A-Levels 1951-2014
20
A-LEVELS 1951-2014 Alan Smithers Centre for Education and Employment Research University of Buckingham August 2014
Transcript of A-Levels 1951-2014

A-LEVELS 1951-2014
Alan Smithers
Centre for Education and Employment ResearchUniversity of Buckingham
August 2014
Contents
Key Findings
1. Trends 1
2. Gender 4
3. Subject Entries 7
4. Subject Grades 12
5 Countries 16
Key Findings
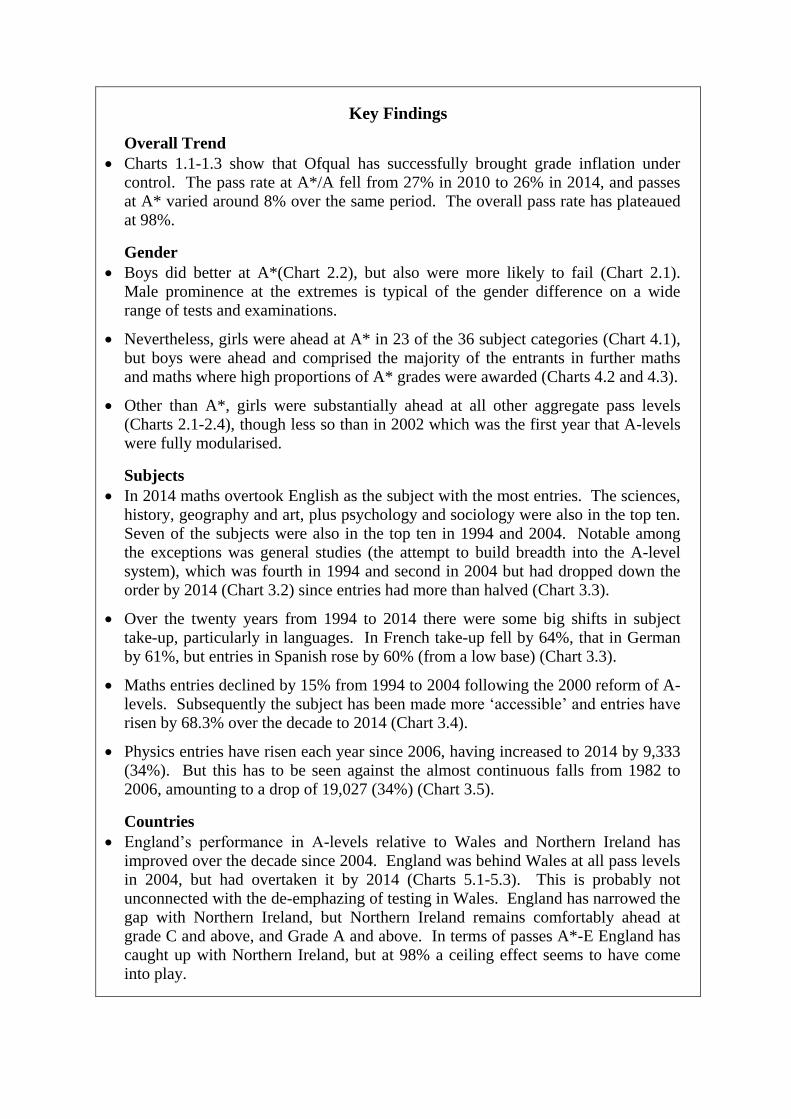
Overall Trend
Charts 1.1-1.3 show that Ofqual has successfully brought grade inflation under control. The pass rate at A*/A fell from 27% in 2010 to 26% in 2014, and passes at A* varied around 8% over the same period. The overall pass rate has plateaued at 98%.
Gender
Boys did better at A*(Chart 2.2), but also were more likely to fail (Chart 2.1). Male prominence at the extremes is typical of the gender difference on a wide range of tests and examinations.
Nevertheless, girls were ahead at A* in 23 of the 36 subject categories (Chart 4.1),
but boys were ahead and comprised the majority of the entrants in further maths and maths where high proportions of A* grades were awarded (Charts 4.2 and 4.3).
Other than A*, girls were substantially ahead at all other aggregate pass levels (Charts 2.1-2.4), though less so than in 2002 which was the first year that A-levels were fully modularised.
Subjects
In 2014 maths overtook English as the subject with the most entries. The sciences, history, geography and art, plus psychology and sociology were also in the top ten. Seven of the subjects were also in the top ten in 1994 and 2004. Notable among the exceptions was general studies (the attempt to build breadth into the A-level system), which was fourth in 1994 and second in 2004 but had dropped down the
order by 2014 (Chart 3.2) since entries had more than halved (Chart 3.3).
Over the twenty years from 1994 to 2014 there were some big shifts in subject take-up, particularly in languages. In French take-up fell by 64%, that in German by 61%, but entries in Spanish rose by 60% (from a low base) (Chart 3.3).
Maths entries declined by 15% from 1994 to 2004 following the 2000 reform of A-levels. Subsequently the subject has been made more ‘accessible’ and entries have risen by 68.3% over the decade to 2014 (Chart 3.4).
Physics entries have risen each year since 2006, having increased to 2014 by 9,333 (34%). But this has to be seen against the almost continuous falls from 1982 to 2006, amounting to a drop of 19,027 (34%) (Chart 3.5).
Countries
England’s performance in A-levels relative to Wales and Northern Ireland has improved over the decade since 2004. England was behind Wales at all pass levels in 2004, but had overtaken it by 2014 (Charts 5.1-5.3). This is probably not unconnected with the de-emphazing of testing in Wales. England has narrowed the gap with Northern Ireland, but Northern Ireland remains comfortably ahead at grade C and above, and Grade A and above. In terms of passes A*-E England has caught up with Northern Ireland, but at 98% a ceiling effect seems to have come into play.

1
1. Trends
1.1. A-level results are much less fun these days. But they are also much more believable. No longer are results ever-rising (when the sport was to try to guess by how much each year). Ofqual’s approach of holding the results consistent from year to year through comparison with the previous attainment of the cohort seems to be working.
Entries and Passes
1.2. Chart 1.1 shows the trends in entries and passes from the start in 1951. Entries have risen steadily year on year apart from the occasional dip associated with a declining birth rate (from 1983) and a change in structure (switch to modular A-levels in 2000). The overall pass rate (now A*-E) falls into three distinct phases. In the early years the target pass rate was set at 70% and the actual pass rate varied around this
till 1982. At that time the grading system was changed from norm-referenced (pre-determined percentages) to setting standards and allowing as many who could reach them to receive the associated grade (criterion referenced).
Chart 1.1: Trends in A-Level Take-Up and Passes (A-E)
0
200
400
600
800
1000
1951 1958 1965 1972 1979 1986 1993 2000 2007 2014
Year
Th
ou
san
ds
65
70
75
80
85
90
95
100
Per C
en
t
Candidates
Per Cent Pass
1.3. The switch to criterion-referencing allowed the pass rate to rise by an average of
about one per cent a year. From 68.2 per cent in 1982 it rose to 89.8 per cent in 2001. The switch to all-modular A-levels in 2002 was associated with a leap of 4.5 percentage points. Thereafter the rate has slowed as the curve forms an asymptote close to 100 per cent. As we show in Section 5 in Northern Ireland where performance outstrips that in England by a considerable margin, the overall pass tends to plateau there too at about 98.0 per cent.
A Grade and Above
1.4. The pattern for passes at A grade and above similarly shows three phases (Chart 1.2). From the introduction of the A grade in 1965 through to 1982 the pass rate

2
remained below the 10 per cent at which it was originally set. Then with criterion-referencing it more than trebled to 27 per cent in 2010. Since when Ofqual the newly formed regulator has intervened to, in effect, norm-reference the grades to 2010 levels. Application of its comparable outcomes approach has led to a slight fall in the pass rate at A grade and above to 26 per cent in 2014. The third phase in Chart 1.2 is thus brought about by the regulator rather than the ceiling effect apparent in Chart 1.1.
Chart 1.2: Trend in A/A* Grades
0
5
10
15
20
25
30
Per
Cen
t
1964 1969 1974 1979 1984 1989 1994 1999 2004 2009 2014
Year
A*
1.5. In discussing the percentage of A grades we have had to add ‘and above’ because in 2010 a new higher grade of A* came into effect. In that first year the proportion awarded was nearly the same as the proportion of A grades in 1965, so it essentially represented a recalibration to take account of the inflation which had occurred in the meantime. Chart 1.3 shows that Ofqual’s tightening of standards has so far held the percentage of A* awarded close to the initial 8 per cent.
Chart 1.3: Trend in A*
Year % A* %A*/A
2010 8.1 27.0
2011 8.2 27.0
2012 7.9 26.6
2013 7.6 26.3
2014 8.2 26.0
1.6. Charts 1.1-1.3 can be interpreted as showing that Ofqual has successfully brought grade inflation under control, though it admits that it has no way of distinguishing

3
inflation from genuine improvement. Ofqual is charged by the government to maintain consistency from year-to-year which means that the pass levels reached by 2010 are for the time set in stone. New tougher A-levels are to be taught from September 2015 and it is not clear what effect they will be allowed to have on pass rates.
4
2. Gender
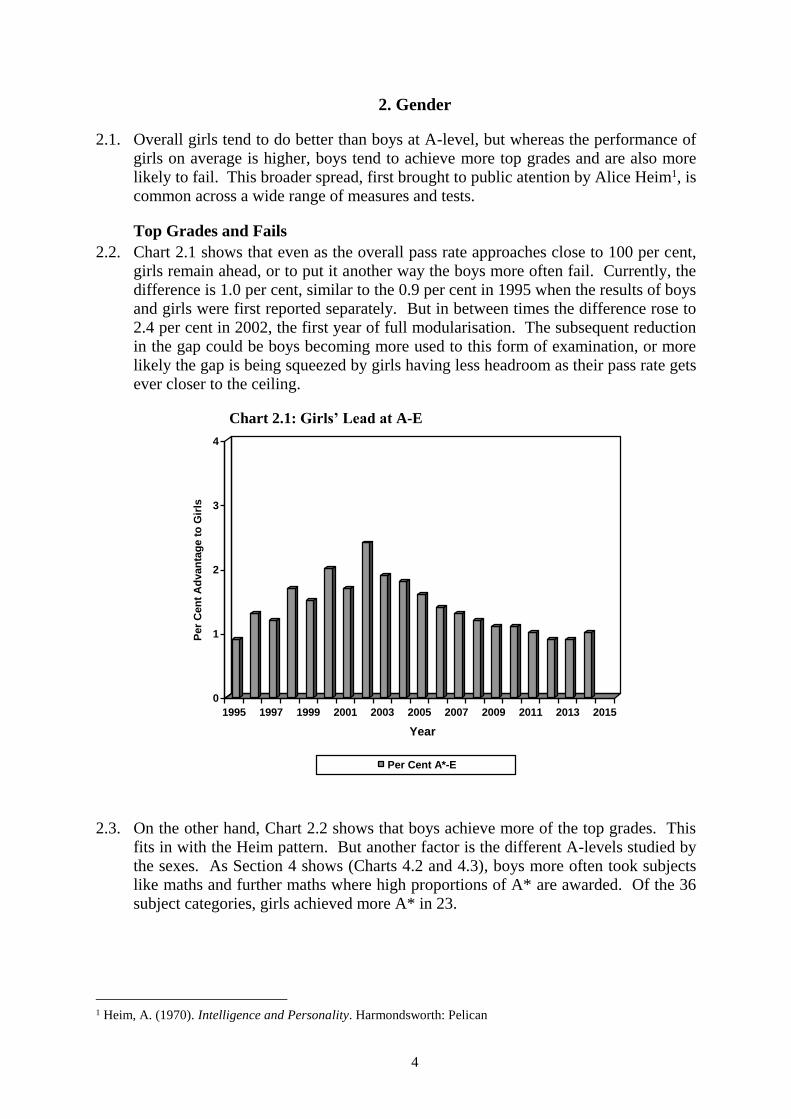
2.1. Overall girls tend to do better than boys at A-level, but whereas the performance of girls on average is higher, boys tend to achieve more top grades and are also more likely to fail. This broader spread, first brought to public atention by Alice Heim1, is common across a wide range of measures and tests.
Top Grades and Fails
2.2. Chart 2.1 shows that even as the overall pass rate approaches close to 100 per cent, girls remain ahead, or to put it another way the boys more often fail. Currently, the difference is 1.0 per cent, similar to the 0.9 per cent in 1995 when the results of boys and girls were first reported separately. But in between times the difference rose to 2.4 per cent in 2002, the first year of full modularisation. The subsequent reduction in the gap could be boys becoming more used to this form of examination, or more
likely the gap is being squeezed by girls having less headroom as their pass rate gets ever closer to the ceiling.
Chart 2.1: Girls’ Lead at A-E
0
1
2
3
4
Per
Cen
t A
dvan
tag
e t
o G
irls
1995 1997 1999 2001 2003 2005 2007 2009 2011 2013 2015
Year
Per Cent A*-E
2.3. On the other hand, Chart 2.2 shows that boys achieve more of the top grades. This fits in with the Heim pattern. But another factor is the different A-levels studied by the sexes. As Section 4 shows (Charts 4.2 and 4.3), boys more often took subjects like maths and further maths where high proportions of A* are awarded. Of the 36 subject categories, girls achieved more A* in 23.
1 Heim, A. (1970). Intelligence and Personality. Harmondsworth: Pelican
5
Chart 2.2: Comparison at A*
Year Males Females Advantage
to Females
2010 7.9 8.3 +0.4
2011 8.2 8.2 0.0
2012 8.0 7.9 -0.1
2013 7.9 7.4 -0.5
2014 8.5 7.9 -0.6
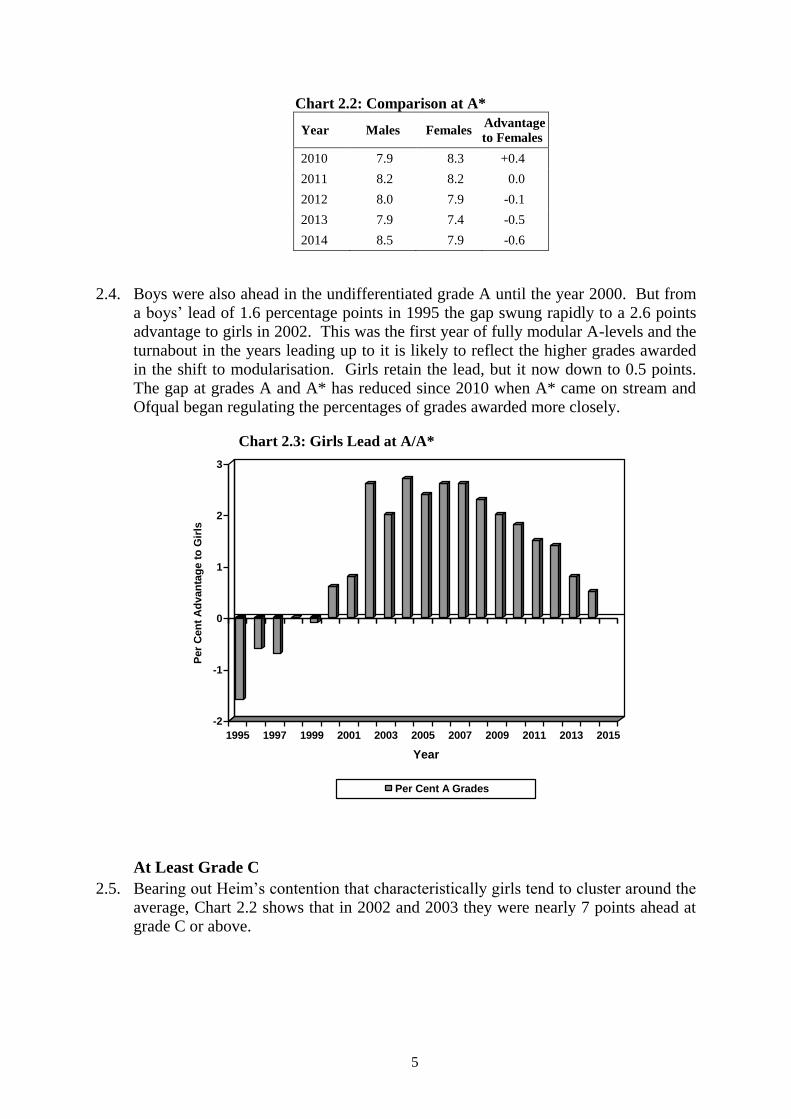
2.4. Boys were also ahead in the undifferentiated grade A until the year 2000. But from a boys’ lead of 1.6 percentage points in 1995 the gap swung rapidly to a 2.6 points advantage to girls in 2002. This was the first year of fully modular A-levels and the turnabout in the years leading up to it is likely to reflect the higher grades awarded
in the shift to modularisation. Girls retain the lead, but it now down to 0.5 points. The gap at grades A and A* has reduced since 2010 when A* came on stream and Ofqual began regulating the percentages of grades awarded more closely.
Chart 2.3: Girls Lead at A/A*
-2
-1
0
1
2
3
Per
Cen
t A
dvan
tag
e t
o G
irls
1995 1997 1999 2001 2003 2005 2007 2009 2011 2013 2015
Year
Per Cent A Grades
At Least Grade C
2.5. Bearing out Heim’s contention that characteristically girls tend to cluster around the average, Chart 2.2 shows that in 2002 and 2003 they were nearly 7 points ahead at grade C or above.

6
Chart 2.4: Girls’ Lead at A*-C
0
1
2
3
4
5
6
7
Per
Cen
t A
dvan
tag
e t
o G
irls
1995 1997 1999 2001 2003 2005 2007 2009 2011 2013 2015
Year
Per Cent A*-C
2.6. The lead at A*/A had increased massively from 0.3 points in 1995 to 6.8 points in 2002, over the period in which A-levels became fully modularised. It can be argued that this examination format suits the typical female approach of conscientious and consistent application, rather than the male tendency to prefer working towards a deadline. The gap has closed somewhat to 4.9 points in 2014, but remains substantial.

7
3. Subject Entries
3.1. Chart 3.1 lists the top ten for entries in 2014, along with equivalent lists ten and twenty years ago. It shows that in 2014 maths overtook English as the subject most frequently taken. The sciences, history, geography and art, plus psychology and sociology were also in the top ten.
3.2. Seven of the subjects were in the top ten in 1994 and 2004. Notable among the exceptions was general studies, which was fourth in 1994 and second in 2004, but had dropped out by 2014. The category ‘social science subjects’, second in 1994, does not appear in the top ten subsequently, because it was split in 1995 into its component subjects including psychology and sociology.
Chart 3.1: Top Ten A-Level Entries
1994 2004 2014
English English Maths
Social Science Subjects General Studies English
Maths Maths Biology
General Studies Biology Psychology
Biology Psychology Chemistry
Geography History History
History Art & Design Art & Design
Chemistry Chemistry Physics
Physics Geography Geography
Art & Design Business Studies Sociology
3.3. The full range of entries in 2014 is shown in rank order in Chart 3.2. The top half is dominated by traditional subjects, but psychology (4th), sociology (10th), media/film/TV (11th) and political studies (17th) also make it. General Studies is down in 15th place.
3.4. The lower half comprised mainly newer subjects, along with Irish and Welsh. But French is down in 23rd spot and German is 29th. In spite of its increasing popularity Spanish is still only 27th. Of concern, is that computing is no higher than 30th.

8
Chart 3.2: Subject Entries 2014
0
10
20
30
40
50
60
70
80
90
En
trie
s i
n T
ho
usan
ds
Mat
hemat
ics
Englis
h
Bio
logy
Psy
cholo
gy
Chem
istry
His
tory
Art&Des
ign
Phys
ics
Geo
graphy
Soci
ology
Med
ia/F
/TV
Bus
Stu
d
Eco
nomic
s
Rel
igio
us Stu
dies
Gen
Stu
dies
Further
Mat
hs
Polit
ical
Stu
d
Des
ign&
Tech
0
10
20
30
40
50
60
70
80
90
En
trie
s i
n T
ho
usan
ds
Dra
ma
PE
All
Oth
erLaw
French IC
T
Oth
er M
FL
Musi
c
Span
ish
Cla
ssic
al S
ubject
s
Ger
man
Com
puting
Oth
erSci
Per
f Arts
Com
m S
tud
Wel
sh
Crit
cal T
hink
Iris
h
3.5. Some of the numbers behind the lists of Chart 3.1 and the histogram of Chart 3.2 are presented in Chart 3.3. It shows that maths take-up fell from 1994 to 2004, but it

9
recovered rapidly after it was made more ‘accessible’. In 2014, as we have seen, it took over from English (which had varied relatively little) at the top.
3.6. The other side of the coin is the substantial and continuing falls in entries to French and German, with some increase in the take-up of Spanish, but nowhere near enough to compensate. General studies fell by more than half from 2004 as schools and students turned away from this attempt to bring more breadth to A-levels. The decline was prompted mainly by leading universities publicising that they would not take it into account in the admissions process.
Chart 3.3: Changes in A-Level Entries in Selected Subjects over One and Two Decades
Subject 1994 2004 2014 %Change
N %Total N %Total N %Total 1994-
2004
2004-
2014
1994-
2014
English 87,896 11.9 81,649 10.7 85,336 10.2 -7.1 4.5 -2.9
Maths 61,728 8.5 52,788 6.9 88,816 10.7 -14.5 68.3 43.9
History 44,787 6.1 43,790 5.7 52,131 6.3 -2.2 19.1 16.4
Geography 46,339 6.4 34,215 4.5 33,007 4.0 -26.2 -3.5 -28.8
Biology 50,685 7.0 52,264 6.8 64,070 7.7 3.1 22.6 26.4
Chemistry 41,226 5.7 37,254 4.9 53,513 6.4 -9.6 43.6 29.8
Physics 35,959 4.9 28,698 3.7 36,701 4.4 -20.2 27.9 2.1
French 29,101 4.0 15,149 2.0 10,433 1.3 -47.9 -31.1 -64.2
German 10,858 1.5 6,390 0.8 4,187 0.5 -41.2 -34.5 -61.4
Spanish 4,755 0.7 5,966 0.8 7,601 0.9 25.5 27.4 59.9
General Studies 53,633 7.4 58,316 7.6 23,884 2.9 8.7 -59.0 -55.5
Media/Film/TV 26,894 3.5 28,497 3.4 6.0
Psychology 46,933 6.1 54,818 6.6 16.8
PE 19,589 2.6 12,760 1.5 -34.9
Other Subjects 261,884 35.9 256,352 33.4 278,053 33.3 -2.1 8.5 6.2
All Subjects 728,851 100.0 766,247 100.0 833,807 100.0 5.1 8.8 14.4
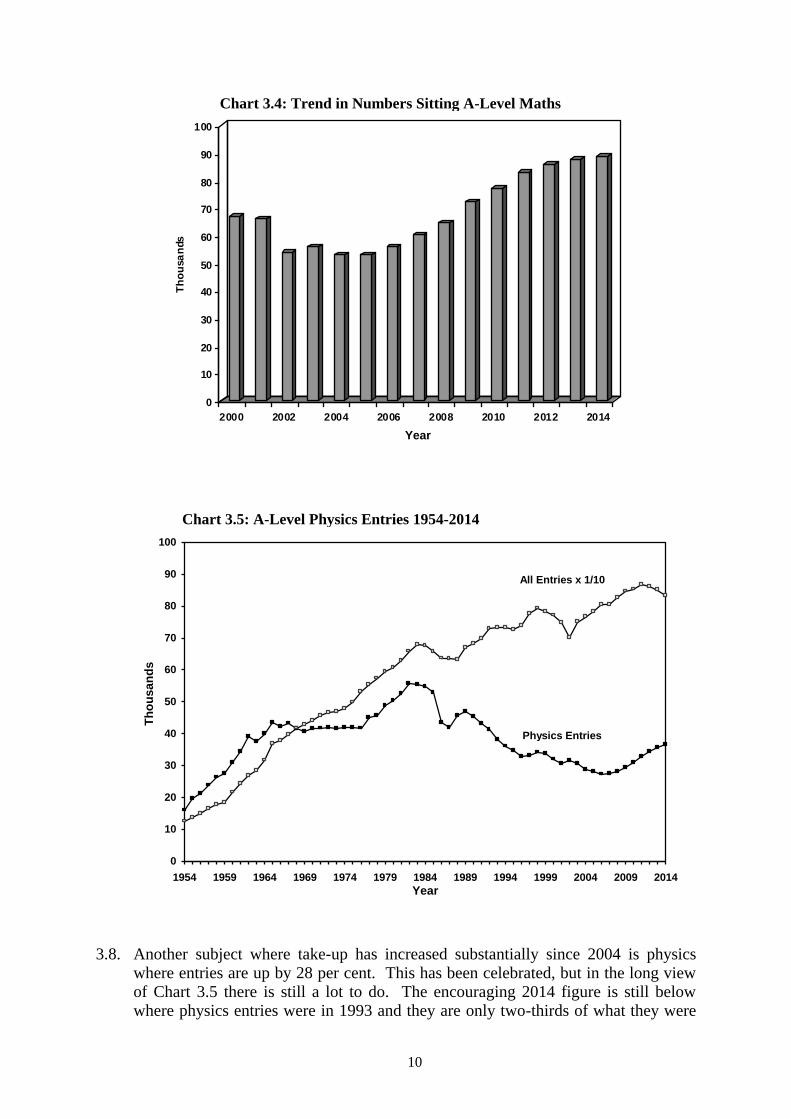
3.7. The trend in A-level maths take-up since 2000 is shown in more detail in Chart 3.4. Entries fell to a nadir in the wake of the reformed A-level taught from 2000 and first examined in 2002. Changes were immediately put in train and a new slimmed down more flexible specification was introduced from 2004. This has led to year-on-year
increases with, as we saw in Chart 3.3 an overall rise in the decade through to 2014 of 68 per cent.
10
Chart 3.4: Trend in Numbers Sitting A-Level Maths
0
10
20
30
40
50
60
70
80
90
100
Th
ou
sa
nds
2000 2002 2004 2006 2008 2010 2012 2014
Year
Chart 3.5: A-Level Physics Entries 1954-2014
0
10
20
30
40
50
60
70
80
90
100
1954 1959 1964 1969 1974 1979 1984 1989 1994 1999 2004 2009 2014
Year
Th
ou
sa
nd
s
Physics Entries
All Entries x 1/10
3.8. Another subject where take-up has increased substantially since 2004 is physics where entries are up by 28 per cent. This has been celebrated, but in the long view of Chart 3.5 there is still a lot to do. The encouraging 2014 figure is still below where physics entries were in 1993 and they are only two-thirds of what they were

11
in 1982. There was a peak in the 18-year-old population in 1982 which will have contributed to the large intake that year. But the steady fall away from 1989 onwards parallels the replacement of O-level physics with GCSE general science which turned out to be a less effective platform for physics at A-level. The recovery from 2006 onwards can be traced to Gordon Brown’s polices, as Chancellor of the Exchequer, to boost the take-up of physics as a separate science at GCSE.

12
4. Subject Grades
4.1. The A* trend discussed in Chapter 1 is for the average percentage across the subjects. The percentage for each subject varies widely. The two halves of Chart 4.1 show the rank order.
Chart 4.1: A* by Subject in 2014
0
5
10
15
20
25
30
Per
Cen
t
Further
Mat
hs
Mat
hs
Oth
er M
od Lan
g
Art&Des
ign
Cla
ssic
al S
ubject
s
Phys
ics
Bio
logy
Iris
h
Chem
istry
Ger
man
Oth
er S
ci
Eco
nomic
s
ALL S
UBJE
CTS
Polit
ical
St
Span
ish
French
His
tory
Geo
graphy
0
5
10
15
20
25
30
Per
Cen
t
Englis
h
Rel
igio
us Stu
dies
Soci
ology
Psy
cholo
gyLaw
D&T
Gen
Stu
d
Dra
ma
Wel
sh
Per
/Exp
Arts
BusS
t
Musi
c
All
Oth
er PE
Com
puting
Com
m S
tud
Critic
al T
hinki
ngIC
T
M/F
/TV
Per Cent A*

13
4.2. The highest percentage in 2014 was in further maths (26.5%) and the lowest in media/film and TV studies (1.4%). Other high scorers included the sciences and languages (ancient and modern), subjects like maths where there would be right answers to give the confidence to award top grades. English (6.2%) was among the subjects awarding relatively few A* grades, along with other interpretive subjects like the social sciences, drama, music and performing/expressive arts.
4.3. The ability of the candidates will have also have had a bearing Further maths candidates will have been highly able having been filtered through their performance in maths. At the other end of the scale, subjects like media studies, physical education, business studies and design and technology can be assumed to appeal less to the academically able. This also appears to be the case for computing and ICT which given the nature of the subjects could have been expected to be up there with maths.
4.4. Actual numbers and percentages of A* grades are presented in Chart 4.2 along with a gender comparison.
Chart 4.2: A* by Subject and Gender 2014
All Males Females Comparison
Entries %A* Entries %A* Entries %A* % Male
Entry
%Male
Ahead
English 85,336 6.2 24,096 6.4 61,240 6.1 28.2 0.3
Maths 88,816 17.3 54,442 18.4 34,374 15.7 61.3 2.7
Further Maths 14,028 26.5 10,053 27.1 3,975 25.1 71.7 2.0
History 52,131 6.3 24,822 5.5 27,309 7.1 47.6 -1.6
Geography 33,007 6.3 16,489 4.8 16,518 7.8 50.0 -3.0
Biology 64,070 9.4 26,346 9.2 37,724 9.6 41.1 -0.4
Chemistry 53,513 9.1 27,637 9.8 25,876 8.3 51.6 1.5
Physics 36,701 10.0 28,958 9.7 7,743 11.2 78.9 -1.5
French 10,433 6.6 3,302 6.7 7,131 6.5 31.6 0.2
German 4,187 8.9 1,664 9.9 2,523 8.2 39.7 1.7
Spanish 7,601 7.7 2,655 7.8 4,946 7.6 34.9 0.2
Media/Film/TV 28,497 1.4 12,761 0.8 15,736 1.9 44.8 -1.1
Psychology 54,818 4.8 13,651 2.4 41,167 5.6 24.9 -3.2
PE 12,760 3.2 8,341 2.0 4,419 5.5 65.4 -3.5
All Subjects 833807 8.2 379,823 8.5 453,984 7.9 45.6 0.6
4.5.
4.6. Overall boys were ahead at A* which stands in contrast to other grade levels where the girls did better as we saw in Chapter 2. The difference was interpreted in terms of Heim’s observation that across a wide range of psychological measures (including intelligence) boys tended to be over-represented at the extremes – more top performers but also more failing.
4.7. Chart 4.2 brings out how the gender comparison at A-level is affected by the distribution of grades within the individual subjects and what proportions of boys and girls take those subjects. For example, as we have seen, there was a high

14
percentage of A* in maths, and as Chart 4.2 shows boys are not only much more likely to take this subject but are also more likely to get the top grade.
Chart 4.3: Gender Differences in A* by Subject
-5
-4
-3
-2
-1
0
1
2
3P
er
Cen
t A
dvan
tag
e t
o M
ale
s
Mat
hs
Wel
sh
Further
Mat
hs
Ger
man
Chem
istry
Cla
ssic
al S
ubj
Oth
er S
cien
ces
Com
puting
Iris
h
Englis
h
All
Oth
er S
ubject
s
French
Span
ish
ALL S
UBJE
CTS
Musi
c
Bio
logy
ICT
Com
m S
tudie
s
-5
-4
-3
-2
-1
0
1
2
3
Pe
r C
en
t A
dvan
tag
e t
o M
ale
s
Rel
igio
us Stu
dies
Gen
eral
Stu
dies
Med
ia
Per
f/Exp
Crit T
hinki
ng
Bus
Stu
dies
Phys
ics
Art&Des
ign
Dra
ma
His
tory
LawD&T
Eco
nomic
s
Soci
ology
Polit
ical
Stu
dies
Geo
graphy
Psy
cholo
gyPE
Oth
er M
od Lan
g
Per Cent A*

15
4.8. The gender differences in A* grades are illustrated in Chart 4.3 which shows that while boys have the higher average percentage overall, girls are ahead in 23 of the 36 subjects. The apparent paradox arises because boys tend to be in the majority in high-scoring high-entry subjects like maths, further maths, physics and chemistry, and also in some cases achieve a higher percentage of A* grades in them. As we argued in paragraphs 4.2 and 4.3 subject differences in top grades are associated with whether the subject has right answers or is more interpretive, and the abilities of the entrants. It does not seem to be a matter of there being more males and, therefore, more top grades.

16
5. Countries of the UK
5.1. A-levels are taken in England, Wales and Northern Ireland, albeit through different examining bodies, three in England and one each in Wales and Northern Ireland, with some overlap between countries. The boards are constituted in different ways and come under different regulators which cooperate to achieve, as far as possible, common standards. The results considered so far have been the combined results for the whole of the United Kingdom. But there are appreciable differences between the countries which we will explore in this Chapter.
5.2. Chart 5.1 shows the percentages achieving at least a C grade. In 2014 Northern Ireland emerges with by far the best results, with England and Wales close but the former 1.3 percentage points ahead. Northern Ireland was similarly ahead in 2004, but at that time Wales was 4.3 percentage points in front of England. We can only
speculate about the reasons for this switch around, But Wales also fared poorly in the 2012 round of PISA testing. In all three countries, both in 2004 and 2014, girls were ahead by at least 4.5 percentage points. Both boy and girl entrants improved more in England than in Wales over the decade, with girls in Wales making the least progress.
Chart 5.1: Change in A*-C Grades 2004-14
Countries 2004 2014
Males Females All Males Females All
Northern Ireland 77.2 81.7 79.8 81.3 85.8 83.7
Wales 68.0 76.2 72.6 71.7 78.1 75.2
England 65.0 71.2 68.3 73.8 78.7 76.5
5.3. The pattern is similar in terms of A*/A with Northern Ireland well ahead and England overtaking Wales. In this case, however, the performance of girls in Wales actually fell between 2004 and 2014 bringing down the overall score. Girls in England, two percentage points behind Wales in 2014 were two points ahead in 2014. For both sexes together, England halved the gap from Northern Ireland over the decade. The relative improvement can be attributed to the importance testing and exam results have assumed for both pupils and schools in England.
Chart 5.2: Change in A*/A Grades 2004-14
Countries 2004 2014
Males Females All Males Females All
Northern Ireland 27.8 31.7 30.0 27.4 32.1 29.9
Wales 21.4 25.2 23.5 22.5 24.0 23.3
England 20.7 23.2 22.1 25.8 26.1 26.0
5.4. The pattern described for passes at grade C and above, and A*/A, hold for passes overall although they are less sharp because nearly everyone who sits passes. Nevertheless, Northern Ireland and girls are consistently ahead and England overtakes Wales. England all but catches up on Northern Ireland since the latter is so close to what de facto is achievable.

17
Chart 5.3: Changes in A*-E Grades 2004-14
Countries 2004 2014
Males Females All Males Females All
Northern Ireland 97.0 97.8 97.4 97.8 98.4 98.1
Wales 95.7 97.1 96.5 96.7 98.1 97.5
England 94.9 96.7 95.0 97.5 98.4 98.0
5.5. A plausible explanation for the patterns is that the attempts of the Welsh Assembly to play down the importance of testing in schools (by not having national tests at age 11 and by not publishing exam results) have succeeded only too well. Northern Ireland’s pre-eminence could be associated with its retention of a grammar school system though people are reluctant to acknowledge this. The
possibility remains though that the differences could be due in part to differences between the exam boards. An in-depth study of the relative performance of the three countries could offer valuable insights into the relationship between school systems, exams, and pupil performance.