A lesson and Learn from F3/C ionospheric Observations for ...€¦ · A lesson and Learn from F3/C...
44
A lesson and Learn from F3/C ionospheric A lesson and Learn from F3/C ionospheric Observations for F7/C2 Observations for F7/C2 2011.04.13 Tiger J. Y. Liu National Space Organization National Central University 1
Transcript of A lesson and Learn from F3/C ionospheric Observations for ...€¦ · A lesson and Learn from F3/C...

A lesson and Learn from F3/C ionospheric A lesson and Learn from F3/C ionospheric
Observations for F7/C2Observations for F7/C2
2011.04.13
Tiger J. Y. LiuNational Space Organization
National Central University
1

Content
• Introduction
• Space-Space Tomography- 2D TIP+GOX Tomography- 2D TIP+GOX Tomography
- 3D TIP+GOX Tomography
- 2D TIP Tomography
• GOX N(500 km) vs. N(800)
• Conclusion
2

Error of Abel Inversion
Liu et al. (JGR 2010)3

Space-Space Ionosphere Tomography
[Hsu et al., T.A.O. 2009]4

Space-Space Tomography
TIP + TriG Tomography
5

TIP and 3 GOX inversionResult
Tomography
6

2000 40003000
5000 6000 7000
Hei
gh
t(k
m)
IRI
Result
8000 9000 10000
Hei
gh
t(k
m)
Electric density(#/cm3)7 7

Space-Space Tomography
TIP + TriG 3D Tomography
8
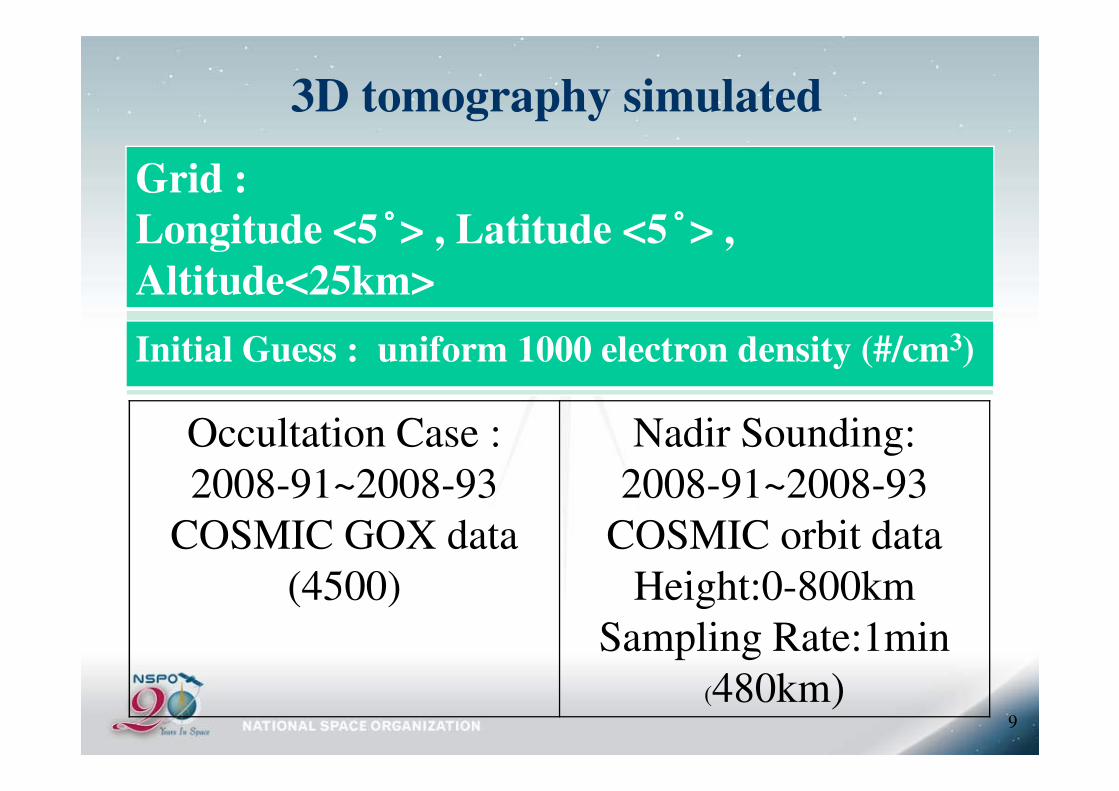
Grid :
Longitude <5°°°°> , Latitude <5°°°°> ,
Altitude<25km>
Result: IRI (2008-74-06)
3D tomography simulated
Initial Guess : uniform 1000 electron density (#/cm3)
Occultation Case :
2008-91~2008-93
COSMIC GOX data
(4500)
Nadir Sounding:
2008-91~2008-93
COSMIC orbit data
Height:0-800km
Sampling Rate:1min
(480km)9

300kmSpace-space
Tomography
IRI
10
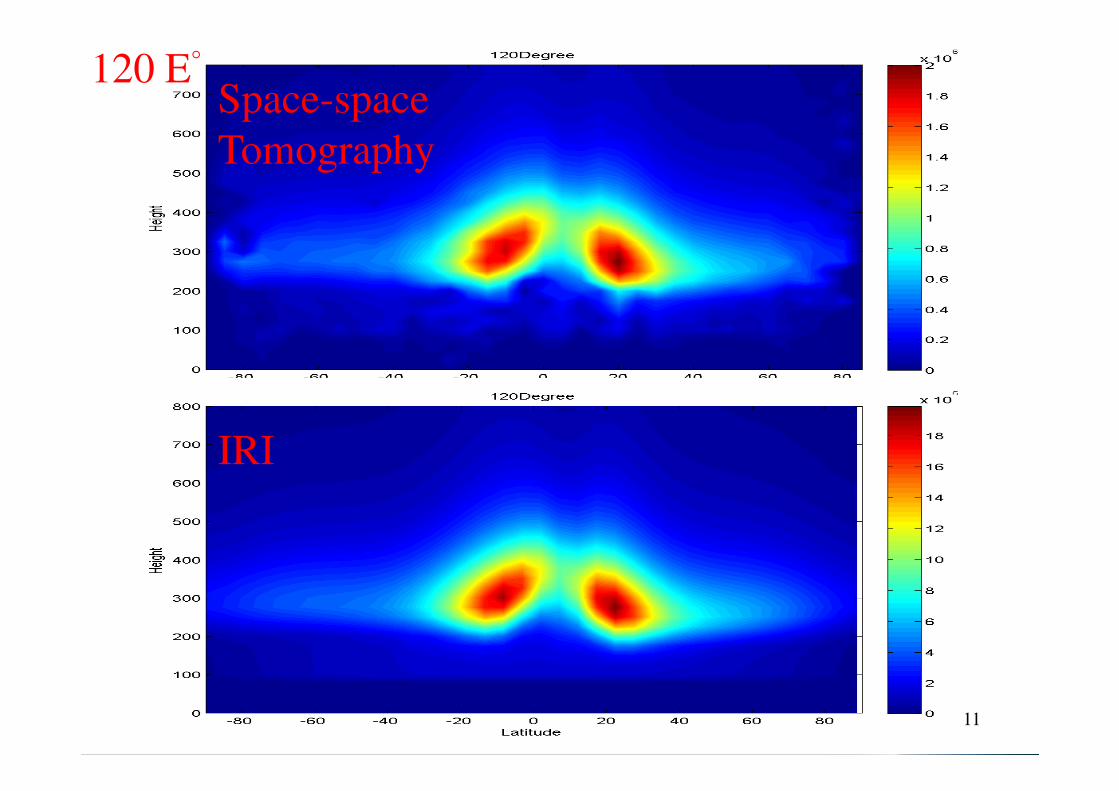
120 E°Space-space
Tomography
IRI
11

Error of Tomography & Abel Inversion
Space-Space
Tomography
ABEL Inversion
Use Occultation
and Nadir
Sounding data for
tomography
Use Occultation inverted
electron density profile
12

150km 200km 250kmSpace-space
Tomography
Electron Density of Bird View
IRI
ABEL
Inversion
1313
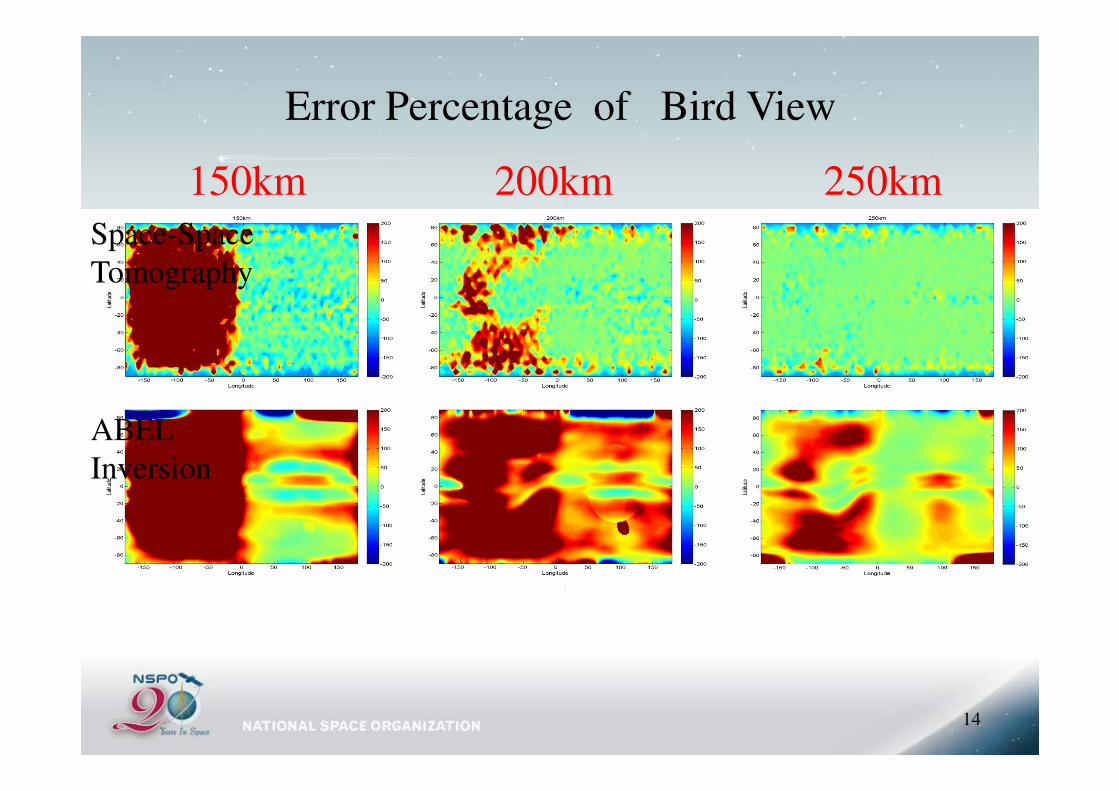
150km 200km 250km
Space-Space
Tomography
Error Percentage of Bird View
ABEL
Inversion
14

300km 350km 400km
Space-space
Tomography
IRI
Electron Density of Bird View
IRI
ABEL
Inversion
15

300km 350km 400km
Space-Space
Tomography
Error Percentage of Bird View
ABEL
Inversion
16

20 E° 100 E° 180 E°
Space-space
Tomography
Electron Density of Side View
17
IRI
ABEL
Inversion
17

20 E° 100 E° 180 E°
Space-Space
Tomography
Error Percentage of Side View
ABEL
Inversion
18

Remark (1)
• The GOX and TIP observations provide the
vertical distribution and horizontal gradient
of the electron density, respectively.
• The space-space tomography yields a better • The space-space tomography yields a better
performance, which can be use to derive 3D
structure and dynamics of the ionospheric
electron density.
• A nadir sounder is essential for the F7
mission.

Space-Space Tomography
2D TIP Tomography

OSSE of 2-D Photometer Tomography on Science Payload F7/C2

Experiment Setup
• Use IRI to simulate the ionosphere
• Satellite (800km altitude, polar orbit)
• Photometer Sounding (1 Hz sampling rate,
135.6nm)
- 1 nadir photometer (F3/C TIP)
- 1 nadir and +45°°°° photometers
- 1 nadir, +45°°°°, and -45°°°° photometers
• Apply MART conducting the
Inversion/tomography (horizontal x vertical
resolution: 40kmx20km)
• Conclusion

IRI SimulationA
ltit
ude
el/cm3
Alt
itude
(km
)
Range (km)

Initial Guess (NmF2:10000#/cm3, hmF2:
250km)
1 nadir PhotometerA
ltit
ude
(km
)
el/cm3
Alt
itude
(km
)
Range (km)
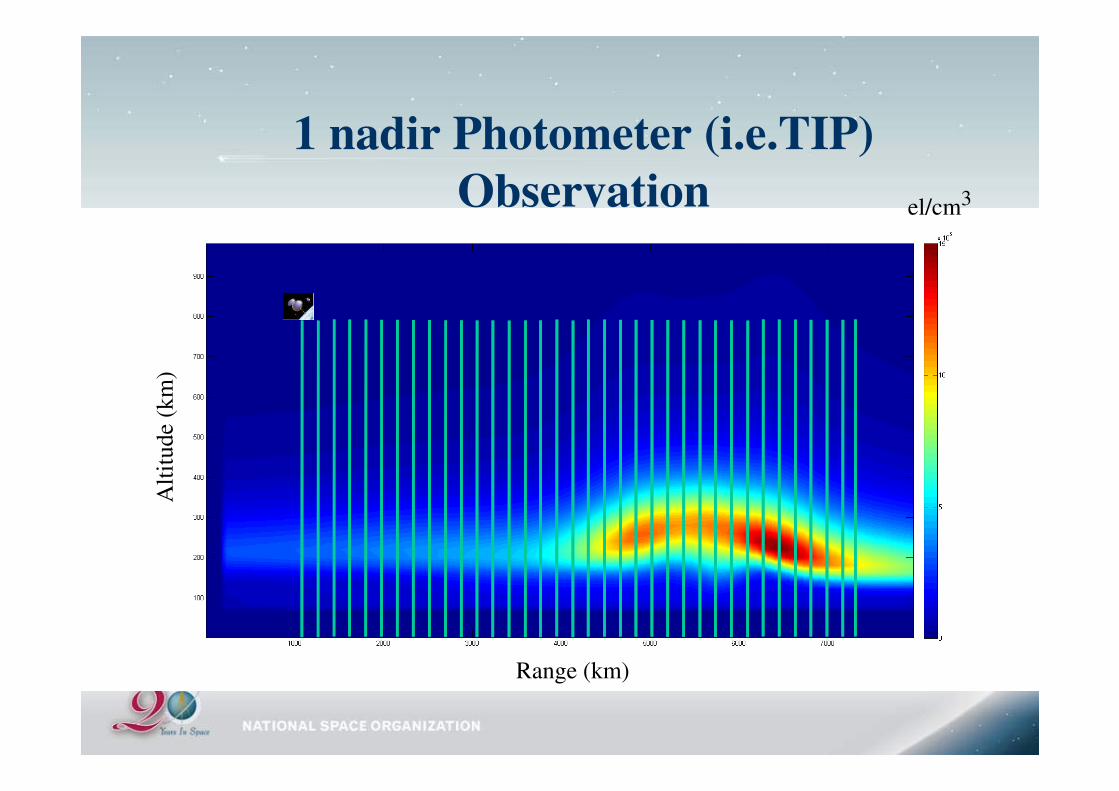
1 nadir Photometer (i.e.TIP)
ObservationA
ltit
ude
(km
)
el/cm3
Alt
itude
(km
)
Range (km)

Inversion of 1 nadir PhotometerA
ltit
ude
(km
)
el/cm3
Alt
itude
(km
)
Range (km)

IRI
Alt
itude
(km
)
IRI vs. 1 nadir Photometer Inversion
1 nadir Inversion
Alt
itude
(km
)
Range (km)
el/cm3

1 nadir & +45 Photometer
ObservationA
ltit
ude
(km
)
el/cm3
Alt
itude
(km
)
Range (km)

1 nadir & + 45 Photometer Tomography A
ltit
ude
(km
)
el/cm3
Alt
itude
(km
)
Range (km)

IRI
Alt
itude
(km
)
el/cm3
IRI vs. 1 nadir & +45 Photometer Tomography
1 nadir & +45 Photometer TomographyAlt
itude
(km
)
Range (km)
el/cm3

Alt
itude
el/cm3
1 nadir & +/- 45 Photometer
ObservationA
ltit
ude
(km
)
Range (km)

Alt
itude
el/cm3
1 nadir & +/- 45 Photometer Tomography A
ltit
ude
(km
)
Range (km)

IRI
Alt
itude
(km
)
el/cm3
IRI vs. 1 nadir & +/- 45 Photometer Tomography
Alt
itude
(km
)
Range (km)
el/cm3
1 nadir & +/- 45 Photometer Tomography
Remark (2)
• The multi-photometer observation can be used
to reconstruct the height-latitude 2-D
ionosphere.
• The observation with nadir, +45°°°°, and -45°°°°• The observation with nadir, +45°°°°, and -45°°°°
photometers yields a batter tomography result.
• Time: 2007.061 ~ 2007.120
• UT: 12:00 ~ 14:00
• Longitude : -180 ~ 180• Longitude : -180 ~ 180
• Latitude : -60 ~ 60
• Altitude : 0 ~ 800km

Satellite Altitude

Side ViewLongitude
-15° 0° 15° 30° 45°
F3/C Alt:500km
60°
F3/C Alt:800km
Difference

OSSE Alt:500km
OSSE Alt:800km
-15° 0° 15° 30° 45° 60°
Difference

Bird viewAltitude
F3/C Alt:500km
150km 200km 250km 300km 350km
F3/C Alt:800km
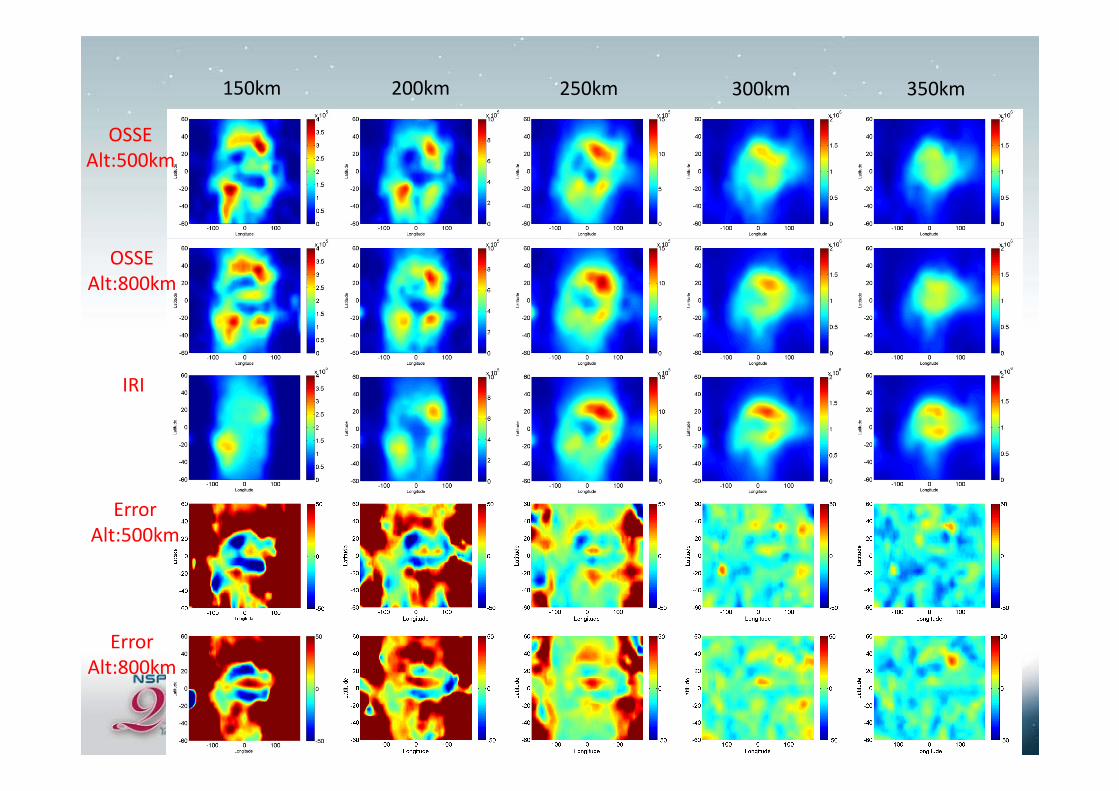
OSSE
Alt:500km
OSSE
Alt:800km
IRI
150km 200km 250km 300km 350km
IRI
Error
Alt:500km
Error
Alt:800km

Side ViewLongitude
-15° 0° 15° 30° 45°
F3/C Alt:500km
60°
F3/C Alt:800km

OSSE Alt:500km
OSSE Alt:800km
IRI
-15° 0° 15° 30° 45° 60°
Error Alt:500km
Error Alt:800km

Conclusion
• The F7/C2 TriG together with TriP shall
provides a better resolution and accuracy for
the ionospheric electron density probing. the ionospheric electron density probing.
• The electron densities derived by the F7/C2
GOX should be carefully investigated.

Thank You !Thank You !

![Simultaneous observations of plasmaspheric and ionospheric ...plasmasphere.aeronomie.be/pdf/Wang_2013_JGR_jgra50046.pdf · Introduction [2] Geospace, ... (thethermosphere,ionosphere,](https://static.fdocuments.in/doc/165x107/5fad12d416a73c73844fbdbc/simultaneous-observations-of-plasmaspheric-and-ionospheric-introduction-2.jpg)


![Tropospheric-Ionospheric Coupling by Electrical Processes ... · the troposphere and the ionosphere is an important assignment related to atmospheric electrodynamics [6]. Observations](https://static.fdocuments.in/doc/165x107/5edafea609ac2c67fa68a3c3/tropospheric-ionospheric-coupling-by-electrical-processes-the-troposphere-and.jpg)