a legacy of leadership. a promise of growth.
164
2010 ANNUAL REPORT a legacy of leadership. a promise of growth.
Transcript of a legacy of leadership. a promise of growth.
P.O. Box 270 Hartford, Connecticut 06141-0270 1-800-286-5000
www.nu.com
2 0 1 0 A N N U A L R E P O R T
a legacy of leadership. a promise of growth.
NO
RT
HEA
ST U
TILIT
IES | 20
10
AN
NU
AL R
EPO
RT

a legacy of leadership. a promise of growth.
TABLE OF CONTENTS
Financial Highlights 1
Chairman’s Message 2
Trustees and Officers 8
Form 10-K Special section
Shareholder Information Inside back cover
Since Northeast Utilities (NU) and its companies were founded, we have built an enduring legacy of delivering
reliable energy for our customers, leadership for our industry and value for our investors. We continue to build
on that legacy with our support of the efficient use of energy and new clean energy technologies as a foundation
for regional economic growth. With a steady hand dealing with today’s economic landscape and an eye to the
challenges that lie ahead, NU continued to deliver strong operational and financial performance in 2010. As
we turned the final pages of the 2010 calendar, we did more than just say goodbye to a year of significant
accomplishments for NU. We welcomed the start of a new era. We capped the year with an agreement to
merge with Boston-based NSTAR to ensure our position as New England’s leading regional energy company,
poised to better serve our customers by delivering on a promise of future growth.
Northeast Utilities
Northeast Utilities operates New England’s largest energy delivery system with approximately 1.9 million electric customers in Connecticut, Massachusetts and New Hampshire and approximately 200,000 natural gas customers in Connecticut. NU is the parent company of several subsidiaries, including the following public utility companies: The Connecticut Light and Power Company, Public Service Company of New Hampshire, Western Massachusetts Electric Company and Yankee Gas Services Company.
Shareholders
As of February 28, 2011, there were 40,210 common shareholders of record of Northeast Utilities holding an aggregate of 176,681,350 common shares issued.
Common Share Information
The common shares of Northeast Utilities are listed on the New York Stock Exchange. The ticker symbol is “NU,” although it is frequently presented as “Noeast Util” and/or “NE Util” in various financial publications. The high and low daily prices and dividends paid for the past two years, by quarters, are shown in the table below.
Quarterly Dividend Year Quarter High Low per Share
2010 First $28.00 $24.68 $0.25625 Second $28.21 $24.83 $0.25625 Third $30.25 $25.24 $0.25625 Fourth $32.21 $29.51 $0.25625
2009 First $25.31 $19.01 $0.23750 Second $22.58 $19.78 $0.23750 Third $24.78 $21.11 $0.23750 Fourth $26.48 $22.20 $0.23750
Transfer Agent and Registrar
Bank of New York (BNY) Mellon Shareowner Services 480 Washington Boulevard Jersey City, NJ 07310-1900 1-800-999-7269
Investor Relations
To contact our Investor Relations Department, call: Jeffrey Kotkin: 860-728-4650 Barbara Nieman: 860-728-4652 www.nu.com/investors
Shareholder Account Access
We have partnered with BNY Mellon Shareowner Services to offer you online access to your important shareowner communications in a single secure place. As an Investor ServiceDirect® (ISD) registered user, you may also enroll in MLinkSM, which offers you immediate online access to your shareowner correspondence. Simply log in to ISD at www.bnymellon.com/shareowner/isd. Step-by-step instructions will prompt you through quick and easy enrollment.
Dividend Reinvestment Plan
Northeast Utilities offers a dividend reinvestment plan called BuyDIRECT. This plan is sponsored by BNY Mellon Shareowner Services and not only offers the reinvestment of dividends, but provides both registered shareholders and interested first-time investors an affordable alternative for buying and selling NU shares. To request an enrollment package, please call 1-800-999-7269 or log on to www.bnymellon.com/shareowner/isd.
Direct Deposit for Quarterly Dividends
Direct deposit provides the convenience of automatic and immediate access to your funds, while eliminating the possibility of mail delays and lost, stolen or destroyed checks. This service is free of charge to you. Please call 1-800-999-7269 to request an enrollment form.
Annual Meeting
The Annual Meeting of Shareholders of Northeast Utilities will be held at 10:30 a.m. on May 10, 2011, at The Hartford Club, 46 Prospect Street, Hartford, CT.
Compliance with New York Stock Exchange Corporate Governance Rules
The Company’s Annual Report on Form 10-K for 2010 contained the certifications required by Section 302 of the Sarbanes-Oxley Act of 2002, and on June 8, 2009, the Company’s Chief Executive Officer provided the New York Stock Exchange with the required annual written certification that he was not aware of any violations by the company of the Exchange’s corporate governance listing standards.
Form 10-K
Northeast Utilities will provide shareholders a copy of its 2010 Annual Report on Form 10-K, including the financial statements and schedules thereto, without charge, upon receipt of a written request sent to: O. Kay Comendul Assistant Secretary Northeast Utilities P.O. Box 270 Hartford, Connecticut 06141-0270
Review Your Annual Report and Proxy Electronically
If you are interested in receiving your Annual Report and proxy materials electronically, you may log on to: www.bnymellon.com/shareowner/isd. It would be helpful to have your NU Investor ID number on hand when you go online. Your Investor ID number can be found on the correspondence recently mailed to you by The Bank of New York Mellon or by calling 1-800-999-7269.
shareholder information
financial highlights
DIVIDENDS PAID/SHARE For the Years Ended December 31,
10
09
08
07
06
05
$0.825
$0.775
$0.725
$0.675
CLOSING SHARE PRICE At Year End
10
09
08
07
06
05
$24.06
$28.16
$19.69
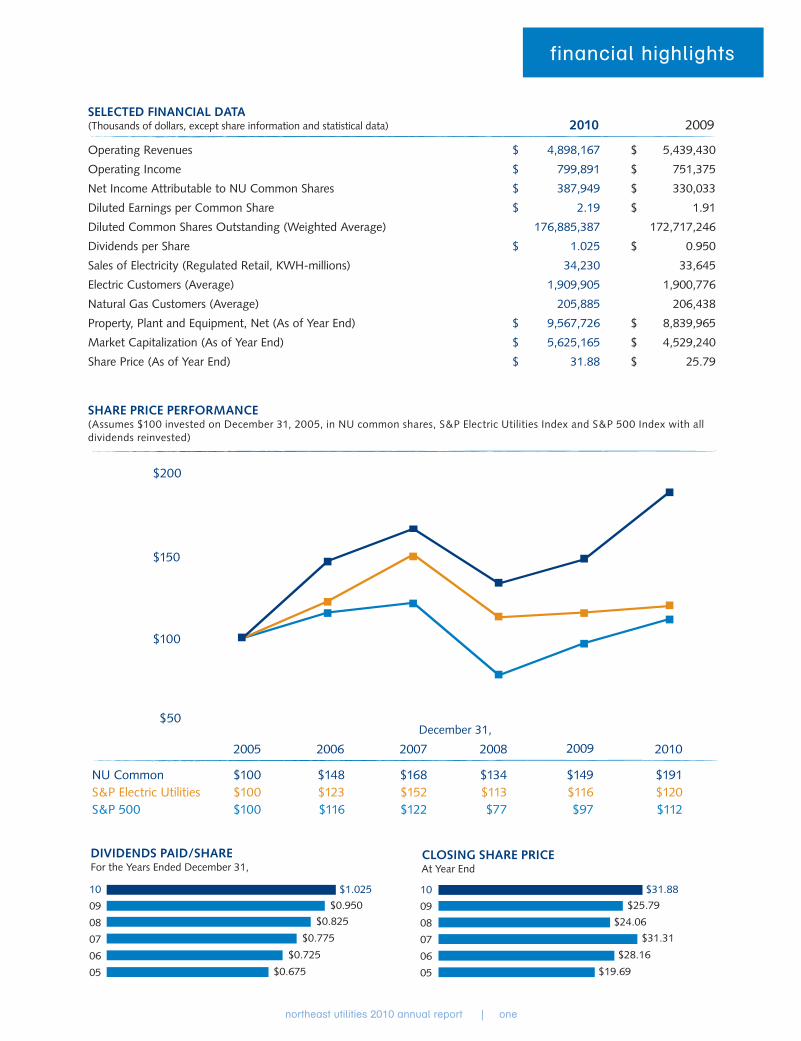
SELECTED FINANCIAL DATA (Thousands of dollars, except share information and statistical data) 2010 2009
Operating Revenues $ 4,898,167 $ 5,439,430
Operating Income $ 799,891 $ 751,375
Net Income Attributable to NU Common Shares $ 387,949 $ 330,033
Diluted Earnings per Common Share $ 2.19 $ 1.91
Diluted Common Shares Outstanding (Weighted Average) 176,885,387 172,717,246
Dividends per Share $ 1.025 $ 0.950
Sales of Electricity (Regulated Retail, KWH-millions) 34,230 33,645
Electric Customers (Average) 1,909,905 1,900,776
Natural Gas Customers (Average) 205,885 206,438
Property, Plant and Equipment, Net (As of Year End) $ 9,567,726 $ 8,839,965
Market Capitalization (As of Year End) $ 5,625,165 $ 4,529,240
Share Price (As of Year End) $ 31.88 $ 25.79
December 31,
NU Common $100 $148 $168 $134 $149 $191 S&P Electric Utilities $100 $123 $152 $113 $116 $120 S&P 500 $100 $116 $122 $77 $97 $112
2005 2006 2007 2008 2009 2010
SHARE PRICE PERFORMANCE (Assumes $100 invested on December 31, 2005, in NU common shares, S&P Electric Utilities Index and S&P 500 Index with all dividends reinvested)
$31.88$1.025
$0.950 $25.79
$31.31
northeast utilities 2010 annual report | one
$200
$150
$100
$50

a message from the chairman
For Northeast Utilities (NU), 2010 was a year of significant achievement as we
continued to successfully execute our strategic plan. Our performance has again
demonstrated the strength of our strategy and our ability to excel under even
the most challenging economic conditions. Shouldering the responsibility of
leadership, we delivered reliable, responsive service to customers and solid results
to shareholders.
northeast utilities 2010 annual report | two

To Our Shareholders:
Appropriately, we capped a year of achievement with the next step in the evolution of NU. On October 18, 2010, we announced plans to merge with the Boston-area electric and gas utility, NSTAR. This transaction is a natural fit of two companies with adjacent geographic footprints and similar strategic goals. It will create a premier regional energy company serving nearly 3.5 million customers in three states. Once the merger is complete, we will provide electricity and natural gas to over half of the energy customers in New England. Simply put, this combination provides a better platform for us to deliver on our promise for future growth than we would have been able to achieve on a stand-alone basis. Our shareholders and NSTAR shareholders overwhelmingly approved the merger on March 4, and we expect to secure the necessary approvals to complete this transaction in the second half of 2011.
Solid financial results
For our shareholders, we delivered improved financial performance for the year with our continued control over costs, strong operating results in all of our segments, and by strategically deploying capital for transmission and distribution investments.
In 2010, we delivered earnings per share of $2.19, compared with $1.91 per share in 2009. Company earnings totaled $387.9 million in 2010, compared with $330.0 million in 2009.
In an economic environment that saw many companies cut dividends, we increased our dividend at a faster pace than the utility industry average. We raised our dividend in early 2010 from an annualized rate of $0.95 per share to $1.025 per share. In the first quarter of 2011, we raised the dividend again to an annualized rate of $1.10 per share. This was the eleventh consecutive year we increased our dividend. Our total shareholder return during 2010 was 28.3 percent, including our dividend.
In fact, our total return was the highest of all similar companies in the Edison Electric Institute’s Index of Shareholder-Owned Electric Utilities for five years ended September 30, 2010.
Operational excellence
Within our operations, employees of NU and its companies in Connecticut, Massachusetts and New Hampshire kept the lights on and the gas flowing by delivering excellent performance in 2010. We delivered greater certainty for our customers and shareholders by successfully completing multiple-year rate cases for The Connecticut Light and Power Company (CL&P), Public Service Company of New Hampshire (PSNH) and Western Massachusetts Electric Company (WMECo).
And we delivered on our promise of value for Yankee Gas Services Company (Yankee Gas) customers with a capital plan that has reduced supply constraints and enhanced safety and reliability.
We invested $1 billion to further upgrade, strengthen and modernize our energy distribution and transmission systems. Over the next five years, we expect to invest an additional $6.6 billion in New England’s energy infrastructure.
In 2010, we completed or advanced several major infrastructure projects on time, on budget and safely, once again demonstrating a level of operational excellence and responsibility that sets us apart.
will create a premier regional energy company serving nearly 3.5 million customers in three states
our proposed merger with NSTAR
northeast utilities 2010 annual report | three

In Connecticut, we completed approximately 10 miles of our 16-mile Yankee Gas pipeline expansion between Wallingford and Waterbury. The project will supplement our supply portfolio, ensure we can meet our growing peak demand and will enable the retirement of aged propane peaking facilities. One segment was placed in service in 2010, and we anticipate the entire project will be completed in time for the 2011-2012 winter heating season.
Another major project, the New England East-West Solutions (NEEWS) family of transmission projects will improve regional reliability by providing a strong transmission connection for the flow of power throughout southern New England.
The largest of the NEEWS projects, the Greater Springfield Reliability Project, received siting approvals from Massachusetts and Connecticut in 2010. Construction began at the end of 2010 with a projected late-2013 completion date. In addition, ISO-New England reaffirmed the need for the Interstate Reliability Project in August 2010. The last of the NEEWS projects – the Central Connecticut Reliability Project – remains within
ISO-New England’s regional system plan while it continues its review to determine when it will be needed.
These infrastructure investments enable us to strengthen the reliability of our system and increase our ability to add renewable energy to the region.
Advancing clean energy solutions
By reducing emissions, adding renewable energy options and working with customers to conserve energy, we envision a cleaner energy future for New England. In 2010, we established ourselves as a regional and national leader in clean, renewable energy and alternative technologies while supporting the legislative goals of our states.
Additionally, we continued our record of success in delivering innovative, forward-looking transmission solutions for the energy issues challenging our region.
In 2010, we successfully reached key milestones for the Northern Pass project, a high-voltage, direct-current transmission line that will bring 1,200 megawatts of low-carbon, primarily
northeast utilities 2010 annual report | four

hydro-electric, power from Canada to New England’s load centers. We made significant progress finalizing and completing a series of agreements for the project, in partnership with NSTAR and Hydro-Québec, and made key regulatory filings with the U.S. Department of Energy and the Federal Energy Regulatory Commission (FERC). On February 11, 2011, FERC approved the Transmission Service Agreement as uniquely beneficial to our region.
Community outreach for the project began following the public announcement of the converter terminal location in Franklin, New Hampshire. Although it is contingent on siting approvals, construction of the line should begin in 2013. By 2015, we expect it to begin delivering power into New England.
In another development that speaks to our overall leadership, we embarked on the construction of large-scale solar generation in Massachusetts. In October 2010, WMECo completed its first facility in Pittsfield, Massachusetts, where it installed 1.8 megawatts of solar generation. Completed in just six months, the project shines as the region’s largest solar installation to date. WMECo recently announced selection of the second site for development of a 4.2 megawatt facility on a 62-acre capped landfill in Springfield, Massachusetts.
Construction of the Springfield facility will complete the initial 6-megawatt authorization WMECo received from the Massachusetts Department of Public Utilities in 2009.
In New Hampshire, construction on the Clean Air Project at PSNH’s Merrimack Generating Station is 82 percent complete and continues to be ahead of schedule and under budget. When the project is completed in 2012, the power plant will be one of the nation’s cleanest coal-burning energy facilities. This project will use wet-flue gas desulfurization technology. It will dramatically reduce mercury and sulfur dioxide emissions from Merrimack’s two units, and Merrimack will continue to provide the region with competitively priced energy and needed fuel diversity.
In 2010, we continued to examine the emerging industry of plug-in electric vehicles as an opportunity to provide our customers with a clean, lower-cost fuel alternative and to help spur the region’s economy. Ongoing research projects include the installation and testing of electric vehicle charging equipment at NU facilities in Hartford and Berlin, Connecticut. In addition, CL&P and WMECo are partnering with interested municipalities and business customers to install about two dozen charging stations in Connecticut and western Massachusetts. These New England states will be among the first in the nation to sell the dual-fuel Chevy Volt and the all-electric Nissan Leaf, as a result of our early, proactive collaboration with automakers and state and local policy leaders.
Innovative customer solutions
Working with our customers to help them conserve energy and manage its use demonstrates another powerful way that NU leads the effort to ensure a clean energy future. In fact, our foresight in energy efficiency has enabled us to lead this worthwhile effort both regionally and nationally for more than three decades.
enable us to strengthen the reliability of our system and increase our ability to add renewable energy to our portfolio of energy resources
investments in the region’s infrastructure
northeast utilities 2010 annual report | five

Energy efficiency is also more critical than ever in these trying economic times. When our customers save energy, it benefits them financially and is good for the environment. Throughout Connecticut, Massachusetts and New Hampshire, we give our customers the tools to better manage their energy use and reduce costs.
In 2010, we partnered with our customers to achieve landmark energy efficiency savings. For example, in Connecticut, nearly 700,000 CL&P and Yankee Gas customers participated in an energy efficiency program or rebate offer sponsored by the Connecticut Energy Efficiency Fund. As a result, these customers saved more than $51 million in energy costs, while tons of carbon dioxide emissions were avoided.
NU received national recognition for continuing its legacy of leadership in energy efficiency and the advancement of technology to best serve our customers. We were among Intelligent Utility magazine’s annual ranking of the nation’s top 25 electric utilities based on our commitment to renewable energy, energy efficiency and our investments in smart grid technology. In addition, our electric operating companies received the
Environmental Protection Agency’s 2010 ENERGY STAR® Sustained Excellence Award as part of the Northeast Retail Products Initiative.
Our region is our home
Across the NU family of companies, whether in Connecticut, western Massachusetts or New Hampshire, we live where we work and we take seriously our responsibility to be good neighbors. The spirit of service has always been reflected in our employees’ commitment to donating their time to volunteer work. Last year, they gave a record number of hours at company-sponsored opportunities to support various causes in our communities.
northeast utilities 2010 annual report | six

NU employees also contribute financially, in particular through the company’s annual employee giving campaign to benefit the United Way. The results of our 2010 campaign once again highlight our long-standing commitment to helping others in need, as exemplified by our total donation of over $1.5 million. Our collective pledges exceeded our $1.1 million campaign pledge goal and reflect NU’s exceptional generosity. Equally impressive was the support of our Day of Caring activities; more than 1,100 NU employees worked on-location at over 40 community sites.
In addition, our operating companies and the Northeast Utilities Foundation provided $4.7 million in grants to nonprofit organizations and worthwhile regional activities across our tri-state service area in 2010.
Positioning NU for the future
2010 was a unique and remarkable year for NU with considerable accomplishments for our customers and shareholders. Of course, none of this would
have been possible without the talented men and women of NU. Our employees are the heart of NU’s achievements that earned us nationwide recognition in 2010 with many awards reflecting our commitment to improving the lives of our customers and supporting technological progress for our industry.
Always looking ahead, we will remain focused on achieving our financial goals and delivering value for you. We will also continue to work hard to sustain operational excellence and honor our environmental and community commitments to continue to deliver industry-leading performance for our customers.
No one championed these commitments more than Dr. E. Gail dePlanque, a member of the NU Board of Trustees for 15 years. We were greatly saddened by Gail’s death in 2010, and she will be missed by her colleagues here at NU.
Finally, I look forward to the successful completion of our merger with NSTAR. This last chapter remains to be written, but I am confident it will allow us to be better positioned to deliver on our promise of leadership and growth for years to come. Thank you for your continued support and confidence as we work to achieve future success.
Sincerely,
Charles W. Shivery Chairman, President and Chief Executive Officer March 11, 2011
to help them conserve energy and manage its use demonstrates another powerful way that NU leads the effort to ensure a clean energy future
working with our customers
northeast utilities 2010 annual report | seven

Northeast Utilities TrusteesRichard H. Booth Vice Chairman, Guy Carpenter & Company, LLC, a global reinsurance intermediary and a subsidiary of Marsh & McLennan Companies, Inc.
John S. ClarkesonChairman Emeritus, The Boston Consulting Group, Inc.
Cotton M. Cleveland President, Mather Associates, a leadership and organizational development consulting firm
Sanford Cloud, Jr.Chairman and Chief Executive Officer, The Cloud Company, LLC, a real estate development and business investment firm
John G. Graham Retired, Former Senior Vice President and Chief Financial Officer, GPU, Inc.
Elizabeth T. Kennan *President Emeritus, Mount Holyoke College, and Partner, Cambus-Kenneth Farm
Kenneth R. LeiblerFormer Chairman, Boston Options Exchange
Robert E. PatricelliChairman and Chief Executive Officer, Women’s Health USA Inc., a provider of women’s health care services, and Evolution Benefits, Inc., a provider of employee benefit services
Charles W. ShiveryChairman of the Board, President and Chief Executive Officer, Northeast Utilities
John F. Swope Attorney, Retired
Dennis R. Wraase Retired, Former Chairman of the Board and Chief Executive Officer, Pepco Holdings, Inc.
* Lead Trustee
Northeast Utilities OfficersCharles W. ShiveryChairman of the Board, President and Chief Executive Officer
David R. McHaleExecutive Vice President and Chief Financial Officer
Leon J. OlivierExecutive Vice President and Chief Operating Officer
Gregory B. ButlerSenior Vice President and General Counsel
Jay S. ButhVice President – Accounting and Controller
Randy A. ShoopVice President and Treasurer
Samuel K. LeeSecretary
O. Kay ComendulAssistant Secretary
Susan B. WeberAssistant Treasurer – Finance
Northeast Utilities Service Company OfficersCharles W. ShiveryChairman, President and Chief Executive Officer
David R. McHaleExecutive Vice President and Chief Financial Officer
Leon J. OlivierExecutive Vice President and Chief Operating Officer
Gregory B. ButlerSenior Vice President and General Counsel
James B. RobbSenior Vice President – Enterprise Planning and Development
James A. MuntzPresident – Transmission
Michael F. AhernVice President – Utility Services
Michael J. AuseréVice President – Finance
Laurie E. AylsworthVice President – Transmission Projects, Engineering and Maintenance
David H. BoguslawskiVice President – Transmission Strategy and Operations
Jay S. ButhVice President – Accounting and Controller
Jeffrey R. KotkinVice President – Investor Relations
Jean M. LaVecchiaVice President – Human Resources
Dana L. LouthVice President – Asset Strategy
Johnny D. MagwoodVice President – Customer Experience and Chief Customer Officer
Margaret L. MortonVice President – Governmental Affairs
Shirley M. PayneVice President – Shared Services
Randy A. ShoopVice President and Treasurer
Lisa J. ThibdaueVice President – Rates and Regulatory
Marie T. van LulingVice President – Communications
Samuel K. LeeSecretary
Electric & Gas Operating Company OfficersCL&P – The Connecticut Light and Power Company
PSNH – Public Service Company of New Hampshire
WMECo – Western Massachusetts Electric Company
Yankee Gas – Yankee Gas Services Company
Charles W. ShiveryChairman, CL&P, PSNH, WMECo and Yankee Gas
Leon J. OlivierChief Executive Officer, CL&P, PSNH, WMECo and Yankee Gas
Jeffrey D. Butler President and Chief Operating Officer, CL&P
Peter J. ClarkePresident and Chief Operating Officer, WMECo
Gary A. LongPresident and Chief Operating Officer, PSNH
Rodney O. PowellPresident and Chief Operating Officer, Yankee Gas
David R. McHaleExecutive Vice President and Chief Financial Officer, CL&P, PSNH, WMECo and Yankee Gas
Gregory B. ButlerSenior Vice President and General Counsel, CL&P, PSNH, WMECo and Yankee Gas
James A. MuntzSenior Vice President – Transmission, CL&P, PSNH and WMECo
Marc N. AndrukiewiczVice President – Operations, Yankee Gas
Laurie E. AylsworthVice President – Transmission Projects, Engineering and Maintenance, CL&P, PSNH and WMECo
David H. BoguslawskiVice President – Transmission Strategy and Operations, CL&P, PSNH and WMECo
Kenneth B. BowesVice President – Energy Delivery Services, CL&P
Jay S. Buth Vice President – Accounting and Controller, CL&P, PSNH, WMECo and Yankee Gas
Robert S. Coates, Jr.Vice President – Customer Operations, WMECo
Robert T. HybschVice President – Customer Operations, CL&P
John M. MacDonald Vice President – Generation, PSNH
William J. Quinlan Vice President – Customer Solutions, CL&P
Paul E. Ramsey Vice President – Energy Delivery, PSNH
Randy A. Shoop Vice President and Treasurer, CL&P, PSNH, WMECo and Yankee Gas
Samuel K. Lee Secretary, CL&P, PSNH and Yankee Gas and Secretary and Clerk, WMECo
trustees and officers (as of March 11, 2011)
northeast utilities 2010 annual report | eight

UNITED STATES SECURITIES AND EXCHANGE COMMISSION WASHINGTON, D.C. 20549
FORM 10-K
[X] ANNUAL REPORT PURSUANT TO SECTION 13 OR 15(d) OF THE
SECURITIES EXCHANGE ACT OF 1934 For the Fiscal Year Ended December 31, 2010 OR [ ] TRANSITION REPORT PURSUANT TO SECTION 13 OR 15(d) OF THE
SECURITIES EXCHANGE ACT OF 1934 For the transition period from ____________ to ____________
Commission File Number
Registrant; State of Incorporation;Address; and Telephone Number
I.R.S. EmployerIdentification No.
1-5324 NORTHEAST UTILITIES
(a Massachusetts voluntary association) One Federal Street Building 111-4 Springfield, Massachusetts 01105 Telephone: (413) 785-5871
04-2147929
0-00404 THE CONNECTICUT LIGHT AND POWER COMPANY
(a Connecticut corporation) 107 Selden Street Berlin, Connecticut 06037-1616 Telephone: (860) 665-5000
06-0303850
1-6392 PUBLIC SERVICE COMPANY OF NEW HAMPSHIRE
(a New Hampshire corporation) Energy Park 780 North Commercial Street Manchester, New Hampshire 03101-1134 Telephone: (603) 669-4000
02-0181050
0-7624 WESTERN MASSACHUSETTS ELECTRIC COMPANY
(a Massachusetts corporation) One Federal Street Building 111-4 Springfield, Massachusetts 01105 Telephone: (413) 785-5871
04-1961130

Securities registered pursuant to Section 12(b) of the Act: Registrant
Title of Each Class
Name of Each Exchange on Which Registered
Northeast Utilities Common Shares, $5.00 par value New York Stock Exchange, Inc. Securities registered pursuant to Section 12(g) of the Act: Registrant Title of Each Class The Connecticut Light and Power Company
Preferred Stock, par value $50.00 per share, issuable in series, of which the following series are outstanding:
$1.90 Series of 1947 $2.00 Series of 1947 $2.04 Series of 1949 $2.20 Series of 1949 3.90% Series of 1949 $2.06 Series E of 1954 $2.09 Series F of 1955 4.50% Series of 1956 4.96% Series of 1958 4.50% Series of 1963 5.28% Series of 1967 $3.24 Series G of 1968 6.56% Series of 1968
Public Service Company of New Hampshire and Western Massachusetts Electric Company meet the conditions set forth in General Instruction I(1)(a) and (b) of Form 10-K and are therefore filing this Form 10-K with the reduced disclosure format specified in General Instruction I(2) to Form 10-K. Indicate by check mark if the registrants are well-known seasoned issuers, as defined in Rule 405 of the Securities Act. Yes No
Indicate by check mark if the registrants are not required to file reports pursuant to Section 13 or Section 15(d) of the Act. Yes No
Indicate by check mark whether the registrants (1) have filed all reports required to be filed by Section 13 or 15(d) of the Securities Exchange Act of 1934 during the preceding 12 months (or for such shorter period that the registrants were required to file such reports), and (2) have been subject to such filing requirements for the past 90 days. Yes No
Indicate by check mark if disclosure of delinquent filers pursuant to Item 405 of Regulation S-K is not contained herein, and will not be contained, to the best of the registrants' knowledge, in definitive proxy or information statements incorporated by reference in Part III of this Form 10-K or any amendment to this Form 10-K. [ ] Indicate by check mark whether the registrant is a large accelerated filer, an accelerated filer, or a non-accelerated filer. See definition of "accelerated filer and large accelerated filer" in Rule 12b-2 of the Exchange Act. (Check one): Large
Accelerated Filer Accelerated
Filer Non-accelerated
Filer
Northeast Utilities The Connecticut Light and Power Company Public Service Company of New Hampshire Western Massachusetts Electric Company
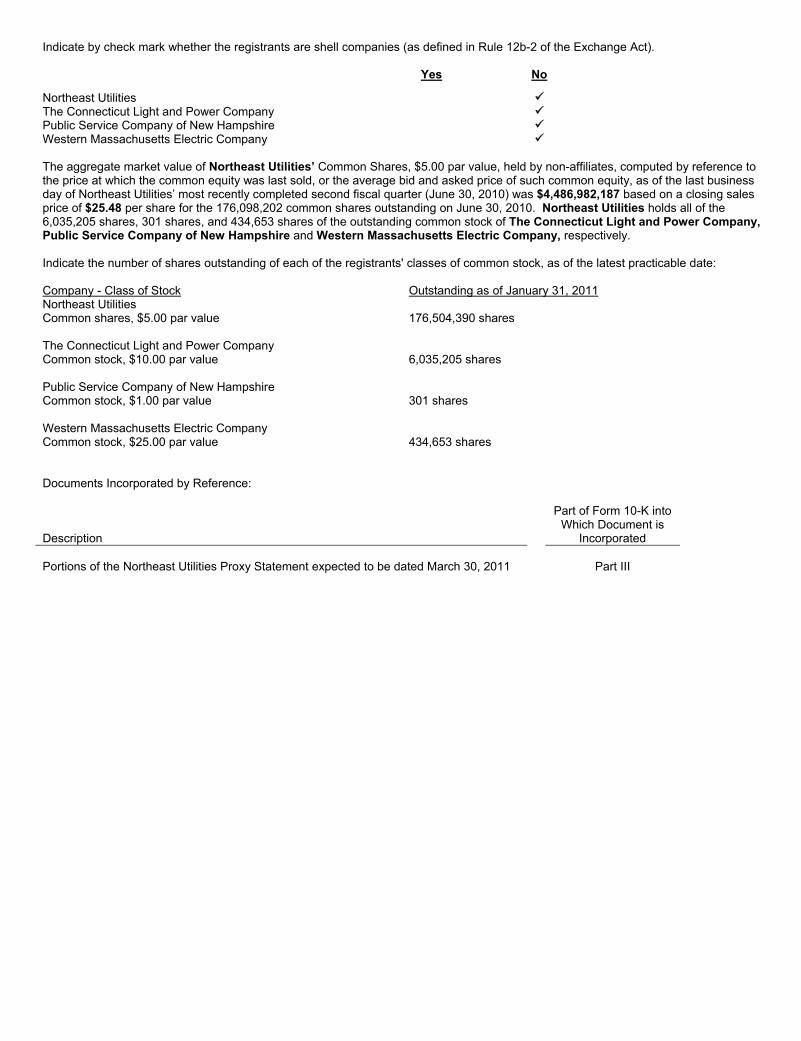
Indicate by check mark whether the registrants are shell companies (as defined in Rule 12b-2 of the Exchange Act). Yes No
Northeast Utilities The Connecticut Light and Power Company Public Service Company of New Hampshire Western Massachusetts Electric Company The aggregate market value of Northeast Utilities’ Common Shares, $5.00 par value, held by non-affiliates, computed by reference to the price at which the common equity was last sold, or the average bid and asked price of such common equity, as of the last business day of Northeast Utilities’ most recently completed second fiscal quarter (June 30, 2010) was $4,486,982,187 based on a closing sales price of $25.48 per share for the 176,098,202 common shares outstanding on June 30, 2010. Northeast Utilities holds all of the 6,035,205 shares, 301 shares, and 434,653 shares of the outstanding common stock of The Connecticut Light and Power Company, Public Service Company of New Hampshire and Western Massachusetts Electric Company, respectively. Indicate the number of shares outstanding of each of the registrants' classes of common stock, as of the latest practicable date: Company - Class of Stock Outstanding as of January 31, 2011 Northeast Utilities Common shares, $5.00 par value
176,504,390 shares
The Connecticut Light and Power Company Common stock, $10.00 par value
6,035,205 shares
Public Service Company of New Hampshire Common stock, $1.00 par value
301 shares
Western Massachusetts Electric Company Common stock, $25.00 par value
434,653 shares
Documents Incorporated by Reference: Description
Part of Form 10-K intoWhich Document is
Incorporated Portions of the Northeast Utilities Proxy Statement expected to be dated March 30, 2011 Part III

i
GLOSSARY OF TERMS
The following is a glossary of abbreviations or acronyms that are found in this report. CURRENT OR FORMER NU COMPANIES, SEGMENTS OR INVESTMENTS: Boulos E.S. Boulos Company CL&P The Connecticut Light and Power Company HWP HWP Company, formerly the Holyoke Water Power Company NGS Northeast Generation Services Company and subsidiaries NGS Mechanical NGS Mechanical, Inc. NPT Northern Pass Transmission LLC, a jointly owned limited liability company, held
by NUTV and NSTAR Transmission Ventures, Inc. on a 75 percent and 25 percent basis, respectively
NUTV NU Transmission Ventures, Inc. NU or the Company Northeast Utilities and subsidiaries NU Enterprises NU Enterprises, Inc., the parent company of Select Energy, NGS, NGS
Mechanical, SECI and Boulos NUSCO Northeast Utilities Service Company NU parent and other companies NU parent and other companies is comprised of NU parent, NUSCO and other
subsidiaries, including HWP, RRR (a real estate subsidiary), and the non-energy-related subsidiaries of Yankee (Yankee Energy Services Company, and Yankee Energy Financial Services Company)
PSNH Public Service Company of New Hampshire Regulated companies NU's Regulated companies, comprised of the electric distribution and transmission
segments of CL&P, PSNH and WMECO, the generation activities of PSNH and WMECO, Yankee Gas, a natural gas local distribution company, and NPT
RRR The Rocky River Realty Company SECI Select Energy Contracting, Inc. Select Energy Select Energy, Inc. SESI Select Energy Services, Inc., a former subsidiary of NU Enterprises WMECO Western Massachusetts Electric Company Yankee Yankee Energy System, Inc. Yankee Gas Yankee Gas Services Company REGULATORS: CDEP Connecticut Department of Environmental Protection DOE U.S. Department of Energy EPA U.S. Environmental Protection Agency DPU Massachusetts Department of Public Utilities DPUC Connecticut Department of Public Utility Control FERC Federal Energy Regulatory Commission MA DEP Massachusetts Department of Environmental Protection NHPUC New Hampshire Public Utilities Commission SEC Securities and Exchange Commission USDEP U.S. Department of Environmental Protection OTHER: 2010 Healthcare Act Patient Protection and Affordable Care Act 2010 Tax Act Tax Relief, Unemployment Insurance Reauthorization and Job Creation Act AFUDC Allowance For Funds Used During Construction AMI Advanced metering infrastructure ARO Asset Retirement Obligation C&LM Conservation and Load Management CAAA Clean Air Act Amendments CERCLA The federal Comprehensive Environmental Response, Compensation and
Liability Act of 1980 CfD Contract for Differences CO2 Carbon dioxide CSC Connecticut Siting Council CTA Competitive Transition Assessment CWIP Construction work in progress CYAPC Connecticut Yankee Atomic Power Company EFSB Massachusetts Energy Facilities Siting Board EIA Energy Independence Act EMF Electric and Magnetic Fields

ii
EPS Earnings Per Share ERISA Employee Retirement Income Security Act of 1974 ES Default Energy Service ESOP Employee Stock Ownership Plan ESPP Employee Stock Purchase Plan FASB Financial Accounting Standards Board Fitch Fitch Ratings FMCC Federally Mandated Congestion Charge FTR Financial Transmission Rights GAAP Accounting principles generally accepted in the United States of America GHG Greenhouse Gas GSC Generation Service Charge GSRP Greater Springfield Reliability Project GWh Giga-watt Hours HG&E Holyoke Gas and Electric, a municipal department of the town of Holyoke, MA HQ Hydro-Québec, a corporation wholly-owned by the Québec government, including
its divisions that produce, transmit and distribute electricity in Québec, Canada HVDC High voltage direct current Hydro Renewable Energy H.Q. Hydro Renewable Energy, Inc., a wholly-owned subsidiary of Hydro-Québec IPP Independent Power Producers ISO-NE ISO New England, Inc., the New England Independent System Operator KV Kilovolt KWh Kilowatt-Hours LNG Liquefied natural gas LOC Letter of Credit LRS Last resort service MGP Manufactured Gas Plant Millstone Millstone Nuclear Generating station, made up of Millstone 1, Millstone 2, and
Millstone 3. All three units were sold in March 2001. MMBtu One million British thermal units Money Pool Northeast Utilities Money Pool Moody's Moody's Investors Services, Inc. MW Megawatt MWh Megawatt-Hours MYAPC Maine Yankee Atomic Power Company NEEWS New England East-West Solution NOx Nitrogen oxide Northern Pass The high voltage direct current transmission line project from Canada into New
Hampshire NPDES National Pollutant Discharge Elimination System NU supplemental benefit trust The NU Trust Under Supplemental Executive Retirement Plan NWPP Northern Wood Power Project PBO Projected Benefit Obligation PBOP Postretirement Benefits Other Than Pension PBOP Plan Postretirement Benefits Other Than Pension Plan that provides certain retiree
health care benefits, primarily medical and dental, and life insurance benefits PCRBs Pollution Control Revenue Bonds Pension Plan Single uniform noncontributory defined benefit retirement plan PGA Purchased Gas Adjustment PPA Pension Protection Act RECs Renewable Energy Certificates Regulatory ROE The average cost of capital method for calculating the return on equity related to
the distribution and generation business segments excluding the wholesale transmission segment
RFP Request for Proposal RGGI Regional Greenhouse Gas Initiative RMR Reliability Must Run RNS Regional Network Service ROE Return on Equity RPS Renewable Portfolio Standards RRB Rate Reduction Bond or Rate Reduction Certificate RSUs Restricted share units RTO Regional Transmission Organization S&P Standard & Poor's Financial Services LLC SBC Systems Benefits Charge SCRC Stranded Cost Recovery Charge SERP Supplemental Executive Retirement Plan SO2 Sulfur dioxide

iii
SS Standard service TCAM Transmission Cost Adjustment Mechanism TSA Transmission Service Agreement UI The United Illuminating Company VIE Variable interest entity WWL Project The construction of a 16-mile gas pipeline between Waterbury and Wallingford,
Connecticut and the increase of vaporization output of Yankee Gas' LNG plant YAEC Yankee Atomic Electric Company Yankee Companies Connecticut Yankee Atomic Power Company, Yankee Atomic Electric Company
and Maine Yankee Atomic Power Company

iv
NORTHEAST UTILITIES THE CONNECTICUT LIGHT AND POWER COMPANY PUBLIC SERVICE COMPANY OF NEW HAMPSHIRE
WESTERN MASSACHUSETTS ELECTRIC COMPANY
2010 Form 10-K Annual Report Table of Contents
Part I Page
Item 1. Business 2
Item 1A. Risk Factors 14
Item 1B. Unresolved Staff Comments 19
Item 2. Properties 19
Item 3. Legal Proceedings 20
Item 4. [RESERVED] 22
Part II
Item 5. Market for the Registrants' Common Equity and Related Stockholder Matters 23
Item 6. Selected Consolidated Financial Data 24
Item 7. Management's Discussion and Analysis of Financial Condition and Results of Operations 26
Item 7A. Quantitative and Qualitative Disclosures about Market Risk 53
Item 8. Financial Statements and Supplementary Data 55
Item 8A. Changes in and Disagreements with Accountants on Accounting and Financial Disclosure 122
Item 8B. Controls and Procedures 122
Item 9. Other Information 122
Part III
Item 10. Directors, Executive Officers and Corporate Governance 123
Item 11. Executive Compensation 124
Item 12. Security Ownership of Certain Beneficial Owners and Management and Related Stockholder Matters 125
Item 13. Certain Relationships and Related Transactions, and Director Independence 126
Item 14. Principal Accountant Fees and Services 126
Part IV
Item 15. Exhibits and Financial Statement Schedules 127
Signatures 128

1
NORTHEAST UTILITIES THE CONNECTICUT LIGHT AND POWER COMPANY PUBLIC SERVICE COMPANY OF NEW HAMPSHIRE
WESTERN MASSACHUSETTS ELECTRIC COMPANY
SAFE HARBOR STATEMENT UNDER THE PRIVATE SECURITIES LITIGATION REFORM ACT OF 1995
References in this Annual Report on Form 10-K to "NU," "we," "our," and "us" refer to Northeast Utilities and its consolidated subsidiaries. From time to time we make statements concerning our expectations, beliefs, plans, objectives, goals, strategies, assumptions of future events, financial performance or growth and other statements that are not historical facts. These statements are "forward-looking statements" within the meaning of the Private Securities Litigation Reform Act of 1995. You can generally identify our forward-looking statements through the use of words or phrases such as "estimate," "expect," "anticipate," "intend," "plan," "project," "believe," "forecast," "should," "could," and other similar expressions. Forward-looking statements are based on the current expectations, estimates, assumptions or projections of management and are not guarantees of future performance. These expectations, estimates, assumptions or projections may vary materially from actual results. Accordingly, any such statements are qualified in their entirety by reference to, and are accompanied by, the following important factors that could cause our actual results to differ materially from those contained in our forward-looking statements, including, but not limited to:
• actions or inaction by local, state and federal regulatory bodies • changes in business and economic conditions, including their impact on interest rates, bad debt expense, and demand for our
products and services • changes in weather patterns • changes in laws, regulations or regulatory policy • changes in levels and timing of capital expenditures • disruptions in the capital markets or other events that make our access to necessary capital more difficult or costly • developments in legal or public policy doctrines • technological developments • changes in accounting standards and financial reporting regulations • fluctuations in the value of our remaining competitive contracts • actions of rating agencies • The expected timing and likelihood of completion of the proposed merger with NSTAR, including the timing, receipt and terms
and conditions of any required governmental and regulatory approvals of the proposed merger that could reduce anticipated benefits or cause the parties to abandon the merger, the diversion of management's time and attention from our ongoing business during this time period, as well as the ability to successfully integrate the businesses, and the risk that the credit ratings of the combined company or its subsidiaries may be different from what the companies expect and
• other presently unknown or unforeseen factors. Other risk factors are detailed in our reports filed with the SEC and updated as necessary, and we encourage you to consult such disclosures. All such factors are difficult to predict, contain uncertainties that may materially affect our actual results and are beyond our control. You should not place undue reliance on the forward-looking statements, each speaks only as of the date on which such statement is made, and we undertake no obligation to update any forward-looking statement or statements to reflect events or circumstances after the date on which such statement is made or to reflect the occurrence of unanticipated events. New factors emerge from time to time and it is not possible for management to predict all of such factors, nor can it assess the impact of each such factor on the business or the extent to which any factor, or combination of factors, may cause actual results to differ materially from those contained in any forward-looking statements. For more information, see Item 1A, Risk Factors, included in this combined Annual Report on Form 10-K. This Annual Report on Form 10-K also describes material contingencies and critical accounting policies and estimates in the accompanying Management’s Discussion and Analysis and Combined Notes to Consolidated Financial Statements. We encourage you to review these items.

2
NORTHEAST UTILITIES THE CONNECTICUT LIGHT AND POWER COMPANY PUBLIC SERVICE COMPANY OF NEW HAMPSHIRE
WESTERN MASSACHUSETTS ELECTRIC COMPANY
PART I Item 1. Business Please refer to the Glossary of Terms for definitions of defined terms and abbreviations used in this Annual Report on Form 10-K. PROPOSED MERGER WITH NSTAR On October 18, 2010, we and NSTAR announced that each company’s Board of Trustees unanimously approved a Merger Agreement (the merger agreement) to combine the two companies. The transaction was structured as a merger of equals in a tax-free exchange. Upon the terms and subject to the conditions set forth in the merger agreement, at closing, NSTAR will become a wholly-owned subsidiary of NU. The post-transaction company will provide electric and natural gas energy delivery service to nearly 3.5 million electric and natural gas customers through six regulated electric and natural gas utilities in Connecticut, Massachusetts and New Hampshire, representing over half of all the customers in New England. Under the terms of the merger agreement, NSTAR shareholders would receive 1.312 NU common shares for each common share of NSTAR that they own (the "exchange ratio"). The exchange ratio was structured to result in a no premium merger and is based on the average closing share price of each company's common shares for the 20 trading days preceding the announcement. Following completion of the merger, common shares of the post-transaction company will be owned approximately 56 percent by NU shareholders and approximately 44 percent by former NSTAR shareholders. We anticipate that we will issue approximately 137 million common shares to the NSTAR shareholders as a result of the merger. Following the closing of the merger, our next quarterly dividend per common share will be increased to an amount that is equivalent to NSTAR’s last quarterly dividend per common share paid prior to the closing, divided by the exchange ratio. Based on the last quarterly dividend paid by NSTAR of $0.425 per share, and assuming there are no changes to such dividend prior to the closing of the merger, that would result in NU’s quarterly dividend being increased by approximately 18 percent to approximately $0.325 per share, or approximately $1.30 per share on an annualized basis as compared to NU's current annualized dividend of $1.10 per share. NU filed its joint proxy statement/prospectus with the SEC on January 5, 2011 and scheduled a special meeting of shareholders for March 4, 2011, at which shareholders will vote on whether to approve the merger. Completion of the merger is subject to various customary conditions, including approval by holders of two-thirds of the outstanding common shares of each company and receipt of all required regulatory approvals, including those of the Massachusetts DPU, the FERC and the NRC. We received approval from the FCC on January 4, 2011, and on February 10, 2011, the applicable Hart-Scott-Rodino waiting period expired. Several intervening parties have applied to participate in the regulatory review of the merger and have raised various issues that they believe the regulatory agencies should examine in the course of the proceedings. In November 2010, the DPUC issued a draft decision stating it lacked jurisdiction over the merger. In December 2010, the Connecticut Office of Consumer Counsel, supported by the Connecticut Attorney General, petitioned the DPUC to reconsider its draft decision. In January 2011, the DPUC issued an Administrative Order stating that it plans to hold a hearing to determine if it has jurisdiction over the merger. Oral arguments surrounding the draft decision were held in February 2011. The DPUC plans to hold an informational hearing at a date to be determined. In addition, legislation proposing to give the DPUC jurisdiction over the merger may be introduced in the Connecticut legislature. THE COMPANY NU, headquartered in Hartford, Connecticut, is a public utility holding company subject to regulation by FERC under the Public Utility Holding Company Act of 2005. We are engaged primarily in the energy delivery business through the following wholly-owned utility subsidiaries: ● The Connecticut Light and Power Company (CL&P), a regulated electric utility that serves residential, commercial and
industrial customers in parts of Connecticut; ● Public Service Company of New Hampshire (PSNH), a regulated electric utility that serves residential, commercial and
industrial customers in parts of New Hampshire and continues to own generation assets used to serve customers; ● Western Massachusetts Electric Company (WMECO), a regulated electric utility that serves residential, commercial and
industrial customers in parts of western Massachusetts; and ● Yankee Gas Services Company (Yankee Gas), a regulated natural gas utility that serves residential, commercial and industrial
customers in parts of Connecticut. NU also owns certain unregulated businesses through its wholly-owned subsidiary, NU Enterprises. As of December 31, 2010, NU Enterprises’ business consisted of (i) Select Energy’s few remaining energy wholesale marketing contracts, which are being wound down, and (ii) NU Enterprises’ electrical contracting business.

3
Although NU, CL&P, PSNH and WMECO each report their financial results separately, we also include information in this report on a segment, or line-of-business, basis - the distribution segment (which also includes the generation businesses of PSNH and WMECO and our natural gas distribution business) and the transmission segment. Our Regulated companies accounted for approximately 99 percent of our total earnings of $387.9 million for 2010, with electric distribution representing approximately 45 percent, natural gas distribution representing approximately 8 percent and electric transmission representing approximately 46 percent of consolidated earnings. The remaining 1 percent of our 2010 earnings comes from our competitive businesses. REGULATED ELECTRIC DISTRIBUTION General NU’s electric distribution segment consists of the distribution businesses of CL&P, PSNH and WMECO, which are primarily engaged in the distribution of electricity in Connecticut, New Hampshire and western Massachusetts, respectively, plus PSNH’s regulated electric generation business and WMECO’s solar generation. The following table shows the sources of 2010 electric franchise retail revenues for NU’s electric distribution companies, collectively, based on categories of customers:
Sources ofRevenue
% of Total Revenues
Residential 59% Commercial 33% Industrial 7% Other 1% Total 100%
A summary of changes in the Regulated companies’ retail electric sales (GWh) for 2010 as compared to 2009 on an actual and weather normalized basis (using a 30-year average) is as follows:
2010 2009
PercentageIncrease/
(Decrease)
Weather Normalized Percentage (Decrease)
Residential 14,913 14,412 3.5% (0.7)% Commercial 14,506 14,474 0.2% (2.8)% Industrial 4,481 4,423 1.3% (1.5)% Other 330 336 (1.4)% (1.4)% Total 34,230 33,645 1.7% (1.7)%
Total retail electric sales for all three electric companies were higher in 2010 compared to 2009 due primarily to warmer than normal weather in the summer of 2010 and colder than normal weather in December 2010. Residential sales benefitted the most from the weather in 2010 and were higher for all three electric companies in 2010 compared to 2009. On a weather normalized basis, retail sales for all three electric companies were lower in 2010 compared to 2009. We believe the decrease was due in part to increased conservation efforts by our customers and the continuing effects of the weak economy. THE CONNECTICUT LIGHT AND POWER COMPANY - DISTRIBUTION CL&P’s distribution business consists primarily of the purchase, delivery and sale of electricity to its residential, commercial and industrial customers. As of December 31, 2010, CL&P furnished retail franchise electric service to approximately 1.2 million customers in 149 cities and towns in Connecticut. CL&P does not own any electric generation facilities. In 2010, CL&P had contracts to purchase the electric output from eighteen IPP generators. The term of two of these contracts ended in 2010. In 2011 the sixteen remaining generators are anticipated to provide approximately two million MWh per year through March 2015, with purchase quantities dropping significantly from 2015 through 2024, when the term of the last IPP contract ends. CL&P sells the output of these contracts into the ISO New England market, crediting customer energy charges with the proceeds. CL&P has entered into eleven contracts with renewable energy generators under a state program known as Project 150, and UI has entered into 2 other similar contracts under Project 150. CL&P and UI will share the costs and benefits of these contracts on an 80 percent and 20 percent basis, respectively. This cost sharing split is independent of the specific utility that is the counterparty to the contract. It is currently projected that the first of these renewable energy projects will commence commercial operation in 2011.

4
The following table shows the sources of 2010 electric franchise retail revenues for CL&P based on categories of customers:
Sources ofRevenue
% of Total Revenues
Residential 61% Commercial 32% Industrial 6% Other 1% Total 100%
Rates CL&P is subject to regulation by the Connecticut DPUC, which, among other things, has jurisdiction over its rates, accounting procedures, certain dispositions of property and plant, mergers and consolidations, issuances of long-term securities, standards of service, management efficiency and construction and operation of facilities. CL&P's present general rate structure consists of various rate and service classifications covering residential, commercial and industrial services. CL&P's retail rates include a delivery service component, which includes distribution, transmission, conservation, renewables, CTA, SBC and other charges that are assessed on all customers. The CTA is a charge assessed to recover stranded costs associated with electric industry restructuring as well as various IPP contracts. The SBC recovers costs associated with various hardship and low income programs as well as payments to municipalities to compensate them for losses in property tax revenue due to decreases in the value of electric generating facilities resulting directly from electric industry restructuring. The CTA and SBC are annually reconciled to actual costs incurred, with any difference refunded to, or recovered from, customers. Under state law, all of CL&P's customers are entitled to choose their energy suppliers, while CL&P remains their electric distribution company. Under "Standard Service" rates for customers with less than 500 KW of demand and "Supplier of Last Resort Service" rates for customers with 500 KW of demand or greater, CL&P purchases power for those customers who do not choose a competitive energy supplier and passes the cost to such customers through a combined GSC and FMCC on customers' bills. The combined GSC and FMCC charges for both types of service recover all of the costs of procuring energy from CL&P's wholesale suppliers and are adjusted periodically and reconciled semi-annually in accordance with the directives of the DPUC. Although more CL&P customers chose competitive energy suppliers in 2010 than in 2009, CL&P continues to supply approximately 40 percent of its customer load at Standard Service or Supplier of Last Resort Service rates while the other 60 percent of its customer load has migrated to competitive energy suppliers. Because this customer migration is only for energy supply service, it has no impact on CL&P’s delivery business or its operating income. Distribution Rates: On June 30, 2010, the DPUC issued a final order in CL&P’s most recent retail rate case approving annualized distribution rate increases of $63.4 million effective July 1, 2010 and an incremental $38.5 million effective July 1, 2011. The 2010 increase was deferred from customer bills until January 1, 2011 to coincide with the decline in revenue requirements associated with the final payment of CL&P’s RRBs. In its decision, the DPUC also maintained CL&P’s authorized distribution segment regulatory ROE of 9.4 percent. In 2010, CL&P earned a distribution segment regulatory ROE of 7.9 percent, compared to 7.3 percent in 2009, and expects to earn a distribution segment regulatory ROE of approximately 9 percent in 2011. In May 2010, the Connecticut Legislature approved a state budget for the 2010-2011 fiscal year, which calls for the issuance by the state of Connecticut of up to $760 million of economic recovery revenue bonds (ERRBs) that would be amortized over eight years. These bonds will be repaid through a charge on the bills of customers of CL&P and other Connecticut electric distribution companies. For CL&P, the revenue to pay interest and principal on the bonds would come from a continuation of a portion of its CTA, which would have otherwise ended by December 31, 2010 with the final payment of the principal and interest on its RRBs, and the diversion of about one-third of the annual funding for C&LM programs beginning in April 2012. A lawsuit pending against the DPUC to prevent the issuance of the ERRBs is pending and several bills seeking to modify or prevent the issuance have been proposed before the state legislature. On March 31, 2010, CL&P filed with the DPUC an AMI and dynamic pricing plan concluding that a full deployment of AMI meters accompanied by dynamic pricing options for all CL&P customers would be cost beneficial under a set of reasonable assumptions, identified as the "base case scenario." Under the base case scenario, capital expenditures associated with the installation of the meters are estimated at $296 million. CL&P has proposed beginning installation of meters in late 2012 and finishing in 2016. CL&P has a transmission adjustment clause as part of its retail distribution rates, which reconciles on a semi-annual basis the transmission revenues billed to customers against the transmission costs of acquiring such services, thereby recovering all of its transmission expenses on a timely basis. Sources and Availability of Electric Power Supply As noted above, CL&P does not own any generation assets and purchases energy to serve its Standard Service and Supplier of Last Resort Service loads from a variety of competitive sources through periodic RFPs. CL&P enters into supply contracts for Standard Service periodically for periods of up to three years to mitigate price volatility for its residential and small and medium load commercial

5
and industrial customers. CL&P enters into supply contracts for Supplier of Last Resort service for larger commercial and industrial customers every three months. Currently, CL&P has contracts in place with various suppliers for all of its Standard Service loads through 2011, 40 percent of expected load for 2012, and 10 percent of expected load for 2013. CL&P’s contracts for its Supplier of Last Resort Service loads extend through the second quarter of 2011. PUBLIC SERVICE COMPANY OF NEW HAMPSHIRE - DISTRIBUTION PSNH’s distribution business (which includes its generation business) consists primarily of the generation, purchase, delivery and sale of electricity to its residential, commercial and industrial customers. As of December 31, 2010, PSNH furnished retail franchise electric service to approximately 497,000 retail customers in 211 cities and towns in New Hampshire. PSNH also owns and operates approximately 1,200 MW of primarily fossil-fueled electricity generation assets. Included in those generation assets is its 50 MW wood-burning Northern Wood Power Project at its Schiller Station in Portsmouth, New Hampshire, and approximately 70 MW of hydroelectric generation. PSNH also has contracts with 18 IPPs, the output of which it either uses to serve its customer load or sells into the market. PSNH is constructing its Clean Air Project, a sulfur dioxide and mercury scrubber at its Merrimack coal-fired generation station, which is currently expected to cost $430 million. The project is scheduled for completion in mid-2012. PSNH will recover all related costs through its ES rates described below. The following table shows the sources of 2010 electric franchise retail revenues based on categories of customers:
Sources ofRevenue
% of Total Revenues
Residential 54% Commercial 36% Industrial 9% Other 1% Total 100%
Rates PSNH is subject to regulation by the NHPUC, which has jurisdiction over, among other things, rates, certain dispositions of property and plant, mergers and consolidations, issuances of securities, standards of service, management efficiency and construction and operation of facilities. PSNH’s ES rate recovers its generation and purchased power costs from customers on a current basis and allows for an ROE of 9.81 percent on its generation investment. Under New Hampshire law, the SCRC allows PSNH to recover its stranded costs, including expenses incurred under mandated power contracts and other long-term investments and obligations. PSNH has financed a significant portion of its stranded costs through securitization by issuing RRBs secured by the right to recover these stranded costs from customers over time and recovers the costs of these bonds through the SCRC rate. On an annual basis, PSNH files with the NHPUC an ES/SCRC reconciliation filing for the preceding year. The difference between ES/SCRC revenues and ES/SCRC costs are included in the ES/SCRC rate calculations and refunded to/recovered from customers in the subsequent period approved by the NHPUC. The TCAM allows PSNH to recover on a fully reconciling basis its transmission related costs. The TCAM is adjusted July 1 of each year. Distribution Rates: On June 28, 2010, the NHPUC approved a joint settlement of PSNH’s rate case that had commenced in 2009, allowing a net distribution rate increase of $45.5 million on an annualized basis to be effective July 1, 2010, and annualized distribution rate adjustments projected to be a decrease of $2.9 million and increases of $9.5 million and $11.1 million on July 1 of each of the three subsequent years, respectively. PSNH agreed not to file a new distribution rate request that would be effective prior to July 1, 2015. During the term of the settlement, PSNH can only propose changes to its permanent distribution rate level when its 12-month distribution ROE falls below 7 percent for two consecutive quarters or certain specified external events, such as major storms, occur. If PSNH’s 12-month ROE rolling average is greater than 10 percent, anything over the 10 percent level will be allocated 75 percent to customers and 25 percent to PSNH. The settlement also provided that the authorized regulatory ROE on distribution only plant will continue at the previously allowed level of 9.67 percent. PSNH’s distribution segment regulatory ROE was 10.2 percent (including generation) in 2010, compared to 7.2 percent in 2009. We expect PSNH’s distribution segment regulatory ROE will be approximately 9 percent in 2011. PSNH's customers are entitled to choose competitive energy suppliers, with PSNH providing default energy service under its ES rate for those customers who do not elect to use a third party supplier. Prior to 2009, PSNH experienced only a minimal amount of customer migration. However, customer migration levels began to increase significantly in 2009 as energy costs decreased from their historic high levels and competitive energy suppliers with more pricing flexibility were able to offer electricity supply at lower prices than PSNH. By the end of 2010, approximately 2 percent of all of PSNH’s customers (approximately 32 percent of load), mostly large commercial and industrial customers, had switched to competitive energy suppliers. The increased level of migration has caused an
6
increase in the ES rate, as fixed costs of PSNH’s generation assets must be spread over a smaller group of customers and lower sales volume. The customers that did not switch to a third party supplier, predominately residential and small commercial and industrial customers, are now paying a larger proportion of these fixed costs. The NHPUC opened a proceeding in 2010 to consider the effect of customer migration on ES rates for customers, principally residential and small commercial and industrial customers, remaining on PSNH default energy service. As part of this docket, the NHPUC stated its intention to explore the interplay of customer choice, migration issues and power procurement options for PSNH. PSNH cannot predict if the upward pressure on ES rates will continue into the future, as future customer migration levels, which are dependent on market prices and supplier alternatives, are uncertain. If future market prices once more exceed the average ES rate level, some or all of these customers on third party supply may migrate back to PSNH. Sources and Availability of Electric Power Supply During 2010, about 88 percent of PSNH’s load was met through its own generation, long-term power supply provided pursuant to orders of the NHPUC, and contracts with third parties. The remaining 12 percent of PSNH's load was met by short-term (less than one year) purchases and spot purchases in the competitive New England wholesale power market. PSNH expects to meet its load requirements in 2011 in a similar manner. WESTERN MASSACHUSETTS ELECTRIC COMPANY - DISTRIBUTION WMECO’s distribution business consists primarily of the purchase, delivery and sale of electricity to residential, commercial and industrial customers. At December 31, 2010, WMECO furnished retail franchise electric service to approximately 206,000 retail customers in 59 cities and towns in the western third of Massachusetts. Following electric industry restructuring in the 1990s, WMECO sold all of its generating facilities and now purchases its energy requirements from competitive suppliers. In 2009, pursuant to the Massachusetts Green Communities Act, WMECO was authorized to install 6 MW of solar energy generation in its service territory. In October 2010, WMECO completed construction of a 1.8 MW solar generation facility at a site in Pittsfield, Massachusetts, which began producing electricity in late 2010. In January 2011, WMECO announced its plans to develop a second solar generation facility at a site in Springfield, Massachusetts. This facility will accommodate 17,000 solar panels, producing up to 4.2 MW of solar energy. WMECO will sell all energy and other products from its solar generation facilities into the ISO New England market. WMECO had a contract with one IPP generator in 2010, the output of which WMECO sold into the ISO New England market. The term of this contract ended on December 31, 2010. The following table shows the sources of 2010 electric franchise retail revenues based on categories of customers:
Sources ofRevenue
% of Total Revenues
Residential 57% Commercial 33% Industrial 9% Other 1% Total 100%
Rates WMECO is subject to regulation by the Massachusetts DPU, which has jurisdiction over, among other things, rates, accounting procedures, certain dispositions of property and plant, mergers and consolidations, issuances of long-term securities, acquisition of securities, standards of service, management efficiency and construction and operation of distribution, production and storage facilities. WMECO's present general rate structure consists of various rate and service classifications covering residential, commercial and industrial services. Massachusetts utilities are entitled under state law to charge rates that are sufficient to allow them an opportunity to recover their reasonable operation and capital costs, to attract needed capital and maintain their financial integrity, while also protecting relevant public interests. Under state law, WMECO's customers are entitled to choose their energy suppliers, while WMECO remains their distribution company. WMECO purchases electric power from competitive suppliers for, and passes through the cost to, those customers who do not choose a competitive energy supplier (basic service). Basic service charges are adjusted and reconciled on an annual basis. Most of WMECO's residential and small commercial and industrial customers have continued to buy their power from WMECO at basic service rates. A greater proportion of large commercial and industrial customers have opted for a competitive energy supplier. WMECO continues to supply approximately 50 percent of its customer load at basic service rates while the other 50 percent of its customer load has migrated to competitive energy suppliers. Because this customer migration is only for energy supply service, it has no impact on WMECO’s delivery business or its operating income. WMECO recovers certain costs through various tracking mechanisms in its retail rates, including transmission costs, pension costs and prudently incurred stranded costs (a portion of which have been financed through securitization by issuing RRBs) with periodic true-up adjustments.

7
Distribution Rates: On January 31, 2011, the DPU issued a final decision in WMECO’s July 2010 rate application, granting a $16.8 million annualized rate increase in distribution revenues and an allowed ROE of 9.6 percent effective February 1, 2011. The DPU also authorized a full decoupling mechanism, whereby actual revenue billed by WMECO would be reconciled with WMECO’s target revenue on an annual basis, WMECO’s request to recover balances of certain active hardship account balances and the recovery of certain storm costs over five years. The DPU did not authorize rate recovery of a proposed $20 million average increase in WMECO’s capital spending plan. WMECO’s distribution segment regulatory ROE was 4.6 percent in 2010 compared to 8.4 percent in 2009. We expect WMECO’s distribution segment regulatory ROE will be approximately 9 percent in 2011. WMECO is subject to SQ metrics that measure safety, reliability and customer service, and WMECO pays any charges incurred for failure to meet such metrics to customers. WMECO will not be required to pay an assessment charge for its 2010 performance results as WMECO performed at target for all of its SQ metrics in 2010. On October 16, 2009, WMECO filed its proposal for a dynamic pricing smart meter pilot program with the DPU. However, the Company does not expect it will conduct a pilot prior to 2012. Sources and Availability of Electric Power Supply As noted above, WMECO does not own any generation assets (other than its recently constructed solar generation) and purchases its energy requirements from a variety of competitive sources through periodic RFPs. For basic service power supply, WMECO issues RFPs periodically, consistent with DPU regulations. REGULATED GAS DISTRIBUTION – YANKEE GAS SERVICES COMPANY Yankee Gas operates the largest natural gas distribution system in Connecticut as measured by number of customers (approximately 206,000 customers in 71 cities and towns), and size of service territory (2,187 square miles). Total throughput (sales and transportation) in both 2010 and 2009 was approximately 52.5 Bcf. Yankee Gas provides firm natural gas sales service to retail customers who require a continuous natural gas supply throughout the year, such as residential customers who rely on gas for their heating, hot water and cooking needs, and commercial and industrial customers who choose to purchase natural gas from Yankee Gas. Retail natural gas service in Connecticut is partially unbundled: residential customers in Yankee Gas’ service territory buy gas supply and delivery only from Yankee Gas while commercial and industrial customers have choice in their gas suppliers. Yankee Gas offers firm transportation service to its commercial and industrial customers who purchase gas from sources other than Yankee Gas as well as interruptible transportation and interruptible gas sales service to those commercial and industrial customers that have the capability to switch from natural gas to an alternative fuel on short notice. Yankee Gas can interrupt service to these customers during peak demand periods or at any other time to maintain distribution system integrity. Yankee Gas also owns a 1.2 Bcf LNG facility in Waterbury, Connecticut, which enables the company to buy natural gas in periods of low demand, store it and use it during peak demand periods when prices are typically higher. The following table shows the sources of 2010 gas operating revenues based on categories of customers:
Sources ofRevenue
% of Total Revenues
Residential 51% Commercial 30% Industrial 16% Other 3% Total 100%
A summary of firm natural gas sales in million cubic feet for Yankee Gas for 2010 and 2009 and the percentage changes in 2010 as compared to 2009 on an actual and weather normalized basis (using a 30-year average) is as follows:
Firm Natural Gas Sales (Mcf)
2010 2009
Percent Decrease/Increase
Weather Normalized Percentage (Decrease)
Residential 13,403 13,562 (1.2)% 4.9% Commercial 14,982 14,063 6.6% 12.1% Industrial 14,866 14,825 0.3% 1.7% Total 43,251 42,450 1.9% 6.2%
8
Yankee Gas’ firm natural gas sales are subject to many of the same influences as our retail electric sales, but they have recently benefitted from a favorable price for natural gas relative to competing fuels resulting in commercial and industrial customers switching from interruptible service to firm service, and the addition of gas-fired distributed generation in Yankee Gas’ service territory. Actual firm natural gas sales in 2010 were higher than 2009 despite the milder weather during the first quarter 2010 heating season. Firm natural gas sales benefitted from these trends and from a large commercial customer who began to take service from Yankee Gas mid-way through the third quarter of 2009 and continued to take service throughout all of 2010. In April 2010, Yankee Gas commenced construction of its WWL project, a 16-mile gas pipeline between Waterbury and Wallingford, Connecticut coupled with the increase of vaporization output of its LNG plant. The project is expected to cost approximately $57.6 million. In 2010, approximately $26.6 million was spent on construction of the WWL project, which included construction of a segment of pipeline connecting the Cheshire and Wallingford distribution systems. The remainder of the pipeline construction and the expansion of the vaporization capacity of the LNG facility are expected to be completed in the fourth quarter of 2011 Rates Yankee Gas is subject to regulation by the DPUC, which has jurisdiction over, among other things, rates, accounting procedures, certain dispositions of property and plant, mergers and consolidations, issuances of long-term securities, standards of service, management efficiency and construction and operation of distribution, production and storage facilities. Distribution Rates: On January 7, 2011, Yankee Gas filed an application with the DPUC to raise natural gas distribution rates by $32.8 million, or 7.3 percent, to be effective July 1, 2011, and by an additional $13 million, or 2.8 percent, to be effective July 1, 2012. Among other items, Yankee Gas requested to maintain its current authorized ROE of 10.1 percent, that $57.6 million of costs associated with the WWL project be placed into rates, and that a substantial increase in capital funding to replace bare steel and cast iron pipe on Yankee Gas' system. A final decision is expected in June 2011. Yankee Gas’ regulatory ROE was 8.6 percent in 2010 compared to 6.6 percent in 2009. We expect Yankee Gas’ distribution segment regulatory ROE to be approximately 9 percent in 2011. Sources and Availability of Natural Gas Supply The DPUC requires that Yankee Gas meet the needs of its firm customers under all weather conditions. Specifically, Yankee Gas must structure its portfolio to meet firm customer needs under a design day scenario (defined as the coldest day in 30 years) and under a design year scenario (defined as the average of the four coldest years in the last 30 years). Yankee Gas’ LNG facility enables Yankee Gas to buy natural gas in periods of low demand, store it and use it during peak demand periods when prices are typically higher. Yankee Gas’ on-system stored LNG and underground storage supplies help to meet consumption needs during the coldest days of winter. Yankee Gas obtains its interstate capacity from the three interstate pipelines that currently directly serve Connecticut: the Algonquin, Tennessee and Iroquois Pipelines. Yankee Gas has long-term firm contracts for capacity on TransCanada Pipelines Limited pipeline, Vector Pipeline, L.P., Tennessee Gas Pipeline, Iroquois Gas Transmission Pipeline, Algonquin Pipeline, Union Gas Limited, Dominion Transmission, Inc., National Fuel Gas Supply Corporation, Transcontinental Gas Pipeline Company, and Texas Eastern Transmission, L.P. pipelines. Yankee Gas considers such transportation arrangements adequate for its needs. ELECTRIC TRANSMISSION General CL&P, PSNH and WMECO and most other New England utilities, generation owners and marketers are parties to a series of agreements that provide for coordinated planning and operation of the region's generation and transmission facilities and the rules by which they participate in the wholesale markets and acquire transmission services. Under these arrangements, ISO-NE, a non-profit corporation whose board of directors and staff are independent of all market participants, has served since 2005 as the RTO of the New England transmission system. ISO-NE works to ensure the reliability of the system, administers, subject to FERC approval, the independent system operator tariff, oversees the efficient and competitive functioning of the regional wholesale power market and determines which costs of all regional major transmission facilities are shared by consumers throughout New England. Wholesale Transmission Rates Wholesale transmission revenues are recovered through formula rates that are approved by the FERC. Our transmission revenues are recovered from New England customers through ISO-NE charges which recover costs of transmission and other transmission-related services provided by all regional transmission owners, with a portion of those revenues collected from the distribution segments of CL&P, PSNH and WMECO. FERC ROE Decision Pursuant to a series of orders involving the ROE for regionally planned New England transmission projects, the FERC set the base ROE at 11.14 percent and approved incentives that increased the ROE to 12.64 percent for those projects that were in-service by the end of 2008. In addition, certain projects were granted additional ROE incentives by FERC under its transmission incentive policy. As a result, CL&P earns between 12.64 percent and 13.1 percent on its major transmission projects. All appeals of FERC's orders on the ROE for New England transmission owners have been denied.

9
On November 17, 2008, the FERC issued an order granting certain incentives and rate amendments to National Grid and us for certain components of the proposed NEEWS project, which is described below. The approved incentives include (1) an ROE of 12.89 percent; (2) inclusion of 100 percent CWIP costs in rate base; and (3) full recovery of prudently incurred costs if any portion of NEEWS is abandoned for reasons beyond our control. Several parties have sought rehearing of this FERC order on which FERC has not yet acted. Transmission Projects NEEWS CL&P and WMECO are continuing to develop and build the NEEWS project, which is comprised of GSRP, the Interstate Reliability Project and the Central Connecticut Reliability Project, and is estimated to cost $1.52 billion in the aggregate (approximately $1.45 billion reflecting the impact of UI’s potential investment of up to approximately $69 million as discussed below). CL&P and WMECO commenced substation construction on GSRP in December 2010 and expect to begin overhead line construction in the first half of 2011. We expect GSRP to be placed in service in late 2013 at a cost of approximately $795 million. CL&P is designing and building the Interstate Reliability Project in coordination with National Grid USA, whose segment of this phase will interconnect with CL&P’s at the Connecticut-Rhode Island border. In August 2010, ISO-NE reaffirmed the need for the Interstate Reliability Project. We expect CL&P's share of the costs of this project to be $301 million and that the project will be placed in service in late 2015. The timing of the Central Connecticut Reliability Project is expected to be twelve months behind the Interstate Reliability Project and cost approximately $338 million. ISO-NE continues to assess the need date for the Central Connecticut Reliability Project and we expect that ISO-NE will conclude its evaluation by mid-2011. Included as part of NEEWS are $84 million of expenditures for associated reliability related projects, all of which have received siting approval and most are under construction. The in-service dates for these projects range from later this year through 2013. Northern Pass Transmission Line Project NPT is a limited liability company jointly formed by NU and NSTAR to construct, own and operate the Northern Pass transmission line, a new HVDC transmission line from the border of Canada and the United States to Franklin, New Hampshire that will interconnect at the border with a new HVDC transmission line being developed by HQ TransEnergie, the transmission subsidiary of HQ. NUTV, a subsidiary of NU, holds a 75 percent interest in NPT, with NSTAR Transmission Ventures, Inc., a subsidiary of NSTAR, holding the remaining 25 percent. Consistent with FERC's February 11, 2011 order accepting the TSA between NPT and Hydro Renewable Energy that was filed December 15, 2011, NPT will charge Hydro Renewable Energy cost-based rates for firm transmission service over the Northern Pass line for a 40-year term. The projected cost-of-service calculation includes an ROE of 12.56 percent through the construction phase of the project. Upon commercial operation, the ROE will be equal to the ISO-NE regional rates base ROE (currently 11.14 percent) plus 1.42 percent based on a deemed capital structure for NPT of 50 percent debt and 50 percent equity. In October 2010, NPT filed the Northern Pass project design with ISO-NE for technical approval and filed a presidential permit application with the DOE. The DOE application seeks permission for NPT to construct and maintain facilities that cross the U.S. border and connect to HQ TransEnergie's facilities in Canada. Assuming timely regulatory review and siting approvals, NPT expects to commence construction of the Northern Pass in 2013, with power flowing across the line in late 2015. We currently estimate that our 75 percent share of the costs to build the Northern Pass transmission project will be approximately $830 million out of total expected costs of approximately $1.1 billion (including capitalized AFUDC). Other Transmission Transactions In July 2010, CL&P and UI entered into an agreement under which UI would acquire certain transmission assets within CL&P's portion of each of the NEEWS segments. Under the terms of the agreement, which has received approval from the FERC and the DPUC, UI will have the option to invest up to $69 million or an amount equal to 8.4 percent of CL&P's costs for the assets, which are expected to aggregate approximately $828 million. On December 17, 2010, CL&P and CTMEEC, a non-profit municipal joint action transmission entity formed by several Connecticut municipal electric companies, entered into an agreement, subject to DPUC approval, under which CTMEEC would acquire a segment of CL&P’s high voltage transmission lines in the town of Wallingford, Connecticut. The transaction was approved by FERC on January 31, 2011. The purchase price will be based on the net book value of the assets at the time of the closing of the sale in May 2011, projected to be approximately $42.3 million. CL&P will continue to operate and maintain the lines for CTMEEC.

10
Transmission Rate Base Under our FERC-approved tariff, transmission projects generally enter rate base once they are placed in commercial operation. However, 100 percent of the NEEWS projects will enter rate base during their construction period. At the end of 2010, our transmission rate base was approximately $2.8 billion, including approximately $2.1 billion at CL&P, $341 million at PSNH and $269 million at WMECO. We forecast that our total transmission rate base will grow to approximately $4.8 billion by the end of 2015, including approximately $830 million at NPT. CONSTRUCTION AND CAPITAL IMPROVEMENT PROGRAM The principal focus of our construction and capital improvement program is maintaining, upgrading and expanding our existing electric generation, transmission and distribution systems and our natural gas distribution system. Our consolidated capital expenditures in 2010 totaled approximately $1 billion, almost all of which ($967 million) was expended by the Regulated companies. The capital expenditures of these companies in 2011 are estimated to total approximately $1.2 billion, $477 million by CL&P, $284 million by PSNH, $287 million by WMECO and $113 million by Yankee Gas. This capital budget includes anticipated costs for all committed capital projects (i.e., generation, transmission, distribution, environmental compliance and others) and those we expect to become committed projects in 2011. In 2010, CL&P’s transmission capital expenditures totaled approximately $107 million, and its distribution capital expenditures totaled approximately $305 million. For 2011, CL&P projects transmission capital expenditures of approximately $137 million and distribution capital expenditures of approximately $337 million. During the period 2011 through 2015, CL&P plans to invest approximately $1 billion in transmission projects, the majority of which will be for NEEWS and $1.9 billon on distribution projects. If all of the distribution and transmission projects are built as proposed, CL&P’s rate base for electric transmission is projected to increase from approximately $2.1 billion at the end of 2010 to approximately $2.6 billion by the end of 2015, and its rate base for distribution assets is projected to increase from approximately $2.3 billion to approximately $3.3 billion over the same period. In 2010, PSNH's transmission capital expenditures totaled approximately $49 million, its distribution capital expenditures totaled approximately $84 million and its generation capital expenditures totaled $177 million. For 2011, PSNH projects transmission capital expenditures of approximately $59 million, distribution capital expenditures of approximately $113 million and generation capital expenditures of approximately $112 million. The bulk of the generation capital expenditures is for the Clean Air Project. During the period 2011 through 2015, PSNH plans to spend approximately $293 million on transmission projects, approximately $621 million on distribution projects, and $274 million on generation projects. If all of the distribution, generation and transmission projects are built as proposed, PSNH’s rate base for electric transmission is projected to increase from approximately $341 million at the end of 2010 to approximately $540 million by the end of 2015, and its rate base for distribution and generation assets is projected to increase from approximately $1.2 billion to approximately $1.9 billion over the same period. In 2010, WMECO's transmission capital expenditures totaled approximately $95 million, its distribution capital expenditures totaled approximately $33.1 million and solar generation expenditures were $10 million. In 2011, WMECO projects transmission capital expenditures of approximately $229 million, distribution capital expenditures of approximately $36 million and $22 million on solar generation. During the period 2011 through 2015, WMECO plans to spend approximately $732 million on transmission projects, with the bulk of that amount to be spent on GSRP, approximately $194 million on distribution projects and $46 million on solar generation. If all of the generation, distribution and transmission projects are built as proposed, WMECO’s rate base for electric transmission is projected to increase from approximately $269 million at the end of 2010 to approximately $803 million by the end of 2015 and its rate base for distribution and generation assets is projected to increase from approximately $423 million to approximately $488 million over the same period. In 2010, Yankee Gas capital expenditures totaled approximately $95 million. For 2011, Yankee Gas projects total capital expenditures of approximately $113 million, approximately $30 million of which is expected to be related to the WWL project, $37 million related to basic business activities such as relocation of conflicting gas facilities and the purchase of meters, tools and information technology; $30 million related to reliability improvements; and $16 million for load growth and new business requests. During the period 2011 through 2015, Yankee Gas plans on making approximately $587 million of capital expenditures, including approximately $30 million on the WWL project. Future capital spending will likely be affected by price differences between the cost of natural gas with respect to home heating oil, natural gas supply, new home construction, road reconstruction, regulatory mandates and business requirements. Excluding non-recurring major projects, NU expects that approximately 28 percent of Yankee Gas’ capital expenditures over the 2011-2015 period to be related to basic business activities, approximately 28 percent related to load growth and new business, and approximately 39 percent related to reliability initiatives, with the balance related to the WWL project. If all of Yankee Gas projects are built as proposed, Yankee Gas’ investment in its regulated assets is projected to increase from approximately $682 million at the end of 2010 to approximately $969 million by the end of 2015. FINANCING NU subsidiaries issued a total of $145 million in long-term debt in 2010. On March 8, 2010, WMECO issued $95 million of senior unsecured notes due March 1, 2020 carrying a coupon rate of 5.1 percent and on April 22, 2010, Yankee Gas issued $50 million of first mortgage bonds through a private placement with a maturity date of April 1, 2020 carrying a coupon rate of 4.87 percent. In addition, on April 1, 2010, CL&P completed the remarketing of $62 million of tax-exempt secured PCRBs. The PCRBs carry a coupon rate of 1.4 percent until April 1, 2011, at which time CL&P expects to remarket the bonds.
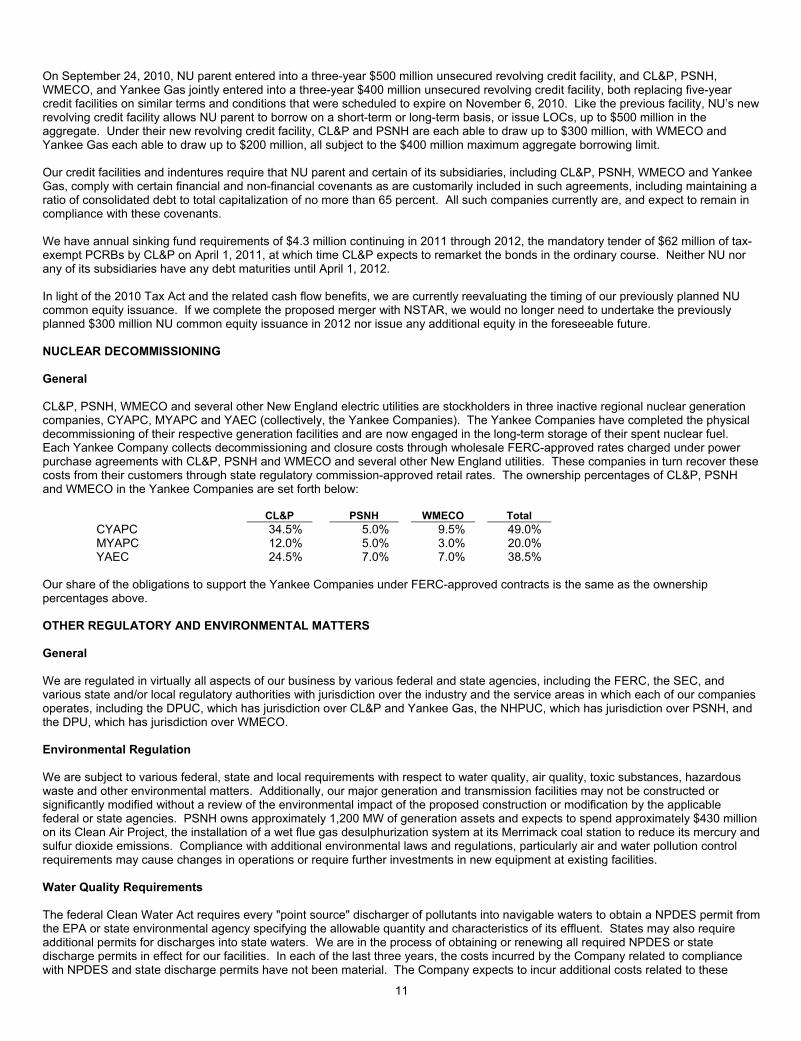
11
On September 24, 2010, NU parent entered into a three-year $500 million unsecured revolving credit facility, and CL&P, PSNH, WMECO, and Yankee Gas jointly entered into a three-year $400 million unsecured revolving credit facility, both replacing five-year credit facilities on similar terms and conditions that were scheduled to expire on November 6, 2010. Like the previous facility, NU’s new revolving credit facility allows NU parent to borrow on a short-term or long-term basis, or issue LOCs, up to $500 million in the aggregate. Under their new revolving credit facility, CL&P and PSNH are each able to draw up to $300 million, with WMECO and Yankee Gas each able to draw up to $200 million, all subject to the $400 million maximum aggregate borrowing limit. Our credit facilities and indentures require that NU parent and certain of its subsidiaries, including CL&P, PSNH, WMECO and Yankee Gas, comply with certain financial and non-financial covenants as are customarily included in such agreements, including maintaining a ratio of consolidated debt to total capitalization of no more than 65 percent. All such companies currently are, and expect to remain in compliance with these covenants. We have annual sinking fund requirements of $4.3 million continuing in 2011 through 2012, the mandatory tender of $62 million of tax-exempt PCRBs by CL&P on April 1, 2011, at which time CL&P expects to remarket the bonds in the ordinary course. Neither NU nor any of its subsidiaries have any debt maturities until April 1, 2012. In light of the 2010 Tax Act and the related cash flow benefits, we are currently reevaluating the timing of our previously planned NU common equity issuance. If we complete the proposed merger with NSTAR, we would no longer need to undertake the previously planned $300 million NU common equity issuance in 2012 nor issue any additional equity in the foreseeable future. NUCLEAR DECOMMISSIONING General CL&P, PSNH, WMECO and several other New England electric utilities are stockholders in three inactive regional nuclear generation companies, CYAPC, MYAPC and YAEC (collectively, the Yankee Companies). The Yankee Companies have completed the physical decommissioning of their respective generation facilities and are now engaged in the long-term storage of their spent nuclear fuel. Each Yankee Company collects decommissioning and closure costs through wholesale FERC-approved rates charged under power purchase agreements with CL&P, PSNH and WMECO and several other New England utilities. These companies in turn recover these costs from their customers through state regulatory commission-approved retail rates. The ownership percentages of CL&P, PSNH and WMECO in the Yankee Companies are set forth below:
CL&P PSNH WMECO Total CYAPC 34.5% 5.0% 9.5% 49.0% MYAPC 12.0% 5.0% 3.0% 20.0% YAEC 24.5% 7.0% 7.0% 38.5%
Our share of the obligations to support the Yankee Companies under FERC-approved contracts is the same as the ownership percentages above. OTHER REGULATORY AND ENVIRONMENTAL MATTERS General We are regulated in virtually all aspects of our business by various federal and state agencies, including the FERC, the SEC, and various state and/or local regulatory authorities with jurisdiction over the industry and the service areas in which each of our companies operates, including the DPUC, which has jurisdiction over CL&P and Yankee Gas, the NHPUC, which has jurisdiction over PSNH, and the DPU, which has jurisdiction over WMECO. Environmental Regulation We are subject to various federal, state and local requirements with respect to water quality, air quality, toxic substances, hazardous waste and other environmental matters. Additionally, our major generation and transmission facilities may not be constructed or significantly modified without a review of the environmental impact of the proposed construction or modification by the applicable federal or state agencies. PSNH owns approximately 1,200 MW of generation assets and expects to spend approximately $430 million on its Clean Air Project, the installation of a wet flue gas desulphurization system at its Merrimack coal station to reduce its mercury and sulfur dioxide emissions. Compliance with additional environmental laws and regulations, particularly air and water pollution control requirements may cause changes in operations or require further investments in new equipment at existing facilities. Water Quality Requirements The federal Clean Water Act requires every "point source" discharger of pollutants into navigable waters to obtain a NPDES permit from the EPA or state environmental agency specifying the allowable quantity and characteristics of its effluent. States may also require additional permits for discharges into state waters. We are in the process of obtaining or renewing all required NPDES or state discharge permits in effect for our facilities. In each of the last three years, the costs incurred by the Company related to compliance with NPDES and state discharge permits have not been material. The Company expects to incur additional costs related to these

12
permits in the future; however, due to uncertainty regarding the imposition of new or additional requirements, the Company is unable to accurately estimate such costs. Air Quality Requirements The CAAA, as well as New Hampshire law, impose stringent requirements on emissions of SO2 and NOX for the purpose of controlling acid rain and ground level ozone. In addition, the CAAA address the control of toxic air pollutants. Installation of continuous emissions monitors and expanded permitting provisions also are included. In New Hampshire, the Multiple Pollutant Reduction Program capped NOX, SO2 and CO2 emissions beginning in 2007. In addition, a 2006 New Hampshire law requires PSNH to install a wet flue gas desulphurization system, known as "scrubber" technology, to reduce mercury emissions of its coal fired plants by at least 80 percent (with the co-benefit of reductions in SO2 emissions as well). The Clean Air Project addresses this requirement. PSNH began site work for this project in November 2008 and is scheduled to complete it by mid-2012. In addition, Connecticut, New Hampshire and Massachusetts are each members of the RGGI, a cooperative effort by ten northeastern and mid-Atlantic states, to develop a regional program for stabilizing and reducing CO2 emissions from fossil fuel-fired electric generating plants. Because CO2 allowances issued by any participating state will be usable across all ten RGGI state programs, the individual state CO2 trading programs, in the aggregate, will form one regional compliance market for CO2 emissions. A regulated power plant must hold CO2 allowances equal to its emissions to demonstrate compliance at the end of a three-year compliance period that began in 2009. Because neither CL&P nor WMECO currently own any generating assets (other than the solar facilities owned by WMECO, which do not emit CO2), neither is required to acquire CO2 allowances; however, the CO2 allowance costs borne by generators that provide energy supply to CL&P and WMECO will likely be included in wholesale rates charged to them, which costs are then recoverable from customers. PSNH anticipates that its generating units will emit between four million and five million tons of CO2 per year after taking into effect the operation of PSNH’s Northern Wood Power Project. Under the RGGI formula, this Project decreased PSNH’s responsibility for reducing fossil-fired CO2 emissions by approximately 425,000 tons per year, or almost ten percent. New Hampshire legislation provides up to 2.5 million banked CO2 allowances per year for PSNH’s fossil fueled generating plants during the 2009 through 2011 compliance period. These banked CO2 allowances will initially comprise approximately one-half of the yearly CO2 allowances required for PSNH’s generating plants to comply with RGGI. Such banked allowances will decrease over time. PSNH expects to satisfy its remaining RGGI requirements by purchasing CO2 allowances at auction or in the secondary market. The cost of complying with RGGI requirements is recoverable from PSNH customers. Each of the states in which we do business also has RPS requirements, which generally require fixed percentages of energy supply to come from renewable energy sources such as solar, hydropower, landfill gas, fuel cells and other similar sources. New Hampshire’s RPS provision requires increasing percentages of the electricity sold to retail customers to have direct ties to renewable sources, beginning in 2008 at four percent and ultimately reaching 23.8 percent by 2025. In 2010, the total RPS obligation was 7.5 percent of total generation supplied to customers. Energy suppliers, like PSNH, purchase RECs from producers that generate energy from a qualifying resource and use them to satisfy the RPS requirements. PSNH also owns renewable sources and uses both internally generated RECs and purchased RECs to meet its RPS obligations. To the extent that PSNH is unable to purchase sufficient RECs, it makes up the difference between the RECs purchased and its total obligation by making an alternative compliance payment for each REC requirement for which PSNH is deficient. The costs of both the RECs and alternative compliance payments do not impact earnings, as these costs are recovered by PSNH through its ES rates charged to customers. Connecticut's RPS statute requires electricity suppliers to meet renewable energy standards, beginning with a four percent RPS in 2004. This percentage increases each year. For 2010, the requirement was 14 percent with goals of 19.5 percent by 2015 and 27 percent by 2020. CL&P is permitted to pass any costs incurred in complying with RPS on to customers through rates. Massachusetts’ RPS program required electricity suppliers to meet a one percent renewable energy standard in 2003 and has a goal of 15 percent by 2015. For 2010, the requirement was five percent. WMECO is permitted to pass any costs incurred in complying with RPS on to customers through rates. In addition, many states and environmental groups have challenged certain of the federal laws and regulations relating to air emissions as not being sufficiently strict. As a result, it is possible that state and federal regulations could be developed that will impose more stringent limitations on emissions than are currently in effect. Hazardous Materials Regulations Prior to the last quarter of the 20th century when environmental best practices and laws were implemented, utility companies often disposed of residues from operations by depositing or burying them on-site or disposing of them at off-site landfills or other facilities. Typical materials disposed of include coal gasification byproducts, fuel oils, ash, and other materials that might contain polychlorinated biphenyls or that otherwise might be hazardous. It has since been determined that deposited or buried wastes, under certain circumstances, could cause groundwater contamination or create other environmental risks. We have recorded a liability for what we
13
believe is, based upon currently available information, our estimated environmental investigation and/or remediation costs for waste disposal sites for which we expect to bear legal liability. We continue to evaluate the environmental impact of our former disposal practices. Under federal and state law, government agencies and private parties can attempt to impose liability on us for these practices. At December 31, 2010, the liability recorded by us for our reasonably estimable and probable environmental remediation costs for known sites needing investigation and/or remediation, exclusive of recoveries from insurance or from third parties, was approximately $37.1 million, representing 58 sites. These costs could be significantly higher if remediation becomes necessary or when additional information as to the extent of contamination becomes available. The most significant liabilities currently relate to future clean up costs at former MGP facilities. These facilities were owned and operated by our predecessor companies from the mid-1800's to mid-1900's. By-products from the manufacture of gas using coal resulted in fuel oils, hydrocarbons, coal tar, purifier wastes, metals and other waste products that may pose risks to human health and the environment. We, through our subsidiaries, currently have partial or full ownership responsibilities at 28 former MGP sites. HWP, a wholly-owned subsidiary of NU, is continuing to evaluate additional potential remediation requirements at a river site in Massachusetts containing tar deposits associated with an MGP site that HWP sold to HG&E, a municipal electric utility, in 1902. HWP is at least partially responsible for this site and has already conducted substantial investigative and remediation activities. HWP's share of the remediation costs related to this site is not recoverable from customers. Electric and Magnetic Fields For more than twenty years, published reports have discussed the possibility of adverse health effects from EMF associated with electric transmission and distribution facilities and appliances and wiring in buildings and homes. Although weak health risk associations reported in some epidemiology studies remain unexplained, most researchers, as well as numerous scientific review panels, considering all significant EMF epidemiology and laboratory studies, have concluded that the available body of scientific information does not support the conclusion that EMF affects human health. We have closely monitored research and government policy developments for many years and will continue to do so. In accordance with recommendations of various regulatory bodies and public health organizations, we reduce EMF associated with new transmission lines by the use of designs that can be implemented without additional cost or at a modest cost. We do not believe that other capital expenditures are appropriate to minimize unsubstantiated risks. Global Climate Change and Greenhouse Gas Emission Issues Global climate change and greenhouse gas emission issues have received an increased focus from state governments and the federal government, particularly in recent years. The EPA has initiated a rulemaking addressing greenhouse gas emissions and, on December 7, 2009, issued a finding that concluded that greenhouse gas emissions are "air pollution" and endanger public health and welfare and should be regulated. The largest source of greenhouse gas emissions in the U.S. is the electricity generating sector. The EPA has mandated GHG emission reporting beginning in 2012 for 2011 emissions for certain aspects of our business including stationary combustion, volume of gas supplied to large customers and fugitive emissions of SF-6 gas and methane. We are continually evaluating the risks presented by climate change concerns and issues. Such concerns could potentially lead to additional rules and regulations that impact how we operate our business, both in terms of the generating facilities we own and operate as well as general utility operations. (See "Air Quality Requirements" in this section for information concerning RGGI) These could include federal "cap and trade" laws, or regulations requiring additional capital expenditures at our generating facilities. In addition, such rules or regulations could potentially impact the prices we pay for goods and services provided by companies directly affected by such rules or regulations. We would expect that any costs of these rules and regulations would be recovered from customers, but such costs could impact energy use by our customers. Global climate change could potentially impact weather patterns such as increasing the frequency and severity of storms or altering temperatures. These changes could affect our facilities and infrastructure and could also impact energy usage by our customers. FERC Hydroelectric Project Licensing Federal Power Act licenses may be issued for hydroelectric projects for terms of 30 to 50 years as determined by the FERC. Upon the expiration of an existing license, (i) the FERC may issue a new license to the existing licensee, or (ii) the United States may take over the project or (iii) the FERC may issue a new license to a new licensee, upon payment to the existing licensee of the lesser of the fair value or the net investment in the project, plus severance damages, less certain amounts earned by the licensee in excess of a reasonable rate of return. PSNH owns nine hydroelectric generating stations with a current claimed capability representing winter rates of approximately 71 MW, eight of which are licensed by the FERC under long-term licenses that expire on varying dates from 2017 through 2047. PSNH and its hydroelectric projects are subject to conditions set forth in such licenses, the Federal Power Act and related FERC regulations, including provisions related to the condemnation of a project upon payment of just compensation, amortization of project investment from excess project earnings, possible takeover of a project after expiration of its license upon payment of net investment and severance damages and other matters.

14
Licensed operating hydroelectric projects are not generally subject to decommissioning during the license term in the absence of a specific license provision that expressly permits the FERC to order decommissioning during the license term. However, the FERC has taken the position that under appropriate circumstances it may order decommissioning of hydroelectric projects at relicensing or may require the establishment of decommissioning trust funds as a condition of relicensing. The FERC may also require project decommissioning during a license term if a hydroelectric project is abandoned, the project license is surrendered or the license is revoked. PSNH is not presently encountering any of these challenges. EMPLOYEES As of December 31, 2010, we employed a total of 6,182 employees, excluding temporary employees, of which 1,847 were employed by CL&P, 1,240 by PSNH, 354 by WMECO, 429 by Yankee Gas and 2,307 were employed by NUSCO. Approximately 2,212 employees of CL&P, PSNH, WMECO, NUSCO and Yankee Gas are members of the International Brotherhood of Electrical Workers and The United Steelworkers and are covered by 11 union agreements. INTERNET INFORMATION Our website address is www.nu.com. We make available through our website a link to the SEC's EDGAR website (http://www.sec.gov/edgar/searchedgar/companysearch.html), at which site NU's, CL&P's, WMECO's and PSNH's Annual Reports on Form 10-K, Quarterly Reports on Form 10-Q, Current Reports on Form 8-K and any amendments to those reports may be reviewed. Printed copies of these reports may be obtained free of charge by writing to our Investor Relations Department at Northeast Utilities, 56 Prospect Street, Hartford, CT 06103. Item 1A. Risk Factors In addition to the matters set forth under "Safe Harbor Statement Under the Private Securities Litigation Reform Act of 1995" included directly prior to Item 1, Business, above, we are subject to a variety of significant risks. Our susceptibility to certain risks, including those discussed in detail below, could exacerbate other risks. These risk factors should be considered carefully in evaluating our risk profile. The actions of regulators can significantly affect our earnings, liquidity and business activities. The rates that our Regulated companies charge their respective retail and wholesale customers are determined by their state utility commissions and by FERC. These commissions also regulate the companies’ accounting, operations, the issuance of certain securities and certain other matters. FERC also regulates their transmission of electric energy, the sale of electric energy at wholesale, accounting, issuance of certain securities and certain other matters. The commissions’ policies and regulatory actions could have a material impact on the Regulated companies’ financial position, results of operations and cash flows. Our transmission, distribution and generation systems may not operate as expected, and could require unplanned expenditures, which could adversely affect our financial position, results of operations and cash flows. Our ability to properly operate of our transmission, distribution and generation systems is critical to the financial performance of our business. Our transmission, distribution and generation businesses face several operational risks, including the breakdown or failure of or damage to equipment or processes (especially due to age); labor disputes; disruptions in the delivery of electricity, including impacts on us or our customers; increased capital expenditure requirements, including those due to environmental regulation; information security risk, such as a breach of our systems on which sensitive utility customer data and account information are stored; catastrophic events such as fires, explosions, or other similar occurrences; and other unanticipated operations and maintenance expenses and liabilities. The failure of our transmission, distributions and generation systems to operate as planned may result in increased capital investments, reduced earnings or unplanned increases in operation and maintenance costs. At PSNH, outages at generating stations may be deemed imprudent by state regulators resulting in disallowance of replacement power costs. Such costs that are not recoverable from our customers would have an adverse effect on our financial position, results of operations and cash flows. Limits on our access to and increases in the cost of capital may adversely impact our ability to execute our business plan. We use short-term debt and the long-term capital markets as a significant source of liquidity and funding for capital requirements not obtained from our operating cash flow. If access to these sources of liquidity becomes constrained, our ability to implement our business strategy could be adversely affected. In addition, higher interest rates would increase our cost of borrowing, which could adversely impact our results of operations. A downgrade of our credit ratings or events beyond our control, such as a disruption in global capital and credit markets, could increase our cost of borrowing and cost of capital or restrict our ability to access the capital markets and negatively affect our ability to maintain and to expand our businesses. Our counterparties may not meet their obligations to us. We are exposed to the risk that counterparties to various arrangements who owe us money, or have contracted to supply us with energy, coal, or other commodities or services, or who work with us as strategic partners, including on significant capital projects, will not be able to perform their obligations or, with respect to our credit facilities, fail to honor their commitments. Should any of these counterparties fail to perform their obligations, we might be forced to replace the underlying commitment at higher market prices and/or

15
have to delay the completion of a capital project. Should any lenders under our credit facilities fail to perform, the level of borrowing capacity under those arrangements could decrease. In any such events, our financial position, results of operations, or cash flows could be adversely affected. Changes in regulatory or legislative policy and/or regulatory decisions, difficulties in obtaining siting, design or other approvals, global demand for critical resources, environmental or other concerns, or construction of new generation may delay completion of or displace our planned transmission projects or adversely affect our ability to recover our investments or result in lower than expected rates of return. Our transmission construction plans could be affected by new legislation, regulations or judicial or regulatory interpretations of applicable law or regulations or regulatory decisions, delays in obtaining approvals or difficulty in obtaining critical resources required for construction. Any of such events could cause delays in our construction schedule adversely affecting our ability to achieve forecasted earnings. The regulatory approval process for our transmission projects requires extensive permitting, design and technical activities. Various factors could result in increased costs and delay construction schedules. These include environmental and community concerns and design and siting issues. Recoverability of all such investments in rates may be subject to prudence review at the FERC. While we believe that all such costs have been and will be prudently incurred, we cannot predict the outcome of future reviews should they occur. In addition, our transmission projects may be delayed or displaced by new generation facilities, which could result in reduced transmission capital investments, reduced earnings, and limited future growth prospects. Many of our transmission projects are expected to help alleviate identified reliability issues and reduce customers' costs. However, if, due to further regulatory or other delays, the in-service date for one or more of these projects is delayed, there may be increased risk of failures in the electricity transmission system and supply interruptions or blackouts, which could have an adverse effect on our earnings. The FERC has followed a policy of providing incentives designed to encourage the construction of new transmission facilities, including higher returns on equity and allowing facilities under construction to be placed in rate base. Our projected earnings and growth could be adversely affected were FERC to reduce these incentives in the future below the level presently anticipated. Increases in electric and gas prices and/or a weak economy, can lead to changes in legislative and regulatory policy promoting energy efficiency, conservation, and self-generation and/or a reduction in our customers’ ability to pay their bills, which may adversely impact our business. Energy consumption is significantly impacted by the general level of economic activity and cost of energy supply. Economic downturns or periods of high energy supply costs typically can lead to the development of legislative and regulatory policy designed to promote reductions in energy consumption and increased energy efficiency and self-generation by customers. This focus on conservation, energy efficiency and self-generation may result in a decline in electricity and gas sales in our service territories. If any such declines were to occur without corresponding adjustments in rates, then our revenues would be reduced and our future growth prospects would be limited. In addition, a period of prolonged economic weakness could impact customers’ ability to pay bills in a timely manner and increase customer bankruptcies, which may lead to increased bad debt expenses or other adverse effects on our financial position, results of operations or cash flows. Connecticut, New Hampshire and Massachusetts have each investigated revenue decoupling as a mechanism to align the interests of customers and utilities relative to conservation. In Connecticut, the DPUC authorized decoupling through a rate design that is intended to recover greater distribution revenue through fixed charges, and proportionately less distribution revenue through usage-based charges. In New Hampshire, the NHPUC conducted a decoupling docket and determined that utilities were free to propose decoupling in the context of a rate case and demonstrate the effect decoupling would have on its risk profile and ROE. PSNH has not yet commenced such a proceeding. In Massachusetts, the DPU has required WMECO to adopt full decoupling in its January 31, 2011 rate decision. At this time it is uncertain what impact these decoupling mechanisms will have on our companies. As a way to promote self-generation and reduce energy costs, Connecticut, Massachusetts, and New Hampshire have taken a greater interest in allowing customers to receive credit for generation produced at a customer-owned generating facility that exceeds their energy needs. In Massachusetts, in accordance with the Green Communities Act, the DPU adopted rules and regulations concerning net metering that will have this effect. Such rules provide a cost recovery mechanism for affected utilities to recover lost revenues. The Massachusetts DPU is expected to hold further proceedings to address net metering in early 2011. In Connecticut, the DPUC opened a docket to review existing state statutes and determine what limitations currently exist in state law concerning net metering. In addition, any legislation in Connecticut to promote self-generation and net metering could impact CL&P’s financial position, results of operations or cash flows. In New Hampshire, new legislation dramatically changed the net metering rules in 2010. This new legislation is meant to encourage net metering from customers with small generators and also provides PSNH a cost recovery mechanism for lost distribution revenue.
16
Changes in regulatory and/or legislative policy could negatively impact regional transmission cost allocation rules. The existing FERC-approved New England transmission tariff allocates the costs of transmission facilities that provide regional benefits to all customers of participating transmission-owning utilities. As new investment in regional transmission infrastructure occurs in any one state, its cost is shared across New England in accordance with relative benefits received. This regional cost allocation is set forth in the Transmission Operating Agreement signed by all of the New England transmission owning utilities. Effective February 1, 2010, this agreement can be modified with the approval of a majority of the transmission owning utilities and FERC. In addition, other parties, such as state regulators, may seek certain changes to the regional cost allocation formula, which could have adverse effects on the rates our distribution companies charge their retail customers. FERC is also considering policies to encourage the construction of transmission for renewable generation that could have the effect of imposing costs of inter-regional investment on New England customers. Changes in regulatory or legislative policy or unfavorable outcomes in regulatory proceedings could jeopardize our full and/or timely recovery of costs incurred by our regulated distribution and generation businesses. Under state law, our Regulated companies are entitled to charge rates that are sufficient to allow them an opportunity to recover their reasonable operating and capital costs, to attract needed capital and maintain their financial integrity, while also protecting relevant public interests. Each of these companies prepares and submits periodic rate filings with their respective state regulatory commissions for review and approval. There is no assurance that these state commissions will approve the recovery of all such costs incurred by our Regulated companies, such as for construction, operation and maintenance, as well as a return on investment on their respective regulated assets. Increases in these costs, coupled with increases in fuel and energy prices could lead to consumer or regulatory resistance to the timely recovery of such costs, thereby adversely affecting our financial position, results of operations or cash flows. Additionally, state legislators may enact laws that significantly impact our Regulated companies’ revenues, including by mandating electric or gas rate relief and/or by requiring surcharges to customer bills to support state programs not related to the utilities or energy policy. Such increases could pressure overall rates to our customers and our routine requests to regulators for rate relief. In addition, CL&P and WMECO procure energy for a substantial portion of their customers’ needs via requests for proposal on an annual, semi-annual or quarterly basis. CL&P and WMECO receive approval to recover the costs of these contracts from the DPUC and DPU, respectively. While both regulatory agencies have consistently approved the solicitation processes, results and recovery of costs, management cannot predict the outcome of future solicitation efforts or the regulatory proceedings related thereto. PSNH meets most of its energy requirements through its own generation resources and fixed-price forward purchase contracts. PSNH’s remaining energy needs are met primarily through spot market purchases. Unplanned forced outages of its generating plants could increase the level of energy purchases needed by PSNH and therefore increase the market risk associated with procuring the energy to meet its requirements. PSNH recovers these costs through its ES rate, subject to a prudence review by the NHPUC. We cannot predict the outcome of future regulatory proceedings related to recovery of these costs. Migration of customers from PSNH energy service to competitive energy suppliers could increase the cost to the remaining customers of energy produced by PSNH generation assets and decrease our revenues. PSNH’s ES rates have been higher than competitive energy prices offered to some customers in recent years, primarily due to lower natural gas prices. As a result, by the end of 2010, approximately 2 percent of PSNH’s retail customers (representing approximately 32 percent of load), mostly large commercial and industrial customers, were buying their energy from competitive suppliers rather than from PSNH. The remaining retail customers are experiencing an increase in the cost of energy service supplied by PSNH by 5 percent to 7 percent due to migration of large commercial and industrial customers and the lower base in which to recover PSNH's fixed generation costs. This increase may in turn cause further migration and further increasing of PSNH energy service rates. This trend could lead to PSNH continuing to lose retail customers and increasing the burden of supporting the cost of its generation facilities on remaining customers and being unable to support the cost of its generation facilities through an ES rate. The NHPUC is examining this issue in a proceeding in which hearings ended on December 1, 2010. PSNH has suggested transferring some fixed costs of the generation facilities into a nonbypassable charge while intervening competitive suppliers have proposed taking over the purchased power portion of the load not supplied by PSNH’s generation. Others have also proposed having PSNH bid all of its generation facilities into the market while an RFP process supplies all of the power for PSNH’s energy service. The NHPUC is considering further proceedings to explore these and other issues as well as the NHPUC authority to require PSNH to divest its generation facilities. It is not known what the results of such a proceeding would be, what PSNH may realize as a result of the sale or retirement of one or more of its generation facilities, or to what extent or manner the NHPUC would provide for recovery of any investment in its generation facilities. Judicial or regulatory proceedings or changes in regulatory or legislative policy could jeopardize completion of, or full recovery of costs incurred by PSNH in constructing, the Clean Air Project. Pursuant to New Hampshire law, PSNH is building the Clean Air Project at its Merrimack Station in Bow, New Hampshire. Several parties initiated legal proceedings challenging the project. These proceedings, or new legislation, regulations or judicial or regulatory interpretations of applicable law or regulations could result in increased costs to the project. In addition, PSNH’s investment in the project after it is completed is subject to prudence review by the NHPUC at the time the project is placed in service. A material prudence disallowance could adversely affect PSNH’s financial position, results of operations or cash

17
flows. While we believe we have prudently incurred all expenditures to date, we cannot predict the outcome of any prudency reviews should they occur. Our projected earnings and growth could be adversely affected were the NHPUC to deny recovery of some or all of PSNH’s investment in the project. The loss of key personnel or the inability to hire and retain qualified employees could have an adverse effect on our business, financial condition and results of operations. Our operations depend on the continued efforts of our employees. Retaining key employees and maintaining the ability to attract new employees are important to both our operational and financial performance. We cannot guarantee that any member of our management or any key employee at the NU parent or subsidiary level will continue to serve in any capacity for any particular period of time. In addition, a significant portion of our workforce, including many workers with specialized skills maintaining and servicing the electrical infrastructure, will be eligible to retire over the next five to ten years. Such highly skilled individuals cannot be quickly replaced due to the technically complex work they perform. We have developed strategic workforce plans to identify key functions and proactively implement plans to assure a ready and qualified workforce, but cannot predict the impact of these plans on our ability to hire and retain key employees. Grid disturbances, severe weather, or acts of war or terrorism could negatively impact our business. Because our generation and transmission systems are part of an interconnected regional grid, we face the risk of possible loss of business continuity due to a disruption or black-out caused by an event (severe storm, generator or transmission facility outage, solar storm activity or terrorist action) on an interconnected system or the actions of another utility. In addition, we are subject to the risk that acts of war or terrorism, including cyber-terrorism could negatively impact the operation of our system. Any such disruption could result in a significant decrease in revenues and significant additional costs to repair assets, which could have a material adverse impact on our financial condition, results of operations or cash flows. Severe weather, such as ice and snow storms, hurricanes and other natural disasters, may cause outages and property damage, which may require us to incur additional costs that may not be recoverable from customers. The cost of repairing damage to our operating subsidiaries' facilities and the potential disruption of their operations due to storms, natural disasters or other catastrophic events could be substantial, particularly as customers demand better and quicker response times to outages. The effect of the failure of our facilities to operate as planned would be particularly burdensome during a peak demand period, such as during the hot summer months. Market performance or changes in assumptions could require us to make significant contributions to our pension and other post-employment benefit plans. We provide a defined benefit pension plan and other post-retirement benefits for a substantial number of employees, former employees and retirees. Our future pension obligations, costs and liabilities are highly dependent on a variety of factors beyond our control. These factors include estimated investment returns, interest rates, health care cost trends, benefit changes, salary increases and the demographics of plan participants. If our assumptions prove to be inaccurate, our future costs could increase significantly. In 2008 and 2009, due to the financial crisis, the value of our pension assets declined. As a result, we made a contribution of $45 million in 2010 and expect to make an approximate $145 million contribution in 2011. In addition, various factors, including underperformance of plan investments and changes in law or regulation, could increase the amount of contributions required to fund our pension plan in the future. Additional large funding requirements, when combined with the financing requirements of our construction program, could impact the timing and amount of future equity and debt financings and negatively affect our financial position, results of operations or cash flows. Costs of compliance with environmental regulations, including climate change legislation, may increase and have an adverse effect on our business and results of operations. Our subsidiaries' operations are subject to extensive federal, state and local environmental statutes, rules and regulations that govern, among other things, air emissions, water discharges and the management of hazardous and solid waste. Compliance with these requirements requires us to incur significant costs relating to environmental monitoring, installation of pollution control equipment, emission fees, maintenance and upgrading of facilities, remediation and permitting. The costs of compliance with existing legal requirements or legal requirements not yet adopted may increase in the future. An increase in such costs, unless promptly recovered, could have an adverse impact on our business and our financial position, results of operations or cash flows. In addition, global climate change issues have received an increased focus from federal and state governments, which could potentially lead to additional rules and regulations that impact how we operate our business, both in terms of the power plants we own and operate as well as general utility operations. Although we would expect that any costs of these rules and regulations would be recovered from customers, their impact on energy use by customers and the ultimate impact on our business would be dependent upon the specific rules and regulations adopted and cannot be determined at this time. The impact of these additional costs to customers could lead to a further reduction in energy consumption resulting in a decline in electricity and gas sales in our service territories, which would have an adverse impact on our business and financial position, results of operations or cash flows. Any failure by us to comply with environmental laws and regulations, even if due to factors beyond our control, or reinterpretations of existing requirements, could also increase costs. Existing environmental laws and regulations may be revised or new laws and regulations seeking to protect the environment may be adopted or become applicable to us. Revised or additional laws could result in significant additional expense and operating restrictions on our facilities or increased compliance costs, which may not be fully

18
recoverable in distribution company rates. The cost impact of any such laws, rules or regulations would be dependent upon the specific requirements adopted and cannot be determined at this time. For further information, see Item 1, Business - "Other Regulatory and Environmental Matters," in this Annual Report on Form 10-K. As a holding company with no revenue-generating operations, NU parent is dependent on dividends from its subsidiaries, primarily the Regulated companies, its bank facility, and its ability to access the long-term debt and equity capital markets. NU parent is a holding company and as such, has no revenue-generating operations of its own. Its ability to meet its financial obligations associated with the debt service obligations on its debt and to pay dividends on its common shares is largely dependent on the ability of its subsidiaries to pay dividends to or to repay borrowings from NU parent; and/or NU parent’s ability to access its credit facility or the long-term debt and equity capital markets. Prior to funding NU parent, the Regulated companies have financial obligations that must be satisfied, including among others, their operating expenses, debt service, preferred dividends (in the case of CL&P) and obligations to trade creditors. Additionally, the Regulated companies could retain their free cash flow to fund their capital expenditures in lieu of receiving equity contributions from NU parent. Should the Regulated companies not be able to pay dividends to or repay funds due to NU parent or if NU parent cannot access its bank facilities or the long-term debt and equity capital markets, NU parent’s ability to pay interest, dividends and its own debt obligations would be restricted. Risks Related to the Proposed Merger with NSTAR We may be unable to satisfy the conditions or obtain the approvals required to complete the merger or such approvals may contain material restrictions or conditions. The merger is subject to approval by the shareholders of both NU and NSTAR and numerous other conditions, including the approval of various government agencies. Governmental agencies may not approve the merger or such approvals may impose conditions on the completion, or require changes to the terms of the merger, including restrictions on the business, operations or financial performance of the combined company, which could be adverse to the company's interests. These conditions or changes could also delay or increase the cost of the merger or limit the net income or financial prospects of the combined company. We will be subject to business uncertainties and contractual restrictions while the merger is pending. The work required to complete the merger may place a significant burden on management and internal resources. Management's attention and other company resources may be focused on the merger instead of on day-to-day management activities, including pursuing other opportunities beneficial to NU. In addition, while the merger is pending our business operations are restricted by the Agreement and Plan of merger to ordinary course of business activities consistent with past practice, which may cause us to forgo otherwise beneficial business opportunities. We may lose management personnel and other key employees and be unable to attract and retain such personnel and employees. Uncertainties about the effect of the merger on management personnel and employees may impair our ability to attract, retain and motivate key personnel until the merger is completed and for a period of time thereafter, which could affect our financial performance. The merger may not be completed, which may have an adverse effect on our share price and future business and financial results and we could face litigation concerning the merger, whether or not the merger is consummated. Failure to complete the merger could negatively affect NU's share price, as well as our future business and financial results. In addition, purported class actions have been brought against us, NSTAR and others on behalf of holders of NSTAR common shares. If these actions or similar actions that may be brought are successful, the costs of completing the merger could increase, or the merger could be delayed or prevented. We cannot make any assurances that we will succeed in any litigation brought in connection with the merger. See Item 3, Legal Proceedings, in this Annual Report on Form 10-K for discussion of pending litigation related to the merger. If the merger is not completed for certain reasons specified in the merger agreement, we may be required to pay NSTAR a termination fee of $135 million plus up to $35 million of certain expenses incurred by NSTAR. In addition, we must pay our own costs related to the merger including, among others, legal, accounting, advisory, financing and filing fees and printing costs, whether the merger is completed or not. Further, if the merger is not completed, we could be subject to litigation related to the failure to complete the merger or other factors, which may adversely affect our business, financial results and share price. If completed, the merger may not achieve its intended results. We entered into the merger agreement with the expectation that the merger would result in various benefits. If the merger is completed, our ability to achieve the anticipated benefits will be subject to a number of uncertainties, including whether our businesses can be integrated in an efficient and effective manner. Failure to achieve these anticipated benefits could adversely affect our business, financial results and share price.
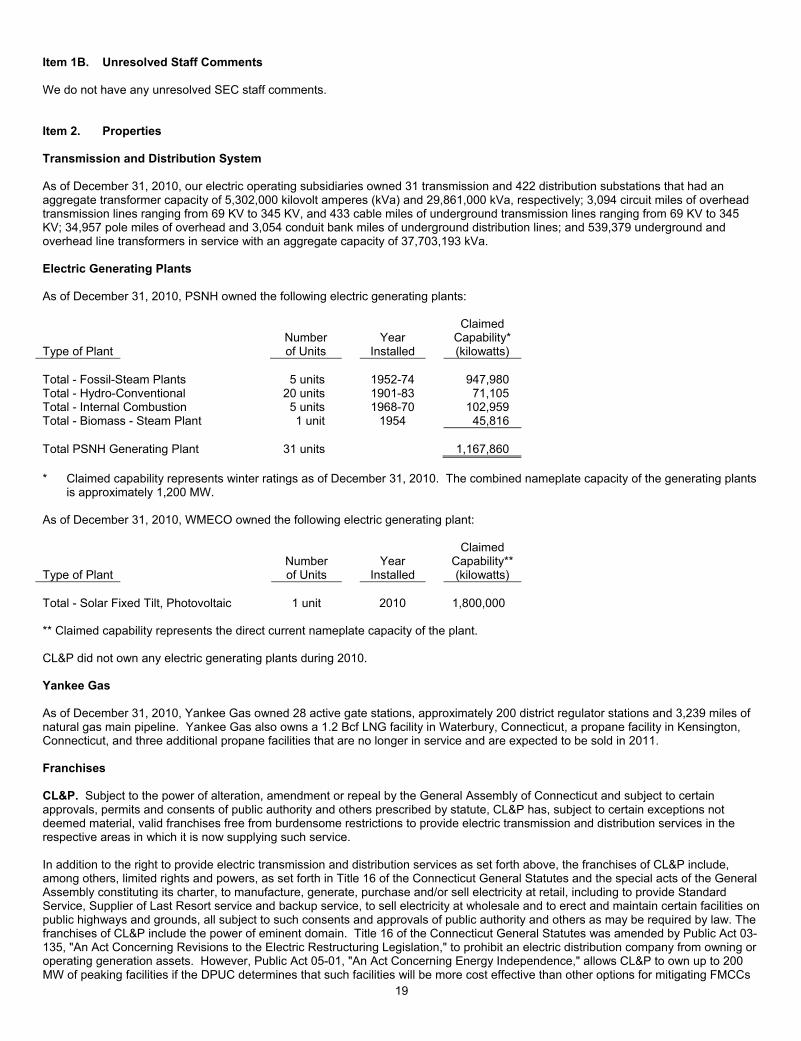
19
Item 1B. Unresolved Staff Comments We do not have any unresolved SEC staff comments. Item 2. Properties Transmission and Distribution System As of December 31, 2010, our electric operating subsidiaries owned 31 transmission and 422 distribution substations that had an aggregate transformer capacity of 5,302,000 kilovolt amperes (kVa) and 29,861,000 kVa, respectively; 3,094 circuit miles of overhead transmission lines ranging from 69 KV to 345 KV, and 433 cable miles of underground transmission lines ranging from 69 KV to 345 KV; 34,957 pole miles of overhead and 3,054 conduit bank miles of underground distribution lines; and 539,379 underground and overhead line transformers in service with an aggregate capacity of 37,703,193 kVa. Electric Generating Plants As of December 31, 2010, PSNH owned the following electric generating plants:
Type of Plant
Number of Units
Year
Installed
Claimed Capability*(kilowatts)
Total - Fossil-Steam Plants 5 units 1952-74 947,980 Total - Hydro-Conventional 20 units 1901-83 71,105 Total - Internal Combustion 5 units 1968-70 102,959 Total - Biomass - Steam Plant 1 unit 1954 45,816 Total PSNH Generating Plant 31 units 1,167,860 * Claimed capability represents winter ratings as of December 31, 2010. The combined nameplate capacity of the generating plants
is approximately 1,200 MW. As of December 31, 2010, WMECO owned the following electric generating plant:
Type of Plant
Number of Units
Year
Installed
Claimed Capability**(kilowatts)
Total - Solar Fixed Tilt, Photovoltaic 1 unit 2010 1,800,000 ** Claimed capability represents the direct current nameplate capacity of the plant. CL&P did not own any electric generating plants during 2010. Yankee Gas As of December 31, 2010, Yankee Gas owned 28 active gate stations, approximately 200 district regulator stations and 3,239 miles of natural gas main pipeline. Yankee Gas also owns a 1.2 Bcf LNG facility in Waterbury, Connecticut, a propane facility in Kensington, Connecticut, and three additional propane facilities that are no longer in service and are expected to be sold in 2011. Franchises CL&P. Subject to the power of alteration, amendment or repeal by the General Assembly of Connecticut and subject to certain approvals, permits and consents of public authority and others prescribed by statute, CL&P has, subject to certain exceptions not deemed material, valid franchises free from burdensome restrictions to provide electric transmission and distribution services in the respective areas in which it is now supplying such service. In addition to the right to provide electric transmission and distribution services as set forth above, the franchises of CL&P include, among others, limited rights and powers, as set forth in Title 16 of the Connecticut General Statutes and the special acts of the General Assembly constituting its charter, to manufacture, generate, purchase and/or sell electricity at retail, including to provide Standard Service, Supplier of Last Resort service and backup service, to sell electricity at wholesale and to erect and maintain certain facilities on public highways and grounds, all subject to such consents and approvals of public authority and others as may be required by law. The franchises of CL&P include the power of eminent domain. Title 16 of the Connecticut General Statutes was amended by Public Act 03-135, "An Act Concerning Revisions to the Electric Restructuring Legislation," to prohibit an electric distribution company from owning or operating generation assets. However, Public Act 05-01, "An Act Concerning Energy Independence," allows CL&P to own up to 200 MW of peaking facilities if the DPUC determines that such facilities will be more cost effective than other options for mitigating FMCCs

20
and Locational Installed Capacity (LICAP) costs. In addition, Section 83 of Public Act 07-242, "An Act Concerning Electricity and Energy Efficiency," states that if an existing electric generating plant located in Connecticut is offered for sale, then an electric distribution company, such as CL&P, would be eligible to purchase the generation plant upon obtaining prior approval from the DPUC and a determination by the DPUC that such purchase is in the public interest. PSNH. The NHPUC, pursuant to statutory requirements, has issued orders granting PSNH exclusive franchises to distribute electricity in the respective areas in which it is now supplying such service. In addition to the right to distribute electricity as set forth above, the franchises of PSNH include, among others, rights and powers to manufacture, generate, purchase, and transmit electricity, to sell electricity at wholesale to other utility companies and municipalities and to erect and maintain certain facilities on certain public highways and grounds, all subject to such consents and approvals of public authority and others as may be required by law. The distribution and transmission franchises of PSNH include the power of eminent domain. WMECO. WMECO is authorized by its charter to conduct its electric business in the territories served by it, and has locations in the public highways for transmission and distribution lines. Such locations are granted pursuant to the laws of Massachusetts by the Department of Public Works of Massachusetts or local municipal authorities and are of unlimited duration, but the rights thereby granted are not vested. Such locations are for specific lines only and for extensions of lines in public highways. Further similar locations must be obtained from the Department of Public Works of Massachusetts or the local municipal authorities. In addition, WMECO has been granted easements for its lines in the Massachusetts Turnpike by the Massachusetts Turnpike Authority and pursuant to state laws, has the power of eminent domain. The Massachusetts restructuring legislation defines service territories as those territories actually served on July 1, 1997 and following municipal boundaries to the extent possible. The restructuring legislation further provides that until terminated by law or otherwise, distribution companies shall have the exclusive obligation to serve all retail customers within their service territories and no other person shall provide distribution service within such service territories without the written consent of such distribution companies. Pursuant to the Massachusetts restructuring legislation, the DPU (then, the Department of Telecommunications and Energy) was required to define service territories for each distribution company, including WMECO. The DPU subsequently determined that there were advantages to the exclusivity of service territories and issued a report to the Massachusetts Legislature recommending against, in this regard, any changes to the restructuring legislation. Yankee Gas. Yankee Gas holds valid franchises to sell gas in the areas in which Yankee Gas supplies gas service, which it acquired either directly or from its predecessors in interest. Generally, Yankee Gas holds franchises to serve customers in areas designated by those franchises as well as in most other areas throughout Connecticut so long as those areas are not occupied and served by another gas utility under a valid franchise of its own or are not subject to an exclusive franchise of another gas utility. Yankee Gas’ franchises are perpetual but remain subject to the power of alteration, amendment or repeal by the General Assembly of the State of Connecticut, the power of revocation by the DPUC and certain approvals, permits and consents of public authorities and others prescribed by statute. Generally, Yankee Gas’ franchises include, among other rights and powers, the right and power to manufacture, generate, purchase, transmit and distribute gas and to erect and maintain certain facilities on public highways and grounds, and the right of eminent domain, all subject to such consents and approvals of public authorities and others as may be required by law. Item 3. Legal Proceedings 1. Yankee Companies v. U.S. Department of Energy The Yankee Companies (YAEC, MYAPC, and CYAPC) commenced litigation in 1998 against the DOE charging that the federal government breached contracts it entered into with each company in 1983 under the Nuclear Waste Policy Act of 1982 to begin removing spent nuclear fuel from the respective nuclear plants no later than January 31, 1998 in return for payments by each company into the Nuclear Waste Fund. The funds for those payments were collected from regional electric customers. The Yankee Companies initially claimed damages for incremental spent nuclear fuel storage, security, construction and other costs through 2010. In 2006, the Court of Federal Claims held that the DOE was liable for damages to CYAPC for $34.2 million through 2001, YAEC for $32.9 million through 2001 and MYAPC for $75.8 million through 2002. In December 2006, the DOE appealed the decision and the Yankee Companies filed cross-appeals. The Court of Appeals disagreed with the trial court’s method of calculation of the amount of the DOE’s liability, among other things, and vacated the decision of the Court of Federal Claims and remanded the case to make new findings consistent with its decision. On September 7, 2010, the trial court issued its decision following remand and awarded CYAPC $39.7 million, YAEC $21.2 million and MYAPC $81.7 million. The DOE filed an appeal and the Yankee Companies cross-appealed. Briefs are due in the first quarter of 2011. The application of any damages that are ultimately recovered to benefit customers, is established in the Yankee Companies' FERC-approved rate settlement agreements, although implementation will be subject to the final determination of the FERC. In December 2007, the Yankee Companies filed a second round of lawsuits against the DOE seeking recovery of actual damages incurred in the years following 2001 and 2002.
21
2. Connecticut MGP Cost Recovery In September 2006, CL&P and Yankee Gas (the NU Companies) filed a complaint against UGI Utilities, Inc. (UGI) in the U.S. District Court for the District of Connecticut seeking past and future remediation costs related to historic MGP operations on thirteen sites currently or formerly owned by the NU Companies (Yankee Gas is responsible for ten of the sites, CL&P for two of the sites, and both companies share responsibility for one site) in a number of different locations throughout the State of Connecticut. The NU Companies allege that UGI controlled operations of the plants at various times throughout the period 1883 to 1941, when UGI was forced to divest its interests. Investigations and remediation activity and expenditures at the sites are ongoing. A trial was held in April 2009. On May 22, 2009, the court granted judgment in favor of the NU Companies with respect to the Waterbury-North site, and granted judgment in favor of UGI with respect to the remaining sites. Judgment was entered on March 31, 2010. On April 23, 2010, the NU Companies filed a Notice of Appeal with respect to the court’s decision, which has been fully briefed. The Phase II trial, which would determine what portion of the remediation costs at the Waterbury-North site are attributable to UGI's control, is scheduled for August 31, 2011. Any recovery resulting from the case (following the appeal and the Waterbury-North complaint) would flow back to the NU Companies' customers, and the NU Companies would continue to seek recovery as appropriate of remediation and other associated costs with regard to the sites for which no recovery from UGI will be forthcoming. 3. Litigation Related to the Proposed Merger with NSTAR In October 2010, NSTAR, the members of the NSTAR board of trustees, NU, and two wholly-owned NU subsidiaries, NU Holding Energy 1 LLC and NU Holding Energy 2 LLC, were named defendants in eight lawsuits (since consolidated) filed in the Superior Court for Suffolk County, Massachusetts, and one lawsuit filed in federal court in the district of Massachusetts. The lawsuits, each of which was brought by a single shareholder, purport to be brought on behalf of classes of NSTAR shareholders opposed to the terms of the merger agreement. The original complaints made virtually identical allegations that, among other things, NSTAR’s trustees breached their fiduciary duties by failing to maximize the value to be received by NSTAR’s shareholders, and that the other defendants aided and abetted the NSTAR trustees’ breaches of fiduciary duties. Both the state and federal complaints sought and continue to seek, among other things, to enjoin defendants from consummating the merger and either rescission of the merger, to the extent it is completed, or monetary damages. On December 10, 2010, the state-court plaintiffs filed their consolidated amended complaint, which, in addition to the already-pending claims, alleged that the disclosures in the preliminary joint proxy statement/prospectus NU filed jointly with NSTAR, were insufficiently detailed, pointing to various aspects of the section entitled "The Merger." On January 6, 2011, NU and NSTAR each moved to dismiss the claims asserted against them for failure to state a claim. In addition, NU and NSTAR jointly moved for a protective order staying the discovery that some of the Plaintiffs had served contemporaneously with their complaints. On January 13, 2011, Plaintiffs moved the Court to expedite proceedings in anticipation of their making a subsequent motion for preliminary injunction to enjoin the March 4, 2011 shareholder vote. Plaintiffs also filed a purported "emergency" motion to obtain discovery from Lexicon Partners, NSTAR's financial advisors. NU and NSTAR opposed both motions, which the Court subsequently denied and scheduled a "litigation control" conference for February 28, 2011 "to address proper scheduling of any and all related motions anticipated by the parties." On February 11, 2011, Plaintiffs filed a motion for preliminary injunction seeking to enjoin the March 4, 2011 shareholder vote. NU and NSTAR will file their opposition to the motion on or before February 22, 2011 on the grounds that it lacks any legal or evidentiary basis. There have been no developments in the federal case, in which the plaintiff has never served NSTAR, NU, or any other defendant with his complaint. NU and NSTAR believe both the federal and state lawsuits are without merit and are defending the lawsuits vigorously. 4. Bankruptcy of Independent Power Producer On February 1, 2011, an independent power producer, AES Thames, L.L.C. (Thames), which is the counterparty to a CL&P electricity purchase agreement, filed a voluntary petition for bankruptcy in the U.S. Bankruptcy Court in Delaware (Case No. 11-10334). Thames owns and operates a 181 MW coal fired generation plant in Montville, Connecticut providing electric energy to CL&P and process steam to a nearby paperboard manufacturer. Citing market conditions and regulatory and legislative uncertainties, Thames had advised CL&P on January 24, 2011 that it was shutting the plant down for an undetermined period. Under an amendment to the electricity purchase agreement entered into in 1999, Thames agreed to supply CL&P with energy from the plant for a reduced price in exchange for a substantial prepayment. The electricity purchase agreement was due to expire in 2015. CL&P has appeared in the Delaware bankruptcy proceeding and intends to assert all available legal rights to protect its customers’ interests. Management cannot estimate the effects of this proceeding, but does not believe there will be a material impact on CL&P’s financial position, results or operations or cash flows. 5. Other Legal Proceedings For further discussion of legal proceedings see the following sections of Item 1, Business: "- Regulated Electric Distribution," "-Regulated Gas Distribution - Yankee Gas Services Company," and "- Electric Transmission," for information about various state regulatory and rate proceedings, civil lawsuits related thereto, and information about proceedings relating to power, transmission and pricing issues; "- Nuclear Decommissioning" for information related to high-level nuclear waste; and "- Other Regulatory and Environmental Matters" for information about proceedings involving surface water and air quality requirements, toxic substances and hazardous waste, EMF, licensing of hydroelectric projects, and other matters. In addition, see Item 1A, Risk Factors, for general information about several significant risks.

22
EXECUTIVE OFFICERS OF THE REGISTRANT The following table sets forth the executive officers of NU as of February 24, 2011. All of the Company’s officers serve terms of one year and until their successors are elected and qualified: Name Age Title Jay S. Buth 41 Vice President - Accounting and Controller. Gregory B. Butler 53 Senior Vice President and General Counsel. Jean M. LaVecchia* 59 Vice President - Human Resources of NUSCO. David R. McHale 50 Executive Vice President and Chief Financial Officer of NU. Leon J. Olivier 62 Executive Vice President and Chief Operating Officer of NU. James B. Robb* 50 Senior Vice President, Enterprise Planning and Development of NUSCO. Charles W. Shivery 65 Chairman of the Board, President and Chief Executive Officer of NU. *Deemed executive officer of NU pursuant to Rule 3b-7 under the Securities Exchange Act of 1934. Jay S. Buth. Mr. Buth was elected Vice President - Accounting and Controller of NU, CL&P, PSNH and WMECO, effective June 9, 2009. Previously, Mr. Buth served as Controller, and Vice President and Controller at NJR Service Corporation, a subsidiary of New Jersey Resources Corporation, a gas utility holding company, from June 2006 to January 2009. He also served as Director - Finance at Allegheny Energy, Inc. from May 2004 to May 2006. Gregory B. Butler. Mr. Butler was elected Senior Vice President and General Counsel of NU effective December 1, 2005, and of CL&P, PSNH and WMECO, subsidiaries of NU, effective March 9, 2006, and was elected a Director of CL&P, PSNH and WMECO April 22, 2009 and a Director of Northeast Utilities Foundation, Inc. effective December 1, 2002. Previously Mr. Butler served as Senior Vice President, Secretary and General Counsel of NU from August 31, 2003 to December 1, 2005 and Vice President, Secretary and General Counsel of NU from May 1, 2001 through August 30, 2003. Jean M. LaVecchia. Ms. LaVecchia was elected Vice President - Human Resources of NUSCO, effective January 1, 2005 and was elected a Director of CL&P, PSNH and WMECO April 22, 2009 and a Director of Northeast Utilities Foundation, Inc. effective January 30, 2007. Previously Ms. LaVecchia served as Vice President - Human Resources and Environmental Services from May 1, 2001 to December 31, 2004. David R. McHale. Mr. McHale was elected Executive Vice President and Chief Financial Officer of NU, CL&P, PSNH and WMECO, effective January 1, 2009, elected a Director of PSNH and WMECO, effective January 1, 2005, of CL&P effective January 15, 2007 and of Northeast Utilities Foundation, Inc. effective January 1, 2005. Previously, Mr. McHale served as Senior Vice President and Chief Financial Officer of NU, CL&P, PSNH and WMECO from January 1, 2005 to December 31, 2008 and Vice President and Treasurer of NU, PSNH and WMECO from July 1998 to December 31, 2004. Leon J. Olivier. Mr. Olivier was elected Executive Vice President and Chief Operating Officer of NU effective May 13, 2008; He also has served as Chief Executive Officer of CL&P, PSNH and WMECO since January 15, 2007; a Director of PSNH and WMECO since January 17, 2005 and a Director of CL&P since September 2001. Previously, Mr. Olivier served as Executive Vice President - Operations of NU from February 13, 2007 to May 12, 2008; Executive Vice President of NU from December 1, 2005 to February 13, 2007; President - Transmission Group of NU from January 17, 2005 to December 1, 2005; and President and Chief Operating Officer of CL&P from September 2001 to January 2005. James B. Robb. Mr. Robb was elected Senior Vice President, Enterprise Planning and Development of NUSCO on September 4, 2007 and was elected a Director of CL&P, PSNH and WMECO April 22, 2009. Previously, Mr. Robb served as Managing Director, Russell Reynolds Associates from December 2006 to August 2007; Entrepreneur in Residence, Mohr Davidow Ventures from March 2006 to November 2006; Senior Vice President, Retail Marketing, Reliant Energy, Inc. from December 2003 to December 2006; and Senior Vice President, Performance Management, Reliant Resources, Inc. from November 2002 to December 2003. Charles W. Shivery. Mr. Shivery was elected Chairman of the Board, President and Chief Executive Officer of NU effective March 29, 2004; Chairman and a Director of CL&P, PSNH and WMECO effective January 19, 2007 and a Director of Northeast Utilities Foundation effective March 3, 2004. Previously, Mr. Shivery served as President (interim) of NU from January 1, 2004 to March 29, 2004; and President - Competitive Group of NU and President and Chief Executive Officer of NU Enterprises, Inc., from June 2002 through December 2003. Item 4. [RESERVED]

23
PART II Item 5. Market for the Registrants' Common Equity and Related Stockholder Matters NU. Our common shares are listed on the New York Stock Exchange. The ticker symbol is "NU," although it is frequently presented as "Noeast Util" and/or "NE Util" in various financial publications. The high and low sales prices for the past two years, by quarter, are shown below.
Year Quarter High Low 2010 First $ 28.00 $ 24.68 Second 28.21 24.83 Third 30.25 25.24 Fourth 32.21 29.51 2009 First $ 25.05 $ 19.45 Second 22.40 19.99 Third 24.72 21.38 Fourth 26.33 22.54
There were no purchases made by or on behalf of our company or any "affiliated purchaser" (as defined in Rule 10b-18(a)(3) under the Securities Exchange Act of 1934), of common stock during the fourth quarter of the year ended December 31, 2010. As of January 31, 2011, there were 40,210 registered common shareholders of our company on record. As of the same date, there were a total of 195,808,704 common shares issued. There were no unallocated ESOP shares held in the ESOP trust as of December 31, 2010. Pursuant to NU parent's Shareholder Rights Plan (the "Plan"), NU parent distributed to shareholders of record as of May 7, 1999, a dividend in the form of one common share purchase right (a "Right") for each common share owned by the shareholder. The Rights and the Plan expired at the end of the 10-year term on February 23, 2009. On February 8, 2011, our Board of Trustees declared a dividend of 27.5 cents per share, payable on March 31, 2011 to shareholders of record as of March 1, 2011. On October 12, 2010, our Board of Trustees declared a dividend of 25.625 cents per share, payable on December 31, 2010 to shareholders of record as of December 1, 2010. On July 12, 2010, our Board of Trustees declared a dividend of 25.625 cents per share, payable on September 30, 2010 to shareholders of record as of September 1, 2010. On April 13, 2010, our Board of Trustees declared a dividend of 25.625 cents per share, payable on June 30, 2010 to shareholders of record as of June 1, 2010. On February 9, 2010, our Board of Trustees declared a dividend of 25.625 cents per share, payable on March 31, 2010 to shareholders of record as of March 1, 2010. On October 13, 2009, our Board of Trustees declared a dividend of 23.75 cents per share, payable on December 31, 2009 to shareholders of record as of December 1, 2009. On July 14, 2009, our Board of Trustees declared a dividend of 23.75 cents per share, payable on September 30, 2009 to shareholders of record as of September 1, 2009. On April 14, 2009, our Board of Trustees declared a dividend of 23.75 cents per share, payable on June 30, 2009 to shareholders of record as of June 1, 2009. On February 10, 2009, our Board of Trustees declared a dividend of 23.75 cents per share, payable on March 31, 2009 to shareholders of record as of March 1, 2009. Information with respect to dividend restrictions for us, CL&P, PSNH, and WMECO is contained in Item 7, Management's Discussion and Analysis of Financial Condition and Results of Operations, under the caption "Liquidity" and Item 8, Financial Statements and Supplementary Data, in the Combined Notes to Consolidated Financial Statements, within this Annual Report on Form 10-K. There is no established public trading market for the common stock of CL&P, PSNH and WMECO. All of the common stock of CL&P, PSNH and WMECO is held solely by NU. During 2010 and 2009, CL&P approved and paid $217.7 million and $113.8 million, respectively, of common stock dividends to NU.

24
During 2010 and 2009, PSNH approved and paid $50.6 million and $40.8 million, respectively, of common stock dividends to NU. During 2010 and 2009, WMECO approved and paid $14.9 million and $18.2 million, respectively, of common stock dividends to NU. For information regarding securities authorized for issuance under equity compensation plans, see Item 12, Security Ownership of Certain Beneficial Owners and Management and Related Stockholder Matters, included in this Annual Report on Form 10-K. Item 6. Selected Consolidated Financial Data NU Selected Consolidated Financial Data (Unaudited) (Thousands of Dollars, except percentages and common share information) 2010 2009 2008 2007 2006 Balance Sheet Data: Property, Plant and Equipment, Net $ 9,567,726 $ 8,839,965 $ 8,207,876 $ 7,229,945 $ 6,242,186 Total Assets 14,522,042 14,057,679 13,988,480 11,581,822 11,303,236 Total Capitalization (a) 8,627,985 8,253,323 7,293,960 6,667,920 5,879,691 Obligations Under Capital Leases (a) 12,236 12,873 13,397 14,743 14,425 Income Statement Data: Operating Revenues $ 4,898,167 $ 5,439,430 $ 5,800,095 $ 5,822,226 $ 6,877,687 Income from Continuing Operations 394,107 335,592 266,387 251,455 138,495 Income from Discontinued Operations - - - 587 337,642 Net Income Attributable to Noncontrolling Interests 6,158 5,559 5,559 5,559 5,559 Net Income Attributable to Controlling Interests $ 387,949 $ 330,033 $ 260,828 $ 246,483 $ 470,578 Common Share Data: Basic Earnings Per Common Share: Income from Continuing Operations $ 2.20 $ 1.91 $ 1.68 $ 1.59 $ 0.86 Income from Discontinued Operations - - - - 2.20 Net Income Attributable to Controlling Interests $ 2.20 $ 1.91 $ 1.68 $ 1.59 $ 3.06 Diluted Earnings Per Common Share: Income from Continuing Operations $ 2.19 $ 1.91 $ 1.67 $ 1.59 $ 0.86 Income from Discontinued Operations - - - - 2.19 Net Income Attributable to Controlling Interests $ 2.19 $ 1.91 $ 1.67 $ 1.59 $ 3.05 Weighted Average Common Shares Outstanding Basic 176,636,086 172,567,928 155,531,846 154,759,727 153,767,527 Diluted 176,885,387 172,717,246 155,999,240 155,304,361 154,146,669 Dividends Declared Per Share $ 1.03 $ 0.95 $ 0.83 $ 0.78 $ 0.73 Market Price - Closing (high) (b) $ 32.05 $ 26.33 $ 31.15 $ 33.53 $ 28.81 Market Price - Closing (low) (b) $ 24.78 $ 19.45 $ 19.15 $ 26.93 $ 19.24 Market Price - Closing (end of year) (b) $ 31.88 $ 25.79 $ 24.06 $ 31.31 $ 28.16 Book Value Per Share (end of year) $ 21.60 $ 20.37 $ 19.38 $ 18.79 $ 18.14 Tangible Book Value Per Share (end of year) (c) $ 19.97 $ 18.74 $ 17.54 $ 16.93 $ 16.28 Rate of Return Earned on Average Common Equity (%) (d) 10.7 10.2 8.8 8.6 18.0 Market-to-Book Ratio (end of year) (e) 1.5 1.3 1.2 1.7 1.6 Capitalization: Total Equity 44 % 44 % 41 % 44 % 48 % Preferred Stock, not subject to mandatory redemption 1 1 2 2 2 Long-Term Debt (a) 55 55 57 54 50 100 % 100 % 100 % 100 % 100 % (a) Includes portions due within one year, but excludes RRBs for Long-Term Debt. (b) Market price information reflects closing prices as reflected by the New York Stock Exchange. (c) Common Shareholders' Equity adjusted for goodwill and intangibles divided by total common shares outstanding. (d) Net Income divided by the average change in Common Shareholders' Equity. (e) The closing market price divided by the book value per share. See the Combined Notes to the Consolidated Financial Statements for a description of any accounting changes materially affecting the comparability of the information reflected in the table above.

25
CL&P Selected Consolidated Financial Data (Unaudited) (Thousands of Dollars) 2010 2009 2008 2007 2006 Operating Revenues $ 2,999,102 $ 3,424,538 $ 3,558,361 $ 3,681,817 $ 3,979,811 Net Income 244,143 216,316 191,158 133,564 200,007 Cash Dividends on Common Stock 217,691 113,848 106,461 79,181 63,732 Property, Plant and Equipment, Net 5,586,504 5,340,561 5,089,124 4,401,846 3,634,370 Total Assets 8,287,585 8,364,564 8,336,118 7,018,099 6,321,294 Rate Reduction Bonds - 195,587 378,195 548,686 743,899 Long-Term Debt (a) 2,583,102 2,582,361 2,270,414 2,028,546 1,519,440 Preferred Stock Not Subject to Mandatory Redemption 116,200 116,200 116,200 116,200 116,200 Obligations Under Capital Leases (a) 10,613 10,956 11,207 13,602 14,264
PSNH Selected Consolidated Financial Data (Unaudited) (Thousands of Dollars) 2010 2009 2008 2007 2006 Operating Revenues $ 1,033,439 $ 1,109,591 $ 1,141,202 $ 1,083,072 $ 1,140,900 Net Income 90,067 65,570 58,067 54,434 35,323 Cash Dividends on Common Stock 50,584 40,844 36,376 30,720 41,741 Property, Plant and Equipment, Net 2,053,281 1,814,714 1,580,985 1,388,405 1,242,378 Total Assets 2,889,840 2,697,191 2,628,833 2,106,969 2,071,276 Rate Reduction Bonds 138,247 188,113 235,139 282,018 333,831 Long-Term Debt (a) 836,365 836,255 686,779 576,997 507,099 Obligations Under Capital Leases (a) 1,428 1,670 1,931 1,141 1,356
WMECO Selected Consolidated Financial Data (Unaudited) (Thousands of Dollars) 2010 2009 2008 2007 2006 Operating Revenues $ 395,161 $ 402,413 $ 441,527 $ 464,745 $ 431,509 Net Income 23,090 26,196 18,330 23,604 15,644 Cash Dividends on Common Stock 14,882 18,203 39,706 12,779 7,946 Property, Plant and Equipment, Net 817,146 705,760 624,205 559,357 526,094 Total Assets 1,199,559 1,101,800 1,048,489 991,088 988,693 Rate Reduction Bonds 43,325 58,735 73,176 86,731 99,428 Long-Term Debt (a) 400,288 305,475 303,868 303,872 261,777 Obligations Under Capital Leases (a) 83 105 126 - - (a) Includes portions due within one year, but excludes RRBs for Long-Term Debt.

26
Item 7. Management's Discussion and Analysis of Financial Condition and Results of Operations The following discussion and analysis should be read in conjunction with our consolidated financial statements and related combined notes included in this Annual Report on Form 10-K. References in this Annual Report to "NU," the "Company," "we," "us" and "our" refer to Northeast Utilities and its consolidated subsidiaries. All per share amounts are reported on a diluted basis. Refer to the Glossary of Terms included in this Annual Report on Form 10-K for abbreviations and acronyms used throughout the combined notes to the consolidated financial statements. The only common equity securities that are publicly traded are common shares of NU. The earnings and EPS of each business discussed below do not represent a direct legal interest in the assets and liabilities allocated to such business but rather represent a direct interest in our assets and liabilities as a whole. EPS by business is a financial measure not recognized under GAAP that is calculated by dividing the net income or loss attributable to controlling interests of each business by the weighted average diluted NU common shares outstanding for the period. We use this non-GAAP financial measure to evaluate earnings results and to provide details of earnings results and guidance by business. We believe that this measurement is useful to investors to evaluate the actual and projected financial performance and contribution of our businesses. This non-GAAP financial measure should not be considered as an alternative to our consolidated diluted EPS determined in accordance with GAAP as an indicator of operating performance. The discussion below also includes non-GAAP financial measures referencing our 2010 earnings and EPS excluding expenses related to NU's proposed merger with NSTAR and certain non-recurring benefits from the settlement of tax issues as well as our 2008 earnings and EPS excluding a significant charge resulting from the settlement of litigation. We use these non-GAAP financial measures to more fully compare and explain the 2010, 2009 and 2008 results without including the impact of these non-recurring items. Due to the nature and significance of these items on Net Income, management believes that this non-GAAP presentation is more representative of our performance and provides additional and useful information to readers of this report in analyzing historical and future performance. These non-GAAP financial measures should not be considered as alternatives to reported Net Income Attributable to Controlling Interests or EPS determined in accordance with GAAP as indicators of operating performance. Reconciliations of the above non-GAAP financial measures to the most directly comparable GAAP measures of consolidated diluted EPS and Net Income Attributable to Controlling Interests are included under "Financial Condition and Business Analysis-Overview-Consolidated" and "Financial Condition and Business Analysis-Future Outlook" in Management's Discussion and Analysis, herein. All forward-looking information for 2011 and thereafter provided in this Management’s Discussion and Analysis assumes we will operate on a stand-alone basis, excluding the impacts of the proposed merger with NSTAR, unless otherwise indicated. Financial Condition and Business Analysis Proposed Merger with NSTAR: On October 18, 2010, we and NSTAR announced that each company's Board of Trustees unanimously approved a Merger Agreement (the "agreement") to create a combined company that will be called Northeast Utilities. The transaction was structured as a merger of equals in a tax-free exchange. The post-transaction company will provide electric and natural gas energy delivery service to approximately 3.5 million electric and natural gas customers through six regulated electric and natural gas utilities in Connecticut, Massachusetts and New Hampshire, representing over half of all the customers in New England. Under the terms of the agreement, NSTAR shareholders would receive 1.312 NU common shares for each NSTAR common share that they own (the "exchange ratio"). The exchange ratio was structured to result in a no premium merger based on the average closing share price of each company's common shares for the 20 trading days preceding the announcement. Based on the number of NU common shares and NSTAR common shares estimated to be outstanding immediately prior to the closing of the merger, upon such closing, NU shareholders will own approximately 56 percent of the post-transaction company and former NSTAR shareholders will own approximately 44 percent of the post-transaction company. It is anticipated that we would issue approximately 137 million common shares to the NSTAR shareholders as a result of the merger. Subject to the conditions in the agreement, our first quarterly dividend per common share declared after the completion of the merger will be increased to an amount that is equivalent, after adjusting for the exchange ratio, to NSTAR's last quarterly dividend paid prior to the closing. Based on the last quarterly dividend paid by NSTAR, and assuming there are no changes to such dividend prior to the closing of the merger, this anticipated amount would be approximately $0.325 per share, or approximately $1.30 per share on an annualized basis. Completion of the merger is subject to various customary conditions, including, among others, approval by holders of two-thirds of the outstanding common shares of each company and receipt of all required regulatory approvals. The companies anticipate that the regulatory approvals can be obtained to permit the merger to close in the second half of 2011. Special meetings of shareholders of both companies to approve the merger are scheduled for March 4, 2011. On November 24, 2010, NU and NSTAR filed a joint petition requesting Massachusetts DPU approval of their proposed merger by May 15, 2011. On January 5, 2011, a public hearing and procedural conference were held before the DPU. The schedule has subsequently been suspended pending a decision on the appropriate standard of review for the merger. On January 4, 2011, we received approval from the FCC, and on February 10, 2011, the applicable Hart-Scott-Rodino waiting period expired. On January 7, 2011, NU and NSTAR filed an application with the FERC, requesting approval of the merger by May 10, 2011.

27
In November 2010, the DPUC issued a draft decision stating that it lacked jurisdiction over the merger. In December 2010, the Connecticut Office of Consumer Counsel, supported by the Connecticut Attorney General, petitioned the DPUC to reconsider its draft decision. In January 2011, the DPUC issued an Administrative Order stating that it plans to hold a hearing to determine if it has jurisdiction over the merger. Oral arguments surrounding the draft decision were held in February 2011. The DPUC plans to hold an informational hearing at a date to be determined. In addition, legislation proposing to give the DPUC jurisdiction over the merger may be introduced in the Connecticut legislature. Executive Summary The following items in this executive summary are explained in more detail in this Annual Report: Results: • We earned $387.9 million, or $2.19 per share, in 2010, compared with $330 million, or $1.91 per share, in 2009. Improved results
were due primarily to the impact of the CL&P and PSNH 2010 distribution rate case decisions that were effective July 1, 2010, higher retail electric sales due to weather impacts, the non-recurring benefits from the settlement of tax issues in the fourth quarter of 2010, and our continued success in managing operation and maintenance costs. These benefits were partially offset by higher pension and storm-related expenses and expenses related to our proposed merger with NSTAR.
• Our Regulated companies earned $384 million, or $2.16 per share, in 2010, compared with $323.5 million, or $1.87 per share, in
2009. • Earnings from the distribution segment of our Regulated companies (which also includes the generation businesses of PSNH and
WMECO and the natural gas distribution business of Yankee Gas) totaled $206.2 million, or $1.16 per share, in 2010, compared with $159.2 million, or $0.92 per share, in 2009. Earnings from the transmission segment of our Regulated companies totaled $177.8 million, or $1.00 per share, in 2010, compared with $164.3 million, or $0.95 per share, in 2009.
• Our competitive businesses, which are held by NU Enterprises, earned $8.3 million, or $0.05 per share, in 2010, compared with
$15.8 million, or $0.09 per share, in 2009. NU Enterprises recorded $0.7 million of after-tax mark-to-market gains in 2010, compared with $3.8 million of after-tax mark-to-market gains in 2009.
• NU parent and other companies recorded net expenses of $4.4 million, or $0.02 per share, in 2010, compared with net expenses
of $9.3 million, or $0.05 per share, in 2009. The 2010 results include a fourth quarter non-recurring benefit of $15.7 million, or $0.09 per share, associated with the settlement of tax issues and a fourth quarter after-tax charge of $9.4 million, or $0.06 per share, associated with expenses related to NU’s proposed merger with NSTAR.
Outlook: • Excluding certain non-recurring costs related to our proposed merger with NSTAR of approximately $0.15 per share, we project
consolidated 2011 earnings of between $2.25 per share and $2.40 per share. This projection includes distribution segment earnings of between $1.25 per share and $1.35 per share, transmission segment earnings of between $1.05 per share and $1.10 per share, and net expenses at NU parent and other companies of approximately $0.05 per share, excluding merger-related costs of approximately $0.15 per share. The number of outstanding NU common shares used to calculate this guidance is approximately 177 million shares. Results from our competitive businesses are factored into the NU parent and other companies’ results. This projection assumes we will operate on a stand-alone basis in 2011, although our proposed merger with NSTAR is expected to close in the second half of 2011.
• We project a compound average annual EPS growth rate through 2015 of between 6 percent and 9 percent using 2009 EPS of
$1.91 per share as the base level. Assuming completion of our proposed merger with NSTAR, we expect our EPS growth rate will be at the higher end of this range.
• We project capital expenditures for 2011 through 2015 of approximately $6.6 billion (approximately $1.2 billion in 2011). During
that time period, we expect our Regulated company rate base to increase from approximately $7.3 billion at the end of 2010 to approximately $11.4 billion at the end of 2015, excluding any impacts from the merger.
• On February 8, 2011, our Board of Trustees declared a quarterly common dividend of $0.275 per share, payable on March 31,
2011 to shareholders of record as of March 1, 2011, which equates to $1.10 per share on an annualized basis. Assuming completion of our proposed merger with NSTAR, based on the last quarterly dividend paid by NSTAR of $0.425 per share, and assuming there are no changes to such dividend prior to the closing of the merger, our first quarterly dividend per common share declared would be approximately $0.325 per share, or approximately $1.30 per share on an annualized basis.
Strategy, Regulatory and Other Items: • On June 30, 2010, the DPUC issued a final decision in CL&P's distribution rate case that approved annualized rate increases of
$63.4 million effective July 1, 2010 and an additional $38.5 million effective July 1, 2011. The decision approved CL&P’s proposal
28
to defer implementation of the first increase by six months until January 1, 2011 and maintained CL&P’s authorized distribution segment regulatory ROE of 9.4 percent.
• On June 28, 2010, the NHPUC approved the distribution rate case settlement agreement among PSNH, the NHPUC staff and the
Office of Consumer Advocate. Under the agreement, the settling parties agreed to a net annualized distribution rate increase of $45.5 million, effective July 1, 2010, and annualized distribution rate adjustments projected to be a decrease of $2.9 million and increases of $9.5 million and $11.1 million on July 1 of each of the three subsequent years. PSNH’s authorized distribution business regulatory ROE remained at 9.67 percent.
• On January 31, 2011, the DPU issued a final decision in WMECO's distribution rate case that approved an annualized rate
increase of $16.8 million effective February 1, 2011 and an authorized distribution segment regulatory ROE of 9.6 percent. • On January 7, 2011, Yankee Gas filed an application with the DPUC to increase distribution rates by $32.8 million effective July 1,
2011 and by an additional $13 million effective July 1, 2012. Among other items, Yankee Gas requested to maintain its current authorized regulatory ROE of 10.1 percent. A final decision is expected in June 2011.
• On February 11, 2011, the FERC accepted without modification the TSA that NPT and Hydro Renewable Energy entered into in
connection with the Northern Pass transmission project. Assuming timely receipt of other regulatory reviews and siting approvals, NPT expects to place the project in service in late 2015.
• CL&P and WMECO have received siting approvals in Connecticut and Massachusetts, respectively, for the first and largest
component of our NEEWS project, GSRP, which involves the construction of 115 KV and 345 KV lines from Ludlow, Massachusetts, to Bloomfield, Connecticut. We commenced substation construction in December 2010, and expect to begin overhead line construction in the first half of 2011. We expect the cost of this project to be $795 million and to place the project in service in late 2013.
• Construction of PSNH’s Clean Air Project at Merrimack Station was approximately 80 percent complete as of December 31, 2010
and is projected to cost approximately $430 million, which is approximately $27 million below the project’s previously announced cost of $457 million. The project must be operational by July 1, 2013, but PSNH expects it will commence operations by mid-2012.
• On December 17, 2010, President Obama signed into law the 2010 Tax Act. We expect the 2010 Tax Act to provide NU with cash
flow benefits of approximately $250 million in 2011 and approximately $450 million to $550 million over the period 2011 through 2013.
Liquidity: • Cash capital expenditures totaled $954.5 million in 2010, compared with $908.1 million in 2009. • Cash flows provided by operating activities in 2010 totaled $832.6 million, compared with $745 million in 2009 (amounts are net of
RRB payments). The improved cash flows were due primarily to the absence in 2010 of costs incurred at PSNH and WMECO related to the major storm in December 2008 that were paid in the first quarter of 2009, a decrease in Fuel, Materials and Supplies attributable to a $31.8 million reduction in coal inventory levels at PSNH, and increases in amortization on regulatory deferrals within PSNH’s ES and CL&P’s CTA tracking mechanisms. Offsetting these favorable cash flow impacts was a $45 million contribution to our Pension Plan. Excluding the impact of our proposed merger with NSTAR, we project 2011 cash flows provided by operating activities, net of RRB payments, of approximately $950 million to $1 billion. The increase over 2010 is due primarily to the accelerated depreciation provisions of the 2010 Tax Act and the impact of the 2010 distribution rate case decisions. Those benefits are partially offset by projected 2011 contributions to our Pension Plan of approximately $145 million.
• Cash and cash equivalents totaled $23.4 million as of December 31, 2010, compared with $27 million as of December 31, 2009. • On September 24, 2010, CL&P, PSNH, WMECO, and Yankee Gas jointly entered into a three-year $400 million unsecured
revolving credit facility, replacing a five-year $400 million credit facility that was scheduled to expire on November 6, 2010. On September 24, 2010, NU parent entered into a three-year $500 million unsecured revolving credit facility, replacing a five-year $500 million credit facility that was scheduled to expire on November 6, 2010. Both new revolving credit facilities expire on September 24, 2013. As of December 31, 2010, we had $600.9 million of aggregate borrowing availability on our revolving credit lines, as compared to $702.8 million as of December 31, 2009.
• We issued $145 million of new long-term debt in 2010, consisting of $95 million by WMECO and $50 million by Yankee Gas.
Additionally, CL&P remarketed $62 million of tax-exempt PCRBs. In 2011, in addition to remarketing the CL&P $62 million PCRBs, we expect to issue approximately $260 million of long-term debt comprised of $160 million by PSNH and $100 million by WMECO in the second half of 2011. We have no debt maturities until April 2012.

29
Overview Consolidated: We earned $387.9 million, or $2.19 per share, in 2010, compared with $330 million, or $1.91 per share, in 2009 and $260.8 million, or $1.67 per share, in 2008. Improved results were due primarily to the impact of the CL&P and PSNH 2010 distribution rate case decisions that were effective July 1, 2010, higher retail electric sales due to warmer than normal summer weather and colder than normal December 2010 weather, the non-recurring benefits from the settlement of tax issues in the fourth quarter of 2010, lower uncollectibles expense, our continued success in managing operation and maintenance costs, and increased earnings in the transmission segment. These benefits were partially offset by higher pension and storm-related expenses, expenses related to our proposed merger with NSTAR, charges associated with the enactment of the 2010 Healthcare Act, and lower earnings at our competitive businesses. Due primarily to weather impacts, retail electric sales were up 1.7 percent in 2010 compared with 2009. A summary of our earnings by business, which also reconciles the non-GAAP financial measures of consolidated non-GAAP earnings and EPS, as well as EPS by business, to the most directly comparable GAAP measures of consolidated Net Income Attributable to Controlling Interests and diluted EPS, for 2010, 2009 and 2008 is as follows: For the Years Ended December 31, 2010 2009 2008 (Millions of Dollars, except per share amounts) Amount Per Share Amount Per Share Amount Per Share Net Income Attributable to Controlling Interests (GAAP) $ 387.9 $ 2.19 $ 330.0 $ 1.91 $ 260.8 $ 1.67 Regulated Companies $ 384.0 $ 2.16 $ 323.5 $ 1.87 $ 289.1 $ 1.85 Competitive Businesses 8.3 0.05 15.8 0.09 13.1 0.08 NU Parent and Other Companies (10.7) (0.05) (9.3) (0.05) (11.6) (0.07) Non-GAAP Earnings 381.6 2.16 330.0 1.91 290.6 1.86 Non-Recurring Tax Settlements 15.7 0.09 - - - - Merger-Related Costs (after-tax) (9.4) (0.06) - - - - Litigation Charge (after-tax) - - - - (29.8) (0.19) Net Income Attributable to Controlling Interests (GAAP) $ 387.9 $ 2.19 $ 330.0 $ 1.91 $ 260.8 $ 1.67 Regulated Companies: Our Regulated companies consist of the distribution and electric transmission segments, with Yankee Gas natural gas distribution segment and PSNH and WMECO generation activities included in the distribution segment. A summary of our Regulated companies' earnings by segment for 2010, 2009 and 2008 is as follows: For the Years Ended December 31, (Millions of Dollars) 2010 2009 2008 CL&P Transmission $ 143.9 $ 136.8 $ 115.6 PSNH Transmission 20.7 18.0 16.7 WMECO Transmission 13.0 9.5 6.0 NUTV 0.2 - - Total Transmission $ 177.8 $ 164.3 $ 138.3 CL&P Distribution $ 94.1 $ 74.0 $ 70.0 PSNH Distribution 69.3 47.5 41.4 WMECO Distribution 10.1 16.7 12.3 Yankee Gas 32.7 21.0 27.1 Total Distribution $ 206.2 $ 159.2 $ 150.8 Net Income - Regulated Companies $ 384.0 $ 323.5 $ 289.1 The higher 2010 and 2009 transmission segment earnings reflect increasing investment in transmission infrastructure to meet the reliability needs of our customers and the region. Our transmission rate base totaled $2.76 billion at the end of 2010, compared with $2.6 billion at the end of 2009. CL&P’s 2010 distribution segment earnings were $20.1 million higher than 2009 due primarily to the DPUC distribution rate case decision that was effective July 1, 2010. The decision allowed CL&P to defer operating and maintenance expenses for the last six months of 2010 in lieu of cash rate relief until new rates begin on January 1, 2011. CL&P’s 2010 earnings also benefitted from lower depreciation expense as authorized in the distribution rate case decision, lower interest expense as a result of the favorable resolution of state tax audits in the fourth quarter of 2010, and lower uncollectibles expenses. Partially offsetting these favorable items were higher storm restoration costs and higher pension costs. CL&P’s 2010 retail electric sales were 1.8 percent higher than 2009 due primarily to warmer than normal weather during the summer of 2010. CL&P’s distribution segment regulatory ROE was 7.9 percent in 2010 compared to 7.3 percent in 2009. We expect CL&P’s distribution segment regulatory ROE will be approximately 9 percent in 2011. PSNH’s 2010 distribution segment earnings were $21.8 million higher than 2009. The improved performance in 2010 was due primarily to higher revenues as a result of distribution rate increases effective August 1, 2009 and July 1, 2010, higher AFUDC earnings related to the Clean Air Project capital expenditures, and higher retail electric sales of 1.3 percent due primarily to warmer than normal weather during the summer of 2010. The permanent distribution rate case settlement approved on June 28, 2010 allowed for certain costs to be

30
recovered retroactive to August 1, 2009. These favorable items were partially offset by higher expenses, including employee benefit costs, storm restoration costs, depreciation, interest expense and income taxes as a result of a higher effective tax rate in 2010. PSNH’s distribution segment regulatory ROE was 10.2 percent (including generation) in 2010, compared to 7.2 percent in 2009. We expect PSNH’s distribution segment regulatory ROE will be approximately 9 percent in 2011. WMECO’s 2010 distribution segment earnings were $6.6 million lower than 2009 due primarily to higher operating costs including storm restoration costs, employee benefit costs, depreciation and property taxes as well as a net $2.1 million after-tax charge primarily related to uncollectibles expense as a result of the outcome of the distribution rate case decision from the DPU on January 31, 2011. These unfavorable items were partially offset by stronger retail distribution revenues. WMECO’s 2010 retail electric sales were 2.4 percent higher than 2009 due primarily to warmer than normal weather during the summer of 2010. WMECO’s distribution segment regulatory ROE was 4.6 percent in 2010 compared to 8.4 percent in 2009. On January 31, 2011, the DPU authorized a distribution segment regulatory ROE of 9.6 percent as part of its distribution rate case decision. We expect WMECO’s distribution segment regulatory ROE will be approximately 9 percent in 2011. Yankee Gas’ 2010 earnings were $11.7 million higher than 2009 due primarily to lower uncollectibles expenses, higher revenues attributable to a 1.9 percent increase in firm sales as compared to 2009, and lower depreciation expense. Partially offsetting these favorable items were higher employee benefit costs. Yankee Gas’ regulatory ROE was 8.6 percent in 2010 compared to 6.6 percent in 2009. In June 2011 we anticipate the DPUC will issue a decision on Yankee Gas’ request to raise its distribution rates effective July 1, 2011. Yankee Gas’ request includes a recommendation to maintain its authorized regulatory ROE of 10.1 percent. For the distribution segment of our Regulated companies, a summary of changes in CL&P, PSNH and WMECO retail electric GWh sales and Yankee Gas firm natural gas sales for 2010 as compared to 2009 on an actual and weather normalized basis (using a 30-year average) is as follows: Electric Firm Natural Gas CL&P PSNH WMECO Total Yankee Gas
Percentage Increase
Weather Normalized Percentage Decrease
Percentage Increase/
(Decrease)
WeatherNormalizedPercentageIncrease/
(Decrease)
PercentageIncrease/
(Decrease)
WeatherNormalizedPercentageIncrease/
(Decrease)
PercentageIncrease/
(Decrease)
Weather Normalized Percentage Decrease
PercentageIncrease/
(Decrease)
Weather NormalizedPercentage
Increase Residential 3.5% (1.0)% 2.5% (0.5)% 5.1% 1.4% 3.5% (0.7)% (1.2)% 4.9% Commercial 0.1% (3.0)% (0.1)% (3.0)% 1.5% (1.4)% 0.2% (2.8)% 6.6% 12.1% Industrial 1.7% (1.0)% 1.6% (1.9)% (0.6)% (2.4)% 1.3% (1.5)% 0.3% 1.7% Other - - 0.4% 0.4% (19.9)% (19.9)% (1.4)% (1.4)% - - Total 1.8% (1.8)% 1.3% (1.8)% 2.4% (0.6)% 1.7% (1.7)% 1.9% 6.2% A summary of our retail electric sales in GWh for CL&P, PSNH and WMECO and firm natural gas sales in million cubic feet for Yankee Gas for 2010 and 2009 is as follows: Electric Firm Natural Gas
2010 2009
Percentage Increase/
(Decrease) 2010 2009
Percentage Increase/
(Decrease) Residential 14,913 14,412 3.5% 13,403 13,562 (1.2)% Commercial 14,506 14,474 0.2% 14,982 14,063 6.6 % Industrial 4,481 4,423 1.3% 14,866 14,825 0.3 % Other 330 336 (1.4)% - - - Total 34,230 33,645 1.7% 43,251 42,450 1.9 % Actual retail electric sales for all three electric companies were higher in 2010 compared to 2009 due primarily to warmer than normal summer weather and colder than normal weather in December 2010. Residential sales benefitted the most from the favorable impacts of the weather in 2010 and were higher for all three electric companies in 2010 compared to 2009. Cooling degree days in 2010 for Connecticut and Western Massachusetts were 77 percent higher than 2009 and 41 percent above normal. In New Hampshire, cooling degree days in 2010 were 107 percent higher than 2009 and 42 percent above normal. On a weather normalized basis, retail electric sales for all three electric companies were lower in 2010 compared to 2009. We believe the decrease in weather normalized residential sales was due in part to increased conservation efforts by our customers and continuing effects of the weak economy on our customers. The decline in commercial sales in 2010 compared to 2009 can be attributed in part to relatively weak employment growth, higher vacancy rates and uncertainty in consumer confidence. Industrial sales were also lower in 2010 compared to 2009 due to a lack of manufacturing sector hiring although industrial sales benefitted from increased manufacturing hours worked. Our commercial and industrial sales continue to be negatively impacted by additional installation of gas-fired distributed generation and utilization of C&LM programs. Our firm natural gas sales are subject to many of the same influences as our retail electric sales, but have benefitted from a favorable price for natural gas and the addition of gas-fired distributed generation in Yankee Gas’ service territory. Actual firm natural gas sales in 2010 were higher than 2009 despite the milder weather during the first quarter 2010 heating season. Heating degree days in 2010 for Connecticut were 11 percent below 2009 levels and 11 percent below normal levels. Firm natural gas sales benefitted from commercial and industrial customers switching from interruptible service to firm service, additional gas-fired distributed generation, and

31
a large commercial customer who began to take service from Yankee Gas mid-way through the third quarter of 2009 and continued to take service throughout all of 2010. Our expense related to uncollectible receivable balances (our uncollectibles expense) is influenced by the economic conditions of our region. Fluctuations in our uncollectibles expense are mitigated from an earnings perspective because a portion of the total uncollectibles expense for each of the electric distribution companies is allocated for recovery to the respective company's energy supply rate and recovered through its tariffs. Additionally, for CL&P and Yankee Gas, write-offs of uncollectible receivable balances attributable to qualified customers under financial or medical duress (hardship customers) are fully recovered through their respective tariffs. In 2010, our total pre-tax uncollectibles expense that impacts earnings was $23.4 million as compared to $46.5 million in 2009. The improvement in 2010 uncollectibles expense was due in part to continued accounts receivable collection efforts and we expect our 2011 uncollectibles expense to be consistent with 2010. Competitive Businesses: NU Enterprises, which continues to manage to completion Select Energy's remaining wholesale marketing contracts and to manage its electrical contracting business and other operating and maintenance services contracts, earned $8.3 million, or $0.05 per share, in 2010, compared with $15.8 million, or $0.09 per share, in 2009 and $13.1 million, or $0.08 per share, in 2008. In 2010, NU Enterprises recorded $0.7 million of after-tax mark-to-market gains, compared with after-tax mark-to-market gains of $3.8 million in 2009 and $1.1 million in 2008. NU Parent and Other Companies: NU parent and other companies recorded net expenses of $4.4 million, or $0.02 per share, in 2010, compared with net expenses of $9.3 million, or $0.05 per share, in 2009 and net expenses of $41.4 million, or $0.26 per share, in 2008. The 2010 results include a fourth quarter non-recurring benefit of $15.7 million, or $0.09 per share, associated with the settlement of tax issues and a fourth quarter after-tax charge of $9.4 million, or $0.06 per share, associated with expenses related to NU’s proposed merger with NSTAR. Excluding these impacts, 2010 net expenses increased by $1.4 million as compared to 2009 due primarily to a $0.9 million after-tax unfavorable change in the HWP environmental reserve and a $0.6 million net after-tax charge associated with the 2010 Healthcare Act, partially offset by lower interest expense at NU parent. The net expenses in 2008 included a $29.8 million, or $0.19 per share, after-tax charge resulting from the payment of $49.5 million made in March 2008 associated with the settlement of litigation. Future Outlook EPS Guidance: Following is a summary of our projected 2011 EPS by business, which also reconciles consolidated diluted EPS to the non-GAAP financial measure of EPS by business. Non-GAAP EPS by business also excludes a $0.15 per share charge related to expected non-recurring merger costs we will incur relating to financial advisor costs, legal, accounting and consulting fees, which will affect NU parent and other companies' results. 2011 EPS Range (Approximate amounts) Low High Diluted EPS (GAAP) $ 2.10 $ 2.25 Regulated Companies: Distribution Segment $ 1.25 $ 1.35 Transmission Segment 1.05 1.10 Total Regulated Companies 2.30 2.45 NU Parent and Other Companies (0.05) (0.05) Non-GAAP EPS $ 2.25 $ 2.40 Merger-Related Costs (0.15) (0.15) Diluted EPS (GAAP) $ 2.10 $ 2.25 This projection assumes we will operate on a stand-alone basis in 2011, although our proposed merger with NSTAR is expected to close in the second half of 2011. We have included the impacts of the CL&P, PSNH, and WMECO electric distribution rate case decisions received as well as an anticipated reasonable outcome in the Yankee Gas rate case decision expected in June 2011 in the assumptions used to develop our 2011 earnings guidance. The 2011 distribution and transmission earnings guidance reflects the impact of a higher rate base as well as $1.2 billion of projected capital expenditures in 2011. The 2011 distribution segment earnings guidance assumes that total weather-normalized retail electric sales are essentially unchanged from 2010 and weather-normalized firm natural gas sales, excluding special contracts as fluctuations in their usage do not impact earnings, are approximately 4 percent higher than 2010. Offsetting these favorable items are assumed increases in pension costs and certain operation and maintenance costs. In 2010, the NU effective tax rate was 34.8 percent. For 2011, we estimate that the effective tax rate for NU will be approximately 35 percent. Long-Term Growth Rate: We project that we will achieve a compound average annual EPS growth rate for the five-year period from 2011 to 2015 of between 6 percent and 9 percent using 2009 EPS of $1.91 per share as the base level. Assuming completion of our proposed merger with NSTAR in the second half of 2011, we expect to achieve an EPS growth rate at the higher end of the range of 6 percent and 9 percent.
32
Liquidity Consolidated: Cash and cash equivalents totaled $23.4 million as of December 31, 2010, compared with $27 million as of December 31, 2009. NU subsidiaries issued a total of $145 million in long-term debt in 2010. On March 8, 2010, WMECO issued $95 million of senior unsecured notes due March 1, 2020 carrying a coupon rate of 5.1 percent. On April 22, 2010, Yankee Gas issued $50 million of first mortgage bonds through a private placement with a maturity date of April 1, 2020 carrying a coupon rate of 4.87 percent. The proceeds from these financings were used to repay short-term borrowings incurred in the ordinary course of business and to fund ongoing capital investment programs. On April 1, 2010, CL&P remarketed $62 million of tax-exempt PCRBs that were subject to a mandatory tender on April 1, 2010. The PCRBs, which mature on May 1, 2031, carry a coupon rate of 1.4 percent for a one-year period and are subject to a mandatory tender for purchase on April 1, 2011, at which time CL&P expects to remarket them. On November 1, 2010, the DPUC approved CL&P's application requesting authority to issue up to $900 million in long-term debt through 2014. Proceeds will be used to refinance CL&P's short-term debt previously incurred in the ordinary course of business, to finance capital expenditures, to provide working capital and to pay issuance costs. On November 10, 2010, the DPUC approved Yankee Gas’ application to issue up to $300 million in long-term debt through 2014. Proceeds will be used to refinance Yankee Gas’ short-term debt previously incurred in the ordinary course of business, to refinance its Series G first mortgage bonds due in 2014, to finance capital expenditures, to provide working capital and to pay issuance costs. On November 12, 2010, PSNH filed an application with the NHPUC requesting authority to issue securities for the purpose of refinancing certain series of PCRBs totaling $209 million. A public hearing for this application was held February 4, 2011 and a decision is pending. On December 17, 2010, the NHPUC authorized PSNH to issue up to $160 million of long-term debt through 2011. Proceeds will be used to refinance PSNH's short-term debt previously incurred in the ordinary course of business, to finance capital expenditures, to provide working capital and to pay issuance costs. On January 28, 2011, the DPU authorized WMECO to issue up to $330 million in long-term debt through December 31, 2012 to be used to refinance WMECO’s short-term debt previously incurred in the ordinary course of business, to finance capital expenditures, to provide working capital and to pay issuance costs. On September 24, 2010, CL&P, PSNH, WMECO, and Yankee Gas jointly entered into a three-year $400 million unsecured revolving credit facility, which expires on September 24, 2013. This facility replaced a five-year $400 million credit facility on similar terms and conditions that was scheduled to expire on November 6, 2010. CL&P and PSNH are each able to draw up to $300 million under this facility, and WMECO and Yankee Gas are each able to draw up to $200 million, subject to the $400 million maximum aggregate borrowing limit. This total commitment may be increased to $500 million at the request of the borrowers, subject to lender approval. Under this facility, each company can borrow either on a short-term or a long-term basis, subject to regulatory approval. As of December 31, 2010, PSNH had $30 million of short-term borrowings outstanding under this facility, leaving $370 million of aggregate borrowing capacity available. The weighted-average interest rate on these short-term borrowings as of December 31, 2010 was 2.05 percent, which is based on a variable rate plus an applicable margin based on PSNH's credit ratings. On September 24, 2010, NU parent entered into a three-year $500 million unsecured revolving credit facility, which expires on September 24, 2013. This facility replaced a five-year $500 million credit facility on similar terms and conditions that was scheduled to expire on November 6, 2010. Like the previous facility, the new revolving credit facility allows NU parent to borrow up to $500 million at any one time on a short-term or long-term basis and allows for the issuance of LOCs up to $500 million in the aggregate (net of the amount of borrowings then outstanding) on behalf of NU or any of its subsidiaries for periods up to 364 days. This total commitment may be increased to $600 million at the request of NU parent, subject to lender approval. As of December 31, 2010, NU parent had $32.1 million of LOCs issued primarily for the benefit of PSNH and $237 million of short-term borrowings outstanding, leaving $230.9 million of borrowing capacity available. The weighted-average interest rate on these short-term borrowings as of December 31, 2010 was 2.85 percent, which is based on a variable rate plus an applicable margin based on NU parent's credit ratings. Our credit facilities and indentures require that NU parent and certain of its subsidiaries, including CL&P, PSNH and WMECO, comply with certain financial and non-financial covenants as are customarily included in such agreements, including a consolidated debt to total capitalization ratio. As of December 31, 2010, all such companies were in compliance with these covenants. Refer to Note 8, "Short-Term Debt," and Note 9, "Long-Term Debt," to our consolidated financial statements included in this Annual Report on Form 10-K for further discussion of material terms and conditions of these agreements. In 2011, in addition to remarketing the CL&P $62 million PCRBs, we expect to issue approximately $260 million of long-term debt comprised of $160 million by PSNH and $100 million by WMECO in the second half of 2011. We have annual sinking fund requirements of $4.3 million continuing in 2011 through 2012, the mandatory tender of $62 million of tax-exempt PCRBs by CL&P on April 1, 2011, at which time CL&P expects to remarket the bonds in the ordinary course, and no debt maturities until April 1, 2012. In light of the 2010 Tax Act and the related cash flow benefits, we are currently reevaluating the timing of our previously planned NU

33
common equity issuance. If we complete the proposed merger with NSTAR, we would no longer need to undertake the previously planned $300 million NU common equity issuance in 2012 nor issue any additional equity in the foreseeable future. Cash flows provided by operating activities in 2010 totaled $832.6 million, compared with operating cash flows of $745 million in 2009 and $424.1 million in 2008 (all amounts are net of RRB payments, which are included in financing activities on the accompanying consolidated statements of cash flows). The improved cash flows were due primarily to the absence in 2010 of costs incurred at PSNH and WMECO related to the major storm in December 2008 that were paid in the first quarter of 2009, a decrease in Fuel, Materials and Supplies attributable to a $31.8 million reduction in coal inventory levels at the PSNH generation business as ordered by the NHPUC, and increases in amortization on regulatory deferrals primarily attributable to 2009 activity within PSNH’s ES and CL&P’s CTA tracking mechanisms where such costs exceeded revenues resulting in an unfavorable cash flow impact in 2009. Offsetting these favorable cash flow impacts was a $45 million contribution made into our Pension Plan in September 2010. The increase in operating cash flows from 2008 to 2009 was due primarily to higher transmission revenues at CL&P after significant projects were placed in service in late 2008, as well as cost management efforts; a decrease of approximately $225 million related primarily to amounts spent on CL&P's FMCC and GSC, the costs of which are passed on to customers; approximately $100 million less in cash expenditures on Fuel, Materials and Supplies in 2009 due primarily to the lower cost of natural gas being stored by Yankee Gas for the winter heating season; and the absence in 2009 of the litigation settlement payment of $49.5 million made in 2008. Excluding the impact of our proposed merger with NSTAR, we project 2011 cash flows provided by operating activities of approximately $950 million to $1 billion, net of RRB payments. The increase over 2010 is due primarily to the accelerated depreciation provisions of the 2010 Tax Act, which is expected to result in a cash flow benefit of approximately $250 million in 2011, and the impact of the 2010 distribution rate case decisions. Those benefits are partially offset by projected 2011 contributions to our Pension Plan of approximately $145 million. On December 30, 2010, CL&P made its final principal and interest payment on approximately $1.4 billion of RRBs that were issued in 2001. As a result, CL&P will no longer recover any payments from customers associated with these RRBs. A total of $203.2 million of principal and interest payments were made on these RRBs in 2010. The full amortization of these RRBs in 2010 will reduce CL&P’s cash flows provided by operating activities in 2011, compared with previous years, but will have no material impact on CL&P’s operating cash flows net of RRB payments. PSNH and WMECO RRBs do not fully amortize until 2013, therefore the RRBs do not have an impact on their respective operating cash flows in 2011 when compared to 2010. A summary of the current credit ratings and outlooks by Moody's, S&P and Fitch for senior unsecured debt of NU parent and WMECO and senior secured debt of CL&P and PSNH is as follows: Moody's S&P Fitch Current Outlook Current Outlook Current Outlook NU parent Baa2 Stable BBB- Watch-Positive BBB Watch-Positive CL&P A2 Stable BBB+ Watch-Positive A- Stable PSNH A3 Stable BBB+ Watch-Positive BBB+ Stable WMECO Baa2 Stable BBB Watch-Positive BBB+ Stable On October 18, 2010, following the announcement of the proposed merger of NU and NSTAR, Moody's announced that it had reaffirmed the ratings and "stable" outlooks of NU parent, CL&P, PSNH and WMECO, and S&P announced that it had placed NU parent, CL&P, PSNH and WMECO's ratings outlooks on credit watch with "positive" implications. On October 19, 2010, also due to the announcement of the proposed merger, Fitch announced that it had reaffirmed the ratings and "stable" outlooks of CL&P, PSNH and WMECO and placed NU parent's ratings outlook on credit watch with "positive" implications. Assuming completion of the proposed merger with NSTAR, we expect our credit ratings will improve. On January 22, 2010, Fitch downgraded CL&P’s preferred stock rating from BBB to BBB- as a result of revised guidelines for rating preferred stock and hybrid securities in general. If the senior unsecured debt ratings of NU parent were to be reduced to below investment grade level by either Moody's or S&P, a number of Select Energy's supply contracts would require Select Energy to post additional collateral in the form of cash or LOCs. If such an event had occurred as of December 31, 2010, Select Energy would have been required to provide additional cash or LOCs in an aggregate amount of $24 million to various unaffiliated counterparties and additional cash or LOCs in the aggregate amount of $7.4 million to independent system operators. NU parent would have been and remains able to provide that collateral on behalf of Select Energy. If the unsecured debt ratings of PSNH were to be reduced by either Moody's or S&P, certain supply contracts could require PSNH to post additional collateral in the form of cash or LOCs with various unaffiliated counterparties. As of December 31, 2010, if the unsecured debt ratings of PSNH had been reduced by one level or to below investment grade, PSNH had an adequate amount of collateral posted and would not have been required to post additional amounts. We paid common dividends of $180.5 million in 2010, compared with $162.4 million in 2009 and $129.1 million in 2008. The increase reflects a 7.9 percent increase in our common dividend rate that took effect in the first quarter of 2010, as well as a higher number of shares outstanding as a result of the March 2009 issuance of nearly 19 million common shares. On February 8, 2011, our Board of Trustees declared a quarterly common dividend of $0.275 per share, payable on March 31, 2011 to shareholders of record as of
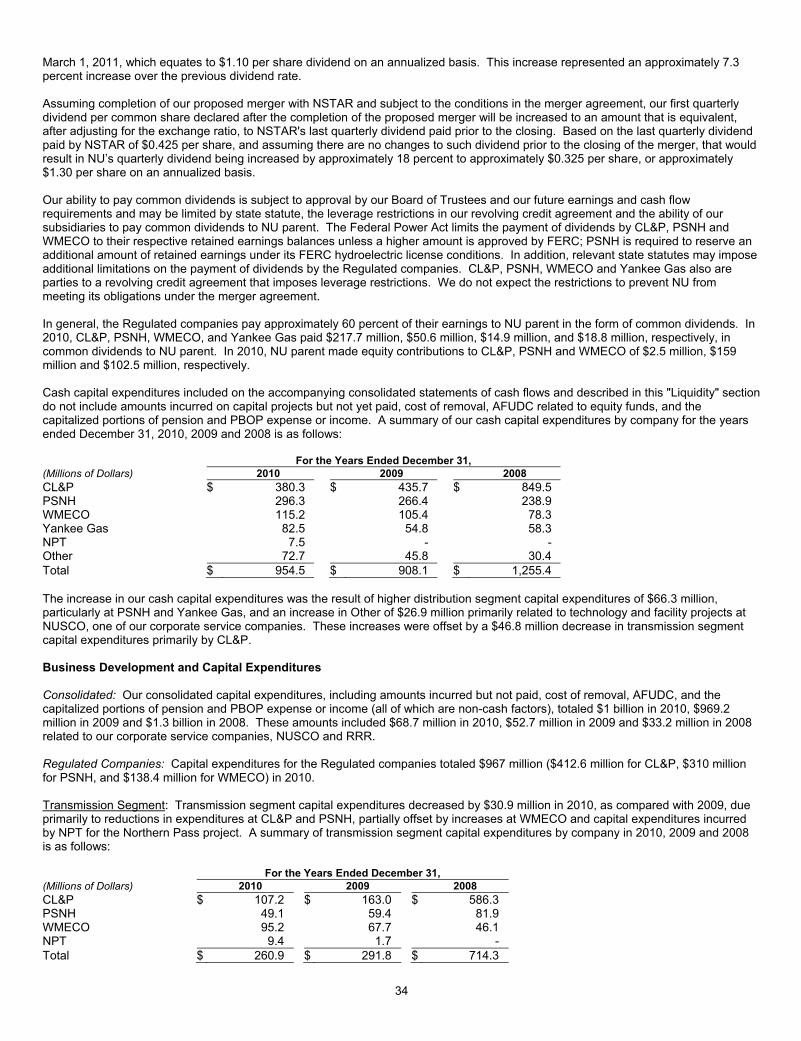
34
March 1, 2011, which equates to $1.10 per share dividend on an annualized basis. This increase represented an approximately 7.3 percent increase over the previous dividend rate. Assuming completion of our proposed merger with NSTAR and subject to the conditions in the merger agreement, our first quarterly dividend per common share declared after the completion of the proposed merger will be increased to an amount that is equivalent, after adjusting for the exchange ratio, to NSTAR's last quarterly dividend paid prior to the closing. Based on the last quarterly dividend paid by NSTAR of $0.425 per share, and assuming there are no changes to such dividend prior to the closing of the merger, that would result in NU’s quarterly dividend being increased by approximately 18 percent to approximately $0.325 per share, or approximately $1.30 per share on an annualized basis. Our ability to pay common dividends is subject to approval by our Board of Trustees and our future earnings and cash flow requirements and may be limited by state statute, the leverage restrictions in our revolving credit agreement and the ability of our subsidiaries to pay common dividends to NU parent. The Federal Power Act limits the payment of dividends by CL&P, PSNH and WMECO to their respective retained earnings balances unless a higher amount is approved by FERC; PSNH is required to reserve an additional amount of retained earnings under its FERC hydroelectric license conditions. In addition, relevant state statutes may impose additional limitations on the payment of dividends by the Regulated companies. CL&P, PSNH, WMECO and Yankee Gas also are parties to a revolving credit agreement that imposes leverage restrictions. We do not expect the restrictions to prevent NU from meeting its obligations under the merger agreement. In general, the Regulated companies pay approximately 60 percent of their earnings to NU parent in the form of common dividends. In 2010, CL&P, PSNH, WMECO, and Yankee Gas paid $217.7 million, $50.6 million, $14.9 million, and $18.8 million, respectively, in common dividends to NU parent. In 2010, NU parent made equity contributions to CL&P, PSNH and WMECO of $2.5 million, $159 million and $102.5 million, respectively. Cash capital expenditures included on the accompanying consolidated statements of cash flows and described in this "Liquidity" section do not include amounts incurred on capital projects but not yet paid, cost of removal, AFUDC related to equity funds, and the capitalized portions of pension and PBOP expense or income. A summary of our cash capital expenditures by company for the years ended December 31, 2010, 2009 and 2008 is as follows: For the Years Ended December 31, (Millions of Dollars) 2010 2009 2008 CL&P $ 380.3 $ 435.7 $ 849.5 PSNH 296.3 266.4 238.9 WMECO 115.2 105.4 78.3 Yankee Gas 82.5 54.8 58.3 NPT 7.5 - - Other 72.7 45.8 30.4 Total $ 954.5 $ 908.1 $ 1,255.4 The increase in our cash capital expenditures was the result of higher distribution segment capital expenditures of $66.3 million, particularly at PSNH and Yankee Gas, and an increase in Other of $26.9 million primarily related to technology and facility projects at NUSCO, one of our corporate service companies. These increases were offset by a $46.8 million decrease in transmission segment capital expenditures primarily by CL&P. Business Development and Capital Expenditures Consolidated: Our consolidated capital expenditures, including amounts incurred but not paid, cost of removal, AFUDC, and the capitalized portions of pension and PBOP expense or income (all of which are non-cash factors), totaled $1 billion in 2010, $969.2 million in 2009 and $1.3 billion in 2008. These amounts included $68.7 million in 2010, $52.7 million in 2009 and $33.2 million in 2008 related to our corporate service companies, NUSCO and RRR. Regulated Companies: Capital expenditures for the Regulated companies totaled $967 million ($412.6 million for CL&P, $310 million for PSNH, and $138.4 million for WMECO) in 2010. Transmission Segment: Transmission segment capital expenditures decreased by $30.9 million in 2010, as compared with 2009, due primarily to reductions in expenditures at CL&P and PSNH, partially offset by increases at WMECO and capital expenditures incurred by NPT for the Northern Pass project. A summary of transmission segment capital expenditures by company in 2010, 2009 and 2008 is as follows: For the Years Ended December 31, (Millions of Dollars) 2010 2009 2008 CL&P $ 107.2 $ 163.0 $ 586.3 PSNH 49.1 59.4 81.9 WMECO 95.2 67.7 46.1 NPT 9.4 1.7 - Total $ 260.9 $ 291.8 $ 714.3

35
CL&P and WMECO have received siting approvals in Connecticut and Massachusetts, respectively, for the first and largest component of our NEEWS project, GSRP, which involves the construction of 115 KV and 345 KV lines from Ludlow, Massachusetts, to Bloomfield, Connecticut. We commenced substation construction in December 2010 and expect to begin overhead line construction in the first half of 2011. We expect the cost of GSRP to be $795 million and to place the project in service in late 2013. In June 2010, residents living near the proposed Connecticut route of the GSRP appealed the CSC approval in New Britain Superior Court, claiming that the CSC acted improperly by approving an overhead route for the line. We do not expect the appeal to have a material impact on the timing of construction. Our second major NEEWS project is the Interstate Reliability Project, which is being designed and built in coordination with National Grid USA. CL&P's share of this project includes an approximately 40-mile, 345 KV all overhead line from Lebanon, Connecticut to the Connecticut-Rhode Island border where it would connect with enhancements National Grid USA is designing in Rhode Island and Massachusetts. In August 2010, ISO-NE reaffirmed the need for the Interstate Reliability Project, which is now expected to be placed in service in late 2015. This in-service date assumes that siting applications are filed in all three states in late 2011, with orders received in mid/late 2013 and construction commencing in late 2013 or early 2014. We expect CL&P's share of the costs of this project to be $301 million. The third major part of NEEWS is the Central Connecticut Reliability Project, which involves construction of a new line from Bloomfield, Connecticut to Watertown, Connecticut. This line would provide another 345 KV all overhead connection to move power across the state of Connecticut. The timing of this project is expected to be twelve months behind the Interstate Reliability Project. We expect the cost of this project to be $338 million. ISO-NE continues to assess the need date for the Central Connecticut Reliability Project and we expect that ISO-NE will conclude its evaluation by mid-2011. Included as part of NEEWS are $84 million of expenditures for associated reliability related projects, all of which have received siting approval and most of which are under construction. The in-service dates for these projects range from later this year through 2013. Since inception of NEEWS through December 31, 2010, CL&P and WMECO have capitalized approximately $105.9 million and $136.9 million, respectively, in costs associated with NEEWS, of which $38.4 million and $62.6 million, respectively, were capitalized in 2010. The total cost estimate for the NEEWS projects is $1.52 billion. As these projects are completed and put in service, actual costs may differ from these estimates. On October 4, 2010, NPT and Hydro Renewable Energy entered into a TSA in connection with the Northern Pass transmission project. Northern Pass is comprised of a planned HVDC transmission line from the U.S./Canadian border to Franklin, New Hampshire and an associated alternating current radial transmission line between Franklin and Deerfield, New Hampshire that will be constructed by NPT. Northern Pass will interconnect at the U.S./Canadian border with a planned HVDC transmission line that HQ TransÉnergie, the transmission division of HQ, will construct in Québec. Consistent with the FERC's February 11, 2011 order accepting without modification the TSA between NPT and Hydro Renewable Energy that was filed on December 15, 2010, NPT will sell to Hydro Renewable Energy 1,200 MW of firm electric transmission rights over the Northern Pass for a 40-year term and charge cost-based rates. The projected cost-of-service calculation includes an ROE of 12.56 percent through the construction phase of the project, and upon commercial operation, the ROE will be equal to the ISO-NE regional rates base ROE (currently 11.14 percent) plus 1.42 percent. The TSA rates will be based on a deemed capital structure for NPT of 50 percent debt and 50 percent equity. During the development and the construction phases under the TSA, NPT will be recording non-cash AFUDC earnings. On October 13, 2010, NPT filed the Northern Pass project design with ISO-NE for technical approval and on October 14, 2010, NPT filed a presidential permit application with the DOE, which seeks permission to construct and maintain facilities that cross the U.S. border and connect to HQ TransÉnergie's facilities in Canada. NPT anticipates filing additional state and federal permit and siting applications in 2011. Assuming timely regulatory review and siting approvals, NPT expects to commence construction of Northern Pass in 2013 and complete the line with power flowing in late 2015. We currently estimate that NU's 75 percent share of the Northern Pass transmission project will be approximately $830 million and NSTAR’s 25 percent share of the Northern Pass transmission project will be approximately $280 million, for a combined total expected cost of approximately $1.1 billion (including capitalized AFUDC). In July 2010, CL&P and UI entered into an agreement providing UI an option to make quarterly payments to CL&P in exchange for ownership of specific Connecticut based NEEWS transmission assets as they come into commercial operation. Under the agreement, which has received approval of the FERC and the DPUC, UI will have the right to invest up to $69 million or an amount equal to 8.4 percent of CL&P's costs for the Connecticut portion of these projects, which are expected to aggregate to approximately $828 million. On December 30, 2010, CL&P received the first of these deposits in the amount of $7.2 million. The impact of the UI transaction is reflected in the 2010 capital expenditures and our five-year capital expenditures and rate base forecasts. On December 17, 2010, CL&P and the Connecticut Transmission Municipal Electric Energy Cooperative (CTMEEC), a non-profit municipal joint action transmission entity formed by several Connecticut municipal electric companies, filed with the DPUC and the FERC a joint application seeking regulatory approval of the transfer of a segment of high voltage transmission lines built by CL&P in the town of Wallingford, Connecticut. FERC approval for the transfer was received on January 31, 2011. The purchase price will be based on the net book value of the assets at the time of the closing of the sale, plus any additional closing adjustments. This segment of lines is projected to have a value of $42.3 million at the anticipated time of closing in May of 2011. CL&P will continue to operate and

36
maintain the lines for CTMEEC. The transaction does not include the transfer of land or equipment not related to electric transmission service. The transaction will not impact our five-year capital plan and is already reflected in CL&P’s transmission rate base forecasts. Distribution Segment: Distribution segment capital expenditures increased by $81.4 million in 2010, as compared with 2009, due to expenditures related primarily to the PSNH Clean Air Project, the WMECO solar generation project, and the Yankee Gas WWL Project. A summary of distribution segment capital expenditures by company for 2010, 2009 and 2008 is as follows: For the Years Ended December 31, (Millions of Dollars) 2010 2009 2008 CL&P: Basic business $ 126.2 $ 104.6 $ 114.7 Aging infrastructure 104.0 104.1 95.4 Load growth 75.2 74.3 86.5 Total CL&P 305.4 283.0 296.6 PSNH: Basic business 41.2 55.5 41.6 Aging infrastructure 19.5 17.8 19.6 Load growth 23.1 25.5 37.0 Total PSNH 83.8 98.8 98.2 WMECO: Basic business 17.5 21.5 18.1 Aging infrastructure 10.5 12.2 12.9 Load growth 5.1 4.0 6.8 Total WMECO 33.1 37.7 37.8 Totals - Electric Distribution (excluding Generation) 422.3 419.5 432.6 Yankee Gas 94.6 59.6 44.0 Other 2.0 0.6 0.5 Total Distribution 518.9 479.7 477.1 PSNH Generation: Clean air project 149.7 119.3 24.8 Other 27.4 25.7 49.2 Total PSNH Generation 177.1 145.0 74.0 WMECO Generation 10.1 - - Total Distribution Segment $ 706.1 $ 624.7 $ 551.1 For the electric distribution business, basic business includes the relocation of plant, the purchase of meters, tools, vehicles, and information technology. Aging infrastructure relates to the planned replacement of overhead lines, plant substations, transformer replacements, and underground cable replacement. Load growth includes requests for new business and capacity additions on distribution lines and substation overloads. For the natural gas business, basic business includes the relocation of conflicting natural gas facilities due to municipal and state road work and the purchase of meters, tools, and information technology. Aging infrastructure relates to the planned replacement of natural gas facilities. Load growth includes requests for new natural gas service, new service mains and new distributed generation service. PSNH's Clean Air Project is a wet scrubber project under construction at its Merrimack coal station, the cost of which will be recovered through PSNH's ES rates under New Hampshire law. Construction costs are running below their previously announced cost of $457 million and the project is expected to be completed in mid-2012, about a year ahead of schedule. We currently expect the project to cost approximately $430 million, including capitalized interest and equity returns. Since inception of the project, PSNH has capitalized $296.5 million associated with this project, of which $149.7 million was capitalized in 2010. Construction of the project was approximately 80 percent complete as of December 31, 2010. On August 12, 2009, the DPU approved a stipulation agreement between WMECO and the Massachusetts Attorney General concerning WMECO's proposal, under the Massachusetts Green Communities Act, to install 6 MW of solar energy generation in its service territory at an estimated cost of $41 million by the end of 2012. In October 2010, WMECO completed construction of a 1.8 MW solar generation facility on a site in Pittsfield, Massachusetts. The full cost of this project was approximately $9.4 million, all of which WMECO has capitalized as of December 31, 2010. On January 17, 2011, WMECO announced its plans to develop a second project on a site in Springfield, Massachusetts. WMECO believes this site is capable of accommodating a 4.2 MW solar generation facility. The major permitting and procurement activities for this project are underway and, assuming their favorable and timely completion, WMECO would expect to begin construction during the second quarter of 2011. In April 2010, Yankee Gas commenced construction of its WWL Project, a 16-mile natural gas pipeline between Waterbury and Wallingford, Connecticut and the increase of vaporization output of its LNG plant. The project is now expected to cost $57.6 million, down from our previously announced cost of approximately $63 million. Construction during 2010, which cost $26.6 million, included the completion of Phase I, a seven-mile segment of pipeline connecting the Cheshire and Wallingford distribution systems, and four miles of Phase II. The remainder of the Phase II pipeline construction (approximately five miles) and the expansion of the vaporization capacity of the LNG facility are expected to be completed by the fourth quarter of 2011. Construction of the project was 46 percent complete as of December 31, 2010 and is currently on schedule.
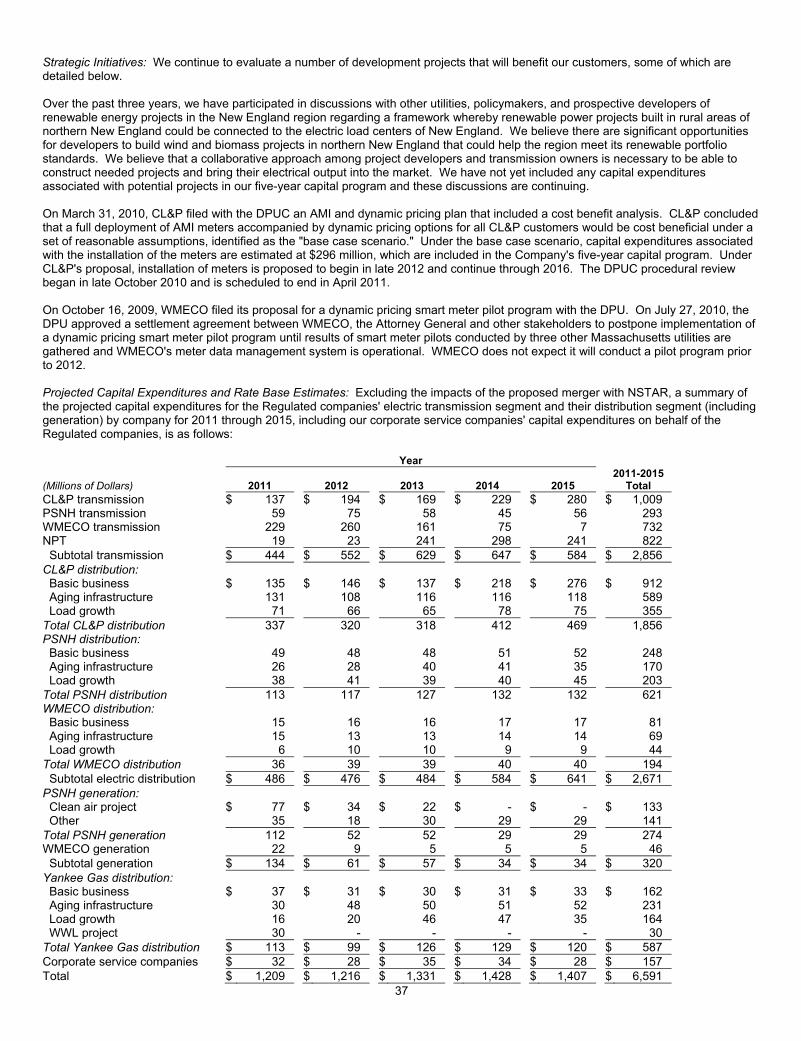
37
Strategic Initiatives: We continue to evaluate a number of development projects that will benefit our customers, some of which are detailed below. Over the past three years, we have participated in discussions with other utilities, policymakers, and prospective developers of renewable energy projects in the New England region regarding a framework whereby renewable power projects built in rural areas of northern New England could be connected to the electric load centers of New England. We believe there are significant opportunities for developers to build wind and biomass projects in northern New England that could help the region meet its renewable portfolio standards. We believe that a collaborative approach among project developers and transmission owners is necessary to be able to construct needed projects and bring their electrical output into the market. We have not yet included any capital expenditures associated with potential projects in our five-year capital program and these discussions are continuing. On March 31, 2010, CL&P filed with the DPUC an AMI and dynamic pricing plan that included a cost benefit analysis. CL&P concluded that a full deployment of AMI meters accompanied by dynamic pricing options for all CL&P customers would be cost beneficial under a set of reasonable assumptions, identified as the "base case scenario." Under the base case scenario, capital expenditures associated with the installation of the meters are estimated at $296 million, which are included in the Company's five-year capital program. Under CL&P's proposal, installation of meters is proposed to begin in late 2012 and continue through 2016. The DPUC procedural review began in late October 2010 and is scheduled to end in April 2011. On October 16, 2009, WMECO filed its proposal for a dynamic pricing smart meter pilot program with the DPU. On July 27, 2010, the DPU approved a settlement agreement between WMECO, the Attorney General and other stakeholders to postpone implementation of a dynamic pricing smart meter pilot program until results of smart meter pilots conducted by three other Massachusetts utilities are gathered and WMECO's meter data management system is operational. WMECO does not expect it will conduct a pilot program prior to 2012. Projected Capital Expenditures and Rate Base Estimates: Excluding the impacts of the proposed merger with NSTAR, a summary of the projected capital expenditures for the Regulated companies' electric transmission segment and their distribution segment (including generation) by company for 2011 through 2015, including our corporate service companies' capital expenditures on behalf of the Regulated companies, is as follows: Year
(Millions of Dollars) 2011 2012 2013 2014 2015 2011-2015
Total CL&P transmission $ 137 $ 194 $ 169 $ 229 $ 280 $ 1,009 PSNH transmission 59 75 58 45 56 293 WMECO transmission 229 260 161 75 7 732 NPT 19 23 241 298 241 822 Subtotal transmission $ 444 $ 552 $ 629 $ 647 $ 584 $ 2,856 CL&P distribution: Basic business $ 135 $ 146 $ 137 $ 218 $ 276 $ 912 Aging infrastructure 131 108 116 116 118 589 Load growth 71 66 65 78 75 355 Total CL&P distribution 337 320 318 412 469 1,856 PSNH distribution: Basic business 49 48 48 51 52 248 Aging infrastructure 26 28 40 41 35 170 Load growth 38 41 39 40 45 203 Total PSNH distribution 113 117 127 132 132 621 WMECO distribution: Basic business 15 16 16 17 17 81 Aging infrastructure 15 13 13 14 14 69 Load growth 6 10 10 9 9 44 Total WMECO distribution 36 39 39 40 40 194 Subtotal electric distribution $ 486 $ 476 $ 484 $ 584 $ 641 $ 2,671 PSNH generation: Clean air project $ 77 $ 34 $ 22 $ - $ - $ 133 Other 35 18 30 29 29 141 Total PSNH generation 112 52 52 29 29 274 WMECO generation 22 9 5 5 5 46 Subtotal generation $ 134 $ 61 $ 57 $ 34 $ 34 $ 320 Yankee Gas distribution: Basic business $ 37 $ 31 $ 30 $ 31 $ 33 $ 162 Aging infrastructure 30 48 50 51 52 231 Load growth 16 20 46 47 35 164 WWL project 30 - - - - 30 Total Yankee Gas distribution $ 113 $ 99 $ 126 $ 129 $ 120 $ 587 Corporate service companies $ 32 $ 28 $ 35 $ 34 $ 28 $ 157 Total $ 1,209 $ 1,216 $ 1,331 $ 1,428 $ 1,407 $ 6,591

38
Yankee Gas determines the amount of capital spending by category based on business needs and opportunities. Future capital spending will likely be affected by price differences between the cost of natural gas with respect to home heating oil, natural gas supply, new home construction, road reconstruction, regulatory mandates and business requirements. Actual capital expenditures could vary from the projected amounts for the companies and periods above. Economic conditions in the northeast could impact the timing of our major transmission projects. Most of these capital investment projections, including those for NPT, assume timely regulatory approval, which in most cases requires extensive review. Delays in or denials of those approvals could reduce the levels of expenditures, associated rate base, and anticipated EPS growth. Based on the 2010 actual and 2011 through 2015 projected capital expenditures, the 2010 actual and 2011 through 2015 projected transmission, distribution and generation rate base as of December 31 of each year are as follows:
Year (Millions of Dollars) 2010 2011 2012 2013 2014 2015 CL&P transmission $ 2,149 $ 2,114 $ 2,178 $ 2,234 $ 2,394 $ 2,552 PSNH transmission 341 360 406 406 505 540 WMECO transmission 269 459 650 730 834 803 NPT - - - - - 830 Total transmission 2,759 2,933 3,234 3,370 3,733 4,725 CL&P distribution 2,273 2,382 2,540 2,736 3,007 3,297 PSNH distribution 803 866 947 1,006 1,070 1,143 WMECO distribution 412 422 425 429 439 453 Total electric distribution 3,488 3,670 3,912 4,171 4,516 4,893 PSNH generation 394 399 727 742 740 728 WMECO generation 11 27 31 31 33 35 Total generation 405 426 758 773 773 763 Yankee Gas distribution 682 743 756 790 847 969 Total $ 7,334 $ 7,772 $ 8,660 $ 9,104 $ 9,869 $ 11,350 Transmission Rate Matters and FERC Regulatory Issues CL&P, PSNH and WMECO and most other New England utilities, generation owners and marketers are parties to a series of agreements that provide for coordinated planning and operation of the region's generation and transmission facilities and the rules by which these parties participate in the wholesale markets and acquire transmission services. Under these arrangements, ISO-NE, a non-profit corporation whose board of directors and staff are independent from all market participants, has served as the RTO for New England since February 1, 2005. ISO-NE works to ensure the reliability of the New England transmission system, administers the independent system operator tariff, subject to FERC approval, oversees the efficient and competitive functioning of the regional wholesale power market and determines the portion of the costs of our major transmission facilities that are regionalized throughout New England. Transmission - Wholesale Rates: NU's transmission rates recover total transmission revenue requirements, ensuring that we recover all regional and local revenue requirements. These rates provide for annual true-ups to actual costs. The financial impacts of differences between actual and projected costs are deferred for future recovery from, or refund to, customers. As of December 31, 2010, NU was in a total overrecovery position of $40.9 million ($37.2 million for CL&P, $3 million for PSNH, and $0.7 million for WMECO), which will be refunded to customers in June 2011. Pursuant to a series of orders involving the ROE for regionally planned New England transmission projects, the FERC set the base ROE at 11.14 percent and approved incentives that increased the ROE to 12.64 percent for those projects that were in-service by the end of 2008. In addition, certain projects were granted additional ROE incentives by FERC under its transmission incentive policy. As a result, CL&P earns between 12.64 percent and 13.1 percent on its major transmission projects. All appeals of FERC's orders on the ROE for New England transmission owners have been denied. NEEWS Incentives: On November 17, 2008, the FERC issued an order granting incentives and rate amendments to us and National Grid USA for the NEEWS projects. The approved incentives included (1) an ROE of 12.89 percent, representing an incentive of 125 basis points; (2) 100 percent inclusion of CWIP in rate base; and (3) full recovery of prudently incurred costs if NEEWS, or any portion thereof, is cancelled as a result of factors beyond NU's or National Grid USA's control. Several parties have sought rehearing of this yet to be acted upon FERC order. Legislative Matters 2010 Federal Legislation: On March 23, 2010, President Obama signed into law the 2010 Healthcare Act. The 2010 Healthcare Act was amended by a Reconciliation Bill signed into law on March 30, 2010. The 2010 Healthcare Act includes a provision that eliminated the tax deductibility of certain PBOP contributions equal to the amount of the federal subsidy received by companies like NU, which sponsor retiree health care benefit plans with a prescription drug benefit that is actuarially equivalent to Medicare Part D. The tax deduction eliminated by this legislation represented a loss of previously recognized deferred income tax assets established through 2009 and as a result, these assets were written down by approximately $18 million in the first quarter of 2010. Since the electric and

39
natural gas distribution companies are cost-of-service and rate-regulated, a portion of the $18 million was able to be deferred and recovered through future rates. For the year ended December 31, 2010, NU deferred approximately $15 million of recoverable write-offs related to these businesses and reduced 2010 earnings on a net basis by approximately $3 million of non-recoverable costs. In addition, as a result of the elimination of the tax deduction in 2010, NU was not able to recognize approximately $2 million of net annual benefits. On September 27, 2010, President Obama signed into law the Small Business Jobs and Credit Act of 2010, which extends the bonus depreciation provisions of the American Recovery and Reinvestment Act of 2009 to small and large businesses through 2010. This extended stimulus provided NU with cash flow benefits of approximately $100 million. On December 17, 2010, President Obama signed into law the 2010 Tax Act, which, among other things, provides 100 percent bonus depreciation for tangible personal property placed in service after September 8, 2010, and through December 31, 2011. For tangible personal property placed in service after December 31, 2011, and through December 31, 2012, the 2010 Tax Act provides for 50 percent bonus depreciation. We expect the 2010 Tax Act to provide NU with cash flow benefits of approximately $250 million in 2011 and approximately $450 million to $550 million over the period 2011 through 2013. 2010 Connecticut Legislation: In May 2010, the Connecticut Legislature approved a state budget for the 2010-2011 fiscal year, which calls for the issuance by the state of Connecticut of up to $760 million of economic recovery revenue bonds that would be amortized over eight years. These bonds will be repaid through a charge on the bills of customers of CL&P and other Connecticut electric distribution companies. For CL&P, the revenue to pay interest and principal on the bonds would come from a continuation of a portion of its CTA, which would have otherwise ended by December 31, 2010 with the final principal and interest payment on its RRBs, and the diversion of about one-third of the annual funding for C&LM programs beginning in April 2012. On September 29, 2010, the DPUC approved a financing order for the bonds. A lawsuit filed by a state senator against the DPUC could delay the issuance. By order dated December 21, 2010, the trial court dismissed the state senator’s suit on jurisdictional grounds, and the state senator promptly appealed that order to the Connecticut Appellate Court. The DPUC has requested that the case be transferred to the Connecticut Supreme Court and decided on an expedited schedule. In addition, several bills have been introduced by the state senator and other state lawmakers to rescind the law authorizing these bonds. Unlike the RRBs issued in 2001, the revenues, interest expense and amortization expense associated with these bonds, should they be issued, will not be reflected on CL&P’s financial statements. Regulatory Developments and Rate Matters Connecticut - CL&P: Distribution Rates: On January 8, 2010, CL&P filed an application with the DPUC to raise distribution rates by $133.4 million (later revised to $129 million) to be effective July 1, 2010 and by an additional $44.2 million (later revised to $41.4 million) to be effective July 1, 2011. On June 30, 2010, the DPUC issued a final order in the distribution rate case, which approved annualized rate increases of $63.4 million effective July 1, 2010 and an additional $38.5 million effective July 1, 2011. The 2010 increase was deferred from customer bills until January 1, 2011 to coincide with the decline in revenue requirements associated with the amortization of the aforementioned CL&P RRBs, which more than offset the revenue requirements associated with the January 1, 2011 distribution rate increase. While CL&P’s earnings benefitted in the second half of 2010 from the rate decision as a result of declines in depreciation and maintenance expense, cash flow benefits will not begin until early 2011 when customer bills begin to reflect an approximately $110 million increase in distribution rates. That $110 million increase reflects the two distribution rate increases and the recovery of approximately $32 million in maintenance expense that was deferred for recovery from the second half of 2010 to 2011 and the first half of 2012. In its decision, the DPUC also maintained CL&P’s authorized distribution segment regulatory ROE of 9.4 percent. Standard Service and Last Resort Service Rates: CL&P's residential and small commercial customers who do not choose competitive suppliers are served under SS rates, and large commercial and industrial customers who do not choose competitive suppliers are served under LRS rates. CL&P is fully recovering from customers the costs of its SS and LRS services. Effective January 1, 2011, the DPUC approved a decrease to CL&P’s total average SS rate of approximately 7.8 percent and a slight increase to CL&P’s total average LRS rate of approximately 0.8 percent. The energy supply portion of the total average SS rate decreased from 11.282 cents per KWh to 9.732 cents per KWh while the energy supply portion of the total average LRS rate increased from 7.062 cents per KWh to 7.193 cents per KWh. CTA and SBC Reconciliation: On March 31, 2010, CL&P filed with the DPUC its 2009 CTA and SBC reconciliation, which compared CTA and SBC revenues charged to customers to revenue requirements and allows for full recovery of revenue requirements. For the 12 months ended December 31, 2009, total CTA revenue requirements exceeded CTA revenues by $46.9 million. For the 12 months ended December 31, 2009, the SBC revenues exceeded SBC revenue requirements by $23.7 million. On November 10, 2010, a decision in the 2009 CTA and SBC docket was issued approving the 2009 CTA and SBC reconciliations as filed. The decision stated that the CTA and SBC rates would need to be reset effective January 1, 2011 based on current projections. On December 22, 2010, the DPUC approved new CTA and SBC rates, effective January 1, 2011, using updated information provided by CL&P. Based on that updated information, the CTA rate decreased from 1.054 cents per KWh to 0.332 cents per KWh and the SBC rate decreased from 0.207 cents per KWh to 0.037 cents per KWh. FMCC Filing: On February 5, 2010, CL&P filed with the DPUC its semi-annual filing, which reconciled actual FMCC revenues and charges and GSC revenues and expenses, for the period July 1, 2009 through December 31, 2009, and also included the previously filed revenues and expenses for the January 1, 2009 through June 30, 2009 period. The filing identified a total net underrecovery of
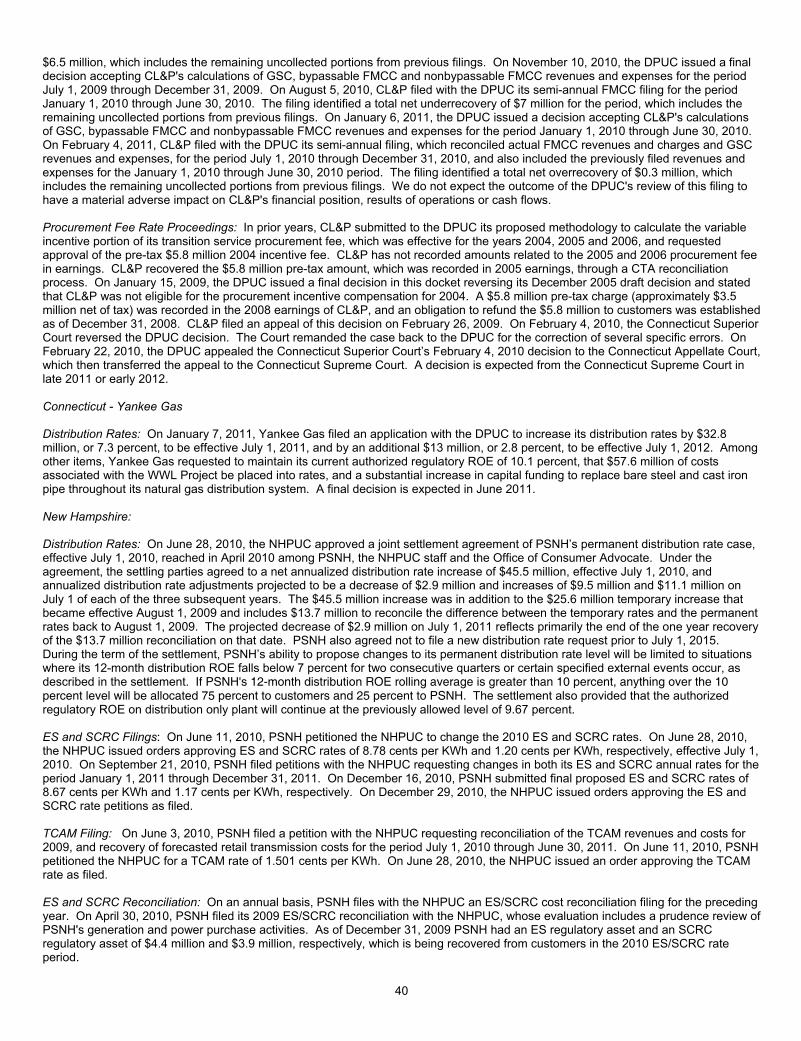
40
$6.5 million, which includes the remaining uncollected portions from previous filings. On November 10, 2010, the DPUC issued a final decision accepting CL&P's calculations of GSC, bypassable FMCC and nonbypassable FMCC revenues and expenses for the period July 1, 2009 through December 31, 2009. On August 5, 2010, CL&P filed with the DPUC its semi-annual FMCC filing for the period January 1, 2010 through June 30, 2010. The filing identified a total net underrecovery of $7 million for the period, which includes the remaining uncollected portions from previous filings. On January 6, 2011, the DPUC issued a decision accepting CL&P's calculations of GSC, bypassable FMCC and nonbypassable FMCC revenues and expenses for the period January 1, 2010 through June 30, 2010. On February 4, 2011, CL&P filed with the DPUC its semi-annual filing, which reconciled actual FMCC revenues and charges and GSC revenues and expenses, for the period July 1, 2010 through December 31, 2010, and also included the previously filed revenues and expenses for the January 1, 2010 through June 30, 2010 period. The filing identified a total net overrecovery of $0.3 million, which includes the remaining uncollected portions from previous filings. We do not expect the outcome of the DPUC's review of this filing to have a material adverse impact on CL&P's financial position, results of operations or cash flows. Procurement Fee Rate Proceedings: In prior years, CL&P submitted to the DPUC its proposed methodology to calculate the variable incentive portion of its transition service procurement fee, which was effective for the years 2004, 2005 and 2006, and requested approval of the pre-tax $5.8 million 2004 incentive fee. CL&P has not recorded amounts related to the 2005 and 2006 procurement fee in earnings. CL&P recovered the $5.8 million pre-tax amount, which was recorded in 2005 earnings, through a CTA reconciliation process. On January 15, 2009, the DPUC issued a final decision in this docket reversing its December 2005 draft decision and stated that CL&P was not eligible for the procurement incentive compensation for 2004. A $5.8 million pre-tax charge (approximately $3.5 million net of tax) was recorded in the 2008 earnings of CL&P, and an obligation to refund the $5.8 million to customers was established as of December 31, 2008. CL&P filed an appeal of this decision on February 26, 2009. On February 4, 2010, the Connecticut Superior Court reversed the DPUC decision. The Court remanded the case back to the DPUC for the correction of several specific errors. On February 22, 2010, the DPUC appealed the Connecticut Superior Court’s February 4, 2010 decision to the Connecticut Appellate Court, which then transferred the appeal to the Connecticut Supreme Court. A decision is expected from the Connecticut Supreme Court in late 2011 or early 2012. Connecticut - Yankee Gas Distribution Rates: On January 7, 2011, Yankee Gas filed an application with the DPUC to increase its distribution rates by $32.8 million, or 7.3 percent, to be effective July 1, 2011, and by an additional $13 million, or 2.8 percent, to be effective July 1, 2012. Among other items, Yankee Gas requested to maintain its current authorized regulatory ROE of 10.1 percent, that $57.6 million of costs associated with the WWL Project be placed into rates, and a substantial increase in capital funding to replace bare steel and cast iron pipe throughout its natural gas distribution system. A final decision is expected in June 2011. New Hampshire: Distribution Rates: On June 28, 2010, the NHPUC approved a joint settlement agreement of PSNH’s permanent distribution rate case, effective July 1, 2010, reached in April 2010 among PSNH, the NHPUC staff and the Office of Consumer Advocate. Under the agreement, the settling parties agreed to a net annualized distribution rate increase of $45.5 million, effective July 1, 2010, and annualized distribution rate adjustments projected to be a decrease of $2.9 million and increases of $9.5 million and $11.1 million on July 1 of each of the three subsequent years. The $45.5 million increase was in addition to the $25.6 million temporary increase that became effective August 1, 2009 and includes $13.7 million to reconcile the difference between the temporary rates and the permanent rates back to August 1, 2009. The projected decrease of $2.9 million on July 1, 2011 reflects primarily the end of the one year recovery of the $13.7 million reconciliation on that date. PSNH also agreed not to file a new distribution rate request prior to July 1, 2015. During the term of the settlement, PSNH’s ability to propose changes to its permanent distribution rate level will be limited to situations where its 12-month distribution ROE falls below 7 percent for two consecutive quarters or certain specified external events occur, as described in the settlement. If PSNH's 12-month distribution ROE rolling average is greater than 10 percent, anything over the 10 percent level will be allocated 75 percent to customers and 25 percent to PSNH. The settlement also provided that the authorized regulatory ROE on distribution only plant will continue at the previously allowed level of 9.67 percent. ES and SCRC Filings: On June 11, 2010, PSNH petitioned the NHPUC to change the 2010 ES and SCRC rates. On June 28, 2010, the NHPUC issued orders approving ES and SCRC rates of 8.78 cents per KWh and 1.20 cents per KWh, respectively, effective July 1, 2010. On September 21, 2010, PSNH filed petitions with the NHPUC requesting changes in both its ES and SCRC annual rates for the period January 1, 2011 through December 31, 2011. On December 16, 2010, PSNH submitted final proposed ES and SCRC rates of 8.67 cents per KWh and 1.17 cents per KWh, respectively. On December 29, 2010, the NHPUC issued orders approving the ES and SCRC rate petitions as filed. TCAM Filing: On June 3, 2010, PSNH filed a petition with the NHPUC requesting reconciliation of the TCAM revenues and costs for 2009, and recovery of forecasted retail transmission costs for the period July 1, 2010 through June 30, 2011. On June 11, 2010, PSNH petitioned the NHPUC for a TCAM rate of 1.501 cents per KWh. On June 28, 2010, the NHPUC issued an order approving the TCAM rate as filed. ES and SCRC Reconciliation: On an annual basis, PSNH files with the NHPUC an ES/SCRC cost reconciliation filing for the preceding year. On April 30, 2010, PSNH filed its 2009 ES/SCRC reconciliation with the NHPUC, whose evaluation includes a prudence review of PSNH's generation and power purchase activities. As of December 31, 2009 PSNH had an ES regulatory asset and an SCRC regulatory asset of $4.4 million and $3.9 million, respectively, which is being recovered from customers in the 2010 ES/SCRC rate period.
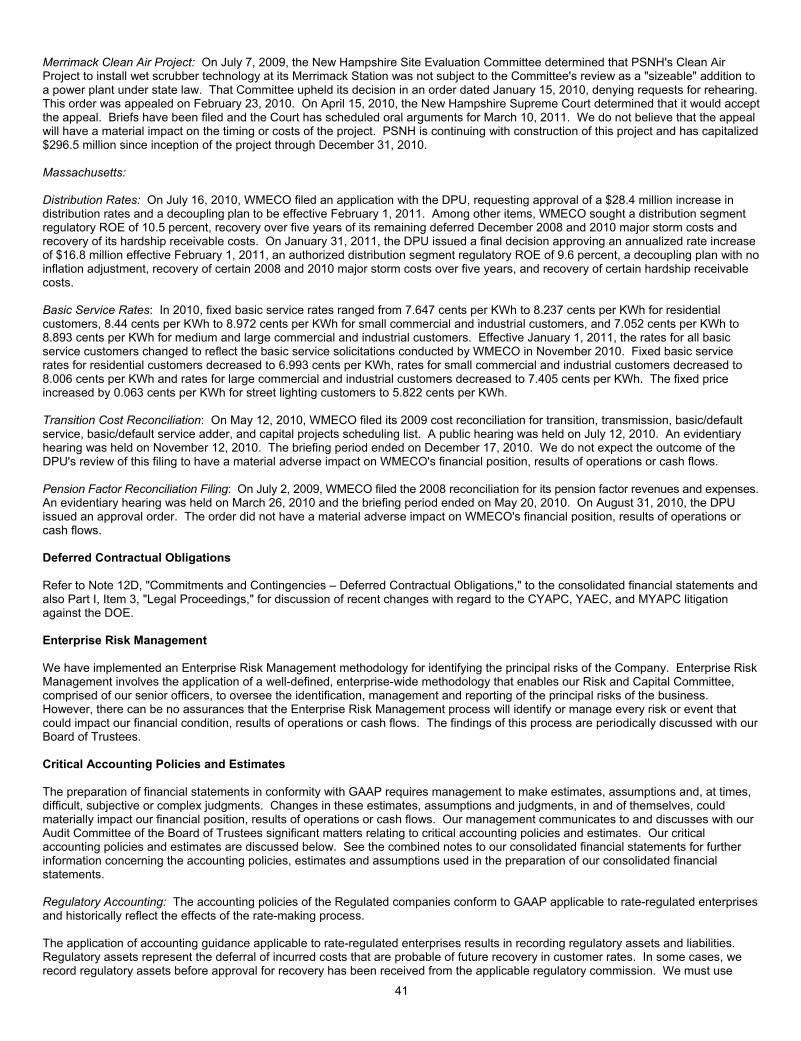
41
Merrimack Clean Air Project: On July 7, 2009, the New Hampshire Site Evaluation Committee determined that PSNH's Clean Air Project to install wet scrubber technology at its Merrimack Station was not subject to the Committee's review as a "sizeable" addition to a power plant under state law. That Committee upheld its decision in an order dated January 15, 2010, denying requests for rehearing. This order was appealed on February 23, 2010. On April 15, 2010, the New Hampshire Supreme Court determined that it would accept the appeal. Briefs have been filed and the Court has scheduled oral arguments for March 10, 2011. We do not believe that the appeal will have a material impact on the timing or costs of the project. PSNH is continuing with construction of this project and has capitalized $296.5 million since inception of the project through December 31, 2010. Massachusetts: Distribution Rates: On July 16, 2010, WMECO filed an application with the DPU, requesting approval of a $28.4 million increase in distribution rates and a decoupling plan to be effective February 1, 2011. Among other items, WMECO sought a distribution segment regulatory ROE of 10.5 percent, recovery over five years of its remaining deferred December 2008 and 2010 major storm costs and recovery of its hardship receivable costs. On January 31, 2011, the DPU issued a final decision approving an annualized rate increase of $16.8 million effective February 1, 2011, an authorized distribution segment regulatory ROE of 9.6 percent, a decoupling plan with no inflation adjustment, recovery of certain 2008 and 2010 major storm costs over five years, and recovery of certain hardship receivable costs. Basic Service Rates: In 2010, fixed basic service rates ranged from 7.647 cents per KWh to 8.237 cents per KWh for residential customers, 8.44 cents per KWh to 8.972 cents per KWh for small commercial and industrial customers, and 7.052 cents per KWh to 8.893 cents per KWh for medium and large commercial and industrial customers. Effective January 1, 2011, the rates for all basic service customers changed to reflect the basic service solicitations conducted by WMECO in November 2010. Fixed basic service rates for residential customers decreased to 6.993 cents per KWh, rates for small commercial and industrial customers decreased to 8.006 cents per KWh and rates for large commercial and industrial customers decreased to 7.405 cents per KWh. The fixed price increased by 0.063 cents per KWh for street lighting customers to 5.822 cents per KWh. Transition Cost Reconciliation: On May 12, 2010, WMECO filed its 2009 cost reconciliation for transition, transmission, basic/default service, basic/default service adder, and capital projects scheduling list. A public hearing was held on July 12, 2010. An evidentiary hearing was held on November 12, 2010. The briefing period ended on December 17, 2010. We do not expect the outcome of the DPU's review of this filing to have a material adverse impact on WMECO's financial position, results of operations or cash flows. Pension Factor Reconciliation Filing: On July 2, 2009, WMECO filed the 2008 reconciliation for its pension factor revenues and expenses. An evidentiary hearing was held on March 26, 2010 and the briefing period ended on May 20, 2010. On August 31, 2010, the DPU issued an approval order. The order did not have a material adverse impact on WMECO's financial position, results of operations or cash flows. Deferred Contractual Obligations Refer to Note 12D, "Commitments and Contingencies – Deferred Contractual Obligations," to the consolidated financial statements and also Part I, Item 3, "Legal Proceedings," for discussion of recent changes with regard to the CYAPC, YAEC, and MYAPC litigation against the DOE. Enterprise Risk Management We have implemented an Enterprise Risk Management methodology for identifying the principal risks of the Company. Enterprise Risk Management involves the application of a well-defined, enterprise-wide methodology that enables our Risk and Capital Committee, comprised of our senior officers, to oversee the identification, management and reporting of the principal risks of the business. However, there can be no assurances that the Enterprise Risk Management process will identify or manage every risk or event that could impact our financial condition, results of operations or cash flows. The findings of this process are periodically discussed with our Board of Trustees. Critical Accounting Policies and Estimates The preparation of financial statements in conformity with GAAP requires management to make estimates, assumptions and, at times, difficult, subjective or complex judgments. Changes in these estimates, assumptions and judgments, in and of themselves, could materially impact our financial position, results of operations or cash flows. Our management communicates to and discusses with our Audit Committee of the Board of Trustees significant matters relating to critical accounting policies and estimates. Our critical accounting policies and estimates are discussed below. See the combined notes to our consolidated financial statements for further information concerning the accounting policies, estimates and assumptions used in the preparation of our consolidated financial statements. Regulatory Accounting: The accounting policies of the Regulated companies conform to GAAP applicable to rate-regulated enterprises and historically reflect the effects of the rate-making process. The application of accounting guidance applicable to rate-regulated enterprises results in recording regulatory assets and liabilities. Regulatory assets represent the deferral of incurred costs that are probable of future recovery in customer rates. In some cases, we record regulatory assets before approval for recovery has been received from the applicable regulatory commission. We must use

42
judgment to conclude that costs deferred as regulatory assets are probable of future recovery. We base our conclusion on certain factors, including, but not limited to, regulatory precedent. Regulatory liabilities represent revenues received from customers to fund expected costs that have not yet been incurred or probable future refunds to customers. We use our best judgment when recording regulatory assets and liabilities; however, regulatory commissions can reach different conclusions about the recovery of costs, and those conclusions could have a material impact on our consolidated financial statements. We believe it is probable that the Regulated companies will recover the regulatory assets that have been recorded. If we determined that we could no longer apply the accounting guidance applicable to rate-regulated enterprises to our operations, or if we could not conclude that it is probable that costs would be recovered or reflected in future rates, the costs would be charged to earnings in the period in which they were incurred. If we determine that a regulatory asset is no longer probable of recovery in rates, then we would record the charge in earnings at that time. For further information, see Note 2, "Regulatory Accounting," to the consolidated financial statements. Unbilled Revenues: The determination of retail energy sales to residential, commercial and industrial customers is based on the reading of meters, which occurs on a systematic basis throughout the month. Billed revenues are based on these meter readings and the majority of recorded revenues is based on actual billings. At the end of each month, amounts of energy delivered to customers since the date of the last meter reading are estimated, and an estimated amount of unbilled revenues is recorded. Unbilled revenues represent an estimate of electricity or natural gas delivered to customers but not yet billed. Unbilled revenues are included in Operating Revenues on the statement of income and are assets on the balance sheet that are reclassified to Accounts Receivable in the following month as customers are billed. Such estimates are subject to adjustment when actual meter readings become available, when changes in estimating methodology occur and under other circumstances. There were no changes in estimating methodology in 2010. The Regulated companies estimate unbilled revenues monthly using the daily load cycle (DLC) method. The DLC method allocates billed sales to the current calendar month based on the daily load for each billing cycle. The billed sales are subtracted from total calendar month sales to estimate unbilled sales. Unbilled revenues are estimated by first allocating sales to the respective rate classes and then applying an average rate to the estimate of unbilled sales. The estimate of unbilled revenues is sensitive to numerous factors, such as energy demands, weather and changes in the composition of customer classes, that can significantly impact the amount of revenues recorded. For further information, see Note 1M, "Summary of Significant Accounting Policies - Revenues," to the consolidated financial statements. Pension and PBOP: Our subsidiaries participate in a Pension Plan covering certain of our regular employees and in a PBOP Plan to provide certain health care benefits, primarily medical and dental, and life insurance benefits to retired employees. For each of these plans, the development of the benefit obligation, fair value of plan assets, funded status and net periodic benefit cost is based on several significant assumptions. We evaluate these assumptions at least annually and adjust them as necessary. Changes in these assumptions could have a material impact on our financial position, results of operations or cash flows. Pre-tax net periodic pension expense for the Pension Plan was $80.4 million, $39.7 million and $2.4 million for the years ended December 31, 2010, 2009 and 2008, respectively. The pre-tax net PBOP Plan expense was $41.6 million, $37.2 million and $36.2 million for the years ended December 31, 2010, 2009 and 2008, respectively. We develop key assumptions for purposes of measuring the plans’ liabilities as of December 31 and expenses for the subsequent year. These assumptions include the long-term rate of return on plan assets, discount rate, compensation/progression rate, and health care cost trend rates and are discussed below. Long-Term Rate of Return on Plan Assets: In developing this assumption, we consider historical and expected returns and input from our actuaries and consultants. Our expected long-term rate of return on assets is based on assumptions regarding target asset allocations and corresponding expected rates of return for each asset class. We routinely review the actual asset allocations and periodically rebalance the investments to the targeted asset allocations when appropriate. We used aggregate expected long-term rate of return assumptions of 8.25 percent and 8.75 percent on Pension Plan assets and PBOP Plan life and non-taxable health assets and a 6.45 percent and 6.85 percent for PBOP taxable health assets as of December 31, 2010 and 2009, respectively. Discount Rate: Payment obligations related to the Pension Plan and PBOP Plan are discounted at interest rates applicable to the timing of the plans’ cash flows. The discount rate that is utilized in determining the pension and PBOP obligations is based on a yield-curve approach. The yield curve is developed from the top quartile of "AA-rated" Moody’s and S&P’s bonds without callable features outstanding as of December 31, 2010. The discount rates determined on this basis are 5.57 percent for the Pension Plan and 5.28 percent for the PBOP Plan as of December 31, 2010 and 5.98 percent and 5.73 percent for the respective plans as of December 31, 2009. Compensation/Progression Rate: This assumption reflects the expected long-term salary growth rate, which impacts the estimated benefits that pension plan participants receive in the future. We used a compensation/progression rate of 3.5 percent and 4.0 percent as of December 31, 2010 and 2009, respectively. The 3.5 percent rate reflects our current expectation of future salary increases and promotions, including consideration of the levels of increases built into union contracts.

43
Actuarial Determination of Expense: Pension and PBOP expense are determined by our actuaries and consist of service cost and prior service cost, interest cost based on the discounting of the obligations, amortization of actuarial gains and losses and amortization of the net transition obligation, offset by the expected return on plan assets. Actuarial gains and losses represent differences between assumptions and actual information or updated assumptions. We determine the expected return on plan assets by applying our assumed rate of return to a calculation of plan assets that recognizes investment gains or losses over a four-year period after the year in which they occur, which reduces year-to-year volatility. Investment gains or losses for this purpose are the difference between the calculated expected return using our long-term rate of return assumption and the actual return or loss based on the change in the fair value of assets during the year. As of December 31, 2010, investment losses that remain to be reflected in the calculation of plan assets over the next four years were $238.9 million and $1.8 million for the Pension Plan and PBOP Plan, respectively. These asset losses will be subject to amortization with other unrecognized actuarial gains or losses as they are reflected in the calculation of plan assets. The plans currently amortize unrecognized actuarial gains or losses as a component of pension and PBOP expense over the average future employee service period of approximately 10 and 9 years, respectively. As of December 31, 2010, the net unrecognized actuarial losses on the Pension and PBOP Plan liabilities, subject to amortization, were $676.7 million and $171.3 million, respectively. Forecasted Expenses and Expected Contributions: Based upon the assumptions and methodologies discussed above, we estimate that forecasted expense for the Pension Plan and PBOP Plan will be $124.9 million and $42.8 million, respectively, in 2011, which is included in our earnings guidance. Pension and PBOP expense for subsequent years will depend on future investment performance, changes in future discount rates and other assumptions, and various other factors related to the populations participating in the plans. Pension and PBOP expense charged to earnings is net of the amounts capitalized. We expect to continue our policy to contribute to the PBOP Plan at the amount of PBOP expense, excluding curtailments and special benefit amounts and adding contributions for the amounts received from the federal Medicare subsidy. NU's policy is to annually fund the Pension Plan in an amount at least equal to what will satisfy the requirements of ERISA and the Internal Revenue Code. NU's Pension Plan has historically been well funded, and a contribution was not required to be made from 1991 until the third quarter of 2010, when PSNH made a contribution to the plan of $45 million. Using the segment rate approach as allowed under PPA guidelines, our Pension Plan funded ratio (the value of plan assets divided by the funding target in accordance with the requirement of the PPA) was 92 percent as of January 1, 2010. We currently estimate that quarterly contributions aggregating to a total of approximately $145 million will be made in 2011. Sensitivity Analysis: The following represents the increase to the Pension Plan’s and PBOP Plan’s reported cost as a result of a change in the following assumptions by 50 basis points (in millions): As of December 31, Pension Plan Cost Postretirement Plan Cost Assumption Change 2010 2009 2010 2009 Lower long-term rate of return $ 10.7 $ 11.1 $ 1.2 $ 1.7 Lower discount rate $ 13.4 $ 12.0 $ 2.2 $ 1.5 Higher compensation increase $ 6.1 $ 6.0 N/A N/A Health Care Cost: The health care cost trend assumption used to project increases in medical costs was 7.5 percent for determining 2010 PBOP Plan expense. For 2011 through 2013, the rate is 7 percent, subsequently decreasing one half percentage point per year to an ultimate rate of 5 percent in 2017. The effect of increasing the health care cost trend by one percentage point would have increased service and interest cost components of PBOP Plan expense by $1.2 million in 2010, with a $14.5 million impact on the postretirement benefit obligation. See Note 10A, "Employee Benefits - Pension Benefits and Postretirement Benefits Other Than Pensions," to the consolidated financial statements for more information. Goodwill and Intangible Assets: We are required to test goodwill balances for impairment at least annually by applying a fair value-based test that requires us to use estimates and judgment. We have selected October 1st of each year as the annual goodwill impairment testing date. Goodwill impairment is deemed to exist if the net book value of a reporting unit exceeds its estimated fair value and if the implied fair value of goodwill based on the estimated fair value of the reporting unit is less than the carrying amount of the goodwill. If goodwill is deemed to be impaired, it is written down in the current period to the extent of the impairment. We performed an impairment analysis as of October 1, 2010 for the Yankee Gas goodwill balance of $287.6 million. We determined that no triggering events occurred in 2010 that would have required testing before or after October 1st. We determined that the fair value of Yankee Gas substantially exceeds its carrying value and no impairment exists. In performing the evaluation, we estimated the fair value of the Yankee Gas reporting unit and compared it to the carrying amount of the reporting unit, including goodwill. We estimated the fair value of Yankee Gas using a discounted cash flow methodology and two market approaches that analyze comparable companies or transactions. This evaluation requires the input of several critical assumptions, including future growth rates, cash flow projections, operating cost escalation rates, rates of return, a risk-adjusted discount rate, long-term earnings and merger multiples of comparable companies.
44
We determined the discount rate using the capital asset pricing model methodology. This methodology uses a weighted average cost of capital in which the ROE is developed using risk-free rates, equity premiums and a beta representing Yankee Gas' volatility relative to the overall market. The resulting discount rate is intended to be comparable to a rate that would be applied by a market participant. The discount rate may change from year to year as it is based on external market conditions. The discount rate decreased in 2010, as compared to 2009, as a result of lower beta and risk-free treasury rates. Income Taxes: Income tax expense is estimated annually for each of the jurisdictions in which we operate. This process involves estimating current and deferred income tax expense or benefit and the impact of temporary differences resulting from differing treatment of items. Such differences are the result of timing of the deduction for expenses, as well as any impact of permanent differences resulting from tax credits, non-tax deductible expenses, in addition to various other items, including items that directly impact our tax return as a result of a regulatory activity (flow-through items). The temporary differences and flow-through items result in deferred tax assets and liabilities that are included in the consolidated balance sheets. The income tax estimation process impacts all of our segments. We record income tax expense quarterly using an estimated annualized effective tax rate. Adjustments to these estimates can significantly impact our consolidated financial statements. A reconciliation of expected tax expense at the statutory federal income tax rate to actual tax expense recorded is included in Note 11, "Income Taxes," to the consolidated financial statements. We also account for uncertainty in income taxes, which applies to all income tax positions previously filed in a tax return and income tax positions expected to be taken in a future tax return that have been reflected on our balance sheets. We follow generally accepted accounting principles to address the methodology to be used in recognizing, measuring and classifying the amounts associated with tax positions that are deemed to be uncertain, including related interest and penalties. The determination of whether a tax position meets the recognition threshold under this guidance is based on facts, circumstances and information available to us. Once a tax position meets the recognition threshold, the tax benefit is measured using a cumulative probability assessment. Assigning probabilities in measuring a recognized tax position and evaluating new information or events in subsequent periods requires significant judgment and could change previous conclusions used to measure the tax position estimate. New information or events may include tax examinations or appeals, developments in case law, settlements of tax positions, changes in tax law and regulations, rulings by taxing authorities and statute of limitation expirations. Such information or events may have a significant impact on our financial position, results of operations and cash flows. Accounting for Environmental Reserves: Accounting for Environmental Reserves: Environmental reserves are accrued when assessments indicate that it is probable that a liability has been incurred and an amount can be reasonably estimated. Adjustments made to environmental reserves could have a significant impact on earnings. We estimate these liabilities based on findings through various phases of the assessment, considering the most likely action plan from a variety of available options (ranging from no action to full site remediation and long-term monitoring), current site information from our site assessments, remediation estimates from third party engineering and remediation contractors, and our prior experience in remediating contaminated sites. Our estimates incorporate currently enacted state and federal environmental laws and regulations and data released by the EPA and other organizations. The estimates associated with each possible action plan are judgmental in nature partly because there are usually several different remediation options from which to choose. Our estimates are subject to revision in future periods based on actual costs or new information from other sources, including the level of contamination at the site. For further information, see Note 12A, "Commitments and Contingencies - Environmental Matters," to the consolidated financial statements. Fair Value Measurements: We follow fair value measurement guidance that defines fair value as the price that would be received for the sale of an asset or paid to transfer a liability in an orderly transaction between market participants at the measurement date (an exit price). We have applied this guidance to the Company's derivative contracts that are recorded at fair value, marketable securities held in NU’s supplemental benefit trust and WMECO’s spent nuclear fuel trust, our valuations of investments in our pension and PBOP plans, and nonrecurring fair value measurements of nonfinancial assets such as goodwill and AROs. Derivative assets are a large portion of our total assets measured at fair value (excluding assets held in our external pension and PBOP trusts), and derivative liabilities comprise almost all of our total liabilities measured at fair value as of December 31, 2010. Changes in fair value of the regulated company derivative contracts are recorded as Regulatory assets or liabilities, as we expect to recover the costs of these contracts in rates. These valuations are sensitive to the prices of energy and energy related products in future years for which markets have not yet developed and assumptions are made. A significant portion of our derivative liabilities relate to the Regulated companies, for which changes in fair value do not affect our earnings and are not material to our liquidity or capital resources because the costs and benefits of the contracts are recoverable from or refundable to customers on a timely basis. We use quoted market prices when available to determine fair values of financial instruments. If quoted market prices are not available, fair value is determined using quoted prices for similar instruments in active markets, quoted prices for identical or similar instruments that are not active and model-derived valuations. When quoted prices in active markets for the same or similar instruments are not available, we value derivative contracts using models that incorporate both observable and unobservable inputs. Significant unobservable inputs utilized in the models include energy and energy-related product prices for future years for long-dated derivative contracts, future contract quantities under full requirements and supplemental sales contracts, and market volatilities. Discounted cash flow valuations incorporate estimates of premiums or discounts, reflecting risk adjusted profit that would be required by a market

45
participant to arrive at an exit price, using available historical market transaction information. Valuations of derivative contracts also reflect our estimates of nonperformance risk, including credit risk. For further information see Item 7A, "Quantitative and Qualitative Disclosures about Market Risk," included in this Annual Report on Form 10-K for a sensitivity analysis of how changes in the prices of energy and energy related products would impact earnings. For further information on derivative contracts and marketable securities, see Note 1J, "Summary of Significant Accounting Policies - Derivative Accounting," Note 4, "Derivative Instruments," and Note 5, "Marketable Securities," to the consolidated financial statements. Other Matters Environmental Matter: HWP, a subsidiary of NU, continues to investigate the potential need for additional remediation at a river site in Massachusetts containing tar deposits associated with an MGP site that HWP sold to HG&E, a municipal utility, in 1902. As of December 31, 2010, HWP has a $2.9 million reserve for estimated costs that HWP considers probable over the remaining life of the project. Although a material increase to the reserve is not presently anticipated, management cannot reasonably estimate potential additional investigation or remediation costs because these costs would depend, among other things, on the nature, extent and timing of additional investigation and remediation that may be required by the MA DEP. For further information, see Note 12A, "Commitments and Contingencies - Environmental Matters," to the consolidated financial statements. Contractual Obligations and Commercial Commitments: Information regarding our contractual obligations and commercial commitments as of December 31, 2010 is summarized annually through 2015 and thereafter as follows: NU (Millions of Dollars) 2011 2012 2013 2014 2015 Thereafter Total Long-term debt maturities (a) (b) $ 66.3 $ 267.3 $ 305.0 $ 275.0 $ 150.0 $ 3,327.9 $ 4,391.5 Estimated interest payments on existing debt (c) 236.2 231.8 220.6 208.9 194.8 1,871.4 2,963.7 Capital leases (d) 2.5 2.6 2.4 2.0 2.0 11.4 22.9 Operating leases (e) 7.9 7.0 6.8 4.9 4.5 19.1 50.2 Funding of pension obligations (e) (j) 145.0 160.0 100.0 90.0 40.0 - 535.0 Funding of other postretirement benefit obligations (e) 42.8 41.9 24.2 21.7 20.2 - 150.8 Estimated future annual companies costs (f) 641.2 719.4 596.9 550.5 478.6 3,404.1 6,390.7 Other purchase commitments (e) (h) 1,570.4 - - - - - 1,570.4 Total (g) (i) $ 2,712.3 $ 1,430.0 $ 1,255.9 $ 1,153.0 $ 890.1 $ 8,633.9 $ 16,075.2 CL&P (Millions of Dollars) 2011 2012 2013 2014 2015 Thereafter Total Long-term debt maturities (a) (b) $ 62.0 $ - $ - $ 150.0 $ 100.0 $ 2,031.7 $ 2,343.7 Estimated interest payments on existing debt (c) 133.8 133.8 133.8 133.8 124.1 1,381.7 2,041.0 Capital leases (d) 1.9 2.0 2.0 1.8 1.8 11.3 20.8 Operating leases (e) 7.2 6.8 6.7 6.5 6.5 23.0 56.7 Funding of other postretirement benefit obligations (e) 17.0 16.6 8.1 7.3 6.8 6.4 62.2 Estimated future annual long-term contractual costs (f) 284.2 415.1 436.5 451.5 397.7 3,129.5 5,114.5 Other purchase commitments (e) (h) 598.2 - - - - - 598.2 Total (g) (i) $ 1,104.3 $ 574.3 $ 587.1 $ 750.9 $ 636.9 $ 6,583.6 $ 10,237.1 (a) Included in our debt agreements are usual and customary positive, negative and financial covenants. Non-compliance with certain
covenants, for example timely payment of principal and interest, may constitute an event of default, which could cause an acceleration of principal payments in the absence of receipt by us of a waiver or amendment. Such acceleration would change the obligations outlined in the table of contractual obligations and commercial commitments.
(b) Long-term debt maturities exclude $301 million and $243.8 million for NU and CL&P, respectively, of fees and interest due for
spent nuclear fuel disposal costs, a positive $11.8 million for NU of net changes in fair value of hedged debt and a negative $5.1 million and $4.4 million for NU and CL&P, respectively, of net unamortized premium and discount as of December 31, 2010.
(c) Estimated interest payments on fixed-rate debt are calculated by multiplying the coupon rate on the debt by its scheduled notional
amount outstanding for the period of measurement. Estimated interest payments on floating-rate debt are calculated by multiplying the average of the 2010 floating-rate resets on the debt by its scheduled notional amount outstanding for the period of measurement. This same rate is then assumed for the remaining life of the debt. Interest payments on debt that have an interest rate swap in place are estimated using the effective cost of debt resulting from the swap rather than the underlying interest cost on the debt, subject to the fixed and floating methodologies.
(d) The capital lease obligations include imputed interest of $10.7 million and $10.2 million for NU and CL&P, respectively, as of
December 31, 2010. (e) Amounts are not included on our consolidated balance sheets.

46
(f) Other than the net mark-to-market changes on respective derivative contracts held by both the Regulated companies and NU Enterprises, these obligations are not included on our consolidated balance sheets. On February 7, 2010, an explosion occurred at the construction site of Kleen Energy Systems, LLC’s 620 MW generation project with which CL&P has a Contract for Differences (CfD) contract. This event could delay or change CL&P’s estimated payments under the CfD contract. For further information, see Note 12C, "Commitments and Contingencies - Long-Term Contractual Arrangements," to the consolidated financial statements.
(g) Does not include unrecognized tax benefits of $101.2 million for NU and $80.8 million for CL&P as of December 31, 2010, as we
cannot make reasonable estimates of the periods or the potential amounts of cash settlement with the respective taxing authorities. Also does not include an NU $50 million contingent commitment to an energy investment fund, which would be invested under certain conditions, as we cannot make reasonable estimates of the periods or the investment contributions.
(h) Amount represents open purchase orders, excluding those obligations that are included in the capital leases, operating leases,
estimated future annual regulated company costs and the estimated future annual NU Enterprises costs. These payments are subject to change as certain purchase orders include estimates based on projected quantities of material and/or services that are provided on demand, the timing of which cannot be determined. Because payment timing cannot be determined, we include all open purchase order amounts in 2011.
(i) For NU, excludes other long-term liabilities, including a significant portion of the unrecognized tax benefits described above,
deferred contractual obligations ($133.1 million), environmental reserves ($37.1 million), various injuries and damages reserves ($35.1 million), employee medical insurance reserves ($6.9 million), long-term disability insurance reserves ($12 million) and the ARO liability reserves ($53.3 million) as we cannot make reasonable estimates of the timing of payments. For CL&P, excludes unrecognized tax benefits described above, deferred contractual obligations ($91.7 million) environmental reserves ($2.8 million), various injuries and damages reserves ($23.5 million), employee medical insurance reserves ($2.2 million), long-term disability insurance reserves ($3.8 million) and the ARO liability reserves ($29.3 million).
(j) These amounts represent NU's estimated minimum pension contributions to its qualified Pension Plan required under ERISA and
the Internal Revenue Code. Contributions in 2012 through 2015 will vary depending on many factors, including the performance of existing plan assets, valuation of the plan's liabilities and long-term discount rates, and are subject to change.
RRB amounts are non-recourse to us, have no required payments over the next five years and are not included in this table. The Regulated companies' standard offer service contracts and default service contracts are also not included in this table. For further information regarding our contractual obligations and commercial commitments, see the consolidated statements of capitalization and Note 8, "Short-Term Debt," Note 9, "Long-Term Debt," Note 10A, "Employee Benefits - Pension Benefits and Postretirement Benefits Other Than Pensions," Note 12C, "Commitments and Contingencies - Long-Term Contractual Arrangements," and Note 13, "Leases," to the consolidated financial statements. Web Site: Additional financial information is available through our web site at www.nu.com.

47
RESULTS OF OPERATIONS – NORTHEAST UTILITIES AND SUBSIDIARIES The following table provides the amounts and variances in operating revenues and expense line items for the consolidated statements of income for NU included in this Annual Report on Form 10-K for the years ended December 31, 2010, 2009 and 2008: Comparison of 2010 to 2009:
Revenues and Expenses
For the Years Ended December 31,
(Millions of Dollars) 2010 2009 Increase/
(Decrease) Percent Operating Revenues $ 4,898.2 $ 5,439.4 $ (541.2) (9.9) % Operating Expenses: Fuel, Purchased and Net Interchange Power 1,985.6 2,629.6 (644.0) (24.5) Other Operating Expenses 958.4 1,001.2 (42.8) (4.3) Maintenance 210.3 234.2 (23.9) (10.2) Depreciation 300.7 309.6 (8.9) (2.9) Amortization of Regulatory Assets, Net 95.7 13.3 82.4 (a) Amortization of Rate Reduction Bonds 232.9 217.9 15.0 6.9 Taxes Other Than Income Taxes 314.7 282.2 32.5 11.5 Total Operating Expenses 4,098.3 4,688.0 (589.7) (12.6) Operating Income $ 799.9 $ 751.4 $ 48.5 6.5 % (a) Percent greater than 100 percent not shown as it is not meaningful. Operating Revenues For the Years Ended December 31,
(Millions of Dollars)
2010
2009 Increase/
(Decrease) Percent Electric Distribution $ 3,802.0 $ 4,358.4 $ (556.4) (12.8) %Natural Gas Distribution 434.3 449.6 (15.3) (3.4) Total Distribution 4,236.3 4,808.0 (571.7) (11.9) Transmission 625.6 577.9 47.7 8.3 Total Regulated Companies 4,861.9 5,385.9 (524.0) (9.7) Competitive Businesses 80.3 81.3 (1.0) (1.2) Other and Eliminations (44.0) (27.8) (16.2) (58.3) NU $ 4,898.2 $ 5,439.4 $ (541.2) (9.9) % A summary of our retail electric sales and firm natural gas sales were as follows: For the Years Ended December 31,
2010 2009 Increase/
(Decrease) Percent Retail Electric Sales in GWh 34,230 33,645 585 1.7 % Firm Natural Gas Sales in Million Cubic Feet 43,251 42,450 801 1.9 % Our Operating Revenues decreased in 2010, as compared to 2009, due primarily to: • Lower electric distribution revenues related to the portions that are included in regulatory commission approved tracking
mechanisms that recover certain incurred costs and do not impact earnings. The tracked electric distribution revenues decreased due primarily to lower generation service and related congestion charges ($574 million) and lower CL&P delivery-related FMCC ($39 million), partially offset by higher retail transmission revenues ($66 million) and higher transition cost recoveries ($48 million). The tracking mechanisms allow for rates to be changed periodically with overcollections refunded to customers or undercollections recovered from customers in future periods. In addition, Regulated companies revenues that eliminate in consolidation decreased by $92 million.
• The portion of electric distribution revenues that impacts earnings increased $40 million due primarily to a 1.7 percent increase in
retail electric sales due to warmer than normal summer weather and PSNH's rate changes that were effective July 1, 2010. A decrease in natural gas revenues was due primarily to lower cost of fuel, as fuel costs are fully recovered in revenues from sales to our customers, offset by an increase in sales volume. Firm natural gas sales increased 1.9 percent in 2010 compared to 2009.
• Improved transmission segment revenues resulting from a higher level of investment in this segment and the return of higher
overall expenses, which are tracked and result in a related increase in revenues. The increase in expenses is directly related to the increase in transmission plant, including costs associated with higher property taxes, depreciation and operation and maintenance expenses.

48
Fuel, Purchased and Net Interchange Power Fuel, Purchased and Net Interchange Power decreased in 2010, as compared to 2009, due primarily to the following:
(Millions of Dollars)
2010 Increase/(Decrease) as compared to 2009
Lower GSC supply costs, deferred fuel costs and other purchased power costs at CL&P
$ (437.4)
An increased level of ES customer migration to third party electric suppliers, partially offset by higher retail sales at PSNH
(157.4) Lower basic/default service supply costs at WMECO (34.9) Lower prices on purchased natural gas, partially offset by a lower net underrecovery in 2010 at Yankee Gas
(19.7)
Increased competitive businesses' expenses due primarily to lower Select Energy mark-to-market gains
5.4
$ (644.0) Other Operating Expenses Other Operating Expenses decreased in 2010, as compared to 2009, due primarily to: • Lower distribution and transmission segment expenses of $66 million were due primarily to lower costs that are recovered through
distribution tracking mechanisms that have no earnings impact ($65 million), such as retail transmission, RMR and customer service expenses, and lower uncollectibles expense at Yankee Gas ($16 million), partially offset by higher electric distribution and natural gas expenses ($22 million and $3 million, respectively), including higher pension costs and storm restoration costs, and higher transmission segment expenses ($4 million). In addition, amounts that eliminate in consolidation primarily related to service company charges decreased by $45 million.
• Higher NU parent and other companies expenses of $22 million due primarily to costs incurred in 2010 related to NU's proposed
merger with NSTAR and higher pension and environmental costs. Maintenance Maintenance decreased in 2010, as compared to 2009, due primarily to the allowed regulatory deferral of approximately $32 million as a result of the June 30, 2010 CL&P rate case decision, of which $29.5 million was recognized as a deferral in maintenance expense, lower boiler and maintenance costs at PSNH’s generation business ($12 million), offset by higher distribution segment overhead line expenses ($13 million), higher distribution segment vegetation management costs ($2 million) and higher transmission segment routine station maintenance expenses ($2 million). Depreciation Depreciation decreased in 2010, as compared to 2009, due primarily to a lower depreciation rate being used at CL&P as a result of the distribution rate case decision that was effective July 1, 2010, partially offset by higher utility plant balances resulting from completed construction projects placed into service in 2010. Amortization of Regulatory Assets, Net Amortization of Regulatory Assets, Net increased in 2010, as compared to 2009, due primarily to a higher recovery of CTA costs at CL&P ($39 million), higher PSNH amortization on the ES deferral and TCAM ($42 million and $11 million, respectively), and previously deferred unrecovered stranded generation costs at WMECO ($11 million), partially offset by the impact of the 2010 Healthcare Act related to the deferral of lost tax benefits that we believe are probable of recovery in future electric and natural gas distribution rates ($26 million). Taxes Other Than Income Taxes
(Millions of Dollars)
2010 Increase/(Decrease) as compared to 2009
Connecticut Gross Earnings Tax $ 8.9 Property Taxes 12.5 Use Taxes 10.4 Other 0.7
$ 32.5 The increase in Taxes Other Than Income Taxes was due primarily to an increase in property taxes as a result of an increase in Property, Plant and Equipment related to our capital programs. The Connecticut Gross Earnings Tax increased primarily as a result of an increase in the transmission segment revenues and an increase in distribution segment revenues primarily related to retail transmission and higher transition cost recoveries in 2010, as compared to 2009. The increase in use taxes was due primarily to the absence in 2010 of a Connecticut state use tax refund.

49
Interest Expense For the Years Ended December 31,
(Millions of Dollars) 2010
2009 Increase/
(Decrease) Percent Interest on Long-Term Debt $ 231.1 $ 224.7 $ 6.4 2.8 %Interest on RRBs 20.6 36.5 (15.9) (43.6) Other Interest (14.4) 12.4 (26.8) (a)
$ 237.3 $ 273.6 $ (36.3) (13.3) % (a) Percent greater than 100 percent not shown as it is not meaningful. Interest Expense decreased in 2010, as compared to 2009, due primarily to the settlement of various state tax matters in the fourth quarter of 2010, which resulted in a reduction in Other Interest and lower Interest on RRBs resulting from lower principal balances outstanding, offset by higher Interest on Long-Term Debt as a result of $145 million in new long-term debt issuances in the first half of 2010 and $400 million in 2009, $150 million of which was issued by PSNH in December 2009. Other Income, Net For the Years Ended December 31,
(Millions of Dollars) 2010
2009 Increase/
(Decrease) Percent Other Income, Net $ 41.9 $ 37.8 $ 4.1 10.8 % Other Income, Net increased in 2010, as compared to 2009, due primarily to higher AFUDC related to equity funds ($7 million), higher C&LM and EIA incentives ($3 million and $2 million, respectively), offset with lower investment and interest income ($4 million and $2 million, respectively). Income Tax Expense For the Years Ended December 31,
(Millions of Dollars) 2010
2009 Increase/
(Decrease) Percent Income Tax Expense $ 210.4 $ 179.9 $ 30.5 17.0 % Income Tax Expense increased in 2010, as compared to 2009, due primarily to the impacts of the 2010 Healthcare Act ($30 million) and higher pre-tax earnings ($10 million), partially offset by lower impacts related to items that directly impact our tax return as a result of a regulatory activity ("flow-through") and other impacts ($5 million) and adjustments for prior years' taxes including adjustments to reconcile estimated taxes accrued to actual amounts reflected in our filed tax returns ($5 million). Comparison of 2009 to 2008:
Revenues and Expenses
For the Years Ended December 31,
(Millions of Dollars) 2009 2008 Increase/
(Decrease) Percent Operating Revenues $ 5,439.4 $ 5,800.1 $ (360.7) (6.2) % Operating Expenses: Fuel, Purchased and Net Interchange Power 2,629.6 2,996.2 (366.6) (12.2) Other Operating Expenses 1,001.2 1,021.7 (20.5) (2.0) Maintenance 234.2 254.0 (19.8) (7.8) Depreciation 309.6 278.6 31.0 11.1 Amortization of Regulatory Assets, Net 13.3 186.4 (173.1) (92.9) Amortization of Rate Reduction Bonds 217.9 204.9 13.0 6.3 Taxes Other Than Income Taxes 282.2 267.5 14.7 5.5 Total Operating Expenses 4,688.0 5,209.3 (521.3) (10.0) Operating Income $ 751.4 $ 590.8 $ 160.6 27.2 %

50
Operating Revenues For the Years Ended December 31,
(Millions of Dollars)
2009
2008 Increase/
(Decrease) Percent Electric Distribution $ 4,358.4 $ 4,716.1 $ (357.7) (7.6) %Natural Gas Distribution 449.6 577.4 (127.8) (22.1) Total Distribution 4,808.0 5,293.5 (485.5) (9.2) Transmission 577.9 424.8 153.1 36.0 Total Regulated Companies 5,385.9 5,718.3 (332.4) (5.8) Competitive Businesses 81.3 114.1 (32.8) (28.7) Other and Eliminations (27.8) (32.3) 4.5 13.9 NU $ 5,439.4 $ 5,800.1 $ (360.7) (6.2) % A summary of our retail electric sales and firm natural gas sales were as follows: For the Years Ended December 31,
2009 2008 Increase/
(Decrease) Percent Retail Electric Sales in GWh 33,645 34,883 (1,238) (3.5) % Firm Natural Gas Sales in Million Cubic Feet 42,450 39,717 2,733 6.9 % Operating Revenues decreased in 2009, as compared to 2008, due primarily to lower distribution segment revenues ($485 million) as a result of the recovery of a lower level of electric and natural gas distribution fuel and other expenses passed through to customers through regulatory tracking mechanisms. Electric distribution revenues decreased due primarily to a decrease in the portion of electric distribution revenues that does not impact earnings ($395 million), partially offset by an increase in the component of revenues that impacts earnings ($37 million). The portion of electric distribution revenues that impacts earnings increased $37 million due primarily to higher CL&P and PSNH retail rates, partially offset by lower retail electric sales. Retail electric sales for the Regulated companies decreased 3.5 percent. Natural gas distribution revenues decreased $128 million due primarily to decreased recovery of fuel costs primarily as a result of lower prices, partially offset by higher sales volumes. Firm natural gas sales increased 6.9 percent in 2009 compared with 2008. The $395 million decrease in electric distribution revenues that does not impact earnings consists of the portions of distribution revenues that are included in regulatory commission approved tracking mechanisms that recover certain incurred costs ($356 million) and revenues that are eliminated in consolidation of the Regulated companies ($39 million). The distribution revenue tracking components decreased $356 million due primarily to lower recovery of generation service and related congestion charges ($331 million) and lower CL&P wholesale revenues as a result of decreased market revenue related to sales of IPP purchased generation output ($163 million), partially offset by higher retail transmission revenues ($104 million) mainly as a result of the higher 2009 retail rates. The tracking mechanisms allow for rates to be changed periodically with overcollections refunded to customers or undercollections recovered from customers in future periods. Transmission segment revenues increased due primarily to a higher transmission investment base as a result of the completion of our southwest Connecticut projects in 2008 and higher overall expenses. Competitive businesses' revenues decreased $33 million due primarily to lower Boulos revenues as a result of less work on transmission projects and a lower level of work in other areas. Fuel, Purchased and Net Interchange Power Fuel, Purchased and Net Interchange Power decreased in 2009, as compared to 2008, due primarily to the following:
(Millions of Dollars)
2009 Increase/(Decrease) as compared to 2008
Lower GSC supply costs and other purchased power costs, partially offset by an increase in deferred fuel costs at CL&P
$ (154.7)
Lower prices on purchased natural gas at Yankee Gas (132.6) An increased level of ES customer migration to third party electric suppliers and lower retail sales, partially offset by higher forward energy market prices at PSNH
(37.8) Lower basic/default service supply costs at WMECO (45.2) Increased competitive businesses' expenses due primarily to lower Select Energy mark-to-market gains
3.7
$ (366.6)
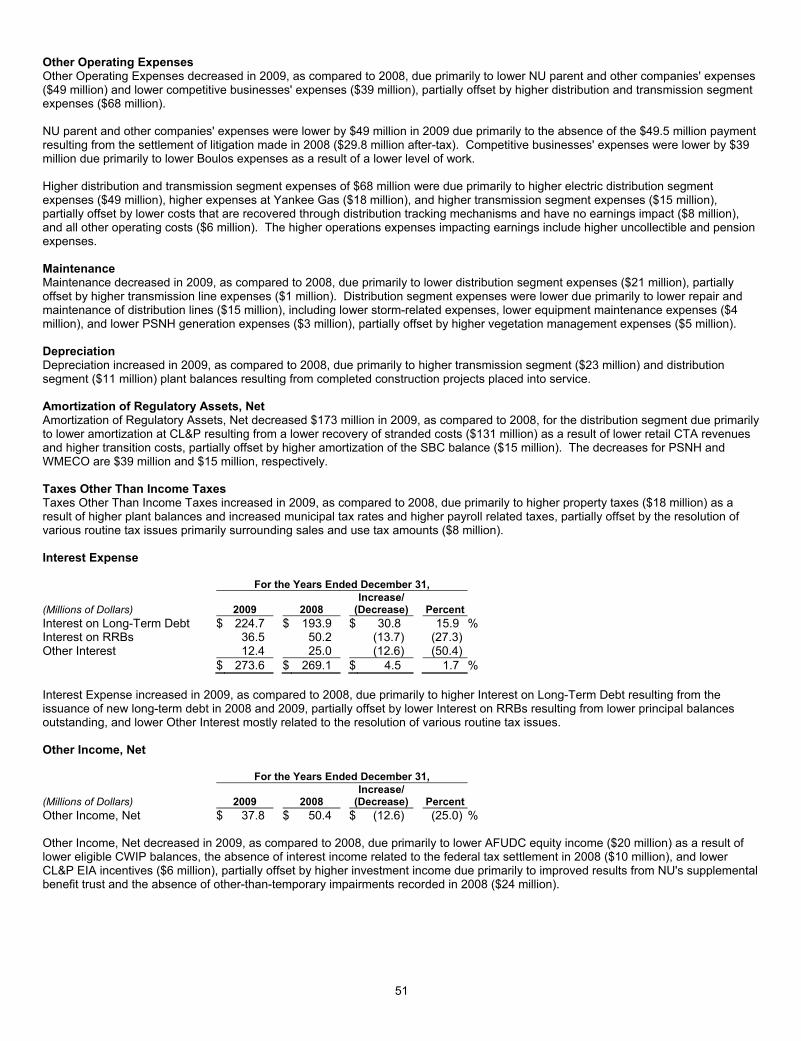
51
Other Operating Expenses Other Operating Expenses decreased in 2009, as compared to 2008, due primarily to lower NU parent and other companies' expenses ($49 million) and lower competitive businesses' expenses ($39 million), partially offset by higher distribution and transmission segment expenses ($68 million). NU parent and other companies' expenses were lower by $49 million in 2009 due primarily to the absence of the $49.5 million payment resulting from the settlement of litigation made in 2008 ($29.8 million after-tax). Competitive businesses' expenses were lower by $39 million due primarily to lower Boulos expenses as a result of a lower level of work. Higher distribution and transmission segment expenses of $68 million were due primarily to higher electric distribution segment expenses ($49 million), higher expenses at Yankee Gas ($18 million), and higher transmission segment expenses ($15 million), partially offset by lower costs that are recovered through distribution tracking mechanisms and have no earnings impact ($8 million), and all other operating costs ($6 million). The higher operations expenses impacting earnings include higher uncollectible and pension expenses. Maintenance Maintenance decreased in 2009, as compared to 2008, due primarily to lower distribution segment expenses ($21 million), partially offset by higher transmission line expenses ($1 million). Distribution segment expenses were lower due primarily to lower repair and maintenance of distribution lines ($15 million), including lower storm-related expenses, lower equipment maintenance expenses ($4 million), and lower PSNH generation expenses ($3 million), partially offset by higher vegetation management expenses ($5 million). Depreciation Depreciation increased in 2009, as compared to 2008, due primarily to higher transmission segment ($23 million) and distribution segment ($11 million) plant balances resulting from completed construction projects placed into service. Amortization of Regulatory Assets, Net Amortization of Regulatory Assets, Net decreased $173 million in 2009, as compared to 2008, for the distribution segment due primarily to lower amortization at CL&P resulting from a lower recovery of stranded costs ($131 million) as a result of lower retail CTA revenues and higher transition costs, partially offset by higher amortization of the SBC balance ($15 million). The decreases for PSNH and WMECO are $39 million and $15 million, respectively. Taxes Other Than Income Taxes Taxes Other Than Income Taxes increased in 2009, as compared to 2008, due primarily to higher property taxes ($18 million) as a result of higher plant balances and increased municipal tax rates and higher payroll related taxes, partially offset by the resolution of various routine tax issues primarily surrounding sales and use tax amounts ($8 million). Interest Expense For the Years Ended December 31,
(Millions of Dollars) 2009 2008 Increase/
(Decrease) Percent Interest on Long-Term Debt $ 224.7 $ 193.9 $ 30.8 15.9 %Interest on RRBs 36.5 50.2 (13.7) (27.3) Other Interest 12.4 25.0 (12.6) (50.4)
$ 273.6 $ 269.1 $ 4.5 1.7 % Interest Expense increased in 2009, as compared to 2008, due primarily to higher Interest on Long-Term Debt resulting from the issuance of new long-term debt in 2008 and 2009, partially offset by lower Interest on RRBs resulting from lower principal balances outstanding, and lower Other Interest mostly related to the resolution of various routine tax issues. Other Income, Net For the Years Ended December 31,
(Millions of Dollars) 2009
2008 Increase/
(Decrease) Percent Other Income, Net $ 37.8 $ 50.4 $ (12.6) (25.0) % Other Income, Net decreased in 2009, as compared to 2008, due primarily to lower AFUDC equity income ($20 million) as a result of lower eligible CWIP balances, the absence of interest income related to the federal tax settlement in 2008 ($10 million), and lower CL&P EIA incentives ($6 million), partially offset by higher investment income due primarily to improved results from NU's supplemental benefit trust and the absence of other-than-temporary impairments recorded in 2008 ($24 million).

52
Income Tax Expense For the Years Ended December 31,
(Millions of Dollars) 2009
2008 Increase/
(Decrease) Percent Income Tax Expense $ 179.9 $ 105.7 $ 74.2 70.2 % Income Tax Expense increased in 2009, as compared to 2008, due primarily to higher pre-tax earnings ($50 million), lower tax benefits associated with less capital expenditures ($10 million), lower federal and state tax credits ($4 million), and increases in allowance for uncollectible accounts reserves ($3 million). Selected Consolidated Sales Statistics 2010 2009 2008 2007 2006 Revenues: (Thousands) Regulated Companies: Residential $ 2,336,078 $ 2,569,278 $ 2,525,635 $ 2,558,547 $ 2,409,414 Commercial 1,303,841 1,462,786 1,607,224 1,735,923 1,977,444 Industrial 268,598 297,854 399,753 412,381 589,742 Wholesale 506,475 445,261 545,127 392,675 388,635 Streetlighting and Railroads 42,387 33,035 38,522 45,880 52,853 Miscellaneous and Eliminations (29,878) 128,118 24,673 84,043 133,925 Total Electric 4,427,501 4,936,332 5,140,934 5,229,449 5,552,013 Natural Gas 434,277 449,571 577,390 514,185 453,894 Total - Regulated Companies $ 4,861,778 $ 5,385,903 $ 5,718,324 $ 5,743,634 $ 6,005,907 NU Enterprises: Retail $ - $ - $ - $ - $ 583,829 Wholesale 24,633 30,009 31,882 25,992 20,163 Generation - - - - 258,178 Services 51,998 48,195 78,625 68,324 39,887 Miscellaneous and Eliminations 3,716 3,145 3,574 3,354 (243) Total - NU Enterprises $ 80,347 $ 81,349 $ 114,081 $ 97,670 $ 901,814 Other Miscellaneous and Eliminations (43,958) (27,822) (32,310) (19,078) (30,034) Total $ 4,898,167 $ 5,439,430 $ 5,800,095 $ 5,822,226 $ 6,877,687 Regulated Companies - Sales: (GWh) Residential 14,913 14,412 14,509 15,051 14,652 Commercial 14,506 14,474 14,885 15,103 14,886 Industrial 4,481 4,423 5,149 5,635 5,750 Wholesale 3,423 4,183 3,576 3,855 8,777 Streetlighting and Railroads 330 336 340 353 332 Total 37,653 37,828 38,459 39,997 44,397 Regulated Companies - Customers: (Average) Residential 1,704,197 1,696,756 1,700,207 1,697,073 1,686,169 Commercial 192,266 189,265 190,067 189,727 188,281 Industrial 7,150 7,207 7,342 7,291 7,406 Streetlighting and Railroads* 6,292 7,548 4,605 3,855 3,873 Total Electric 1,909,905 1,900,776 1,902,221 1,897,946 1,885,729 Natural Gas 205,885 206,438 204,834 202,743 199,377 Total 2,115,790 2,107,214 2,107,055 2,100,689 2,085,106 *Customer counts were redefined with the implementation of a new customer service system (C2) completed in October 2008. [Results of Operations for each of CL&P, PSNH and WMECO are omitted from this report but are set forth in the Annual Report on Form 10-K for 2010 filed on a combined basis with NU with the SEC on February 25, 2011. Such report is also available at the Investors section on www.nu.com.]

53
Item 7A. Quantitative and Qualitative Disclosures about Market Risk Market Risk Information Commodity Price Risk Management: Our Regulated companies enter into energy contracts to serve our customers and the economic impacts of those contracts are passed on to our customers. Accordingly, the Regulated companies have no exposure to loss of future earnings or fair values due to these market risk-sensitive instruments. Select Energy's Wholesale Portfolio: The remaining wholesale portfolio held by Select Energy includes contracts that are market-risk sensitive, including a wholesale energy sales contract through 2013 with an agency comprised of municipalities with approximately 0.3 million remaining MWh of supply contract volumes, net of related sales volumes. Select Energy also has a non-derivative energy contract that expires in mid-2012 to purchase output from a generation facility, which is also exposed to market price volatility. As Select Energy's contract volumes are winding down, and as the wholesale energy sales contract is substantially hedged against price risks, we have limited exposure to commodity price risks. We have not entered into any energy contracts for trading purposes. For Select Energy's wholesale energy portfolio derivatives, we utilize the sensitivity analysis methodology to disclose quantitative information for our commodity price risks. Sensitivity analysis provides a presentation of the potential loss of future pre-tax earnings and fair values from our market risk-sensitive contracts due to one or more hypothetical changes in commodity price components, or other similar price changes. As of December 31, 2010, assuming hypothetical 30 percent increases and decreases in forward energy, capacity and ancillary market prices, the nominal adjusted impact on pre-tax earnings would be $0.1 million and $(0.8) million, respectively. The impact of a change in electricity prices on wholesale derivative transactions as of December 31, 2010 are not necessarily representative of the results that will be realized if such a change were to occur. Energy, capacity and ancillaries have different market volatilities. The method we use to determine the fair value of these contracts includes discounting expected future cash flows using a LIBOR swap curve. As such, the wholesale portfolio is also exposed to interest rate volatility. This exposure is not modeled in sensitivity analyses, and we do not believe that such exposure is material. Other Risk Management Activities We have implemented an Enterprise Risk Management methodology for identifying the principal risks of the Company. Enterprise Risk Management involves the application of a well-defined, enterprise-wide methodology that enables our Risk and Capital Committee, comprised of our senior officers, to oversee the identification, management and reporting of the principal risks of the business. However, there can be no assurances that the Enterprise Risk Management process will identify or manage every risk or event that could impact our financial condition, results of operations or cash flows. The findings of this process are periodically discussed with our Board of Trustees. Interest Rate Risk Management: We manage our interest rate risk exposure in accordance with our written policies and procedures by maintaining a mix of fixed and variable rate long-term debt. As of December 31, 2010, approximately 93 percent (87 percent including the long-term debt subject to the fixed-to-floating interest rate swap as variable rate long-term debt) of our long-term debt, including fees and interest due for spent nuclear fuel disposal costs, was at a fixed interest rate. The remaining long-term debt is at variable interest rates and is subject to interest rate risk that could result in earnings volatility. Assuming a one percentage point increase in our variable interest rate, annual interest expense would have increased by a pre-tax amount of $3.3 million. As of December 31, 2010, we maintained a fixed-to-floating interest rate swap at NU parent associated with $263 million of its fixed-rate long-term debt. Credit Risk Management: Credit risk relates to the risk of loss that we would incur as a result of non-performance by counterparties pursuant to the terms of our contractual obligations. We serve a wide variety of customers and suppliers that include IPPs, industrial companies, gas and electric utilities, oil and gas producers, financial institutions, and other energy marketers. Margin accounts exist within this diverse group, and we realize interest receipts and payments related to balances outstanding in these margin accounts. This wide customer and supplier mix generates a need for a variety of contractual structures, products and terms that, in turn, require us to manage the portfolio of market risk inherent in those transactions in a manner consistent with the parameters established by our risk management process. Our Regulated companies are subject to credit risk from certain long-term or high-volume supply contracts with energy marketing companies. Our Regulated companies manage the credit risk with these counterparties in accordance with established credit risk practices and maintain an oversight group that monitors contracting risks, including credit risk. As of December 31, 2010, our Regulated companies neither held cash collateral nor deposited cash collateral with counterparties. NU parent provides standby LOCs for the benefit of its subsidiaries under its revolving credit agreement. PSNH posts such LOCs as collateral with counterparties and ISO-NE. For further information, see Note 12E, "Commitments and Contingencies - Guarantees and Indemnifications," to the consolidated financial statements. Select Energy has also established written credit policies with regard to its counterparties to minimize overall credit risk on all types of transactions. These policies require collateral under certain circumstances (including cash in advance, LOCs, and parent guarantees), and the use of standardized agreements, which allow for the netting of positive and negative exposures associated with a single counterparty in the event of default. This evaluation results in establishing credit limits prior to Select Energy entering into energy contracts. The appropriateness of these limits is subject to continuing review. Concentrations among these counterparties may impact Select Energy's overall exposure to credit risk, either positively or negatively, in that the counterparties may be similarly affected by

54
changes to economic, regulatory or other conditions. For further information, see Note 1H, " Summary of Significant Accounting Policies - Special Deposits and Counterparty Deposits," to the consolidated financial statements. Additional quantitative and qualitative disclosures about market risk are set forth in Part II, Item 7, Management's Discussion and Analysis of Financial Condition and Results of Operations, included in this Annual Report on Form 10-K.
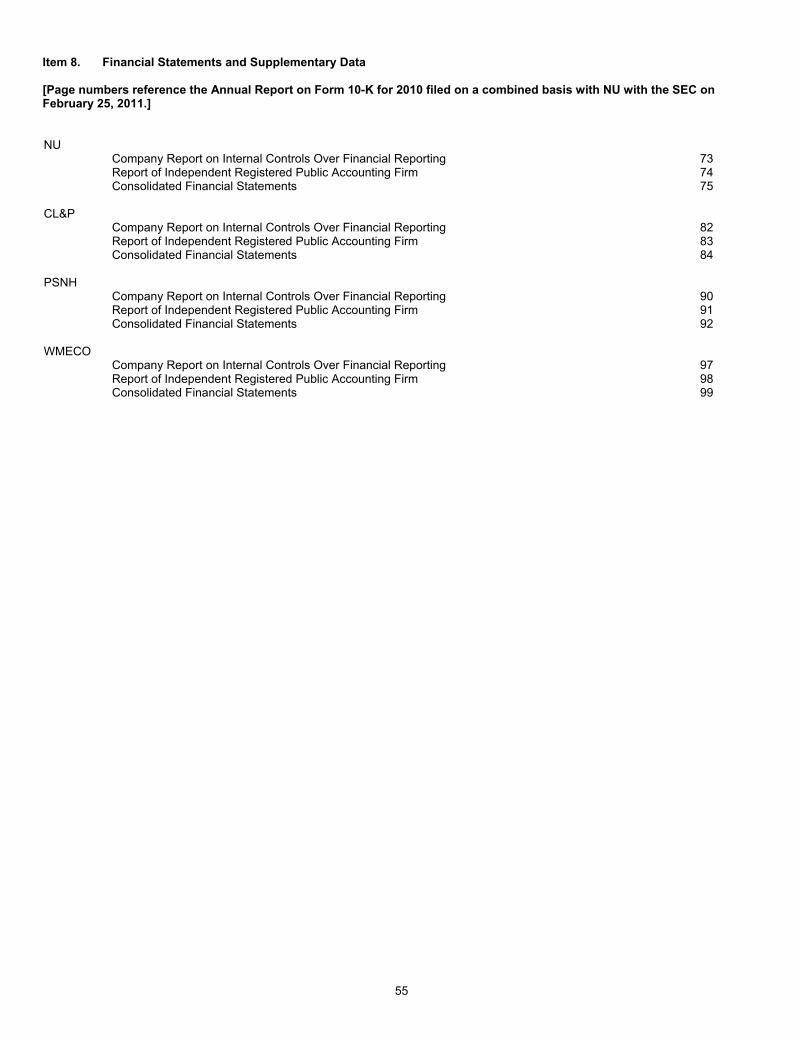
55
Item 8. Financial Statements and Supplementary Data [Page numbers reference the Annual Report on Form 10-K for 2010 filed on a combined basis with NU with the SEC on February 25, 2011.] NU Company Report on Internal Controls Over Financial Reporting 73 Report of Independent Registered Public Accounting Firm 74 Consolidated Financial Statements 75 CL&P Company Report on Internal Controls Over Financial Reporting 82 Report of Independent Registered Public Accounting Firm 83 Consolidated Financial Statements 84 PSNH Company Report on Internal Controls Over Financial Reporting 90 Report of Independent Registered Public Accounting Firm 91 Consolidated Financial Statements 92 WMECO Company Report on Internal Controls Over Financial Reporting 97 Report of Independent Registered Public Accounting Firm 98 Consolidated Financial Statements 99

56
Company Report on Internal Controls Over Financial Reporting Management is responsible for the preparation, integrity, and fair presentation of the accompanying consolidated financial statements of Northeast Utilities and subsidiaries (NU or the Company) and of other sections of this annual report. NU’s internal controls over financial reporting were audited by Deloitte & Touche LLP. Management is responsible for establishing and maintaining adequate internal controls over financial reporting. The Company’s internal control framework and processes have been designed to provide reasonable assurance regarding the reliability of financial reporting and the preparation of financial statements for external purposes in accordance with generally accepted accounting principles. There are inherent limitations of internal controls over financial reporting that could allow material misstatements due to error or fraud to occur and not be prevented or detected on a timely basis by employees during the normal course of business. Additionally, internal controls over financial reporting may become inadequate in the future due to changes in the business environment. Under the supervision and with the participation of the principal executive officer and principal financial officer, NU conducted an evaluation of the effectiveness of internal controls over financial reporting based on criteria established in Internal Control – Integrated Framework issued by the Committee of Sponsoring Organizations of the Treadway Commission (COSO). Based on this evaluation under the framework in COSO, management concluded that internal controls over financial reporting were effective as of December 31, 2010. February 25, 2011
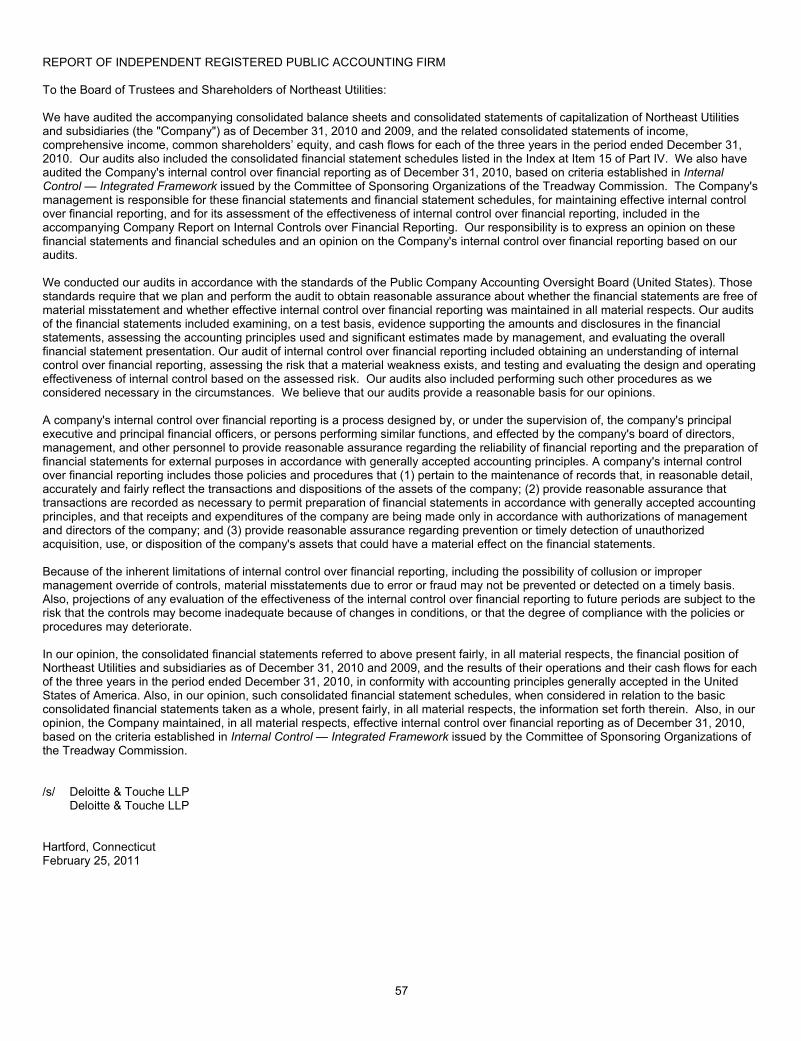
57
REPORT OF INDEPENDENT REGISTERED PUBLIC ACCOUNTING FIRM To the Board of Trustees and Shareholders of Northeast Utilities: We have audited the accompanying consolidated balance sheets and consolidated statements of capitalization of Northeast Utilities and subsidiaries (the "Company") as of December 31, 2010 and 2009, and the related consolidated statements of income, comprehensive income, common shareholders’ equity, and cash flows for each of the three years in the period ended December 31, 2010. Our audits also included the consolidated financial statement schedules listed in the Index at Item 15 of Part IV. We also have audited the Company's internal control over financial reporting as of December 31, 2010, based on criteria established in Internal Control — Integrated Framework issued by the Committee of Sponsoring Organizations of the Treadway Commission. The Company's management is responsible for these financial statements and financial statement schedules, for maintaining effective internal control over financial reporting, and for its assessment of the effectiveness of internal control over financial reporting, included in the accompanying Company Report on Internal Controls over Financial Reporting. Our responsibility is to express an opinion on these financial statements and financial schedules and an opinion on the Company's internal control over financial reporting based on our audits. We conducted our audits in accordance with the standards of the Public Company Accounting Oversight Board (United States). Those standards require that we plan and perform the audit to obtain reasonable assurance about whether the financial statements are free of material misstatement and whether effective internal control over financial reporting was maintained in all material respects. Our audits of the financial statements included examining, on a test basis, evidence supporting the amounts and disclosures in the financial statements, assessing the accounting principles used and significant estimates made by management, and evaluating the overall financial statement presentation. Our audit of internal control over financial reporting included obtaining an understanding of internal control over financial reporting, assessing the risk that a material weakness exists, and testing and evaluating the design and operating effectiveness of internal control based on the assessed risk. Our audits also included performing such other procedures as we considered necessary in the circumstances. We believe that our audits provide a reasonable basis for our opinions. A company's internal control over financial reporting is a process designed by, or under the supervision of, the company's principal executive and principal financial officers, or persons performing similar functions, and effected by the company's board of directors, management, and other personnel to provide reasonable assurance regarding the reliability of financial reporting and the preparation of financial statements for external purposes in accordance with generally accepted accounting principles. A company's internal control over financial reporting includes those policies and procedures that (1) pertain to the maintenance of records that, in reasonable detail, accurately and fairly reflect the transactions and dispositions of the assets of the company; (2) provide reasonable assurance that transactions are recorded as necessary to permit preparation of financial statements in accordance with generally accepted accounting principles, and that receipts and expenditures of the company are being made only in accordance with authorizations of management and directors of the company; and (3) provide reasonable assurance regarding prevention or timely detection of unauthorized acquisition, use, or disposition of the company's assets that could have a material effect on the financial statements. Because of the inherent limitations of internal control over financial reporting, including the possibility of collusion or improper management override of controls, material misstatements due to error or fraud may not be prevented or detected on a timely basis. Also, projections of any evaluation of the effectiveness of the internal control over financial reporting to future periods are subject to the risk that the controls may become inadequate because of changes in conditions, or that the degree of compliance with the policies or procedures may deteriorate. In our opinion, the consolidated financial statements referred to above present fairly, in all material respects, the financial position of Northeast Utilities and subsidiaries as of December 31, 2010 and 2009, and the results of their operations and their cash flows for each of the three years in the period ended December 31, 2010, in conformity with accounting principles generally accepted in the United States of America. Also, in our opinion, such consolidated financial statement schedules, when considered in relation to the basic consolidated financial statements taken as a whole, present fairly, in all material respects, the information set forth therein. Also, in our opinion, the Company maintained, in all material respects, effective internal control over financial reporting as of December 31, 2010, based on the criteria established in Internal Control — Integrated Framework issued by the Committee of Sponsoring Organizations of the Treadway Commission. /s/ Deloitte & Touche LLP Deloitte & Touche LLP Hartford, Connecticut February 25, 2011

58
NORTHEAST UTILITIES AND SUBSIDIARIES CONSOLIDATED BALANCE SHEETS As of December 31, (Thousands of Dollars) 2010 2009 ASSETS Current Assets: Cash and Cash Equivalents $ 23,395 $ 26,952 Receivables, Net 523,644 512,770 Unbilled Revenues 208,834 229,326 Taxes Receivable 89,638 27,600 Fuel, Materials and Supplies 244,043 277,085 Marketable Securities 78,306 66,236 Derivative Assets 17,287 31,785 Prepayments and Other Current Assets 132,595 96,100 Total Current Assets 1,317,742 1,267,854 Property, Plant and Equipment, Net 9,567,726 8,839,965 Deferred Debits and Other Assets: Regulatory Assets 2,995,279 3,244,931 Goodwill 287,591 287,591 Marketable Securities 51,201 54,905 Derivative Assets 123,242 189,751 Other Long-Term Assets 179,261 172,682 Total Deferred Debits and Other Assets 3,636,574 3,949,860 Total Assets $ 14,522,042 $ 14,057,679 The accompanying notes are an integral part of these consolidated financial statements.
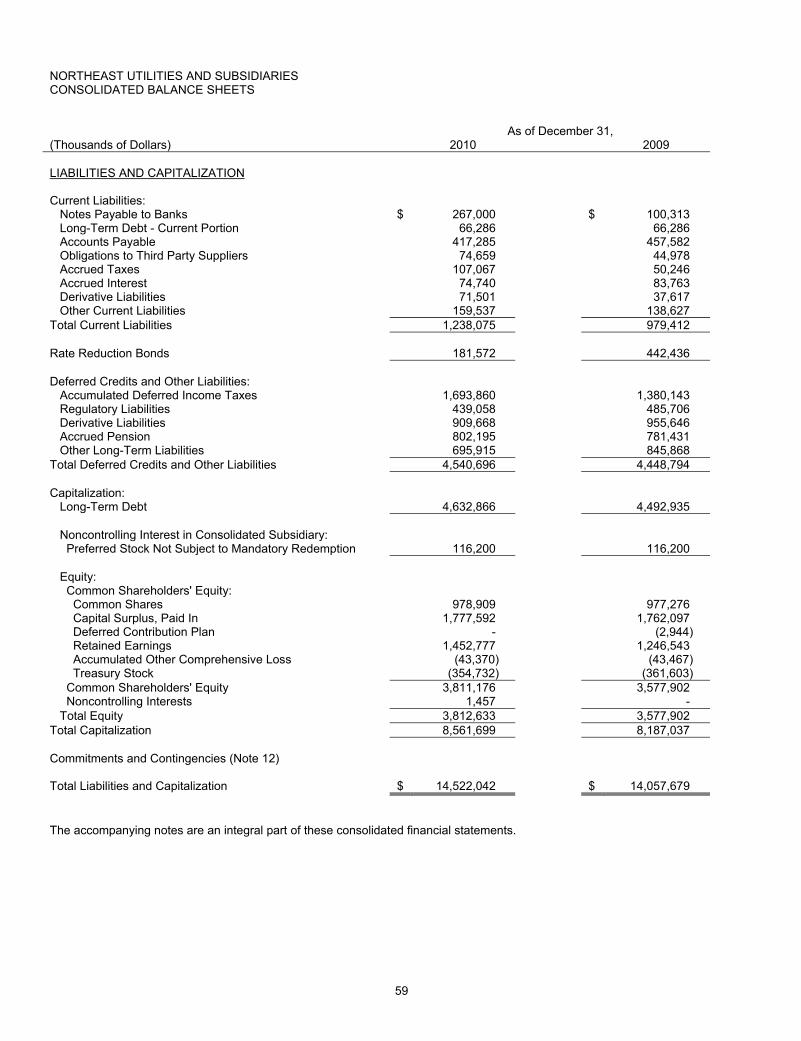
59
NORTHEAST UTILITIES AND SUBSIDIARIES CONSOLIDATED BALANCE SHEETS
As of December 31, (Thousands of Dollars) 2010 2009 LIABILITIES AND CAPITALIZATION Current Liabilities: Notes Payable to Banks $ 267,000 $ 100,313 Long-Term Debt - Current Portion 66,286 66,286 Accounts Payable 417,285 457,582 Obligations to Third Party Suppliers 74,659 44,978 Accrued Taxes 107,067 50,246 Accrued Interest 74,740 83,763 Derivative Liabilities 71,501 37,617 Other Current Liabilities 159,537 138,627 Total Current Liabilities 1,238,075 979,412 Rate Reduction Bonds 181,572 442,436
Deferred Credits and Other Liabilities: Accumulated Deferred Income Taxes 1,693,860 1,380,143 Regulatory Liabilities 439,058 485,706 Derivative Liabilities 909,668 955,646 Accrued Pension 802,195 781,431 Other Long-Term Liabilities 695,915 845,868 Total Deferred Credits and Other Liabilities 4,540,696 4,448,794
Capitalization: Long-Term Debt 4,632,866 4,492,935 Noncontrolling Interest in Consolidated Subsidiary: Preferred Stock Not Subject to Mandatory Redemption 116,200 116,200 Equity: Common Shareholders' Equity: Common Shares 978,909 977,276 Capital Surplus, Paid In 1,777,592 1,762,097 Deferred Contribution Plan - (2,944) Retained Earnings 1,452,777 1,246,543 Accumulated Other Comprehensive Loss (43,370) (43,467) Treasury Stock (354,732) (361,603) Common Shareholders' Equity 3,811,176 3,577,902 Noncontrolling Interests 1,457 - Total Equity 3,812,633 3,577,902 Total Capitalization 8,561,699 8,187,037
Commitments and Contingencies (Note 12) Total Liabilities and Capitalization $ 14,522,042 $ 14,057,679 The accompanying notes are an integral part of these consolidated financial statements.

60
NORTHEAST UTILITIES AND SUBSIDIARIES CONSOLIDATED STATEMENTS OF INCOME For the Years Ended December 31, (Thousands of Dollars, Except Share Information) 2010 2009 2008 Operating Revenues $ 4,898,167 $ 5,439,430 $ 5,800,095 Operating Expenses: Fuel, Purchased and Net Interchange Power 1,985,634 2,629,619 2,996,180 Other Operating Expenses 958,417 1,001,190 1,021,704 Maintenance 210,283 234,173 254,038 Depreciation 300,737 309,618 278,588 Amortization of Regulatory Assets, Net 95,593 13,315 186,396 Amortization of Rate Reduction Bonds 232,871 217,941 204,859 Taxes Other Than Income Taxes 314,741 282,199 267,565 Total Operating Expenses 4,098,276 4,688,055 5,209,330 Operating Income 799,891 751,375 590,765 Interest Expense: Interest on Long-Term Debt 231,089 224,712 193,883 Interest on Rate Reduction Bonds 20,573 36,524 50,231 Other Interest (Note 11) (14,371) 12,401 25,031 Interest Expense 237,291 273,637 269,145 Other Income, Net 41,916 37,801 50,428 Income Before Income Tax Expense 604,516 515,539 372,048 Income Tax Expense 210,409 179,947 105,661 Net Income 394,107 335,592 266,387 Net Income Attributable to Noncontrolling Interests 6,158 5,559 5,559 Net Income Attributable to Controlling Interests $ 387,949 $ 330,033 $ 260,828 Basic Earnings Per Common Share $ 2.20 $ 1.91 $ 1.68 Diluted Earnings Per Common Share $ 2.19 $ 1.91 $ 1.67 Weighted Average Common Shares Outstanding: Basic 176,636,086 172,567,928 155,531,846 Diluted 176,885,387 172,717,246 155,999,240 The accompanying notes are an integral part of these consolidated financial statements.
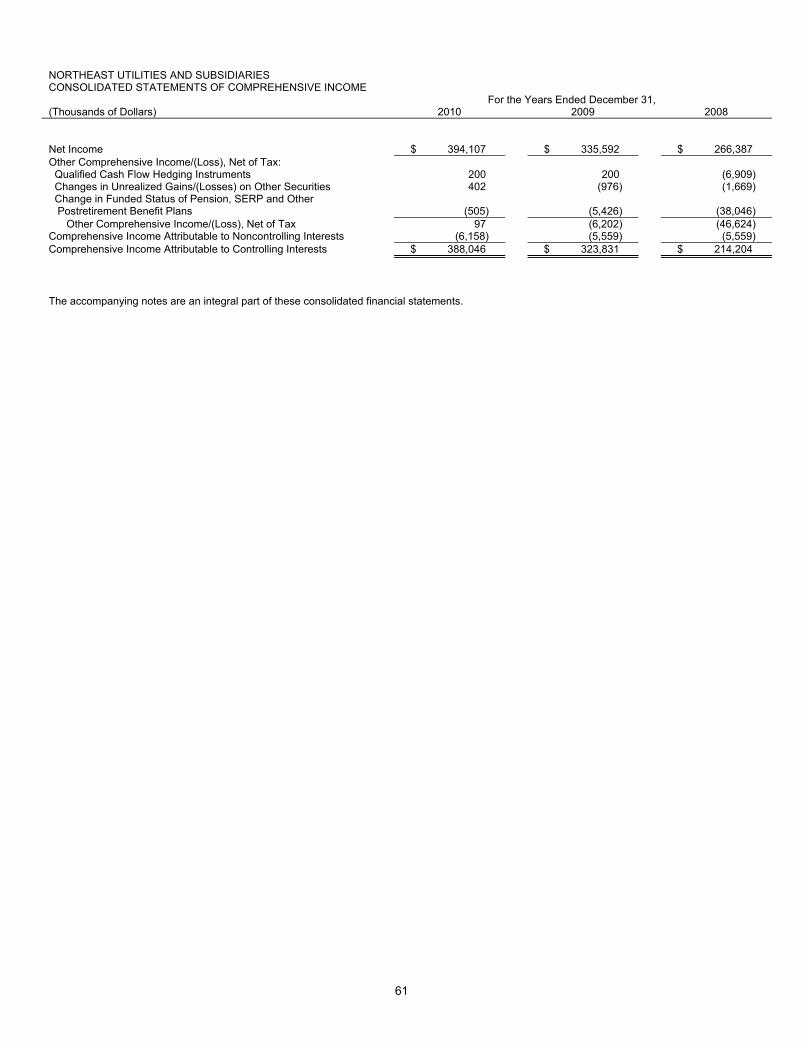
61
NORTHEAST UTILITIES AND SUBSIDIARIES CONSOLIDATED STATEMENTS OF COMPREHENSIVE INCOME For the Years Ended December 31, (Thousands of Dollars) 2010 2009 2008 Net Income $ 394,107 $ 335,592 $ 266,387 Other Comprehensive Income/(Loss), Net of Tax: Qualified Cash Flow Hedging Instruments 200 200 (6,909) Changes in Unrealized Gains/(Losses) on Other Securities 402 (976) (1,669) Change in Funded Status of Pension, SERP and Other Postretirement Benefit Plans (505) (5,426) (38,046) Other Comprehensive Income/(Loss), Net of Tax 97 (6,202) (46,624) Comprehensive Income Attributable to Noncontrolling Interests (6,158) (5,559) (5,559) Comprehensive Income Attributable to Controlling Interests $ 388,046 $ 323,831 $ 214,204 The accompanying notes are an integral part of these consolidated financial statements.

62
NORTHEAST UTILITIES AND SUBSIDIARIES CONSOLIDATED STATEMENTS OF COMMON SHAREHOLDERS' EQUITY
Accumulated Total Capital Deferred Other Common
Common Shares Surplus, Contribution Retained Comprehensive Treasury Shareholders' (Thousands of Dollars, Except Share Information) Shares Amount Paid In Plan Earnings Income/(Loss) Stock Equity Balance as of January 1, 2008 155,079,770 $879,623 $1,465,946 $ (26,352) $ 946,792 $ 9,359 $ (361,533) $ 2,913,835 Net Income 266,387 266,387 Dividends on Common Shares - $0.825 Per Share (129,026) (129,026) Issuance of Common Shares, $5 Par Value 287,581 1,438 4,086 5,524 Dividends on Preferred Stock (5,559) (5,559) Allocation of Benefits – ESOP 469,601 865 10,871 11,736 Change in Restricted Shares, Net (2,591) 2,436 (70) 2,366 Tax Deduction for Stock Options Exercised and Employee Stock Purchase Plan Disqualifying Dispositions 1,622 1,622 Capital Stock Expenses, Net 51 51 Other Comprehensive Loss (46,624) (46,624) Balance as of December 31, 2008 155,834,361 881,061 1,475,006 (15,481) 1,078,594 (37,265) (361,603) 3,020,312 Adoption of Accounting Guidance for Other-Than- Temporary Impairments (Note 1K) 728 (728) - Net Income 335,592 335,592 Dividends on Common Shares - $0.95 Per Share (162,812) (162,812) Issuance of Common Shares, $5 Par Value 19,242,939 96,215 293,502 389,717 Dividends on Preferred Stock (5,559) (5,559) Allocation of Benefits – ESOP 542,724 (98) 12,537 12,439 Change in Restricted Shares, Net 5,303 5,303 Tax Deduction for Stock Options Exercised and Employee Stock Purchase Plan Disqualifying Dispositions 913 913 Capital Stock Expenses, Net (12,529) (12,529) Other Comprehensive Loss (5,474) (5,474) Balance as of December 31, 2009 175,620,024 977,276 1,762,097 (2,944) 1,246,543 (43,467) (361,603) 3,577,902 Net Income 394,107 394,107 Dividends on Common Shares - $1.025 Per Share (181,715) (181,715) Issuance of Common Shares, $5 Par Value 326,526 1,633 5,745 7,378 Dividends on Preferred Stock (6,101) (6,101) Net Income Attributable to Noncontrolling Interests (57) (57) Allocation of Benefits – ESOP 127,054 439 2,944 3,383 ESOP Benefits from Treasury Shares 3,856 (3,856) - Change in Restricted Shares, Net 4,868 4,868 Change in Treasury Stock 374,477 10,727 10,727 Tax Deduction for Stock Options Exercised and Employee Stock Purchase Plan Disqualifying Dispositions 866 866 Capital Stock Expenses, Net (279) (279) Other Comprehensive Income 97 97 Balance as of December 31, 2010 176,448,081 $978,909 $ 1,777,592 $ - $ 1,452,777 $ (43,370) $ (354,732) $ 3,811,176 The accompanying notes are an integral part of these consolidated financial statements.

63
NORTHEAST UTILITIES AND SUBSIDIARIES CONSOLIDATED STATEMENTS OF CASH FLOWS For the Years Ended December 31, (Thousands of Dollars) 2010 2009 2008 Operating Activities: Net Income $ 394,107 $ 335,592 $ 266,387 Adjustments to Reconcile Net Income to Net Cash Flows Provided by Operating Activities: Bad Debt Expense 31,352 53,947 28,573 Depreciation 300,737 309,618 278,588 Deferred Income Taxes 210,939 125,890 86,810 Pension and PBOP Expense, Net of PBOP Contributions 58,228 21,572 (3,839) Pension Contribution (45,000) - - Regulatory Overrecoveries/(Underrecoveries), Net 20,750 37,868 (185,252) Amortization of Regulatory Assets, Net 95,593 13,315 186,396 Amortization of Rate Reduction Bonds 232,871 217,941 204,859 Derivative Assets and Liabilities (11,812) (18,798) (37,052) Other (72,151) (26,003) (51,787) Changes in Current Assets and Liabilities: Receivables and Unbilled Revenues, Net (51,285) 91,081 (141,879) Investments in Securitizable Assets - - (25,787) Fuel, Materials and Supplies 38,126 25,957 (74,531) Taxes Receivable/Accrued (82,103) 16,194 63,251 Accounts Payable (44,355) (208,180) 72,791 Other Current Assets and Liabilities 17,466 (6,876) (12,551) Net Cash Flows Provided by Operating Activities 1,093,463 989,118 654,977 Investing Activities: Investments in Property, Plant and Equipment (954,472) (908,146) (1,255,407) Proceeds from Sales of Marketable Securities 174,865 208,947 259,361 Purchases of Marketable Securities (177,204) (211,243) (262,357) Other Investing Activities (1,157) 7,963 5,046 Net Cash Flows Used in Investing Activities (957,968) (902,479) (1,253,357) Financing Activities: Issuance of Common Shares - 383,295 - Cash Dividends on Common Shares (180,542) (162,381) (129,077) Cash Dividends on Preferred Stock (5,559) (5,559) (5,559) Increase/(Decrease) in Short-Term Debt 166,687 (518,584) 539,897 Issuance of Long-Term Debt 145,000 462,000 760,000 Retirements of Long-Term Debt (4,286) (54,286) (261,286) Retirements of Rate Reduction Bonds (260,864) (244,075) (230,925) Other Financing Activities 512 (9,913) 42 Net Cash Flows (Used In)/Provided by Financing Activities (139,052) (149,503) 673,092 Net (Decrease)/Increase in Cash and Cash Equivalents (3,557) (62,864) 74,712 Cash and Cash Equivalents - Beginning of Year 26,952 89,816 15,104 Cash and Cash Equivalents – End of Year $ 23,395 $ 26,952 $ 89,816 The accompanying notes are an integral part of these consolidated financial statements.

64
NORTHEAST UTILITIES AND SUBSIDIARIES CONSOLIDATED STATEMENTS OF CAPITALIZATION As of December 31, (Thousands of Dollars) 2010 2009 Common Shareholders’ Equity $ 3,811,176 $ 3,577,902 Noncontrolling Interests 1,457 - Preferred Stock: CL&P Preferred Stock Not Subject to Mandatory Redemption - $50 par value - authorized 9,000,000 shares in 2010 and 2009; 2,324,000 shares outstanding in 2010 and 2009; Dividend rates of $1.90 to $3.24; Current redemption prices of $50.50 to $54.00 116,200 116,200 Long-Term Debt: First Mortgage Bonds: Final Maturity Interest Rates
2010-2012 7.19% 8,571 12,857 2014-2018 4.80% to 6.90% 1,205,000 1,205,000 2019-2024 4.50% to 8.48% 659,845 609,845 2034-2037 5.35% to 6.375% 830,000 830,000
Total First Mortgage Bonds 2,703,416 2,657,702 Other Long-Term Debt: Pollution Control Notes:
2016-2018 5.90% 25,400 25,400 2021-2022 Variable Rate and 4.75% to 6.00% 428,285 428,285 2028 5.85% to 5.95% 369,300 369,300 2031 (Note 9) 1.40% 62,000 62,000 Other: 2012-2020 5.00% to 7.25% 713,000 618,000 2034-2037 5.90% to 6.70% 90,000 90,000
Total Pollution Control Notes and Other 1,687,985 1,592,985 Total First Mortgage Bonds, Pollution Control Notes and Other 4,391,401 4,250,687 Fees and Interest Due for Spent Nuclear Fuel Disposal Costs 301,042 300,647 Change in Fair Value Resulting from Interest Rate Hedge Instrument 11,859 13,258 Unamortized Premium and Discount, Net and Other (5,150) (5,371) Total Long-Term Debt 4,699,152 4,559,221 Less: Amounts Due Within One Year 66,286 66,286 Long-Term Debt 4,632,866 4,492,935 Total Capitalization $ 8,561,699 $ 8,187,037 The accompanying notes are an integral part of these consolidated financial statements. [The 2010 financial statements for CL&P, PSNH and WMECO are omitted from this report but are set forth in the Annual Report on Form 10-K for 2010 filed on a combined basis with NU with the SEC on February 25, 2011. Such report is also available at the Investors section on www.nu.com. ]
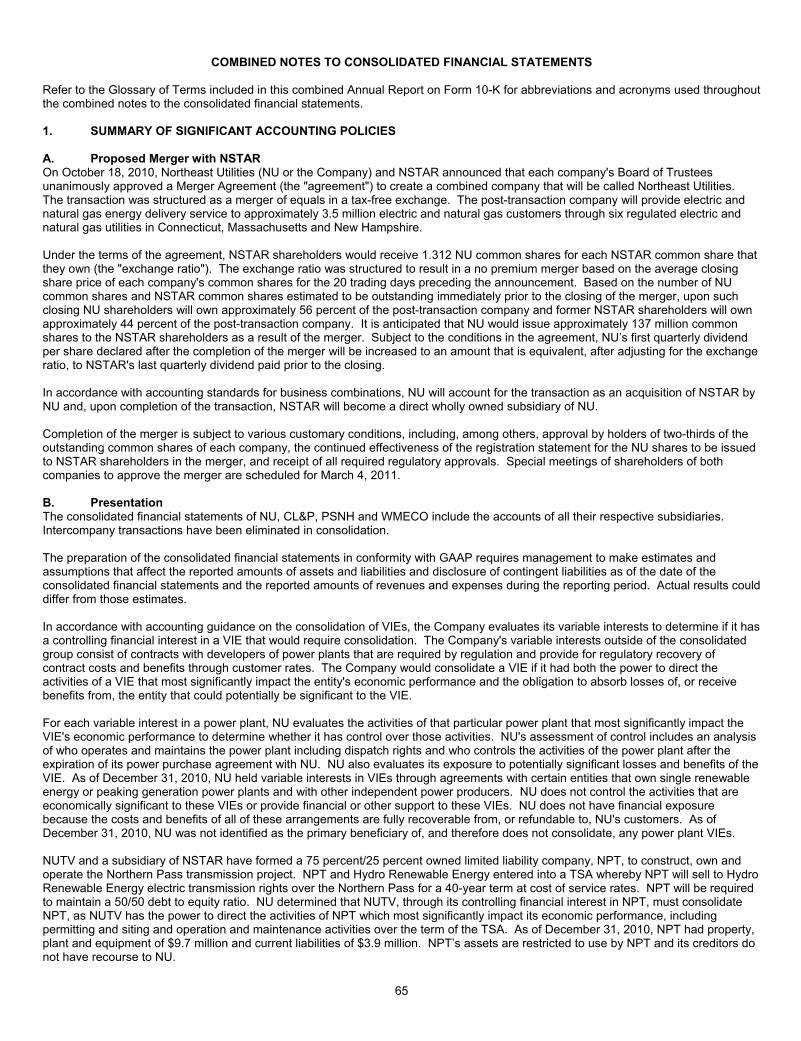
65
COMBINED NOTES TO CONSOLIDATED FINANCIAL STATEMENTS Refer to the Glossary of Terms included in this combined Annual Report on Form 10-K for abbreviations and acronyms used throughout the combined notes to the consolidated financial statements. 1. SUMMARY OF SIGNIFICANT ACCOUNTING POLICIES A. Proposed Merger with NSTAR On October 18, 2010, Northeast Utilities (NU or the Company) and NSTAR announced that each company's Board of Trustees unanimously approved a Merger Agreement (the "agreement") to create a combined company that will be called Northeast Utilities. The transaction was structured as a merger of equals in a tax-free exchange. The post-transaction company will provide electric and natural gas energy delivery service to approximately 3.5 million electric and natural gas customers through six regulated electric and natural gas utilities in Connecticut, Massachusetts and New Hampshire. Under the terms of the agreement, NSTAR shareholders would receive 1.312 NU common shares for each NSTAR common share that they own (the "exchange ratio"). The exchange ratio was structured to result in a no premium merger based on the average closing share price of each company's common shares for the 20 trading days preceding the announcement. Based on the number of NU common shares and NSTAR common shares estimated to be outstanding immediately prior to the closing of the merger, upon such closing NU shareholders will own approximately 56 percent of the post-transaction company and former NSTAR shareholders will own approximately 44 percent of the post-transaction company. It is anticipated that NU would issue approximately 137 million common shares to the NSTAR shareholders as a result of the merger. Subject to the conditions in the agreement, NU’s first quarterly dividend per share declared after the completion of the merger will be increased to an amount that is equivalent, after adjusting for the exchange ratio, to NSTAR's last quarterly dividend paid prior to the closing. In accordance with accounting standards for business combinations, NU will account for the transaction as an acquisition of NSTAR by NU and, upon completion of the transaction, NSTAR will become a direct wholly owned subsidiary of NU. Completion of the merger is subject to various customary conditions, including, among others, approval by holders of two-thirds of the outstanding common shares of each company, the continued effectiveness of the registration statement for the NU shares to be issued to NSTAR shareholders in the merger, and receipt of all required regulatory approvals. Special meetings of shareholders of both companies to approve the merger are scheduled for March 4, 2011. B. Presentation The consolidated financial statements of NU, CL&P, PSNH and WMECO include the accounts of all their respective subsidiaries. Intercompany transactions have been eliminated in consolidation. The preparation of the consolidated financial statements in conformity with GAAP requires management to make estimates and assumptions that affect the reported amounts of assets and liabilities and disclosure of contingent liabilities as of the date of the consolidated financial statements and the reported amounts of revenues and expenses during the reporting period. Actual results could differ from those estimates. In accordance with accounting guidance on the consolidation of VIEs, the Company evaluates its variable interests to determine if it has a controlling financial interest in a VIE that would require consolidation. The Company's variable interests outside of the consolidated group consist of contracts with developers of power plants that are required by regulation and provide for regulatory recovery of contract costs and benefits through customer rates. The Company would consolidate a VIE if it had both the power to direct the activities of a VIE that most significantly impact the entity's economic performance and the obligation to absorb losses of, or receive benefits from, the entity that could potentially be significant to the VIE. For each variable interest in a power plant, NU evaluates the activities of that particular power plant that most significantly impact the VIE's economic performance to determine whether it has control over those activities. NU's assessment of control includes an analysis of who operates and maintains the power plant including dispatch rights and who controls the activities of the power plant after the expiration of its power purchase agreement with NU. NU also evaluates its exposure to potentially significant losses and benefits of the VIE. As of December 31, 2010, NU held variable interests in VIEs through agreements with certain entities that own single renewable energy or peaking generation power plants and with other independent power producers. NU does not control the activities that are economically significant to these VIEs or provide financial or other support to these VIEs. NU does not have financial exposure because the costs and benefits of all of these arrangements are fully recoverable from, or refundable to, NU's customers. As of December 31, 2010, NU was not identified as the primary beneficiary of, and therefore does not consolidate, any power plant VIEs. NUTV and a subsidiary of NSTAR have formed a 75 percent/25 percent owned limited liability company, NPT, to construct, own and operate the Northern Pass transmission project. NPT and Hydro Renewable Energy entered into a TSA whereby NPT will sell to Hydro Renewable Energy electric transmission rights over the Northern Pass for a 40-year term at cost of service rates. NPT will be required to maintain a 50/50 debt to equity ratio. NU determined that NUTV, through its controlling financial interest in NPT, must consolidate NPT, as NUTV has the power to direct the activities of NPT which most significantly impact its economic performance, including permitting and siting and operation and maintenance activities over the term of the TSA. As of December 31, 2010, NPT had property, plant and equipment of $9.7 million and current liabilities of $3.9 million. NPT’s assets are restricted to use by NPT and its creditors do not have recourse to NU.

66
The Company does not have any variable interests in an unconsolidated VIE that are material to the accompanying consolidated financial statements. In accordance with accounting guidance on noncontrolling interests in consolidated financial statements effective January 1, 2009, the Preferred Stock of CL&P, which is not owned by NU or its consolidated subsidiaries and is not subject to mandatory redemption, has been presented as a noncontrolling interest in CL&P in the accompanying consolidated financial statements of NU. The Preferred Stock of CL&P is considered to be temporary equity and has been classified between liabilities and permanent shareholders' equity on the accompanying consolidated balance sheets of NU and CL&P due to a provision in CL&P's certificate of incorporation that grants preferred stockholders the right to elect a majority of CL&P's board of directors should certain conditions exist, such as if preferred dividends are in arrears for one year. The Net Income reported in the accompanying consolidated statements of income and cash flows represents consolidated net income prior to apportionment to noncontrolling interests, which is represented by dividends on preferred stock of CL&P and NSTAR's portion of the net income of NPT. The included presentation and disclosure requirements effective January 1, 2009 have been applied retrospectively to the consolidated statements of income, comprehensive income, common shareholders' equity, and cash flows for the year ended December 31, 2008. For the years ended December 31, 2010, 2009 and 2008, there was no change in NU parent's 100 percent ownership of the common equity of CL&P. Certain other reclassifications of prior period data were made in the accompanying consolidated balance sheets and statements of cash flows for all companies presented. These reclassifications were made to conform to the current year's presentation. NU evaluates events and transactions that occur after the balance sheet date but before financial statements are issued and recognizes in the financial statements the effects of all subsequent events that provide additional evidence about conditions that existed as of the balance sheet date and discloses but does not recognize in the financial statements subsequent events that provide evidence about the conditions that arose after the balance sheet date but before the financial statements are issued. See Note 22, "Subsequent Event," for further information. C. About NU, CL&P, PSNH and WMECO Consolidated: NU is the parent company of CL&P, PSNH, WMECO, Yankee Gas and NU Enterprises, as described below. NU was formed on July 1, 1966 when CL&P, WMECO and The Hartford Electric Light Company affiliated under the common ownership of NU. In 1992, PSNH became a subsidiary of NU. On March 1, 2000, natural gas became an integral part of NU's Connecticut operations when NU's merger with Yankee and its principal subsidiary, Yankee Gas, was completed. CL&P, PSNH and WMECO are reporting companies under the Securities Exchange Act of 1934. NU is a public utility holding company under the Public Utility Holding Company Act of 2005. Arrangements among the regulated electric companies, NU Enterprises and other NU companies, outside agencies and other utilities covering interconnections, interchange of electric power and sales of utility property are subject to regulation by the FERC. The Regulated companies are subject to further regulation for rates, accounting and other matters by the FERC and/or applicable state regulatory commissions (the DPUC for CL&P and Yankee Gas, the NHPUC as well as certain regulatory oversight by the Vermont Department of Public Service and the Maine Public Utilities Commission for PSNH, and the DPU for WMECO). Regulated Companies: CL&P, PSNH and WMECO furnish franchised retail electric service in Connecticut, New Hampshire and Massachusetts, respectively. Yankee Gas owns and operates Connecticut's largest natural gas distribution system. CL&P, PSNH and WMECO's results include the operations of their respective distribution and transmission segments. PSNH's and WMECO's distribution results include the operations of their respective generation businesses. Yankee Gas' results include the operations of its natural gas distribution segment. NPT was formed to construct, own and operate the Northern Pass line, a new HVDC transmission line from Québec to New Hampshire that will interconnect with a new HVDC transmission line being developed by a transmission subsidiary of HQ. NU Enterprises: NU Enterprises is the parent company of Select Energy, Boulos, NGS, NGS Mechanical and SECI. As of December 31, 2010, NU Enterprises’ primary business consisted of (i) Select Energy’s remaining energy wholesale marketing contracts, and (ii) NGS’ operation and maintenance agreements as well as its subsidiary, Boulos, an electrical contractor based in Maine that NU Enterprises continues to own and manage. D. Cash and Cash Equivalents Cash and cash equivalents include cash on hand and short-term cash investments that are highly liquid in nature and have original maturities of three months or less. At the end of each reporting period, any overdraft amounts are reclassified from Cash and Cash Equivalents to Accounts Payable on the accompanying consolidated balance sheets. E. Restricted Cash As of December 31, 2009, PSNH had $10 million of restricted cash held with a trustee related to insurance proceeds received on bondable property, which was included in Prepayments and Other Current Assets on the accompanying consolidated balance sheet. These funds were released from the trustee during the second quarter of 2010 and there was no restricted cash held as of December 31, 2010.
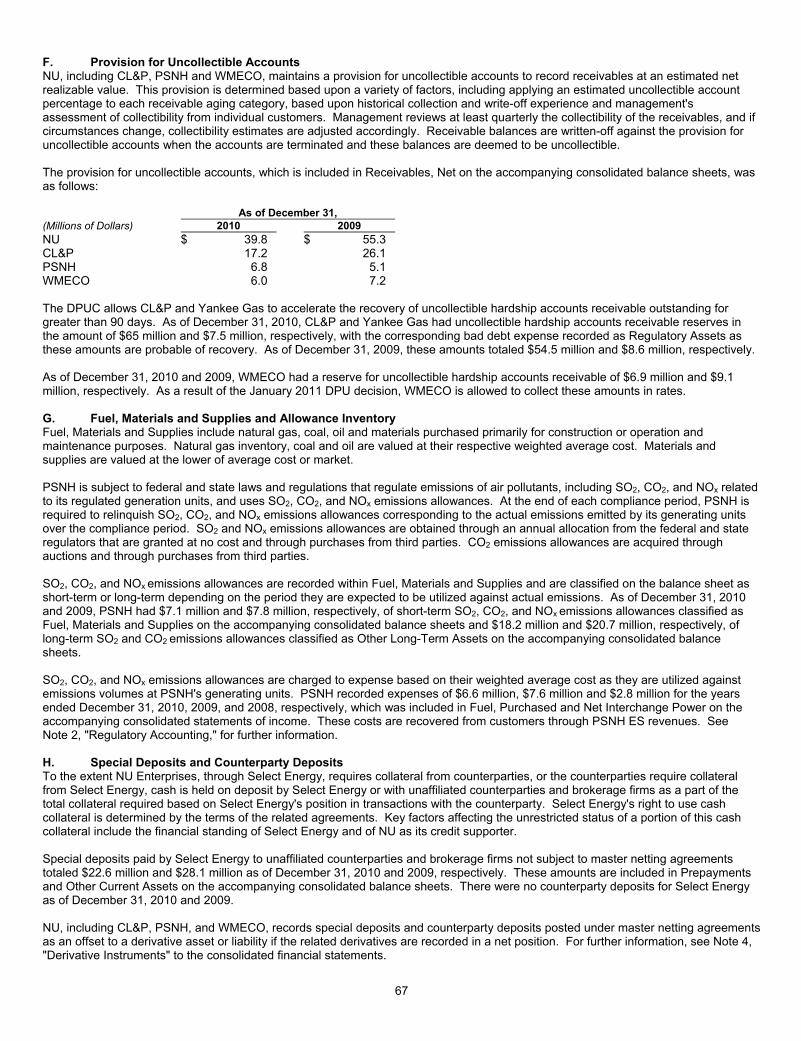
67
F. Provision for Uncollectible Accounts NU, including CL&P, PSNH and WMECO, maintains a provision for uncollectible accounts to record receivables at an estimated net realizable value. This provision is determined based upon a variety of factors, including applying an estimated uncollectible account percentage to each receivable aging category, based upon historical collection and write-off experience and management's assessment of collectibility from individual customers. Management reviews at least quarterly the collectibility of the receivables, and if circumstances change, collectibility estimates are adjusted accordingly. Receivable balances are written-off against the provision for uncollectible accounts when the accounts are terminated and these balances are deemed to be uncollectible. The provision for uncollectible accounts, which is included in Receivables, Net on the accompanying consolidated balance sheets, was as follows: As of December 31, (Millions of Dollars) 2010 2009 NU $ 39.8 $ 55.3 CL&P 17.2 26.1 PSNH 6.8 5.1 WMECO 6.0 7.2 The DPUC allows CL&P and Yankee Gas to accelerate the recovery of uncollectible hardship accounts receivable outstanding for greater than 90 days. As of December 31, 2010, CL&P and Yankee Gas had uncollectible hardship accounts receivable reserves in the amount of $65 million and $7.5 million, respectively, with the corresponding bad debt expense recorded as Regulatory Assets as these amounts are probable of recovery. As of December 31, 2009, these amounts totaled $54.5 million and $8.6 million, respectively. As of December 31, 2010 and 2009, WMECO had a reserve for uncollectible hardship accounts receivable of $6.9 million and $9.1 million, respectively. As a result of the January 2011 DPU decision, WMECO is allowed to collect these amounts in rates. G. Fuel, Materials and Supplies and Allowance Inventory Fuel, Materials and Supplies include natural gas, coal, oil and materials purchased primarily for construction or operation and maintenance purposes. Natural gas inventory, coal and oil are valued at their respective weighted average cost. Materials and supplies are valued at the lower of average cost or market. PSNH is subject to federal and state laws and regulations that regulate emissions of air pollutants, including SO2, CO2, and NOx related to its regulated generation units, and uses SO2, CO2, and NOx emissions allowances. At the end of each compliance period, PSNH is required to relinquish SO2, CO2, and NOx emissions allowances corresponding to the actual emissions emitted by its generating units over the compliance period. SO2 and NOx emissions allowances are obtained through an annual allocation from the federal and state regulators that are granted at no cost and through purchases from third parties. CO2 emissions allowances are acquired through auctions and through purchases from third parties. SO2, CO2, and NOx emissions allowances are recorded within Fuel, Materials and Supplies and are classified on the balance sheet as short-term or long-term depending on the period they are expected to be utilized against actual emissions. As of December 31, 2010 and 2009, PSNH had $7.1 million and $7.8 million, respectively, of short-term SO2, CO2, and NOx emissions allowances classified as Fuel, Materials and Supplies on the accompanying consolidated balance sheets and $18.2 million and $20.7 million, respectively, of long-term SO2 and CO2 emissions allowances classified as Other Long-Term Assets on the accompanying consolidated balance sheets. SO2, CO2, and NOx emissions allowances are charged to expense based on their weighted average cost as they are utilized against emissions volumes at PSNH's generating units. PSNH recorded expenses of $6.6 million, $7.6 million and $2.8 million for the years ended December 31, 2010, 2009, and 2008, respectively, which was included in Fuel, Purchased and Net Interchange Power on the accompanying consolidated statements of income. These costs are recovered from customers through PSNH ES revenues. See Note 2, "Regulatory Accounting," for further information. H. Special Deposits and Counterparty Deposits To the extent NU Enterprises, through Select Energy, requires collateral from counterparties, or the counterparties require collateral from Select Energy, cash is held on deposit by Select Energy or with unaffiliated counterparties and brokerage firms as a part of the total collateral required based on Select Energy's position in transactions with the counterparty. Select Energy's right to use cash collateral is determined by the terms of the related agreements. Key factors affecting the unrestricted status of a portion of this cash collateral include the financial standing of Select Energy and of NU as its credit supporter. Special deposits paid by Select Energy to unaffiliated counterparties and brokerage firms not subject to master netting agreements totaled $22.6 million and $28.1 million as of December 31, 2010 and 2009, respectively. These amounts are included in Prepayments and Other Current Assets on the accompanying consolidated balance sheets. There were no counterparty deposits for Select Energy as of December 31, 2010 and 2009. NU, including CL&P, PSNH, and WMECO, records special deposits and counterparty deposits posted under master netting agreements as an offset to a derivative asset or liability if the related derivatives are recorded in a net position. For further information, see Note 4, "Derivative Instruments" to the consolidated financial statements.

68
NU, CL&P, PSNH and WMECO have established credit policies regarding counterparties to minimize overall credit risk. These policies require an evaluation of potential counterparties, financial condition, collateral requirements and the use of standardized agreements that allow for the netting of positive and negative exposures associated with a single counterparty. These evaluations result in established credit limits prior to entering into a contract. As of December 31, 2010 and 2009, there were no counterparty deposits for these companies. CL&P, PSNH and WMECO had amounts on deposit related to subsidiaries used to facilitate the issuance of RRBs. In addition, CL&P, PSNH and WMECO had other cash deposits held with unaffiliated parties as of December 31, 2010 and 2009. These amounts were as follows: As of December 31, 2010 2009 (Millions of Dollars) NU NU Rate Reduction Bond Deposits $ 53.1 $ 40.2 Other Deposits 7.3 8.1 As of December 31, 2010 2009 (Millions of Dollars) CL&P PSNH WMECO CL&P PSNH WMECO Rate Reduction Bond Deposits $ 22.1 $ 26.9 $ 4.1 $ 16.8 $ 19.7 $ 3.7 Other Deposits 2.1 2.8 1.2 5.0 2.2 - These amounts are included in Other Long-Term Assets on the accompanying consolidated balance sheets. I. Fair Value Measurements NU, including CL&P, PSNH, and WMECO, applies fair value measurement guidance to all derivative contracts recorded at fair value and to the marketable securities held in the NU supplemental benefit trust and WMECO's spent nuclear fuel trust. Fair value measurement guidance is also applied to investment valuations used to calculate the funded status of NU's Pension and PBOP plans and non-recurring fair value measurements of NU's non-financial assets and liabilities, such as AROs and Yankee Gas' goodwill. Upon adoption of fair value measurement guidance, the Company recorded a pre-tax charge to Net Income of $6.1 million as of January 1, 2008 related to derivative liabilities for its remaining unregulated wholesale marketing contracts. In 2010, 2009 and 2008, the Company recorded benefits of $0.8 million, $0.7 million and $0.8 million, respectively, to partially reverse the exit price impact recorded as the Company served out rather than exited its one remaining fixed price forward sales contract. In 2008, the Company also recorded a benefit of $1.8 million related to a contract that expired in May 2008. Fair Value Hierarchy: In measuring fair value, NU uses observable market data when available and minimizes the use of unobservable inputs. Unobservable inputs are needed to value certain derivative contracts due to complexities in the terms of the contracts. Inputs used in fair value measurements are categorized into three fair value hierarchy levels for disclosure purposes. The entire fair value measurement is categorized based on the lowest level of input that is significant to the fair value measurement. NU evaluates the classification of assets and liabilities measured at fair value on a quarterly basis, and NU's policy is to recognize transfers between levels of the fair value hierarchy as of the end of the reporting period. The three levels of the fair value hierarchy are described below:
Level 1 - Inputs are quoted prices (unadjusted) in active markets for identical assets or liabilities as of the reporting date. Active markets are those in which transactions for the asset or liability occur in sufficient frequency and volume to provide pricing information on an ongoing basis.
Level 2 - Inputs are quoted prices for similar instruments in active markets, quoted prices for identical or similar instruments in markets that are not active, and model-derived valuations in which all significant inputs are observable.
Level 3 - Quoted market prices are not available. Fair value is derived from valuation techniques in which one or more significant inputs or assumptions are unobservable. Where possible, valuation techniques incorporate observable market inputs that can be validated to external sources such as industry exchanges, including prices of energy and energy-related products. Significant unobservable inputs are used in the valuations, including items such as energy and energy-related product prices in future years for which observable prices are not yet available, future contract quantities under full-requirements or supplemental sales contracts, and market volatilities. Items valued using these valuation techniques are classified according to the lowest level for which there is at least one input that is significant to the valuation. Therefore, an item may be classified in Level 3 even though there may be some significant inputs that are readily observable.
Determination of Fair Value: The valuation techniques and inputs used in NU's fair value measurements are described in Note 4, "Derivative Instruments," and Note 5, "Marketable Securities," to the consolidated financial statements. There were no changes to the valuation methodologies for derivative instruments or marketable securities as of December 31, 2010 and 2009.
69
J. Derivative Accounting Most of CL&P and PSNH's contracts for the purchase and sale of energy or energy related products are derivatives, along with all but one of NU Enterprises' remaining wholesale marketing contracts. The accounting treatment for energy contracts entered into varies and depends on the intended use of the particular contract and on whether or not the contract is a derivative. The application of derivative accounting is complex and requires management judgment in the following respects: identification of derivatives and embedded derivatives, election and designation of the "normal purchases or normal sales" (normal) exception, identifying, electing and designating hedge relationships, assessing and measuring hedge ineffectiveness, and determining the fair value of derivatives. All of these judgments, depending upon their timing and effect, can have a significant impact on the consolidated financial statements. The fair value of derivatives is based upon the contract terms and conditions and the underlying market price or fair value per unit. When quantities are not specified in the contract, the Company determines whether it is a derivative by using amounts referenced in default provisions and other relevant sections of the contract. The estimated quantities to be served are updated during the term of the contract, and such updates can have a material impact on mark-to-market amounts. The fair value of derivative assets and liabilities with the same counterparty are offset and recorded as a net derivative asset or liability to the consolidated balance sheets. The judgment applied in the election of the normal exception (and resulting accrual accounting) includes the conclusion that it is probable at the inception of the contract and throughout its term that it will result in physical delivery of the underlying product and that the quantities will be used or sold by the business over a reasonable period in the normal course of business. The Company has elected normal on many derivative contracts, including all of WMECO's derivative contracts. If facts and circumstances change and management can no longer support this conclusion, then the normal exception and accrual accounting is terminated and fair value accounting is applied prospectively. All but one of the contracts that comprise NU Enterprises' wholesale marketing activities are derivatives, and many of NU's regulated company contracts for the purchase or sale of energy or energy-related products are derivatives. Wholesale marketing contracts, which are marked-to-market derivative contracts, are not considered to be held for trading purposes, and sales and purchase activity is reported on a net basis in Fuel, Purchased and Net Interchange Power on the consolidated statements of income. For further information regarding derivative contracts of NU, CL&P, PSNH and WMECO and their accounting, see Note 4, "Derivative Instruments," to the consolidated financial statements. K. Marketable Securities NU Supplemental Benefit Trust and WMECO Spent Nuclear Fuel Trust: NU maintains a supplemental benefit trust to fund NU's SERP and non-SERP obligations and WMECO maintains a spent nuclear fuel trust to fund WMECO's prior period spent nuclear fuel liability, both of which hold marketable securities. Other-than-temporary impairments on debt securities held in the NU supplemental benefit trust that NU intends to sell or will be required to sell are recorded in Net Income. Credit losses identified on debt securities held in the NU supplemental benefit trust are also recorded in Net Income. Unrealized gains and unrealized losses on debt securities held in the NU supplemental benefit trust that NU does not intend to sell or will not be required to sell are recorded in Accumulated Other Comprehensive Income/(Loss). Realized gains and losses on debt securities WMECO intends to sell or will be required to sell, credit losses and unrealized gains and losses associated with the WMECO spent nuclear fuel trust are recorded on the accompanying consolidated balance sheets due to the regulatory accounting treatment of this trust. In the second quarter of 2009, NU adopted new accounting guidance related to the recognition and presentation of other- than-temporary impairments. NU recorded an after-tax cumulative effect of accounting change in accounting principle of $0.7 million as an increase to Retained Earnings with an offset to Accumulated Other Comprehensive Income relating to unrealized losses previously recorded in Net Income on debt securities held in the NU supplemental benefit trust, which did not meet the criteria established in the new accounting guidance. Prior to the adoption of accounting guidance in the second quarter of 2009, changes in the fair value of debt securities in the NU supplemental benefit trust and the WMECO spent nuclear fuel trust relating to unrealized losses were considered other-than-temporary because NU and WMECO did not have the ability to hold the debt securities to maturity. Losses on the NU supplemental benefit trust were recorded in Net Income and losses on the WMECO spent nuclear fuel trust were recorded on the balance sheet due to the regulatory nature of the trust. In 2010 and 2009, under applicable fair value accounting guidance, the Company elected to record changes in fair value of newly purchased equity securities in the NU supplemental benefit trust in Net Income. Realized and unrealized gains and losses related to these securities are included in Other Income, Net, on the accompanying consolidated statements of income for the years ended December 31, 2010 and 2009. These trusts are not subject to regulatory oversight by state or federal agencies. For information regarding marketable securities, see Note 5, "Marketable Securities," to the consolidated financial statements.

70
L. Equity Method Investments Regional Nuclear Companies: As of December 31, 2010, CL&P, PSNH and WMECO owned common stock in three regional nuclear generation companies (Yankee Companies). Each of the Yankee Companies owned a single nuclear generating facility that has been decommissioned. Ownership interests in the Yankee Companies as of December 31, 2010, which are accounted for on the equity method, are as follows: (Percent) CYAPC YAEC MYAPC CL&P 34.5 24.5 12.0 PSNH 5.0 7.0 5.0 WMECO 9.5 7.0 3.0 Total NU 49.0 % 38.5 % 20.0 % The total carrying values of ownership interests in CYAPC, YAEC and MYAPC, which are included in Other Long-Term Assets on the accompanying consolidated balance sheets and in the Regulated companies - Electric distribution reportable segment, are as follows: (Millions of Dollars) 2010 2009 CL&P $ 1.3 $ 1.6 PSNH 0.3 0.4 WMECO 0.4 0.5 Total NU $ 2.0 $ 2.5 Regional Transmission Companies: NU parent has a 22.7 percent equity ownership interest in two companies that transmit electricity imported from the Hydro-Québec system in Canada. NU parent's investment, which is included in Other-Long Term Assets on the accompanying consolidated balance sheets, totaled $5.6 million and $6.2 million as of December 31, 2010 and 2009, respectively. Dividends received from the Yankee Companies and the regional transmission companies investments were recorded as a reduction to NU's, including CL&P, PSNH and WMECO, investment and were as follows: For the Years Ended December 31, (Millions of Dollars) 2010 2009 2008 NU $ 1.5 $ 3.8 $ 1.0 CL&P 0.4 1.5 - PSNH 0.1 0.2 - WMECO 0.1 0.4 - Net earnings related to these equity investments are included in Other Income, Net on the accompanying consolidated statements of income. For further information, see Note 1P, "Summary of Significant Accounting Policies - Other Income, Net," to the consolidated financial statements. The application of the equity method is considered the appropriate method to account for the Yankee Companies and the regional transmission companies investments because NU's ownership interests are between 20 and 50 percent of the voting stock and NU has the ability to exercise significant influence over the investees' operating and financial policies. For further information on the Yankee Companies, see Note 12D, "Commitments and Contingencies - Deferred Contractual Obligations," to the consolidated financial statements. M. Revenues Regulated Companies: The Regulated companies' retail revenues are based on rates approved by the state regulatory commissions. In general, rates can only be changed through formal proceedings with the state regulatory commissions. The Regulated companies also utilize regulatory commission-approved tracking mechanisms to recover certain costs as incurred. The tracking mechanisms allow for rates to be changed periodically, with overcollections refunded to customers or undercollections collected from customers in future periods. The Regulated companies record monthly, day ahead and real time energy purchases and sales net in accordance with applicable accounting guidance. Revenues and expenses associated with derivative instruments to purchase and sell energy in the day ahead and real time markets are recorded on a net basis in Operating Revenues or Fuel, Purchased and Net Interchange Power on the consolidated statements of income. Regulated Companies' Unbilled Revenues: Unbilled revenues represent an estimate of electricity or natural gas delivered to customers for which the customers have not yet been billed. Unbilled revenues are included in Operating Revenues on the consolidated statements of income and are assets on the consolidated balance sheets that are reclassified to accounts receivable in the following month as customers are billed. Such estimates are subject to adjustment when actual meter readings become available, when changes in estimating methodology occur and under other circumstances.

71
The Regulated companies estimate unbilled revenues monthly using the daily load cycle method. The daily load cycle method allocates billed sales to the current calendar month based on the daily load for each billing cycle. The billed sales are subtracted from total calendar month sales to estimate unbilled sales. Unbilled revenues are estimated by first allocating sales to the respective rate classes, then applying an average rate to the estimate of unbilled sales. Regulated Companies' Transmission Revenues - Wholesale Rates: Wholesale transmission revenues are based on formula rates that are approved by the FERC. Wholesale transmission revenues for CL&P, PSNH, and WMECO are collected under the ISO-NE FERC, Transmission, Markets and Services Tariff (ISO-NE Tariff). The ISO-NE Tariff includes Regional Network Service (RNS) and Schedule 21 - NU rate schedules to recover fees for transmission and other services. The RNS rate, administered by ISO-NE and billed to all New England transmission users, including CL&P, PSNH, and WMECO's transmission businesses, is reset on June 1st of each year and recovers the revenue requirements associated with transmission facilities that benefit the New England region. The Schedule 21 - NU rate, administered by NU, is reset on January 1st and June 1st of each year and recovers the revenue requirements for local transmission facilities and other transmission costs not recovered under the RNS rate, including 100 percent of the CWIP that is included in rate base on the NEEWS projects. The Schedule 21 - NU rate calculation recovers total transmission revenue requirements net of revenues received from other sources (i.e., RNS, rentals, etc.), thereby ensuring that NU recovers all of CL&P's, PSNH's and WMECO's regional and local revenue requirements as prescribed in the ISO-NE Tariff. Both the RNS and Schedule 21 - NU rates provide for the annual reconciliation and recovery/refund of estimated (or projected) costs to actual costs. The financial impacts of differences between actual and projected costs are deferred for future recovery from, or refunded to, customers. As of December 31, 2010, the Schedule 21 - NU rates were in a total overrecovery position of $40.9 million ($37.2 million for CL&P, $3 million for PSNH and $0.7 million for WMECO), which will be refunded to customers in June 2011. Regulated Companies' Transmission Revenues - Retail Rates: A significant portion of the NU transmission segment revenue comes from ISO-NE charges to the distribution segments of CL&P, PSNH and WMECO, each of which recovers these costs through rates charged to their retail customers. CL&P, PSNH and WMECO each have a retail transmission cost tracking mechanism as part of their rates, which allows the companies to charge their retail customers for transmission costs on a timely basis. NU Enterprises: Service revenues are recognized as services are provided, often on a percentage of completion basis. Wholesale marketing revenues are recognized through mark-to-market accounting on underlying derivative contracts and recorded in Fuel, Purchased and Net Interchange Power on the consolidated statements of income. This net presentation of the mark-to-market and settlement amounts is required as a result of NU Enterprises not being able to assert that physical delivery of contract quantities is probable. N. Operating Expenses Fuel, Purchased and Net Interchange Power: For the years ended December 31, 2010, 2009 and 2008, Fuel, Purchased and Net Interchange Power included costs related to fuel (and natural gas costs as it related to Yankee Gas) as follows: For the Years Ended December 31, (Millions of Dollars) 2010 2009 2008 CL&P $ 0.3 $ 0.5 $ 4.1 PSNH 184.3 174.1 177.4 WMECO 0.1 0.8 0.8 Yankee Gas 206.4 226.1 358.8 Other 0.5 0.2 0.6 NU $ 391.6 $ 401.7 $ 541.7 O. Allowance for Funds Used During Construction AFUDC is included in the cost of the Regulated companies' utility plant and represents the cost of borrowed and equity funds used to finance construction. The portion of AFUDC attributable to borrowed funds is recorded as a reduction of Other Interest Expense and the AFUDC related to equity funds is recorded as Other Income, Net on the accompanying consolidated statements of income. For the Years Ended December 31, NU (Millions of Dollars, except percentages) 2010 2009 2008 AFUDC: Borrowed Funds $ 10.2 $ 5.9 $ 17.8 Equity Funds 16.7 9.4 29.0 Total $ 26.9 $ 15.3 $ 46.8 Average AFUDC Rates 7.1 % 6.1 % 8.1 % For the Years Ended December 31, 2010 2009 2008 (Millions of Dollars, except percentages) CL&P PSNH WMECO CL&P PSNH WMECO CL&P PSNH WMECO AFUDC: Borrowed Funds $ 2.7 $ 6.6 $ 0.3 $ 2.2 $ 3.1 $ 0.2 $ 13.0 $ 3.0 $ 1.0 Equity Funds 4.9 10.4 0.6 5.7 3.6 - 23.2 4.4 1.2 Total $ 7.6 $ 17.0 $ 0.9 $ 7.9 $ 6.7 $ 0.2 $ 36.2 $ 7.4 $ 2.2 Average AFUDC Rates 8.3 % 6.8 % 6.4 % 7.2 % 6.2 % 1.7 % 8.4 % 7.9 % 7.6 %

72
The Regulated companies' average AFUDC rate is based on a FERC-prescribed formula that produces an average rate using the cost of a company's short-term financings as well as a company's capitalization (preferred stock, long-term debt and common equity). The average rate is applied to average eligible CWIP amounts to calculate AFUDC. AFUDC is recorded on 100 percent of CL&P's and WMECO's CWIP for their NEEWS projects, all of which is being reserved as a regulatory liability to reflect current rate base recovery for 100 percent of the CWIP as a result of FERC-approved transmission incentives. For the year ended December 31, 2008, 50 percent of AFUDC related to other major transmission projects at CL&P were being reserved as a regulatory liability to reflect current rate base recovery for 50 percent of the CWIP as a result of FERC-approved transmission incentives. P. Other Income, Net The pre-tax components of other income/(loss) items are as follows: NU For the Years Ended December 31, (Millions of Dollars) 2010 2009 2008 Other Income: Investment Income $ 6.4 $ 10.1 $ 6.6 Interest Income 4.0 5.6 10.1 AFUDC - Equity Funds 16.7 9.4 29.0 EIA Incentives 8.7 6.1 12.1 C&LM Incentives 7.2 4.3 4.8 Other 2.2 2.7 2.7 Total Other Income 45.2 38.2 65.3 Other Loss: Investment Loss - - (14.6) Other (3.3) (0.4) (0.3) Total Other Loss (3.3) (0.4) (14.9) Total Other Income, Net $ 41.9 $ 37.8 $ 50.4 For the Years Ended December 31, 2010 2009 2008 (Millions of Dollars) CL&P PSNH WMECO CL&P PSNH WMECO CL&P PSNH WMECO Other Income: Investment Income $ 4.3 $ 1.0 $ 0.9 $ 6.8 $ 1.7 $ 1.5 $ 6.0 $ 1.9 $ 1.2 Interest Income 3.4 1.0 0.6 3.5 2.2 (0.3) 6.4 1.9 1.1 AFUDC - Equity Funds 4.9 10.4 0.6 5.7 3.6 - 23.2 4.4 1.2 EIA Incentives 8.7 - - 6.1 - - 12.1 - - C&LM Incentives 5.0 1.7 0.5 2.3 1.5 0.5 3.0 1.3 0.5 Other 0.5 0.1 - 1.6 0.5 0.2 1.1 0.2 0.1 Total Other Income 26.8 14.2 2.6 26.0 9.5 1.9 51.8 9.7 4.1 Other Loss: Investment Loss - - - - - - (9.8) (2.4) (2.1) Other (0.1) (2.5) - (0.1) - (0.1) (0.1) - - Total Other Loss (0.1) (2.5) - (0.1) - (0.1) (9.9) (2.4) (2.1) Total Other Income, Net $ 26.7 $ 11.7 $ 2.6 $ 25.9 $ 9.5 $ 1.8 $ 41.9 $ 7.3 $ 2.0 Other Income - Other includes equity in earnings, which relates to the Company's investments, including investments of CL&P, PSNH and WMECO, in the Yankee Companies and NU's investments in two regional transmission companies. For the years ended December 31, 2010, 2009, and 2008, equity in earnings was $1.4 million, $1.8 million and $1.6 million, respectively, for NU. For the year ended December 31, 2010, CL&P, PSNH and WMECO had de minimis amounts for equity in earnings. Equity in earnings was $0.3 million for CL&P and $0.1 million for PSNH and WMECO for both the years ended December 31, 2009 and 2008. For the years ended December 31, 2010, 2009 and 2008, income tax expense associated with the equity in earnings was $0.6 million, $0.7 million and $0.6 million, respectively, for NU (de minimis amounts for CL&P, PSNH and WMECO for all periods presented). The EIA incentives relate to incentives earned by Connecticut regulated companies from the construction of distributed generation, new large-scale generation and implementation of C&LM initiatives to reduce FMCC charges. Included in Other Loss - Other for NU and PSNH for the year ended December 31, 2010 is a $2.5 million write-off of carrying charges related to storm costs incurred during the December 2008 ice storm. This write-off was part of PSNH's multi-year rate case settlement agreement that was effective July 1, 2010. For further information regarding interest income related to federal tax settlements, see Note 11, "Income Taxes," to the consolidated financial statements.

73
Q. Other Taxes Certain excise taxes levied by state or local governments are collected by CL&P and Yankee Gas from their respective customers. These excise taxes are shown on a gross basis with collections in revenues and payments in expenses. Gross receipts taxes, franchise taxes and other excise taxes were included in Operating Revenues and Taxes Other Than Income Taxes on the accompanying consolidated statements of income as follows: For the Years Ended December 31, (Millions of Dollars) 2010 2009 2008 NU $ 143.7 $ 135.6 $ 126.6 CL&P 128.0 119.0 107.2 Certain sales taxes are also collected by CL&P, WMECO, and Yankee Gas from their respective customers as agents for state and local governments and are recorded on a net basis with no impact on the accompanying consolidated statements of income. R. Supplemental Cash Flow Information For the Years Ended December 31, 2010 2009 2008 (Millions of Dollars) NU NU NU Cash Paid/(Received) During the Year for: Interest, Net of Amounts Capitalized $ 258.3 $ 263.8 $ 261.4 Income Taxes 84.5 35.1 (36.1) Non-Cash Investing Activities: Capital Expenditures Incurred But Not Paid 127.9 125.5 132.8 For the Years Ended December 31, 2010 2009 2008 CL&P PSNH WMECO CL&P PSNH WMECO CL&P PSNH WMECO (Millions of Dollars) Cash Paid/(Received) During the Year for: Interest, Net of Amounts Capitalized $ 142.2 $ 51.4 $ 20.2 $ 146.7 $ 49.0 $ 19.4 $ 145.5 $ 50.0 $ 20.0 Income Taxes 71.5 1.6 5.0 42.4 12.8 (9.1) (20.6) 1.0 (5.9) Non-Cash Investing Activities: Capital Expenditures Incurred But Not Paid 46.2 35.8 21.2 48.2 46.5 10.3 76.1 31.4 11.5 Regulatory Overrecoveries/(Refunds and Underrecoveries) on the accompanying consolidated statements of cash flows represents the year-over-year change in regulatory assets and regulatory liabilities, net of amortization charged during the year and other adjustments for non-cash items. These deferred amounts are expected to be recovered from or refunded to customers through the rate-making process and are generally short-term in nature. The majority of the short-term borrowings of NU, including CL&P, PSNH and WMECO, have original maturities of three months or less. Accordingly, borrowings and repayments are shown net on the statement of cash flows. In December 2008, NU borrowed $127 million under its revolving credit agreement that had original maturities in excess of 90 days. These amounts were repaid in March 2009 and are included in the net activity in the statement of cash flows. In 2010, 2009 and 2008, NU, CL&P, PSNH and WMECO had no other such borrowings. S. Self-Insurance Accruals NU, including CL&P, PSNH and WMECO, are self-insured for employee medical coverage, long-term disability coverage and general liability coverage and up to certain limits for workers compensation coverage. Liabilities for insurance claims include accruals of estimated settlements for known claims, as well as accruals of estimates of incurred but not reported claims. These accruals are included in Other Long-Term Liabilities on the accompanying consolidated balance sheets. In estimating these costs, NU considers historical loss experience and makes judgments about the expected levels of costs per claim. These claims are accounted for based on estimates of the undiscounted claims, including those claims incurred but not reported. T. Related Parties Several wholly-owned subsidiaries of NU provide support services for NU, including CL&P, PSNH and WMECO. NUSCO provides centralized accounting, administrative, engineering, financial, information technology, legal, operational, planning, purchasing, and other services to NU's companies. RRR and Properties, Inc., two other NU subsidiaries, construct, acquire or lease some of the property and facilities used by NU's companies. As of both December 31, 2010 and 2009, CL&P, PSNH and WMECO had long-term receivables from NUSCO in the amount of $25 million, $3.8 million and $5.5 million, respectively, which are included in Other Long-Term Assets on the accompanying consolidated balance sheets related to the funding of investments held in trust by NUSCO in connection with certain postretirement benefits for CL&P, PSNH and WMECO employees. These amounts have been eliminated in consolidation on the NU financial statements. Included in the CL&P, PSNH and WMECO consolidated balance sheets as of December 31, 2010 and 2009 are Accounts Receivable from Affiliated Companies and Accounts Payable to Affiliated Companies relating to transactions between CL&P, PSNH and WMECO and other subsidiaries that are wholly-owned by NU. As of December 31, 2010 and 2009, CL&P, PSNH and WMECO had a de minimis

74
amount of tax payments accrued in Accounts Payable to Affiliated Companies related to the estimated quarterly income tax obligation paid in the following quarter. These amounts have been eliminated in consolidation on the NU financial statements. The NU Foundation is an independent not-for-profit charitable entity designed to invest in projects that emphasize economic development, workforce training and education, and a clean and healthy environment. The board of directors of the NU Foundation consists of certain NU officers. The NU Foundation is not included in the consolidated financial statements of NU as it is a not-for-profit entity and the Company does not have title to the NU Foundation's assets and cannot receive contributions back from the NU Foundation. NU made contributions to the NU Foundation of $1 million in 2010. The operating companies (CL&P, PSNH, WMECO and Yankee) made contributions totaling $1 million in January 2011, which have been recorded as payables in December 2010 ($0.6 million for CL&P, $0.2 million for PSNH and $0.1 million for WMECO). NU did not make any contributions to the NU Foundation in 2009 and 2008. 2. REGULATORY ACCOUNTING The Regulated companies continue to be rate-regulated on a cost-of-service basis, therefore, the accounting policies of the Regulated companies conform to GAAP applicable to rate-regulated enterprises and historically reflect the effects of the rate-making process. Management believes it is probable that the Regulated companies will recover their respective investments in long-lived assets, including regulatory assets. All material net regulatory assets are earning a return, except for the majority of deferred benefit cost assets, regulatory assets offsetting derivative liabilities, securitized regulatory assets and income tax regulatory assets, all of which are not in rate base. Amortization and deferrals of regulatory assets/(liabilities) are primarily included on a net basis in Amortization of Regulatory Assets/(Liabilities), Net on the accompanying consolidated statements of income. Regulatory Assets: The components of regulatory assets are as follows: As of December 31, 2010 2009 (Millions of Dollars) NU NU Deferred Benefit Costs $ 1,094.2 $ 1,132.1 Regulatory Assets Offsetting Derivative Liabilities 859.7 855.6 Securitized Assets 171.7 432.9 Income Taxes, Net 401.5 363.2 Unrecovered Contractual Obligations 123.2 149.5 Regulatory Tracker Deferrals 70.3 104.1 Storm Cost Deferrals 60.1 60.0 Asset Retirement Obligations 45.3 42.9 Losses On Reacquired Debt 21.5 24.0 Deferred Environmental Remediation Costs 36.8 24.6 Deferred Operation and Maintenance Costs 29.5 - Other Regulatory Assets 81.5 56.0 Totals $ 2,995.3 $ 3,244.9
As of December 31, 2010 2009
(Millions of Dollars) CL&P PSNH WMECO CL&P PSNH WMECO Deferred Benefit Costs $ 471.8 $ 152.6 $ 96.0 $ 502.4 $ 154.2 $ 104.9 Regulatory Assets Offsetting Derivative Liabilities 846.2 12.8 - 828.6 26.4 - Securitized Assets - 129.8 41.9 195.4 180.1 57.4 Income Taxes, Net 328.9 31.4 16.8 304.1 21.9 16.9 Unrecovered Contractual Obligations 97.9 - 25.3 118.0 - 31.5 Regulatory Tracker Deferrals 35.5 14.7 15.2 70.3 19.0 11.3 Storm Cost Deferrals 4.0 40.7 15.4 - 50.8 9.2 Asset Retirement Obligations 24.9 14.7 3.0 23.8 14.0 2.8 Losses On Reacquired Debt 11.2 8.4 0.4 12.7 9.2 0.4 Deferred Environmental Remediation Costs - 9.7 - - 1.3 - Deferred Operation and Maintenance Costs 29.5 - - - - - Other Regulatory Assets 29.0 19.6 13.1 13.5 17.2 6.4 Totals $ 1,878.9 $ 434.4 $ 227.1 $ 2,068.8 $ 494.1 $ 240.8 Additionally, the Regulated companies had $37.5 million ($0.6 million for CL&P, $26.5 for PSNH, and $1.9 million for WMECO) and $27.1 million ($9.9 million for CL&P and $9.1 million for WMECO) of regulatory costs as of December 31, 2010 and 2009, respectively, which were included in Other Long-Term Assets on the accompanying consolidated balance sheets. These amounts represent incurred costs that have not yet been approved for recovery by the applicable regulatory agency. Management believes these costs are probable of recovery in future cost-of-service regulated rates. Of the total December 31, 2010 amount, $6.6 million for PSNH relates to the probable recovery in future rates of previously recognized tax benefits lost as a result of a provision in the 2010 Healthcare Act that eliminated the tax deductibility of actuarially equivalent Medicare Part D benefits for retirees. On July 28, 2010, the DPUC allowed CL&P the creation of a regulatory asset for the recovery of future tax benefits lost as a result of the 2010 Healthcare Act, subject to review in its next rate case. On January 31, 2011, the DPU

75
also allowed WMECO the creation of a regulatory asset as a result of the 2010 Healthcare Act. NU has concluded that these costs are probable of recovery and has recorded regulatory assets of $22 million ($15.5 million for CL&P, $3.9 million for WMECO and $2.6 million for Yankee Gas) as of December 31, 2010, which are reflected in Other Regulatory Assets in the table above. These assets are not earning a return. For further information regarding the 2010 Healthcare Act, see Note 11, "Income Taxes," to the consolidated financial statements. The December 31, 2010 balance at PSNH also includes $19.9 million of costs incurred for the February 2010 winter storm restorations that met the NHPUC specified criteria for deferral to a major storm cost reserve. PSNH expects to request recovery of both the Medicare asset and the 2010 winter storm costs in 2011. Deferred Benefit Costs: NU's Pension, SERP, and PBOP Plans are accounted for in accordance with accounting guidance on defined benefit pension and other postretirement plans. Under this accounting guidance, the funded status of its pension and PBOP plans is recorded with an offset to Accumulated Other Comprehensive Income/(Loss) and is remeasured annually. However, because the Regulated companies are rate-regulated on a cost-of-service basis, offsets were recorded as regulatory assets as of December 31, 2010 and 2009 as these amounts have been and continue to be recoverable in cost-of-service regulated rates. Regulatory accounting was also applied to the portions of the NUSCO costs that support the Regulated companies, as these amounts are also recoverable. The deferred benefit costs of CL&P and PSNH are not in rate base and are expected to be amortized into expense over a period of up to 12 years. WMECO's deferred benefit costs are earning an equity return at the same rate as the assets included in rate base. Regulatory Assets Offsetting Derivative Liabilities: The regulatory assets offsetting derivative liabilities relate to the fair value of contracts used to purchase power and other related contracts that will be collected from customers in the future. Included in these amounts are $779 million and $768.7 million as of December 31, 2010 and 2009, respectively, of derivative liabilities relating to CL&P's capacity contracts, referred to as CfDs. See Note 4, "Derivative Instruments," to the consolidated financial statements for further information. These assets are excluded from rate base and are being recovered as the actual settlement occurs over the duration of the contracts. Securitized Assets: In March 2001, CL&P issued approximately $1.4 billion in RRBs. CL&P used $1.1 billion of the proceeds from that issuance to buyout or buydown certain contracts with IPPs. The CL&P securitized asset balance was fully amortized as of December 31, 2010. As of December 31, 2009, the unamortized CL&P securitized asset balance was $167 million, which included $23.2 million related to unrecovered contractual obligations. CL&P also used the proceeds from the issuance of the RRBs to securitize a portion of its regulatory assets associated with income taxes. The securitized income tax regulatory asset was fully amortized as of December 31, 2010 and had an unamortized balance of $28.4 million as of December 31, 2009. In April 2001, PSNH issued RRBs in the amount of $525 million. PSNH used the majority of the proceeds from that issuance to buydown its power contracts with an affiliate, North Atlantic Energy Corporation. In May 2001, WMECO issued $155 million in RRBs and used the majority of the proceeds from that issuance to buyout an IPP contract. Securitized regulatory assets are not earning an equity return and are being recovered over the amortization period of their associated RRBs. PSNH RRBs are scheduled to fully amortize by May 1, 2013 and WMECO RRBs are scheduled to fully amortize by June 1, 2013. Income Taxes, Net: The tax effect of temporary differences (differences between the periods in which transactions affect income in the financial statements and the periods in which they affect the determination of taxable income, including those differences relating to uncertain tax positions) is accounted for in accordance with the rate-making treatment of the applicable regulatory commissions and accounting guidance for income taxes. Differences in income taxes between the accounting guidance and the rate-making treatment of the applicable regulatory commissions are recorded as regulatory assets. For further information regarding income taxes, see Note 11, "Income Taxes," to the consolidated financial statements. Unrecovered Contractual Obligations: Under the terms of contracts with CYAPC, YAEC, and MYAPC, CL&P, PSNH, and WMECO are responsible for their proportionate share of the remaining costs of the nuclear facilities, including decommissioning. A portion of these amounts was recorded as unrecovered contractual obligations regulatory assets as of December 31, 2010 and 2009. A portion of these obligations for CL&P was securitized in 2001 and was included in securitized regulatory assets. The securitized portion of these regulatory assets for CL&P was fully recovered as of December 31, 2010. Remaining amounts for CL&P are earning a return and are being recovered through the CTA. Amounts for WMECO are being recovered without a return along with other stranded costs and are anticipated to be recovered by 2013, the scheduled completion date of stranded cost recovery. Amounts for PSNH were fully recovered by 2006. Regulatory Tracker Deferrals: Regulatory tracker deferrals are approved rate mechanisms that allow utilities to recover costs in specific business segments through reconcilable tracking mechanisms that are reviewed at least annually by the applicable regulatory commission. Regulatory tracker deferrals are recorded as regulatory assets if unrecovered costs are in excess of collections and are recorded as regulatory liabilities if collections are in excess of costs. The majority of regulatory tracker deferrals are earning a return. The following regulatory tracker deferrals were recorded as either regulatory assets or liabilities as of December 31, 2010 and 2009: CL&P Tracker Deferrals: The CTA allows CL&P to recover stranded costs, such as securitization costs associated with the RRBs, amortization of regulatory assets, and IPP over market costs. As of December 31, 2010 and 2009, CL&P's CTA was a $35.5 million and $32.2 million regulatory asset, respectively, as CTA unrecovered costs were in excess of CTA collections. As part of the CTA reconciliation process, CL&P has also established an obligation to potentially refund the variable incentive portion of its transition service procurement fee, which totaled $24.7 million and $23.2 million as of December 31, 2010 and 2009, respectively, and was recorded as a regulatory liability.
76
The GSC allows CL&P to recover the costs of the procurement of energy for SS and LRS. The FMCC mechanism allows CL&P to recover the costs of congestion and other costs associated with power market rules approved by the FERC or as approved by the DPUC. CL&P's GSC and FMCC were recorded as a $0.3 million regulatory liability as of December 31, 2010 and a $2.4 million regulatory asset as of December 31, 2009. The SBC allows CL&P to recover certain regulatory and energy public policy costs, such as hardship protection costs and transition period property taxes. As of December 31, 2010, SBC overrcollections totaled $4.8 million and was recorded as a regulatory liability whereas as of December 31, 2009, SBC undercollections totaled $18 million and was recorded as a regulatory asset. The C&LM charge allows CL&P to recover the costs of C&LM programs. C&LM overcollections totaled $36.4 million and $32.8 million and were recorded as regulatory liabilities as of December 31, 2010 and 2009, respectively. As of December 31, 2010, CL&P retail transmission collections were in excess of costs and $13.2 million was recorded as a regulatory liability whereas as of December 31, 2009, retail transmission costs were in excess of collections and $17.7 million was recorded as a regulatory asset. PSNH Tracker Deferrals: The NHPUC permits PSNH to recover the actual and prudent costs of providing generation for ES, subject to annual review. Accordingly, ES revenues and costs are fully tracked, and the difference between ES revenues and costs are deferred. ES deferrals are being collected from/refunded to customers through a charge/(credit) in the subsequent ES rate period. As of December 31, 2010 and 2009, the ES deferral was in an underrecovery position of $14.7 million and $8.4 million, respectively and was recorded as a regulatory asset. The SCRC allows PSNH to recover restructuring costs as a result of deregulation and the TCAM covers retail transmission costs incurred by PSNH's distribution business. As of December 31, 2010, SCRC overcollections totaled $2.4 million and TCAM overcollections totaled $0.8 million whereas as of December 31, 2009, SCRC undercollections totaled $3.9 million and TCAM undercollections totaled $6.7 million. PSNH recovers the cost of C&LM programs and C&LM overcollections totaled $3.4 million and $4.4 million as of December 31, 2010 and 2009, respectively. WMECO Tracker Deferrals: The basic service rate allows WMECO to recover the costs of the procurement of energy for basic service. Basic service undercollections totaled $0.1 million and overcollections totaled $2.1 million as of December 31, 2010 and 2009, respectively. WMECO recovers its stranded costs through a transition charge. This amount represents the cumulative excess of transition expenses over transition revenues. Transition charge undercollections totaled $0.6 million and $6.9 million, and were recorded as a regulatory asset as of December 31, 2010 and 2009, respectively. The C&LM charge allows WMECO to recover the costs of C&LM programs. C&LM undercollections totaled $4.5 million and $2.5 million and were recorded as a regulatory asset as of December 31, 2010 and 2009, respectively. As of December 31, 2010, WMECO retail transmission collections were in excess of costs and $4.8 million was recorded as a regulatory liability whereas, as of December 31, 2009, WMECO retail transmission costs were in excess of collections and $0.9 million was recorded as a regulatory asset. WMECO's pension and PBOP plan costs are recovered through a tracking mechanism that allows WMECO to earn a return on its pension and PBOP assets and liabilities at its weighted average cost of capital, including the deferred future pension and PBOP benefit obligations. As of December 31, 2010 and 2009, pension/PBOP undercollections totaled $4.6 million and $1 million, respectively, and were recorded as a regulatory asset as the pension/PBOP expenses exceeded the revenue collected from customers. Storm Cost Deferrals: The storm cost deferrals relate to costs incurred at CL&P, PSNH and WMECO for restorations that met regulatory agency specified criteria for deferral to a major storm cost reserve. The PSNH deferral as of December 31, 2010 relates to remaining costs incurred for a major storm in December 2008. As part of a multi-year rate case settlement agreement effective July 1, 2010, PSNH was allowed recovery of these storm costs. WMECO's 2008 and 2010 storm costs were deferred and in accordance with WMECO's January 31, 2011 distribution rate case decision will be recovered from customers over five years as part of WMECO's storm reserve. These assets are included in rate base. The CL&P deferral as of December 31, 2010 relates to remaining costs incurred for the March 2010 winter storm restorations that met the DPUC criteria for a major storm. CL&P is allowed to collect from customers $3 million per year for major storm costs. Storm cost deferrals/reserves are included in rate base. Asset Retirement Obligations: See Note 6, "Asset Retirement Obligations," to the consolidated financial statements for further information. Losses on Reacquired Debt: The regulatory asset relates to the losses associated with the reacquisition or redemption of long-term debt. These deferred losses are amortized over the life of the respective long-term debt issuance. Deferred Environmental Remediation Costs: This regulatory asset relates to environmental remediation costs at PSNH of $9.7 million and Yankee Gas of $27.1 million. Both PSNH and Yankee Gas have regulatory rate recovery mechanisms for environmental costs and accordingly, offsets to environmental reserves were recorded as regulatory assets. Management continues to believe these costs are probable of recovery in future cost-of-service regulated rates. Deferred Operation and Maintenance Costs: This regulatory asset represents the deferral of maintenance expense in connection with the deferred recovery of revenue requirements for the period July 1, 2010 through December 31, 2010, as allowed by the DPUC. CL&P is allowed to recover these costs beginning January 1, 2011 through June 2012.

77
Regulatory Liabilities: The components of regulatory liabilities are as follows: As of December 31, 2010 2009 (Millions of Dollars) NU NU Cost of Removal $ 194.8 $ 209.2 Regulatory Liabilities Offsetting Derivative Assets 38.1 109.4 Regulatory Tracker Deferrals 95.1 69.5 AFUDC Transmission Incentive 62.1 51.1 Pension Liability - Yankee Gas Acquisition 12.5 15.0 Other Regulatory Liabilities 36.5 31.5 Totals $ 439.1 $ 485.7
As of December 31, 2010 2009
(Millions of Dollars) CL&P PSNH WMECO CL&P PSNH WMECO Cost of Removal $ 78.6 $ 57.3 $ 9.5 $ 82.2 $ 60.5 $ 16.6 Regulatory Liabilities Offsetting Derivative Assets 38.1 - - 109.0 0.4 - Regulatory Tracker Deferrals 79.4 6.6 4.8 56.0 4.4 2.1 AFUDC Transmission Incentive 56.5 - 5.6 50.4 - 0.7 WMECO Provision For Rate Refunds - - 2.0 - - 2.0 Other Regulatory Liabilities 29.5 3.1 1.1 18.6 4.6 0.3 Totals $ 282.1 $ 67.0 $ 23.0 $ 316.2 $ 69.9 $ 21.7 Cost of Removal: NU's Regulated companies currently recover amounts in rates for future costs of removal of plant assets over the lives of the assets. These amounts are classified as Regulatory Liabilities on the accompanying consolidated balance sheets. This liability is included in rate base. Regulatory Liabilities Offsetting Derivative Assets: The regulatory liabilities offsetting derivative assets relate to the fair value of contracts used to purchase power and other related contracts that will benefit customers in the future. See Note 4, "Derivative Instruments," to the consolidated financial statements for further information. This liability is excluded from rate base and is refunded as the actual settlement occurs over the duration of the contracts. AFUDC Transmission Incentive: See Note 1O, "Summary of Significant Accounting Policies - Allowance for Funds Used During Construction," to the consolidated financial statements for further information. Pension Liability - Yankee Gas Acquisition: When Yankee Gas was acquired by NU, the pension liability was adjusted to fair value with offsets to the adjustment recorded as a regulatory liability, as approved by the DPUC. The pension liability was approved for amortization over an approximate 13-year period beginning in 2002 without a return on the liability. WMECO Provision for Rate Refunds: The provision for rate refunds was established to reserve a refund to customers as a result of DPU service quality penalty guidelines. 3. PROPERTY, PLANT AND EQUIPMENT AND ACCUMULATED DEPRECIATION The following tables summarize the NU, CL&P, PSNH, and WMECO investments in utility plant: As of December 31, 2010 2009 (Millions of Dollars) NU NU Distribution - Electric $ 6,197.2 $ 5,893.9 Distribution - Natural Gas 1,126.6 1,071.1 Transmission 3,378.0 3,219.2 Generation 697.1 660.1 Electric and Natural Gas Utility 11,398.9 10,844.3 Other (1) 305.5 265.6 Total Property, Plant and Equipment, Gross 11,704.4 11,109.9 Less: Accumulated Depreciation Electric and Natural Gas Utility (2,862.3) (2,721.3) Other (119.9) (120.3) Total Accumulated Depreciation (2,982.2) (2,841.6) Property, Plant and Equipment, Net 8,722.2 8,268.3 Construction Work in Progress 845.5 571.7 Total Property, Plant and Equipment, Net $ 9,567.7 $ 8,840.0 (1) These assets are primarily owned by RRR ($166 million and $143.8 million) and NUSCO ($126.6 million and $109 million) as of
December 31, 2010 and 2009, respectively, and are mainly comprised of building improvements at RRR and software and equipment at NUSCO.
78
As of December 31, 2010 2009
(Millions of Dollars) CL&P PSNH WMECO CL&P PSNH WMECO Distribution $ 4,180.7 $ 1,375.4 $ 673.7 $ 3,960.1 $ 1,309.2 $ 654.9 Transmission 2,668.4 476.1 233.5 2,573.2 450.2 195.7 Generation - 687.7 9.4 - 660.1 - Total Property, Plant and Equipment, Gross 6,849.1 2,539.2 916.6 6,533.3 2,419.5 850.6 Less: Accumulated Depreciation (1,508.7) (837.3) (228.5) (1,426.6) (805.5) (218.2) Property, Plant and Equipment, Net 5,340.4 1,701.9 688.1 5,106.7 1,614.0 632.4 Construction Work in Progress 246.1 351.4 129.0 233.9 200.7 73.4 Total Property, Plant and Equipment, Net $ 5,586.5 $ 2,053.3 $ 817.1 $ 5,340.6 $ 1,814.7 $ 705.8 PSNH charges planned major maintenance activities to Operating Expenses unless the cost represents the acquisition of additional components. PSNH capitalizes the cost of plant additions. CL&P, PSNH and WMECO have entered into certain equipment purchase contracts that require the Company to make advance payments during the design, manufacturing, shipment and installation of equipment. As of December 31, 2010 and 2009, advance payments totaling $9.3 million and $27 million, respectively ($1.3 million and $5.4 million for CL&P, $4.9 million and $16.6 million for PSNH and $3.1 million and $5 million for WMECO, respectively) are included within CWIP in the table above and not subject to depreciation. The following table summarizes average depreciable lives as of December 31, 2010: Average Depreciable Life (Years) NU CL&P PSNH WMECO Distribution 36.8 36.0 37.0 32.5 Transmission 43.2 42.3 44.6 54.2 Generation 31.9 - 31.6 25.0 Other 20.7 - - - The provision for depreciation on utility assets is calculated using the straight-line method based on the estimated remaining useful lives of depreciable plant in-service, adjusted for salvage value and removal costs, as approved by the appropriate regulatory agency (the DPUC, NHPUC, and the DPU for CL&P, PSNH, and WMECO, respectively). Depreciation rates are applied to plant-in-service from the time it is placed in service. When a plant is retired from service, the original cost of the plant is charged to the accumulated provision for depreciation, which includes cost of removal less salvage. Cost of removal is classified as a Regulatory Liability on the accompanying consolidated balance sheets. The depreciation rates for the several classes of utility plant-in-service are equivalent to composite rates as follows: (Percent) 2010 2009 2008 NU 2.7 2.9 3.0 CL&P 2.7 3.0 3.1 PSNH 2.8 2.7 2.7 WMECO 2.8 2.9 2.8 4. DERIVATIVE INSTRUMENTS The costs and benefits of derivative contracts that meet the definition of and are designated as "normal purchases or normal sales" (normal) are recognized in Operating Expenses or Operating Revenues on the accompanying consolidated statements of income, as applicable, as electricity or natural gas is delivered. Derivative contracts that are not recorded as normal under the applicable accounting guidance, are recorded at fair value as current or long-term derivative assets or liabilities. Changes in fair values of NU Enterprises' derivatives are included in Net Income. For the Regulated companies, regulatory assets or liabilities are recorded for the changes in fair values of derivatives, as these contracts are part of current regulated operating costs, or have an allowed recovery mechanism, and management believes that these costs will continue to be recovered from or refunded to customers in cost-of-service, regulated rates. See below for discussion of "Derivatives not designated as hedges." The Regulated companies are exposed to the volatility of the prices of energy and energy-related products in procuring energy supply for their customers. The costs associated with supplying energy to customers are recoverable through customer rates. The Company manages the risks associated with the price volatility of energy and energy-related products through the use of derivative contracts, many of which are accounted for as normal (for WMECO all derivative contracts are accounted for as normal) and the use of nonderivative contracts.

79
CL&P mitigates the risks associated with the price volatility of energy and energy-related products through the use of SS or LRS contracts, which fix the price of electricity purchased for customers for periods of time ranging from three months to three years and are accounted for as normal. CL&P has entered into derivatives, including FTR contracts and bilateral basis swaps, to manage the risk of congestion costs associated with its SS and LRS contracts. As required by regulation, CL&P has also entered into derivative and nonderivative contracts for the purchase of energy and energy-related products and contracts related to capacity. While the risks managed by these contracts are regional congestion costs and capacity price risks that are not specific to CL&P, Connecticut's electric distribution companies, including CL&P, are required to enter into these contracts. Management believes any costs or benefits from these contracts are recoverable from or will be refunded to CL&P's customers, and, therefore any changes in fair value are recorded as Regulatory Assets and Regulatory Liabilities on the accompanying consolidated balance sheets. WMECO mitigates the risks associated with the volatility of the prices of energy and energy-related products in procuring energy supply for its customers through the use of basic service contracts, which fix the price of electricity purchased for customers for periods of time ranging from three months to three years and are accounted for as normal. PSNH mitigates the risks associated with the volatility of energy prices in procuring energy supply for its customers through its generation facilities and the use of derivative contracts, including energy forward contracts, options and FTRs. PSNH enters into these contracts in order to stabilize electricity prices for customers. Management believes any costs or benefits from these contracts are recoverable from or will be refunded to PSNH's customers, and, therefore any changes in fair value are recorded as Regulatory Assets and Regulatory Liabilities on the accompanying consolidated balance sheets. NU, through Yankee Gas, mitigates the risks associated with supply availability and volatility of natural gas prices through the use of storage facilities and agreements to purchase natural gas supply for customers. The costs associated with mitigating these risks are recoverable from customers, and, therefore any changes in fair value are recorded as Regulatory Assets and Regulatory Liabilities on the accompanying consolidated balance sheets. NU Enterprises, through Select Energy, has one remaining fixed price forward sales contract to serve electrical load that is part of its wholesale energy marketing portfolio. NU Enterprises mitigates the price risk associated with this contract through the use of forward purchase and sales contracts. NU Enterprises' derivative contracts are accounted for at fair value, and changes in their fair values are recorded in Operating Expenses on the accompanying consolidated statements of income. NU is also exposed to interest rate risk associated with its long-term debt. From time to time, various subsidiaries of the Company enter into forward starting interest rate swaps, accounted for as cash flow hedges, to mitigate the risk of changes in interest rates when they expect to issue long-term debt. NU parent has also entered into an interest rate swap on fixed rate long-term debt in order to manage the balance of its fixed and floating rate debt. This interest rate swap is accounted for as a fair value hedge.
80
The gross fair values of derivative assets and liabilities with the same counterparty are offset and reported as net Derivative Assets or Derivative Liabilities, with appropriate current and long-term portions, in the accompanying consolidated balance sheets. The following tables present the gross fair values of contracts and the net amounts recorded as current or long-term derivative assets or liabilities, by primary underlying risk exposures or purpose:
As of December 31, 2010 Derivatives Not Designated as Hedges
(Millions of Dollars)
Commodity and Capacity
Contracts Required by Regulation
Commodity Sales
Contract and Related Price
and Supply RiskManagement
Other Commodity Price and
Supply RiskManagement
Hedging Instruments-
Interest Rate Risk
Management Collateral
and Netting
Net AmountRecorded as
Derivative Asset/(Liability)
Current Derivative Assets: Level 2: NU Parent $ - $ - $ - $ 7.7 $ - $ 7.7 Level 3: NU Enterprises - 1.7 - - - 1.7 CL&P 5.8 - 2.1 - - 7.9 Total Current Derivative Assets $ 5.8 $ 1.7 $ 2.1 $ 7.7 $ - $ 17.3 Long-Term Derivative Assets: Level 2: NU Parent $ - $ - $ - $ 4.1 $ - $ 4.1 Level 3: NU Enterprises - 3.2 - - - 3.2 CL&P (1) 195.9 - - - (80.0) 115.9 Total Long-Term Derivative Assets $ 195.9 $ 3.2 $ - $ 4.1 $ (80.0) $ 123.2 Current Derivative Liabilities: Level 2: PSNH $ - $ - $ (12.8) $ - $ - $ (12.8) Level 3: NU Enterprises (2) - (11.9) - - 0.5 (11.4) CL&P (1) (54.3) - (0.2) - 7.7 (46.8) Other - - (0.5) - - (0.5) Total Current Derivative Liabilities $ (54.3) $ (11.9) $ (13.5) $ - $ 8.2 $ (71.5) Long-Term Derivative Liabilities: Level 3: NU Enterprises (1) $ - $ (26.5) $ - $ - $ 0.2 $ (26.3) CL&P (883.1) - - - - (883.1) Other - - (0.3) - - (0.3) Total Long-Term Derivative Liabilities $ (883.1) $ (26.5) $ (0.3) $ - $ 0.2 $ (909.7)

81
As of December 31, 2009 Derivatives Not Designated as Hedges
(Millions of Dollars)
Commodity and Capacity
Contracts Required by Regulation
CommoditySales
Contract andRelated Priceand Supply
Risk Management
Other Commodity Price and
Supply Risk Management
Hedging Instruments-
Interest Rate Risk
Management Collateral
and Netting
Net Amount Recorded as
Derivative Asset/(Liability)
Current Derivative Assets: Level 2: NU Parent $ - $ - $ - $ 6.7 $ - $ 6.7 Level 3: CL&P 20.1 - 4.5 - - 24.6 PSNH (3) - - 0.4 - - 0.4 Other - - 0.1 - - 0.1 Total Current Derivative Assets $ 20.1 $ - $ 5.0 $ 6.7 $ - $ 31.8 Long-Term Derivative Assets: Level 2: NU Parent $ - $ - $ - $ 6.5 $ - $ 6.5 Level 3: CL&P (1) 259.0 - - - (75.8) 183.2 Total Long-Term Derivative Assets $ 259.0 $ - $ - $ 6.5 $ (75.8) $ 189.7 Current Derivative Liabilities: Level 2: PSNH $ - $ - $ (18.8) $ - $ - $ (18.8) Level 3: NU Enterprises (2) - (13.0) - - 4.3 (8.7) CL&P (4) (10.3) - - - 0.5 (9.8) Other - - (0.4) - - (0.4) Total Current Derivative Liabilities $ (10.3) $ (13.0) $ (19.2) $ - $ 4.8 $ (37.7) Long-Term Derivative Liabilities: Level 2: PSNH $ - $ - $ (7.6) $ - $ - $ (7.6) Level 3: NU Enterprises (1) - (41.1) - - 6.7 (34.4) CL&P (913.3) - - - - (913.3) Other - - (0.3) - - (0.3) Total Long-Term Derivative Liabilities $ (913.3) $ (41.1) $ (7.9) $ - $ 6.7 $ (955.6) (1) Amounts in Collateral and Netting represent derivative contracts that are netted against the fair value of the gross derivative
asset/liability. (2) Collateral and Netting amounts as of December 31, 2010 for NU Enterprises current derivative liabilities represent cash collateral
posted that is under master netting agreements. As of December 31, 2009, Collateral and Netting included derivative assets of $2.2 million that are netted against the fair value of derivative liabilities and cash collateral of $2.1 million posted under master netting agreements.
(3) On PSNH's accompanying consolidated balance sheet, the current portion of the net derivative asset is shown in Prepayments and
Other Current Assets. (4) Collateral and Netting amounts represent cash posted under master netting agreements. The business activities of the Company that resulted in the recognition of derivative assets also create exposure to various counterparties. As of December 31, 2010, NU's and CL&P's derivative assets are exposed to counterparty credit risk. Of these amounts, $95.5 million ($83.6 million for CL&P) is contracted with investment grade entities and the remainder is contracted with multiple other counterparties. For further information on the fair value of derivative contracts, see Note 1J, "Summary of Significant Accounting Policies - Derivative Accounting," Note 1I, "Summary of Significant Accounting Policies - Fair Value Measurements." The following provides additional information about the derivatives included in the tables above, including volumes and cash flow information.

82
Derivatives not designated as hedges NU Enterprises' commodity sales contract and related price and supply risk management: As of December 31, 2010 and 2009, NU Enterprises had approximately 0.3 million and 0.4 million MWh, respectively, of supply volumes remaining in its wholesale portfolio when expected sales to an agency that is comprised of municipalities are compared with contracted supply, both of which extend through 2013. CL&P commodity and capacity contracts required by regulation: As of December 31, 2010 and 2009, CL&P had contracts with two IPPs to purchase electricity monthly in amounts aggregating approximately 1.5 million MWh per year through March 2015 under one of these contracts and 0.1 million MWh per year through December 2020 under the second contract. CL&P also has two capacity-related CfDs to increase energy supply in Connecticut relating to one generating project that has been modified and one generating plant to be built. The total capacity of these CfDs and two additional CfDs entered into by UI is expected to be approximately 787 MW. CL&P has an agreement with UI, which is also accounted for as a derivative, under which UI will share the costs and benefits of the four CfDs, with 80 percent allocated to CL&P and 20 percent to UI. The four CfDs obligate the utilities to pay/receive monthly the difference between a set capacity price and the forward capacity market price that the projects receive in the ISO-NE capacity markets for periods of up to 15 years beginning in 2009. Commodity price and supply risk management: As of December 31, 2010 and 2009, CL&P had 1.8 million and 2.7 million MWh, respectively, remaining under FTRs that extend through December 2011 and require monthly payments or receipts. PSNH has electricity procurement contracts with delivery dates through 2011 to purchase an aggregate amount of 0.4 million and 1 million MWh of power as of December 31, 2010 and 2009, respectively, that is used to serve customer load and manage price risk of its electricity delivery service obligations. These contracts are settled monthly. PSNH also has two energy call options that it received in exchange for assigning its transmission rights in a direct current transmission line. The options give PSNH the right to purchase a de minimis amount and 0.6 million MWh of electricity through January 2011 as of December 31, 2010 and 2009, respectively. In addition, PSNH has entered into FTRs to manage the risk of congestion costs associated with its electricity delivery service. As of December 31, 2010 and 2009, there were 0.3 million and 0.4 million MWh, respectively, remaining under FTRs that extend through December 2011 and required monthly payments or receipts. The purpose of the PSNH derivative contracts is to provide stable rates for customers by mitigating price uncertainties associated with the New England electricity spot market. The following table presents the realized and unrealized gains/(losses) associated with derivative contracts not designated as hedges:
Amount of Gain/(Loss)
Recognized on Derivative Instrument Derivatives Not Designated
as Hedges Location of Gain or Loss Recognized on Derivative
For the Years Ended December 31, 2010 December 31, 2009
(Millions of Dollars) NU Enterprises: Commodity Sales Contract and Related Price and Supply Risk Management
Fuel, Purchased and Net Interchange Power $ 2.7 $ 6.2
Regulated Companies: CL&P Commodity and Capacity Contracts Required by Regulation Regulatory Assets/Liabilities (74.0) (99.9) Other Commodity Price and Supply Risk Management: CL&P Regulatory Assets/Liabilities (6.2) (7.8) PSNH Regulatory Assets/Liabilities (15.0) (62.6) Other Regulatory Assets/Liabilities (0.5) (2.8) For the Regulated companies, monthly settlement amounts are recorded as receivables or payables and as Operating Revenues or Fuel, Purchased and Net Interchange Power on the accompanying consolidated financial statements. Regulatory assets/liabilities are established with no impact to Net Income. Derivatives designated as hedges Interest Rate Risk Management: To manage the interest rate risk characteristics of NU parent's fixed rate long-term debt, NU parent has a fixed to floating interest rate swap on its $263 million, 7.25 percent fixed rate senior notes maturing on April 1, 2012. This interest rate swap qualifies and was designated as a fair value hedge and requires semi-annual cash settlements. The changes in fair value of the swap and the interest component of the hedged long-term debt instrument are recorded in Interest Expense on the accompanying consolidated statements of income. There was no ineffectiveness recorded for the years ended December 31, 2010 and 2009. The cumulative changes in fair values of the swap and the Long-Term Debt are recorded as a Derivative Asset/Liability and an adjustment to Long-Term Debt. Interest receivable is recorded as a reduction of Interest Expense and is included in Prepayments and Other Current Assets.
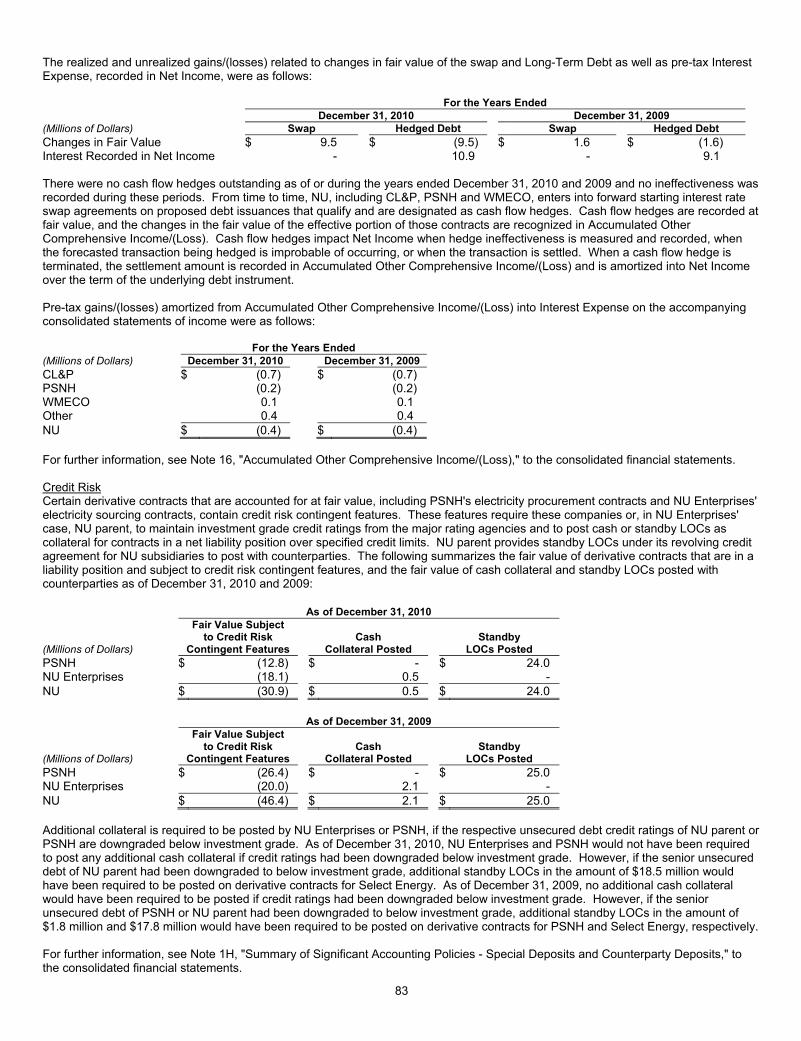
83
The realized and unrealized gains/(losses) related to changes in fair value of the swap and Long-Term Debt as well as pre-tax Interest Expense, recorded in Net Income, were as follows: For the Years Ended December 31, 2010 December 31, 2009 (Millions of Dollars) Swap Hedged Debt Swap Hedged Debt Changes in Fair Value $ 9.5 $ (9.5) $ 1.6 $ (1.6) Interest Recorded in Net Income - 10.9 - 9.1 There were no cash flow hedges outstanding as of or during the years ended December 31, 2010 and 2009 and no ineffectiveness was recorded during these periods. From time to time, NU, including CL&P, PSNH and WMECO, enters into forward starting interest rate swap agreements on proposed debt issuances that qualify and are designated as cash flow hedges. Cash flow hedges are recorded at fair value, and the changes in the fair value of the effective portion of those contracts are recognized in Accumulated Other Comprehensive Income/(Loss). Cash flow hedges impact Net Income when hedge ineffectiveness is measured and recorded, when the forecasted transaction being hedged is improbable of occurring, or when the transaction is settled. When a cash flow hedge is terminated, the settlement amount is recorded in Accumulated Other Comprehensive Income/(Loss) and is amortized into Net Income over the term of the underlying debt instrument. Pre-tax gains/(losses) amortized from Accumulated Other Comprehensive Income/(Loss) into Interest Expense on the accompanying consolidated statements of income were as follows: For the Years Ended (Millions of Dollars) December 31, 2010 December 31, 2009 CL&P $ (0.7) $ (0.7) PSNH (0.2) (0.2) WMECO 0.1 0.1 Other 0.4 0.4 NU $ (0.4) $ (0.4) For further information, see Note 16, "Accumulated Other Comprehensive Income/(Loss)," to the consolidated financial statements. Credit Risk Certain derivative contracts that are accounted for at fair value, including PSNH's electricity procurement contracts and NU Enterprises' electricity sourcing contracts, contain credit risk contingent features. These features require these companies or, in NU Enterprises' case, NU parent, to maintain investment grade credit ratings from the major rating agencies and to post cash or standby LOCs as collateral for contracts in a net liability position over specified credit limits. NU parent provides standby LOCs under its revolving credit agreement for NU subsidiaries to post with counterparties. The following summarizes the fair value of derivative contracts that are in a liability position and subject to credit risk contingent features, and the fair value of cash collateral and standby LOCs posted with counterparties as of December 31, 2010 and 2009:
As of December 31, 2010
(Millions of Dollars)
Fair Value Subject to Credit Risk
Contingent Features Cash
Collateral Posted Standby
LOCs Posted PSNH $ (12.8) $ - $ 24.0 NU Enterprises (18.1) 0.5 - NU $ (30.9) $ 0.5 $ 24.0
As of December 31, 2009
(Millions of Dollars)
Fair Value Subject to Credit Risk
Contingent Features Cash
Collateral Posted Standby
LOCs Posted PSNH $ (26.4) $ - $ 25.0 NU Enterprises (20.0) 2.1 - NU $ (46.4) $ 2.1 $ 25.0 Additional collateral is required to be posted by NU Enterprises or PSNH, if the respective unsecured debt credit ratings of NU parent or PSNH are downgraded below investment grade. As of December 31, 2010, NU Enterprises and PSNH would not have been required to post any additional cash collateral if credit ratings had been downgraded below investment grade. However, if the senior unsecured debt of NU parent had been downgraded to below investment grade, additional standby LOCs in the amount of $18.5 million would have been required to be posted on derivative contracts for Select Energy. As of December 31, 2009, no additional cash collateral would have been required to be posted if credit ratings had been downgraded below investment grade. However, if the senior unsecured debt of PSNH or NU parent had been downgraded to below investment grade, additional standby LOCs in the amount of $1.8 million and $17.8 million would have been required to be posted on derivative contracts for PSNH and Select Energy, respectively. For further information, see Note 1H, "Summary of Significant Accounting Policies - Special Deposits and Counterparty Deposits," to the consolidated financial statements.
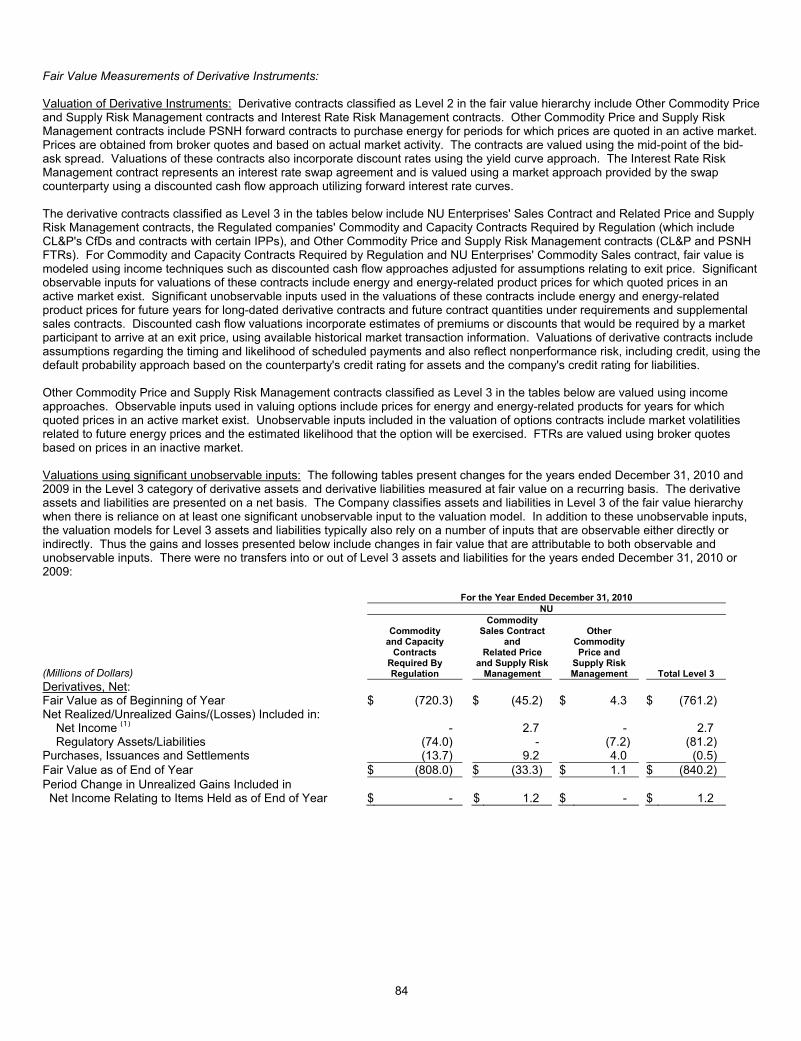
84
Fair Value Measurements of Derivative Instruments: Valuation of Derivative Instruments: Derivative contracts classified as Level 2 in the fair value hierarchy include Other Commodity Price and Supply Risk Management contracts and Interest Rate Risk Management contracts. Other Commodity Price and Supply Risk Management contracts include PSNH forward contracts to purchase energy for periods for which prices are quoted in an active market. Prices are obtained from broker quotes and based on actual market activity. The contracts are valued using the mid-point of the bid-ask spread. Valuations of these contracts also incorporate discount rates using the yield curve approach. The Interest Rate Risk Management contract represents an interest rate swap agreement and is valued using a market approach provided by the swap counterparty using a discounted cash flow approach utilizing forward interest rate curves. The derivative contracts classified as Level 3 in the tables below include NU Enterprises' Sales Contract and Related Price and Supply Risk Management contracts, the Regulated companies' Commodity and Capacity Contracts Required by Regulation (which include CL&P's CfDs and contracts with certain IPPs), and Other Commodity Price and Supply Risk Management contracts (CL&P and PSNH FTRs). For Commodity and Capacity Contracts Required by Regulation and NU Enterprises' Commodity Sales contract, fair value is modeled using income techniques such as discounted cash flow approaches adjusted for assumptions relating to exit price. Significant observable inputs for valuations of these contracts include energy and energy-related product prices for which quoted prices in an active market exist. Significant unobservable inputs used in the valuations of these contracts include energy and energy-related product prices for future years for long-dated derivative contracts and future contract quantities under requirements and supplemental sales contracts. Discounted cash flow valuations incorporate estimates of premiums or discounts that would be required by a market participant to arrive at an exit price, using available historical market transaction information. Valuations of derivative contracts include assumptions regarding the timing and likelihood of scheduled payments and also reflect nonperformance risk, including credit, using the default probability approach based on the counterparty's credit rating for assets and the company's credit rating for liabilities. Other Commodity Price and Supply Risk Management contracts classified as Level 3 in the tables below are valued using income approaches. Observable inputs used in valuing options include prices for energy and energy-related products for years for which quoted prices in an active market exist. Unobservable inputs included in the valuation of options contracts include market volatilities related to future energy prices and the estimated likelihood that the option will be exercised. FTRs are valued using broker quotes based on prices in an inactive market. Valuations using significant unobservable inputs: The following tables present changes for the years ended December 31, 2010 and 2009 in the Level 3 category of derivative assets and derivative liabilities measured at fair value on a recurring basis. The derivative assets and liabilities are presented on a net basis. The Company classifies assets and liabilities in Level 3 of the fair value hierarchy when there is reliance on at least one significant unobservable input to the valuation model. In addition to these unobservable inputs, the valuation models for Level 3 assets and liabilities typically also rely on a number of inputs that are observable either directly or indirectly. Thus the gains and losses presented below include changes in fair value that are attributable to both observable and unobservable inputs. There were no transfers into or out of Level 3 assets and liabilities for the years ended December 31, 2010 or 2009: For the Year Ended December 31, 2010 NU
(Millions of Dollars)
Commodity and Capacity
Contracts Required By Regulation
Commodity Sales Contract
and Related Price
and Supply RiskManagement
Other Commodity Price and
Supply Risk Management Total Level 3
Derivatives, Net: Fair Value as of Beginning of Year $ (720.3) $ (45.2) $ 4.3 $ (761.2) Net Realized/Unrealized Gains/(Losses) Included in: Net Income (1) - 2.7 - 2.7 Regulatory Assets/Liabilities (74.0) - (7.2) (81.2) Purchases, Issuances and Settlements (13.7) 9.2 4.0 (0.5) Fair Value as of End of Year $ (808.0) $ (33.3) $ 1.1 $ (840.2) Period Change in Unrealized Gains Included in Net Income Relating to Items Held as of End of Year $ - $ 1.2 $ - $ 1.2

85
For the Year Ended December 31, 2010 CL&P PSNH
(Millions of Dollars)
Commodityand Capacity
Contracts Required ByRegulation
OtherCommodity Price and
Supply Risk Management Total Level 3
OtherCommodityPrice and
Supply RiskManagement
Derivatives, Net: Fair Value as of Beginning of Year $ (720.3) $ 4.5 $ (715.8) $ 0.4 Net Realized/Unrealized Gains/(Losses) Included in: Regulatory Assets/Liabilities (74.0) (6.2) (80.2) (0.2) Purchases, Issuances and Settlements (13.7) 3.6 (10.1) (0.2) Fair Value as of End of Year $ (808.0) $ 1.9 $ (806.1) $ - For the Year Ended December 31, 2009 (Millions of Dollars) NU CL&P PSNH Derivatives, Net: Fair Value as of Beginning of Year $ (669.2) $ (611.1) $ 4.1 Net Realized/Unrealized Gains/(Losses) Included in: Net Income (1) 6.2 - - Regulatory Assets/Liabilities (114.3) (107.8) (3.6) Purchases, Issuances and Settlements 16.1 3.1 (0.1) Fair Value as of End of Year $ (761.2) $ (715.8) $ 0.4 Period Change in Unrealized Gains Included in Net Income Relating to Items Held as of End of Year $ 6.3 $ - $ - (1) Realized and unrealized gains and losses on derivatives included in Net Income relate to the remaining NU Enterprises' marketing
contracts and are reported in Fuel, Purchased and Net Interchange Power on the accompanying consolidated statements of income.
5. MARKETABLE SECURITIES (NU, WMECO) The Company elected to record exchange traded funds and mutual funds purchased during 2009 in the NU supplemental benefit trust at fair value in order to reflect the economic effect of changes in fair value of all newly purchased equity securities in Net Income. These equity securities, classified as Level 1 in the fair value hierarchy, totaled $42.2 million and $35.3 million as of December 31, 2010 and 2009, respectively, and are included in current Marketable Securities. Gains on these securities of $6.9 million and $6.6 million for the years ended December 31, 2010 and 2009, respectively, were recorded in Other Income, Net on the accompanying consolidated statements of income. Dividend income is recorded when dividends are declared and are recorded in Other Income, Net on the accompanying consolidated statements of income. All other marketable securities are accounted for as available-for-sale. Available-for-Sale Securities: The following is a summary by security type of NU's available-for-sale securities held in the NU supplemental benefit trust and WMECO's spent nuclear fuel trust. These securities are recorded at fair value and included in current and long-term portions of Marketable Securities on the accompanying consolidated balance sheets. As of December 31, 2010
(Millions of Dollars) Amortized
Cost
Pre-Tax Unrealized
Gains (1)
Pre-Tax Unrealized Losses (1)
Fair Value
NU Supplemental Benefit Trust U.S. Government Issued Debt Securities (Agency and Treasury) $ 11.7 $ 0.2 $ (0.1) $ 11.8 Corporate Debt Securities 6.5 0.5 (0.1) 6.9 Asset Backed Debt Securities 6.5 0.4 - 6.9 Municipal Bonds 0.7 - - 0.7 Money Market Funds and Other 3.7 0.2 - 3.9 Total NU Supplemental Benefit Trust $ 29.1 $ 1.3 $ (0.2) $ 30.2 WMECO Spent Nuclear Fuel Trust U.S. Government Issued Debt Securities (Agency and Treasury) $ 6.0 $ - $ - $ 6.0 Corporate Debt Securities 15.6 - - 15.6 Asset Backed Debt Securities 4.8 - (0.1) 4.7 Municipal Bonds 15.4 - - 15.4 Money Market Funds and Other 15.4 - - 15.4 Total WMECO Spent Nuclear Fuel Trust $ 57.2 $ - $ (0.1) $ 57.1 Total NU $ 86.3 $ 1.3 $ (0.3) $ 87.3

86
As of December 31, 2009
(Millions of Dollars) Amortized
Cost
Pre-Tax Unrealized
Gains (1)
Pre-Tax Unrealized Losses (1)
Fair Value
NU Supplemental Benefit Trust U.S. Government Issued Debt Securities (Agency and Treasury) $ 12.8 $ 0.3 $ (0.2) $ 12.9 Corporate Debt Securities 7.4 0.4 (0.1) 7.7 Asset Backed Debt Securities 5.2 0.1 (0.1) 5.2 Municipal Bonds 0.2 - - 0.2 Money Market Funds and Other 3.0 - - 3.0 Total NU Supplemental Benefit Trust $ 28.6 $ 0.8 $ (0.4) $ 29.0 WMECO Spent Nuclear Fuel Trust U.S. Government Issued Debt Securities (Agency and Treasury) $ 17.0 $ - $ - $ 17.0 Corporate Debt Securities 17.4 0.1 (0.1) 17.4 Asset Backed Debt Securities 1.1 - (0.2) 0.9 Municipal Bonds 10.6 - - 10.6 Money Market Funds and Other 10.9 - - 10.9 Total WMECO Spent Nuclear Fuel Trust $ 57.0 $ 0.1 $ (0.3) $ 56.8 Total NU $ 85.6 $ 0.9 $ (0.7) $ 85.8 (1) Unrealized gains and losses on debt securities for the NU supplemental benefit trust and WMECO spent nuclear fuel trust are
recorded in Accumulated Other Comprehensive Income/(Loss) and Other Long-Term Assets, respectively, on the accompanying consolidated balance sheets. For information related to the change in unrealized gains and losses for the NU supplemental benefit trust included in Accumulated Other Comprehensive Income/(Loss), see Note 16, "Accumulated Other Comprehensive Income/(Loss)," to the consolidated financial statements.
Unrealized Losses and Other-than-Temporary Impairment: There have not been significant unrealized losses, other-than-temporary impairments or credit losses for the NU supplemental benefit trust or WMECO spent nuclear fuel trust. Factors considered in determining whether a credit loss exists include the duration and severity of the impairment, adverse conditions specifically affecting the issuer, and the payment history, ratings and rating changes of the security. For asset backed securities, underlying collateral and expected future cash flows are also evaluated. All but one of the corporate and asset backed securities held in the NU supplemental benefit trust are rated investment grade. All but one of the securities in the WMECO spent nuclear fuel trust are rated investment grade and credit losses have been recorded for those securities that are below investment grade. Contractual Maturities: As of December 31, 2010, the contractual maturities of available-for-sale debt securities are as follows: NU WMECO
(Millions of Dollars) Amortized
Cost
Fair Value Amortized
Cost
Fair Value Less than one year $ 36.0 $ 36.1 $ 33.2 $ 33.2 One to five years 15.1 15.2 9.1 9.1 Six to ten years 6.6 7.0 1.0 1.0 Greater than ten years 28.6 29.0 13.9 13.8 Total Debt Securities $ 86.3 $ 87.3 $ 57.2 $ 57.1 Sales of Securities: For the years ended December 31, 2010, 2009 and 2008, realized gains and losses recognized on the sale of available-for-sale securities are as follows: NU WMECO (Millions of Dollars)
Realized Gains
Realized Losses
Net RealizedGains
Realized Gains
Realized Losses
Net RealizedLosses
2010 $ 0.6 $ (0.4) $ 0.2 $ - $ (0.2) $ (0.2) 2009 15.9 (6.2) 9.7 - (0.8) (0.8) 2008 2.5 (2.2) 0.3 0.2 (0.6) (0.4) Realized gains and losses on available-for-sale securities are recorded in Other Income, Net for the NU supplemental benefit trust and in Other Long-Term Assets for the WMECO spent nuclear fuel trust. NU utilizes the specific identification basis method for the NU supplemental benefit trust securities and the average cost basis method for the WMECO spent nuclear fuel trust to compute the realized gains and losses on the sale of available-for-sale securities. Proceeds from the sale of these securities, including proceeds from short-term investments, totaled $174.9 million, $208.9 million and $259.4 million for the years ended December 31, 2010, 2009 and 2008, respectively. WMECO's portion of these proceeds totaled $114.2 million, $106.3 million and $169.1 million for the years ended December 31, 2010, 2009 and 2008, respectively. Proceeds from the sales of securities are used to purchase new securities.

87
For further information regarding marketable securities, see Note 1K, "Summary of Significant Accounting Policies - Marketable Securities," to the consolidated financial statements. Fair Value Measurements: The following table presents the marketable securities recorded at fair value on a recurring basis by the level in which they are classified within the fair value hierarchy: NU WMECO
(Millions of Dollars) As of
December 31, 2010 As of
December 31, 2009 As of
December 31, 2010 As of
December 31, 2009 Level 1: Exchange Traded Funds $ 38.9 $ 32.0 $ - $ - High Yield Bond Fund 3.3 3.3 - - Money Market Funds 1.8 8.9 0.3 6.6 Total Level 1 44.0 44.2 0.3 6.6 Level 2: U.S. Government Issued Debt Securities (Agency and Treasury) 17.8 29.9 6.0 17.0 Corporate Debt Securities 22.5 25.1 15.6 17.4 Asset Backed Debt Securities 11.6 6.1 4.7 0.9 Municipal Bonds 16.1 10.8 15.4 10.6 Other Fixed Income Securities 17.5 5.0 15.1 4.3 Total Level 2 85.5 76.9 56.8 50.2 Total Marketable Securities $ 129.5 $ 121.1 $ 57.1 $ 56.8 U.S. Government issued debt securities are valued using market approaches that incorporate transactions for the same or similar bonds and adjustments for yields and maturity dates. Corporate debt securities are valued using a market approach, utilizing recent trades of the same or similar instrument and also incorporating yield curves, credit spreads and specific bond terms and conditions. Municipal bonds are valued using a market approach that incorporates reported trades and benchmark yields. Asset backed debt securities include collateralized mortgage obligations, commercial mortgage backed securities, and securities collateralized by auto loans, credit card loans or receivables. Asset backed debt securities are valued using recent trades of similar instruments, prepayment assumptions, yield curves, issuance and maturity dates and tranche information. Other fixed income securities are valued using pricing models, quoted prices of securities with similar characteristics, and discounted cash flows. Not included in the tables above are $0.6 million and $11.6 million of cash equivalents as of December 31, 2010 and 2009, respectively, held by NU parent in an unrestricted money market account and included in Cash and Cash Equivalents on the accompanying consolidated balance sheets of NU, which are classified as Level 1 in the fair value hierarchy. 6. ASSET RETIREMENT OBLIGATIONS In accordance with accounting guidance for conditional AROs, NU, including CL&P, PSNH and WMECO, recognizes a liability for the fair value of an ARO on the obligation date if the liability's fair value can be reasonably estimated and is conditional on a future event. The guidance provides that settlement dates and future costs should be reasonably estimated when sufficient information becomes available and provides direction on the definition and timing of sufficient information in determining expected cash flows and fair values. Management has identified various categories of AROs, primarily certain assets containing asbestos and hazardous contamination. A fair value calculation, reflecting expected probabilities for settlement scenarios, has been performed. The fair value of an ARO is recorded as a liability in Other Long-Term Liabilities with an offset included in Property, Plant and Equipment, Net on the accompanying consolidated balance sheets. As the Regulated companies are rate-regulated on a cost-of-service basis, these companies apply regulatory accounting guidance and the costs associated with the Regulated companies' AROs are included in Other Regulatory Assets as of December 31, 2010 and 2009. The ARO assets are depreciated, and the ARO liabilities are accreted over the estimated life of the obligation with corresponding credits recorded as accumulated depreciation and ARO liabilities, respectively. Both the depreciation and accretion were recorded as increases to Regulatory Assets on the accompanying consolidated balance sheets as of December 31, 2010 and 2009.

88
The following tables present the ARO asset, the related accumulated depreciation, the regulatory asset, and the ARO liabilities as of December 31, 2010 and 2009: As of December 31, 2010 As of December 31, 2009
(Millions of Dollars) NU
ARO Asset
AccumulatedDepreciation of ARO Asset
RegulatoryAsset
ARO Liabilities
ARO Asset
Accumulated Depreciation of ARO Asset
RegulatoryAsset
ARO Liabilities
Asbestos $ 2.6 $ (1.7) $ 22.8 $ (25.1) $ 2.7 $ (1.7) $ 21.8 $ (23.9) Hazardous Contamination 4.9 (1.5) 17.3 (21.5) 4.9 (1.4) 16.2 (20.2) Other AROs 2.4 (1.0) 5.2 (6.7) 2.6 (1.2) 4.9 (6.5) Total AROs $ 9.9 $ (4.2) $ 45.3 $ (53.3) $ 10.2 $ (4.3) $ 42.9 $ (50.6) CL&P Asbestos $ 1.6 $ (1.0) $ 13.2 $ (13.8) $ 1.6 $ (1.0) $ 12.6 $ (13.2) Hazardous Contamination 3.8 (1.1) 10.1 (12.8) 3.9 (1.1) 9.4 (12.2) Other AROs 2.0 (0.9) 1.6 (2.7) 2.4 (1.0) 1.8 (3.2) Total AROs $ 7.4 $ (3.0) $ 24.9 $ (29.3) $ 7.9 $ (3.1) $ 23.8 $ (28.6) PSNH Asbestos $ 0.9 $ (0.5) $ 7.7 $ (9.3) $ 0.9 $ (0.5) $ 7.4 $ (8.7) Hazardous Contamination 0.5 (0.3) 6.2 (7.2) 0.5 (0.3) 5.9 (6.7) Other AROs - - 0.8 (1.1) - - 0.7 (1.0) Total AROs $ 1.4 $ (0.8) $ 14.7 $ (17.6) $ 1.4 $ (0.8) $ 14.0 $ (16.4) WMECO Asbestos $ 0.2 $ (0.1) $ 1.9 $ (2.0) $ 0.2 $ (0.1) $ 1.8 $ (1.9) Hazardous Contamination 0.6 (0.2) 1.1 (1.5) 0.5 (0.1) 1.0 (1.4) Other AROs 0.1 - - (0.1) - - - - Total AROs $ 0.9 $ (0.3) $ 3.0 $ (3.6) $ 0.7 $ (0.2) $ 2.8 $ (3.3) A reconciliation of the beginning and ending carrying amounts of Regulated companies' ARO liabilities are as follows: As of December 31, 2010 2009 (Millions of Dollars) NU NU Balance as of Beginning of Year $ (50.6) $ (50.6) Liabilities Incurred During the Year (0.2) - Liabilities Settled During the Year 1.2 2.3 Accretion (3.3) (3.3) Revisions in Estimated Cash Flows (0.4) 1.0 Balance as of End of Year $ (53.3) $ (50.6)
As of December 31, 2010 2009
(Millions of Dollars) CL&P PSNH WMECO CL&P PSNH WMECO Balance as of Beginning of Year $ (28.6) $ (16.4) $ (3.3) $ (28.7) $ (15.9) $ (3.4) Liabilities Incurred During the Year (0.1) - (0.1) - - - Liabilities Settled During the Year 1.2 - - 2.0 - 0.3 Accretion (1.8) (1.1) (0.2) (1.9) (1.0) (0.2) Revisions in Estimated Cash Flows - (0.1) - - 0.5 - Balance as of End of Year $ (29.3) $ (17.6) $ (3.6) $ (28.6) $ (16.4) $ (3.3) 7. GOODWILL AND OTHER INTANGIBLE ASSETS (NU) In accordance with GAAP, goodwill and intangible assets deemed to have indefinite useful lives are reviewed for impairment at least annually by applying a fair value-based test. NU uses October 1st as the annual goodwill impairment testing date. However, if an event occurs or circumstances change that would indicate that goodwill might be impaired, NU management would test the goodwill between the annual testing dates. Goodwill impairment is deemed to exist if the net book value of a reporting unit exceeds its estimated fair value and if the implied fair value of goodwill based on the estimated fair value of the reporting unit is less than the carrying amount. NU's reporting units are consistent with the operating segments underlying the reportable segments identified in Note 21, "Segment Information," to the consolidated financial statements. The only reporting unit that maintains goodwill is the Yankee Gas reporting unit, which is classified under the Regulated companies – natural gas reportable segment and related to the acquisition of Yankee Energy System, Inc., parent of Yankee Gas. Such goodwill is not being recovered from the customers of Yankee Gas. The goodwill balance held by the Yankee Gas reporting unit as of December 31, 2010 and 2009 is $287.6 million. NU completed its impairment analysis of the Yankee Gas goodwill balance as of October 1, 2010 and determined that no impairment exists. In completing this analysis, the fair value of the reporting unit was estimated using a discounted cash flow methodology and analyses of comparable companies and transactions.
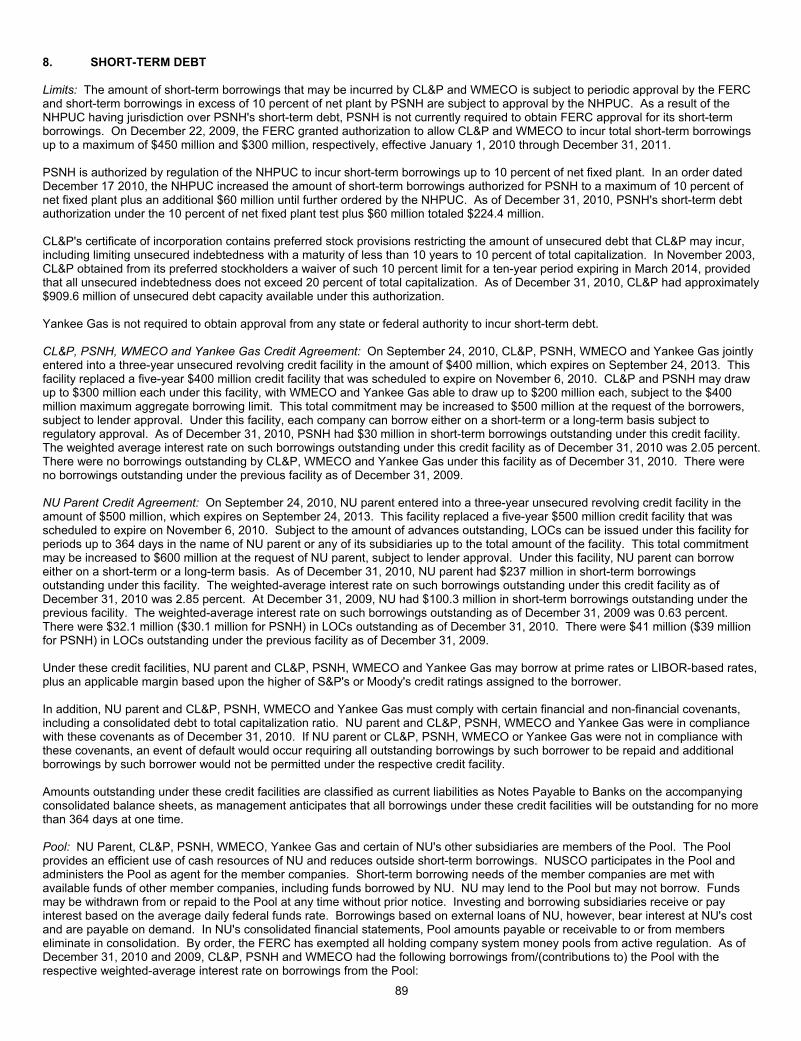
89
8. SHORT-TERM DEBT Limits: The amount of short-term borrowings that may be incurred by CL&P and WMECO is subject to periodic approval by the FERC and short-term borrowings in excess of 10 percent of net plant by PSNH are subject to approval by the NHPUC. As a result of the NHPUC having jurisdiction over PSNH's short-term debt, PSNH is not currently required to obtain FERC approval for its short-term borrowings. On December 22, 2009, the FERC granted authorization to allow CL&P and WMECO to incur total short-term borrowings up to a maximum of $450 million and $300 million, respectively, effective January 1, 2010 through December 31, 2011. PSNH is authorized by regulation of the NHPUC to incur short-term borrowings up to 10 percent of net fixed plant. In an order dated December 17 2010, the NHPUC increased the amount of short-term borrowings authorized for PSNH to a maximum of 10 percent of net fixed plant plus an additional $60 million until further ordered by the NHPUC. As of December 31, 2010, PSNH's short-term debt authorization under the 10 percent of net fixed plant test plus $60 million totaled $224.4 million. CL&P's certificate of incorporation contains preferred stock provisions restricting the amount of unsecured debt that CL&P may incur, including limiting unsecured indebtedness with a maturity of less than 10 years to 10 percent of total capitalization. In November 2003, CL&P obtained from its preferred stockholders a waiver of such 10 percent limit for a ten-year period expiring in March 2014, provided that all unsecured indebtedness does not exceed 20 percent of total capitalization. As of December 31, 2010, CL&P had approximately $909.6 million of unsecured debt capacity available under this authorization. Yankee Gas is not required to obtain approval from any state or federal authority to incur short-term debt. CL&P, PSNH, WMECO and Yankee Gas Credit Agreement: On September 24, 2010, CL&P, PSNH, WMECO and Yankee Gas jointly entered into a three-year unsecured revolving credit facility in the amount of $400 million, which expires on September 24, 2013. This facility replaced a five-year $400 million credit facility that was scheduled to expire on November 6, 2010. CL&P and PSNH may draw up to $300 million each under this facility, with WMECO and Yankee Gas able to draw up to $200 million each, subject to the $400 million maximum aggregate borrowing limit. This total commitment may be increased to $500 million at the request of the borrowers, subject to lender approval. Under this facility, each company can borrow either on a short-term or a long-term basis subject to regulatory approval. As of December 31, 2010, PSNH had $30 million in short-term borrowings outstanding under this credit facility. The weighted average interest rate on such borrowings outstanding under this credit facility as of December 31, 2010 was 2.05 percent. There were no borrowings outstanding by CL&P, WMECO and Yankee Gas under this facility as of December 31, 2010. There were no borrowings outstanding under the previous facility as of December 31, 2009. NU Parent Credit Agreement: On September 24, 2010, NU parent entered into a three-year unsecured revolving credit facility in the amount of $500 million, which expires on September 24, 2013. This facility replaced a five-year $500 million credit facility that was scheduled to expire on November 6, 2010. Subject to the amount of advances outstanding, LOCs can be issued under this facility for periods up to 364 days in the name of NU parent or any of its subsidiaries up to the total amount of the facility. This total commitment may be increased to $600 million at the request of NU parent, subject to lender approval. Under this facility, NU parent can borrow either on a short-term or a long-term basis. As of December 31, 2010, NU parent had $237 million in short-term borrowings outstanding under this facility. The weighted-average interest rate on such borrowings outstanding under this credit facility as of December 31, 2010 was 2.85 percent. At December 31, 2009, NU had $100.3 million in short-term borrowings outstanding under the previous facility. The weighted-average interest rate on such borrowings outstanding as of December 31, 2009 was 0.63 percent. There were $32.1 million ($30.1 million for PSNH) in LOCs outstanding as of December 31, 2010. There were $41 million ($39 million for PSNH) in LOCs outstanding under the previous facility as of December 31, 2009. Under these credit facilities, NU parent and CL&P, PSNH, WMECO and Yankee Gas may borrow at prime rates or LIBOR-based rates, plus an applicable margin based upon the higher of S&P's or Moody's credit ratings assigned to the borrower. In addition, NU parent and CL&P, PSNH, WMECO and Yankee Gas must comply with certain financial and non-financial covenants, including a consolidated debt to total capitalization ratio. NU parent and CL&P, PSNH, WMECO and Yankee Gas were in compliance with these covenants as of December 31, 2010. If NU parent or CL&P, PSNH, WMECO or Yankee Gas were not in compliance with these covenants, an event of default would occur requiring all outstanding borrowings by such borrower to be repaid and additional borrowings by such borrower would not be permitted under the respective credit facility. Amounts outstanding under these credit facilities are classified as current liabilities as Notes Payable to Banks on the accompanying consolidated balance sheets, as management anticipates that all borrowings under these credit facilities will be outstanding for no more than 364 days at one time. Pool: NU Parent, CL&P, PSNH, WMECO, Yankee Gas and certain of NU's other subsidiaries are members of the Pool. The Pool provides an efficient use of cash resources of NU and reduces outside short-term borrowings. NUSCO participates in the Pool and administers the Pool as agent for the member companies. Short-term borrowing needs of the member companies are met with available funds of other member companies, including funds borrowed by NU. NU may lend to the Pool but may not borrow. Funds may be withdrawn from or repaid to the Pool at any time without prior notice. Investing and borrowing subsidiaries receive or pay interest based on the average daily federal funds rate. Borrowings based on external loans of NU, however, bear interest at NU's cost and are payable on demand. In NU's consolidated financial statements, Pool amounts payable or receivable to or from members eliminate in consolidation. By order, the FERC has exempted all holding company system money pools from active regulation. As of December 31, 2010 and 2009, CL&P, PSNH and WMECO had the following borrowings from/(contributions to) the Pool with the respective weighted-average interest rate on borrowings from the Pool:

90
As of and for the Years Ended December 31, 2010 2009 (Millions of Dollars, except percentages) CL&P PSNH WMECO CL&P PSNH WMECO Borrowings from/(Contributions to) $ 6.2 $ 47.9 $ 20.4 $ (97.8) $ 26.7 $ 136.1 Weighted-Average Interest Rates 0.19 % 0.18 % 0.14 % 0.22 % 0.15 % 0.15 % The net borrowings from/(contributions to) the Pool are recorded in Notes Payable to/Notes Receivable from Affiliated Companies, respectively. 9. LONG-TERM DEBT Long-term debt maturities and cash sinking fund requirements on debt outstanding as of December 31, 2010, for the years 2011 through 2015 and thereafter, which include fees and interest due for spent nuclear fuel disposal costs, net unamortized premiums or discounts and other fair value adjustments as of December 31, 2010, are as follows: (Millions of Dollars) NU 2011 $ 66.3 2012 267.3 2013 305.0 2014 275.0 2015 150.0 Thereafter 3,327.9 Fees and Interest due for Spent Nuclear Fuel Disposal Costs 301.0 Net Unamortized Premiums and Discounts and Other Fair Value Adjustments 6.7 Total $ 4,699.2 Details of long-term debt outstanding for CL&P, PSNH and WMECO are as follows: CL&P As of December 31, (Millions of Dollars) 2010 2009 First Mortgage Bonds: 7.875% 1994 Series D due 2024 $ 139.8 $ 139.8 4.800% 2004 Series A due 2014 150.0 150.0 5.750% 2004 Series B due 2034 130.0 130.0 5.000% 2005 Series A due 2015 100.0 100.0 5.625% 2005 Series B due 2035 100.0 100.0 6.350% 2006 Series A due 2036 250.0 250.0 5.375% 2007 Series A due 2017 150.0 150.0 5.750% 2007 Series B due 2037 150.0 150.0 5.750% 2007 Series C due 2017 100.0 100.0 6.375% 2007 Series D due 2037 100.0 100.0 5.650% 2008 Series A due 2018 300.0 300.0 5.500% 2009 Series A due 2019 250.0 250.0 Total First Mortgage Bonds 1,919.8 1,919.8 Pollution Control Notes: 5.85%-5.90%, Fixed Rate, due 2016-2022 46.4 46.4 5.85%-5.95%, Fixed Rate Tax Exempt, due 2028 315.5 315.5 One-Year Fixed Rate Tax Exempt, due 2031 (1) 62.0 62.0 Total Pollution Control Notes 423.9 423.9 Total First Mortgage Bonds and Pollution Control Notes 2,343.7 2,343.7 Fees and Interest due for Spent Nuclear Fuel Disposal Costs 243.8 243.5 Less Amounts due Within One Year (1) (62.0) (62.0) Unamortized Premiums and Discounts, Net (4.4) (4.8) Long-Term Debt $ 2,521.1 $ 2,520.4 (1) On April 1, 2010, CL&P remarketed $62 million of tax-exempt PCRBs for a one-year period. The PCRBs, which mature on
May 1, 2031, carry a coupon rate of 1.4 percent during the current one-year fixed-rate period and are subject to a mandatory tender for purchase on April 1, 2011, at which time CL&P expects to remarket the bonds.
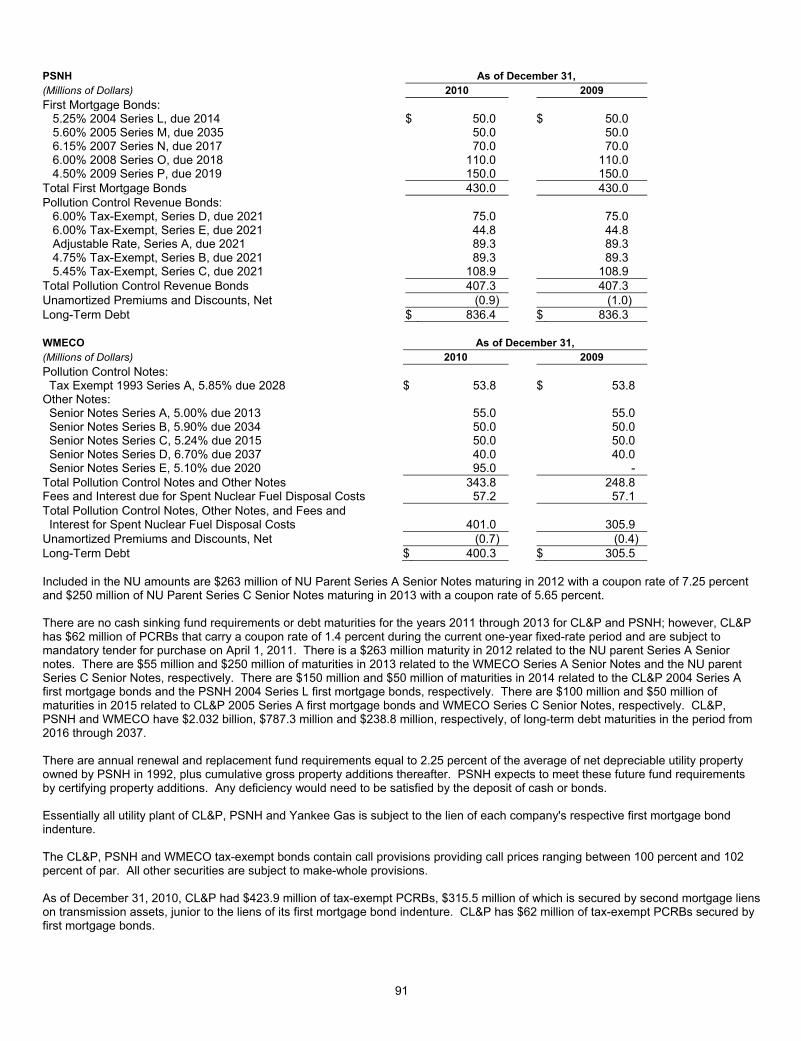
91
PSNH As of December 31, (Millions of Dollars) 2010 2009 First Mortgage Bonds: 5.25% 2004 Series L, due 2014 $ 50.0 $ 50.0 5.60% 2005 Series M, due 2035 50.0 50.0 6.15% 2007 Series N, due 2017 70.0 70.0 6.00% 2008 Series O, due 2018 110.0 110.0 4.50% 2009 Series P, due 2019 150.0 150.0 Total First Mortgage Bonds 430.0 430.0 Pollution Control Revenue Bonds: 6.00% Tax-Exempt, Series D, due 2021 75.0 75.0 6.00% Tax-Exempt, Series E, due 2021 44.8 44.8 Adjustable Rate, Series A, due 2021 89.3 89.3 4.75% Tax-Exempt, Series B, due 2021 89.3 89.3 5.45% Tax-Exempt, Series C, due 2021 108.9 108.9 Total Pollution Control Revenue Bonds 407.3 407.3 Unamortized Premiums and Discounts, Net (0.9) (1.0) Long-Term Debt $ 836.4 $ 836.3 WMECO As of December 31, (Millions of Dollars) 2010 2009 Pollution Control Notes: Tax Exempt 1993 Series A, 5.85% due 2028 $ 53.8 $ 53.8 Other Notes: Senior Notes Series A, 5.00% due 2013 55.0 55.0 Senior Notes Series B, 5.90% due 2034 50.0 50.0 Senior Notes Series C, 5.24% due 2015 50.0 50.0 Senior Notes Series D, 6.70% due 2037 40.0 40.0 Senior Notes Series E, 5.10% due 2020 95.0 - Total Pollution Control Notes and Other Notes 343.8 248.8 Fees and Interest due for Spent Nuclear Fuel Disposal Costs 57.2 57.1 Total Pollution Control Notes, Other Notes, and Fees and Interest for Spent Nuclear Fuel Disposal Costs 401.0 305.9 Unamortized Premiums and Discounts, Net (0.7) (0.4) Long-Term Debt $ 400.3 $ 305.5 Included in the NU amounts are $263 million of NU Parent Series A Senior Notes maturing in 2012 with a coupon rate of 7.25 percent and $250 million of NU Parent Series C Senior Notes maturing in 2013 with a coupon rate of 5.65 percent. There are no cash sinking fund requirements or debt maturities for the years 2011 through 2013 for CL&P and PSNH; however, CL&P has $62 million of PCRBs that carry a coupon rate of 1.4 percent during the current one-year fixed-rate period and are subject to mandatory tender for purchase on April 1, 2011. There is a $263 million maturity in 2012 related to the NU parent Series A Senior notes. There are $55 million and $250 million of maturities in 2013 related to the WMECO Series A Senior Notes and the NU parent Series C Senior Notes, respectively. There are $150 million and $50 million of maturities in 2014 related to the CL&P 2004 Series A first mortgage bonds and the PSNH 2004 Series L first mortgage bonds, respectively. There are $100 million and $50 million of maturities in 2015 related to CL&P 2005 Series A first mortgage bonds and WMECO Series C Senior Notes, respectively. CL&P, PSNH and WMECO have $2.032 billion, $787.3 million and $238.8 million, respectively, of long-term debt maturities in the period from 2016 through 2037. There are annual renewal and replacement fund requirements equal to 2.25 percent of the average of net depreciable utility property owned by PSNH in 1992, plus cumulative gross property additions thereafter. PSNH expects to meet these future fund requirements by certifying property additions. Any deficiency would need to be satisfied by the deposit of cash or bonds. Essentially all utility plant of CL&P, PSNH and Yankee Gas is subject to the lien of each company's respective first mortgage bond indenture. The CL&P, PSNH and WMECO tax-exempt bonds contain call provisions providing call prices ranging between 100 percent and 102 percent of par. All other securities are subject to make-whole provisions. As of December 31, 2010, CL&P had $423.9 million of tax-exempt PCRBs, $315.5 million of which is secured by second mortgage liens on transmission assets, junior to the liens of its first mortgage bond indenture. CL&P has $62 million of tax-exempt PCRBs secured by first mortgage bonds.

92
As of December 31, 2010, PSNH had $407.3 million in outstanding PCRBs. PSNH's obligation to repay each series of PCRBs is secured by first mortgage bonds and three series, the 2001 Series A, B and C, also carry bond insurance. Each such series of first mortgage bonds contains similar terms and provisions as the applicable series of PCRBs. For financial reporting purposes, these first mortgage bonds would not be considered outstanding unless PSNH failed to meet its obligations under the PCRBs. The 2001 Series A PCRBs, in the aggregate principal amount of $89.3 million, bears interest at a rate that is periodically set pursuant to auctions. Since March 2008, a significant majority of this series of PCRBs has been held by the remarketing agent as a result of failed auctions due to general market concerns. The interest rate on this series of PCRBs has been reset by formula under the applicable documents every 35 days. The formula is based on a combination of the ratings on the PCRBs and an index rate. The interest rate has been between 0.16 percent and 4.03 percent since March 2008 and was 0.36 percent as of December 31, 2010. The Company is not obligated to purchase these PCRBs, which mature in 2021, from the remarketing agent. The weighted average effective interest rate on PSNH's Series A variable-rate PCRBs was 0.34 percent in 2010 and 0.25 percent for 2009. NU's, including CL&P, PSNH and WMECO, long-term debt agreements provide that NU and certain of its subsidiaries must comply with certain financial and non-financial covenants as are customarily included in such agreements, including a consolidated debt to total capitalization ratio. NU and these subsidiaries are in compliance with these covenants as of December 31, 2010. Yankee Gas has certain long-term debt agreements that contain cross-default provisions. These cross-default provisions apply to all of Yankee Gas’ outstanding first mortgage bond series. The cross-default provisions on Yankee Gas’ Series B Bonds would be triggered if Yankee Gas were to default in a payment due on indebtedness in excess of $2 million. The cross-default provisions on all other series of Yankee Gas’ first mortgage bonds would be triggered if Yankee Gas were to default in a payment due on indebtedness in excess of $10 million. PSNH would also be in default under its first mortgage indentures if it defaulted on any prior lien obligation exceeding $25 million. PSNH had no prior lien obligations as of December 31, 2010. There are no other debt issuances for CL&P, WMECO or NU parent with cross-default provisions as of December 31, 2010. The accompanying consolidated statements of capitalization as of December 31, 2010 reflect the issuance in 2010 of bonds in the amount of $50 million at Yankee Gas, which are included in Long-Term Debt - First Mortgage Bonds and the issuance in 2010 of senior unsecured notes in the amount of $95 million at WMECO, which are included in Other Long-Term Debt. For information regarding fees and interest due for spent nuclear fuel disposal costs, see Note 12B, "Commitments and Contingencies - Spent Nuclear Fuel Disposal Costs," to the consolidated financial statements. The change in fair value totaling a positive $11.8 million and $13.3 million as of December 31, 2010 and 2009, respectively, on the accompanying consolidated statements of capitalization reflects the NU parent 7.25 percent amortizing note, due 2012 in the amount of $263 million, that is hedged with a fixed to floating interest rate swap. The change in fair value of the interest component of the debt was recorded as an adjustment to Long-Term Debt with an equal and offsetting adjustment to Derivative Assets for the change in fair value of the fixed to floating interest rate swap. 10. EMPLOYEE BENEFITS A. Pension Benefits and Postretirement Benefits Other Than Pensions Pursuant to GAAP, NU is required to record the funded status of its pension and PBOP plans on the accompanying consolidated balance sheets, based on the difference between the projected benefit obligation for the Pension Plan and accumulated postretirement benefit obligation for the PBOP Plan and the fair value of plan assets measured in accordance with fair value measurement accounting guidance. The funded status is recorded with an offset to Accumulated Other Comprehensive Income/(Loss) on the accompanying consolidated balance sheets. This amount is remeasured annually, or as circumstances dictate. As of December 31, 2010 and 2009, NU recorded an after-tax charge totaling $0.5 million and $5.4 million, respectively, to Accumulated Other Comprehensive Income/(Loss) for its unregulated subsidiaries. Charges for the Regulated companies are recorded as Regulatory Assets and included as deferred benefit costs as these benefits expense amounts have been and continue to be recoverable in cost-of-service, regulated rates. For further information see Note 2, "Regulatory Accounting," to the consolidated financial statements. Regulatory accounting was also applied to the portions of the NUSCO costs that support the Regulated companies, as these amounts are also recoverable through rates charged to customers.

93
Pension Benefits: NUSCO sponsors a Pension Plan, which is subject to the provisions of ERISA. The Pension Plan covers nonbargaining unit employees (and bargaining unit employees, as negotiated) of NU, including CL&P, PSNH, and WMECO, hired before 2006 (or as negotiated, for bargaining unit employees). Benefits are based on years of service and the employees' highest eligible compensation during 60 consecutive months of employment. NU allocates net periodic pension expense to its subsidiaries based on the actual participant demographic data for each subsidiary's participants. Benefit payments to participants and contributions are also tracked by the trustee for each subsidiary. The actual investment return for the trust each year is allocated to each of the subsidiaries in proportion to the investment return expected to be earned during the year. NU uses a December 31st measurement date for the Pension Plan. Pension expense/(income) affecting Net Income is as follows: (Millions of Dollars) For the Years Ended December 31, NU 2010 2009 2008 Total Pension Expense $ 80.4 $ 39.7 $ 2.4 (Expense)/Income Capitalized as Utility Plant (16.9) (6.2) 4.9 Total Pension Expense, Net of Amounts Capitalized $ 63.5 $ 33.5 $ 7.3 CL&P Total Pension Expense/(Income) $ 8.5 $ (5.7) $ (21.3) (Expense)/Income Capitalized as Utility Plant (3.8) 2.6 9.4 Total Pension Expense/(Income), Net of Amounts Capitalized $ 4.7 $ (3.1) $ (11.9) PSNH Total Pension Expense $ 28.1 $ 23.3 $ 18.1 Expense Capitalized as Utility Plant (6.9) (6.0) (4.2) Total Pension Expense, Net of Amounts Capitalized $ 21.2 $ 17.3 $ 13.9 WMECO Total Pension Income $ (0.1) $ (2.9) $ (6.1) Income Capitalized as Utility Plant - 1.2 2.1 Total Pension Income, Net of Amounts Capitalized $ (0.1) $ (1.7) $ (4.0) Actuarial Determination of Expense: Pension and PBOP expense consists of the service cost and prior service cost determined by actuaries, the interest cost based on the discounting of the obligations and the amortization of the net transition obligation, offset by the expected return on plan assets. Pension and PBOP expense also includes amortization of actuarial gains and losses, which represent differences between assumptions and actual or updated information. The expected return on plan assets is calculated by applying the assumed rate of return to a four-year rolling average of plan asset fair values, which reduces year-to-year volatility. This calculation recognizes investment gains or losses over a four-year period from the year in which they occur. Investment gains or losses for this purpose are the difference between the calculated expected return and the actual return based on the change in the fair value of assets during the year. As investment gains and losses are reflected in the average plan asset fair values, they are subject to amortization with other unrecognized gains/losses. Unrecognized gains/losses are amortized as a component of pension and PBOP expense over approximately 10 and 9 years, respectively, which is the average future service period of the employees. SERP: NU has maintained a SERP since 1987. The SERP provides its eligible participants, who are officers of NU, with benefits that would have been provided to them under the Pension Plan if certain Internal Revenue Code limitations were not imposed. NU allocates net periodic SERP benefit costs to its subsidiaries based upon actuarial calculations by participant. Although the Company maintains a trust to support the SERP with marketable securities held in the NU supplemental benefit trust, the plan itself does not contain any assets. For information regarding the investments in the NU supplemental benefit trust that are used to support the SERP liability, see Note 5, "Marketable Securities," to the consolidated financial statements. PBOP Plan: On behalf of NU's retirees, NUSCO also sponsors plans that provide certain retiree health care benefits, primarily medical and dental, and life insurance benefits through a PBOP Plan. These benefits are available for employees retiring from NU who have met specified service requirements. For current employees and certain retirees, the total benefit is limited to two times the 1993 per retiree health care cost. These costs are charged to expense over the estimated work life of the employee. NU uses a December 31st measurement date for the PBOP Plan. NU annually funds postretirement costs through external trusts with amounts that have been and will continue to be recovered in rates and that are tax deductible. NU allocates net periodic postretirement benefits expense to its subsidiaries based on the actual participant demographic data for each subsidiary's participants. Benefit payments to participants and contributions are also tracked for each subsidiary. The actual investment return for the trust each year is allocated to each of the subsidiaries in proportion to the investment return expected to be earned during the year.

94
The following table represents information on NU's plan benefit obligations, fair values of plan assets, and funded status: As of December 31, Pension Benefits SERP Benefits PBOP Benefits (Millions of Dollars) 2010 2009 2010 2009 2010 2009 Change in Benefit Obligation Benefit Obligation as of Beginning of Year $ (2,571.0) $ (2,297.7) $ (39.3) $ (34.2) $ (475.7) $ (436.0) Service Cost (50.3) (45.0) (0.7) (0.8) (8.5) (7.2) Interest Cost (150.3) (153.4) (2.3) (2.3) (26.8) (29.1) Actuarial Loss (139.3) (203.8) (1.3) (4.3) (17.5) (44.5) Federal Subsidy on Benefits Paid - - - - (3.7) (3.5) Benefits Paid - Excluding Lump Sum Payments 130.2 128.9 2.5 2.3 42.3 44.6 Benefits Paid - Lump Sum Payments 0.9 - - - - - Benefit Obligation as of End of Year $ (2,779.8) $ (2,571.0) $ (41.1) $ (39.3) $ (489.9) $ (475.7) Change in Plan Assets Fair Value of Plan Assets as of Beginning of Year $ 1,789.6 $ 1,556.8 N/A N/A $ 240.3 $ 195.6 Actual Return on Plan Assets 274.1 361.7 N/A N/A 34.9 48.5 Employer Contribution 45.0 - N/A N/A 45.6 40.8 Benefits Paid - Excluding Lump Sum Payments (130.2) (128.9) N/A N/A (42.3) (44.6) Benefits Paid - Lump Sum Payments (0.9) - N/A N/A - - Fair Value of Plan Assets as of End of Year $ 1,977.6 $ 1,789.6 N/A N/A $ 278.5 $ 240.3 Funded Status as of December 31st $ (802.2) $ (781.4) $ (41.1) $ (39.3) $ (211.4) $ (235.4) The amounts recognized on the accompanying consolidated balance sheets for the funded status above as of December 31, 2010 and 2009 are as follows: As of December 31, (Millions of Dollars) Pension Benefits SERP Benefits PBOP Benefits NU 2010 2009 2010 2009 2010 2009 Accrued Pension $ (802.2) $ (781.4) $ - $ - $ - $ - Other Current Liabilities - - (4.1) (2.9) - - Other Long-Term Liabilities - - (37.0) (36.4) (211.4) (235.4) CL&P Accrued Pension $ (42.5) $ (51.3) $ - $ - $ - $ - Other Current Liabilities - - (0.4) (0.3) - - Other Long-Term Liabilities - - (3.0) (3.1) (81.6) (94.9) PSNH Accrued Pension $ (261.1) $ (272.9) $ - $ - $ - $ - Other Current Liabilities - - (0.3) (0.1) - - Other Long-Term Liabilities - - (1.9) (2.0) (33.0) (39.7) WMECO Prepaid Pension $ 13.6 $ 6.9 $ - $ - $ - $ - Other Long-Term Liabilities - - (0.4) (0.4) (15.0) (17.4) The accumulated benefit obligation for the Pension Plan and SERP as of December 31, 2010 and 2009 is as follows: Pension Benefits SERP Benefits (Millions of Dollars) 2010 2009 2010 2009 NU $ 2,512.2 $ 2,034.7 $ 38.9 $ 36.9 CL&P 864.9 725.8 3.4 3.3 PSNH 395.8 312.4 2.1 1.9 WMECO 177.0 146.4 0.4 0.3 The Company amortizes the prior service cost on an individual subsidiary basis and unrecognized net actuarial gains/(losses) and any remaining transition obligation over the remaining service lives of its employees as calculated on an NU consolidated basis. The pension transition obligation is fully amortized and the PBOP transition obligation will be fully amortized in 2013.
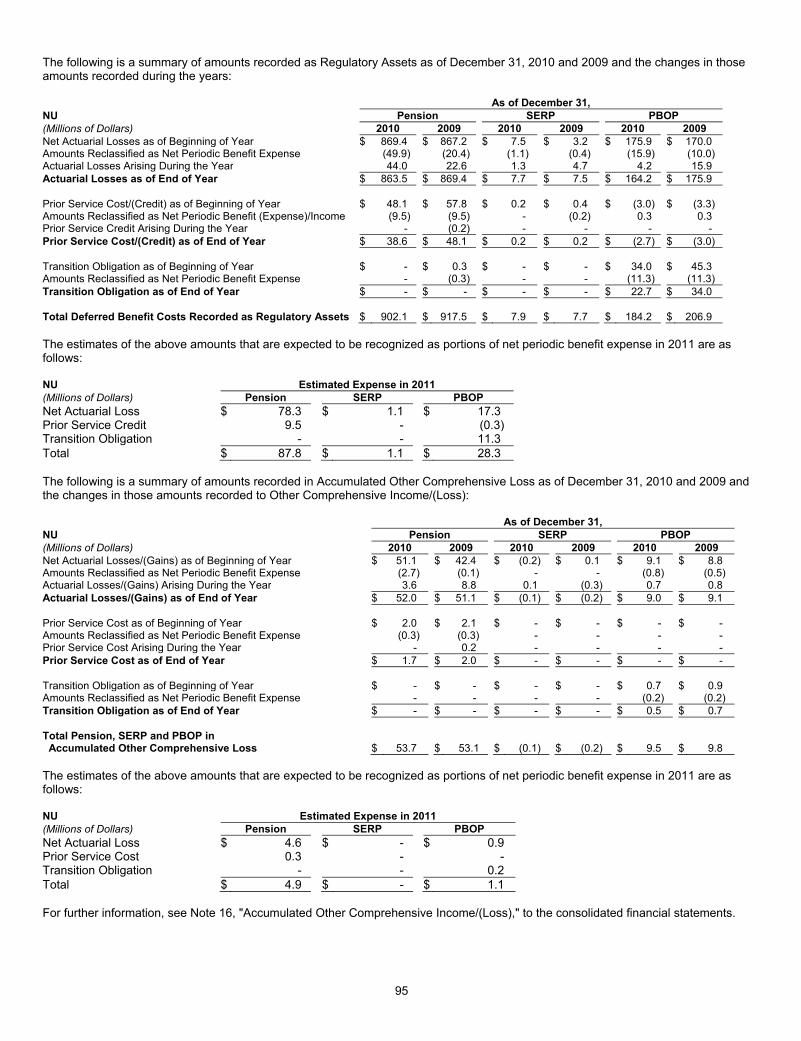
95
The following is a summary of amounts recorded as Regulatory Assets as of December 31, 2010 and 2009 and the changes in those amounts recorded during the years: As of December 31, NU Pension SERP PBOP (Millions of Dollars) 2010 2009 2010 2009 2010 2009 Net Actuarial Losses as of Beginning of Year $ 869.4 $ 867.2 $ 7.5 $ 3.2 $ 175.9 $ 170.0 Amounts Reclassified as Net Periodic Benefit Expense (49.9) (20.4) (1.1) (0.4) (15.9) (10.0) Actuarial Losses Arising During the Year 44.0 22.6 1.3 4.7 4.2 15.9 Actuarial Losses as of End of Year $ 863.5 $ 869.4 $ 7.7 $ 7.5 $ 164.2 $ 175.9 Prior Service Cost/(Credit) as of Beginning of Year $ 48.1 $ 57.8 $ 0.2 $ 0.4 $ (3.0) $ (3.3) Amounts Reclassified as Net Periodic Benefit (Expense)/Income (9.5) (9.5) - (0.2) 0.3 0.3 Prior Service Credit Arising During the Year - (0.2) - - - - Prior Service Cost/(Credit) as of End of Year $ 38.6 $ 48.1 $ 0.2 $ 0.2 $ (2.7) $ (3.0) Transition Obligation as of Beginning of Year $ - $ 0.3 $ - $ - $ 34.0 $ 45.3 Amounts Reclassified as Net Periodic Benefit Expense - (0.3) - - (11.3) (11.3) Transition Obligation as of End of Year $ - $ - $ - $ - $ 22.7 $ 34.0 Total Deferred Benefit Costs Recorded as Regulatory Assets $ 902.1 $ 917.5 $ 7.9 $ 7.7 $ 184.2 $ 206.9 The estimates of the above amounts that are expected to be recognized as portions of net periodic benefit expense in 2011 are as follows: NU Estimated Expense in 2011 (Millions of Dollars) Pension SERP PBOP Net Actuarial Loss $ 78.3 $ 1.1 $ 17.3 Prior Service Credit 9.5 - (0.3) Transition Obligation - - 11.3 Total $ 87.8 $ 1.1 $ 28.3 The following is a summary of amounts recorded in Accumulated Other Comprehensive Loss as of December 31, 2010 and 2009 and the changes in those amounts recorded to Other Comprehensive Income/(Loss): As of December 31, NU Pension SERP PBOP (Millions of Dollars) 2010 2009 2010 2009 2010 2009 Net Actuarial Losses/(Gains) as of Beginning of Year $ 51.1 $ 42.4 $ (0.2) $ 0.1 $ 9.1 $ 8.8 Amounts Reclassified as Net Periodic Benefit Expense (2.7) (0.1) - - (0.8) (0.5) Actuarial Losses/(Gains) Arising During the Year 3.6 8.8 0.1 (0.3) 0.7 0.8 Actuarial Losses/(Gains) as of End of Year $ 52.0 $ 51.1 $ (0.1) $ (0.2) $ 9.0 $ 9.1 Prior Service Cost as of Beginning of Year $ 2.0 $ 2.1 $ - $ - $ - $ - Amounts Reclassified as Net Periodic Benefit Expense (0.3) (0.3) - - - - Prior Service Cost Arising During the Year - 0.2 - - - - Prior Service Cost as of End of Year $ 1.7 $ 2.0 $ - $ - $ - $ - Transition Obligation as of Beginning of Year $ - $ - $ - $ - $ 0.7 $ 0.9 Amounts Reclassified as Net Periodic Benefit Expense - - - - (0.2) (0.2) Transition Obligation as of End of Year $ - $ - $ - $ - $ 0.5 $ 0.7 Total Pension, SERP and PBOP in Accumulated Other Comprehensive Loss $ 53.7
$ 53.1
$ (0.1)
$ (0.2)
$ 9.5 $ 9.8
The estimates of the above amounts that are expected to be recognized as portions of net periodic benefit expense in 2011 are as follows: NU Estimated Expense in 2011 (Millions of Dollars) Pension SERP PBOP Net Actuarial Loss $ 4.6 $ - $ 0.9 Prior Service Cost 0.3 - - Transition Obligation - - 0.2 Total $ 4.9 $ - $ 1.1 For further information, see Note 16, "Accumulated Other Comprehensive Income/(Loss)," to the consolidated financial statements.

96
The following actuarial assumptions were used in calculating the plans' year end funded status: As of December 31, Pension Benefits and SERP PBOP Benefits Balance Sheets 2010 2009 2010 2009 Discount Rate 5.57 % 5.98 % 5.28 % 5.73 % Compensation/Progression Rate 3.50 % 4.00 % N/A N/A Health Care Cost Trend Rate N/A N/A 7.00 % 7.50 % The components of net periodic benefit expense/(income) are as follows: For the Years Ended December 31, NU Pension Benefits SERP Benefits PBOP Benefits (Millions of Dollars) 2010 2009 2008 2010 2009 2008 2010 2009 2008 Service Cost $ 50.3 $ 45.0 $ 43.9 $ 0.7 $ 0.8 $ 0.7 $ 8.5 $ 7.2 $ 7.1 Interest Cost 150.3 153.4 144.0 2.3 2.3 2.0 26.8 29.1 28.3 Expected Return on Plan Assets (182.6) (189.4) (200.2) - - - (21.7) (20.9) (21.1)Net Transition Obligation Cost - 0.3 0.2 - - - 11.6 11.6 11.6 Prior Service Cost/(Credit) 9.8 9.8 9.9 0.1 0.1 0.1 (0.3) (0.3) (0.3)Actuarial Loss 52.6 20.6 4.6 1.0 0.4 0.3 16.7 10.5 10.6 Total - Net Periodic Expense $ 80.4 $ 39.7 $ 2.4 $ 4.1 $ 3.6 $ 3.1 $ 41.6 $ 37.2 $ 36.2 For the Years Ended December 31, CL&P Pension Benefits SERP Benefits PBOP Benefits (Millions of Dollars) 2010 2009 2008 2010 2009 2008 2010 2009 2008 Service Cost $ 17.6 $ 16.0 $ 15.4 $ - $ - $ - $ 2.7 $ 2.2 $ 2.2 Interest Cost 52.0 54.3 51.4 0.2 0.2 0.2 10.5 11.5 11.3 Expected Return on Plan Assets (85.8) (89.0) (93.4) - - - (8.7) (8.3) (8.4)Net Transition Obligation Cost - - - - - - 6.1 6.1 6.1 Prior Service Cost 4.2 4.2 4.2 - - - - - - Actuarial Loss 20.5 8.8 1.1 0.2 0.1 0.1 6.3 4.0 4.5 Total - Net Periodic Expense/(Income) $ 8.5 $ (5.7) $ (21.3) $ 0.4 $ 0.3 $ 0.3 $ 16.9 $ 15.5 $ 15.7 For the Years Ended December 31, PSNH Pension Benefits SERP Benefits PBOP Benefits (Millions of Dollars) 2010 2009 2008 2010 2009 2008 2010 2009 2008 Service Cost $ 9.9 $ 8.8 $ 9.2 $ 0.1 $ 0.1 $ - $ 1.8 $ 1.5 $ 1.7 Interest Cost 24.0 24.3 23.2 0.1 0.1 0.1 5.0 5.4 5.2 Expected Return on Plan Assets (14.7) (15.0) (17.9) - - - (4.3) (4.1) (4.0)Net Transition Obligation Cost - 0.3 0.3 - - - 2.5 2.5 2.5 Prior Service Cost 1.8 1.8 1.9 - - - - - - Actuarial Loss 7.1 3.1 1.4 0.1 0.1 0.1 2.7 1.7 1.7 Total - Net Periodic Expense $ 28.1 $ 23.3 $ 18.1 $ 0.3 $ 0.3 $ 0.2 $ 7.7 $ 7.0 $ 7.1 For the Years Ended December 31, WMECO Pension Benefits SERP Benefits PBOP Benefits (Millions of Dollars) 2010 2009 2008 2010 2009 2008 2010 2009 2008 Service Cost $ 3.5 $ 3.3 $ 3.2 $ - $ - $ - $ 0.6 $ 0.5 $ 0.5 Interest Cost 10.7 11.1 10.4 - - 0.1 2.3 2.5 2.4 Expected Return on Plan Assets (19.5) (20.0) (20.7) - - - (2.1) (2.0) (2.1)Net Transition Obligation Cost - - - - - - 1.3 1.3 1.4 Prior Service Cost 0.9 0.9 0.9 - - - - - - Actuarial Loss 4.3 1.8 0.1 - - - 0.9 0.4 0.6 Total - Net Periodic Expense/(Income) $ (0.1) $ (2.9) $ (6.1) $ - $ - $ 0.1 $ 3.0 $ 2.7 $ 2.8 Not included in the Pension Plan, PBOP Plan and SERP amounts above for CL&P, PSNH and WMECO are related intercompany allocations as follows: For the Years Ended December 31, CL&P PSNH WMECO (Millions of Dollars) 2010 2009 2008 2010 2009 2008 2010 2009 2008 Pension Benefits $ 23.2 $ 14.5 $ 8.9 $ 5.4 $ 3.1 $ 2.0 $ 4.2 $ 2.4 $ 1.5 PBOP Benefits 7.9 7.3 6.7 2.0 1.7 1.5 1.4 1.1 1.1 SERP Benefits 2.0 1.8 1.6 0.6 0.5 0.4 0.3 0.3 0.2

97
The following assumptions were used to calculate pension and PBOP expense and income amounts: For the Years Ended December 31, Pension Benefits and SERP PBOP Benefits Statements of Income 2010 2009 2008 2010 2009 2008 Discount Rate 5.98 % 6.89 % 6.60 % 5.73 % 6.90 % 6.35 %Expected Long-Term Rate of Return 8.75 % 8.75 % 8.75 % N/A N/A N/A Compensation/Progression Rate 4.00 % 4.00 % 4.00 % N/A N/A N/A Expected Long-Term Rate of Return - Health Assets, Taxable N/A N/A N/A 6.85 % 6.85 % 6.85 % Life Assets and Non-Taxable Health Assets N/A N/A N/A 8.75 % 8.75 % 8.75 % For 2011 through 2013, the health care trend cost assumption is 7 percent, subsequently decreasing one half percentage point per year to an ultimate rate of 5 percent in 2017. For the year ended December 31, 2010, the assumed healthcare trend was 7.5 percent, decreasing by 5 percent and reaching the ultimate trend rate of 5 percent in 2015. Assumed health care cost trend rates have a significant effect on the amounts reported for the health care plans. The effect of changing the assumed health care cost trend rate by one percentage point for the year ended December 31, 2010 would have the following effects: (Millions of Dollars) NU
One PercentagePoint Increase
One Percentage Point Decrease
Effect on Postretirement Benefit Obligation $ 14.5 $ (12.1) Effect on Total Service and Interest Cost Components 1.2 (0.9) Fair Value of Pension and PBOP Assets: Pension and PBOP funds are held in external trusts. Trust assets, including accumulated earnings, must be used exclusively for pension and PBOP payments. NU's investment strategy for its Pension and PBOP Plans is to maximize the long-term rates of return on these plans' assets within an acceptable level of risk. The investment strategy for each asset category includes a diversification of asset types, fund strategy and fund managers and establishes target asset allocations that are routinely reviewed and periodically rebalanced. NU's expected long-term rates of return on Pension and PBOP Plan assets are based on these target asset allocation assumptions and related expected long-term rates of return. In developing its expected long-term rate of return assumptions for the Pension and PBOP Plans, NU evaluated input from actuaries and consultants, as well as long-term inflation assumptions and historical returns. For 2010, management has assumed long-term rates of return of 8.25 percent on Pension Plan assets and PBOP Plan life and nontaxable health assets and 6.45 percent for PBOP taxable health assets. These long-term rates of return are based on the assumed rates of return for the target asset allocations as follows: As of December 31,
Pension and PBOP
Life and Non-Taxable HealthPBOP
(Taxable Health) Pension PBOP (Health and Life) 2010 2010 2009 2009
Target Asset
Allocation
Assumed Rate
of Return
Target Asset
Allocation
AssumedRate
of Return
Target Asset
Allocation
Assumed Rate
of Return
Target Asset
Allocation
AssumedRate
of ReturnEquity Securities: United States 24% 9% 55% 9% 24% 9.25% 55% 9.25% International 13% 9% 15% 9% 13% 9.25% 11% 9.25% Emerging Markets 3% 10% - - 3% 10.25% 2% 10.25% Private Equity 12% 13% - - 12% 14.25% - - Debt Securities: Fixed Income 20% 5% 30% 5% 20% 5.7% 27% 5.7% High Yield Fixed Income 3.5% 7.5% - - 3.5% 7.7% 5% 7.7% Emerging Markets Debt 3.5% 7.5% - - 3.5% 7.7% - - Real Estate And Other Assets 8% 7.5% - - 8% 7.5% - - Hedge Funds 13% 7% - - 13% 8% - -

98
The following table presents, by asset category, the Pension and PBOP Plan assets recorded at fair value on a recurring basis by the level in which they are classified within the fair value hierarchy:
Pension Plan Fair Value Measurements as of December 31,
(Millions of Dollars) 2010 2009 Asset Category: Level 1 Level 2 Level 3 Total Level 1 Level 2 Level 3 Total Equity Securities: United States (1) $ 256.3 $ 46.9 $ 266.0 $ 569.2 $ 135.2 $ 150.1 $ 252.1 $ 537.4 International (2) 6.4 250.9 - 257.3 7.1 217.3 - 224.4 Emerging Markets (2) - 81.1 - 81.1 - 67.1 - 67.1 Private Equity (5) 6.9 - 229.5 236.4 21.9 - 193.8 215.7 Fixed Income (3) 7.6 261.6 247.6 516.8 49.4 251.9 174.0 475.3 Real Estate and Other Assets (6) - 26.0 43.7 69.7 - - 38.5 38.5
Hedge Funds - - 247.1 247.1 - - 231.2 231.2 Total $ 277.2 $ 666.5 $ 1,033.9 $ 1,977.6 $ 213.6 $ 686.4 $ 889.6 $ 1,789.6
PBOP Plan Fair Value Measurements as of December 31,
(Millions of Dollars) 2010 2009 Asset Category: Level 1 Level 2 Level 3 Total Level 1 Level 2 Level 3 Total Cash and Cash Equivalents $ 4.4 $ - $ - $ 4.4 $ 4.2 $ - $ - $ 4.2 Equity Securities: United States 132.1 - 10.1 142.2 140.3 - - 140.3 International 34.8 - - 34.8 28.0 - - 28.0 Emerging Markets 7.7 - - 7.7 - - - - Debt Securities: Fixed Income (4) - 35.3 23.4 58.7 - 36.9 24.6 61.5 High Yield Fixed Income - 4.4 - 4.4 6.3 - - 6.3 Emerging Market Debt - 4.8 - 4.8 - - - - Hedge Funds - - 16.4 16.4 - - - - Private Equity - - 0.3 0.3 - - - - Real Estate and Other Assets - 4.8 - 4.8 - - - - Total $ 179.0 $ 49.3 $ 50.2 $ 278.5 $ 178.8 $ 36.9 $ 24.6 $ 240.3 (1) United States Equities classified as Level 2 include investments in commingled funds totaling $34.8 million and $77.1 million and
unrealized gains on holdings in equity index swaps totaling $12.1 million and $73 million for the years ended December 31, 2010 and 2009, respectively. Level 3 investments include hedge funds that are overlayed with equity index swaps and futures contracts. Level 1 investments represent primarily equity holdings and also includes unrealized gains and losses on equity index futures contracts.
(2) The International and Emerging Markets Equities categorized as Level 2 represent investments in commingled funds. (3) Fixed Income securities classified as Level 2 include investments in debt securities, including high yield bond funds, U.S.
government issued securities, corporate bonds, asset backed securities and insurance contracts totaling $261.6 million and $201.2 million for the years ended December 31, 2010 and 2009, respectively. In 2009, this amount above included unrealized gains on fixed income swaps of $50.7 million. Level 3 investments include fixed income funds totaling $147.1 million and $80.5 million that invest in senior credit distressed credit funds, and hedge funds totaling $100.5 million and $93.5 million that are overlayed with interest rate swaps and fixed income index swaps for the years ended December 31, 2010 and 2009, respectively. Level 1 investments include exchange traded funds and in 2009 also included unrealized gains on fixed income index futures contracts totaling $29.8 million.
(4) Fixed Income investments classified as Level 2 include U.S. government issued securities, municipal bonds, corporate bonds and other debt securities. The amount classified in Level 3 represents funds that invests in senior credit distressed income securities totaling $7.6 million and $6.4 million and hedge funds totaling $15.8 million and $18.2 million for the years ended December 31, 2010 and 2009, respectively.
(5) Private Equity amounts classified as Level 1 represent unrealized gains on futures contracts. (6) Level 2 investments relate to other assets not invested in real estate. The Company values assets based on observable inputs when available. Equity securities and futures contracts classified as Level 1 in the fair value hierarchy are priced based on the closing price on the primary exchange as of the balance sheet date. Commingled funds included in Level 2 equity securities are recorded at the net asset value provided by the asset manager, which is based on the market prices of the underlying equity securities. Swaps are valued using pricing models that incorporate interest rates and equity and fixed income index closing prices to determine a net present value of the cash flows. Fixed income securities included in Level 2 are valued using pricing models, quoted prices of securities with similar characteristics or discounted cash flows. The pricing models utilize observable inputs such as recent trades for the same or similar instruments, yield curves, discount margins and bond structures. Hedge funds and investments in distressed credit funds are recorded at net asset value based on the values of the underlying assets. The assets in the hedge funds and distressed credit income funds are valued using observable inputs and are classified as Level 3 within the fair value hierarchy due to redemption restrictions. Private Equity investments and Real Estate and Other Assets are valued
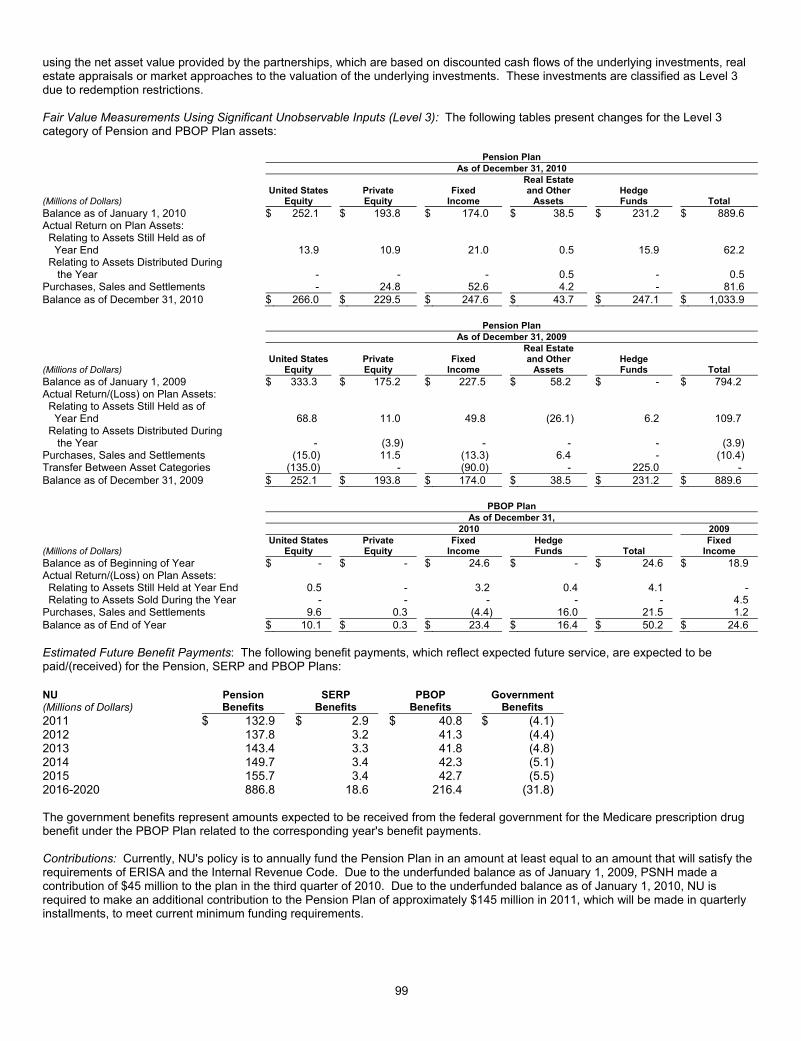
99
using the net asset value provided by the partnerships, which are based on discounted cash flows of the underlying investments, real estate appraisals or market approaches to the valuation of the underlying investments. These investments are classified as Level 3 due to redemption restrictions. Fair Value Measurements Using Significant Unobservable Inputs (Level 3): The following tables present changes for the Level 3 category of Pension and PBOP Plan assets: Pension Plan As of December 31, 2010 (Millions of Dollars)
United StatesEquity
Private Equity
Fixed Income
Real Estate and Other
Assets Hedge Funds Total
Balance as of January 1, 2010 $ 252.1 $ 193.8 $ 174.0 $ 38.5 $ 231.2 $ 889.6 Actual Return on Plan Assets: Relating to Assets Still Held as of Year End 13.9 10.9 21.0 0.5 15.9 62.2 Relating to Assets Distributed During the Year - - - 0.5 - 0.5 Purchases, Sales and Settlements - 24.8 52.6 4.2 - 81.6 Balance as of December 31, 2010 $ 266.0 $ 229.5 $ 247.6 $ 43.7 $ 247.1 $ 1,033.9 Pension Plan As of December 31, 2009 (Millions of Dollars)
United StatesEquity
Private Equity
Fixed Income
Real Estate and Other
Assets Hedge Funds Total
Balance as of January 1, 2009 $ 333.3 $ 175.2 $ 227.5 $ 58.2 $ - $ 794.2 Actual Return/(Loss) on Plan Assets: Relating to Assets Still Held as of Year End 68.8 11.0 49.8 (26.1) 6.2 109.7 Relating to Assets Distributed During the Year - (3.9) - - - (3.9) Purchases, Sales and Settlements (15.0) 11.5 (13.3) 6.4 - (10.4) Transfer Between Asset Categories (135.0) - (90.0) - 225.0 - Balance as of December 31, 2009 $ 252.1 $ 193.8 $ 174.0 $ 38.5 $ 231.2 $ 889.6 PBOP Plan As of December 31, 2010 2009 (Millions of Dollars)
United StatesEquity
Private Equity
Fixed Income
Hedge Funds Total
Fixed Income
Balance as of Beginning of Year $ - $ - $ 24.6 $ - $ 24.6 $ 18.9 Actual Return/(Loss) on Plan Assets: Relating to Assets Still Held at Year End 0.5 - 3.2 0.4 4.1 - Relating to Assets Sold During the Year - - - - - 4.5 Purchases, Sales and Settlements 9.6 0.3 (4.4) 16.0 21.5 1.2 Balance as of End of Year $ 10.1 $ 0.3 $ 23.4 $ 16.4 $ 50.2 $ 24.6 Estimated Future Benefit Payments: The following benefit payments, which reflect expected future service, are expected to be paid/(received) for the Pension, SERP and PBOP Plans: NU (Millions of Dollars)
Pension Benefits
SERP Benefits
PBOP Benefits
GovernmentBenefits
2011 $ 132.9 $ 2.9 $ 40.8 $ (4.1) 2012 137.8 3.2 41.3 (4.4) 2013 143.4 3.3 41.8 (4.8) 2014 149.7 3.4 42.3 (5.1) 2015 155.7 3.4 42.7 (5.5) 2016-2020 886.8 18.6 216.4 (31.8) The government benefits represent amounts expected to be received from the federal government for the Medicare prescription drug benefit under the PBOP Plan related to the corresponding year's benefit payments. Contributions: Currently, NU's policy is to annually fund the Pension Plan in an amount at least equal to an amount that will satisfy the requirements of ERISA and the Internal Revenue Code. Due to the underfunded balance as of January 1, 2009, PSNH made a contribution of $45 million to the plan in the third quarter of 2010. Due to the underfunded balance as of January 1, 2010, NU is required to make an additional contribution to the Pension Plan of approximately $145 million in 2011, which will be made in quarterly installments, to meet current minimum funding requirements.

100
For the PBOP Plan, it is currently NU's policy to annually fund an amount equal to the PBOP Plan's postretirement benefit cost, excluding curtailment and termination benefits. NU contributed $41.8 million for the year ended December 31, 2010 to fund the PBOP Plan and expects to make $42.8 million in contributions to the PBOP Plan in 2011. NU makes an additional contribution to the PBOP Plan for the amounts received from the federal Medicare subsidy. This amount was $3.8 million in 2010 and is estimated to be $4.1 million in 2011. B. Defined Contribution Plans NU maintains a 401(k) Savings Plan for substantially all NU employees, including CL&P, PSNH and WMECO employees. This savings plan provides for employee contributions up to specified limits. NU matches employee contributions up to a maximum of three percent of eligible compensation with one percent in cash and two percent in NU common shares allocated from the ESOP. The 401(k) matching contributions of cash and NU common shares made by NU were $12.7 million ($4 million for CL&P, $2.4 million for PSNH and $0.8 million for WMECO) in 2010, $12.2 million ($3.9 million for CL&P, $2.3 million for PSNH and $0.7 million for WMECO) in 2009, and $12 million ($4 million for CL&P, $2.3 million for PSNH and $0.7 million for WMECO) in 2008. Effective on January 1, 2006, all newly hired, non-bargaining unit employees, and effective on January 1, 2007 or as subject to collective bargaining agreements, certain newly hired bargaining unit employees participate in a new program under the 401(k) Savings Plan called the K-Vantage benefit. These employees are not eligible to participate in the Pension Plan. In addition, participants in the Pension Plan as of January 1, 2006 were given the opportunity to choose to become a participant in the K-Vantage benefit beginning in 2007, in which case their benefit under the Pension Plan would be frozen. NU makes contributions to the K-Vantage benefit based on a percentage of participants' eligible compensation, as defined by the benefit document. The contributions made by NU were $3.4 million ($0.4 million for CL&P, $0.4 million for PSNH and $0.1 million for WMECO) in 2010, $2.6 million (de minimis amounts for CL&P and WMECO and $0.3 million for PSNH) in 2009, and $2 million (de minimis amounts for CL&P and WMECO and $0.3 million for PSNH) in 2008. C. Employee Stock Ownership Plan NU maintains an ESOP for purposes of allocating shares to NU, CL&P, PSNH, and WMECO's employees participating in NU's 401(k) Savings Plan. NU issued unsecured notes during 1991 and 1992 totaling $250 million, the proceeds of which were loaned to the ESOP trust (ESOP Notes) for the purchase of 10.8 million newly issued NU common shares (ESOP shares). The ESOP trust was obligated to make principal and interest payments to NU on the ESOP Notes at the same rate that ESOP shares were allocated to employee accounts in the 401(k) Savings Plan. Under this arrangement, NU made annual contributions to the ESOP trust equal to the ESOP's debt service, less dividends received by the ESOP. NU's contributions to the ESOP trust for the years ended December 31, 2010, 2009 and 2008 totaled $1.1 million, $6.1 million and $6 million, respectively. During 2010, the ESOP Notes were fully repaid and all ESOP shares purchased with the proceeds of the ESOP Notes were fully allocated. Following complete allocation of the ESOP shares in 2010, continuing allocations of NU common shares were made from NU treasury shares to satisfy the 401(k) Savings Plan obligation to provide a portion of the matching contribution in NU common shares. For treasury shares used to satisfy the 401(k) Savings Plan matching contributions, compensation expense is recognized equal to the fair value of shares that have been allocated to participants. Any difference between the fair value and the average cost of the allocated treasury shares is charged or credited to Capital Surplus, Paid In. For the years ended December 31, 2010, 2009 and 2008, NU recognized $8.5 million, $8.2 million and $8 million, respectively, of expense related to the ESOP. Dividends on the ESOP unallocated shares are not considered dividends for financial reporting purposes. During the first and second quarters of 2008, NU paid a $0.20 per share quarterly dividend. During the third and fourth quarters of 2008, NU paid a $0.2125 per share quarterly dividend. NU paid a $0.2375 per share quarterly dividend in 2009 and a $0.25625 per share quarterly dividend in 2010. In 2010 and 2009, the ESOP trust allocated 127,054 and 542,724 of NU common shares, respectively, to satisfy 401(k) Savings Plan obligations to employees. As of December 31, 2010, total allocated ESOP shares were 10,800,185 and there were no unallocated ESOP shares remaining. As of December 31, 2009, total allocated ESOP shares were 10,673,131 and total unallocated ESOP shares were 127,054. The fair market value of the unallocated ESOP shares as of December 31, 2009 was $3.3 million. D. Share-Based Payments NU maintains an ESPP and other long-term equity-based incentive plans under the NU Incentive Plan in which NU, CL&P, PSNH, and WMECO employees and officers are entitled to participate. NU, CL&P, PSNH, and WMECO record compensation cost related to these plans, as applicable, for shares issued or sold to NU, CL&P, PSNH, and WMECO employees and officers, as well as the allocation of costs associated with shares issued or sold to NUSCO employees and officers that support CL&P, PSNH, and WMECO. In accordance with accounting guidance for share-based payments, share-based compensation awards are recorded using the fair value-based method based on the fair value at the date of grant. This guidance applies to share-based compensation awards granted on or after January 1, 2006 or to awards for which the requisite service period has not been completed. NU accounts for its various share-based plans as follows: • For grants of restricted shares and RSUs, NU records compensation expense, net of estimated forfeitures, on a straight-line basis
over the vesting period based upon the fair value of NU's common shares at the date of grant. Dividend equivalents on RSUs are charged to retained earnings, net of estimated forfeitures.

101
• For grants of performance shares, NU records compensation expense, net of estimated forfeitures, on a straight-line basis over the vesting period. Performance shares vest based upon the achievement of Company targets. For the majority of performance shares, fair value is based upon the value of NU's common shares at the date of grant and compensation expense is recorded based upon the probable outcome of the achievement of Company targets. The remaining performance shares are based upon the achievement of the Company's share price as compared to an index of similar equity securities. The fair value at the date of grant for these remaining performance shares was determined using a lattice model and compensation expense is recorded over the vesting period.
• NU has not granted any stock options since 2002, and no compensation expense has been recorded. All options were fully vested
prior to January 1, 2006. • For shares sold under the ESPP, no compensation expense is recorded, as the ESPP qualifies as a non-compensatory plan under
relevant accounting guidance. For the years ended December 31, 2010, 2009 and 2008, tax expense in excess of compensation expense totaling $0.9 million, $0.9 million and $1.6 million, respectively, increased cash flows from financing activities. NU Incentive Plan: Under the NU Incentive Plan, in which CL&P, PSNH and WMECO participate, NU is authorized to grant up to 4.5 million new shares for various types of awards, including restricted shares, RSUs, performance shares and stock options to eligible employees and board members. As of December 31, 2010 and 2009, NU had 3,068,850 and 2,363,521 common shares, respectively, available for issuance under the NU Incentive Plan. Restricted Shares: NU has granted restricted shares under the 2002 through 2004 incentive programs that are subject to three-year and four-year graded vesting schedules. The remaining restricted shares under these programs were fully vested as of December 31, 2008 and the total compensation cost recorded had a de minimis impact to NU, CL&P, PSNH and WMECO for the year ended December 31, 2008. RSUs: NU has granted RSUs under the 2004 through 2010 incentive programs that are subject to three-year and four-year graded vesting schedules for employees, and one-year graded vesting schedules for board members. RSUs are paid in shares, reduced by amounts sufficient to satisfy withholdings, subsequent to vesting. A summary of RSU transactions is as follows:
RSUs RSUs (Units)
Weighted Average
Grant-Date Fair Value
Total Grant-Date Fair Value (Millions)
Outstanding as of December 31, 2007 831,000 $ 22.99 $ 19.1 Granted 352,482 $ 26.82 $ 9.5 Shares issued (263,422) $ 21.94 $ 5.8 Forfeited (7,069) $ 25.97 $ 0.2 Outstanding as of December 31, 2008 912,991 $ 24.75 $ 22.6 Granted 347,112 $ 23.26 $ 8.1 Shares issued (203,888) $ 25.55 $ 5.2Forfeited (18,303) $ 26.26 $ 0.5 Outstanding as of December 31, 2009 1,037,912 $ 24.07 $ 25.0 Granted 258,174 $ 26.03 $ 6.7 Shares issued (267,951) $ 25.05 $ 6.7 Forfeited (13,656) $ 24.26 $ 0.3 Outstanding as of December 31, 2010 1,014,479 $ 24.31 $ 24.7 As of December 31, 2010 and 2009, the number and weighted average grant-date fair value of RSUs not vested was 519,900 and $12.9 million, and 571,673 and $15.2 million, respectively. The number and weighted average grant-date fair value of RSUs vested during 2010 was 317,866 and $8.3 million, respectively. As of December 31, 2010, 494,579 RSUs were fully vested and 493,905 are expected to vest. On November 16, 2010, NU granted 192,309 RSUs to certain executives, contingent upon completion of the proposed merger with NSTAR, with a three year vesting period that would begin as of the date of completion of the merger.
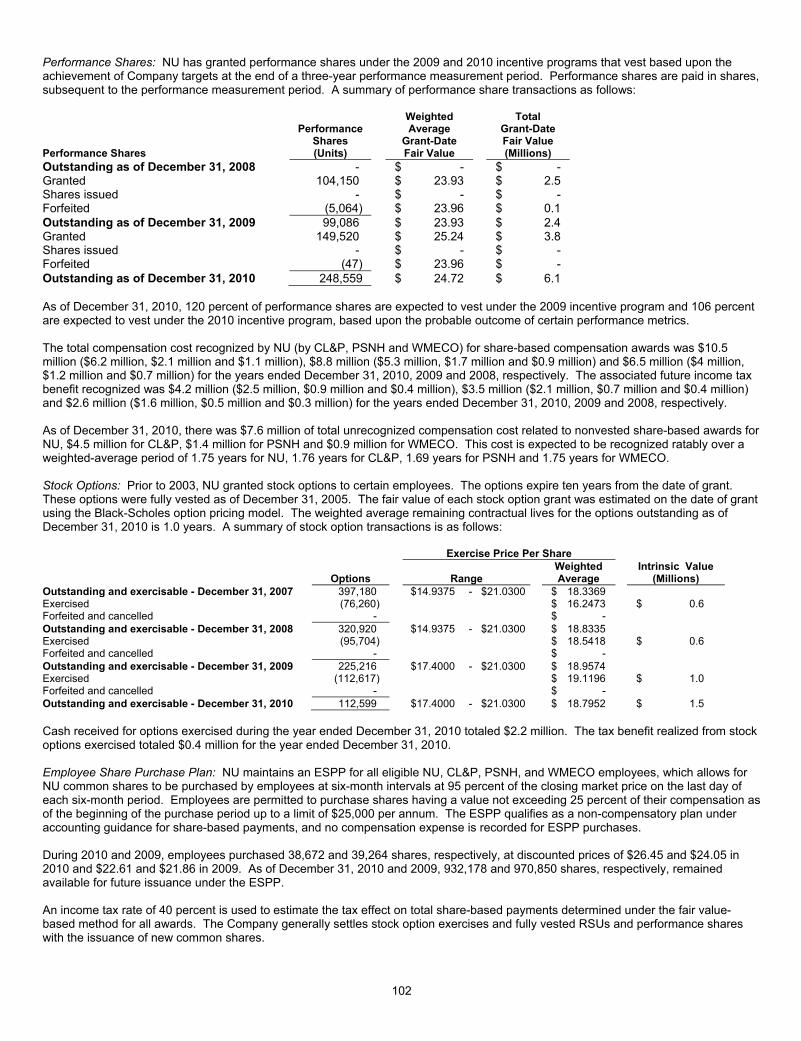
102
Performance Shares: NU has granted performance shares under the 2009 and 2010 incentive programs that vest based upon the achievement of Company targets at the end of a three-year performance measurement period. Performance shares are paid in shares, subsequent to the performance measurement period. A summary of performance share transactions as follows:
Performance Shares
PerformanceShares (Units)
Weighted Average
Grant-Date Fair Value
Total Grant-Date Fair Value (Millions)
Outstanding as of December 31, 2008 - $ - $ - Granted 104,150 $ 23.93 $ 2.5 Shares issued - $ - $ - Forfeited (5,064) $ 23.96 $ 0.1 Outstanding as of December 31, 2009 99,086 $ 23.93 $ 2.4 Granted 149,520 $ 25.24 $ 3.8 Shares issued - $ - $ - Forfeited (47) $ 23.96 $ - Outstanding as of December 31, 2010 248,559 $ 24.72 $ 6.1 As of December 31, 2010, 120 percent of performance shares are expected to vest under the 2009 incentive program and 106 percent are expected to vest under the 2010 incentive program, based upon the probable outcome of certain performance metrics. The total compensation cost recognized by NU (by CL&P, PSNH and WMECO) for share-based compensation awards was $10.5 million ($6.2 million, $2.1 million and $1.1 million), $8.8 million ($5.3 million, $1.7 million and $0.9 million) and $6.5 million ($4 million, $1.2 million and $0.7 million) for the years ended December 31, 2010, 2009 and 2008, respectively. The associated future income tax benefit recognized was $4.2 million ($2.5 million, $0.9 million and $0.4 million), $3.5 million ($2.1 million, $0.7 million and $0.4 million) and $2.6 million ($1.6 million, $0.5 million and $0.3 million) for the years ended December 31, 2010, 2009 and 2008, respectively. As of December 31, 2010, there was $7.6 million of total unrecognized compensation cost related to nonvested share-based awards for NU, $4.5 million for CL&P, $1.4 million for PSNH and $0.9 million for WMECO. This cost is expected to be recognized ratably over a weighted-average period of 1.75 years for NU, 1.76 years for CL&P, 1.69 years for PSNH and 1.75 years for WMECO. Stock Options: Prior to 2003, NU granted stock options to certain employees. The options expire ten years from the date of grant. These options were fully vested as of December 31, 2005. The fair value of each stock option grant was estimated on the date of grant using the Black-Scholes option pricing model. The weighted average remaining contractual lives for the options outstanding as of December 31, 2010 is 1.0 years. A summary of stock option transactions is as follows: Exercise Price Per Share
Options Range Weighted Average
Intrinsic Value(Millions)
Outstanding and exercisable - December 31, 2007 397,180 $14.9375 - $21.0300 $ 18.3369 Exercised (76,260) $ 16.2473 $ 0.6 Forfeited and cancelled - $ - Outstanding and exercisable - December 31, 2008 320,920 $14.9375 - $21.0300 $ 18.8335 Exercised (95,704) $ 18.5418 $ 0.6 Forfeited and cancelled - $ - Outstanding and exercisable - December 31, 2009 225,216 $17.4000 - $21.0300 $ 18.9574 Exercised (112,617) $ 19.1196 $ 1.0 Forfeited and cancelled - $ - Outstanding and exercisable - December 31, 2010 112,599 $17.4000 - $21.0300 $ 18.7952 $ 1.5 Cash received for options exercised during the year ended December 31, 2010 totaled $2.2 million. The tax benefit realized from stock options exercised totaled $0.4 million for the year ended December 31, 2010. Employee Share Purchase Plan: NU maintains an ESPP for all eligible NU, CL&P, PSNH, and WMECO employees, which allows for NU common shares to be purchased by employees at six-month intervals at 95 percent of the closing market price on the last day of each six-month period. Employees are permitted to purchase shares having a value not exceeding 25 percent of their compensation as of the beginning of the purchase period up to a limit of $25,000 per annum. The ESPP qualifies as a non-compensatory plan under accounting guidance for share-based payments, and no compensation expense is recorded for ESPP purchases. During 2010 and 2009, employees purchased 38,672 and 39,264 shares, respectively, at discounted prices of $26.45 and $24.05 in 2010 and $22.61 and $21.86 in 2009. As of December 31, 2010 and 2009, 932,178 and 970,850 shares, respectively, remained available for future issuance under the ESPP. An income tax rate of 40 percent is used to estimate the tax effect on total share-based payments determined under the fair value-based method for all awards. The Company generally settles stock option exercises and fully vested RSUs and performance shares with the issuance of new common shares.

103
E. Other Retirement Benefits NU provides benefits for retirement and other benefits for certain current and past company officers of NU, including CL&P, PSNH and WMECO. The actuarially-determined liability for these benefits, which is included in Other Long-Term Liabilities on the accompanying consolidated balance sheets, was $49.9 million ($0.4 million for CL&P, $2.4 million for PSNH and $0.2 million for WMECO) and $47.9 million ($0.4 million for CL&P, $2.4 million for PSNH and $0.2 million for WMECO) as of December 31, 2010 and 2009, respectively. During 2010, 2009 and 2008, $4.2 million ($2.3 million for CL&P, $0.9 million for PSNH and $0.4 million for WMECO), $3.9 million ($2.2 million for CL&P, $0.9 million for PSNH and $0.4 million for WMECO) and $3.8 million ($2.2 million for CL&P, $0.8 million for PSNH and $0.4 million for WMECO), respectively, was expensed related to these benefits. These benefits are accounted for on an accrual basis and expensed over the service lives of the employees in accordance with accounting guidance for deferred compensation contracts. 11. INCOME TAXES The tax effect of temporary differences is accounted for in accordance with the rate-making treatment of the applicable regulatory commissions and relevant accounting authoritative literature. Details of income tax expense and the components of the federal and state income tax provisions are as follows: For the Years Ended December 31, 2010 2009 2008 (Millions of Dollars) NU NU NU Current Income Taxes: Federal $ 9.0 $ 4.5 $ 6.0 State (6.5) 52.7 16.3 Total Current 2.5 57.2 22.3 Deferred Income Taxes, Net: Federal 201.2 155.1 100.2 State 9.7 (29.2) (13.4) Total Deferred 210.9 125.9 86.8 Investment Tax Credits, Net (3.0) (3.2) (3.4) Income Tax Expense $ 210.4 $ 179.9 $ 105.7 For the Years Ended December 31, 2010 2009 2008 (Millions of Dollars) CL&P PSNH WMECO CL&P PSNH WMECO CL&P PSNH WMECO Current Income Taxes: Federal $ 20.7 $ 6.1 $ 3.1 $ 28.3 $ (8.9) $ (8.6) $ 13.9 $ 0.8 $ (1.4) State (1.1) 5.6 2.5 40.1 5.8 0.9 19.0 (3.6) - Total Current 19.6 11.7 5.6 68.4 (3.1) (7.7) 32.9 (2.8) (1.4) Deferred Income Taxes, Net: Federal 108.1 37.6 11.0 80.5 34.4 21.3 68.0 17.4 10.4 State 7.0 1.6 - (27.6) 0.8 1.6 (20.4) 7.6 1.8 Total Deferred 115.1 39.2 11.0 52.9 35.2 22.9 47.6 25.0 12.2 Investment Tax Credits, Net (2.3) (0.1) (0.3) (2.5) (0.1) (0.3) (2.6) (0.2) (0.2) Income Tax Expense $ 132.4 $ 50.8 $ 16.3 $ 118.8 $ 32.0 $ 14.9 $ 77.9 $ 22.0 $ 10.6 A reconciliation between income tax expense and the expected tax expense at the statutory rate is as follows: For the Years Ended December 31, 2010 2009 2008 (Millions of Dollars, except percentages) NU NU NU Income Before Income Tax Expense $ 604.5 $ 515.5 $ 372.0 Statutory Federal Income Tax Expense at 35% 211.6 180.4 130.2 Tax Effect of Differences: Depreciation (9.5) (2.7) (12.9) Investment Tax Credit Amortization (3.0) (3.2) (3.4) Other Federal Tax Credits (3.8) (3.8) (4.6) State Income Taxes, Net of Federal Impact 12.5 11.5 (9.5) Medicare Subsidy 15.6 (3.5) (4.2) Tax Asset Valuation Allowance/Reserve Adjustments (10.5) 3.8 12.5 Other, Net (2.5) (2.6) (2.4) Income Tax Expense $ 210.4 $ 179.9 $ 105.7 Effective Tax Rate 34.8 % 34.9 % 28.4 %
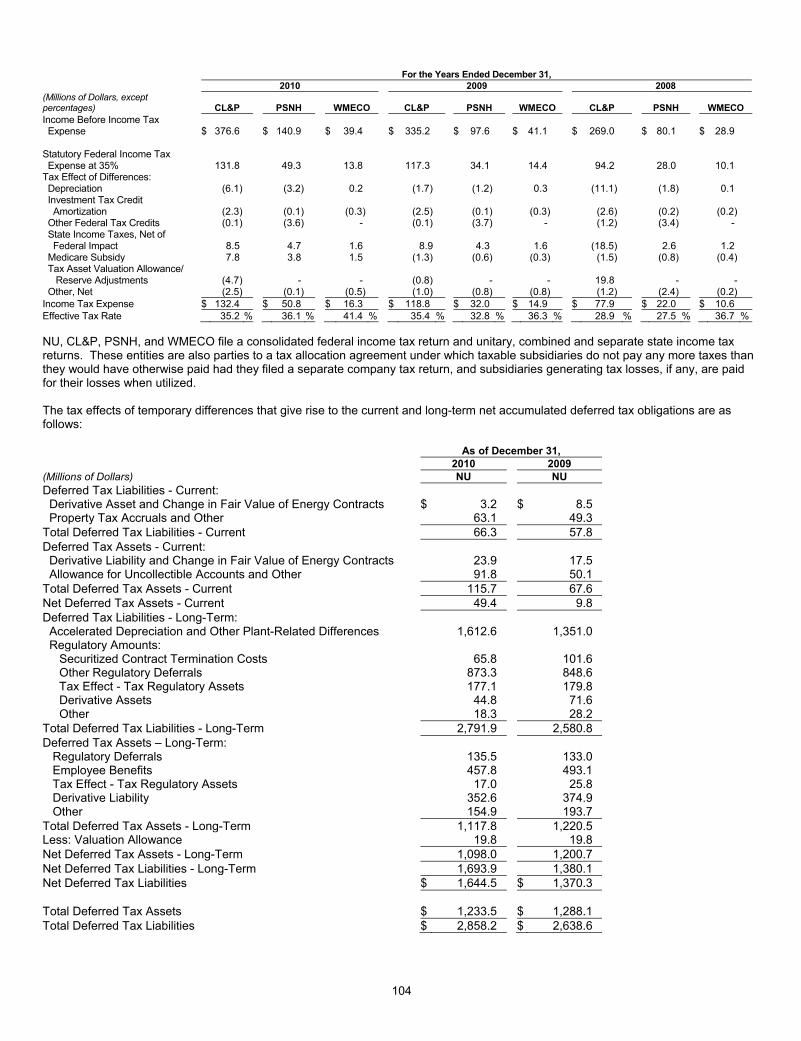
104
For the Years Ended December 31, 2010 2009 2008
(Millions of Dollars, except percentages) CL&P PSNH WMECO CL&P PSNH WMECO CL&P PSNH WMECO Income Before Income Tax Expense $ 376.6 $ 140.9 $ 39.4 $ 335.2 $ 97.6 $ 41.1 $ 269.0 $ 80.1 $ 28.9 Statutory Federal Income Tax Expense at 35% 131.8 49.3 13.8 117.3 34.1 14.4 94.2 28.0 10.1 Tax Effect of Differences: Depreciation (6.1) (3.2) 0.2 (1.7) (1.2) 0.3 (11.1) (1.8) 0.1 Investment Tax Credit Amortization (2.3) (0.1) (0.3) (2.5) (0.1) (0.3) (2.6) (0.2) (0.2) Other Federal Tax Credits (0.1) (3.6) - (0.1) (3.7) - (1.2) (3.4) - State Income Taxes, Net of Federal Impact 8.5 4.7 1.6 8.9 4.3 1.6 (18.5) 2.6 1.2 Medicare Subsidy 7.8 3.8 1.5 (1.3) (0.6) (0.3) (1.5) (0.8) (0.4) Tax Asset Valuation Allowance/ Reserve Adjustments (4.7) - - (0.8) - - 19.8 - - Other, Net (2.5) (0.1) (0.5) (1.0) (0.8) (0.8) (1.2) (2.4) (0.2)Income Tax Expense $ 132.4 $ 50.8 $ 16.3 $ 118.8 $ 32.0 $ 14.9 $ 77.9 $ 22.0 $ 10.6 Effective Tax Rate 35.2 % 36.1 % 41.4 % 35.4 % 32.8 % 36.3 % 28.9 % 27.5 % 36.7 % NU, CL&P, PSNH, and WMECO file a consolidated federal income tax return and unitary, combined and separate state income tax returns. These entities are also parties to a tax allocation agreement under which taxable subsidiaries do not pay any more taxes than they would have otherwise paid had they filed a separate company tax return, and subsidiaries generating tax losses, if any, are paid for their losses when utilized. The tax effects of temporary differences that give rise to the current and long-term net accumulated deferred tax obligations are as follows: As of December 31, 2010 2009 (Millions of Dollars) NU NU Deferred Tax Liabilities - Current: Derivative Asset and Change in Fair Value of Energy Contracts $ 3.2 $ 8.5 Property Tax Accruals and Other 63.1 49.3 Total Deferred Tax Liabilities - Current 66.3 57.8 Deferred Tax Assets - Current: Derivative Liability and Change in Fair Value of Energy Contracts 23.9 17.5 Allowance for Uncollectible Accounts and Other 91.8 50.1 Total Deferred Tax Assets - Current 115.7 67.6 Net Deferred Tax Assets - Current 49.4 9.8 Deferred Tax Liabilities - Long-Term: Accelerated Depreciation and Other Plant-Related Differences 1,612.6 1,351.0 Regulatory Amounts: Securitized Contract Termination Costs 65.8 101.6 Other Regulatory Deferrals 873.3 848.6 Tax Effect - Tax Regulatory Assets 177.1 179.8 Derivative Assets 44.8 71.6 Other 18.3 28.2 Total Deferred Tax Liabilities - Long-Term 2,791.9 2,580.8 Deferred Tax Assets – Long-Term: Regulatory Deferrals 135.5 133.0 Employee Benefits 457.8 493.1 Tax Effect - Tax Regulatory Assets 17.0 25.8 Derivative Liability 352.6 374.9 Other 154.9 193.7 Total Deferred Tax Assets - Long-Term 1,117.8 1,220.5 Less: Valuation Allowance 19.8 19.8 Net Deferred Tax Assets - Long-Term 1,098.0 1,200.7 Net Deferred Tax Liabilities - Long-Term 1,693.9 1,380.1 Net Deferred Tax Liabilities $ 1,644.5 $ 1,370.3 Total Deferred Tax Assets $ 1,233.5 $ 1,288.1 Total Deferred Tax Liabilities $ 2,858.2 $ 2,638.6

105
As of December 31, 2010 2009
(Millions of Dollars) CL&P PSNH WMECO CL&P PSNH WMECO Deferred Tax Assets - Current: Derivative Liability and Change in Fair Value of Energy Contracts $ 18.7 $ 5.1 $ - $ 2.6 $ 7.4 $ - Allowance for Uncollectible Accounts and Other 60.2 11.2 2.0 25.3 6.0 2.8 Total Deferred Tax Assets – Current 78.9 16.3 2.0 27.9 13.4 2.8 Deferred Tax Liabilities - Current: Derivative Assets and Change in Fair Value of Energy Contracts 3.1 - - 8.3 0.2 - Property Tax Accruals and Other 43.4 5.6 3.7 31.2 5.1 3.0 Total Deferred Tax Liabilities – Current 46.5 5.6 3.7 39.5 5.3 3.0 Net Deferred Tax Liabilities/(Assets) - Current (32.4) (10.7) 1.7 11.6 (8.1) 0.2 Deferred Tax Assets - Long-Term: Regulatory Deferrals 68.9 34.4 6.5 70.0 36.2 5.4 Employee Benefits 63.9 121.8 1.8 85.2 135.1 8.3 Income Tax Gross-Up 7.4 1.6 6.9 12.8 2.2 7.2 Derivative Liability 352.5 - - 364.5 3.0 - Other 56.8 8.5 14.3 88.8 9.5 8.4 Net Deferred Tax Assets – Long-Term 549.5 166.3 29.5 621.3 186.0 29.3 Deferred Tax Liabilities - Long-Term: Accelerated Depreciation and Other Plant-Related Differences 917.0 309.8 168.4 754.1 263.1 152.8 Regulatory Amounts: Securitized Contract Termination Costs (0.8) 50.4 16.2 9.6 69.9 22.1 Other Regulatory Deferrals 546.6 105.1 51.1 536.2 111.1 51.2 Income Tax Gross-Up 138.5 14.0 13.7 145.3 10.9 14.0 Derivative Assets 44.8 - - 71.4 - - Other 4.5 14.3 2.4 6.2 6.7 0.6 Total Deferred Tax Liabilities - Long-Term 1,650.6 493.6 251.8 1,522.8 461.7 240.7 Net Deferred Tax Liabilities - Long-Term 1,101.1 327.3 222.3 901.5 275.7 211.4 Net Deferred Tax Liabilities $ 1,068.7 $ 316.6 $ 224.0 $ 913.1 $ 267.6 $ 211.6 Total Deferred Tax Assets $ 628.4 $ 182.6 $ 31.5 $ 649.2 $ 199.4 $ 32.1 Total Deferred Tax Liabilities $ 1,697.1 $ 499.2 $ 255.5 $ 1,562.3 $ 467.0 $ 243.7 Net Deferred Tax Liabilities/(Assets) - Current are recorded as current liabilities or assets and are included in Other Current Liabilities or Prepayments and Other Current Assets, respectively, on the accompanying consolidated balance sheets. As of December 31, 2010, NU had state net operating loss carryforwards of $317.7 million that expire between December 31, 2011 and December 31, 2027 and state credit carryforwards of $84.9 million that begin expiring in 2013. As of December 31, 2009, NU had state net operating loss carryforwards of $323.9 million that expire between December 31, 2010 and December 31, 2027 and state credit carryforwards of $88.7 million that expire by December 31, 2014. The net operating loss carryforward deferred tax asset has been fully reserved by a valuation allowance. As of December 31, 2010, CL&P had state tax credit carryforwards of $56.1 million that expire by 2014. As of December 31, 2009, CL&P had state tax credit carryforwards of $61.1 million that expire by 2014.

106
Unrecognized Tax Benefits: As of December 31, 2010, NU and CL&P had unrecognized tax benefits totaling $101.2 million and $80.8 million, respectively, all of which would impact the effective tax rate if recognized. As of December 31, 2009, NU and CL&P had unrecognized tax benefits totaling $124.3 million and $89 million, respectively, all of which would impact the effective tax rate if recognized. As of December 31, 2008, the portion of NU and CL&P unrecognized tax benefits that would impact the effective tax rate, if recognized, were $120 million and $87 million, respectively. A reconciliation of the activity in unrecognized tax benefits from January 1, 2008 to December 31, 2010 is as follows: (Millions of Dollars) NU CL&P PSNH WMECO Balance as of January 1, 2008 $ 121.1 $ 75.9 $ 10.6 $ 2.9 Gross Increases - Current Year 28.6 24.9 - - Gross Increases - Prior Year 7.4 5.6 1.8 0.9 Lapse of Statute of Limitations (0.8) - - - Balance as of December 31, 2008 156.3 106.4 12.4 3.8 Gross Increases - Current Year 12.3 8.6 - - Settlement (44.2) (26.0) (12.4) (3.8) Lapse of Statute of Limitations (0.1) - - - Balance as of December 31, 2009 124.3 89.0 - - Gross Increases - Current Year 10.8 5.3 - - Gross Increases - Prior Year 0.8 - - - Settlement (34.3) (13.5) - - Lapse of Statute of Limitations (0.4) - - - Balance as of December 31, 2010 $ 101.2 $ 80.8 $ - $ - Interest and Penalties: Interest on uncertain tax positions is recorded and generally classified as a component of Other Interest Expense. However, when resolution of uncertainties results in the Company receiving interest income, any related interest benefit is recorded in Other Income, Net on the accompanying consolidated statements of income. No penalties have been recorded. The components of interest on uncertain tax positions by company in 2010, 2009 and 2008 are as follows:
Other Interest For the Years Ended December 31, Accrued Interest As of December 31, Expense/(Income) 2010 2009 2008 Expense/(Income) 2010 2009
(Millions of Dollars) (Millions of Dollars) CL&P $ (7.4) $ (4.2) $ 4.8 CL&P $ 6.4 $ 13.8 PSNH 0.1 (1.3) - PSNH 0.6 0.5 WMECO - (0.4) 0.2 WMECO - - NU Parent and Other (17.5) 1.9 3.2 NU Parent and Other 2.9 20.4 Total $ (24.8) $ (4.0) $ 8.2 Total $ 9.9 $ 34.7 Tax Positions: During 2010, NU settled various tax matters including state obligations, which resulted in the recognition during the year of an after-tax gain of approximately $35 million. This gain is recorded as a reduction to both interest expense and income tax expense (including NU and CL&P tax expense reductions of approximately $6 million and $4 million, respectively). NU is currently working to resolve the treatments of certain timing and other costs in the remaining open periods. Tax Years: The following table summarizes NU, CL&P, PSNH and WMECO's tax years that remain subject to examination by major tax jurisdictions as of December 31, 2010: Description Tax Years Federal 2009-2010 Connecticut 2005-2010 New Hampshire 2007-2010 Massachusetts 2007-2010 While tax audits are currently ongoing, it is reasonably possible that one or more of these open tax years could be resolved within the next twelve months. Management estimates that potential resolutions of differences of a non-timing nature, could result in a zero to $77 million decrease in unrecognized tax benefits by NU and a zero to $67 million decrease in unrecognized tax benefits by CL&P. These estimated changes could have an impact on NU's and CL&P's 2011 earnings of zero to $38 million and zero to $34 million, respectively. Other companies’ impacts are not expected to be material. 2010 Federal Legislation: On March 23, 2010, President Obama signed into law the 2010 Healthcare Act. The 2010 Healthcare Act was amended by a Reconciliation Bill signed into law on March 30, 2010. The 2010 Healthcare Act includes a provision that eliminated the tax deductibility of certain PBOP contributions equal to the amount of the federal subsidy received by companies like NU, which sponsor retiree health care benefit plans with a prescription drug benefit that is actuarially equivalent to Medicare Part D. The tax deduction eliminated by this legislation represented a loss of previously recognized deferred income tax assets established through 2009 and as a result, these assets were written down by approximately $18 million in 2010. Since the electric and natural gas distribution companies are cost-of-service and rate-regulated, a portion of the $18 million is able to be deferred and recovered through future rates. For the year ended December 31, 2010, NU deferred approximately $15 million of recoverable write-offs related to these businesses and reduced 2010 earnings on a net basis by approximately $3 million of non-recoverable costs. In addition, as a result of the elimination of the tax deduction in 2010, NU was not able to recognize approximately $2 million of net annual benefits.

107
On September 27, 2010, President Obama signed into law the Small Business Jobs and Credit Act of 2010, which extends the bonus depreciation provisions of the American Recovery and Reinvestment Act of 2009 to small and large businesses through 2010. This extended stimulus provided NU with cash flow benefits of approximately $100 million. On December 17, 2010, President Obama signed into law the 2010 Tax Act, which, among other things, provides 100 percent bonus depreciation for tangible personal property placed in service after September 8, 2010, and through December 31, 2011. For tangible personal property placed in service after December 31, 2011, and through December 31, 2012, the 2010 Tax Act provides for 50 percent bonus depreciation. 12. COMMITMENTS AND CONTINGENCIES A. Environmental Matters General: NU, CL&P, PSNH, and WMECO are subject to environmental laws and regulations intended to mitigate or remove the effect of past operations and improve or maintain the quality of the environment. These laws and regulations require the removal or the remedy of the effect on the environment of the disposal or release of certain specified hazardous substances at current and former operating sites. NU, CL&P, PSNH, and WMECO have an active environmental auditing and training program and believe that they are substantially in compliance with all enacted laws and regulations. Environmental reserves are accrued when assessments indicate that it is probable that a liability has been incurred and an amount can be reasonably estimated. The approach used estimates the liability based on the most likely action plan from a variety of available remediation options, including no action required or several different remedies ranging from establishing institutional controls to full site remediation and monitoring. These estimates are subjective in nature as they take into consideration several different remediation options at each specific site. The reliability and precision of these estimates can be affected by several factors, including new information concerning either the level of contamination at the site, the extent of NU, CL&P, PSNH, and WMECO's responsibility or the extent of remediation required, recently enacted laws and regulations or a change in cost estimates due to certain economic factors. The amounts recorded as environmental liabilities included in Other Long-Term Liabilities on the accompanying consolidated balance sheets represent management's best estimate of the liability for environmental costs, and take into consideration site assessment and remediation costs. NU, CL&P, PSNH, and WMECO's environmental liability also takes into account recurring costs of managing hazardous substances and pollutants, mandated expenditures to remediate previously contaminated sites and any other infrequent and non-recurring clean up costs. A reconciliation of the activity in the environmental reserves is as follows: NU CL&P PSNH WMECO (Millions of Dollars) Balance as of December 31, 2008 $ 27.4 $ 2.8 $ 5.5 $ 0.3 Additions 2.3 0.3 0.1 0.4 Payments (3.7) (0.4) (0.3) (0.3) Balance as of December 31, 2009 26.0 2.7 5.3 0.4 Additions 18.2 0.5 8.9 0.1 Payments (7.1) (0.4) (5.1) (0.2) Balance as of December 31, 2010 $ 37.1 $ 2.8 $ 9.1 $ 0.3 These liabilities are estimated on an undiscounted basis and do not assume that any amounts are recoverable from insurance companies or other third parties. NU, CL&P, PSNH, and WMECO have not recorded any probable recoveries from third parties. The environmental reserve includes sites at different stages of discovery and remediation and does not include any unasserted claims. It is possible that new information or future developments could require a reassessment of the potential exposure to related environmental matters. As this information becomes available, management will continue to assess the potential exposure and adjust the reserves accordingly. As of December 31, 2010, the status of environmental sites are as follows: (Number of Sites) NU CL&P PSNH WMECO Remediation or long-term monitoring phase 33 6 12 8 Some site assessment completed 19 9 2 1 Preliminary site assessment stage 6 2 4 - Total environmental sites 58 17 18 9

108
The environmental reserve related to these sites is as follows: As of December 31, 2010 2009 NU CL&P PSNH WMECO NU CL&P PSNH WMECO Remediation or long-term monitoring phase $ 30.3 $ 0.8 $ 8.8 $ 0.2 $ 18.4 $ 0.5 $ 5.0 $ 0.2 Preliminary site assessment stage 6.5 1.9 0.1 0.1 7.3 2.1 0.2 0.2 Some site assessment completed 0.3 0.1 - - 0.3 0.1 0.1 - Total $ 37.1 $ 2.8 $ 0.3 $ 0.3 $ 26.0 $ 2.7 $ 5.3 0.4 The majority of the accruals for sites in remediation or long-term monitoring relate to MGP sites that were operated several decades ago and produced manufacturing gas from coal, which resulted in certain byproducts in the environment that may pose a risk to human health and the environment. As of December 31, 2010, for 8 environmental sites (3 for CL&P, 2 for PSNH, and 1 for WMECO) that are included in the Company's reserve for environmental costs, the information known and nature of the remediation options at those sites allow for the Company to estimate the range of losses for environmental costs. As of December 31, 2010, $8.4 million ($1.5 million for CL&P, $0.7 million for PSNH, and $0.1 million for WMECO) had been accrued as a liability for these sites, which represent management's best estimates of the liabilities for environmental costs. These amounts are the best estimates within estimated ranges of losses from $4.5 million to $25 million ($1.3 million to $5.7 million for CL&P, zero to $4.1 million for PSNH, and zero to $8.7 million for WMECO). For the 50 remaining sites (14 for CL&P, 16 for PSNH, and 8 for WMECO) that comprise the remaining $28.7 million of the environmental reserve ($1.3 million for CL&P, $8.4 million for PSNH and $0.2 million for WMECO), determining an estimated range of loss is not possible at this time. As of December 31, 2010, in addition to the sites identified above, there were 12 sites (7 for CL&P, 2 for PSNH, and 2 for WMECO) for which there are unasserted claims; however, any related site assessment or remediation costs are not probable or estimable at this time. HWP: HWP, a subsidiary of NU, continues to investigate the potential need for additional remediation at a river site in Massachusetts containing tar deposits associated with a MGP site that HWP sold to HG&E, a municipal utility, in 1902. HWP shares responsibility for site remediation with HG&E and has conducted substantial investigative and remediation activities. The cumulative expense recorded to the reserve for this site since 1994 through December 31, 2010 was $19.5 million, of which $16.6 million had been spent, leaving $2.9 million in the reserve as of December 31, 2010. For the years ended December 31, 2010, 2009 and 2008, pre-tax charges of $2.6 million, $1.1 million and $3 million, respectively, were recorded to reflect estimated costs associated with the site. HWP's share of the costs related to this site is not recoverable from customers. In 2008, the MA DEP issued a letter to HWP and HG&E, representing guidance rather than a mandate, providing conditional authorization for additional investigatory and risk characterization activities and indicating that further removal of tar in certain areas was needed. HWP implemented several supplemental studies to further delineate and assess tar deposits in conformity with the MA DEP's guidance letter. In 2010, HWP delivered a report to the MA DEP describing the results of its site investigation studies and testing. Subsequent communications and discussions with the MA DEP have focused on the course of action to achieve resolution of these matters, and are ongoing. The $2.9 million reserve balance as of December 31, 2010 represents estimated costs that HWP considers probable over the remaining life of the project, including testing and related costs in the near term and field activities to be agreed upon with the MA DEP, further studies and long-term monitoring that are expected to be required by the MA DEP, and certain soft tar remediation activities. Various factors could affect management's estimates and require an increase to the reserve, which would be reflected as a charge to Net Income. Although a material increase to the reserve is not presently anticipated, management cannot reasonably estimate potential additional investigation or remediation costs because these costs would depend, among other things, on the nature, extent and timing of additional investigation and remediation that may be required by the MA DEP. CERCLA: CERCLA and its amendments or state equivalents impose joint and several strict liabilities, regardless of fault, upon generators of hazardous substances resulting in removal and remediation costs and environmental damages. Liabilities under these laws can be material and in some instances may be imposed without regard to fault or for past acts that may have been lawful at the time they occurred. Of the total sites included in the remediation and long-term monitoring phase, 5 sites (3 for PSNH, 2 for CL&P, and 1 for WMECO) are superfund sites under CERCLA for which the Company has been notified that it is a potentially responsible party but for which the site assessment and remediation are not being managed by the Company. As of December 31, 2010, a liability of $0.7 million ($0.4 million for CL&P, $0.3 million for PSNH, and a de minimis amount for WMECO) accrued on these sites represents management's best estimate of its potential remediation costs with respect to these superfund sites. Environmental Rate Recovery: PSNH and Yankee Gas have rate recovery mechanisms for environmental costs. CL&P recovers a certain level of environmental costs currently in rates but does not have an environmental cost recovery tracking mechanism. Accordingly, changes in CL&P's environmental reserves impact CL&P's Net Income. WMECO does not have a separate regulatory

109
mechanism to recover environmental costs from its customers, and changes in WMECO's environmental reserves impact WMECO's Net Income. B. Spent Nuclear Fuel Disposal Costs (CL&P, WMECO) Under the Nuclear Waste Policy Act of 1982, CL&P and WMECO must pay the DOE for the costs of disposal of spent nuclear fuel and high-level radioactive waste for the period prior to the sale of their ownership shares in the Millstone nuclear power stations. The DOE is responsible for the selection and development of repositories for, and the disposal of, spent nuclear fuel and high-level radioactive waste. For nuclear fuel used to generate electricity prior to April 7, 1983 (Prior Period Spent Nuclear Fuel) for CL&P and WMECO, an accrual has been recorded for the full liability, and payment must be made by CL&P and WMECO to the DOE prior to the first delivery of spent fuel to the DOE. After the sale of Millstone, CL&P and WMECO remained responsible for their share of the disposal costs associated with the Prior Period Spent Nuclear Fuel. Until such payment to the DOE is made, the outstanding liability will continue to accrue interest at the 3-month treasury bill yield rate. Fees due to the DOE for the disposal of Prior Period Spent Nuclear Fuel as of December 31, 2010 and 2009 are included in Long-Term Debt and were $301 million and $300.6 million ($243.8 million and $243.5 million for CL&P and $57.2 million and $57.1 million for WMECO), respectively, including accumulated interest costs of $218.9 million and $218.5 million ($177.3 million and $177 million for CL&P and $41.6 million and $41.5 million for WMECO), respectively. In 2004, WMECO established a trust that holds marketable securities to fund amounts due to the DOE for the disposal of WMECO's Prior Period Spent Nuclear Fuel. For further information on this trust, see Note 5, "Marketable Securities," to the consolidated financial statements. C. Long-Term Contractual Arrangements Estimated Future Annual Costs: The estimated future annual costs of significant long-term contractual arrangements as of December 31, 2010 are as follows: NU (Millions of Dollars) 2011 2012 2013 2014 2015 Thereafter Totals VYNPC $ 30.2 $ 7.6 $ 0.2 $ - $ - $ - $ 38.0Supply/Stranded Cost Contracts/Obligations 243.2 289.3 280.5 265.9 196.4 858.2 2,133.5Renewable Energy Contracts 16.6 87.4 112.0 142.0 147.8 2,044.7 2,550.5Peaker CfDs 27.7 54.0 60.6 63.6 62.9 297.4 566.2Natural Gas Procurement Contracts 61.4 55.5 31.3 29.3 25.3 90.6 293.4Wood, Coal and Transportation Contracts 118.5 116.9 10.1 - - - 245.5PNGTS Pipeline Commitments 3.1 3.1 3.1 3.1 3.1 9.8 25.3Transmission Support Commitments 20.6 20.4 20.3 19.8 20.7 103.4 205.2Yankee Companies Billings 27.4 28.4 28.1 26.8 22.4 - 133.1Select Energy Purchase Agreements 43.0 42.8 48.7 - - - 134.5 Clean Air Project Commitments 49.5 14.0 2.0 - - - 65.5Totals $ 641.2 $ 719.4 $ 596.9 $ 550.5 $ 478.6 $ 3,404.1 $ 6,390.7 CL&P (Millions of Dollars) 2011 2012 2013 2014 2015 Thereafter Totals VYNPC $ 17.9 $ 4.5 $ 0.1 $ - $ - $ - $ 22.5 Supply/Stranded Cost Contracts/Obligations 191.4 238.1 233.0 216.1 159.5 728.2 1,766.3 Renewable Energy Contracts 16.6 87.4 112.0 142.0 147.8 2,044.7 2,550.5 Peaker CfDs 27.7 54.0 60.6 63.6 62.9 297.4 566.2 Transmission Support Commitments 11.8 11.6 11.6 11.3 11.8 59.2 117.3 Yankee Companies Billings 18.8 19.5 19.2 18.5 15.7 - 91.7 Totals $ 284.2 $ 415.1 $ 436.5 $ 451.5 $ 397.7 $ 3,129.5 $ 5,114.5 PSNH (Millions of Dollars) 2011 2012 2013 2014 2015 Thereafter Totals VYNPC $ 7.5 $ 1.9 $ 0.1 $ - $ - $ - $ 9.5 Supply/Stranded Cost Contracts/Obligations 51.8 51.2 47.5 49.8 36.9 130.0 367.2 Wood, Coal and Transportation Contracts 118.5 116.9 10.1 - - - 245.5 PNGTS Pipeline Commitments 3.1 3.1 3.1 3.1 3.1 9.8 25.3 Transmission Support Commitments 6.3 6.4 6.3 6.1 6.4 31.8 63.3 Yankee Companies Billings 3.4 3.6 3.6 3.2 2.3 - 16.1 Clean Air Project Commitments 49.5 14.0 2.0 - - - 65.5 Totals $ 240.1 $ 197.1 $ 72.7 $ 62.2 $ 48.7 $ 171.6 $ 792.4 WMECO (Millions of Dollars) 2011 2012 2013 2014 2015 Thereafter Totals VYNPC $ 4.7 $ 1.2 $ - $ - $ - $ - $ 5.9 Transmission Support Commitments 2.5 2.4 2.4 2.4 2.5 12.4 24.6 Yankee Companies Billings 5.2 5.3 5.3 5.1 4.4 - 25.3 Totals $ 12.4 $ 8.9 $ 7.7 $ 7.5 $ 6.9 $ 12.4 $ 55.8

110
VYNPC: CL&P, PSNH, and WMECO have commitments to buy approximately 9.5 percent, 4 percent, and 2.5 percent (16 percent in the aggregate for NU), respectively, of the Vermont Yankee Nuclear Power Corporation (VYNPC) plant's output through March 2012 at a range of fixed prices. CL&P, PSNH, and WMECO's total cost of purchases under contracts with VYNPC amounted to $16 million, $6.7 million, and $4.2 million, respectively, in 2010, $17.5 million, $7.3 million, and $4.6 million, respectively, in 2009, and $15.7 million, $6.6 million, and $4.2 million, respectively, in 2008 ($26.9 million in 2010, $29.4 million in 2009 and $26.5 million in 2008 in the aggregate for NU). Supply/Stranded Cost Contracts/Obligations: CL&P and PSNH have various IPP contracts or purchase obligations for electricity, including payment obligations resulting from the buydown of electricity purchase contracts. Excluding renewable and CfD contracts, which are discussed below, such contracts extend through 2024 for CL&P. At PSNH such contracts extend through 2023. The total cost of purchases and obligations under these contracts/obligations amounted to $196.2 million, ($151.3 million for CL&P, $42.6 million for PSNH, and $2.3 million for WMECO) in 2010, $205.3 million, ($173.1 million for CL&P, $29.8 million for PSNH, and $2.4 million for WMECO) in 2009, and $237.6 million ($200.5 million for CL&P, $34.6 million for PSNH, and $2.5 million for WMECO) in 2008. In addition, CL&P and UI have entered into four CfDs for a total of approximately 787 MW of capacity with three generation projects being built or modified and one demand response project. The capacity CfDs extend through 2026 and obligate the utilities to pay the difference between a set price and the value that the projects receive in the ISO-NE markets. The contracts have terms of up to 15 years beginning in 2009 and are subject to a sharing agreement with UI, whereby UI will share 20 percent of the costs and benefits of these contracts. CL&P's portion of the costs and benefits of these contracts will be paid by or refunded to CL&P's customers. The information in the table above includes 100 percent of the payments projected as of December 31, 2010 under the contracts entered into by CL&P and 80 percent of the payments projected under the contracts entered into by UI. The amounts of these payments are subject to changes in capacity and forward reserve prices that the projects receive in the ISO-NE capacity markets. On February 7, 2010, an explosion occurred at the construction site of Kleen Energy Systems, LLC's 620 MW generation project with which CL&P has a CfD. This event could delay or change CL&P's estimated payments under the CfD contract. These amounts do not include contractual commitments related to CL&P's standard or last resort service or WMECO's default service, both of which represent contractual commitments that are conditional upon CL&P and WMECO customers' use of energy, and PSNH's short-term power supply management. Renewable Energy Contracts: CL&P has entered into various agreements to purchase energy, capacity and renewable energy credits from renewable energy facilities. Amounts payable under these contracts are subject to a sharing agreement with UI, whereby UI will share approximately 20 percent of the costs and benefits of these contracts. In addition, UI has entered into contracts that are subject to this cost sharing agreement under which CL&P will share in approximately 80 percent of the costs and benefits of the contract. The information in the table above includes 100 percent of the payments projected under the contracts entered into by CL&P and 80 percent of the payments projected under the contracts entered into by UI. CL&P's portion of the costs and benefits of these contracts will be paid by or refunded to CL&P's customers. Peaker CfDs: In 2008, CL&P entered into three CfDs with developers of peaking generation units approved by the DPUC (Peaker CfDs). These units will have a total of approximately 500 MW of peaking capacity. As directed by the DPUC, CL&P and UI have entered into a sharing agreement, whereby CL&P is responsible for 80 percent and UI for 20 percent of the net costs or benefits of these CfDs. The Peaker CfDs pay the developer the difference between capacity, forward reserve and energy market revenues and a cost-of-service payment stream for 30 years. The information in the table above includes 100 percent of the estimated payments projected under the contracts, before reimbursement from UI under the sharing agreement. The ultimate cost or benefit to CL&P under these contracts will depend on the costs of plant construction and operation and the prices that the projects receive for capacity and other products in the ISO-NE markets. CL&P's portion of the amounts paid or received under the Peaker CfDs will be recoverable from or refunded to CL&P's customers. Natural Gas Procurement Contracts: Yankee Gas has entered into long-term contracts for the purchase of natural gas in the normal course of business as part of its portfolio of supplies. These contracts extend through 2022. The total cost of Yankee Gas' procurement portfolio, including these contracts, amounted to $209.5 million in 2010, $236.3 million in 2009 and $352.5 million in 2008. Wood, Coal and Transportation Contracts: PSNH has entered into various arrangements for the purchase of wood, coal and the transportation services for fuel supply for its electric generating assets. PSNH's fuel and natural gas costs, excluding emissions allowances, amounted to approximately $168.3 million in 2010, $156.7 million in 2009 and $165.4 million in 2008. PNGTS Pipeline Commitments: PSNH has a contract for capacity on the Portland Natural Gas Transmission System (PNGTS) pipeline that extends through 2018. The cost under this contract amounted to $2.8 million in 2010, $1.6 million in 2009 and $1.5 million in 2008. These costs are not recovered from PSNH's retail customers. Transmission Support Commitments: Along with other New England utilities, CL&P, PSNH and WMECO entered into agreements in 1985 to support transmission and terminal facilities that were built to import electricity from the Hydro-Québec system in Canada. CL&P, PSNH and WMECO are obligated to pay, over a 30-year period ending in 2020, their proportionate shares of the annual operation and maintenance expenses and capital costs of those facilities. CL&P, PSNH and WMECO's total cost of these agreements amounted to $10.8 million, $5.8 million and $2.3 million, respectively, in 2010, $10.7 million, $5.7 million and $2.2 million, respectively, in 2009, and $10.5 million, $5.6 million and $2.2 million, respectively, in 2008 ($18.9 million in 2010, $18.6 million in 2009 and $18.3 million in 2008 in the aggregate for NU).

111
Yankee Companies Billings: CL&P, PSNH and WMECO have significant decommissioning and plant closure cost obligations to the Yankee Companies, which have each completed the physical decommissioning of their respective nuclear facilities and are now engaged in the long-term storage of their spent fuel. The Yankee Companies collect decommissioning and closure costs through wholesale, FERC-approved rates charged under power purchase agreements with several New England utilities, including CL&P, PSNH and WMECO. These companies in turn recover these costs from their customers through state regulatory commission-approved retail rates. CL&P, PSNH and WMECO's total cost of these billings amounted to $22.7 million, $4.1 million and $6.2 million, respectively, in 2010, $18.2 million, $3.7 million and $5 million, respectively, in 2009, and $20 million, $4.4 million and $5.4 million, respectively, in 2008 ($33 million in 2010, $26.9 million in 2009 and $29.8 million in 2008 in the aggregate for NU). See Note 12D "Commitments and Contingencies - Deferred Contractual Obligations," to the consolidated financial statements for information regarding the collection of the Yankee Companies' decommissioning costs. Clean Air Project Commitments: These amounts represent commitments for engineering, program management services and major component supply and installation associated with PSNH's coal-fired 440 MW Merrimack Station clean air project, which includes the addition of a wet scrubber to reduce mercury and SO2 emissions at Merrimack Station Units 1 and 2. The total cost under these contracts amounted to $129.6 million in 2010, $107.5 million in 2009 and $20.5 million in 2008. Select Energy Purchase Agreements: Select Energy maintains long-term agreements to purchase energy as part of its portfolio of resources to meet its actual or expected sales commitments. Most purchase commitments are recorded at their mark-to-market value with the exception of one nonderivative contract, which is accounted for on the accrual basis. Select Energy's purchase commitment amounts are reported on a net basis in Fuel, Purchased and Net Interchange Power on the accompanying consolidated statements of income along with certain sales contracts and mark-to-market amounts. Accordingly, the amount included in Fuel, Purchased and Net Interchange Power will be less than the amounts included in the table above. Select Energy also maintains certain energy commitments whose mark-to-market values have been recorded on the consolidated balance sheets as Derivative Assets and Liabilities. These contracts are included in the table above. D. Deferred Contractual Obligations CL&P, PSNH and WMECO have decommissioning and plant closure cost obligations to the Yankee Companies, which have each completed the physical decommissioning of their respective nuclear facilities and are now engaged in the long-term storage of their spent fuel. The Yankee Companies collect decommissioning and closure costs through wholesale, FERC-approved rates charged under power purchase agreements with several New England utilities, including CL&P, PSNH and WMECO. These companies in turn recover these costs from their customers through state regulatory commission-approved retail rates. CL&P, PSNH and WMECO's percentage share of the obligations to support the Yankee Companies under FERC-approved rate tariffs is the same as their respective ownership percentages in the Yankee Companies. For further information on the ownership percentages, see Note 1L, "Summary of Significant Accounting Policies - Equity Method Investments," to the consolidated financial statements. The Yankee Companies are currently collecting amounts that management believes are adequate to recover the remaining decommissioning and closure cost estimates for the respective plants. Management believes CL&P and WMECO will recover their shares of these decommissioning and closure obligations from their customers. PSNH has already recovered its share of these costs from its customers. Spent Nuclear Fuel Litigation: In 1998, CYAPC, YAEC and MYAPC filed separate complaints against the DOE in the Court of Federal Claims seeking monetary damages resulting from the DOE's failure to begin accepting spent nuclear fuel for disposal by January 31, 1998 pursuant to the terms of the 1983 spent fuel and high level waste disposal contracts between the Yankee Companies and the DOE. In a ruling released on October 4, 2006, the Court of Federal Claims held that the DOE was liable for damages to CYAPC for $34.2 million through 2001, YAEC for $32.9 million through 2001 and MYAPC for $75.8 million through 2002. In December 2007, the Yankee Companies each filed subsequent lawsuits against the DOE seeking recovery of actual damages incurred in the years following 2001/2002. In December 2006, the DOE appealed the ruling, and the Yankee Companies filed cross-appeals. The Court of Appeals issued its decision on August 7, 2008, effectively agreeing with the trial court's findings as to the liability of the DOE but disagreeing with the method that the trial court used to calculate damages. The Court of Appeals vacated the decision and remanded the case for new findings consistent with its decision. On September 7, 2010, the trial court issued its decision following remand, and judgment on the decision was entered on September 9, 2010. The judgment awarded CYAPC $39.7 million, YAEC $21.2 million and MYAPC $81.7 million. The DOE filed an appeal and the Yankee Companies cross-appealed on November 8, 2010. Briefs will be due absent extensions during the first quarter of 2011. Interest on the judgments does not start to accrue until all appeals have been decided and/or all appeal periods have expired without appeals being filed. The application of any damages, which are ultimately recovered to benefit customers, is established in the Yankee Companies' FERC-approved rate settlement agreements, although implementation will be subject to the final determination of the FERC.
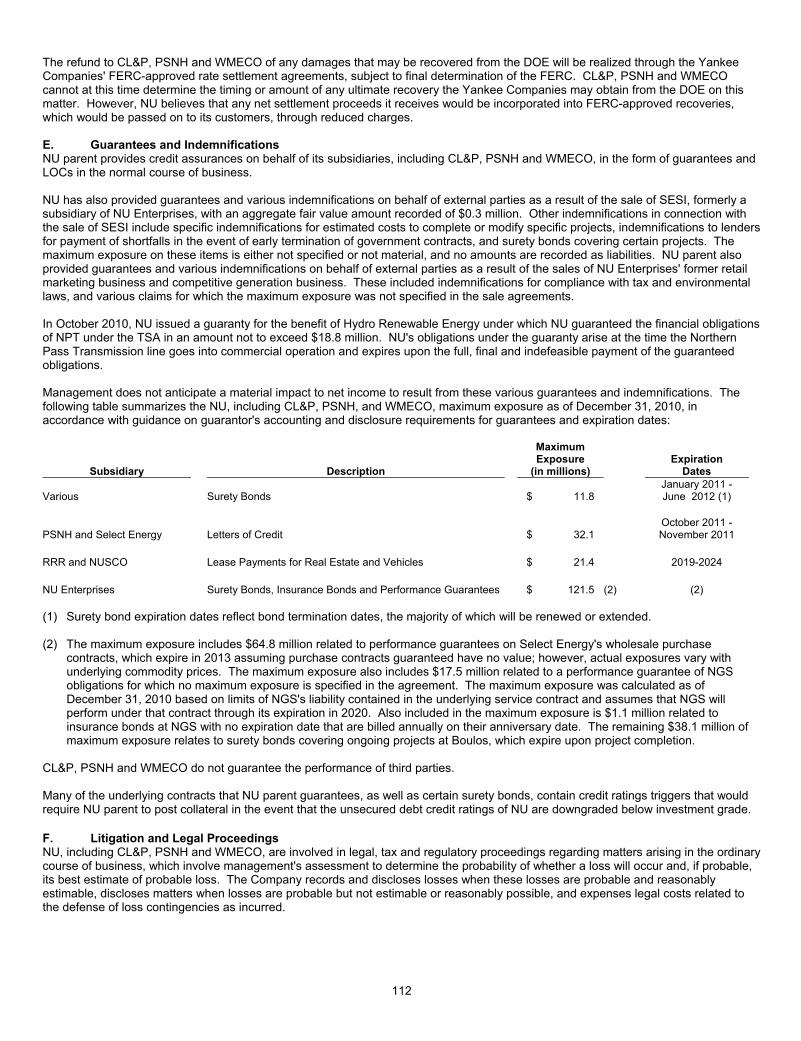
112
The refund to CL&P, PSNH and WMECO of any damages that may be recovered from the DOE will be realized through the Yankee Companies' FERC-approved rate settlement agreements, subject to final determination of the FERC. CL&P, PSNH and WMECO cannot at this time determine the timing or amount of any ultimate recovery the Yankee Companies may obtain from the DOE on this matter. However, NU believes that any net settlement proceeds it receives would be incorporated into FERC-approved recoveries, which would be passed on to its customers, through reduced charges. E. Guarantees and Indemnifications NU parent provides credit assurances on behalf of its subsidiaries, including CL&P, PSNH and WMECO, in the form of guarantees and LOCs in the normal course of business. NU has also provided guarantees and various indemnifications on behalf of external parties as a result of the sale of SESI, formerly a subsidiary of NU Enterprises, with an aggregate fair value amount recorded of $0.3 million. Other indemnifications in connection with the sale of SESI include specific indemnifications for estimated costs to complete or modify specific projects, indemnifications to lenders for payment of shortfalls in the event of early termination of government contracts, and surety bonds covering certain projects. The maximum exposure on these items is either not specified or not material, and no amounts are recorded as liabilities. NU parent also provided guarantees and various indemnifications on behalf of external parties as a result of the sales of NU Enterprises' former retail marketing business and competitive generation business. These included indemnifications for compliance with tax and environmental laws, and various claims for which the maximum exposure was not specified in the sale agreements. In October 2010, NU issued a guaranty for the benefit of Hydro Renewable Energy under which NU guaranteed the financial obligations of NPT under the TSA in an amount not to exceed $18.8 million. NU's obligations under the guaranty arise at the time the Northern Pass Transmission line goes into commercial operation and expires upon the full, final and indefeasible payment of the guaranteed obligations. Management does not anticipate a material impact to net income to result from these various guarantees and indemnifications. The following table summarizes the NU, including CL&P, PSNH, and WMECO, maximum exposure as of December 31, 2010, in accordance with guidance on guarantor's accounting and disclosure requirements for guarantees and expiration dates:
Subsidiary Description
Maximum Exposure
(in millions) Expiration
Dates
Various Surety Bonds $ 11.8 January 2011 - June 2012 (1)
PSNH and Select Energy Letters of Credit $ 32.1 October 2011 - November 2011
RRR and NUSCO Lease Payments for Real Estate and Vehicles $ 21.4 2019-2024 NU Enterprises Surety Bonds, Insurance Bonds and Performance Guarantees $ 121.5 (2) (2) (1) Surety bond expiration dates reflect bond termination dates, the majority of which will be renewed or extended. (2) The maximum exposure includes $64.8 million related to performance guarantees on Select Energy's wholesale purchase
contracts, which expire in 2013 assuming purchase contracts guaranteed have no value; however, actual exposures vary with underlying commodity prices. The maximum exposure also includes $17.5 million related to a performance guarantee of NGS obligations for which no maximum exposure is specified in the agreement. The maximum exposure was calculated as of December 31, 2010 based on limits of NGS's liability contained in the underlying service contract and assumes that NGS will perform under that contract through its expiration in 2020. Also included in the maximum exposure is $1.1 million related to insurance bonds at NGS with no expiration date that are billed annually on their anniversary date. The remaining $38.1 million of maximum exposure relates to surety bonds covering ongoing projects at Boulos, which expire upon project completion.
CL&P, PSNH and WMECO do not guarantee the performance of third parties. Many of the underlying contracts that NU parent guarantees, as well as certain surety bonds, contain credit ratings triggers that would require NU parent to post collateral in the event that the unsecured debt credit ratings of NU are downgraded below investment grade. F. Litigation and Legal Proceedings NU, including CL&P, PSNH and WMECO, are involved in legal, tax and regulatory proceedings regarding matters arising in the ordinary course of business, which involve management's assessment to determine the probability of whether a loss will occur and, if probable, its best estimate of probable loss. The Company records and discloses losses when these losses are probable and reasonably estimable, discloses matters when losses are probable but not estimable or reasonably possible, and expenses legal costs related to the defense of loss contingencies as incurred.

113
13. LEASES Various NU subsidiaries, including CL&P, PSNH and WMECO, have entered into lease agreements, some of which are capital leases, for the use of data processing and office equipment, vehicles, and office space. In addition, CL&P, PSNH and WMECO incur costs associated with leases entered into by NUSCO and RRR. These costs are included below in CL&P, PSNH and WMECO's operating lease payments charged to expense and amounts capitalized as well as future operating lease payments from 2011 through 2015 and thereafter. These amounts are eliminated on an NU consolidated basis. The provisions of these lease agreements generally contain renewal options. Certain lease agreements contain contingent lease payments. The contingent lease payments are based on various factors, such as the commercial paper rate plus a credit spread or the consumer price index. For the years ended December 31, 2010, 2009, and 2008, rental payments made on capital leases, interest included in capital lease payments, and capital lease asset amortization were as follows: (Millions of Rental Payments Interest Asset Amortization Dollars) NU CL&P PSNH NU CL&P PSNH NU CL&P PSNH 2010 $ 2.5 $ 1.9 $ 0.5 $ 1.8 $ 1.5 $ 0.3 $ 0.7 $ 0.4 $ 0.2 2009 2.6 1.9 0.5 1.9 1.6 0.3 0.6 0.3 0.2 2008 2.5 2.1 0.4 1.8 1.7 0.1 0.7 0.4 0.3 There was a de minimis amount of capital leases held by WMECO in 2010, 2009, and 2008. For the years ended December 31, 2010, 2009 and 2008, operating lease rental payments charged to expense and the capitalized portion of operating lease payments were as follows:
Expensed Capitalized (Millions of Dollars) NU CL&P PSNH WMECO NU CL&P PSNH WMECO2010 $ 11.9 $ 10.0 $ 2.2 $ 2.6 $ 4.8 $ 3.8 $ 0.1 $ 0.1 2009 18.1 12.8 3.9 3.4 9.7 6.1 1.5 1.1 2008 19.1 12.7 4.1 3.8 10.8 6.8 1.8 1.3 Future minimum rental payments excluding executory costs, such as property taxes, state use taxes, insurance, and maintenance, under long-term noncancelable leases, as of December 31, 2010 are as follows: Capital Leases (Millions of Dollars) NU CL&P PSNH 2011 $ 2.5 $ 1.9 $ 0.5 2012 2.6 2.0 0.5 2013 2.4 2.0 0.4 2014 2.0 1.8 0.2 2015 2.0 1.8 0.2 Thereafter 11.4 11.3 0.1 Future minimum lease payments 22.9 20.8 1.9 Less amount representing interest 10.7 10.2 0.5 Present value of future minimum lease payments $ 12.2 $ 10.6 $ 1.4 Operating Leases (Millions of Dollars) NU CL&P PSNH WMECO 2011 $ 7.9 $ 7.2 $ 2.0 $ 3.0 2012 7.0 6.8 1.8 2.9 2013 6.8 6.7 1.7 2.8 2014 4.9 6.5 1.7 1.3 2015 4.5 6.5 1.7 0.9 Thereafter 19.1 23.0 5.3 2.6 Future minimum lease payments $ 50.2 $ 56.7 $ 14.2 $ 13.5 In November 2008, the lessor of CL&P, PSNH, WMECO and Yankee Gas' vehicle/equipment master lease agreements notified the companies that it was electing to terminate the lease agreements as permitted under the termination clause of the agreements. The remaining payments under the agreements were made in 2009 for PSNH and WMECO and January 2011 for CL&P and Yankee Gas. CL&P entered into certain contracts for the purchase of energy that qualify as leases. These contracts do not have minimum lease payments and therefore are not included in the tables above. See Note 12C, "Commitments and Contingencies - Long-Term Contractual Arrangements," to the consolidated financial statements for further information regarding these contracts.
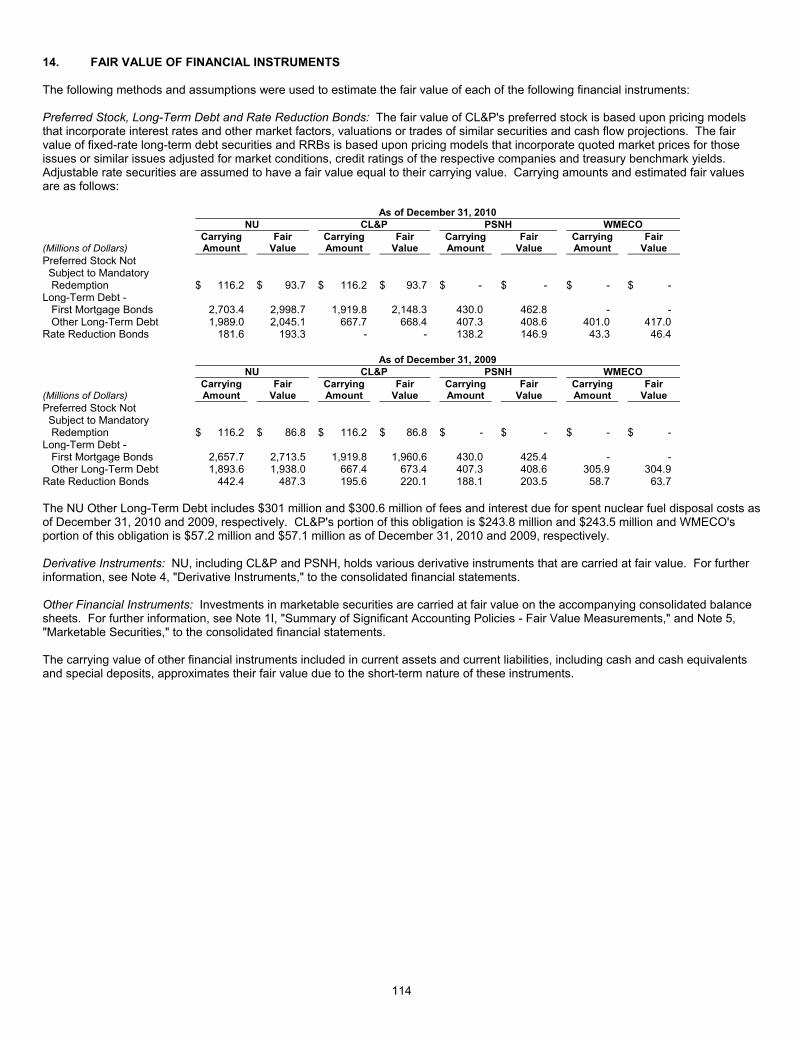
114
14. FAIR VALUE OF FINANCIAL INSTRUMENTS The following methods and assumptions were used to estimate the fair value of each of the following financial instruments: Preferred Stock, Long-Term Debt and Rate Reduction Bonds: The fair value of CL&P's preferred stock is based upon pricing models that incorporate interest rates and other market factors, valuations or trades of similar securities and cash flow projections. The fair value of fixed-rate long-term debt securities and RRBs is based upon pricing models that incorporate quoted market prices for those issues or similar issues adjusted for market conditions, credit ratings of the respective companies and treasury benchmark yields. Adjustable rate securities are assumed to have a fair value equal to their carrying value. Carrying amounts and estimated fair values are as follows: As of December 31, 2010 NU CL&P PSNH WMECO
(Millions of Dollars) Carrying Amount
Fair Value
CarryingAmount
FairValue
CarryingAmount
FairValue
Carrying Amount
FairValue
Preferred Stock Not Subject to Mandatory Redemption $ 116.2 $ 93.7 $ 116.2 $ 93.7 $ - $ - $ - $ - Long-Term Debt - First Mortgage Bonds 2,703.4 2,998.7 1,919.8 2,148.3 430.0 462.8 - - Other Long-Term Debt 1,989.0 2,045.1 667.7 668.4 407.3 408.6 401.0 417.0 Rate Reduction Bonds 181.6 193.3 - - 138.2 146.9 43.3 46.4 As of December 31, 2009 NU CL&P PSNH WMECO
(Millions of Dollars) Carrying Amount
Fair Value
CarryingAmount
FairValue
CarryingAmount
FairValue
Carrying Amount
FairValue
Preferred Stock Not Subject to Mandatory Redemption $ 116.2 $ 86.8 $ 116.2 $ 86.8 $ - $ - $ - $ - Long-Term Debt - First Mortgage Bonds 2,657.7 2,713.5 1,919.8 1,960.6 430.0 425.4 - - Other Long-Term Debt 1,893.6 1,938.0 667.4 673.4 407.3 408.6 305.9 304.9 Rate Reduction Bonds 442.4 487.3 195.6 220.1 188.1 203.5 58.7 63.7 The NU Other Long-Term Debt includes $301 million and $300.6 million of fees and interest due for spent nuclear fuel disposal costs as of December 31, 2010 and 2009, respectively. CL&P's portion of this obligation is $243.8 million and $243.5 million and WMECO's portion of this obligation is $57.2 million and $57.1 million as of December 31, 2010 and 2009, respectively. Derivative Instruments: NU, including CL&P and PSNH, holds various derivative instruments that are carried at fair value. For further information, see Note 4, "Derivative Instruments," to the consolidated financial statements. Other Financial Instruments: Investments in marketable securities are carried at fair value on the accompanying consolidated balance sheets. For further information, see Note 1I, "Summary of Significant Accounting Policies - Fair Value Measurements," and Note 5, "Marketable Securities," to the consolidated financial statements. The carrying value of other financial instruments included in current assets and current liabilities, including cash and cash equivalents and special deposits, approximates their fair value due to the short-term nature of these instruments.

115
15. PREFERRED STOCK NOT SUBJECT TO MANDATORY REDEMPTION (CL&P) CL&P's charter authorizes it to issue up to 9 million shares of preferred stock ($50 par value per share) of which 2,324,000 shares were outstanding as of December 31, 2010 and 2009. In addition, CL&P's charter authorizes it to issue up to 8 million shares of Class A preferred stock ($25 par value per share). There were no Class A preferred shares outstanding as of December 31, 2010 and 2009. The issuance of additional preferred shares would be subject to approval by the DPUC. Preferred stockholders have liquidation rights equal to the par value for each class, which they would receive in preference to any distributions to any junior stock. Were there to be a shortfall, all preferred stockholders would share ratably in available liquidation assets. Details of preferred stock not subject to mandatory redemption are as follows (in millions except in redemption price and shares):
Description December 31, 2010 Redemption Price
Shares Outstanding as of December 31, 2010 and 2009
As of December 31, 2010 2009
$1.90 Series of 1947 $ 52.50 163,912 $ 8.2 $ 8.2 $2.00 Series of 1947 $ 54.00 336,088 16.8 16.8 $2.04 Series of 1949 $ 52.00 100,000 5.0 5.0 $2.20 Series of 1949 $ 52.50 200,000 10.0 10.0 3.90% Series of 1949 $ 50.50 160,000 8.0 8.0 $2.06 Series E of 1954 $ 51.00 200,000 10.0 10.0 $2.09 Series F of 1955 $ 51.00 100,000 5.0 5.0 4.50% Series of 1956 $ 50.75 104,000 5.2 5.2 4.96% Series of 1958 $ 50.50 100,000 5.0 5.0 4.50% Series of 1963 $ 50.50 160,000 8.0 8.0 5.28% Series of 1967 $ 51.43 200,000 10.0 10.0 $3.24 Series G of 1968 $ 51.84 300,000 15.0 15.0 6.56% Series of 1968 $ 51.44 200,000 10.0 10.0 Totals 2,324,000 $ 116.2 $ 116.2 Dividends totaling $6.1 million for 2010 and $5.6 million for 2009 and 2008 were declared and dividends of $5.6 million were paid to the preferred stockholders in 2010, 2009 and 2008. 16. ACCUMULATED OTHER COMPREHENSIVE INCOME/(LOSS) The accumulated balance for each component of other comprehensive income/(loss), net of tax, is as follows: (Millions of Dollars) NU
December 31, 2008
2009 Change
December 31, 2009
2010 Change
December 31,2010
Qualified Cash Flow Hedging Instruments $ (4.6) $ 0.2 $ (4.4) $ 0.2 $ (4.2) Unrealized Gains/(Losses) on Other Securities 1.2 (1.0) 0.2 0.4 0.6 Pension, SERP and PBOP Benefits (33.9) (5.4) (39.3) (0.5) (39.8) Accumulated Other Comprehensive Income/(Loss) $ (37.3) $ (6.2) $ (43.5) $ 0.1 $ (43.4) CL&P Qualified Cash Flow Hedging Instruments $ (3.6) $ 0.4 $ (3.2) $ 0.5 $ (2.7) Unrealized Gains/(Losses) on Other Securities - - - - - Accumulated Other Comprehensive Income/(Loss) $ (3.6) $ 0.4 $ (3.2) $ 0.5 $ (2.7) PSNH Qualified Cash Flow Hedging Instruments $ (0.8) $ 0.1 $ (0.7) $ 0.1 $ (0.6) Unrealized Gains/(Losses) on Other Securities 0.1 (0.1) - - - Accumulated Other Comprehensive Income/(Loss) $ (0.7) $ - $ (0.7) $ 0.1 $ (0.6) WMECO Qualified Cash Flow Hedging Instruments $ 0.1 $ (0.1) $ - $ (0.1) $ (0.1) Unrealized Gains/(Losses) on Other Securities 0.1 (0.1) - - - Accumulated Other Comprehensive Income/(Loss) $ 0.2 $ (0.2) $ - $ (0.1) $ (0.1) Qualified cash flow hedging items impacting Net Income in the tables above represent amounts that were reclassified from Accumulated Other Comprehensive Income/(Loss) into Net Income in connection with the consummation of interest rate swap agreements and the amortization of existing interest rate hedges.

116
The changes in the components of other comprehensive income/(loss) are reported net of the following income tax effects: (Millions of Dollars) NU 2010 2009 2008 Qualified Cash Flow Hedging Instruments $ (0.2) $ (0.2) $ 4.5 Change in Unrealized Gains/(Losses) on Other Securities (0.2) 0.7 1.1 Pension, SERP and PBOP Benefits - 2.9 24.2 Total $ (0.4) $ 3.4 $ 29.8 CL&P Qualified Cash Flow Hedging Instruments $ (0.3) $ (0.3) $ 2.2 PSNH Qualified Cash Flow Hedging Instruments $ (0.1) $ - $ 1.0 WMECO Qualified Cash Flow Hedging Instruments $ - $ 0.1 $ 0.1 It is estimated that a charge of $0.2 million will be reclassified from Accumulated Other Comprehensive Income/(Loss) as a decrease to earnings over the next 12 months as a result of amortization of the interest rate swap agreements, which have been settled. Included in this amount are estimated charges of $0.4 million and $0.1 million for CL&P and PSNH, respectively, and a benefit of $0.1 million for WMECO. As of December 31, 2010, it is estimated that a pre-tax amount of $6 million included in the Accumulated Other Comprehensive Income/(Loss) balance will be reclassified as a decrease to Net Income over the next 12 months related to Pension, SERP and PBOP adjustments for NU. 17. DIVIDEND RESTRICTIONS NU parent's ability to pay dividends may be affected by certain state statutes, the ability of its subsidiaries to pay common dividends and the leverage restriction tied to its consolidated total debt to total capitalization ratio requirement in its revolving credit agreement. CL&P, PSNH, and WMECO are subject to Section 305 of the Federal Power Act that makes it unlawful for a public utility to make or pay a dividend from any funds "properly included in its capital account." Management believes that this Federal Power Act restriction, as applied to CL&P, PSNH and WMECO, would not be construed or applied by the FERC to prohibit the payment of dividends for lawful and legitimate business purposes from retained earnings. In addition, certain state statutes may impose additional limitations on such companies and on Yankee Gas. Such state law restrictions do not restrict payment of dividends from retained earnings or net income. CL&P, PSNH, WMECO and Yankee Gas also have a revolving credit agreement that imposes leverage restrictions including consolidated total debt to total capitalization ratio requirements. The Retained Earnings balances subject to these leverage restrictions are $1.453 billion for NU, $734.6 million for CL&P, $347.5 million for PSNH and $98.8 million for WMECO as of December 31, 2010. PSNH is further required to reserve an additional amount under its FERC hydroelectric license conditions. As of December 31, 2010, approximately $11.6 million of PSNH's Retained Earnings is subject to restriction under its FERC hydroelectric license conditions. As of December 31, 2010, NU, CL&P, PSNH, WMECO and Yankee Gas were in compliance with all such provisions of its credit agreement that may restrict the payment of dividends. 18. COMMON SHARES The following table sets forth the NU common shares and the shares of CL&P, PSNH and WMECO common stock authorized and issued and the respective par values as of December 31, 2010 and 2009: Shares Per Share Authorized Issued Par Value 2010 and 2009 2010 2009 NU $ 5 225,000,000 195,781,740 195,455,214 CL&P $ 10 24,500,000 6,035,205 6,035,205 PSNH $ 1 100,000,000 301 301 WMECO $ 25 1,072,471 434,653 434,653 On March 20, 2009, NU issued approximately 19 million common shares. As of December 31, 2010 and 2009, 19,333,659 and 19,708,136 NU common shares were held as treasury shares, respectively.

117
19. COMMON SHAREHOLDERS' EQUITY AND NONCONTROLLING INTERESTS (NU) A summary of the changes in Common Shareholders' Equity and Noncontrolling Interests of NU is as follows: For the Years Ended December 31, 2010 2009 2008
(Millions of Dollars)
Common Shareholders'
Equity Noncontrolling
Interest Total
Equity
Preferred StockNot Subject to
Mandatory Redemption
Total Equity
Preferred Stock Not Subject to
Mandatory Redemption
Total Equity
Preferred StockNot Subject to
Mandatory Redemption
Balance as of Beginning of Year $ 3,577.9 $ - $ 3,577.9 $ 116.2 $ 3,020.3 $ 116.2 $ 2,913.8 $ 116.2 Net Income 394.1 - 394.1 - 335.6 - 266.4 - Dividends on Common Shares (181.7) - (181.7) - (162.8) - (129.0) - Dividends on Preferred Stock (6.1) - (6.1) (6.1) (5.6) (5.6) (5.6) (5.6) Issuance of Common Shares 7.4 - 7.4 - 389.7 - 5.5 - Capital Stock Expenses, Net (0.3) - (0.3) - (12.5) - 0.1 - Contributions to NPT - 1.4 1.4 - - - - - Other Transactions, Net 19.9 - 19.9 - 18.7 - 15.7 - Net Income Attributable to Noncontrolling Interests (0.1) 0.1 - 6.1 - 5.6 - 5.6 Other Comprehensive Income/(Loss) (Note 16) 0.1 - 0.1 - (5.5) - (46.6) - Balance as of End of Year $ 3,811.2 $ 1.5 $ 3,812.7 $ 116.2 $ 3,577.9 $ 116.2 $ 3,020.3 $ 116.2 20. EARNINGS PER SHARE (NU) EPS is computed based upon the monthly weighted average number of common shares outstanding, excluding unallocated ESOP shares, during each year. Diluted EPS is computed on the basis of the monthly weighted average number of common shares outstanding plus the potential dilutive effect if certain securities are converted into common stock. The computation of diluted EPS excludes the effect of the potential exercise of share awards when the average market price of the common shares is lower than the exercise price of the related awards during the period. These outstanding share awards are not included in the computation of diluted EPS because the effect would have been antidilutive. In 2010 and 2009, there were 1,578 and 17,637 share awards excluded from the computation, respectively, as these awards were antidilutive. In 2008, there were no antidilutive share awards outstanding. The following table sets forth the components of basic and diluted EPS: (Millions of Dollars, except share information) 2010 2009 2008 Net Income Attributable to Controlling Interests $ 387.9 $ 330.0 $ 260.8 Weighted Average Common Shares Outstanding: Basic 176,636,086 172,567,928 155,531,846 Dilutive Effect 249,301 149,318 467,394 Diluted 176,885,387 172,717,246 155,999,240 Basic EPS $ 2.20 $ 1.91 $ 1.68 Diluted EPS $ 2.19 $ 1.91 $ 1.67 RSUs and performance shares are included in basic common shares outstanding as of the date that all necessary vesting conditions have been satisfied. The dilutive effect of outstanding RSUs and performance shares for which common shares have not been issued is calculated using the treasury stock method. Assumed proceeds of the units under the treasury stock method consist of the remaining compensation cost to be recognized and a theoretical tax benefit. The theoretical tax benefit is calculated as the tax impact of the intrinsic value of the units (the difference between the market value of the average units outstanding for the year, using the average market price during the year, and the grant date market value). The dilutive effect of stock options is also calculated using the treasury stock method. Assumed proceeds for stock options consist of remaining compensation cost to be recognized, cash proceeds that would be received upon exercise, and a theoretical tax benefit. The theoretical tax benefit is calculated as the tax impact of the intrinsic value of the stock options (the difference between the market value of the average stock options outstanding for the year, using the average market price during the year, and the grant price). Allocated ESOP shares are included in basic common shares outstanding in the above table. 21. SEGMENT INFORMATION Presentation: NU is organized between the Regulated companies' segments, NU Enterprises and Other based on a combination of factors, including the characteristics of each business' products and services, the sources of operating revenues and expenses and the regulatory environment in which each segment operates. Cash flows for total investments in plant included in the segment information below are cash capital expenditures that do not include amounts incurred but not paid, cost of removal, AFUDC related to equity funds, and the capitalized portions of pension and PBOP expense or income. The Regulated companies' segments include the electric distribution segment, the natural gas distribution segment and the electric transmission segment. The electric distribution segment includes the generation activities of PSNH and WMECO. The Regulated companies' segments represented substantially all of NU's total consolidated revenues for each of the years ended December 31, 2010, 2009 and 2008.

118
NU Enterprises is comprised of the following: 1) Select Energy (wholesale contracts), 2) Boulos, 3) NGS, 4) NGS Mechanical, 5) SECI, and 6) NU Enterprises parent. Other in the tables below primarily consists of 1) the results of NU parent, which includes other income related to the equity in earnings of NU parent's subsidiaries and interest income from the NU Money Pool, which are both eliminated in consolidation, and interest income and expense related to the cash and debt of NU parent, respectively, 2) the revenues and expenses of NU's service companies, most of which are eliminated in consolidation, and 3) the results of other subsidiaries, which are comprised of RRR (a real estate subsidiary), the non-energy-related subsidiaries of Yankee (Yankee Energy Services Company and Yankee Energy Financial Services Company) and the remaining operations of HWP that were not exited as part of the sale of the competitive generation business in 2006 and the sale of its transmission business to WMECO in December 2008. Regulated companies' revenues from the sale of electricity and natural gas primarily are derived from residential, commercial and industrial customers and are not dependent on any single customer. NU's segment information for the years ended December 31, 2010, 2009 and 2008, with the distribution segment segregated between electric and natural gas, is as follows (some amounts may not agree between the financial statements and the segment schedules due to rounding): For the Year Ended December 31, 2010 Regulated Companies Distribution
(Millions of Dollars) Electric Natural
Gas Transmission NU
Enterprises Other
Eliminations
Total Operating Revenues $ 3,802.0 $ 434.3 $ 625.6 $ 80.3 $ 441.3 $ (485.3) $ 4,898.2 Depreciation and Amortization (506.7) (23.8) (86.7) (0.3) (15.5) 3.8 (629.2) Other Operating Expenses (2,919.6) (340.0) (192.1) (62.6) (442.8) 488.0 (3,469.1) Operating Income/(Loss) 375.7 70.5 346.8 17.4 (17.0) 6.5 799.9 Interest Expense (133.4) (17.9) (73.2) (2.2) (15.2) 4.6 (237.3) Interest Income 0.7 - 1.8 - 5.3 (6.3) 1.5 Other Income, Net 24.4 0.8 14.3 (0.3) 436.7 (435.5) 40.4 Income Tax (Expense)/Benefit (90.3) (20.7) (109.3) (6.6) 17.6 (1.1) (210.4) Net Income 177.1 32.7 180.4 8.3 427.4 (431.8) 394.1 Net Income Attributable to Noncontrolling Interests (3.6) - (2.6) - - - (6.2) Net Income Attributable to Controlling Interests $ 173.5 $ 32.7 $ 177.8 $ 8.3 $ 427.4
$ (431.8) $ 387.9
Total Assets (as of) $ 8,968.9 $ 1,451.5 $ 3,418.3 $ 86.7 $ 6,197.9 $ (5,601.3) $ 14,522.0 Cash Flows for Total Investments in Plant $ 560.1 $ 82.5 $ 239.2 $ - $ 72.7
$ - $ 954.5
For the Year Ended December 31, 2009 Regulated Companies Distribution
(Millions of Dollars) Electric Natural
Gas Transmission NU
Enterprises Other Eliminations Total Operating Revenues $ 4,358.4 $ 449.6 $ 577.9 $ 81.3 $ 400.8 $ (428.6) $ 5,439.4 Depreciation and Amortization (431.5) (26.8) (71.0) (0.4) (13.0) 1.9 (540.8) Other Operating Expenses (3,604.6) (368.1) (170.9) (53.8) (382.1) 432.3 (4,147.2) Operating Income 322.3 54.7 336.0 27.1 5.7 5.6 751.4 Interest Expense (149.1) (22.1) (72.5) (2.8) (33.4) 6.3 (273.6) Interest Income 4.5 - 1.0 - 7.7 (7.6) 5.6 Other Income, Net 24.0 0.3 7.6 - 371.6 (371.4) 32.1 Income Tax (Expense)/Benefit (60.2) (11.9) (105.5) (8.5) 8.6 (2.4) (179.9) Net Income 141.5 21.0 166.6 15.8 360.2 (369.5) 335.6 Net Income Attributable to Noncontrolling Interests (3.3) - (2.3) - - - (5.6) Net Income Attributable to Controlling Interests $ 138.2 $ 21.0 $ 164.3 $ 15.8 $ 360.2 $ (369.5) $ 330.0 Total Assets (as of) $ 8,881.1 $ 1,379.0 $ 3,263.0 $ 71.9 $ 5,857.8 $ (5,395.1) $ 14,057.7 Cash Flows for Total Investments in Plant $ 521.5 $ 54.8 $ 286.0 $ - $ - $ 45.8 $ 908.1

119
For the Year Ended December 31, 2008 Regulated Companies Distribution
(Millions of Dollars) Electric Natural
Gas Transmission NU
Enterprises Other Eliminations Total Operating Revenues $ 4,716.1 $ 577.4 $ 424.8 $ 114.1 $ 416.6 $ (448.9) $ 5,800.1 Depreciation and Amortization (581.5) (26.2) (49.3) (0.6) (13.1) 0.9 (669.8) Other Operating Expenses (3,828.6) (487.3) (138.5) (89.6) (431.2) 435.7 (4,539.5) Operating Income/(Loss) 306.0 63.9 237.0 23.9 (27.7) (12.3) 590.8 Interest Expense (164.3) (21.6) (51.8) (5.6) (35.4) 9.6 (269.1) Interest Income 14.1 0.5 2.1 1.0 8.5 (10.6) 15.6 Other Income, Net 13.1 0.3 21.8 - 227.5 (227.9) 34.8 Income Tax (Expense)/Benefit (41.6) (16.0) (68.8) (6.2) 28.7 (1.8) (105.7) Net Income 127.3 27.1 140.3 13.1 201.6 (243.0) 266.4 Net Income Attributable to Noncontrolling Interests (3.6) - (2.0) - - - (5.6) Net Income Attributable to Controlling Interests $ 123.7 $ 27.1 $ 138.3 $ 13.1 $ 201.6 $ (243.0) $ 260.8 Cash Flows for Total Investments in Plant $ 487.8 $ 58.4 $ 678.9 $ - $ 30.3 $ - $ 1,255.4 The information related to the distribution and transmission segments for CL&P, PSNH and WMECO for the years ended December 31, 2010, 2009 and 2008 is included below. Information for segmenting total assets between electric distribution and transmission is not available as of December 31, 2008. CL&P - For the Years Ended December 31, 2010 2009 2008 (Millions of Dollars) Distribution Transmission Totals Distribution Transmission Totals Distribution Transmission Totals Operating Revenues $ 2,500.3 $ 498.8 $ 2,999.1 $ 2,954.6 $ 469.9 $ 3,424.5 $ 3,218.5 $ 339.9 $ 3,558.4 Depreciation and Amortization (355.5) (67.6) (423.1) (330.3) (58.4) (388.7) (433.1) (39.4) (472.5)Other Operating Expenses (1,942.4) (146.0) (2,088.4) (2,441.7) (129.0) (2,570.7) (2,610.5) (102.0) (2,712.5)Operating Income 202.4 285.2 487.6 182.6 282.5 465.1 174.9 198.5 373.4 Interest Expense (77.6) (60.1) (137.7) (93.1) (62.7) (155.8) (102.1) (44.1) (146.2)Interest Income 1.9 1.5 3.4 2.7 0.8 3.5 9.2 1.6 10.8 Other Income, Net 14.6 8.6 23.2 16.2 6.1 22.3 12.4 18.7 31.1 Income Tax Expense (43.6) (88.8) (132.4) (31.1) (87.7) (118.8) (20.8) (57.1) (77.9)Net Income $ 97.7 $ 146.4 $ 244.1 $ 77.3 $ 139.0 $ 216.3 $ 73.6 $ 117.6 $ 191.2 Total Assets (as of) $ 5,687.9 $ 2,599.7 $ 8,287.6 $ 5,771.1 $ 2,593.5 $ 8,364.6 $ - $ - $ - Cash Flows for Total Investments in Plant $ 270.2 $ 110.1 $ 380.3 $ 270.8 $ 164.9 $ 435.7 $ 294.3 $ 555.2 $ 849.5 PSNH - For the Years Ended December 31, 2010 2009 2008 (Millions of Dollars) Distribution Transmission Totals Distribution Transmission Totals Distribution Transmission Totals Operating Revenues $ 951.0 $ 82.4 $ 1,033.4 $ 1,035.8 $ 73.8 $ 1,109.6 $ 1,082.2 $ 59.0 $ 1,141.2 Depreciation and Amortization (118.4) (10.4) (128.8) (70.5) (9.3) (79.8) (104.0) (7.2) (111.2)Other Operating Expenses (696.0) (32.4) (728.4) (865.8) (29.4) (895.2) (882.8) (24.3) (907.1)Operating Income 136.6 39.6 176.2 99.5 35.1 134.6 95.4 27.5 122.9 Interest Expense (38.6) (8.5) (47.1) (39.8) (6.7) (46.5) (44.6) (5.6) (50.2)Interest Income/(Loss) (1.7) 0.2 (1.5) 2.1 0.1 2.2 2.9 0.5 3.4 Other Income, Net 11.6 1.7 13.3 6.0 1.3 7.3 1.4 2.6 4.0 Income Tax Expense (38.6) (12.2) (50.8) (20.2) (11.8) (32.0) (13.7) (8.3) (22.0)Net Income $ 69.3 $ 20.8 $ 90.1 $ 47.6 $ 18.0 $ 65.6 $ 41.4 $ 16.7 $ 58.1 Total Assets (as of) $ 2,399.3 $ 490.5 $ 2,889.8 $ 2,255.0 $ 442.2 $ 2,697.2 $ - $ - $ - Cash Flows for Total Investments in Plant $ 252.2 $ 44.1 $ 296.3 $ 207.8 $ 58.6 $ 266.4 $ 158.6 $ 80.3 $ 238.9
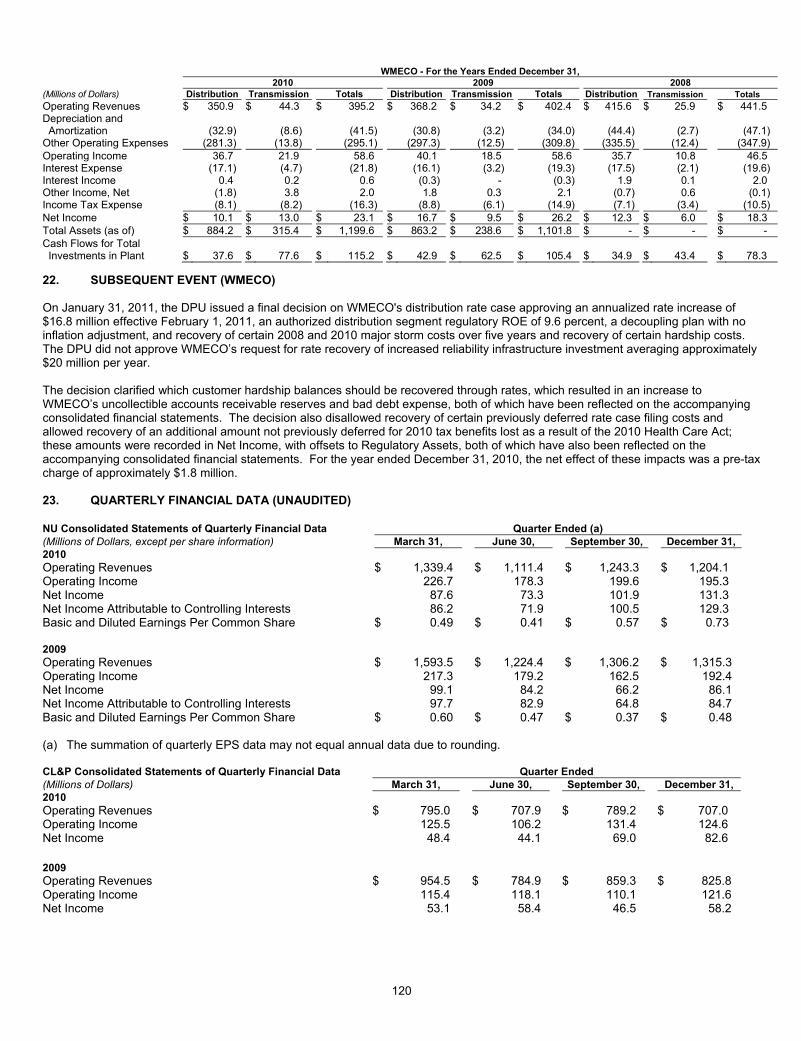
120
WMECO - For the Years Ended December 31, 2010 2009 2008 (Millions of Dollars) Distribution Transmission Totals Distribution Transmission Totals Distribution Transmission Totals Operating Revenues $ 350.9 $ 44.3 $ 395.2 $ 368.2 $ 34.2 $ 402.4 $ 415.6 $ 25.9 $ 441.5 Depreciation and Amortization (32.9) (8.6) (41.5) (30.8) (3.2) (34.0) (44.4) (2.7) (47.1) Other Operating Expenses (281.3) (13.8) (295.1) (297.3) (12.5) (309.8) (335.5) (12.4) (347.9) Operating Income 36.7 21.9 58.6 40.1 18.5 58.6 35.7 10.8 46.5 Interest Expense (17.1) (4.7) (21.8) (16.1) (3.2) (19.3) (17.5) (2.1) (19.6) Interest Income 0.4 0.2 0.6 (0.3) - (0.3) 1.9 0.1 2.0 Other Income, Net (1.8) 3.8 2.0 1.8 0.3 2.1 (0.7) 0.6 (0.1) Income Tax Expense (8.1) (8.2) (16.3) (8.8) (6.1) (14.9) (7.1) (3.4) (10.5) Net Income $ 10.1 $ 13.0 $ 23.1 $ 16.7 $ 9.5 $ 26.2 $ 12.3 $ 6.0 $ 18.3 Total Assets (as of) $ 884.2 $ 315.4 $ 1,199.6 $ 863.2 $ 238.6 $ 1,101.8 $ - $ - $ - Cash Flows for Total Investments in Plant $ 37.6 $ 77.6 $ 115.2 $ 42.9 $ 62.5 $ 105.4 $ 34.9 $ 43.4 $ 78.3 22. SUBSEQUENT EVENT (WMECO) On January 31, 2011, the DPU issued a final decision on WMECO's distribution rate case approving an annualized rate increase of $16.8 million effective February 1, 2011, an authorized distribution segment regulatory ROE of 9.6 percent, a decoupling plan with no inflation adjustment, and recovery of certain 2008 and 2010 major storm costs over five years and recovery of certain hardship costs. The DPU did not approve WMECO’s request for rate recovery of increased reliability infrastructure investment averaging approximately $20 million per year. The decision clarified which customer hardship balances should be recovered through rates, which resulted in an increase to WMECO’s uncollectible accounts receivable reserves and bad debt expense, both of which have been reflected on the accompanying consolidated financial statements. The decision also disallowed recovery of certain previously deferred rate case filing costs and allowed recovery of an additional amount not previously deferred for 2010 tax benefits lost as a result of the 2010 Health Care Act; these amounts were recorded in Net Income, with offsets to Regulatory Assets, both of which have also been reflected on the accompanying consolidated financial statements. For the year ended December 31, 2010, the net effect of these impacts was a pre-tax charge of approximately $1.8 million. 23. QUARTERLY FINANCIAL DATA (UNAUDITED) NU Consolidated Statements of Quarterly Financial Data Quarter Ended (a) (Millions of Dollars, except per share information) March 31, June 30, September 30, December 31,2010 Operating Revenues $ 1,339.4 $ 1,111.4 $ 1,243.3 $ 1,204.1 Operating Income 226.7 178.3 199.6 195.3 Net Income 87.6 73.3 101.9 131.3 Net Income Attributable to Controlling Interests 86.2 71.9 100.5 129.3 Basic and Diluted Earnings Per Common Share $ 0.49 $ 0.41 $ 0.57 $ 0.73 2009 Operating Revenues $ 1,593.5 $ 1,224.4 $ 1,306.2 $ 1,315.3 Operating Income 217.3 179.2 162.5 192.4 Net Income 99.1 84.2 66.2 86.1 Net Income Attributable to Controlling Interests 97.7 82.9 64.8 84.7 Basic and Diluted Earnings Per Common Share $ 0.60 $ 0.47 $ 0.37 $ 0.48 (a) The summation of quarterly EPS data may not equal annual data due to rounding. CL&P Consolidated Statements of Quarterly Financial Data Quarter Ended (Millions of Dollars) March 31, June 30, September 30, December 31, 2010 Operating Revenues $ 795.0 $ 707.9 $ 789.2 $ 707.0 Operating Income 125.5 106.2 131.4 124.6 Net Income 48.4 44.1 69.0 82.6 2009 Operating Revenues $ 954.5 $ 784.9 $ 859.3 $ 825.8 Operating Income 115.4 118.1 110.1 121.6 Net Income 53.1 58.4 46.5 58.2

121
PSNH Consolidated Statements of Quarterly Financial Data Quarter Ended (Millions of Dollars) March 31, June 30, September 30, December 31, 2010 Operating Revenues $ 258.6 $ 238.3 $ 277.0 $ 259.5 Operating Income 39.9 43.4 49.8 43.1 Net Income 15.8 21.6 28.8 23.9 2009 Operating Revenues $ 307.7 $ 262.9 $ 275.1 $ 263.9 Operating Income 36.1 31.2 34.1 33.2 Net Income 17.5 16.6 16.2 15.3 WMECO Consolidated Statements of Quarterly Financial Data Quarter Ended (Millions of Dollars) March 31, June 30, September 30, December 31, 2010 Operating Revenues $ 100.2 $ 92.5 $ 103.7 $ 98.8 Operating Income 16.4 14.3 14.9 13.1 Net Income 5.7 5.2 7.3 4.9 2009 Operating Revenues $ 118.1 $ 95.1 $ 96.6 $ 92.6 Operating Income 15.3 13.2 17.1 13.0 Net Income 6.1 5.8 8.5 5.7

122
Item 8A. Changes in and Disagreements with Accountants on Accounting and Financial Disclosure No events that would be described in response to this item have occurred with respect to NU, CL&P, PSNH or WMECO. Item 8B. Controls and Procedures Management, on behalf of NU, CL&P, PSNH and WMECO, is responsible for the preparation, integrity, and fair presentation of the accompanying Consolidated Financial Statements and other sections of this combined Annual Report on Form 10-K. NU, CL&P, PSNH and WMECO’s internal controls over financial reporting were audited by Deloitte & Touche LLP. Management, on behalf of NU, CL&P, PSNH and WMECO, is responsible for establishing and maintaining adequate internal controls over financial reporting. The internal control framework and processes have been designed to provide reasonable assurance regarding the reliability of financial reporting and the preparation of financial statements for external purposes in accordance with GAAP. There are inherent limitations of internal controls over financial reporting that could allow material misstatements due to error or fraud to occur and not be prevented or detected on a timely basis by employees during the normal course of business. Additionally, internal controls over financial reporting may become inadequate in the future due to changes in the business environment. Under the supervision and with the participation of the principal executive officers and principal financial officer, an evaluation of the effectiveness of internal controls over financial reporting was conducted based on criteria established in Internal Control - Integrated Framework issued by the Committee of Sponsoring Organizations of the Treadway Commission (COSO). Based on this evaluation under the framework in COSO, management concluded that internal controls over financial reporting at NU, CL&P, PSNH and WMECO were effective as of December 31, 2010. Management, on behalf of NU, CL&P, PSNH and WMECO, undertook a separate evaluation of the design and operation of disclosure controls and procedures to determine whether they are effective in ensuring that the disclosure of required information is made timely and in accordance with the Securities Exchange Act of 1934 and the rules and forms of the SEC. This evaluation was made under management’s supervision and with management’s participation, including the principal executive officers and principal financial officer, as of the end of the period covered by this report on Form 10-K. The principal executive officers and principal financial officer have concluded, based on their review, that the disclosure controls and procedures of NU, CL&P, PSNH and WMECO are effective to ensure that information required to be disclosed by us in reports filed under the Securities Exchange Act of 1934 i) is recorded, processed, summarized, and reported within the time periods specified in SEC rules and forms and ii) is accumulated and communicated to management, including the principal executive officers and principal financial officer, as appropriate to allow timely decisions regarding required disclosure. There have been no changes in internal controls over financial reporting for NU, CL&P, PSNH and WMECO during the quarter ended December 31, 2010 that have materially affected, or are reasonably likely to materially affect, internal controls over financial reporting. Item 9. Other Information No information is required to be disclosed under this item as of December 31, 2010, as this information has been previously disclosed in applicable reports on Form 8-K during the fourth quarter of 2010.
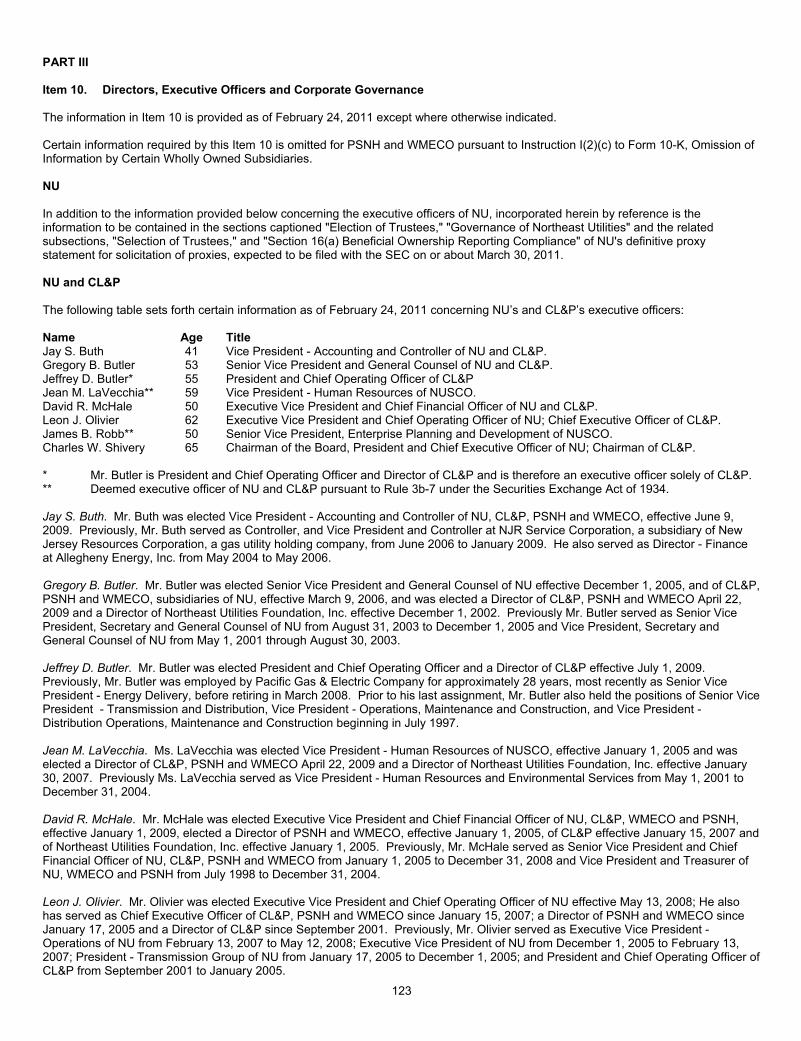
123
PART III Item 10. Directors, Executive Officers and Corporate Governance The information in Item 10 is provided as of February 24, 2011 except where otherwise indicated. Certain information required by this Item 10 is omitted for PSNH and WMECO pursuant to Instruction I(2)(c) to Form 10-K, Omission of Information by Certain Wholly Owned Subsidiaries. NU In addition to the information provided below concerning the executive officers of NU, incorporated herein by reference is the information to be contained in the sections captioned "Election of Trustees," "Governance of Northeast Utilities" and the related subsections, "Selection of Trustees," and "Section 16(a) Beneficial Ownership Reporting Compliance" of NU's definitive proxy statement for solicitation of proxies, expected to be filed with the SEC on or about March 30, 2011. NU and CL&P The following table sets forth certain information as of February 24, 2011 concerning NU’s and CL&P’s executive officers: Name Age Title Jay S. Buth 41 Vice President - Accounting and Controller of NU and CL&P. Gregory B. Butler 53 Senior Vice President and General Counsel of NU and CL&P. Jeffrey D. Butler* 55 President and Chief Operating Officer of CL&P Jean M. LaVecchia** 59 Vice President - Human Resources of NUSCO. David R. McHale 50 Executive Vice President and Chief Financial Officer of NU and CL&P. Leon J. Olivier 62 Executive Vice President and Chief Operating Officer of NU; Chief Executive Officer of CL&P.James B. Robb** 50 Senior Vice President, Enterprise Planning and Development of NUSCO. Charles W. Shivery 65 Chairman of the Board, President and Chief Executive Officer of NU; Chairman of CL&P. * Mr. Butler is President and Chief Operating Officer and Director of CL&P and is therefore an executive officer solely of CL&P. ** Deemed executive officer of NU and CL&P pursuant to Rule 3b-7 under the Securities Exchange Act of 1934. Jay S. Buth. Mr. Buth was elected Vice President - Accounting and Controller of NU, CL&P, PSNH and WMECO, effective June 9, 2009. Previously, Mr. Buth served as Controller, and Vice President and Controller at NJR Service Corporation, a subsidiary of New Jersey Resources Corporation, a gas utility holding company, from June 2006 to January 2009. He also served as Director - Finance at Allegheny Energy, Inc. from May 2004 to May 2006. Gregory B. Butler. Mr. Butler was elected Senior Vice President and General Counsel of NU effective December 1, 2005, and of CL&P, PSNH and WMECO, subsidiaries of NU, effective March 9, 2006, and was elected a Director of CL&P, PSNH and WMECO April 22, 2009 and a Director of Northeast Utilities Foundation, Inc. effective December 1, 2002. Previously Mr. Butler served as Senior Vice President, Secretary and General Counsel of NU from August 31, 2003 to December 1, 2005 and Vice President, Secretary and General Counsel of NU from May 1, 2001 through August 30, 2003. Jeffrey D. Butler. Mr. Butler was elected President and Chief Operating Officer and a Director of CL&P effective July 1, 2009. Previously, Mr. Butler was employed by Pacific Gas & Electric Company for approximately 28 years, most recently as Senior Vice President - Energy Delivery, before retiring in March 2008. Prior to his last assignment, Mr. Butler also held the positions of Senior Vice President - Transmission and Distribution, Vice President - Operations, Maintenance and Construction, and Vice President - Distribution Operations, Maintenance and Construction beginning in July 1997. Jean M. LaVecchia. Ms. LaVecchia was elected Vice President - Human Resources of NUSCO, effective January 1, 2005 and was elected a Director of CL&P, PSNH and WMECO April 22, 2009 and a Director of Northeast Utilities Foundation, Inc. effective January 30, 2007. Previously Ms. LaVecchia served as Vice President - Human Resources and Environmental Services from May 1, 2001 to December 31, 2004. David R. McHale. Mr. McHale was elected Executive Vice President and Chief Financial Officer of NU, CL&P, WMECO and PSNH, effective January 1, 2009, elected a Director of PSNH and WMECO, effective January 1, 2005, of CL&P effective January 15, 2007 and of Northeast Utilities Foundation, Inc. effective January 1, 2005. Previously, Mr. McHale served as Senior Vice President and Chief Financial Officer of NU, CL&P, PSNH and WMECO from January 1, 2005 to December 31, 2008 and Vice President and Treasurer of NU, WMECO and PSNH from July 1998 to December 31, 2004. Leon J. Olivier. Mr. Olivier was elected Executive Vice President and Chief Operating Officer of NU effective May 13, 2008; He also has served as Chief Executive Officer of CL&P, PSNH and WMECO since January 15, 2007; a Director of PSNH and WMECO since January 17, 2005 and a Director of CL&P since September 2001. Previously, Mr. Olivier served as Executive Vice President - Operations of NU from February 13, 2007 to May 12, 2008; Executive Vice President of NU from December 1, 2005 to February 13, 2007; President - Transmission Group of NU from January 17, 2005 to December 1, 2005; and President and Chief Operating Officer of CL&P from September 2001 to January 2005.

124
James B. Robb. Mr. Robb was elected Senior Vice President, Enterprise Planning and Development of NUSCO on September 4, 2007 and was elected a Director of CL&P, PSNH and WMECO April 22, 2009. Previously, Mr. Robb served as Managing Director, Russell Reynolds Associates from December 2006 to August 2007; Entrepreneur in Residence, Mohr Davidow Ventures from March 2006 to November 2006; Senior Vice President, Retail Marketing, Reliant Energy, Inc. from December 2003 to December 2006; and Senior Vice President, Performance Management, Reliant Resources, Inc. from November 2002 to December 2003. Charles W. Shivery. Mr. Shivery was elected Chairman of the Board, President and Chief Executive Officer of NU effective March 29, 2004; Chairman and a Director of CL&P, PSNH and WMECO effective January 19, 2007 and a Director of Northeast Utilities Foundation effective March 3, 2004. Previously, Mr. Shivery served as President (interim) of NU from January 1, 2004 to March 29, 2004; and President - Competitive Group of NU and President and Chief Executive Officer of NU Enterprises, Inc., from June 2002 through December 2003. There are no family relationships between any director or executive officer and any other trustee, director or executive officer of NU or CL&P and none of the above executive officers or directors serves as an executive officer or director pursuant to any agreement or understanding with any other person. Our executive officers hold the offices set forth opposite their names until the next annual meeting of the Board of Trustees, in the case of NU, and the Board of Directors, in the case of CL&P, and until their successors have been elected and qualified. CL&P obtains audit services from the independent registered public accounting firm engaged by the Audit Committee of NU's Board of Trustees. CL&P does not have its own audit committee or, accordingly, an audit committee financial expert. CL&P relies on NU, which has an audit committee and an audit committee expert. CODE OF ETHICS AND STANDARDS OF BUSINESS CONDUCT Each of NU, CL&P, PSNH and WMECO has adopted a Code of Ethics for Senior Financial Officers (Chief Executive Officer, Chief Financial Officer and Controller) and the Standards of Business Conduct, which are applicable to all Trustees, directors, officers, employees, contractors and agents of NU, CL&P, PSNH and WMECO. The Code of Ethics and the Standards of Business Conduct have both been posted on the NU web site and are available at www.nu.com/investors/corporate_gov/default.asp on the Internet. Any amendments to or waivers from the Code of Ethics and Standards of Business Conduct for executive officers, directors or Trustees will be posted on the website. Any such amendment or waiver would require the prior consent of the Board of Trustees or an applicable committee thereof. Printed copies of the Code of Ethics and the Standards of Business Conduct are also available to any shareholder without charge upon written request mailed to: Ms. O. Kay Comendul Assistant Secretary Northeast Utilities Service Company P.O. Box 270 Hartford, CT 06141 Item 11. Executive Compensation NU The information required by this Item 11 for NU is incorporated herein by reference to certain information contained in NU’s definitive proxy statement for solicitation of proxies, which is expected to be filed with the SEC on or about March 30, 2011, under the sections captioned "Compensation Discussion and Analysis" plus the related subsections, and "Compensation Committee Report" plus the related subsections following such Report. PSNH and WMECO Certain information required by this Item 11 has been omitted for PSNH and WMECO pursuant to Instruction I(2)(c) to Form 10-K, Omission of Information by Certain Wholly-Owned Subsidiaries. CL&P [The information required by this Item 11 for CL&P is omitted from this report but is set forth in the Annual Report on Form 10-K for 2010 filed on a combined basis with NU with the SEC on February 25, 2011. Such report is also available at the Investors section on www.nu.com.]

125
Item 12. Security Ownership of Certain Beneficial Owners and Management and Related Stockholder Matters NU In addition to the information below under "Securities Authorized for Issuance Under Equity Compensation Plans," incorporated herein by reference is the information contained in the sections "Common Share Ownership of Certain Beneficial Owners" and "Common Share Ownership of Trustees and Management" of NU’s definitive proxy statement for solicitation of proxies, expected to be filed with the SEC on or about March 30, 2011. PSNH and WMECO Certain information required by this Item 12 has been omitted for PSNH and WMECO pursuant to Instruction I(2)(c) to Form 10-K, Omission of Information by Certain Wholly-Owned Subsidiaries. CL&P [The information required by this Item 12 for CL&P is omitted from this report but is set forth in the Annual Report on Form 10-K for 2010 filed on a combined basis with NU with the SEC on February 25, 2011. Such report is also available at the Investors section on www.nu.com.] SECURITIES AUTHORIZED FOR ISSUANCE UNDER EQUITY COMPENSATION PLANS The following table sets forth the number of NU common shares issuable under NU equity compensation plans, as well as their weighted exercise price, as of December 31, 2010, in accordance with the rules of the SEC:
Plan Category
Number of securities to be issued
upon exercise of outstanding
options, warrants and rights (a)
Weighted-average exercise price of
outstanding options, warrants and rights (b)
Number of securities remaining available for future issuance
under equity compensation plans (excluding securities
reflected in column (a)) (c)
Equity compensation plans approved by security holders 1,375,637 $ 18.80 4,001,028 Equity compensation plans not approved by security holders (d) - - - Total 1,375,637 $ 18.80 4,001,028 (a) Includes 112,599 common shares to be issued upon exercise of options, 1,014,479 common shares for distribution of restricted
share units, and 248,559 performance shares issuable at target, all pursuant to the terms of our Incentive Plan. (b) The weighted-average exercise price in Column (b) does not take into account restricted share units or performance shares,
which have no exercise price. (c) Includes 932,178 common shares issuable under our Employee Share Purchase Plan II. (d) All of our current compensation plans under which equity securities of NU are authorized for issuance have been approved by
NU’s shareholders.
126
Item 13. Certain Relationships and Related Transactions, and Director Independence NU Incorporated herein by reference is the information contained in the sections captioned "Trustee Independence" and "Certain Relationships and Related Transactions" of NU’s definitive proxy statement for solicitation of proxies, expected to be filed with the SEC on or about March 30, 2011. PSNH and WMECO Certain information required by this Item 13 has been omitted for PSNH and WMECO pursuant to Instruction I(2)(c) to Form 10-K, Omission of Information by Certain Wholly-Owned Subsidiaries. CL&P [The information required by this Item 13 for CL&P is omitted from this report but is set forth in the Annual Report on Form 10-K for 2010 filed on a combined basis with NU with the SEC on February 25, 2011. Such report is also available at the Investors section on www.nu.com.] Item 14. Principal Accountant Fees and Services NU Incorporated herein by reference is the information contained in the section "Relationship with Independent Auditors" of NU’s definitive proxy statement for solicitation of proxies, expected to be filed with the SEC on or about March 30, 2011. CL&P, PSNH and WMECO [The information required by this Item 14 for CL&P, PSNH and WMECO is omitted from this report but is set forth in the Annual Report on Form 10-K for 2010 filed on a combined basis with NU with the SEC on February 25, 2011. Such report is also available at the Investors section on www.nu.com.]

127
PART IV Item 15. Exhibits and Financial Statement Schedules (a) 1. Financial Statements:
The financial statements filed as part of this Annual Report on Form 10-K are set forth under Item 8, "Financial Statements and Supplementary Data." Reference is made to the index on page 55.
2. Schedules I. Financial Information of Registrant:
Northeast Utilities (Parent) Balance Sheets as of December 31, 2010 and 2009 S-1 Northeast Utilities (Parent) Statements of Income for the Years Ended
December 31, 2010, 2009 and 2008 S-2 Northeast Utilities (Parent) Statements of Cash Flows for the Years Ended
December 31, 2010, 2009 and 2008 S-3 II. Valuation and Qualifying Accounts and Reserves for NU, CL&P, PSNH and WMECO for
2010, 2009 and 2008 S-4 All other schedules of the companies for which inclusion is required in the applicable
regulations of the SEC are permitted to be omitted under the related instructions or are not applicable, and therefore have been omitted.
3. Exhibit Index E-1

128
NORTHEAST UTILITIES
SIGNATURES Pursuant to the requirements of Section 13 or 15(d) of the Securities Exchange Act of 1934, the Registrant has duly caused this report to be signed on its behalf by the undersigned, thereunto duly authorized.
NORTHEAST UTILITIES (Registrant)
By /s/ Charles W. Shivery Date Charles W. Shivery Chairman of the Board, February 25, 2011 President and Chief Executive Officer (Principal Executive Officer) Pursuant to the requirements of the Securities Exchange Act of 1934, this report has been signed below by the following persons on behalf of the Registrant and in the capacities and on the dates indicated.
Signature Title Date /s/ Charles W. Shivery Chairman of the Board, President and Chief February 25, 2011 Charles W. Shivery Executive Officer, and a Trustee (Principal Executive Officer) /s/ David R. McHale Executive Vice President and
Chief Financial Officer (Principal Financial Officer)
February 25, 2011 David R. McHale /s/ Jay S. Buth Vice President - Accounting and Controller February 25, 2011 Jay S. Buth /s/ Richard H. Booth Trustee February 25, 2011 Richard H. Booth /s/ John S. Clarkeson Trustee February 25, 2011 John S. Clarkeson /s/ Cotton M. Cleveland Trustee February 25, 2011 Cotton M. Cleveland /s/ Sanford Cloud, Jr. Trustee February 25, 2011 Sanford Cloud, Jr. /s/ John F. Swope Trustee February 25, 2011 John F. Swope /s/ Robert E. Patricelli Trustee February 25, 2011 Robert E. Patricelli /s/ John G. Graham Trustee February 25, 2011 John G. Graham /s/ Elizabeth T. Kennan Trustee February 25, 2011 Elizabeth T. Kennan

129
/s/ Kenneth R. Leibler Trustee February 25, 2011 Kenneth R. Leibler /s/ Dennis R. Wraase Trustee February 25, 2011 Dennis R. Wraase

THIS PAGE INTENTIONALLY LEFT BLANK.

S-1
SCHEDULE I NORTHEAST UTILITIES (PARENT)
FINANCIAL INFORMATION OF REGISTRANT BALANCE SHEETS
AS OF DECEMBER 31, 2010 AND 2009 (Thousands of Dollars)
2010 2009 ASSETS Current Assets: Cash $ 268 $ 1,222 Notes Receivable from Affiliated Companies 132,600 186,213 Accounts Receivable 2,885 3,150 Accounts Receivable from Affiliated Companies 1,163 1,689 Taxes Receivable 18,139 2,838 Prepayments and Other Current Assets 18,021 6,837 Total Current Assets 173,076 201,949 Deferred Debits and Other Assets: Investments in Subsidiary Companies, at Equity 4,323,455 3,928,090 Notes Receivable from Affiliated Companies 62,500 62,500 Accumulated Deferred Income Taxes 23,288 31,503 Derivative Assets 4,099 6,520 Other Long-Term Assets 8,179 16,971 Total Deferred Debits and Other Assets 4,421,521 4,045,584 Total Assets $ 4,594,597 $ 4,247,533 LIABILITIES AND CAPITALIZATION Current Liabilities: Notes Payable to Banks $ 237,000 $ 100,313 Accounts Payable 179 - Accounts Payable to Affiliated Companies 411 - Accrued Taxes 3,616 1,162 Accrued Interest 8,024 6,112 Other 1,145 408 Total Current Liabilities 250,375 107,995 Deferred Credits and Other Liabilities: Other 6,776 35,442 Total Deferred Credits and Other Liabilities 6,776 35,442 Capitalization: Long-Term Debt 524,813 526,194 Equity: Common Shareholders' Equity: Common Shares 978,909 977,276 Capital Surplus, Paid in 1,777,592 1,762,097 Deferred Contribution Plan - (2,944) Retained Earnings 1,452,777 1,246,543 Accumulated Other Comprehensive Loss (43,370) (43,467) Treasury Stock (354,732) (361,603) Common Shareholders' Equity 3,811,176 3,577,902 Noncontrolling Interests 1,457 - Total Equity 3,812,633 3,577,902 Total Capitalization 4,337,446 4,104,096 Total Liabilities and Capitalization $ 4,594,597 $ 4,247,533

S-2
SCHEDULE I
NORTHEAST UTILITIES (PARENT) FINANCIAL INFORMATION OF REGISTRANT
STATEMENTS OF INCOME FOR THE YEARS ENDED DECEMBER 31, 2010, 2009 AND 2008
(Thousands of Dollars, Except Share Information)
2010 2009 2008 Operating Revenues $ - $ - $ - Operating Expenses: Other 21,081 3,251 53,484 Operating Loss (21,081) (3,251) (53,484) Interest Expense 12,058 29,678 30,893 Other Income, Net: Equity in Earnings of Subsidiaries 396,333 346,137 307,908 Other, Net 4,536 6,511 6,956 Other Income, Net 400,869 352,648 314,864 Income Before Income Tax Benefit 367,730 319,719 230,487 Income Tax Benefit (20,276) (10,314) (30,341) Net Income 388,006 330,033 260,828 Net Income Attributable to Noncontrolling Interest 57 - - Net Income Attributable to Controlling Interest $ 387,949 $ 330,033 $ 260,828 Basic Earnings per Common Share $ 2.20 $ 1.91 $ 1.68 Diluted Earnings per Common Share $ 2.19 $ 1.91 $ 1.67 Weighted Average Common Shares Outstanding: Basic 176,636,086 172,567,928 155,531,846 Diluted 176,885,387 172,717,246 155,999,240

S-3
SCHEDULE I NORTHEAST UTILITIES (PARENT)
FINANCIAL INFORMATION OF REGISTRANT STATEMENTS OF CASH FLOWS
FOR THE YEARS ENDED DECEMBER 31, 2010, 2009 AND 2008 (Thousands of Dollars)
2010 2009 2008 Operating Activities:
Net Income $ 388,006 $ 330,033 $ 260,828 Adjustments to Reconcile Net Income to Net Cash Flows Provided by Operating Activities:
Equity in Earnings of Subsidiaries (396,333) (346,137) (307,908) Cash Dividends Received from Subsidiaries 309,669 207,877 215,162 Deferred Income Taxes 8,398 (6,658) (3,164) Other 23,675 15,525 12,576
Changes in Current Assets and Liabilities: Receivables, Including Affiliate Receivables 791 (861) 883 Accounts Payable, Including Affiliate Payables 590 (35,522) 33,752 Taxes Receivable/Accrued (28,394) 5,591 3,580 Other Current Assets and Liabilities (12,656) 2,369 2,451
Net Cash Flows Provided by Operating Activities 293,746 172,217 218,160 Investing Activities:
Capital Contributions to Subsidiaries (313,560) (243,688) (323,164) Return of Investment in Subsidiaries 5,000 - 30,000 Decrease/(Increase) in NU Money Pool Lending 83,300 128,700 (84,600) Increase in Notes Receivable from Affiliated Companies (29,687) (72,709) (79,504) Other Investing Activities 1,703 2,283 1,557
Net Cash Flows Used in Investing Activities (253,244) (185,414) (455,711) Financing Activities:
Issuance of Common Shares - 383,295 - Cash Dividends on Common Shares (180,542) (162,381) (129,077) Increase/(Decrease) in Short-Term Debt 136,687 (203,206) 261,519 Issuance of Long-Term Debt - - 250,000 Retirements of Long-Term Debt - - (150,000) Financing Fees - (12,457) - Other Financing Activities 2,399 7,874 6,109
Net Cash Flows (Used in)/Provided by Financing Activities (41,456) 13,125 238,551 Net (Decrease)/Increase in Cash (954) (72) 1,000 Cash - Beginning of Year 1,222 1,294 294 Cash - End of Year $ 268 $ 1,222 $ 1,294 Supplemental Cash Flow Information: Cash Paid/(Received) During the Year for:
Interest, Net of Amounts Capitalized $ 22,886 $ 26,744 $ 27,522 Income Taxes $ 1,291 $ (12,848) $ (37,063)

S-4
SCHEDULE II NORTHEAST UTILITIES AND SUBSIDIARIES
VALUATION AND QUALIFYING ACCOUNTS AND RESERVES FOR THE YEARS ENDED DECEMBER 31, 2010, 2009 AND 2008
(Thousands of Dollars) Column A Column B Column C Column D Column E Additions (1) (2) Description:
Balance as
of Beginning of Year
Charged to Costs
and Expenses
Charged to Other
Accounts - Describe (a)
Deductions -
Describe (b)
Balance
as of End of Year
NU: Reserves Deducted from Assets - Reserves for Uncollectible Accounts:
2010 $ 55,300 $ 31,352 $ 10,714 $ 57,569 $ 39,797 2009 43,275 53,947 24,136 66,058 55,300 2008 25,529 28,573 81,991 92,818 43,275 CL&P: Reserves Deducted from Assets - Reserves for Uncollectible Accounts:
2010 $ 26,057 $ 7,484 $ 9,919 $ 26,286 $ 17,174 2009 23,956 15,276 20,115 33,290 26,057 2008 7,874 5,951 81,129 70,998 23,956 PSNH: Reserves Deducted from Assets - Reserves for Uncollectible Accounts:
2010 $ 5,086 $ 8,858 $ 1,017 $ 8,137 $ 6,824 2009 4,165 10,084 652 9,815 5,086 2008 2,675 5,661 483 4,654 4,165 WMECO: Reserves Deducted from Assets - Reserves for Uncollectible Accounts:
2010 $ 7,217 $ 9,747 $ 243 $ 11,232 $ 5,975 2009 6,571 7,590 103 7,047 7,217 2008 5,699 8,185 234 7,547 6,571 (a) Amount relates to uncollectible amounts reserved for that relate to receivables other than those of customers. (b) Amounts written off, net of recoveries. The DPUC issued an order allowing CL&P and Yankee Gas to accelerate the recovery of
uncollectible hardship accounts receivable outstanding for greater than 90 days. As of December 31, 2010, CL&P, WMECO and Yankee Gas had uncollectible hardship accounts receivable reserves in the amount of $65 million, $6.9 million and $7.5 million, respectively. As of December 31, 2009, CL&P, WMECO and Yankee Gas had uncollectible hardship accounts receivable reserves in the amount of $54.5 million, $9.1 million and $8.6 million, respectively. As of December 31, 2008, CL&P and Yankee Gas had uncollectible hardship accounts receivable reserves in the amount of $41 million and $10 million, respectively.

THIS PAGE INTENTIONALLY LEFT BLANK.

E-1
EXHIBIT INDEX
Each document described below is incorporated by reference by the registrant(s) listed to the files identified, unless designated with a (*), which exhibits are filed herewith. Management contracts and compensation plans or arrangements are designated with a (+). Exhibit Number Description 2. Plan of Acquisition, Reorganization, Arrangement, Liquidation or Succession (A) Northeast Utilities
2.1 Agreement and Plan of Merger By and Among Northeast Utilities, NU Holding Energy 1 LLC, NU Holding Energy 2 LLC and NSTAR dated as of October 16, 2010 (Exhibit 2.1 Current Report on Form 8-K filed October 18, 2010, File No. 001-05324) *2.1.1 Amendment 1 to Agreement and Plan of Merger By and Among Northeast Utilities, NU Holding Energy 1
LLC, NU Holding Energy 2 LLC and NSTAR dated as of November 1, 2010 *2.1.2 Amendment 2 to Agreement and Plan of Merger By and Among Northeast Utilities, NU Holding Energy 1
LLC, NU Holding Energy 2 LLC and NSTAR dated as of December 16, 2010 3. Articles of Incorporation and By-Laws (A) Northeast Utilities
3.1 Declaration of Trust of NU, as amended through May 10, 2005 (Exhibit A.1, NU Form U-1 filed June 23, 2005, File No. 70-10315)
(B) The Connecticut Light and Power Company
3.1 Certificate of Incorporation of CL&P, restated to March 22, 1994 (Exhibit 3.2.1, 1993 CL&P Form 10-K filed on March 25, 1994, File No. 0-00404)
3.1.1 Certificate of Amendment to Certificate of Incorporation of CL&P, dated December 26, 1996 (Exhibit 3.2.2,
1996 CL&P Form 10-K filed March 25, 1997, File No. 001-11419) 3.1.2 Certificate of Amendment to Certificate of Incorporation of CL&P, dated April 27, 1998 (Exhibit 3.2.3, 1998
CL&P Form 10-K filed March 23, 1999, File No. 000-00404)
3.2 By-laws of CL&P, as amended to January 1, 1997 (Exhibit 3.2.3, 1996 CL&P Form 10-K filed March 25, 1997, File No. 001-11419)
(C) Public Service Company of New Hampshire
3.1 Articles of Incorporation, as amended to May 16, 1991 (Exhibit 3.3.1, 1993 PSNH Form 10-K filed on March 25, 1994, File No. 001-06392)
3.2 By-laws of PSNH, as in effect June 27, 2008 (Exhibit 3, PSNH Form 10-Q for the Quarter Ended June 30, 2008 filed
August 7, 2008, File No. 001-06392)
(D) Western Massachusetts Electric Company
3.1 Articles of Organization of WMECO, restated to February 23, 1995 (Exhibit 3.4.1, 1994 WMECO Form 10-K filed on March 27, 1995, File No. 001-07624)
3.2 By-laws of WMECO, as amended to April 1, 1999 (Exhibit 3.1, WMECO Form 10-Q for the Quarter Ended June 30,
1999 filed August 13, 1999, File No. 000-07624)
3.2.1 By-laws of WMECO, as further amended to May 1, 2000 (Exhibit 3.1, WMECO Form 10-Q for the Quarter Ended June 30, 2000 filed August 11, 2000, File No. 000-07624)

E-2
4. Instruments defining the rights of security holders, including indentures (A) Northeast Utilities
4.1 Indenture between NU and The Bank of New York as Trustee dated as of April 1, 2002 (Exhibit A-3, NU 35-CERT filed April 16, 2002, File No. 070-09535)
4.1.1 First Supplemental Indenture between NU and The Bank of New York as Trustee dated as of April 1, 2002,
relating to $263 million of Senior Notes, Series A, due 2012 (Exhibit A-4, NU 35-CERT filed April 16, 2002, File No. 070-09535)
4.1.2 Third Supplemental Indenture between NU and The Bank of New York Trust Company N.A., as Trustee,
dated as of June 1, 2008, relating to $250 million of Senior Notes, Series C, due 2013, (Exhibit 4.1, NU Current Report on Form 8-K filed June 10, 2008, File No. 001-05324)
4.2 Credit Agreement between NU, the Banks Named Therein, Union Bank, N.A. as Administrative Agent, and Barclays
Bank, PLC, Citibank, N.A., JPMorgan Chase Bank, N.A. and Union Bank, N.A., as Fronting Banks dated September 24, 2010 (Exhibit 10, NU Form 10-Q for the Quarter Ended September 30, 2010, filed November 8, 2010, File No. 001-05324)
(B) The Connecticut Light and Power Company 4.1 Indenture of Mortgage and Deed of Trust between CL&P and Bankers Trust Company, Trustee, dated as of May 1,
1921 (Composite including all twenty-four amendments to May 1, 1967) (Exhibit 4.1.1, 1989 NU Form 10-K, File No. 001-05324)
4.1.1 Series D Supplemental Indentures to the Composite May 1, 1921 Indenture of Mortgage and Deed of Trust
between CL&P and Bankers Trust Company, dated as of October 1, 1994 (Exhibit 4.2.16, 1994 CL&P Form 10-K filed on March 27, 1995, File No. 001-11419)
4.1.2 Series A Supplemental Indenture between CL&P and Deutsche Bank Trust Company Americas, as Trustee,
dated as of September 1, 2004 (Exhibit 99.2, CL&P Current Report on Form 8-K filed September 22, 2004, File No. 000-00404)
4.1.3 Series B Supplemental Indenture between CL&P and Deutsche Bank Trust Company Americas, as Trustee
dated as of September 1, 2004 (Exhibit 99.5, CL&P Current Report on Form 8-K filed September 22, 2004, File No. 000-00404)
4.2 Composite Indenture of Mortgage and Deed of Trust between CL&P and Deutsche Bank Trust Company Americas
f/k/a Bankers Trust Company, dated as of May 1, 1921, as amended and supplemented by seventy-three supplemental mortgages to and including Supplemental Mortgage dated as of April 1, 2005 (Exhibit 99.5, CL&P Current Report on Form 8-K filed April 13, 2005, File No. 000-00404)
4.2.1 Supplemental Indenture (2005 Series A Bonds and 2005 Series B Bonds) between CL&P and Deutsche
Bank Trust Company Americas, as Trustee dated as of April 1, 2005 (Exhibit 99.2, CL&P Current Report on Form 8-K filed April 13, 2005, File No. 000-00404)
4.2.2 Supplemental Indenture (2006 Series A Bonds) between CL&P and Deutsche Bank Trust Company
Americas, as Trustee dated as of June 1, 2006 (Exhibit 99.2, CL&P Current Report on Form 8-K filed June 7, 2006, File No. 000-00404)
4.2.3 Supplemental Indenture (2007 Series A Bonds and 2007 Series B Bonds) between CL&P and Deutsche
Bank Trust Company Americas, as Trustee dated as of March 1, 2007 (Exhibit 99.2, CL&P Current Report on Form 8-K filed March 29, 2007, File No. 000-00404)
4.2.4 Supplemental Indenture (2007 Series C Bonds and 2007 Series D Bonds) between CL&P and Deutsche
Bank Trust Company Americas, as Trustee dated as of September 1, 2007 (Exhibit 4, CL&P Current Report on Form 8-K filed September 19, 2007, File No. 000-00404)
4.2.5 Supplemental Indenture (2008 Series A Bonds) between CL&P and Deutsche Bank Trust Company
Americas, as Trustee dated as of May 1, 2008 (Exhibit 4, CL&P Current Report on Form 8-K filed May 29, 2008, File No. 000-00404)
4.2.6 Supplemental Indenture (2009 Series A Bonds) between CL&P and Deutsche Bank Trust Company
Americas, as Trustee dated as of February 1, 2009 (Exhibit 4, CL&P Current Report on Form 8-K filed February 19, 2009, File No. 000-00404)

E-3
4.3 Financing Agreement between The Industrial Development Authority of the State of New Hampshire and CL&P (Pollution Control Bonds, 1986 Series) dated as of December 1, 1986 (Exhibit C.1.47, 1986 NU Form U5S, File No. 030-00246)
4.4 Financing Agreement between The Industrial Development Authority of the State of New Hampshire and CL&P
(Pollution Control Revenue Bonds, 1988 Series) dated as of October 1, 1988 (Exhibit C.1.55, 1988 NU Form U5S, File No. 030-00246)
4.5 Loan and Trust Agreement among Business Finance Authority of the State of New Hampshire, CL&P and BayBank,
the Trustee (Pollution Control Refunding Revenue Bonds, 1992 Series A) dated as of December 1, 1992 (Exhibit C.2.33, 1992 NU Form U5S, File No. 030-00246)
4.6 Loan Agreement between Connecticut Development Authority and CL&P (Pollution Control Revenue Refunding
Bonds - 1993A Series) dated as of September 1, 1993 (Exhibit 4.2.21, 1993 CL&P Form 10-K filed March 25, 1994, File No. 000-00404)
4.7 Loan Agreement between Connecticut Development Authority and CL&P (Pollution Control Revenue Refunding
Bonds – 1993B Series) dated as of September 1, 1993 (Exhibit 4.2.22, 1993 CL&P Form 10- K filed March 25, 1994, File No. 000-00404)
4.8 Amended and Restated Loan Agreement between Connecticut Development Authority and CL&P dated as of May 1,
1996 and Amended and Restated as of January 1, 1997 (Pollution Control Revenue Bond - 1996A Series) (Exhibit 4.2.24, 1996 CL&P Form 10-K filed March 25, 1997, File No. 001-11419)
4.8.1 First Amendment to Amended and Restated Loan Agreement between the Connecticut Development
Authority and CL&P dated as of October 1, 2008 (Pollution Control Revenue Bond-1996A Series) (Exhibit 10.1, CL&P Form 10-Q for the Quarter Ended September 30, 2008, filed November 10, 2008, File No. 000-00404)
4.9 Amended and Restated Indenture of Trust between Connecticut Development Authority and Fleet National Bank, the
Trustee dated as of May 1, 1996 and Amended and Restated as of January 1, 1997 (Pollution Control Revenue Bond-1996A Series) (Exhibit 4.2.24.1, 1996 CL&P Form 10-K, filed March 25, 1997, File No. 000-11419) 4.9.1 First Amendment to Amended and Restated Indenture of Trust between Connecticut Development Authority
and U.S. Bank National Association, as Trustee dated as of October 1, 2008 (Exhibit 10.2 CL&P Form 10-Q for the Quarter Ended September 30, 2008, filed November 10, 2008, File No. 000-00404)
4.10 Credit Agreement between CL&P, WMECO, Yankee Gas and PSNH, the Banks Named Therein, and Citicorp N.A., as Administrative Agent dated September 24, 2010 (Exhibit 10, CL&P Form 10-Q for the Quarter Ended September 30, 2010 filed November 8, 2010, File No. 000-00404)
(C) Public Service Company of New Hampshire
4.1 First Mortgage Indenture between PSNH and First Fidelity Bank, National Association, New Jersey, now First Union
National Bank, Trustee, dated as of August 15, 1978 (Composite including all amendments to May 16, 1991) (Exhibit 4.4.1, 1992 PSNH Form 10-K, File No. 001-05324) 4.1.1 Tenth Supplemental Indenture between PSNH and First Fidelity Bank, National Association, now First Union
National Bank dated as of May 1, 1991 (Exhibit 4.1, PSNH Current Report on Form 8-K filed February 10, 1992, File No. 001-06392)
4.1.2 Twelfth Supplemental Indenture between PSNH and First Union National Bank dated as of December 1, 2001 (Exhibit 4.3.1.2, 2001 PSNH Form 10-K filed March 22, 2002, File No. 001-06392)
4.1.3 Thirteenth Supplemental Indenture between PSNH and Wachovia Bank, National Association, successor to
First Union National Bank, as successor to First Fidelity Bank, National Association, as Trustee dated as of July 1, 2004 (Exhibit 99.2, PSNH Current Report on Form 8-K filed October 5, 2004, File No. 001-06392)
4.1.4 Fourteenth Supplemental Indenture between PSNH and Wachovia Bank, National Association successor to
First Union National Bank, as successor to First Fidelity Bank, National Association, as Trustee dated as of October 1, 2005 (Exhibit 99.2, PSNH Current Report on Form 8-K filed October 6, 2005, File No. 001-06392)
4.1.5 Fifteenth Supplemental Indenture between PSNH and Wachovia Bank, National Association successor to
First Union National Bank, as successor to First Fidelity Bank, National Association, as Trustee dated as of September 1, 2007 (Exhibit 4.1, PSNH Current Report on Form 8-K filed September 24, 2007, File No. 001-06392)
E-4
4.1.6 Sixteenth Supplemental Indenture between PSNH and U.S. Bank National Association, as Trustee, relating
to First Mortgage Bonds, Series O, Due 2018, dated as of May 1, 2008 (Exhibit 4.1 to PSNH Current Report on Form 8-K filed May 29, 2008 (File No. 001-06392)
4.1.7 Seventeenth Supplemental Indenture between PSNH and U.S. Bank National Association, as Trustee dated
as of December 1, 2009 (Exhibit 4.1, PSNH Current Report on Form 8-K filed December 15, 2009 (File No. 001-06392)
4.2 Series D (Tax Exempt Refunding) Amended and Restated PCRB Loan and Trust Agreement dated as of April 1,
1999 (Exhibit 4.3.6, 1999 PSNH Form 10-K filed March 27, 2000, File No. 001-06392) 4.3 Series E (Tax Exempt Refunding) Amended and Restated PCRB Loan and Trust Agreement dated as of April 1,
1999 (Exhibit 4.3.7, 1999 PSNH Form 10-K filed March 27, 2000, File No. 001-06392) 4.4 Series A Loan and Trust Agreement among Business Finance Authority of the State of New Hampshire and PSNH
and State Street Bank and Trust Company, as Trustee (Tax Exempt Pollution Control Bonds) dated as of October 1, 2001 (Exhibit 4.3.4, 2001 PSNH Form 10-K filed March 22, 2002, File No. 001-06392)
4.5 Series B Loan and Trust Agreement among Business Finance Authority of the State of New Hampshire and PSNH
and State Street Bank and Trust Company, as Trustee (Tax Exempt Pollution Control Bonds) dated as of October 1, 2001 (Exhibit 4.3.5, 2001 PSNH Form 10-K filed March 22, 2002, File No. 001-06392)
4.6 Series C Loan and Trust Agreement among Business Finance Authority of the State of New Hampshire and PSNH
and State Street Bank and Trust Company, as Trustee (Tax Exempt Pollution Control Bonds) dated as of October 1, 2001 (Exhibit 4.3.6, 2001 PSNH Form 10-K filed March 22, 2002, File No. 001-06392)
4.7 Credit Agreement between CL&P, WMECO, Yankee Gas and PSNH, the Banks Named Therein, and Citicorp, N.A.,
as Administrative Agent dated September 24, 2010 (Exhibit 10, PSNH Form 10-Q for the Quarter Ended September 30, 2010 filed November 8, 2010, File No. 001-06392)
(D) Western Massachusetts Electric Company
4.1 Loan Agreement between Connecticut Development Authority and WMECO, (Pollution Control Revenue Bonds -
Series A, Tax Exempt Refunding) dated as of September 1, 1993 (Exhibit 4.4.13, 1993 WMECO Form 10-K filed March 25,1994, File No. 000-07624)
4.2 Indenture between WMECO and The Bank of New York, as Trustee, dated as of September 1, 2003 (Exhibit 99.2,
WMECO Current Report on Form 8-K filed October 8, 2003, File No. 000-07624) 4.2.1 First Supplemental Indenture between WMECO and The Bank of New York, as Trustee, dated as of
September 1, 2003 (Exhibit 99.3, WMECO Current Report on Form 8-K filed October 8, 2003, File No. 000-07624)
4.2.2 Second Supplemental Indenture between WMECO and The Bank of New York, as Trustee, dated as of September 1, 2004 (Exhibit 4.1, WMECO Current Report on Form 8-K filed September 27, 2004, File No. 000-07624)
4.2.3 Third Supplemental Indenture between WMECO and The Bank of New York Trust, as Trustee, dated as of
August 1, 2005 (Exhibit 4.1, WMECO Current Report on Form 8-K filed August 12, 2005, File No. 000-07624)
4.2.4 Fourth Supplemental Indenture between WMECO and The Bank of New York Trust, as Trustee, dated as of
August 1, 2007 (Exhibit 4.1, WMECO Current Report on Form 8-K filed August 20, 2007, File No. 000-07624)
4.2.5 Fifth Supplemental Indenture between WMECO and The Bank of New York Trust Company, N.A., as
Trustee, dated as of March 1, 2010 (Exhibit 4.1, WMECO Current Report on Form 8-K filed March 10, 2010, File No. 000-07624)
4.3 Credit Agreement between CL&P, WMECO, Yankee Gas and PSNH, the Banks Named Therein, and Citicorp, N.A.,
as Administrative Agent dated September 24, 2010 (Exhibit 10, WMECO Form 10-Q for the Quarter Ended September 30, 2010 filed November 8, 2010, File No. 000-07624)
E-5
10. Material Contracts (A) NU
10.1 Lease between The Rocky River Realty Company and Northeast Utilities Service Company dated as of April 14,
1992 with respect to the Berlin, Connecticut headquarters (Exhibit 10.29.1, 1992 NU Form 10-K, File No. 001-05324) 10.2 Indenture of Mortgage and Deed of Trust between Yankee Gas Services Company and the Connecticut National
Bank, as Trustee, dated July 1, 1989 (Exhibit 4.7, Yankee Energy System, Inc. Form 10-K for the year ended September 30, 1990, File No. 001-10721)
10.2.1 First Supplemental Indenture of Mortgage and Deed of Trust between Yankee Gas Services Company and
The Connecticut National Bank, as Trustee, dated April 1, 1992 (Yankee Energy System, Inc. Registration Statement on Form S-3, dated October 2, 1992, File No. 33-52750)
10.2.2 Fourth Supplemental Indenture of Mortgage and Deed of Trust between Yankee Gas Services Company
and Fleet National Bank (formerly The Connecticut National Bank), as Trustee dated April 1, 1997 (Exhibit 4.15, Yankee Energy System, Inc. Form 10-K for the year ended September 30, 1997 filed December 10, 1997, File No. 001-10721)
10.2.3 Fifth Supplemental Indenture of Mortgage and Deed of Trust between Yankee Gas Services Company and
The Bank of New York, as Successor Trustee to Fleet Bank (formerly The Connecticut National Bank) dated January 1, 1999 (Exhibit 4.2, Yankee Energy System, Inc. Form 10-Q for the Quarter ended March 31, 1999 filed May 13, 1999, File No. 001-10721)
10.2.4 Sixth Supplemental Indenture of Mortgage and Deed of Trust between Yankee Gas Services Company and
The Bank of New York, as Successor Trustee to Fleet Bank (formerly The Connecticut National Bank) dated January 1, 2004 (Exhibit 10.5.6, 2004 NU Form 10-K filed March 17, 2005, File No. 001-05324)
10.2.5 Seventh Supplemental Indenture of Mortgage and Deed of Trust between Yankee Gas Services Company
and The Bank of New York, as Successor Trustee to Fleet Bank (formerly The Connecticut National Bank) dated November 1, 2005 (Exhibit 10.5.7, 2004 NU Form 10-K filed March 17, 2005, File No. 001-05324)
10.2.6 Eighth Supplemental Indenture of Mortgage and Deed of Trust between Yankee Gas Services Company
and The Bank of New York, as Successor Trustee to Fleet Bank (formerly the Connecticut National Bank) dated July 1, 2005 (Exhibit 10.5.8, NU Form 10-Q for the Quarter Ended June 30, 2005 filed August 8, 2005, File No. 001-05324)
10.2.7 Ninth Supplemental Indenture of Mortgage and Deed of Trust between Yankee Gas Services Company and
The Bank of New York Mellon Trust Company, N.A., successor as Trustee to The Bank of New York, as successor to Fleet National Bank (formerly known as The Connecticut National Bank), dated as of October 1, 2008 (Exhibit 10.1, NU Form 10-Q for the Quarter Ended September 30, 2008 filed November 10, 2008, File No. 001-05324)
10.2.8 Tenth Supplemental Indenture of Mortgage between Yankee Gas Services Company and The Bank of New
York Mellon Trust Company, N.A., successor as Trustee to The Bank of New York, as successor to Fleet National Bank (formerly known as The Connecticut National Bank), dated as of April 1, 2010 (Exhibit 10, NU Form 10-Q for the Quarter Ended March 31, 2010 filed May 7, 2010, File No. 001-05324)
* +10.3 Northeast Utilities Board of Trustees' Compensation Arrangement Summary
+10.4 Amended and Restated Northeast Utilities Deferred Compensation Plan for Trustees, effective January 1, 2009
(Exhibit 10.6, NU Form 10-Q for the Quarter Ended September 30, 2008 filed November 10, 2008, File No. 001-05324)
*10.5 Limited Liability Company Agreement of Northern Pass Transmission LLC dated as of April 6, 2010
*10.5.1 Amendment No. 1 to Limited Liability Company Agreement of Northern Pass Transmission LLC, dated as of May 14, 2010
*10.5.2 Amendment No. 2 to Limited Liability Company Agreement of Northern Pass Transmission LLC, dated as of
November 18, 2010 *10.6 Transmission Service Agreement by and between Northern Pass Transmission LLC, as Owner and H.Q. Hydro
Renewable Energy, as Purchaser dated October 4, 2010
E-6
(B) NU, CL&P, PSNH and WMECO 10.1 Form of Service Contract between each of NU, CL&P and WMECO and Northeast Utilities Service Company
(NUSCO) dated as of July 1, 1966 (Exhibit 10.20, 1993 NU Form 10-K filed March 25, 1994, File No. 001-05324) 10.1.1 Form of Renewal of Service Contract (Exhibit 10.2, 2006 NU Form 10-K filed March 1, 2007, File No. 001-
05324)
10.2 Agreements among New England Utilities with respect to the Hydro-Quebec interconnection projects (Exhibits 10(u) and 10(v); 10(w), 10(x), and 10(y), 1990 and 1988, respectively, Form 10-K of New England Electric System, File No. 001-03446)
10.3 Transmission Operating Agreement between the Initial Participating Transmission Owners, Additional Participating
Transmission Owners and ISO New England, Inc. dated as of February 1, 2005 (Exhibit 10.29, 2004 NU Form 10-K filed March 17, 2005, File No. 001-05324)
10.3.1 Rate Design and Funds Disbursement Agreement among the Initial Participating Transmission Owners,
Additional Participating Transmission Owners and ISO New England, Inc., effective June 30, 2006 (Exhibit 10.22.1, 2006 NU Form 10-K filed March 1, 2007, File No. 001-05324)
10.4 Northeast Utilities Service Company Transmission and Ancillary Service Wholesale Revenue Allocation Methodology
among The Connecticut Light and Power Company, Western Massachusetts Electric Company, Public Service Company of New Hampshire, Holyoke Water Power Company and Holyoke Power and Electric Company Trustee dated as of January 1, 2008 (Exhibit 10.1, NU Form 10-Q for the Quarter Ended March 31, 2008 filed May 9, 2008, File No. 001-05324)
+10.5 Amended and Restated Employment Agreement with Charles W. Shivery, effective January 1, 2009 (Exhibit 10.6,
2008 NU Form 10-K filed February 27, 2009, File No. 001-05324)
+10.6 Amended and Restated Employment Agreement with Gregory B. Butler, effective January 1, 2009 (Exhibit 10.7, 2008 NU Form 10-K filed February 27, 2009, File No. 001-05324)
+10.7 Amended and Restated Employment Agreement with David R. McHale, effective January 1, 2009 (Exhibit 10.8, 2008
NU Form 10-K filed February 27, 2009, File No. 001-05324)
+10.8 Amended and Restated Agreement between Northeast Utilities and Leon J. Olivier, effective January 1, 2009 (Exhibit 10.9, 2008 NU Form 10-K filed February 27, 2009, File No. 001-05324)
+10.9 Amended and Restated Incentive Plan Effective January 1, 2009 (Exhibit 10.3, NU Form 10-Q for the Quarter Ended
September 30, 2008 filed November 10, 2008, File No. 001-05324)
+10.10 Amended and Restated Supplemental Executive Retirement Plan for Officers of Northeast Utilities System Company effective January 1, 2009 (Exhibit 10.5, NU Form 10-Q for the Quarter Ended September 30, 2008 filed November 10, 2008, File No. 001-05324)
+10.11 Trust under Supplemental Executive Retirement Plan dated May 2, 1994 (Exhibit 10.33, 2002 NU Form 10-K filed
March 21, 2003, File No. 001-05324)
+10.11.1 First Amendment to Trust Under Supplemental Executive Retirement Plan, effective as of December 10, 2002 (Exhibit 10(B) 10.19.1, 2003 NU Form 10-K filed March 12, 2004, File No. 001-05324)
+10.11.2 Second Amendment to Trust Under Supplemental Executive Retirement, effective as of November 12,
2008 (Exhibit 10.12.2, 2008 NU Form 10-K filed February 27, 2009, File No. 001-05324)
+10.12 Special Severance Program for Officers of NU System Companies as of January 1, 2009, (Exhibit 10.2, NU Form 10-Q for the Quarter Ended September 30, 2008 filed November 10, 2008, File No. 001-05324)
+10.13 Amended and Restated Northeast Utilities Deferred Compensation Plan for Executives as of January 1, 2009 (Exhibit
10.4 NU Form 10-Q for Quarter Ended September 30, 2008 filed November 10, 2008, File No. 001-05324)
+10.14 Agreement with James B. Robb effective October 15, 2009 (Exhibit 10.14 2009 NU Form 10-K filed February 26, 2010, File No. 001-05324)
+10.15 Northeast Utilities Retention Agreement (Exhibit 10.1, NU Registration Statement on Form S-4, filed November 22,
2010, File No. 333-170754)

E-7
10.16 Northeast Utilities System's Second Amended and Restated Tax Allocation Agreement dated as of September 21, 2005 (Exhibit D.4 to Amendment No. 1 to U5S Annual Report for the year ended December 31, 2004, filed September 30, 2005, File No. 001-05324)
(C) NU and CL&P
10.1 CL&P Transition Property Purchase and Sale Agreement between CL&P Funding LLC and CL&P, dated as of March 30, 2001 (Exhibit 10.55, 2001 CL&P Form 10-K filed March 22 2002, File No. 000-00404)
10.2 CL&P Transition Property Servicing Agreement between CL&P Funding LLC and CL&P, dated as of March 30, 2001
(Exhibit 10.56, 2001 CL&P Form 10-K filed March 22, 2002, File No. 000-00404) 10.3 CL&P Agreement Re: Connecticut NEEWS Projects by and between CL&P and The United Illuminating Company
dated July 14, 2010 (Exhibit 10, CL&P Form 10-Q, for the Quarter Ended June 30, 2010 filed on August 6, 2010, File No. 000-00404)
*10.4 Purchase and Sale Agreement by and between The Connecticut Light & Power Company, as Seller and Connecticut
Transmission Municipal Electric Energy Cooperative, as Buyer dated December 16, 2010
(D) NU and PSNH
10.1 PSNH Purchase and Sale Agreement with PSNH Funding LLC dated as of April 25, 2001 (Exhibit 10.57, 2001 PSNH Form 10-K filed March 22, 2002, File No. 001-06392)
10.2 PSNH Servicing Agreement with PSNH Funding LLC dated as of April 25, 2001 (Exhibit 10.58, 2001 PSNH Form
10-K filed March 22, 2002, File No. 001-06392)
(E) NU and WMECO
10.1 Lease and Agreement by and between WMECO and Bank of New England, N.A., with BNE Realty Leasing Corporation of North Carolina dated as of December 15, 1988 (Exhibit 10.63, 1988 NU Form 10-K, File No. 001-05324)
10.2 WMECO Transition Property Purchase and Sale Agreement between WMECO Funding LLC and WMECO, dated as
of May 17, 2001 (Exhibit 10.61, 2001 WMECO Form 10-K filed March 22, 2002, File No. 000-07624) 10.3 WMECO Transition Property Servicing Agreement between WMECO Funding LLC and WMECO, dated as of
May 17, 2001 (Exhibit 10.62, 2001 WMECO Form 10-K filed March 22, 2002, File No. 000-07624)
*12 Ratio of Earnings to Fixed Charges
(A) Northeast Utilities (B) The Connecticut Light and Power Company
(C) Public Service Company of New Hampshire
(D) Western Massachusetts Electric Company *21 Subsidiaries of the Registrant *23 Consent of Independent Registered Public Accounting Firm
23.1 Deloitte & Touche LLP 23.2 PricewaterhouseCoopers LLP
*31 Rule 13a – 14(a)/15 d – 14(a) Certifications
E-8
(A) Northeast Utilities
31 Certification of Charles W. Shivery, Chairman, President and Chief Executive Officer of NU required by Rule 13a – 14(a)/15d – 14(a) of the Securities Exchange Act of 1934, as amended, as adopted pursuant to Section 302 of the Sarbanes-Oxley Act of 2002, dated February 25, 2011
31.1 Certification of David R. McHale, Executive Vice President and Chief Financial Officer of NU required by Rule 13a –
14(a)/15d – 14(a) of the Securities Exchange Act of 1934, as amended, as adopted pursuant to Section 302 of the Sarbanes-Oxley Act of 2002, dated February 25, 2011
(B) The Connecticut Light and Power Company
31. Certification of Leon J. Olivier, Chief Executive Officer of CL&P required by Rule 13a – 14(a)/15d – 14(a) of the Securities Exchange Act of 1934, as amended, as adopted pursuant to Section 302 of the Sarbanes-Oxley Act of 2002, dated February 25, 2011
31.1 Certification of David R. McHale, Executive Vice President and Chief Financial Officer of CL&P required by Rule 13a
– 14(a)/15d – 14(a) of the Securities Exchange Act of 1934, as amended, as adopted pursuant to Section 302 of the Sarbanes-Oxley Act of 2002, dated February 25, 2011
(C) Public Service Company of New Hampshire
31. Certification of Leon J. Olivier, Chief Executive Officer of PSNH required by Rule 13a – 14(a)/15d – 14(a) of the Securities Exchange Act of 1934, as amended, as adopted pursuant to Section 302 of the Sarbanes-Oxley Act of 2002, dated February 25, 2011
31.1 Certification of David R. McHale, Executive Vice President and Chief Financial Officer of PSNH required by Rule 13a
– 14(a)/15d – 14(a) of the Securities Exchange Act of 1934, as amended, as adopted pursuant to Section 302 of the Sarbanes-Oxley Act of 2002, dated February 25, 2011
(D) Western Massachusetts Electric Company
31 Certification of Leon J. Olivier, Chief Executive Officer of WMECO required by Rule 13a – 14(a)/15d – 14(a) of the Securities Exchange Act of 1934, as amended, as adopted pursuant to Section 302 of the Sarbanes-Oxley Act of 2002, dated February 25, 2011
31.1 Certification of David R. McHale, Executive Vice President and Chief Financial Officer of WMECO required by Rule
13a – 14(a)/15d – 14(a) of the Securities Exchange Act of 1934, as amended, as adopted pursuant to Section 302 of the Sarbanes-Oxley Act of 2002, dated February 25, 2011
*32 18 U.S.C. Section 1350 Certifications (A) Northeast Utilities
32 Certification of Charles W. Shivery, Chairman, President and Chief Executive Officer of Northeast Utilities and David R. McHale, Executive Vice President and Chief Financial Officer of Northeast Utilities, pursuant to 18 U.S.C. Section 1350 as adopted pursuant to Section 906 of the Sarbanes-Oxley Act of 2002, dated February 25, 2011
(B) The Connecticut Light and Power Company
32 Certification of Leon J. Olivier, Chief Executive Officer of The Connecticut Light and Power Company and David R. McHale, Executive Vice President and Chief Financial Officer of The Connecticut Light and Power Company, pursuant to 18 U.S.C. Section 1350 as adopted pursuant to Section 906 of the Sarbanes-Oxley Act of 2002, dated February 25, 2011
(C) Public Service Company of New Hampshire
32 Certification of Leon J. Olivier, Chief Executive Officer of Public Service Company of New Hampshire and David R. McHale, Executive Vice President and Chief Financial Officer of Public Service Company of New Hampshire, pursuant to 18 U.S.C. Section 1350 as adopted pursuant to Section 906 of the Sarbanes-Oxley Act of 2002, dated February 25, 2011

E-9
(D) Western Massachusetts Electric Company
32 Certification of Leon J. Olivier, Chief Executive Officer of Western Massachusetts Electric Company and David R. McHale, Executive Vice President and Chief Financial Officer of Western Massachusetts Electric Company, pursuant to 18 U.S.C. Section 1350 as adopted pursuant to Section 906 of the Sarbanes-Oxley Act of 2002, dated February 25, 2011
*101.INS XBRL Instance Document *101.SCH XBRL Taxonomy Extension Schema *101.CAL XBRL Taxonomy Extension Calculation *101.DEF XBRL Taxonomy Extension Definition *101.LAB XBRL Taxonomy Extension Labels *101.PRE XBRL Taxonomy Extension Presentation
Northeast Utilities is committed to sustainability and protecting the environment. In conducting our business, we:
• maintain compliance with both the letter and spirit of environmental protection laws and our own procedures;
• demonstrate leadership by pursuing economically, socially and environmentally sustainable initiatives that protect the environment and are consistent with our corporate vision;
• ensure the accountability of employees and their openness with and responsiveness to co-workers, customers, shareholders and the public, by establishing specific objectives and measurable targets that promote continuous improvement and by reporting our environmental performance; and
• practice stewardship by managing our operations with genuine care and by working to reduce or eliminate significant environmental impacts and prevent pollution resulting from our activities.
Our 2010 Annual Report is another example of our efforts to continue to provide you with important information about the company while reducing costs and environmental impacts.
This year’s Annual Report is printed on recycled paper manufactured with windpower using 100 percent and 10 percent post-consumer waste with soy-based inks. The Forest Stewardship Council (FSC) is an international certification and labeling system for products that come from responsibly managed forests and verified recycled sources. Under FSC certification, forests are certified against a set of strict environmental and social standards, and fibre from certified forests is tracked all the way to the consumer through the chain of custody certification system. This means forests, pulp providers, mills merchants and printers must all obtain FSC certification in order for a product to carry the FSC logo or label.
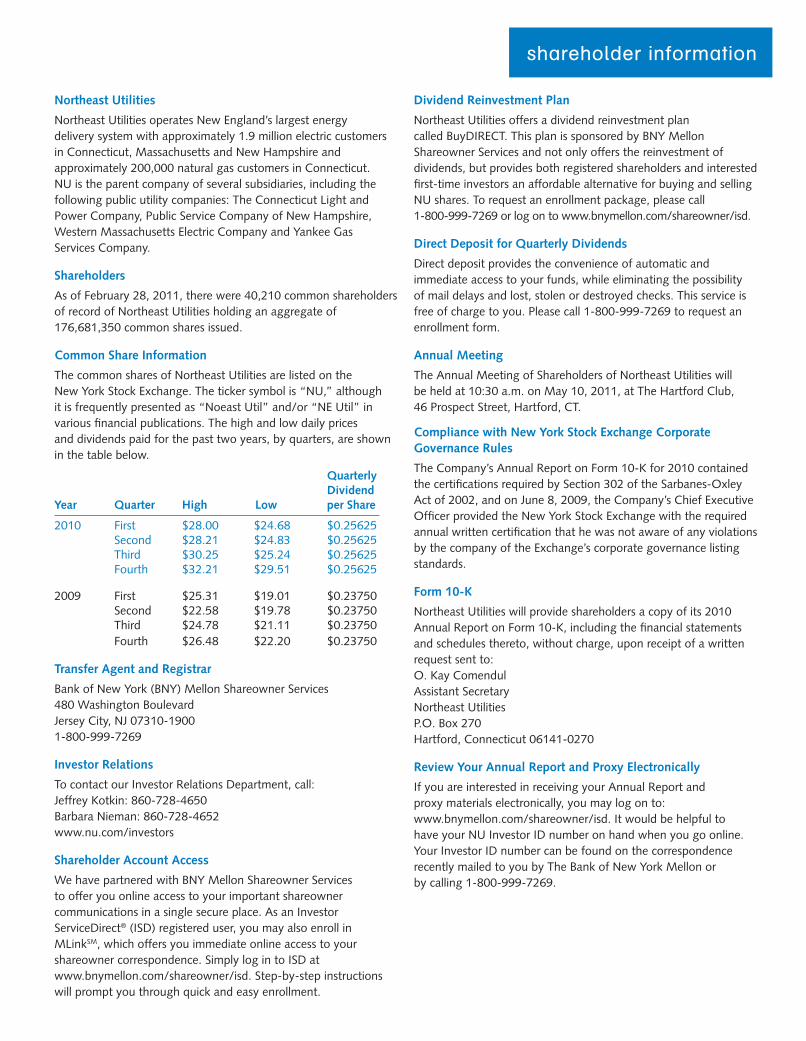
a legacy of leadership. a promise of growth.
TABLE OF CONTENTS
Financial Highlights 1
Chairman’s Message 2
Trustees and Officers 8
Form 10-K Special section
Shareholder Information Inside back cover
Since Northeast Utilities (NU) and its companies were founded, we have built an enduring legacy of delivering
reliable energy for our customers, leadership for our industry and value for our investors. We continue to build
on that legacy with our support of the efficient use of energy and new clean energy technologies as a foundation
for regional economic growth. With a steady hand dealing with today’s economic landscape and an eye to the
challenges that lie ahead, NU continued to deliver strong operational and financial performance in 2010. As
we turned the final pages of the 2010 calendar, we did more than just say goodbye to a year of significant
accomplishments for NU. We welcomed the start of a new era. We capped the year with an agreement to
merge with Boston-based NSTAR to ensure our position as New England’s leading regional energy company,
poised to better serve our customers by delivering on a promise of future growth.
Northeast Utilities
Northeast Utilities operates New England’s largest energy delivery system with approximately 1.9 million electric customers in Connecticut, Massachusetts and New Hampshire and approximately 200,000 natural gas customers in Connecticut. NU is the parent company of several subsidiaries, including the following public utility companies: The Connecticut Light and Power Company, Public Service Company of New Hampshire, Western Massachusetts Electric Company and Yankee Gas Services Company.
Shareholders
As of February 28, 2011, there were 40,210 common shareholders of record of Northeast Utilities holding an aggregate of 176,681,350 common shares issued.
Common Share Information
The common shares of Northeast Utilities are listed on the New York Stock Exchange. The ticker symbol is “NU,” although it is frequently presented as “Noeast Util” and/or “NE Util” in various financial publications. The high and low daily prices and dividends paid for the past two years, by quarters, are shown in the table below.
Quarterly Dividend Year Quarter High Low per Share
2010 First $28.00 $24.68 $0.25625 Second $28.21 $24.83 $0.25625 Third $30.25 $25.24 $0.25625 Fourth $32.21 $29.51 $0.25625
2009 First $25.31 $19.01 $0.23750 Second $22.58 $19.78 $0.23750 Third $24.78 $21.11 $0.23750 Fourth $26.48 $22.20 $0.23750
Transfer Agent and Registrar
Bank of New York (BNY) Mellon Shareowner Services 480 Washington Boulevard Jersey City, NJ 07310-1900 1-800-999-7269
Investor Relations
To contact our Investor Relations Department, call: Jeffrey Kotkin: 860-728-4650 Barbara Nieman: 860-728-4652 www.nu.com/investors
Shareholder Account Access
We have partnered with BNY Mellon Shareowner Services to offer you online access to your important shareowner communications in a single secure place. As an Investor ServiceDirect® (ISD) registered user, you may also enroll in MLinkSM, which offers you immediate online access to your shareowner correspondence. Simply log in to ISD at www.bnymellon.com/shareowner/isd. Step-by-step instructions will prompt you through quick and easy enrollment.
Dividend Reinvestment Plan
Northeast Utilities offers a dividend reinvestment plan called BuyDIRECT. This plan is sponsored by BNY Mellon Shareowner Services and not only offers the reinvestment of dividends, but provides both registered shareholders and interested first-time investors an affordable alternative for buying and selling NU shares. To request an enrollment package, please call 1-800-999-7269 or log on to www.bnymellon.com/shareowner/isd.
Direct Deposit for Quarterly Dividends
Direct deposit provides the convenience of automatic and immediate access to your funds, while eliminating the possibility of mail delays and lost, stolen or destroyed checks. This service is free of charge to you. Please call 1-800-999-7269 to request an enrollment form.
Annual Meeting
The Annual Meeting of Shareholders of Northeast Utilities will be held at 10:30 a.m. on May 10, 2011, at The Hartford Club, 46 Prospect Street, Hartford, CT.
Compliance with New York Stock Exchange Corporate Governance Rules
The Company’s Annual Report on Form 10-K for 2010 contained the certifications required by Section 302 of the Sarbanes-Oxley Act of 2002, and on June 8, 2009, the Company’s Chief Executive Officer provided the New York Stock Exchange with the required annual written certification that he was not aware of any violations by the company of the Exchange’s corporate governance listing standards.
Form 10-K
Northeast Utilities will provide shareholders a copy of its 2010 Annual Report on Form 10-K, including the financial statements and schedules thereto, without charge, upon receipt of a written request sent to: O. Kay Comendul Assistant Secretary Northeast Utilities P.O. Box 270 Hartford, Connecticut 06141-0270
Review Your Annual Report and Proxy Electronically
If you are interested in receiving your Annual Report and proxy materials electronically, you may log on to: www.bnymellon.com/shareowner/isd. It would be helpful to have your NU Investor ID number on hand when you go online. Your Investor ID number can be found on the correspondence recently mailed to you by The Bank of New York Mellon or by calling 1-800-999-7269.
shareholder information

P.O. Box 270 Hartford, Connecticut 06141-0270 1-800-286-5000
www.nu.com
2 0 1 0 A N N U A L R E P O R T
a legacy of leadership. a promise of growth.
NO
RT
HEA
ST U
TILIT
IES | 20
10
AN
NU
AL R
EPO
RT