
A Large Scale Genetic analysis of c-Myc-regulated Gene Expression Patterns Gene Expression Network...
44
A Large Scale Genetic analysis of c-Myc- regulated Gene Expression Patterns Gene Expression Network Dynamics by Tomer Galon
-
date post
19-Dec-2015 -
Category
Documents
-
view
218 -
download
2
Transcript of A Large Scale Genetic analysis of c-Myc-regulated Gene Expression Patterns Gene Expression Network...
A Large Scale Genetic analysis of c-Myc-regulated Gene Expression Patterns
Gene Expression Network Dynamics
by Tomer Galon
A Large Scale Genetic Analysis of c-Myc-regulated Gene Expression Patterns– Brenda C. O’Connell, Ann F. Cheung,
Carl P. Simkevich, Wanny Tam, Xiaojia Ren,Maria K. Mateyak, and John M. Sedivy
Department of Molecular Biology, Cell Biology, and Biochemistry, Brown University,

Protein Production

Myc - Protein
Mycc-myc, N-myc, L-myc
Transcriptional regulators
Human malignancies
Proto-Oncogenes
Not well understood

Myc - Review
• Myc is a weak transcriptional regulator• High Myc levels are found in tumor cells
harms cell division and cell
growth
Promotes proliferation &
growth.
protection against apoptotic processes
harms cell cycle withdrawal & differentiation
c-myc
• One of the Myc gene family.
• Sedivy and his team succeeded in creating:– c-myc -/- null rat fibroblast cells. (HO)
c-myc null cells had a slow cell cycle.– Conditionally active c-myc cells. (MycER)
(using Tamoxifen, a specific c-myc estrogen receptor)

About the experiments
• Goal: to create a biological system for profiling Myc target genes.
• Conditions:– Constant conditions of cell lines which
promised balanced steady state of growth.– All of the experiments were performed on
three different independent occasions.
Experiment 1
• Revealing the total number of genes that respond to loss of c-myc
• Cells used:– c-myc +/+ (TGR) - wild type cells– c-myc -/- (HO) - not producing c-myc– c-myc transgened cells (HOmyc3) -
• over-expressing c-myc protein at 3-4 times the level in TGR cells.

Experiment 1
• Total RNA was extracted out of the exponential growth cell lines.
• Each of the corresponding RNAs was hybridized to the three available Affymetrix rat GeneChips (U34A, U34B, U34C)
• 9 total samples (3 replicates)• Pairwise comparison between
cell lines were made usingStudent’s t-test (p<0.05)

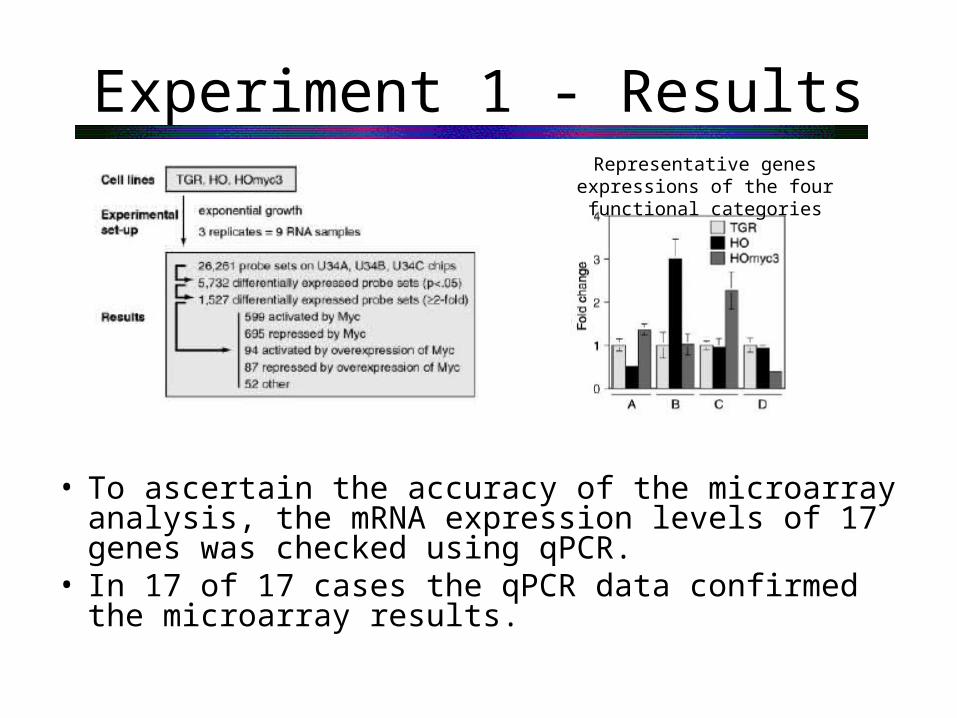
Experiment 1 - Results
• 5,732 probe sets displayed statistically significant differences (p<=0.05) between TGR and HO cells and between HO and HOmyc3 cells.
• Adopting an expression differential cutoff of 2-fold between the means of TGR and HO and HO and HOmyc3 reduces the number of probe sets to 1,527.
)(
)()(
ix
ixir
U
I
Fold change ratio

Experiment 1 - Results
• Probe sets were grouped into 4 categories– HO vs TGR & HO vs HOmyc3 using 2fold– 599 (39%) activated by Myc– 695 (46%) repressed by Myc– 94 (6%) activated by overexpression of Myc– 87 (6%) repressed by overexpression of Myc
• The remaining 52 probe sets (3%) exhibited patterns of
expression whose biological relevance to c-myc is not clear.
Experiment 1 - Results
• To ascertain the accuracy of the microarray analysis, the mRNA expression levels of 17 genes was checked using qPCR.
• In 17 of 17 cases the qPCR data confirmed the microarray results.
Representative genes expressions of the four functional categories
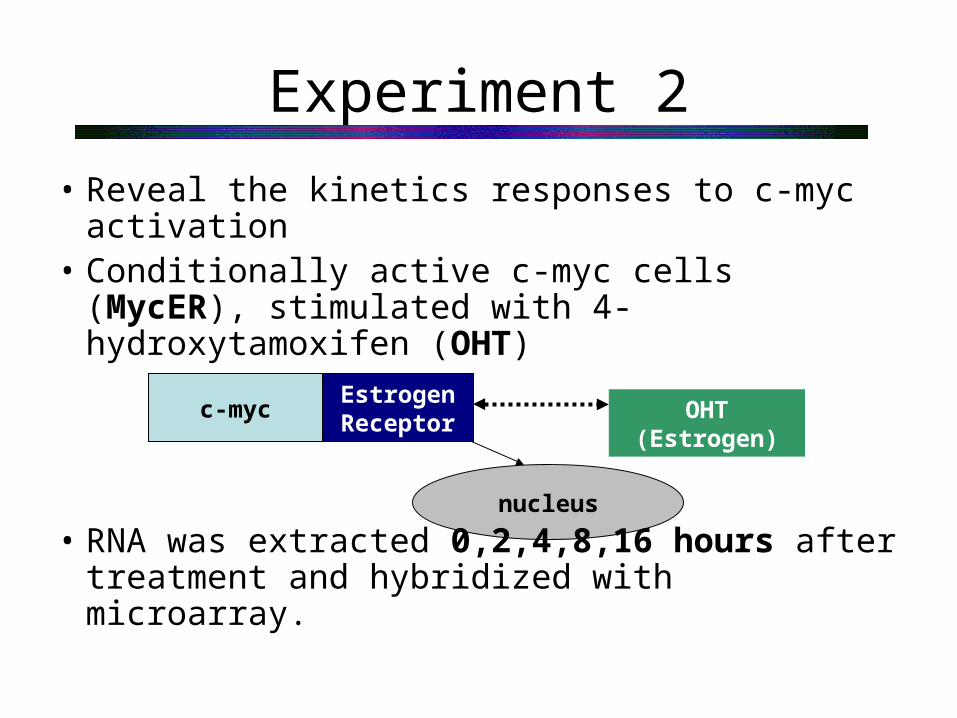
Experiment 2
• Reveal the kinetics responses to c-myc activation
• Conditionally active c-myc cells (MycER), stimulated with 4-hydroxytamoxifen (OHT)
• RNA was extracted 0,2,4,8,16 hours after treatment and hybridized with microarray.
c-mycEstrogen Receptor
OHT (Estrogen)
nucleusnucleus
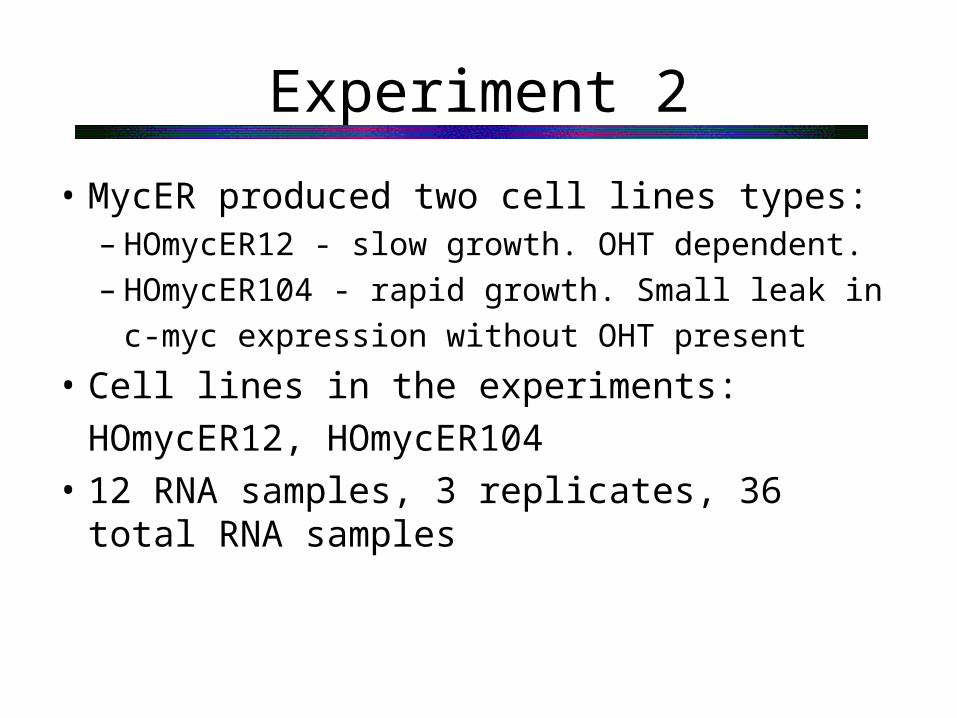
Experiment 2
• MycER produced two cell lines types:– HOmycER12 - slow growth. OHT dependent.– HOmycER104 - rapid growth. Small leak in
c-myc expression without OHT present
• Cell lines in the experiments:
HOmycER12, HOmycER104
• 12 RNA samples, 3 replicates, 36 total RNA samples
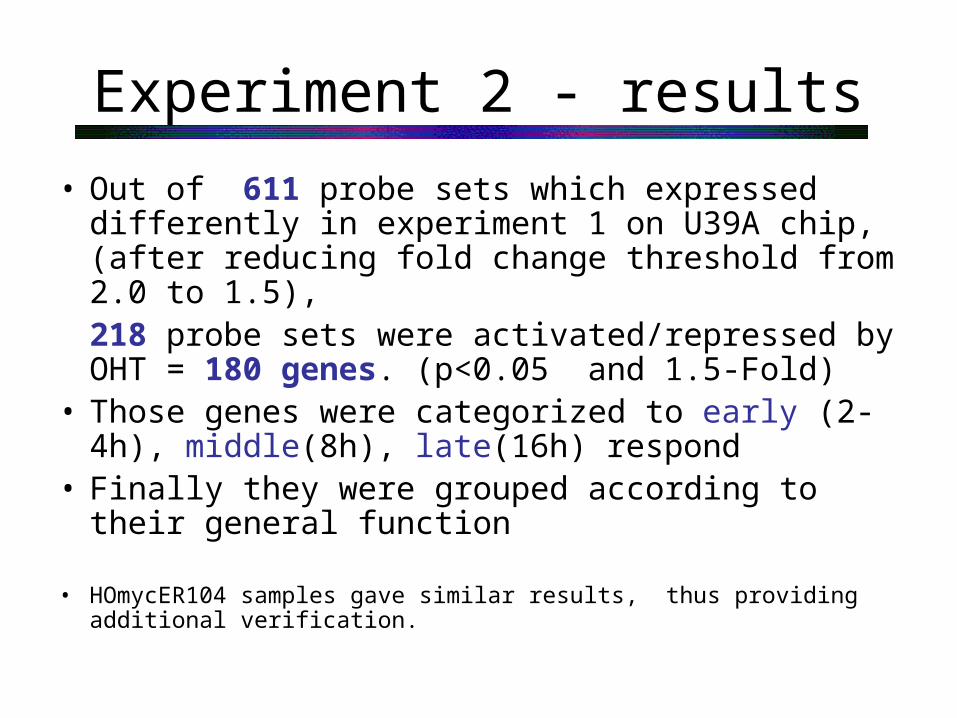
Experiment 2 - results
• Out of 611 probe sets which expressed differently in experiment 1 on U39A chip, (after reducing fold change threshold from 2.0 to 1.5),218 probe sets were activated/repressed by OHT = 180 genes. (p<0.05 and 1.5-Fold)
• Those genes were categorized to early (2-4h), middle(8h), late(16h) respond
• Finally they were grouped according to their general function
• HOmycER104 samples gave similar results, thus providing additional verification.
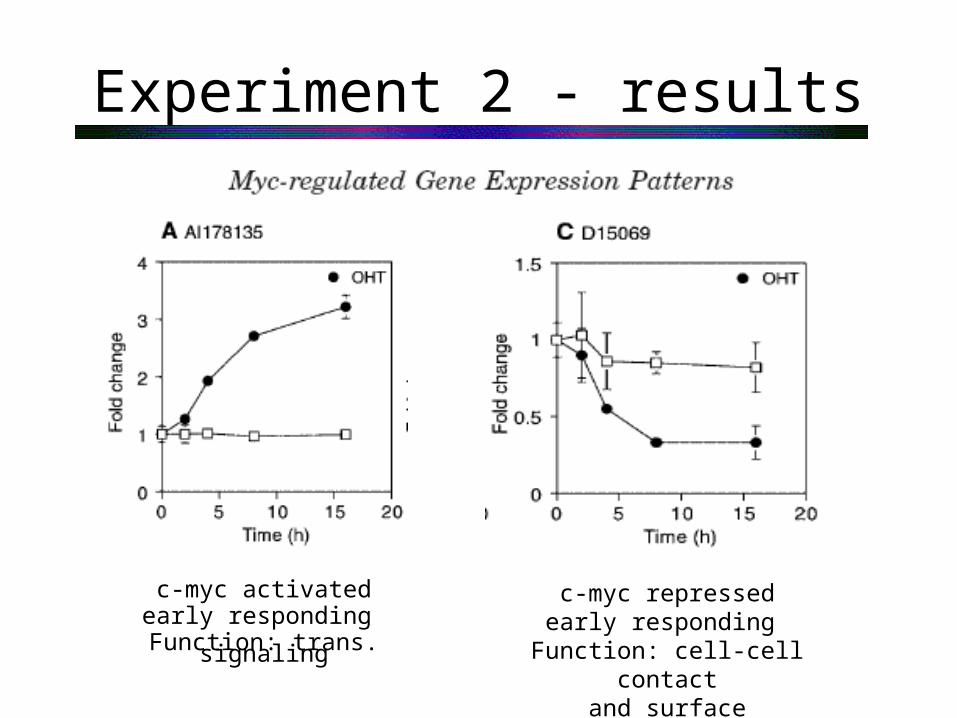
Experiment 2 - results
c-myc activated early responding
Function: trans. signaling
c-myc repressed early responding
Function: cell-cell contactand surface proteins
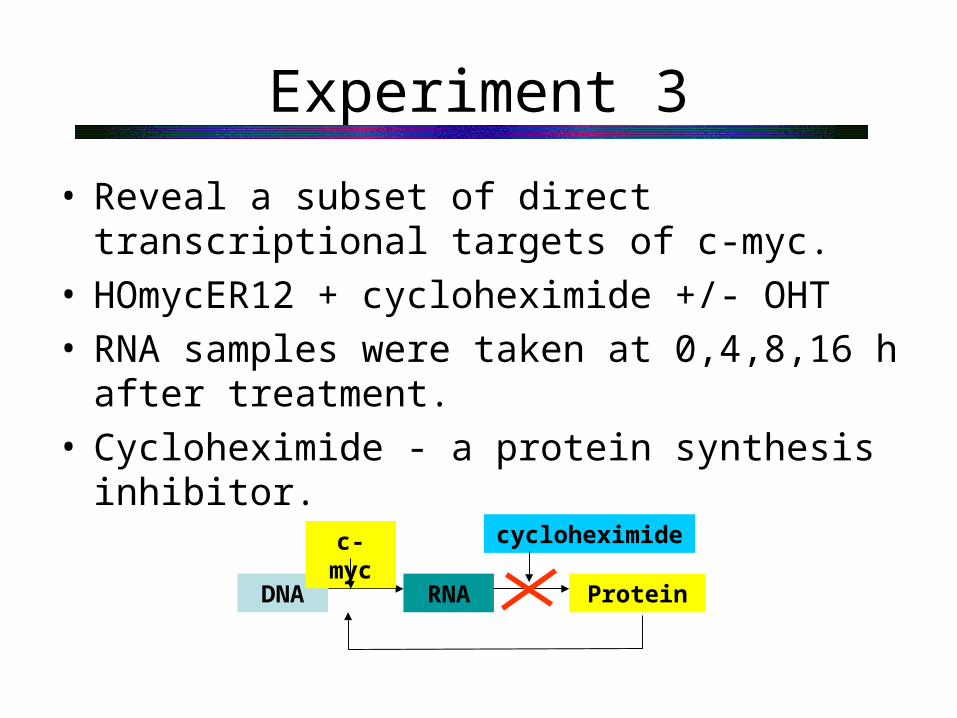
Experiment 3
• Reveal a subset of direct transcriptional targets of c-myc.
• HOmycER12 + cycloheximide +/- OHT• RNA samples were taken at 0,4,8,16 h after
treatment.• Cycloheximide - a protein synthesis inhibitor.
DNA RNA Protein
c-myc cycloheximide
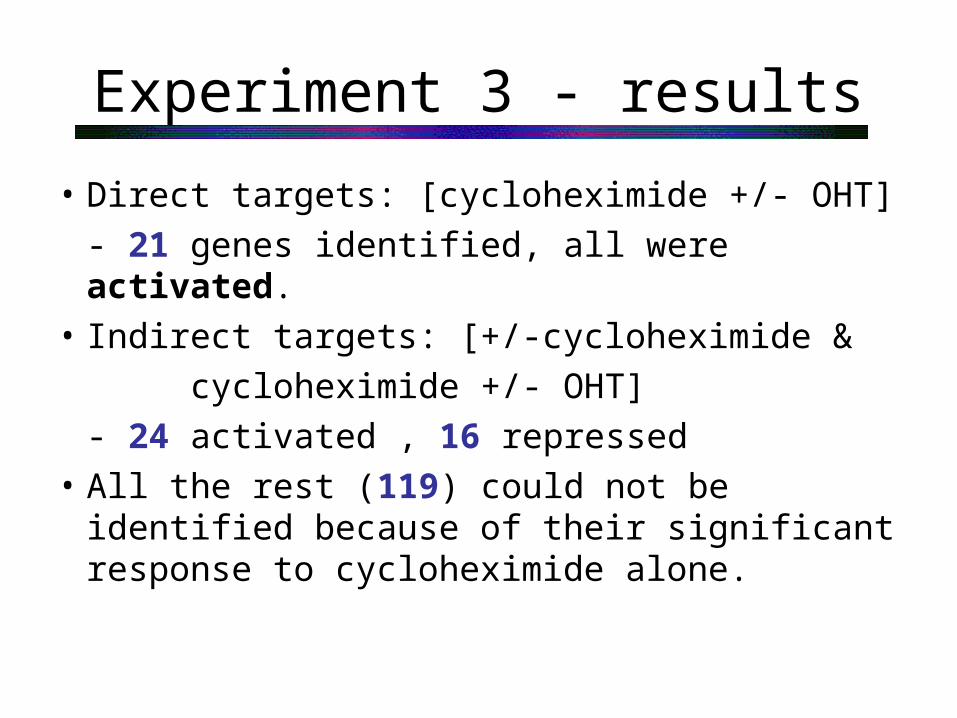
Experiment 3 - results
• Direct targets: [cycloheximide +/- OHT]
- 21 genes identified, all were activated.
• Indirect targets: [+/-cycloheximide &
cycloheximide +/- OHT]
- 24 activated , 16 repressed
• All the rest (119) could not be identified because of their significant response to cycloheximide alone.
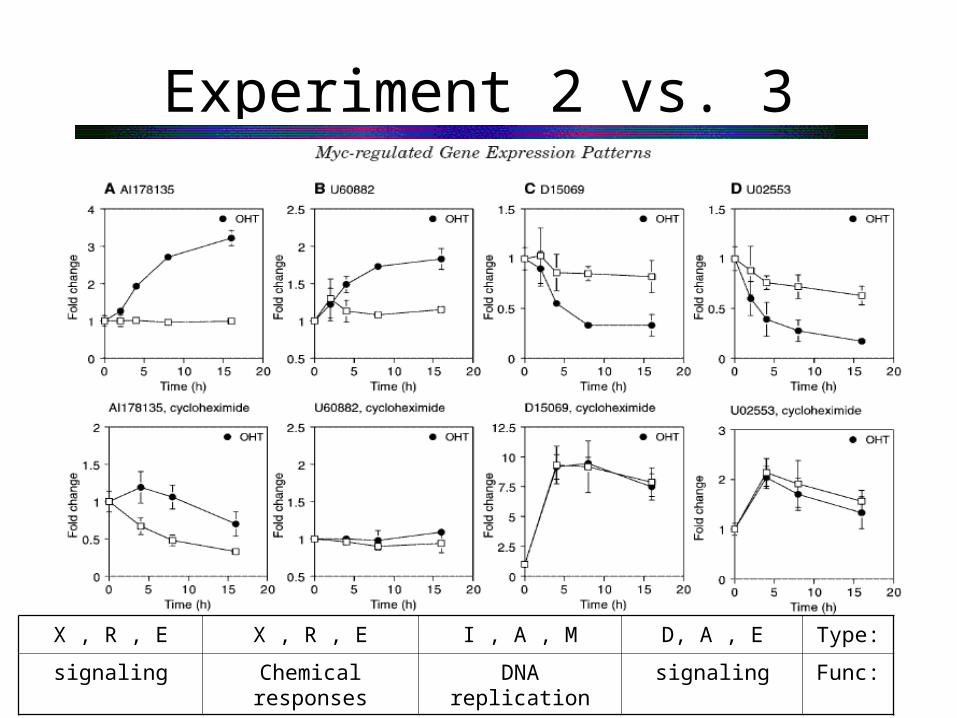
Experiment 2 vs. 3
Type:D, A , EI , A , MX , R , EX , R , E
Func:signalingDNA replicationChemical responsessignaling
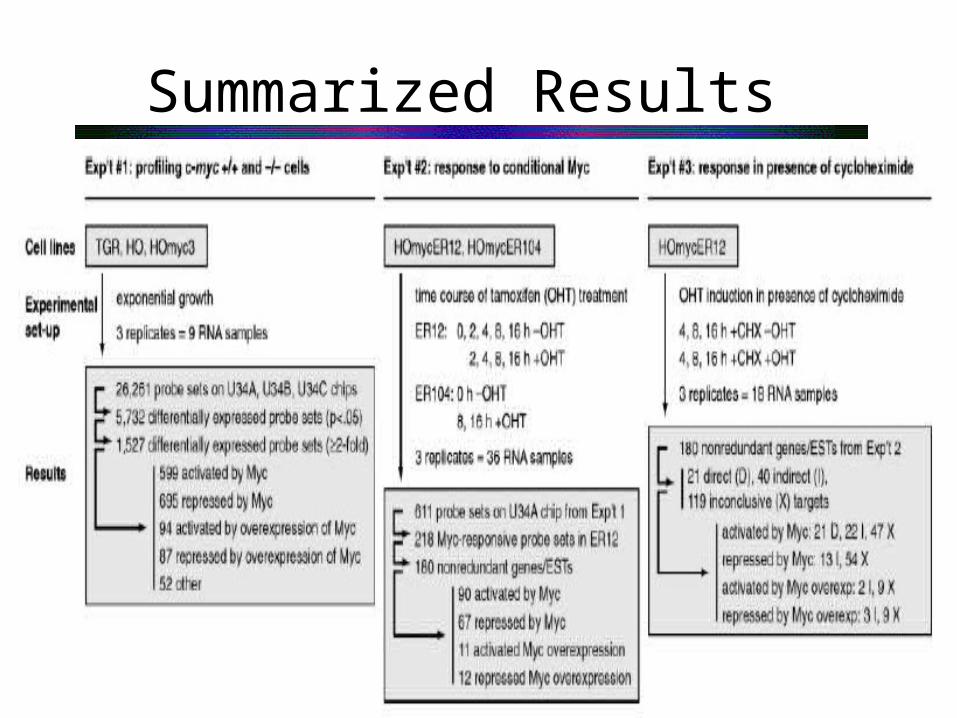
Summarized Results
Discussion
• The three Affymetrix GeneChips provide the most extensive coverage of the rat genome available (26,261 probe sets, 20,691 unique genes and expressed sequence tag clusters).
• They assume that Myc activates ~2400 genes in fibroblast cells.
• If the differential expression criterion is relaxed to statistical significance only, the Myc-responsive transcriptome becomes greater than 50% of all active genes.
Discussion
• The large number of Myc-responsive genes achieved is the result their ability to modulate Myc expression from almost zero to supraphysiological.
• 36% of differentially expressed probe sets
responded in the HOmycER12 cell line.
Possible explanation is that most of the Myc-activated genes are indirect and late.
Discussion
• Cycloheximide limited resolution due to short half-life of MycER and the effects of cycloheximide on gene expression.– No direct repressed genes found– Other proteins needed for Myc regulation
• Estimation of 247 direct gene targets in fibroblast cells.

Discussion
• The experiment might not represent the total spectrum of Myc-regulated genes– A gene may not be affected equally by Myc
under all growth conditions.– Cell cycle effects– Cell line - or cell type-specific effects– Some genes are detected poorly or not at all
by the current U34 probe sets
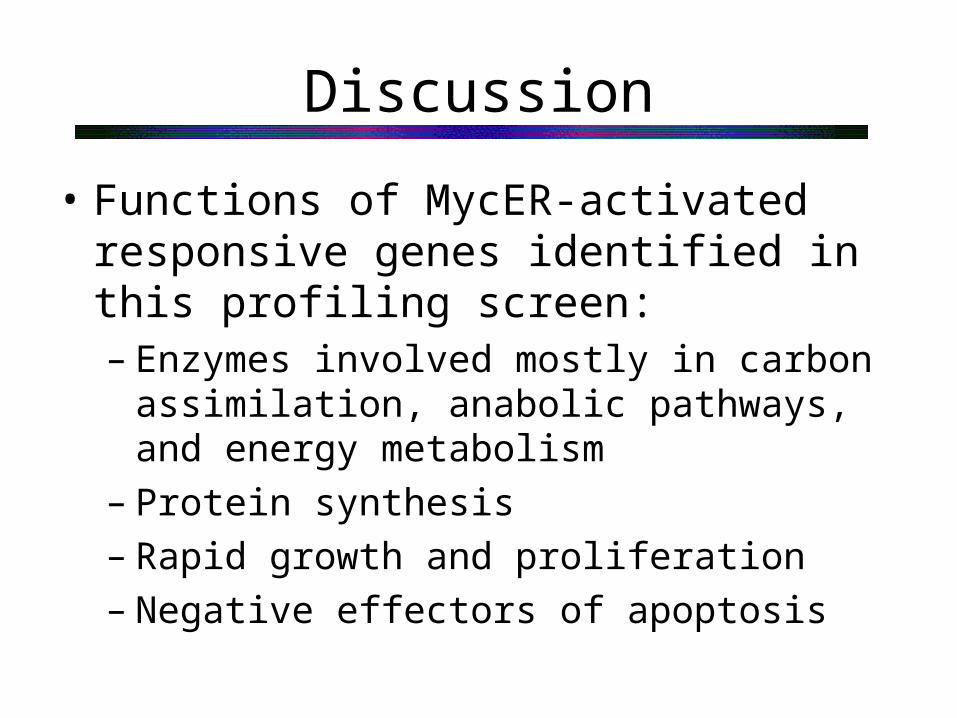
Discussion
• Functions of MycER-activated responsive genes identified in this profiling screen:– Enzymes involved mostly in carbon
assimilation, anabolic pathways, and energy metabolism
– Protein synthesis– Rapid growth and proliferation– Negative effectors of apoptosis

Discussion
• Myc-repressed genes are involved in the interaction and communication of cells with their external environment.
• This study revealed a number of new candidates for drug targets.
• Eliminates drugs side effects
• Experiments on Human tissues
Gene Expression Network Dynamics: from Microarray Data to Gene-Gene Connectivity reconstruction. Reconstruction of c-MYC proto-oncogene regulated genetic network
-G. C.Castellani, D.Remondini, N.Intrator, B. O’Connell,
JM Sedivy
Centro L.Galvani Biofisica Bioinformatica e Biocomplessità Università Bologna and Physics Department Bologna
Institute for Brain and Neural System Brown University Providence RI

One of the most recent theories that has been shown to havepromising applications in the Biological Sciences is the so called Theory of Complex Networks that have been applied to protein-proteininteraction and to metabolic network (Jeong and Barabasi)

Extension to Random Graph Theory
During the last several years, considerable efforts have been made to further analyze the statistics of Random Graphs.
The “Scale Free” network is created by two simple rules:Network growth and Preferential Attachment (the most connectednodes are the most probable sites of attachment)The model gives a non Poisson degree distribution: Power Law
kkP )( ck
kk
ekkkP)(
0
0
)()(
Moreover, this type of distribution was observed in real networks such asInternet, C.Elegans Brain, Methabolic Network with 2< < 3 exponent and various values for the exponential cutoff kc and k0

The John Sedivy Lab at Brown University has designed a new generation of microarrays that cover approximately one half of the whole rat genome (roughly 9000 genes). The array construction aims at obtaining a precise targeting of the proto-oncogene c-MYC. This gene encodes for a transcriptional regulator that is correlated with a wide array of human malignancies, cellular growth and cell cycle progression.The data base is organized in 81 array obtained by hybridisation with a cell line of rat fibroblats.. These gene expression measurements were performed in triplicate for a better statistical significance. The complete data set is divided into three separate experiments; each of which addresses a specific problem;. Experiment 1: Comparison of different cell lines where c-myc is expressed at various degrees (null, moderate, over-expressed). This experiment can reveal the total number of genes that respond to a sustained loss of c-Myc as well as those genes that respond to c-MYC over-expression. Experiment 2: Analysis of those cell-lines that over-express c-Myc following stimulation with Tamoxifen (a drug that has been used to treat both advanced and early stages of breast cancer). This data was collected during a 16 our time course. This experiment reveals the kinetics of the response to Myc activation and may lead to the identification of the early- responding genes. Experiment 3: Analysis of the time course of induction with Tamoxifen when it was performed in the presence of Cycloheximide (a protein synthesis inhibitor). This experiment reveals a subset of direct transcriptional targets of c-Myc.
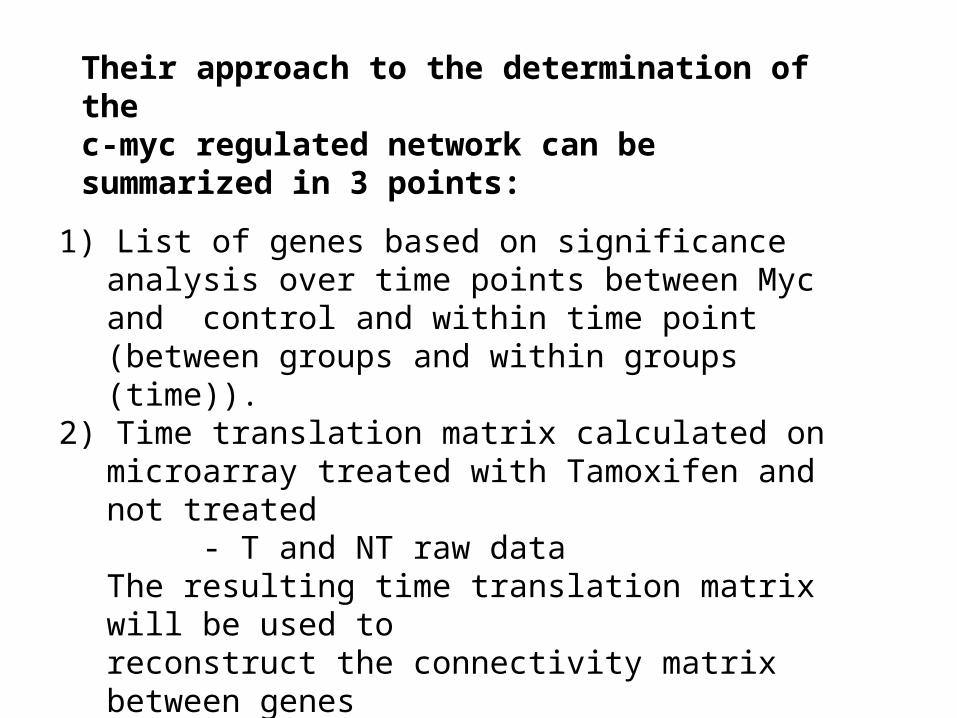
Their approach to the determination of the c-myc regulated network can be summarized in 3 points:
1) List of genes based on significance analysis over time points between Myc and control and within time point (between groups and within groups (time)).
2) Time translation matrix calculated on microarray treated with Tamoxifen and not treated
- T and NT raw dataThe resulting time translation matrix will be used to reconstruct the connectivity matrix between genes
3) Model validation for determination of the error model
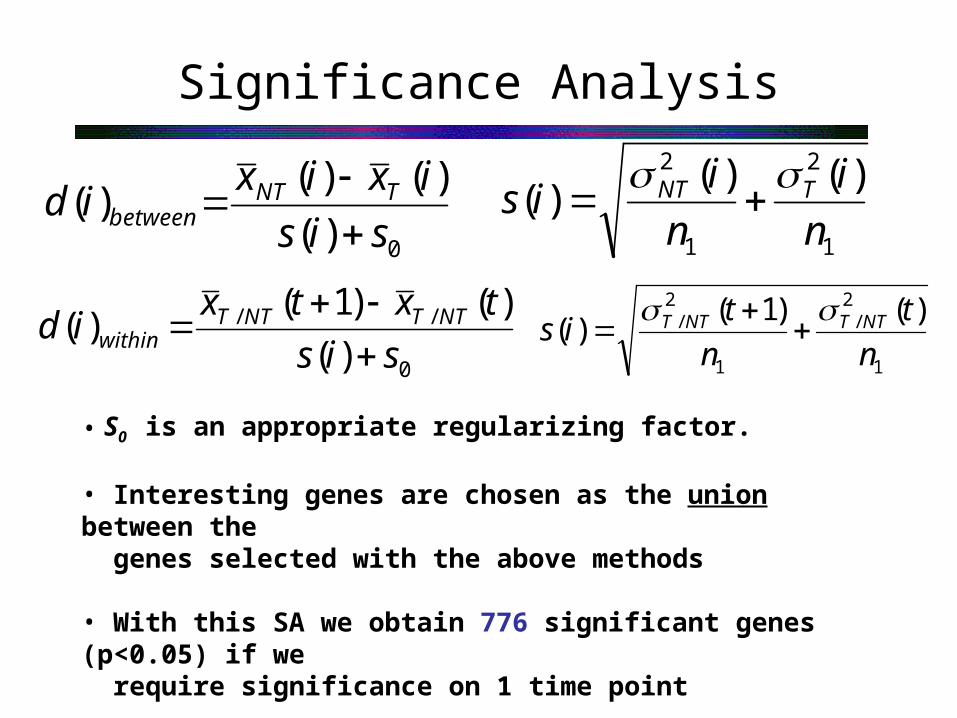
• S0 is an appropriate regularizing factor.
• Interesting genes are chosen as the union between the genes selected with the above methods
• With this SA we obtain 776 significant genes (p<0.05) if we require significance on 1 time point
0)(
)()()(
sis
ixixid TNTbetween
1
2
1
2 )()()(
n
i
n
iis TNT
0
//
)(
)()1()(
sis
txtxid NTTNTTwithin
1
2/
1
2/ )()1(
)(n
t
n
tis NTTNTT
Significance Analysis

The selected genes are used for step 2 of the analysis:
The x(t) are the gene expressions at time t and A is the unknown linear transformation matrix that we estimate from time course (0,2,4,8,16) of microarray data(T and NT separately, An and At).This is a so called inverse problem because the matrix is recovered from time dependent data.
-> From appropriate thresholding on A’s we can recover the connectivity matrix between the genes.
)1()( tAxtx
Step 2: Linear “Markov” Model

Network Topology
No Tamoxifen With Tamoxifen
Changing Databases
In order to have a better understanding of the
results, both in terms of network topology and
connectivity distribution, we generated 2
databases:
1) One small database with those genes that
were without any doubt affected by Tamoxifen
(50 genes)
2) One larger database with all the genes that
give 2 P on 3 experiments i.e. those genes for
which we have good measurements (3444
genes)
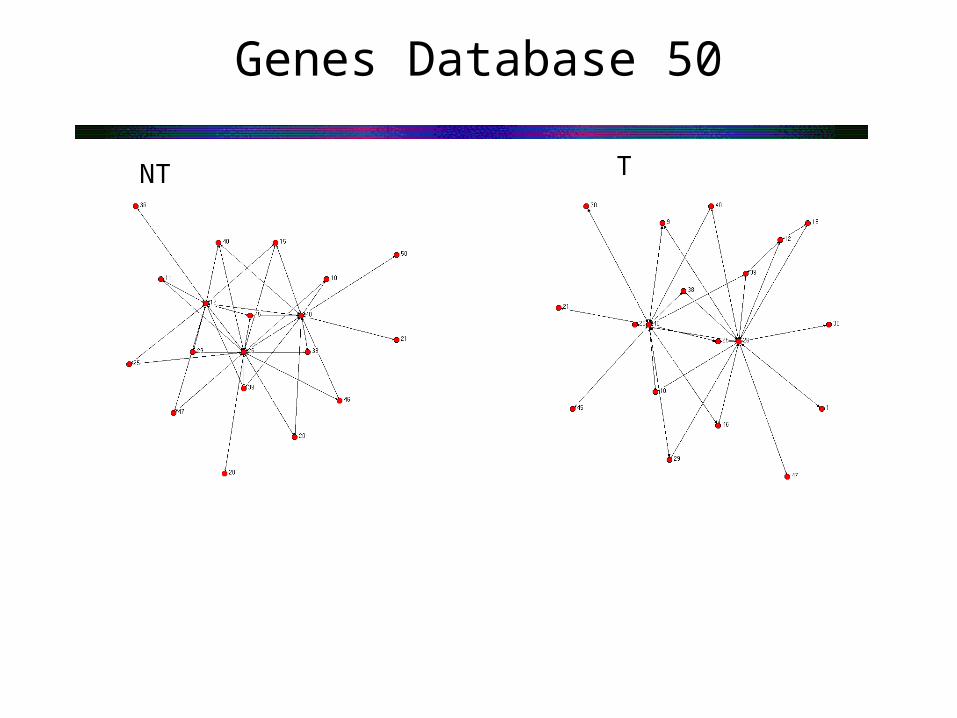
50 Genes Database
NT T

Results
For each of the 50 genes, they computed the
connectivity and the clustering coefficient that
express if the gene is connected to highly
connected or poorly connected genes.
It is possible to see that the treatment with
Tamoxifen causes a decrease in clustering in
the network so it seems that the network
becomes “less scale free”. This is confirmed by
the network clustering coefficient:
N Overall graph clustering coefficient: 0.840
T Overall graph clustering coefficient: 0.241
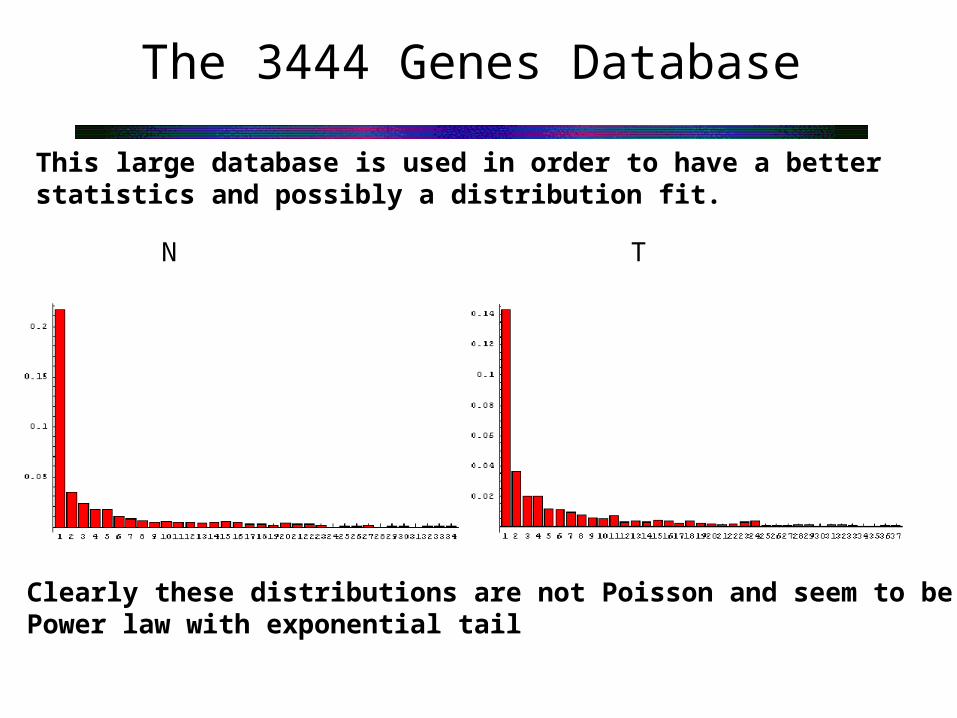
The 3444 Genes Database
This large database is used in order to have a better statistics and possibly a distribution fit.
N T
Clearly these distributions are not Poisson and seem to bePower law with exponential tail

Fitting the distributions
The distribution was fitted with a generalized power-law :
N T
ck
kk
ekkkP)(
0
0
)()(
3.266.304.10 ckk5.28.44.00 ckkN T
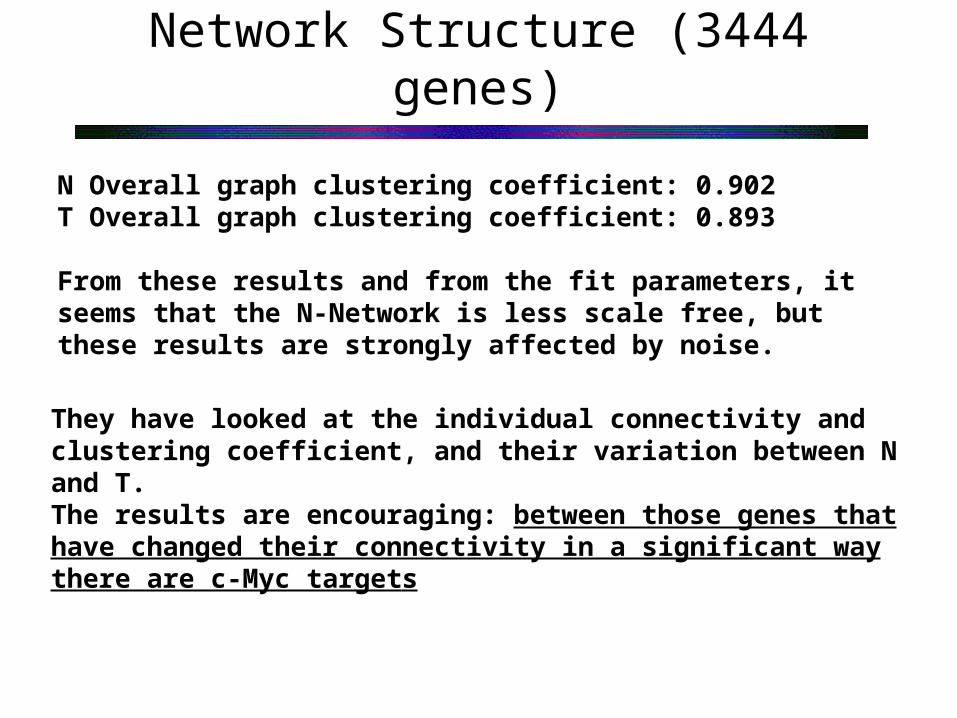
Network Structure (3444 genes)
N Overall graph clustering coefficient: 0.902T Overall graph clustering coefficient: 0.893
From these results and from the fit parameters, it seems that the N-Network is less scale free, but these results are strongly affected by noise.
They have looked at the individual connectivity and clustering coefficient, and their variation between N and T.The results are encouraging: between those genes that have changed their connectivity in a significant way there are c-Myc targets

Network Structure (3444 genes)
As an example we report some connectivity change in C-Myc target genes:
2379 rc_AI178135_at complement component 1, q subcomponent binding protein 3 272 2796 U09256_at transketolase 13 39
2772 U02553cds_s_at protein tyrosine phosphatase, non-receptor type 16 133 146
390 D10853_at phosphoribosyl pyrophosphate Amidotransferase 0 7
933M58040_at transferrin receptor 1 27

Conclusions
This assay tested the hypothesis that a treatment with Tamoxifen in these engineered cells lead to c-Myc activation can be related to connectivity changes between genes.The results show that within the framework of scale free network there are changes in gene-gene connectivity.
The connectivity distributions of N and T are far from Poisson with parameters that are similar to those founded for other systems that account for scale free distribution with exponential tail.One clear result is that the global gene degree connectivity follows a power law distribution both with and without Tamoxifen. This result seems to point out that this type of behavior is very general.
Conclusions
Looking at individual gene connectivity or looking at a smaller database, we observe that there are significant changes induced by the treatment. As example the clustering coefficient changes and some c-Myc targets show connectivity and clustering coefficient changes.
These results need to be confirmed and further analyzed, but, at their knowledge this is the first attempt to monitor the network connectivity changes induced by c-Myc activation in comparison with a basal level.
Some points that need further analysis are the correlation between connectivity change and c-Myc target method . This is not a significance test it can only help to look gene activity as result of interactions between genes at the previous time step

References• O'Connell BC, Cheung AF, Simkevich CP, Tam W, Ren X, Mateyak MK, Sedivy JM. A large
scale genetic analysis of c-Myc-regulated gene expression patterns.
J Biol Chem. 2003 Apr 4;278(14):12563-73
• Gene expression Network dynamics: from microarray data to gene-gene connectivity reconstruction. Reconstruction of c-MYC proto-oncogene regulated genetic network.G. C.Castellani, D.Remondini, N.Intrator, B. O’Connell, JM Sedivy.Centro L.Galvani Biofisica Bioinformatica e Biocomplessità Università Bologna and Physics Department Bologna Institute for Brain and Neural System Brown University Providence RI
www.nettab.org/2003/docs/GastoneCastellani.ppt
• Biology of the Cell 3rd Edition. Bruce Alberts, Dennis Bray, Julian Lewis, Martin Raff, Keith Roberts, James D. Watson. Garland Publishing.
Many Thanks to Yael Galon


