
A Labview Based On Line Robotic Arm For Students' … LABVIEW -BASED ON-LINE ROBOTIC ARM FOR...
16
AC 2009-1179: A LABVIEW-BASED ON-LINE ROBOTIC ARM FOR STUDENTS' LABORATORY Olawale Akinwale, Obafemi Awolowo University, Ile-Ife, Nigeria Lawrence Kehinde, Texas Southern University Kayode P. Ayodele, Obafemi Awolowo University, Ile-Ife, Nigeria A. M. Jubril, Obafemi Awolowo University, Ile-Ife, Nigeria Olutola. P. Jonah, Obafemi Awolowo University, Ile-Ife, Nigeria Soji Ilori, Obafemi Awolowo University, Ile-Ife, Nigeria Xuemin Chen, Texas Southern University © American Society for Engineering Education, 2009 Page 14.39.1
Transcript of A Labview Based On Line Robotic Arm For Students' … LABVIEW -BASED ON-LINE ROBOTIC ARM FOR...
AC 2009-1179: A LABVIEW-BASED ON-LINE ROBOTIC ARM FOR STUDENTS'LABORATORY
Olawale Akinwale, Obafemi Awolowo University, Ile-Ife, Nigeria
Lawrence Kehinde, Texas Southern University
Kayode P. Ayodele, Obafemi Awolowo University, Ile-Ife, Nigeria
A. M. Jubril, Obafemi Awolowo University, Ile-Ife, Nigeria
Olutola. P. Jonah, Obafemi Awolowo University, Ile-Ife, Nigeria
Soji Ilori, Obafemi Awolowo University, Ile-Ife, Nigeria
Xuemin Chen, Texas Southern University
© American Society for Engineering Education, 2009
Page 14.39.1

A LABVIEW-BASED ON-LINE ROBOTIC ARM FOR
STUDENTS’ LABORATORY
Abstract
In this paper, the development of robotic arm experiments using the i-Lab Interactive
Architecture is presented. Communication with the arm is done by using the RS-232 protocol.
The robotic arm used in the laboratory has five degrees of freedom, each degree of freedom
being controlled by a servomotor. The servomotors are controlled via pulse-width
modulation (PWM), the width of each pulse being indicative of the position to which motor
should move.
Three experiments are considered. The first experiment simply makes the robotic arm
available to the student for direct control by moving different sliders. Each slider controls a
motor. This would be the preliminary task to students who are new to robotics, and would
familiarise them with the workings of the robotic arm. The second experiment demonstrates
the effect of gravity on a robotic arm at different data rates. The third experiment developed
entails requiring students to program the positions of each of the motors for each sequence
stage of robot movements. Students would draw up this movement to perform an instructor-
determined task. The instructor would require the students to, for example, pick an object
from one location and place the object in another location.
The RA-01 robotic arm made by Images SI Inc. is used for these experiments and LabVIEW is
used to create the laboratory clients and experiment engines. A visual feedback from the lab
to the client is provided via a webcam.
I. Introduction
The field of robotics is largely unexplored by the underdeveloped and the developing
countries. Few universities undergo course work in robotics and even fewer have labs for
robotics. Yet, the field of robotics stands as one of the most promising of the future. The
world is gearing up for the next level of automation where every device would be smart and
able to do lots of things on their own without human input. The field of robotics holds front
lines in these research areas with unmanned missions, explorations and excavations, home
servant robots, robot playing sports and several other fields. With a dearth of robotics in the
third world, the great brains in these parts of the world could be contributing more if only
knew how to.
This research work reported here was prompted by the lack of laboratories and lectures in the
field of robotics in the authors’ environment. This research work aims to set up an online
control engineering experimentation platform in the field of robotics. The aim was and is to
expand the set of online experiments in the Control Engineering field while introducing
newbies to robotics. The set of online experiments which this research work would put up are
based on a robotic arm.
Three experiments have been set up at the Obafemi Awolowo University by this research
effort. The experiments are:
1. A simple slider control experiment
2. An effect of gravity experiment
3. A trajectory planning experiment
Page 14.39.2

II. Review
A lot of work has been done in the development of online laboratories (or weblabs). Below is
an account of some of the developed labs in the field of Control Engineering.
At the University of Western Australia, a telerobot laboratory has been set up to enable
students to practice kinematics 1. An online temperature control laboratory has also been set
up 2. National Instrument’s LabVIEW was used to develop their experiment engines.
At the University of Siena, an “Automatic Control Telelab (ACT)” has been developed 3. In
this laboratory, the user is required to design a controller for the experiment using
MathWorks’s Simulink. Experiments include the position control and speed control of a dc
motor, level control and flow control of fluid in a tank, a magnetic levitation experiment, a
helicopter simulation and control of a Lego robot.
Böhne et al 4 reported the development of “Internet Assisted Laboratories (i-Labs)” in a
cooperation between the Stanford Center for Innovations in Learning and the Learning Lab
Lower Saxony within the Wallenberg Global Learning Network (WGLN). One or their
experiments uses a Programmable Logic Controller (PLC) for the control of a process
engineering plant.
A web-based laboratory for Control Engineering has been developed at the University of
Bologna 5. They implemented a rotary flexible joint, a ball and beam, a flexible link and a
Furuta pendulum.
Bing Duan, Keck-Voon Ling and Habib Mir M. Hosseini of the School of Electrical and
Electronic Engineering, Nanyang Technological University, Singapore have developed an
online laboratory to perform the inverted pendulum experiment and a couple tank
experiment6, 7
. The experimenter is required to design a controller for the experiment using
state feedback. His input to the experiment setup is the controller gains: K1, K2, K3 and K4.
The work presented in this paper follows largely from the Telerobot laboratory developed by
the University of Western Australia 1. Unlike the two-tiered architecture employed in the
Telerobot lab, this work uses the three-tiered interactive architecture developed by the
Massachusetts Institute of Technology 8, 18
.
III. The Architecture of the Lab
1. The Three-Tiered iLab Architecture:
The laboratory which has been developed and reported in this paper was developed using the
three-tiered architecture developed by the Massachusetts Institute of Technology (MIT) i-Lab
research team. A second architecture is also possible, the two-tiered architecture. In the two-
tiered architecture, there is a lab server and a client (forming the two tiers). This is shown in
figure 1. In the three-tiered architecture however, a third tier is included between the lab
server and the client. This third tier is called the Service Broker. In the two-tiered
architecture, all authentications, user arbitration, database management and control of the
laboratory equipment are handled by the laboratory server. In the three-tiered architecture
however, the laboratory server is left solely with the responsibility of controlling the
laboratory equipment. Hence, the lab server parses user requests (i.e. experiment
specifications which the user sends in to the lab), executes requests which are deemed okay
Page 14.39.3
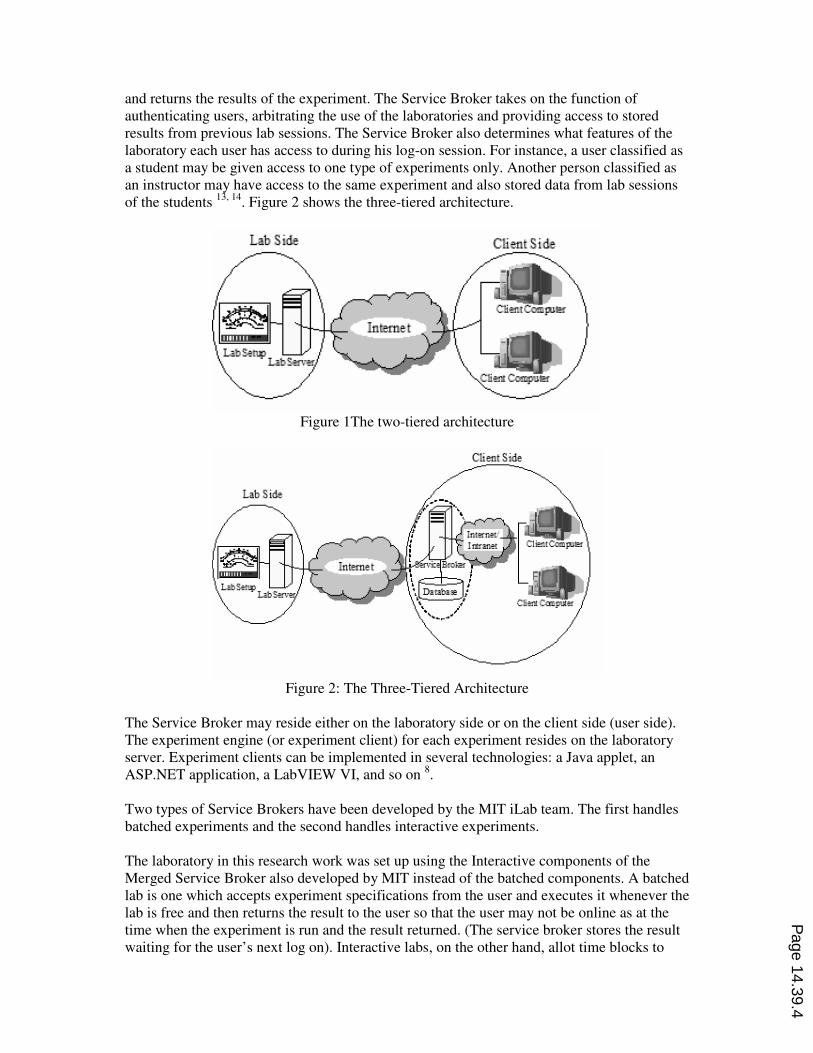
and returns the results of the experiment. The Service Broker takes on the function of
authenticating users, arbitrating the use of the laboratories and providing access to stored
results from previous lab sessions. The Service Broker also determines what features of the
laboratory each user has access to during his log-on session. For instance, a user classified as
a student may be given access to one type of experiments only. Another person classified as
an instructor may have access to the same experiment and also stored data from lab sessions
of the students 13, 14
. Figure 2 shows the three-tiered architecture.
Figure 1The two-tiered architecture
Figure 2: The Three-Tiered Architecture
The Service Broker may reside either on the laboratory side or on the client side (user side).
The experiment engine (or experiment client) for each experiment resides on the laboratory
server. Experiment clients can be implemented in several technologies: a Java applet, an
ASP.NET application, a LabVIEW VI, and so on 8.
Two types of Service Brokers have been developed by the MIT iLab team. The first handles
batched experiments and the second handles interactive experiments.
The laboratory in this research work was set up using the Interactive components of the
Merged Service Broker also developed by MIT instead of the batched components. A batched
lab is one which accepts experiment specifications from the user and executes it whenever the
lab is free and then returns the result to the user so that the user may not be online as at the
time when the experiment is run and the result returned. (The service broker stores the result
waiting for the user’s next log on). Interactive labs, on the other hand, allot time blocks to
Page 14.39.4
different users so that each user, in real time, is given access to the lab and control over the
experiment parameters. The Merged Service Broker is a new Service Broker developed
which combines the batched architecture and the interactive architecture in one. The
interactive architecture was used for this work because of the nature of the experiments.
Since the experiments involve the control of the motion robotic arm, it would make a lot
more sense to have the control done in real time so that the user can immediately observe
what changes to experiment parameters have on the robotic arm. The choice of the interactive
architecture was also made because interactive labs give students a more realistic lab
experience. Furthermore, feedback from students of the Obafemi Awolowo University who
used the batched labs currently deployed at the university complained that performing the
batched experiments, to them, felt like running the experiments using a simulation package
like Multisim. There are currently three batched laboratories at the university: an operational
amplifiers lab, a simple logic lab and an advanced digital electronics lab. All these were
designed in-house.
In the Interactive Architecture for the three-tiered iLab systems, three other servers are
included. These are the Laboratory Scheduling Server (LSS), a User Scheduling Server
(USS) and the Experiments Storage Server (ESS). These three servers work with the Merged
Service Broker to handle Interactive Experiments. Since the experiments are controlled in
real time by the users, each user must have a scheduled time when he is given full control
over the experiment parameters to perform the experiment. Two scheduling servers are used
in the Interactive architecture: one which schedules the availability of the lab and which is set
by the administrator of the lab and the other which schedules different users to make use of
the lab. The reason there are two scheduling servers is to enable a user system e.g. a
university which intends to use a laboratory developed and owned by another university to be
able to independently schedule its different classes of lab users as it pleases using the USS,
while the laboratory administrator at the remote end simply uses the LSS to schedule when
the lab would be available to the user system.
It should be noted that in the three-tiered architecture, each of the servers can be located at
the user’s side, the lab’s side or somewhere else geographically displaced from these two.
Hence, figure 2 can be redrawn with the Service Broker on the lab side and the ESS and USS
on the client side with the LSS on the lab side. Hence, the architecture is useable in diverse
configurations.
2. LabVIEW:
LabVIEW is a virtual instrumentation software developed by National Instruments (NI). It is
a programming environment in which programs are written graphically using the G language.
It uses icons instead of lines of text to create applications 9. Programs are developed by
dragging blocks onto a front panel or a block diagram and connecting the various blocks
together in the block diagram. Each program written in LabVIEW is called a Virtual
Instrument (VI).The flow of data in the block diagram of each developed VI determines the
execution of the program (of the VI). VIs created by LabVIEW are useful for test and
measurement, data acquisition (DAQ), instrument control, data-logging, measurement
analysis and report generation. Each VI comprises a Front Panel and a Block Diagram. The
Front Panel is the user interface. The Block Diagram contains the graphical representation of
functions which control the Front Panel objects 10
.
LabVIEW has a feature called Remote Panels and it uses this together with the LabVIEW
web server to make it possible to access and control a LabVIEW Virtual Instrument (VI) over
Page 14.39.5

the internet. The user wishing to access and control the VI would only need to have the
requisite LabVIEW Runtime engine installed on his computer. LabVIEW was chosen to be
used to create the lab client. LabVIEW is a graphical programming environment, and hence,
the Front Panel of the LabVIEW VI developed serves as the GUI which the user interacts
with and the Block Diagram of the VI serves as the experiment engine which parses and
executes user input.
3. The RA-01 Robotic Arm:
The RA-01 robotic arm used for this laboratory is a product of Images SI Incorporated, New
York. It is a robotic arm with five degrees of freedom. The base, shoulder, elbow and wrist
joints are revolute joints. The gripper joint is a prismatic joint. The gripper servomotor is a
rotary motor but the gripper mechanism converts the rotary motion into a translation. Figure
3 shows the RA-01 robotic arm.
Figure 3: The RA-01 Robotic Arm
4. The Robotic Arm Laboratory:
Figure 4 shows the architecture of the developed robotic arm laboratory. The lab developed at
the Obafemi Awolowo University has the USS and LSS installed on the Service Broker since
for now, the only user system which exists consists of students from the university itself.
With expansion of the lab, a USS and an ESS can be placed in each system of users’ side.
Page 14.39.6

Figure 4: Architecture of Robotic Arm Laboratory
IV. The Experiments
1. Slider Control of the Robotic Arm:
This experiment is designed to give the lab user a feel of the workings of the robotic arm.
Each of the servomotors (degrees of freedom (DOF)) of the robotic arm is controlled by a
slider on the front panel of the LabVIEW VI. The user moves each slider to move each of the
DOFs.
The LabVIEW VI was designed so that the user gives in the angular positions desired for
each of the motors of the robotic arm. Each slider has variations from -90° through 0° to 90°.
Each slider has a digital display beside it so that the user can view the exact angular position
he is sending to the arm. Buttons are also included beside each digital display for
incrementing and decrementing the angles. The design lets only integer angular values to be
sent to the arm. Figure 4 shows the Front Panel of the Simple Slider Control Experiment VI.
Page 14.39.7

Figure 4: Front Panel of the Simple Slider Control VI.
The design of each experiment in the robotics laboratory is such that each motor of the
robotic arm takes a maximum of a one degree step every 20 milliseconds as opposed to
allowing the robotic arm to move as fast as the user moves the sliders. This was done for
three reasons. Firstly, safety is a main concern of each online laboratory. By safety is meant
safety of the laboratory equipment being used and safety to all surrounding components and
equipment in the laboratory. One concern in the design was that if the robotic arm responds
as fast as the user moves each of the sliders, if every user subjects the arm to successive rapid
motions, wear and tear would quickly set in to the arm. Hence, the safety of the arm would be
compromised if the arm responds as fast as the user’s fast commands. Secondly, the user
control over precise motions of the arm would be low. A glitch in the response of the user’s
computer or a faulty mouse could easily be transmitted onward to the robotic arm, again
compromising the safety of the arm, but also resulting in user errors – depending on the
laboratory instructor’s instructions.
A third concern relates with the fact that since a live webcam feed is paramount to this
laboratory and since users particularly in the third world often do not have access to high
bandwidth connections to the internet, the video feed from the lab to the user should be of
low resolution. Rapid robotic arm movements would require a high resolution video feed
from the lab to the user to be able to capture each of the frames of the motion of the robotic
arm and sufficiently transmit them to the user.
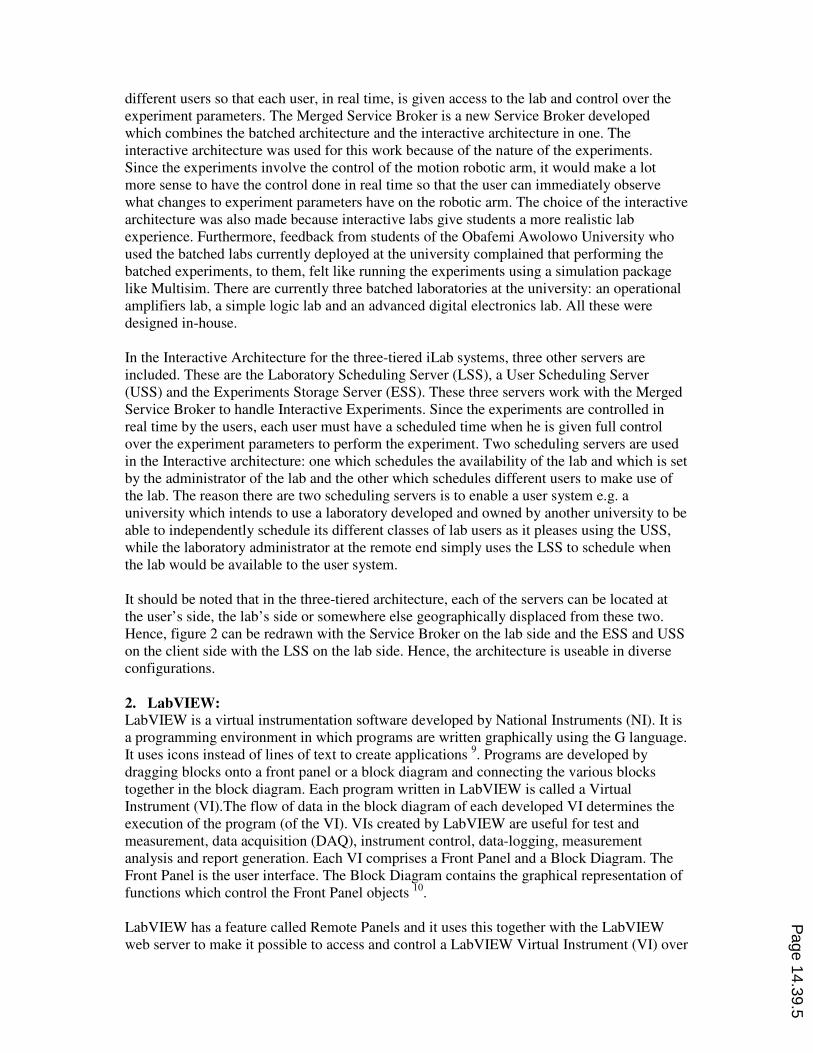
The VIs for the labs were designed such that they iterate from the current position they are to
the new position specified by the user one degree every 20 ms (20 ms is the period of each
instruction cycle being sent to each motor). Figure 5 shows the block diagram of the Simple
Slider Control Experiment VI.
Page 14.39.8
Figure 5: Block Diagram of Simple Slider Control Experiment VI
2. Effect of Gravity Experiment:
When programming a robotic arm, one has to take into account the weight of the arm that is
the drag of earth’s gravity on the arm. Hence, the torque which one would require to lower an
object using a revolute joint would be different from the torque required to raise the revolute
joint even if the resistance to motion is the same in both cases. This second experiment
introduces students to this concept. In their work, Yamawaki and Yashima show that the
output controllability of the motion of the end effector depends on both the configuration and
dynamic parameters of a robotic arm, and the gravity acting on the arm 11
.
This experiment uses a VI slightly modified from the VI used for simple slider control of the
robotic arm. In this VI, a slider is place to control the period of the pulse train being sent to
the robotic arm. The user is required to vary the period of the pulse train being sent to the
robotic arm and observe the response of the arm to different periods.
A five-degree of freedom servomotor controller board (SMC-05) was obtained with the
robotic arm. The position of each motor is controlled by pulse-width modulation. The SMC-
05 continuously sends pulses to each of the five motors. The width of each pulse tells the
motor the position it is expected to be at (or move to). The period of the pulse train which the
SMC-05 sends to the motors is 20 ms. The pulse width for each motor is varied between 0.75
ms and 2.55 ms dependent on the numerical value sent for that motor, 0.75 being for a
numeric of 75 (90° counter clockwise) and 2.55 being for a numeric value of 255 (90°
clockwise).
For this experiment, the user is required to vary the period of the pulse train containing the
desired angular positions being sent to the robotic arm. The user does this by varying the
sixth slider in figure 6. The user is allowed to vary the period between its minimum (20 ms)
and 100 ms. Beyond 100 ms, the jerky motion of the robotic arm would compromise the
safety to the robotic arm. The pulse width is only available to the student for variation Page 14.39.9

between 0.75 to 2.55 ms (which is done by varying angular positions being sent to the robotic
arm between -90° and 90°).
Figure 6: Front panel of the Effect of Gravity VI.
As the user gradually increases the period of the pulse train, he would observe from the live
video stream that the robotic arm, when not in an upright position, would increasingly have
jerky motions. The jerkiness of the motion is due to gravity acting on the arm. A servomotor
has zero torque when not powered. When the period of the pulse train exceeds 20 ms, the
servomotor is effectively “off” for the extra length of time. Hence, if a period of 45 ms is
used, the servomotor is powered for 20 ms and then “off” for 25 ms. During this “off” period,
the servomotor, having zero torque, is susceptible to the pull of gravity. Hence, if not in an
upright position, it would begin falling under the influence of gravity until the next pulse
comes in stating the desired position which it jumps back toward.
For this experiment, the user is required to vary the period of the pulse train, observe the
outcome of the motion and explain why the motion is as it is, also stating why the motion of
the arm is still very smooth at a period of 30 ms.
3. Trajectory Planning Experiment:
This experiment requires the user to determine the angular positions the robotic arm should
go through to perform a task. These angular positions, which define a series of motions, will
then be sent to the arm for execution in a tabular format. This experiment is geared at
teaching the student the art of planning the trajectory of motion of a robotic arm, and by
extension, a robot.
Page 14.39.10

The VI is designed such that the user does not have much control over the velocity of the
motors of the robotic arm. When moving, each motor moves one degree per instruction cycle
(i.e. the period of the pulse train – 20 milliseconds). This is a constraint which the users of the
lab would be required to work with. Figure 7 gives the front panel of the Trajectory Planning
VI.
Figure 7: Trajectory Planning Experiment VI
The user is required to do the math for the inverse kinematics of the robotic arm. The
experiment only gives the user control over the angular positions of the servomotors of the
robotic arm. Hence, the user computes the forward kinematics and then the inverse
kinematics for the individual gripper positions necessary to carry out the instructor specified
task (for example, a pick and place routine).
The resulting angular positions arrived at for each of the positions which the robotic arm is
desired to move through are placed in tabular form. These values are now entered in this VI
and the execute button is clicked on. Error checking is first done to ensure that the entered
values lie within the specified ranges of motion of each motor. If there is an error in the
entered value(s), an error message to that effect is displayed in the Message box of (figure 7).
If the entered values are ok, a message “No Error” is displayed and the entered array of
angular positions is executed.
V. Preliminary Appraisal
A preliminary appraisal of the developed laboratory is discussed below as arrived at from
usage by a few staff of the department:
1. Bandwidth Concerns:
The experiments, being interactive in nature, require that a feedback be given to the user in
real-time. The feedback employed by this laboratory is visual: a live video feed from a
webcam. When streaming the video at 320 × 240 pixels, a video size which would was
deemed the minimum to enable dexterous user control over the robotic arm, the bandwidth
requirement for a smooth image was 60 kbps per viewer using JavaScript or Flash for the
streaming. For speeds at which the robotic arm would move (each motor moving at a
Page 14.39.11
maximum of 1° / 20 ms), the video feed at this data rate was smooth enough. Hence, if 10
users chose to view the live feed simultaneously (which ought to be an integral part of a
laboratory process – watching while other students perform experiments before or after one’s
turn), the lab server would need to have at least 600 kbps uplink to satisfy the users’ demand.
With 100 viewers, the bandwidth would be way beyond what the lab has available. This issue
is further worsened by the fact that at least two cameras ought to be used to enhance user
precision. The time lag between the robotic arm motions and the motions in the video stream
was about 0.8 seconds.
Hence, a direct streaming from the laboratory to each client could cause problems. To
forestall this, an account was created with Mogulus (www.mogulus.com). Mogulus is a live
broadcast platform on the internet though which a user can create a live, scheduled or on-
demand internet TV applications 15
. With Mogulus, we stream live from the laboratory to the
Mogulus server and all viewers of the webcam view the live feed from the Mogulus server
through a player widget embedded in a webpage. Since Mogulus theoretically have an
unlimited bandwidth, the number of users which can view the webcam feed is unlimited.
When this was tested with the lab, a time lag of 2 to 5 seconds was observed between the
robotic arm’s movements and the movements on the video stream (depending on the network
traffic). This made it really difficult to perform the first two experiments as they involved
real-time response of the robotic arm to the slider movements of the user.
Streaming via Ustream (www.ustream.tv) was also tried with comparable results. Mogulus
was preferred as there were more glitches, interruptions in the transmission, when Ustream
was used, than when Mogulus was used.
As a fall-out from the above discourse, a smaller resolution and frame rate were employed: a
resolution of 160 x 120 pixels; a frame rate of 14 frames per second. With these settings, a
jerky video could be watched at 30 kbps. Also, work is being done on using both schemes,
using a direct feed from the laboratory to the active user and using the Mogulus feed to all
other viewers of the webcam. This is because the time lag is only really an issue for the
person who is actively controlling the arm at the time.
2. Controlled Environment:
When pick and place experiments were test run, it became obvious that the environment for
such experiments would have to be controlled. Firstly, the object to be picked and placed
would best be an object which does not bounce so that since the work envelope of the robotic
arm is limited, the object would not bounce out of range if the user dropped it from an
altitude.
3. The LabVIEW Runtime:
One major draw-back of using the Remote Panels feature of LabVIEW is that as stated
earlier, the user must have the requisite LabVIEW Runtime installed on his computer to be
able to view the client. The Runtime engine for the version of LabVIEW used for this work
(version 8.2) is 91.5 MB in size. Downloading and installing this Runtime could prove
challenging for low bandwidth networks. The latest release of LabVIEW, version 8.6, has a
slim Runtime installation (28.7 MB in size) as well as the full Runtime installation (108 MB).
The slim installation supports the features necessary for Remote Panels. Using this version
would ameliorate the download problems, but not solve it as 28.7 MB is still large for low
bandwidth networks.
Page 14.39.12

A second issue with the LabVIEW Runtime is that while it integrates well into Internet
Explorer, Mozilla Firefox, Opera web browser, Google Chrome and Apple Safari are all
unable to load the LabVIEW Runtime to launch the lab client. Hence, running the
experiments is only possible with Internet Explorer. This is a little restrictive as several web
users often have other browser preferences. The laboratory has not been tried in the Linux
environment.
VI. User Data and Analysis
The developed experiments in this laboratory currently do not fit into any part of the
curriculum of the Electronic and Electrical Engineering Department of the Obafemi
Awolowo University. However, a robotics club has been set up by the IEEE Student member
chapter in the department. It is intended that this club would performing the experiments in
the robotic lab this summer.
Prior to this, however, 500 level students of the department (about seventy students) were
told to perform the experiments. Since one of the main design considerations was that the
laboratory (the experiments, the clients and the documentation) should be intuitive enough
for a person not previously exposed to robotics, the students were made to perform the
experiments without a physical instructor giving instructions. The students were told to
obtain the instructions from the laboratory’s website and follow them as best as they could.
Upon completion of the experiments, they were required to download and fill a questionnaire
about their lab experience. The following data was obtained from them:
1. LabVIEW Runtime Installation:
81.5 % complained that they did not have access to a computer which was connected to the
internet on which they could install the LabVIEW Runtime to perform the experiments.
The other 18.5 % (13 students) install the LabVIEW Runtime, sharing 3 laptops between
them.
0 % downloaded the LabVIEW Runtime from the lab server. Two students copied the
Runtime from me and others got it from them.
Note that it is impossible to view the experiment clients over the internet without the
Runtime. Hence, non-installation of the Runtime means that one cannot perform any of the
experiments.
2. Live Video Viewership:
46 % of those who installed the LabVIEW Runtime were able to view the live video feed
from Mogulus and Ustream. These attempted the experiments from a network with a
bandwidth of 60 kbps and more.
54 % were unable to view the live video feed. These attempted the experiments from a
network with a bandwidth of 15 kbps and less.
3. User Experience:
a. Lab intuitiveness:
The average score given by the users for the intuitiveness of the lab (i.e. the experiment
clients and the available documentation) was 72.9 %.
Page 14.39.13

b. Depth of understanding:
From the questions asked the students sequel to their performing the experiments, our
average assessment of the depth of their understanding of the concepts being taught,
introduced and experimented in the lab is 55 %.
c. User’s Rating of the Lab:
The average user rating was 79.2 %
d. User complaints:
67 % of users complained about the latency in the live video feed from the webcam.
30 % complained about the moderately low quality of the video stream from the webcam.
Two users complained having wrong times being presented to choose from during the
scheduling session. This was resolved when they changed the time zone setting of their
computer to that for Nigeria (GMT +1). The documentation for the lab has been updated to
specify that users check the time zone settings of their computer to ensure that they have the
right time zone selected.
A number of users complained about not having the full specified time for each session
available to them. It was discovered that differences in the times between the individual
computers and the lab scheduling server were causing these disparities. This is being
resolved.
The trajectory experiment, sometimes, resulted in the robotic arm beginning to jerk
uncontrollably and becoming unresponsive to user input. This is being further investigated.
VII. Further Work Ahead
As a result of the feedback from users of the laboratory, a number of options are being
considered in providing visual feedback to the lab user from the lab. One possibility is the
introduction of a virtual robotic arm in a virtual work cell 16
. This simulated environment
would be embedded in the user’s web browser (hence, would probably run on java) and
respond immediately to user input. The user input would also be sent to the robotic arm and
the live video will still be made available, but the user would have a simulated robot which
would respond immediately and then he can view the live video feed to see if the live robotic
arm responds the same way. A second benefit of using a simulated robotic arm in addition to
the video feed is that the low resolution of the video feed becomes less significant as the
simulation provides a high resolution feedback to the user.
Further work ahead will introduce another robotic arm, one which would support PID control
experiments and which would give the users control over the torques of the individual
motors.
VIII. Conclusion
On online laboratory has been set up at the Obafemi Awolowo University, available at
http://ilab.oauife.edu.ng/MergedServiceBroker. The simple slider control experiment
introduces newbies to the workings of a robotic arm. The Effect of Gravity Experiment
allows students to observe practice with gravity concerns in the programming of a robotic
arm. The Trajectory Planning Experiment is a medium whereby students practice inverse
kinematics.
Page 14.39.14

Bandwidth issues are the main concern of this laboratory as a live webcam feed is paramount
to each of the experiments in the laboratory. Hence, work lies ahead on ways of minimizing
the lab’s bandwidth requirements while still presenting the necessary visual, auditory and
possibly haptic feedback to the user 17
and minimizing simulations which could give students
the feel of being in a virtual laboratory instead of an online laboratory.
References
1. Trevelyan, J. (2004). "Lessons Learned from 10 Years Experience with Remote
Laboratories”. International Conference on Engineering Education and Research
“Progress Through Partnership”, Ostrava, ISSN 1562-3580
2. Harjono (2001). Telelabs Project: Online Temperature Control Laboratory.
Mechatronics Engineering Honors Thesis. University of Western Australia.
3. Casini M., Prattichizzo D. and Vicino A. (2001). The Automatic Control Telelab: A
Remote Control Engineering Laboratory. Proceedings of the 40th
IEEE Conference on
Decision and Control, Orlando, USA. ThM 10-5.
4. Böhne, A., Faltin, N. and Wagner, B. (2002). “Self-directed Learning and Tutorial
Assistance in a Remote Laboratory.” Interactive computer Aided Learning
Conference. Villach, Austria. 2002.
5. Bonivento, C., C. Gentili, L., Marconi, L. and Rappini, L. (2002). “A Web-Based
Laboratory for Control Engineering Education”. Dipartimento di Elettronica
Informatica e Sistemistica, University of Bologna.
6. Duan, B., Ling, K., Mir M. Hosseini, H (2004). “Developing and Implementing
Online Laboratory for Control Engineering Education”. Nanyang Technological
University.
7. Ling K.V., Lai Y.K. and Chew K.B. (2001). “An Online Internet Laboratory for
Control Experiments”. Advances in Control Education 2000, Pergamon, Great
Britain, pp 173-176.
8. Harward J., Mao T. T., Jabbour I. (2006). “iLab Interactive Services – Overview”.
Available at http://icampus.mit.edu/iLabs/architecture/downloads Accessed on 7th
July 2008.
9. National Instruments Corporation (2000). “LabVIEW Basics I. Course Manual”.
10. National Instruments Corporation (2003). “LabVIEW Basics I. CD”.
11. Images SI Inc (2006). “RA-01 Robotic Arm & Controller Manual & User’s Guide”.
Page 14.39.15
12. Yamawaki, T. and Yashima, M. (2007). “Effect of Gravity on Manipulation
Performance of a Robotic Arm”. National Defense Academy of Japan, Yokosuka,
Japan.
13. Ayodele K. P., Kehinde L.O., Jonah O., Ilori O., Ajayi E.O.B., Osasona O.O. (2008):
Development Of An Operational Amplifier Virtual Laboratory Based On ILab
Architecture And NI Elvis. Proceedings of the ASEE Annual Conference and
Exposition, June 2008, Pittsburgh.
14. Olowokere D., Kehinde L.O., Jonah O., Ayodele K. P., Ajayi E.O.B., Osasona O.O.
(2008): Human And Infrastructure Issues In The Development Of Web-Based
Laboratories In Challenged Environments. Proceedings of the ASEE Annual
Conference and Exposition, June 2008, Pittsburgh.
15. http://www.mogulus.com/info/about. Accessed on 5th Feb 2009.
16. Safaric R. (2001). “Telerobotics Experiments Via the Internet.” IEEE Transactions on
Industrial Electronics, Vol. 48, No. 2, pp 424 – 431.
17. Bethea B.T., Okamura A.M., Kitagawa M., Fitton T.P., Cattaneo S.M., Gott V.L.,
Baumgartner W.A., and Yuh D.D. (2004). “Application of Haptic Feedback to
Robotic Surgery”. Journal of Laparoendoscopic & Advanced Surgical Techniques.
Vol. 14, No. 3, pp 191 – 195.
18. Del Alamo, J. A., Brooks L., Mclean C., Hardison J., Mishuris G., Chang V., and Hui
L. (2002). "The Mit Microelectronics Weblab: A Web-Enabled Remote Laboratory
For Microelectronics Device Characterization." 2002 World Congress On Networked
Learning In A Global Environment, Berlin (Germany), May 2002.
Page 14.39.16


