A Laboratory Study on the Phase Transition for Polar ... · Transition for Polar Stratospheric...
57
National Aeronautics and Space Administration NASA Contractor Report 198056 A Laboratory Study on the Phase Transition for Polar Stratospheric Cloud Particles Edward H. Teets, Jr. NASA Contract NAG-2572 March 1997
Transcript of A Laboratory Study on the Phase Transition for Polar ... · Transition for Polar Stratospheric...

National Aeronautics and Space Administration
NASA Contractor Report 198056
A Laboratory Study on the Phase Transition for Polar Stratospheric Cloud Particles
Edward H. Teets, Jr.
NASA Contract NAG-2572March 1997

National Aeronautics andSpace Administration
Dryden Flight Research CenterEdwards, California 93523-0273
NASA Contractor Report 198056
A Laboratory Study on the Phase Transition for Polar Stratospheric Cloud Particles
Edward H. Teets, Jr.
University of RenoReno, Nevada
Prepared forNASA Dryden Flight Research CenterEdwards, CaliforniaUnder NASA Research GrantGrant NAG-2572

CONTENTS
Page
ACKNOWLEDGMENTS. . . . . . . . . . . . . . . . . . . . . . . . . . . . . . . . . . . . . . . . . . . . . . . . . . . . . . . . . . . . . . . . . . . .vi
ABSTRACT . . . . . . . . . . . . . . . . . . . . . . . . . . . . . . . . . . . . . . . . . . . . . . . . . . . . . . . . . . . . . . . . . . . . . . . . . . . . . . 1
NOMENCLATURE . . . . . . . . . . . . . . . . . . . . . . . . . . . . . . . . . . . . . . . . . . . . . . . . . . . . . . . . . . . . . . . . . . . . . . . . 1
CHAPTER 1: INTRODUCTION . . . . . . . . . . . . . . . . . . . . . . . . . . . . . . . . . . . . . . . . . . . . . . . . . . . . . . . . . . . . . . 2
CHAPTER 2: THE ATMOSPHERE . . . . . . . . . . . . . . . . . . . . . . . . . . . . . . . . . . . . . . . . . . . . . . . . . . . . . . . . . . . 3Observation of Stratospheric Clouds . . . . . . . . . . . . . . . . . . . . . . . . . . . . . . . . . . . . . . . . . . . . . . . . . . . . . . . . 4Aerosol Layer . . . . . . . . . . . . . . . . . . . . . . . . . . . . . . . . . . . . . . . . . . . . . . . . . . . . . . . . . . . . . . . . . . . . . . . . . . 6Polar Stratospheric Cloud Formation . . . . . . . . . . . . . . . . . . . . . . . . . . . . . . . . . . . . . . . . . . . . . . . . . . . . . . . . 7Particles in Solution . . . . . . . . . . . . . . . . . . . . . . . . . . . . . . . . . . . . . . . . . . . . . . . . . . . . . . . . . . . . . . . . . . . . 11
Deliquescence . . . . . . . . . . . . . . . . . . . . . . . . . . . . . . . . . . . . . . . . . . . . . . . . . . . . . . . . . . . . . . . . . . . . . 11Particle Growth: Influence of Solute . . . . . . . . . . . . . . . . . . . . . . . . . . . . . . . . . . . . . . . . . . . . . . . . . . . . 11Particle Growth: Influence of Curvature . . . . . . . . . . . . . . . . . . . . . . . . . . . . . . . . . . . . . . . . . . . . . . . . . 12
Gibbs Free Energy . . . . . . . . . . . . . . . . . . . . . . . . . . . . . . . . . . . . . . . . . . . . . . . . . . . . . . . . . . . . . . . . . . . . . 14Effect of Relative Humidity . . . . . . . . . . . . . . . . . . . . . . . . . . . . . . . . . . . . . . . . . . . . . . . . . . . . . . . . . . . . . . 14Growth Rate Factors . . . . . . . . . . . . . . . . . . . . . . . . . . . . . . . . . . . . . . . . . . . . . . . . . . . . . . . . . . . . . . . . . . . . 15What the Experiment Will Show . . . . . . . . . . . . . . . . . . . . . . . . . . . . . . . . . . . . . . . . . . . . . . . . . . . . . . . . . . 16
CHAPTER 3: EXPERIMENTAL PROCESS. . . . . . . . . . . . . . . . . . . . . . . . . . . . . . . . . . . . . . . . . . . . . . . . . . . . 16Characterizing the Solutions. . . . . . . . . . . . . . . . . . . . . . . . . . . . . . . . . . . . . . . . . . . . . . . . . . . . . . . . . . . . . . 18Supercooling the Solution. . . . . . . . . . . . . . . . . . . . . . . . . . . . . . . . . . . . . . . . . . . . . . . . . . . . . . . . . . . . . . . . 18Crystal Growth Rates . . . . . . . . . . . . . . . . . . . . . . . . . . . . . . . . . . . . . . . . . . . . . . . . . . . . . . . . . . . . . . . . . . . 19Mixed Solutions . . . . . . . . . . . . . . . . . . . . . . . . . . . . . . . . . . . . . . . . . . . . . . . . . . . . . . . . . . . . . . . . . . . . . . . 20Aircraft Soot Mixtures . . . . . . . . . . . . . . . . . . . . . . . . . . . . . . . . . . . . . . . . . . . . . . . . . . . . . . . . . . . . . . . . . . 20
CHAPTER 4: EXPERIMENTAL RESULTS. . . . . . . . . . . . . . . . . . . . . . . . . . . . . . . . . . . . . . . . . . . . . . . . . . . . 20Growth vs. Tube Diameter . . . . . . . . . . . . . . . . . . . . . . . . . . . . . . . . . . . . . . . . . . . . . . . . . . . . . . . . . . . . . . . 20Supercooling and Growth . . . . . . . . . . . . . . . . . . . . . . . . . . . . . . . . . . . . . . . . . . . . . . . . . . . . . . . . . . . . . . . . 28
Salts . . . . . . . . . . . . . . . . . . . . . . . . . . . . . . . . . . . . . . . . . . . . . . . . . . . . . . . . . . . . . . . . . . . . . . . . . . . . . 28Acids . . . . . . . . . . . . . . . . . . . . . . . . . . . . . . . . . . . . . . . . . . . . . . . . . . . . . . . . . . . . . . . . . . . . . . . . . . . . 29Growth Rate at High Concentration. . . . . . . . . . . . . . . . . . . . . . . . . . . . . . . . . . . . . . . . . . . . . . . . . . . . . 31
Mixtures of Acids . . . . . . . . . . . . . . . . . . . . . . . . . . . . . . . . . . . . . . . . . . . . . . . . . . . . . . . . . . . . . . . . . . . . . . 33Addition of Non-Soluble Material . . . . . . . . . . . . . . . . . . . . . . . . . . . . . . . . . . . . . . . . . . . . . . . . . . . . . . . . . 36
CHAPTER 5: DISCUSSION OF RESULTS . . . . . . . . . . . . . . . . . . . . . . . . . . . . . . . . . . . . . . . . . . . . . . . . . . . . 36Diffusion Chamber . . . . . . . . . . . . . . . . . . . . . . . . . . . . . . . . . . . . . . . . . . . . . . . . . . . . . . . . . . . . . . . . . . . . . 41Recommendations. . . . . . . . . . . . . . . . . . . . . . . . . . . . . . . . . . . . . . . . . . . . . . . . . . . . . . . . . . . . . . . . . . . . . . 41Conclusions. . . . . . . . . . . . . . . . . . . . . . . . . . . . . . . . . . . . . . . . . . . . . . . . . . . . . . . . . . . . . . . . . . . . . . . . . . . 41Implications . . . . . . . . . . . . . . . . . . . . . . . . . . . . . . . . . . . . . . . . . . . . . . . . . . . . . . . . . . . . . . . . . . . . . . . . . . 42
BIBLIOGRAPHY . . . . . . . . . . . . . . . . . . . . . . . . . . . . . . . . . . . . . . . . . . . . . . . . . . . . . . . . . . . . . . . . . . . . . . . . . 45
iii

APPENDIX A: CHEMICAL REACTIONS WHICH PRODUCE SULFURIC ACID . . . . . . . . . . . . . . . . . . . . 48
APPENDIX B: PHOTOCHEMICAL REACTIONS LEADING TO NITRIC ACID FORMATION. . . . . . . . . 49
APPENDIX C: THERMAL PROPERTIES OF COMMON SUBSTANCES . . . . . . . . . . . . . . . . . . . . . . . . . . . 50
TABLES
1. Properties of the polar stratospheric particles . . . . . . . . . . . . . . . . . . . . . . . . . . . . . . . . . . . . . . . . . . . . . . . . 8
2. Relative humidities of phase transition. (Twomey, 1977) . . . . . . . . . . . . . . . . . . . . . . . . . . . . . . . . . . . . . . 12
A-1. Vapor pressures (mm Hg) H2SO4 and H2O in solution. (Gmitro and Vermeulen, 1964) . . . . . . . . . . . . . . 48
C-1. Thermal properties of common substances. (Carslaw and Jaeger, 1959) . . . . . . . . . . . . . . . . . . . . . . . . . . 50
FIGURES
1. Standard temperature profile. (U. S. Standard Atmosphere, 1976) . . . . . . . . . . . . . . . . . . . . . . . . . . . . . . . . 3
2. Schematic representation of solar occultation technique employed by the Nimbus 7SAM II instrument. (Hamill and McMaster, 1983) . . . . . . . . . . . . . . . . . . . . . . . . . . . . . . . . . . . . . . . . . . . . 4
3. Nitric acid concentration as a function of altitude and latitude. (Cadle, et al., 1973) . . . . . . . . . . . . . . . . . . 5
4. Mixing ratio profiles of large particles, r > 0.15 µm, 1972–73. (Hofmann, et al., 1975). . . . . . . . . . . . . . . . 7
5. Steps leading to formation of PSCs and those leading to the possible ozonedestruction. (Hamill and Toon, 1991) . . . . . . . . . . . . . . . . . . . . . . . . . . . . . . . . . . . . . . . . . . . . . . . . . . . . . . . 8
6. Weight composition and maximum supercooling of sulfuric acid droplet as a functionof temperature. (Steele and Hamill, 1981; Hallett and Lewis, 1967) . . . . . . . . . . . . . . . . . . . . . . . . . . . . . . . 9
7. Differences in growth of aqueous solution droplets of H2SO4. The dry size is indicatedon each curve. (Nair and Vohra, 1974) . . . . . . . . . . . . . . . . . . . . . . . . . . . . . . . . . . . . . . . . . . . . . . . . . . . . . 13
8. Gibbs free energy plot showing the critical radius growth. (Twomey, 1977) . . . . . . . . . . . . . . . . . . . . . . . . 14
9. Equilibrium relative humidity (RH) line of a saturated solution against temperature—acurve which also represents the transition line between the regions of solid andsolution. (Twomey, 1977) . . . . . . . . . . . . . . . . . . . . . . . . . . . . . . . . . . . . . . . . . . . . . . . . . . . . . . . . . . . . . . . 15
10. Illustration of the experimentation setup . . . . . . . . . . . . . . . . . . . . . . . . . . . . . . . . . . . . . . . . . . . . . . . . . . . 17
11. Tubing diameter in supercooling for 1 m solution of ammonium sulfate at a temperatureof about –11 °C (7.3 K supercooled) . . . . . . . . . . . . . . . . . . . . . . . . . . . . . . . . . . . . . . . . . . . . . . . . . . . . . . 21
12. Growth rates as a function of tube diameter and temperature. Equilibrium ice-solutiontemperature is shown at – 4 °C . . . . . . . . . . . . . . . . . . . . . . . . . . . . . . . . . . . . . . . . . . . . . . . . . . . . . . . . . . . 21
13. (a–c). Crystal growth of a 1 m solution of ammonium sulfate in a 4.0 mm diameter tubeat 4.0 K supercooled at 7, 11 and 16 sec. . . . . . . . . . . . . . . . . . . . . . . . . . . . . . . . . . . . . . . . . . . . . . . . . . . . 22
13. (d–f). Crystal growth of a 1 m solution of ammonium sulfate in a 4.0 mm diameter tubeat 9.0 K supercooled at 2, 4 and 6 sec. . . . . . . . . . . . . . . . . . . . . . . . . . . . . . . . . . . . . . . . . . . . . . . . . . . . . . 23
13. (g–i). Crystal growth of a 1 m solution of ammonium sulfate in a 4.0 mm diameter tubeat 12.0 K supercooled at 1, 2 and 4 sec. . . . . . . . . . . . . . . . . . . . . . . . . . . . . . . . . . . . . . . . . . . . . . . . . . . . . 25
iv

13. (j). Crystal shapes as a function of concentration and supercooling. (Wedum, 1979) . . . . . . . . . . . . . . . . . 26
14. Growth rate errors due to uncertainties in stop-watch timing at low supercooling . . . . . . . . . . . . . . . . . . . 27
15. Growth rate errors due to uncertainties in stop-watch timing at high supercooling . . . . . . . . . . . . . . . . . . . 27
16. Growth velocity as a function of molality and temperature for sodium chloride;freezing point depression is 3.37 K per 1 m . . . . . . . . . . . . . . . . . . . . . . . . . . . . . . . . . . . . . . . . . . . . . . . . . 28
17. Growth velocity as a function of temperature and molality for ammonium sulfate; with growthrate for pure water; equilibrium freezing point depression is 3.86 K at 1 m . . . . . . . . . . . . . . . . . . . . . . . . 29
18. Growth velocity as a function of temperature and molarity for ammonium bisulfate; freezingpoint depression is 3.8 K at 1 m . . . . . . . . . . . . . . . . . . . . . . . . . . . . . . . . . . . . . . . . . . . . . . . . . . . . . . . . . . 30
19. Growth velocity as a function of temperature and molarity for nitric acid; freezing pointdepression is 3.6 K at 1 m . . . . . . . . . . . . . . . . . . . . . . . . . . . . . . . . . . . . . . . . . . . . . . . . . . . . . . . . . . . . . . . 30
20. Growth velocity as a function of temperature and molarity for sulfuric acid; freezing pointdepression is 3.8 K at 1 m . . . . . . . . . . . . . . . . . . . . . . . . . . . . . . . . . . . . . . . . . . . . . . . . . . . . . . . . . . . . . . . 31
21. (a-b). Growth velocities for nitric acid and 3H2O hydrate crystals as a function of supercoolingand molarities. Equilibrium temperatures are –30 °C for 40%, –20 °C for 48%, –20 °C for 52%,and –22 °C for 62% by weight. (Pickering, 1893) . . . . . . . . . . . . . . . . . . . . . . . . . . . . . . . . . . . . . . . . . . . . 32
22. Equilibrium freezing temperatures and experimental data showing temperatures andmolarity where nucleation was initiated. (Pickering, 1893) . . . . . . . . . . . . . . . . . . . . . . . . . . . . . . . . . . . . . 33
23. Equilibrium freezing temperatures and experimental data showing temperatures andmolarity of nucleation. Triangles indicate points where nucleation was not initiated.(Gable, et al., 1950) . . . . . . . . . . . . . . . . . . . . . . . . . . . . . . . . . . . . . . . . . . . . . . . . . . . . . . . . . . . . . . . . . . . 34
24. Growth velocity curves for 80% and 95% HNO3 and 20% and 5% H2SO4 mixtures at 1 m . . . . . . . . . . . 35
25. Growth velocity curves for 80% and 95% HNO3 and 20% and 5% H2SO4 mixtures at 3 m.Curves also show the growth velocities for the same mixtures with a small amount ofsoot added . . . . . . . . . . . . . . . . . . . . . . . . . . . . . . . . . . . . . . . . . . . . . . . . . . . . . . . . . . . . . . . . . . . . . . . . . . . 35
26. Growth velocity as a function of supercooling for sodium chloride. . . . . . . . . . . . . . . . . . . . . . . . . . . . . . . 37
27. Growth velocity as a function of supercooling for ammonium bisulfate . . . . . . . . . . . . . . . . . . . . . . . . . . . 37
28. Growth velocity as a function of supercooling for ammonium sulfate. . . . . . . . . . . . . . . . . . . . . . . . . . . . . 38
29. Growth velocity as a function of supercooling for nitric acid . . . . . . . . . . . . . . . . . . . . . . . . . . . . . . . . . . . 38
30. Growth velocity as a function of supercooling for sulfuric acid. . . . . . . . . . . . . . . . . . . . . . . . . . . . . . . . . . 39
31. (a–c). Kohler curves for ammonium sulfate, nitric acid and sulfuric acid with molar andmolal concentrations indicated . . . . . . . . . . . . . . . . . . . . . . . . . . . . . . . . . . . . . . . . . . . . . . . . . . . . . . . . . . . 42
B-1. Photochemical lifetime of HNO3 for winter, as calculated by Garcia-Soloman (1983) as afunction of altitude and latitude . . . . . . . . . . . . . . . . . . . . . . . . . . . . . . . . . . . . . . . . . . . . . . . . . . . . . . . . . . 49
v

ACKNOWLEDGMENTS
The research was supported by National Aeronautics and Space Administration (NASA) Research GrantNAG-2572.
I would like to thank Dr. John Hallett for being a terrific advisor with the insight and knowledge to lead methrough the completion of this thesis. Also, I would like to thank Dr. Alan Gertler and Dr. John Frederick for theirwillingness to serve on my committee and help me when I had questions.
I would also like to thank Bill McCain of PRC Inc. and L. J. Ehrenberger of NASA Dryden Flight ResearchCenter for giving me encouragement, and work experience while continuing my education.
To my parents, Edward and Lynn Teets, for their unconditional support and encouragement through my schooland life. Without these two great people this thesis would not be possible.
Last but not least, I would like to thank my wife Elisa Olson Teets for her patience and support during mygraduate study.
vi

ABSTRACT
The nucleation and growth of different phases of simulated polar stratospheric cloud (PSC) particles wereinvestigated in the laboratory. Solutions and mixtures of solutions at concentrations 1 to 5 m (molality) ofammonium sulfate, ammonium bisulfate, sodium chloride, sulfuric acid, and nitric acid were supercooled toprescribed temperatures below their equilibrium melting point. These solutions were contained in small diameterglass tubing of volumes ranging from 2.6 to 0.04 ml. Samples were nucleated by insertion of an ice crystal, or insome cases by a liquid nitrogen cooled wire. Crystallization velocities were determined by timing the crystal growthfront passages along the glass tubing. Solution mixtures containing aircraft exhaust (soot) were also examined.Crystallization rates increased as ∆T2, where ∆T is the supercooling for weak solutions (2 m or less). The higherconcentrated solutions (>3 m) showed rates significantly less than ∆T2. This reduced rate suggested an onset of aglass phase. Results were applied to the nucleation of highly concentrated solutions at various stages of polarstratospheric cloud development within the polar stratosphere.
NOMENCLATURE
A constant for a given substance
a a function of the environment variable,
AAOE Airborne Antarctic Ozone Experiment
ACS American Chemical Society
b variable,
CCN condensation cloud nuclei
CFC chlorofluorocarbons
D diameter
DFRC NASA Dryden Flight Research Center, Edwards, California
e inverse of natural log, 2.71828
vapor pressure over the solution
es vapor pressure of the pure solution
hv solar energy, nm
JPL Jet Propulsion Laboratory
Kf freezing point depression constant
M mass
m moles of solute per kilogram of solvent
ms mass of solute, K
n moles of solute
N0 number of effective solute molecules of mass
n0 moles of solvent
NAT nitric acid trihydrate
NMR number mixing ratios
OCS carbonyl sulfide
P best fit slope of the growth velocity on a log-log plot
PSC polar stratospheric cloud
2σ ρLRvT⁄
3imv 4πρLms⁄
e'

r radius
Rv universal gas constant
RH relative humidity
SAM II Stratospheric Aerosol Measurement II
SAT sulfuric acid tetrahydrate
T temperature
Vr growth velocity, cm sec–1
∆G Gibbs free energy
∆T degree of supercooling for weak solutions
∆Tf temperature freezing point depression
η viscosity
κ thermal diffusivity of glass or liquid, cm2 sec–1
density of the liquid
σ surface tension
τ thermal equilibrium
CHAPTER 1: INTRODUCTION
Nucleation and growth of polar stratospheric cloud (PSC) particles has become of great interest because of therecent discovery of the PSC link to ozone destruction. PSCs form in the polar vortices, on H2SO4-nH2O nucleiparticles. This process occurs by the deliquescence of nitric acid (HNO3) and water (H2O) onto these particles asthe temperatures in the stratosphere drop during the Arctic or Antarctic winters. A knowledge of the stratosphericaerosol nucleation process and how these particles grow is an important aspect in understanding the formation ofthese clouds. In general, the nucleation process is dominated by the presence of impurity nucleation, which preventsthe occurrence of substantial supercooling. However, on occasion nucleation can be initiated in the absence ofimpurities by growth from large clusters of atoms and molecules. This is homogeneous nucleation of the substanceby itself, as opposed to heterogeneous nucleation by impurity.
In the laboratory experimental techniques for the study of nucleation processes follow the simple method oftaking smaller and smaller samples until the probability of having impurity-induced heterogeneous nucleation isreduced to insignificant levels. Nature applies this technique very effectively in clouds in the atmosphere, whichcontain liquid water or solution droplets less than about 10 µm in diameter. Studies have shown these droplets canbe supercooled to – 40 °C. This is in contrast to that of freezing a bucket of water which normally occurs at less thana few degrees of supercooling. Consideration must be given to the nucleation of concentrated sulfuric and nitric acidmixtures in high level polar stratospheric clouds whose particles can remain liquid to temperatures far below –50 °C.
This study is concerned with understanding the phase change of solution droplets in high level clouds and theirsubsequent crystal growth. The emphasis is concerned with specific metastability and phase changes, not only inPSC but in all aerosols. In the lower atmosphere the aerosols consist of mixtures of ammonium sulfate, ammoniumbisulfate, sodium chloride and others. In the stratosphere, at PSC levels, aerosols are comprised mainly of sulfuricand nitric acid from volcanic injection or from upward diffusion from the lower atmosphere. It is these aerosols thatare suspected of catalyzing ozone destruction reactions by adsorption on the surfaces of crystallized particles. Forhigh concentrations of acids, viscosity increases to give the droplet the appearance of a glass at sufficiently lowtemperatures, limiting the internal diffusion of adsorbed trace components.
ρL
2

Major questions arise concerning the extent to which such particles supercool prior to crystallization, the natureof the crystallization process itself in these droplets, and the nature of subsequent growth from vapor depending onenvironmental conditions—temperature and vapor pressure. The phase of the particle is important in determiningthe role these particles serve as either a growth nucleus or a substrate for adsorption/absorption of trace chemicalspecies and heterogeneous catalysis.
Literature pertinent to the formation of PSCs and the physical relationships influencing nucleation and aerosolgrowth is reviewed. Experiments to exhibit the influences of composition and temperature on nucleation and crystalgrowth rates for solution of sulfuric acid (H2SO4), nitric acid, ammonium sulfate, ammonium bisulfate, and sodiumchloride are described, together with recommendations for future research.
CHAPTER 2: THE ATMOSPHERE
The vertical distribution of temperature for a “standard atmosphere” is shown in figure 1. This profile isrepresentative of typical conditions in the middle latitudes. As indicated in the figure, the vertical profile can bedivided into three distinct layers: troposphere, stratosphere, and mesosphere. The tops of these layers are called thetropopause, and stratopause, respectively.
The troposphere (literally, the turning or changing sphere) accounts for more than 80% of the mass and virtuallyall the water vapor, clouds, and precipitation in the earth’s atmosphere. It is characterized by rather strong verticalmixing; for example, in clear air it is not unusual for an air parcel to traverse the entire depth of the troposphere overthe course of a few days. The transition from the troposphere to the stratosphere is usually marked by an abruptchange in the concentrations of some of the variable trace constituents; water vapor decreases sharply while ozoneconcentration often increases by an order of magnitude within the first few kilometers above the troposphere. Thesestrong gradients just above the tropopause are a reflection of the fact that there is relatively little mixing between thedry ozone-rich stratospheric and the relatively moist ozone-poor tropospheric air.
3
Figure 1. Standard temperature profile. (U. S. Standard Atmosphere, 1976)
2 01 00- 1 0- 2 0- 3 0- 4 0- 5 0- 6 0- 7 0- 8 0- 9 00
10
20
30
40
50
60
70
80
Temperature (Celsius)
Alt
itu
de
(k
m) Stratopause
Mesosphere
Stratosphere
Tropopause
Troposphere

The stratosphere (literally, the layer sphere) is characterized by very weak vertical mixing. Aerosols, in stratifiedlayers, are observed to persist for long periods of time within a limited altitude range. It is within the stratospherewhere the much publicized and very important protective ozone layer exists. This ozone layer absorbs a large amountof the harmful ultra-violet radiation and prevents it from reaching the earth’s surface. Consequently, absorption ofthe ultra-violet radiation heats the stratospheric air. This absorption is the reason for increasing temperature withheight. The temperature maximum generally exists near 50 km. In contrast, during the polar winter months ataltitudes of 10–15 km, the lower stratosphere provides the coldest temperatures, 173 K (–100 °C). This study willcenter on the processes that lead to PSC formation in these regions.
Observation of Stratospheric Clouds
Stratospheric clouds have been observed for over a hundred years over the poles during their respectivewinter months. However, with the introduction of the satellite age and the launching of Stratospheric AerosolMeasurement II (SAM II) on the Nimbus 7 spacecraft in 1978, the age of understanding stratospheric aerosol andpolar stratospheric clouds began. Detection of clouds was accomplished by the SAM II basic data product—anextinction profile. New investigations have shown that cloud particles are a relatively common phenomena duringthe Antarctic winters below 25 km, and have a highly negative correlation to temperatures T < 195 K (McCormick,et al., 1982). In the past, these clouds were usually observed over land. However, for the first time, SAM II observedclouds where no land existed and which could not be seen from the ground. Researchers were first confused byobservance of these clouds at these locations because this eliminated the possibility these clouds were nacreous ormother-of-pearl by nature, which are a form of wave cloud that require mountains for the necessary lift. Also ofinterest was the equal distribution of clouds throughout Antarctica, Greenland, Canada, and Scandinavia during thepolar winters (Steele, et al., 1983). Figure 2 shows a schematic representation of solar occultation, used indetermining the extinction as the Nimbus 7 spacecraft passed through sunrises and sunsets at a given altitude.
It was first thought that stratospheric clouds formed rapidly by deposition of water vapor onto sulfuric acidaerosol surfaces when the temperature fell below the frost point of water, approximately –90 °C, as observed withnacreous clouds (Steele, et al., 1983). Extensive work by Mastenbrook in 1968 determined the normal stratosphericwater vapor mixing ratio existed around 5 ppmv ( 3 × 10⁻⁶ mixing ratio), or about 1% relative humidity plus anerror of measurement. Simple atmospheric models by Hamill, Turco, and Toon (1988) suggest that clouds formedby a 5 ppmv mixing ratio would have an extinction of 0.2 km–1 by the time the temperature dropped to 184 K,
4
Figure 2. Schematic representation of solar occultation technique employed by the Nimbus 7 SAM II instrument.(Hamill and McMaster, 1983)

assuming all aerosols were converted to ice. If only 0.1% of the aerosols grow large, the extinction would rangefrom 10–2 to 10–3 km–1. Observations of these clouds in the stratosphere by SAM II began to raise many questionson the water vapor content of the stratosphere since data previously obtained by SAM II indicated extinctionsbetween 10–2 and 10–3 km–1, and only 10% being above 10–2 km–1. However, satellite records for these extinctionsonly observed temperatures between 190 and 200 K, which is too warm to sustain water ice formation. As a resultof the satellite data, these clouds, now considered Type I PSCs, were of considerable interest until it was suggestedby Crutzen and Arnold (1986) and Toon, et al. (1986) that these clouds might consist of condensed nitric acid in theform of crystalline nitric acid trihydrate (HNO3·3H2O), a stable form at these temperatures.
As part of ongoing studies into the growth and formation processes of PSCs, it is now believed that this processconsists of many stages. The formation and multistage growth idea includes; (1) the precursor stage of supercooledliquid H2SO4·H2O aerosol (Steele, et al., 1983); (2) an intermediate stage in which HNO3 and H2O vapors are co-deposited onto frozen aerosol nuclei as nitric acid trihydrate (HNO3·3H2O) (Toon, et al., 1986); and (3) a final stageof coupled deposition of HNO3·3H2O and pure water ice. Each stage of particle growth is directly related totemperature. To complicate matters, there is evidence that sulfuric acid particles may not freeze at temperaturesabove 195 K. At these temperatures the particles would be highly supercooled and it is reasonable to assume theformation of a droplet would be comprised of H2SO4-HNO3-H2O. However, extrapolated values of vapor pressureindicate that very little nitric acid could be incorporated into such particles (Hamill and Toon, 1991).
In 1987, NASA aircraft flew through stratospheric clouds during the Airborne Antarctic Ozone Experiment(AAOE) to collect cloud particles on impactors and filters. Pueschel, et al. (1992) of NASA Ames Research Center,analyzed filters coated with nitron, a precipitating agent for nitrates. The reaction observed with cloud particles andnitron lead to the growth of nitron nitrate, thus confirming the presence of nitric acid in the stratosphere. This studyhowever, was unable to determine whether the polar stratospheric cloud particles were frozen or liquid. It wasdetermined that within the polar stratosphere there exists about 10 times more nitric acid than sulfuric acid. Cadle,et al. (1973) studied the amount of nitric acid present within the stratosphere as a function of latitude and altitude,as figure 3 illustrates.
5
Figure 3. Nitric acid concentration as a function of altitude and latitude. (Cadle, et al., 1973)
1 08642010
20
30
HNO3 ppbm
Alt
itu
de
, K
m
64 deg
31.2 deg
8.27 deg

Aerosol Layer
The existence of particles in the stratosphere has been inferred for many years from atmospheric optical effectssuch as unusual sunsets, mother-of-pearl and noctilucent clouds. The persistence of these optical effects lasting yearsis explained by a significant amount of particles remaining above the tropopause where downward mixing,turbulence, and washout are nearly non-existent after a major volcanic eruption, such as Mt. Pinatubo in 1991. Whathas been known is that stratospheric aerosol particles can produce spectacular optical displays such as brilliantsunsets and unusual ring coloration of the sun and moon (Hamill, et al., 1977).
In the late fifties, Junge, et al. (1961) flew a balloon-borne condensation nucleus counter through the 15–20 kmlevels and discovered that the stratospheric aerosol layer, or Junge layer, was consistent in its behavior and existedworld-wide. Since that time, with the aid of improving techniques and better measurement platforms, this discoverywas confirmed, although the behavior and consistency, size and concentration, have been proven more variable thanwas first thought.
The most predominant constituent of stratospheric aerosols, identified by Junge, et al. (1961), is sulfurcontaining compounds. Particles collected by Junge, et al. (1961) were subjected to fluorescence analysis and foundto produce x-ray spectra showing a strong peak at the sulfur K α line, a strong, fairly unambiguous indication ofsulfur. Following the 1963 eruption of Mt. Agung, it was discovered that most of the stratospheric particles collectedduring research were liquid (Rosen, 1964). The most probable liquid at the very low stratospheric humidity wasobviously sulfuric acid.
Friend, et al. (1973) suggest the oxidation of sulfur dioxide (SO2) to sulfur trioxide (SO3) with water vapor isthe primary formation mechanism of stratospheric particles, H2SO4. The main source of sulfur dioxide in thestratosphere is from injection of violent volcanic eruptions (Hamill and Toon, 1991) which subsequently becameoxidized to SO3. However, with the emergence of the industrial age many anthropogenic pollutants, such ashydrogen sulfide (H2S) and sulfur trioxide (SO3), were released into the atmosphere, providing additional sulfurcompounds which eventually were transported into the lower stratosphere. More recently, exhausts of rockets andaircraft have also contributed a variety of gases and aerosols into the stratosphere. Sulfur laden compounds areconverted to sulfuric acid (H2SO4) through photochemical reactions. Appendix A illustrates the photochemical stepsin the production and destruction of sulfuric acid as well as thermodynamic and other important properties. Whenin the presence of enough water vapor and significantly cold temperatures, these vapors will eventually condense,forming small sulfuric acid solution droplets.
Stratospheric aerosol particles are usually found in highly stratified layers beginning near the top of thetropopause and extending up to 30 km or more. The height and thickness of the aerosol layers are quite variable,exhibiting temporal and latitudinal trends, as well as an apparent correlation with tropopause height (Rosen,et al., 1975). The particles are typically 0.1 to 0.3 µm in diameter and are present at number mixing ratios (NMR,number per milligram of air) of ~ 60 per milligram (Junge, et al., 1961). In addition, this layer has a marked largeparticle, >0.3 µm diameter, and mixing ratio with a maximum located 6–11 km above the tropopause. Figure 4shows two typical large particle mixing ratio profiles measured at mid-latitudes during 1972–73, showing clearly amaximum in the large particle region. The maximum particle concentration lies in the range of 4–12 per milligram(about 0.4–1.2 particles cm–3 at 20 km), falling off to 1.0 per milligram at higher and lower altitudes. This largeparticle mixing ratio is observed to increase considerably after a volcanic eruption that has plumes penetrating intothe stratosphere. However, within 6 months these NMR levels decrease to prevolcanic levels. As observed above,there are significantly more smaller particles than larger particles; however, the larger particles are of more interestsince their cross section is responsible for light scattering, and the larger particles act as cloud condensation nuclei.
6

Figure 4. Mixing ratio profiles of large particles, r > 0.15 µm, 1972–73. (Hofmann, et al., 1975)
1 51 05010
15
20
25
30
Mixing ratio, number/mg
Alt
itu
de
(k
m)
Hamill, et al. (1982) have implied from their research that there must be other sources of particles outside of thestratosphere when volcanic activity is small, providing the nuclei to maintain the Junge layer. Such possible sourcesare condensed meteoritic vapor and particles transported from the troposphere (Hunten, et al., 1980). Measurementsof particles provide evidence against meteoritic vapor below 25 km (Hamill, et al., 1982). Although Hamill,et al. (1982) and others have suggested that the troposphere could provide a source of nuclei for stratosphericaerosols, there is only limited observational evidence for tropospheric particles entering the lower stratosphere(Goodman, et al., 1989). Evidence shows that only H2SO4 would be produced, and only at the high tropicaltropopause where temperatures often reach – 80 °C. It is conceivable, however, at these conditions, troposphericaerosols such as sodium chloride, ammonium sulfate, and ammonium bisulfate may be transported into thestratosphere by the deep convective system within the tropics. At those temperatures these particles may act ascondensation nuclei for sulfuric acid vapor. Sodium chloride, ammonium sulfate, and ammonium bisulfate in thetroposphere act as cloud condensation nuclei for cirrus and contrails.
Polar Stratospheric Cloud Formation
Although much is yet to be understood, many new studies are slowly revealing the nature of the formationmechanisms of stratospheric aerosols, nitric acid clouds, and water-ice polar stratospheric clouds. Cloud physicistsdo, however, consider the important microphysical processes to be nucleation, condensation and evaporation,coagulation and sedimentation. Figure 5 shows steps leading to the formation of the PSC particles. Our interest inthese clouds resides mainly in their formation and growth processes and as catalysts for chemical reactions leadingto a reduction in the ozone concentrations in the stratosphere (Cadle, et al., 1973).
In the PSC formation process two fundamental questions come to mind. First, how do the background sulfateaerosols serve as condensation nuclei for water and nitric acid vapor (Toon, et al., 1989)? It is presently unclear as towhen in the sequence of events the sulfate aerosols become active, providing a nuclei for HNO3 and water droplets.Second, once these droplets form, do they freeze forming nitric acid trihydrate (NAT) particles (Type I PSC) or
7

Figure 5. Steps leading to formation of PSCs and those leading to the possible ozone destruction. (Hamill andToon, 1991)
remain supercooled as nitric acid droplets? Type I PSCs are considered by many scientists to be the most importantphase in PSC development. It is during this phase of growth that the particles are subjected to additionalmicrophysical processes transforming these clouds into nitrogen sinks, required for ozone destruction. In addition,as temperatures fall below Type I PSCs, deliquescence temperature deposition of water vapor dominates the PSCgrowth, producing a particle consisting predominantly of water ice (Type II PSC). During this phase, the particlesproduced can grow large enough to settle out of the lower stratosphere, dehumidifying and denitrifying thestratosphere. Table 1 lists the properties of the stratospheric particles during each phase.
8
Table 1. Properties of the polar stratospheric particles.
Composition FormSize(µm) Temp (K) Location Source/Area
60–80% H2SO4(could be as low as40 wt% H2SO4)
liquid (perhaps solid also)
0.01–1.0 195–240 global OCS* (1 µm2/cm3)Volcanoes (100 µm2/cm3)Aircraft (sulfur in fuels)
HNO3/H2O(approx 50/50 wt%)(Type I PSC)
solid 0.3–3.0 <195 polar winter OCS (1 µm2/cm3)N2O aircraft (NOx)
H2O/ice(Type II PSC)
solid 1–100(up to 1000for wave clouds)
<187 polar winter OCS (10 µm2/cm3)H2O, CH4
*Carbonyl Sulfide (OCS) was coined by Crutzen in 1976, referring to a water-insoluble and chemically inertcompound.

Although the stratosphere is much cleaner than the troposphere, it contains a significant amount of suspendedparticulate matter, namely the aerosol layer containing sulfuric acid droplets. Under normal stratospheric conditions(20 km altitude and 220 K temperature) the sulfate aerosol has an average diameter of about 0.15 µm and acomposition of 75% H2SO4 and 25% H2O. At these temperatures, these particles are most likely to be supercooledliquid drops. Since the relative humidity in the stratosphere is about 1%, it is easy to show that the environment mustbe cooled to about 188 K before water vapor will condense forming ice crystals.
The equilibrium composition of a droplet of sulfuric acid depends on concentration and temperature. Theparticles in the stratosphere are constantly being bombarded by vapor of sulfuric acid and water molecules, some ofwhich get absorbed. At the same time, both sulfuric acid and water molecules are evaporating from the droplet. Aslong as both processes are occurring, the droplet remains in equilibrium. In the stratosphere there are 108 times morewater vapor than sulfuric acid vapor, therefore the particle will reach equilibrium with water much more quickly thanwith sulfuric acid. It is much easier for the droplet to be in equilibrium with water because every time a molecule isabsorbed one molecule evaporates. However, when a sulfuric acid molecule is absorbed, the composition changesslightly and the molecule must absorb a water molecule to remain in equilibrium. This leads to a very slow growthby condensation. As the environment turns colder, the droplet becomes more dilute as it absorbs water and growslarger. As the temperature falls during the polar night, reaching <195 K, the droplets swell to nearly twice theiroriginal size, and change in concentration from 75% to less than 50% by weight. Figure 6 illustrates the dilutioncurve of a sulfuric acid droplet with decreasing temperature for a fixed 5 ppmv water vapor mixing ratio (Steele andHamill, 1981).
Since the droplet is supercooled throughout this entire process, we must consider the possibility that the dropletwill freeze before it becomes too dilute. Pruppacher and Neiburger (1963) showed that a solute will enhance the
9
Figure 6. Weight composition and maximum supercooling of sulfuric acid droplet as a function of temperature.(Steele and Hamill, 1981; Hallett and Lewis, 1967)

supercooling of pure water and the resultant supercooling will be the sum of the maximum supercooling and theequilibrium freezing-point depression due to the solute. Hallett and Lewis (1967) assumed the supercooling of dilutesulfuric acid droplets in the stratosphere could be very large. In figure 6, the dashed line shows the Hallett and Lewiscurve for supercooled sulfuric acid. Based on the works of Hallett and Lewis (1967), and the change in concentrationby Steele and Hamill (1981), homogeneous freezing of sulfuric acid can be expected where the two lines cross, about189 K. Freezing of the droplet could occur at warmer temperatures by heterogeneous nucleation, i.e., nucleation ona foreign body such as an ice crystal. Crutzen and Arnold (1986) suggest that as the temperature falls below 191 K,the H2SO4 ⁄ H2O solution droplets will most likely be frozen, forming sulfuric acid tetrahydrate (SAT), based onobservation which shows cirrus-like particles near 191 K. Due to their small sizes, there is no direct method todetermine if they are in a solid phase. There is an indirect piece of evidence for solid phase; Lidar observations showlarge polarization values representative of nonspherical particles. This evidence only proves that solid particles arepresent and fails to prove that liquid particles do not exist.
Shortly after the discovery of the ozone hole in Antarctica in 1985 by Farman, et al., and cloud extinctioncoefficient observations from SAM II, it was postulated by Toon, et al. (1986), and Crutzen and Arnold (1986), thatthe PSC cloud observed might be composed of condensed nitric acid trihydrate (NAT) or Type I PSC. Hanson andMauersberger (1988) in a series of laboratory studies, provided in detail the composition and vapor pressure of thetrihydrate and monohydrate at conditions observed in the stratosphere. These studies have led them to the conclusionthat the nitric acid trihydrate hydrate is the most stable at stratospheric conditions. Calculations by Toon, et al. (1986)also suggest that the nitric acid monohydrate may be neglected since the ambient HNO3 vapor pressures are muchtoo low for the monohydrate formation at typical stratospheric temperatures. Nitric acid is formed by photochemicalreaction of reactive NOx compounds (NO, NO2, and N2O5) and water vapor. These compounds are produced bynatural and man-made processes. Appendix B illustrates the photochemical equations involved in the production anddestruction of nitric acid, along with other important properties of nitric acid.
The growth for Type I PSCs is considered the same as for the sulfate aerosols. That is, they are most likely inequilibrium with water vapor and grow only when nitric acid molecules impinge on the droplet. The formation ofnitric acid PSCs in the stratosphere probably does not consist of the freezing of pre-existing supercooled nitric aciddroplets. It seems more likely that the PSC evolves from condensation of HNO3 and H2O vapor onto existing frozenor supercooled particles, most likely of sulfate aerosols. According to Hanson and Mauersberger (1988), thesaturation of HNO3 with respect to NAT is expected at temperatures around 195–196 K for normal stratosphericconcentrations at 50 mb.
In addition to the nitric acid trihydrate cloud, another type of cloud can form. This type occurs when theAntarctic winter temperatures fall below 190 K. As the air cools, water vapor condenses on some of the suspendedparticles, forming water-ice clouds (Type II PSC). The seed particles for these clouds are the nitric acid particles,which have themselves grown on sulfuric acid particles. These clouds, although rare, must be given someconsideration since it is these cloud particles that grow quite large (10–100 µm). However, they are few in number.
In the stratosphere, prior to PSC formation, the amount of nitric acid in the vapor phase is about 5 ppbv, or 5 timesgreater than the gas-phase concentration of sulfuric acid (Hamill and Toon, 1991). It is therefore considered that thegrowth rate and particle sizes of Type I PSC are considerably larger than that of sulfuric acid particle growth. With theobserved water vapor concentration of between 2 and 5 ppmv, an even faster growth of Type II clouds exist. In fact,the growth rates for Type I and II ice clouds are so short (hours or less) that their sizes are controlled mainly by therate of temperature change.
The polar stratospheric clouds are critical to the formation of the Antarctic ozone hole for the following reasons.First, they act to remove nitrogen compounds from the stratosphere by sedimentation, important for the existence ofhigh levels of reactive chlorine species that destroy ozone (Salawitch, et al., 1989). With the particles growing large,
10

as Type II PSC, more and more nitric acid and water is removed by selective nucleation, whereby only a smallnumber of large particles are produced. It is currently believed that these few large particles slowly sediment out ofthe stratosphere, removing both water and nitric acid (Salawitch, et al., 1989), taking perhaps a few weeks to occur.Secondly, unreactive forms of chlorine, such as ClONO2, are converted into reactive forms of chlorine on the surfaceof these clouds (Turco, et al., 1989). Reactions of importance are N2O5 and ClNO2 with water and ClN2O5 andClNO2 with HCl on the surfaces of the PSC producing reactive chlorine and nitric acid. The removal of nitric acid,a Cl neutralizer, by deposition and conversion allows the free Cl atoms unrestricted access to ozone. However, whenthe sun returns and the PSC evaporate, nitric acid is returned to a gaseous state that slowly photolyzes into NO2,reducing the availability of reactive Cl.
It follows that formation of the number of nitric acid particles cannot exceed the number of sulfate particles, butcould be much less dependent on a number of factors. For example, if the temperature decreases slowly, the firstnitric acid particle to form could absorb a significant amount of the excess nitric acid retarding nucleation of otherparticles. Models by Poole and McCormick (1988) suggest that with high cooling rates, 5 K/day, the rate at whichHNO3 condenses is small compared to the rate of increase of available HNO3 vapor (i.e., difference between thesaturated vapor pressure at the surface and the ambient partial pressure), and thus large supersaturation is created,allowing the activation of most frozen sulfuric acid aerosols. This rate of cooling suggests that tens of minutes arerequired for PSC to form. For cooling rates less than 1 K/day, HNO3 condensation is balanced for all particlesproducing fewer nucleated NAT particles. This results in large particles. Hofmann (1990) believed the particlesobserved in Antarctica are the result of growth in which slow cooling rates were observed.
Particles in Solution
Deliquescence
In the next sections, important concepts will be presented to better explain PSC development. It should be notedthat not all material will absorb water at the same rate. There is a common relationship between vapor pressure ofthe solution and the concentration of the solute dissolved in the solution. This relationship is known as Roault’s law:
where is the vapor pressure over the solution containing n moles of solute, and n0 moles of solvent; and es is thevapor pressure of the pure solution with no solute dissolved within. The law says that vapor pressure of a solutionvaries inversely with concentration. With the number of components and phases of this system in thermodynamicequilibrium, there can only be one degree of freedom. Therefore, a solution drop at a particular temperature will bein equilibrium at only one concentration, and one relative humidity (RH). RH is the ratio of vapor pressure over thesolution droplet containing the solute to the vapor pressure of the droplet containing no solute. If the relativehumidity of the environment were to rise, equilibrium would be shifted and the particle would grow. If the relativehumidity were to drop below the equilibrium point, the resultant change would cause the particle to evaporate. Thisequilibrium point is called the deliquescence point. Not all solutes have the same deliquescence point; some of therelevant ones are summarized in table 2.
Particle Growth: Influence of Solute
When mixing water vapor and a solute together a variety of things happen, such as the lowering of the vaporpressure and freezing point. However, in discussing such effects we need to first identify the solution products for
e'es ∞( )--------------
n0
n0 n+---------------=
e'
11

Table 2. Relative humidities of phase transition. (Twomey, 1977)
Particle composition Observed RH
Sodium Chloride (NaCl) ≈ 76%
Ammonium Sulfate (NH4)2SO4 ≈ 80%
Ammonium Bisulfate (NH4HSO4) ≈ 40%
Nitric Acid (HNO3) ≈ 70%
Sulfuric Acid (H2SO4) ≈ 1%
which nucleation will take place and to determine the degree of dissociation or association. This is determined bythe number of ions which are freed by dissociation or combined in association. For a given solute, the value i, theVan’t Hoff factor, is given to describe the number of ions each solute will provide to solution. The size of the ionsand the solvent both determine the Van’t Hoff value; for instance, ammonium sulfate (NH4)2SO4 produces 3 ions,but only 2.3 ions are added to pure water (Low, 1969). A dissolved solute tends to lower the equilibrium vaporpressure of a liquid. Briefly, when a solute is added to a liquid, some of the liquid molecules that were on the surfacelayer are replaced by solute molecules. In addition, these solute molecules have an attraction force on one anotherthat restricts the movement of the liquid molecules. For this reason the vapor pressure of the liquid is lowered.
For N0, the number of effective solute molecules of mass, M, in lowering the vapor pressure may be given by where ms is the molecular weight of the solute. The number of water molecules in mass, m, may
likewise be expressed by . The mass of water, m, may be written When these values arecombined and rearranged, the ratio then becomes
or
where
Upon inspection of this equation it is obvious that the saturation vapor pressure is decreased proportionally tothe number of ions freed in solution, and negatively inversely proportional to the cube of the radius.
Particle Growth: Influence of Curvature
In a growing droplet, the equilibrium vapor pressure over a droplet surface also depends upon its curvature andis given by (Kelvin term)
Here, is the vapor pressure over a surface of radius, r ; σ is the surface tension between the liquid and thevapor; is the universal gas constant; is the density of the liquid, and T is the temperature. This means that adroplet of radius r will be in equilibrium in a vapor environment where flat surfaces of a solution are supersaturated.This equilibrium is a metastable one with respect to growth of a droplet because it takes work to grow an embryo to
iN0M ms,⁄N0m mv⁄ 4 3πρLr
3.⁄
e'es ∞( )-------------- 1
3imvM
4πρLmsr3
-------------------------–=
e'es ∞( )-------------- 1 b r
3⁄–=
b 3imv 4πρLms.⁄=
es r( ) es ∞( ) 2σ rRvρLT⁄( )exp=
es r( )Rv ρ
L
12

size r, but if an embryo gets larger than r, the energy of the system is reduced. This is important because themechanism for formation of crystals in the atmosphere requires the growth of a drop to a size where nucleation cantake place.
Combining the two previous terms produces the Kohler curve, an equation which relates the saturation ratio asa function of particle curvature and the contribution of solute in solution (which by the equation lowers the saturationratio) as given by
where and for r not too small, a good approximation is
Figure 7 shows these Kohler curves for sulfuric acid over a range of initial sizes observed in the atmosphere. Thesecurves represent a range from 10–16 to 10–14 grams for each solute, and a fixed Van’t Hoff coefficient. These curves,which are not the same for all materials, are used to illustrate the sizes of a particular particle at the equilibrium vaporpressure, or relative humidity that exists for a given mass particle. In addition, the curves aid in determining thenucleation point of a droplet at a given molality, an important tool in understanding the nucleation processes thatcontribute to the formation of PSCs.
es' r( )es ∞( )-------------- 1 b
r3
-----– ea r⁄
=
a 2σ ρLRvT⁄ ;=
es' r( )es ∞( )-------------- 1 a r⁄ b r
3⁄–+=
13
Figure 7. Differences in growth of aqueous solution droplets of H2SO4. The dry size is indicated on each curve. (Nairand Vohra, 1974)

Gibbs Free Energy
In order for a particle embryo to form and grow an energy barrier Gibbs Free Energy must first be overcome.The reason the equilibrium is metastable rather than unstable is that the energy barrier must be minimized for thisprocess to occur. During the process of nuclei growth the energy is reduced under experimental conditions. Themechanism of nuclei growth can be analyzed by considering the embryo as a tiny sphere. The sphere will have bothvolume and surface energies expressed by E = ar3 + br2. This relationship is shown in figure 8. The first term is theenergy needed to create a volume, neglecting surface energy, multiplied by ( 4 ⁄ 3 )π for a sphere. The second term isthe surface area term, where b is multiplied by 4π for surface energy. Without going into great detail on the valuesof these terms, we can show the importance of the terms as a function of changing radius. The equation has aminimum for r = 0 and r = –b ⁄ a, and a maximum at r = 0 and r = –2b ⁄ 3a. The value for b will always be positivedue to the energy needed to form a surface. The “a” term, however, is not as simple. For example, the energy requiredfor a molecule to leave the surface of a sphere would increase the energy of the sphere because the volume woulddecrease, thus increasing the surface tension to hold the sphere in its shape. Conversely, the energy of a sphere wouldbe reduced when vapor condenses onto a sphere, increasing its volume.
In summary, the value of a is a function of the environment. Where a is positive, work is required to grow theembryo. If the term were negative, as for a supersaturated solution, the embryo would grow rapidly, but only if thecritical size were met (r = –2b ⁄ 3a). For a > 0, no growth is observed; for a = 0, growth is possible; and for a < 0,growth is certain.
Effects of Relative Humidity
In the atmosphere a wide range of relative humidities can be encountered, from 1% in the stratosphere, tosaturation, and on rare occasion supersaturation. The non-soluble particles are silica, dust, oils and a variety of other
14
Figure 8. Gibbs free energy plot showing the critical radius growth. (Twomey, 1977).

material. The soluble particles are ammonium sulfate and sodium chloride, existing in size ranges of > 0.1 and> 1.0 µm. The physics of these particles are especially important to cloud and fog formation for visibilityand corrosion.
The phase rule of physical chemistry states that the equilibrium of a system of C components and P phasespossesses C – P + 2 degrees of freedom. For a system of a soluble salt and water vapor, three phases exist; a solid,an aqueous solution, and water vapor with two components (water and salt). The degree of freedom is one, whichmeans that we specify one thermodynamic variable, temperature; the other variable factors are set and not free tovary. In other words at a given temperature, water vapor, solution, and solid can exist at only one vapor pressure orrelative humidity. Therefore, this relative humidity represents a phase transition point or a phase transition line onthe temperature-humidity diagram. Figure 9 shows the equilibrium relative humidity line of a saturated solutionagainst temperature.
Growth Rate Factors
Studies have shown crystal growth should occur at the rate of diffusion; however, the rate has been shown to beslower (Humphreys-Owen, 1949). In fact, growth rates were observed to change discontinuously. In crystal growththeory there appears to be three main factors to influence growth rates: diffusion, release of latent heat, and viscosity.While the driving force of crystal growth is diffusion, latent heat and viscosity work against the process, providinga balance of forces and equilibrium.
The principal assumption in growth models is that it happens very fast. The limitation in the rate ofcrystallization is the transfer of solute from solution to the crystal. This transfer process ordinarily involves an eddyof molecular diffusion. This rate, considerably slower than for pure solvent, is believed to be caused by the hinderingof the molecules as they traverse the medium toward the crystal (O’Hare and Reed, 1973).
15
Figure 9. Equilibrium relative humidity (RH) line of a saturated solution against temperature—a curve which alsorepresents the transition line between the regions of solid and solution. (Twomey, 1977)

Lindenmeyer, et al. (1957) showed ice crystal growth in pure water was limited by the amount of latent heatreleased, demonstrating the transport mechanism most responsible for the removal of the thermally enhancedreaction products. Hallett (1964) showed that ice crystal growth in supercooled water grew at a rate approximatelyequal to the square of the supercooling.
Another limiting factor in the growth rate of crystals is viscosity. Viscosity is related to the solute, itscharacteristics, and the environment. In general, most solutions become viscous when the temperature is reduced. Itis very clear that if a solution is a highly viscous solute, molecules may not be able to diffuse to the growing crystalquickly enough and the growth will be very slow. For a viscous solution, the growth rate of a crystal can bedescribed by
where η is the viscosity, ∆T is the degree of supercooling, and n is the power having a value of 1 or 2 (O’Hare andReed, 1973). For example, if one lets honey sit for a few months, crystal growth can be observed. If the solutionconcentration increases the viscosity enough, it is conceivable, in theory, that growth rate would not increase andmay actually slow down, and effectively cease.
What the Experiment Will Show
Through the years in which the polar stratospheric particles have been studied, there still remains confusionwhether the PSC exists as highly supercooled liquid droplets, frozen sulfate particles, or particles in a highly viscousglass transition. The interest of these experiments is to better understand the phase transition of the particles as theymove from stratospheric aerosol to Type I and then to Type II PSC. The transition phase of these particles may bethe key in determining the rates at which O3 is being destroyed.
The experiments were conducted to provide detailed data concerning the composition, phase, and formationprocesses of PSCs. To understand the possible phase behavior, sulfuric and nitric acid, ammonium sulfate,ammonium bisulfate, and sodium chloride solutions were supercooled and nucleated to observe solution growthrates at stratospheric temperatures. These growth rates were explored over a wide range of temperature and solutionconcentrations. In addition, military aircraft exhaust (soot), provided by NASA Dryden Flight Research Center(DFRC), Edwards, California, was added to these solutions, re-supercooled and nucleated to investigate anychanges in growth rates due to the addition of the soot. In the stratosphere, mixing of this soot may be neglected dueto the stability and the lack of turbulence; it is therefore possible that these particles may require a very long timebefore eventually falling out. For example, a 1 µm particle, large for a stratospheric aerosol, has the fall speed ofabout 0.13 cm sec–1, requiring a matter of weeks for fallout. Some consideration should be given to this theory if thePSCs are observed more frequently in the future due to the ever increasing amount of exhaust being transported intothe stratosphere, or directly injected there.
A significant portion of the experimental work consisted of attempts to simulate a glass phase of H2SO4-H2Oand HNO3-3H2O solutions by supercooling small volumes, 0.04 ml, of solution. This glass phase assumes, atextreme supercooling, the volume is transformed into a highly viscous liquid or glass without crystal growth. Theseexperiments were conducted in a controlled environment to measure the crystallization rate.
CHAPTER 3: EXPERIMENTAL PROCESS
The experimental setup was designed to measure the crystal growth velocities of solutions at differentconcentrations and degrees of supercooling. In order to investigate these properties, an experimental setup similar
V1η---∆T
n≈
16

to that of Yang and Good (1966) and others was used. This consists of a “|__|” shaped clear glass tubing of differentbore diameters, having identical test observation sections and overall column lengths. Each piece of tubing isapproximately 30 cm, having a sample interval of 15 cm, and a test interval of 7 cm in length. This is illustrated infigure 10. These experiments use 6 different bore hole diameters (0.5, 1.0, 2.0, 4.0, and occasionally 5.0 and6.0 mm). The tubing size choices were determined so that the dimensions of the glass tube opening were largeenough to allow either an ice crystal or a liquid nitrogen cooled wire to be easily inserted. Secondly, minimizationof the volume of liquid was desired in order to achieve maximum supercooling. This setup was chosen because itwas a simple setup with few moving parts and allowed a good view of the growing crystals.
A Neslab model 220D cooling bath with adjustable temperature control, to –90 °C, was selected. The systemprovides an enclosed coolant containment basin in which the glass tubing setup with solution sample could beimmersed. Cyrocool® from Savant Inc., (a clear silicone based heat transfer liquid) was chosen because of the lowtemperatures required, –55 °C. This particular liquid remained less viscous than any other heat transfer liquidsreviewed, and at –90 °C, Cyrocool remained less viscous than water at –90 °C. When choosing a heat transfer liquid,it was important to consider the viscosity trends as a function of temperature. Cyrocool met these requirements.
17
Figure 10. Illustration of the experimentation setup.
®Cyrocool, a registered trademark of Savant Inc., Midland, Michigan.

For accuracy and repeatability the temperatures were monitored by a calibrated thermocouple, to ± 0.05 K, andan accurate mercury thermometer, to ± 0.1 K. The thermocouple and thermometer were connected to the apparatusat opposite ends as illustrated in figure 10, five centimeters below the surface. This arrangement was used so that theliquid could be monitored for the possible formation of thermal gradients, which could lead to erroneous results.
Characterizing the Solutions
Solutions of different concentrations, ranging between 1 and 5 m (molality, m = moles of solute per kilogram ofsolvent), were prepared using standard techniques for each of the 3 salts (<5 m) and the 2 acids at diluteconcentrations (<3.5 M, molarity, M = moles of solute per liter of solution). For acid concentrations greater than 1 m,the concentrations are referred to in molarity, instead of molality. The solutions were prepared to ± 0.05 m usingcertified American Chemical Society (ACS) grade sodium chloride (NaCl), ammonium sulfate (NH4)2SO4,ammonium bisulfate (NH4)HSO4, and reagent grade ACS sulfuric acid 98.8% (H2SO4) and nitric acid 70% (HNO3).The salts were poured into a beaker filled with warm distilled water, and stirred by a Gyratherm magnetic stirrer forabout 1 hour. The acids did not need to be stirred by the magnet, but were shaken periodically to ensure completemixing. At the higher concentration for nitric and sulfuric acids, the freezing point depression, ∆Tf = Kf m (Glasstoneand Lewis, 1960) where Kf is the freezing point depression constant, was not very meaningful. This will be shownlater by the equilibrium curves for sulfuric acid by Gable, et al. (1950), and for nitric acid by Pickering (1893). Thesolutions were prepared with distilled water and placed into containers that had been thoroughly cleaned with strongdetergent, rinsed with distilled water, and placed on a clean shelf to dry.
Supercooling the Solution
This particular cooling device had a built-in mechanical circulating system which constantly mixed the fluid atthe desired temperature, usually between –3° and –55 °C, keeping any temperature gradients to a minimum. Duringthis phase of the experiment the maximum supercooling for each solution at each concentration was determined byslowly cooling the sample until only self nucleation occurred with the solution almost in equilibrium. Thermalequilibrium for the setup was established according to the time constant equation given by Carslaw and Jaeger (1959):
Appendix C shows the thermal conductivity, density, specific heat, and diffusivity of a number of substances. Thetime constant value needed for equilibrium to be established, τ, is equal to 1 ⁄ e or 63.2% of desired temperaturevalue. Thermal equilibrium is established at 5 times τ, which is within 1% of the actual temperature. An estimate ofthe time required for equilibrium, assuming r = 3.0 mm and κ = 5.8E-03 for glass, the equation shows that τ equalsabout 2 to 10 sec, and some 5 times longer for water, depending on the wall thickness. For these studies 3.5 minuteswas considered the time to reach thermal equilibrium. Upon reaching thermal equilibrium, and in the absence ofpremature nucleation, the temperature was decreased by additional 1 or 2 degree increments and allowed to reachequilibrium again. This was continued only until self-nucleation was observed, indicating the last temperature withno nucleation as the temperature limit for supercooling.
where
r = radius of the tubing, cm
and
κ = thermal diffusivity of glass or liquid, cm2 sec–2
τ r2
κ-----≈
18

As a comparison, several tubing sizes (0.5, 1.0, and 4.0 mm diameter) were prepared with identical solutions toidentify the effects of tube size on supercooling. It is believed that the size of the sample volume, the type of solution,and the material of the tubing is important in determining how much supercooling can be possible. This study wasconducted using only a 1 m solution of ammonium sulfate.
Experimental care was used to minimize potential problems. For example, during these experiments severalproblems involving the glass tubing were observed. Namely, the glass had flaws that induced premature nucleation.In addition, if the tubing was not properly cleaned after a test run, residual material may have been left to nucleatethe next runs early in the supercooling process. Also the solution, although carefully prepared, may have had someimpurities that affected both the supercooling and growth rates.
Crystal Growth Rates
This setup was ideal for establishing the growth rate characteristics of the solutions to identify and observe thefollowing properties: crystal growth velocity and crystal shape as a function of supercooling, temperature, andconcentration. The growth velocity Vr (cm/sec), is defined as the velocity of the moving solid-liquid interface in asupercooled or supersaturated solution. First, the growth rate for a 1 m ammonium sulfate solution was conductedusing the 0.5, 2.0 and, 4.0 mm diameter tubing for temperatures ranging from – 4 °C to self-nucleation. Thisprocedure was conducted several times, and the rates averaged to eliminate inconsistencies in timing the growth frontpassages due to either errors in the timing procedure or errors due to unseen gradients. The timing of these growthfronts was accomplished with the use of an ordinary stop-watch. The starts and stops were determined by visualinspection and still photographs. Photographs were taken to show the crystal shapes at low and high supercooling.The timing started as the growth front passed one of two wire markers on each tube and stopped when the frontpassed the second wire. During this portion of the experiment it was important to have accurate knowledge of thetemperature of the coolant immediately surrounding the tubing setup. This was necessary in order to minimizetemperature gradients within the solution prior to nucleation. For this reason the temperature was consistentlymonitored at both ends of the apparatus.
Secondly, the crystal growth rate experiments for each solution at the desired concentrations were conducted inthe 0.5 mm diameter tubing. The 0.5 mm bore hole tube was selected since larger supercoolings were observedduring the supercooling phase. A volume of 0.04 ml supercools more than a 2 ml volume in accord with the followingidea: for given volume there exist a finite number of nuclei that will initiate nucleation. If the volume is halved, thenumber of nuclei is halved. In theory, if the halving process continues, at some point the volume left will becompletely free of any nuclei which could initiate crystal growth. The nucleation of these solutions was initiated oneof two ways after reaching equilibrium. First, an ice crystal suspended on the end of a 0.5 mm copper wire wassubmerged into the supercooled solution just below the surface. Second, if the ice crystal failed to nucleate thesolution, the wire was cooled by liquid nitrogen and again submerged just below the solution surface. In most casesthis worked successfully. Since the temperature of maximum supercooling was known, the tubing setup, withsolution, was submerged in the coolant at a predetermined temperature and allowed to reach equilibrium beforenucleation was initiated. Timing of the growth fronts were again conducted the same as before.
Once completed with the initial test runs for solutions <5 m, inspection of the crystal growth pattern for higherconcentrations of nitric and sulfuric acid occurred. Sulfuric acid and nitric acid each have a series of hydrates whichcan form depending on the temperature and concentration. For example, at 10% by weight H2SO4 there exists, ifnucleated, solid ice plus liquid H2SO4. On the other hand, if 100% by weight H2SO4 were to nucleate, there wouldexist solid H2SO4. Within the 10–100% range, there exists many combinations or hydrates of H2SO4·nH2O. Thesehydrates have a point on a curve where the liquids and solids have the same composition and are in equilibrium witheach other. This point, is the congruent melting point of the compound, and allows the solid and liquid with the samecomposition to coexist.
19

Mixed Solutions
Additional experiments were performed to determine the affects on the supercooling and growth rates frommixing identical concentrations of sulfuric and nitric acid. As shown earlier, the particles observed as PSC containboth sulfuric and nitric acid in different proportions. These experiments investigate the affects, if any, due to themixing of these two acids. Since the phase of the Type I PSC was known to contain significantly more nitric acidthan sulfuric acid, ratios of 80% and 95% by volume of nitric acid were mixed with 20% and 5% by volume ofsulfuric acid. The solution mixtures were prepared using a 1 and 3 M concentration of each solution. The proceduresby which the maximum supercooling and growth rates were conducted were identical to the previous experiments.
Aircraft Soot Mixtures
A follow-on experiment examined a small amount, 0.6 grams per 15 ml solution, of engine exhaust (soot) addedto the 3 M concentrations of nitric and sulfuric acid, 95/5 and 80/20 respectively. This experiment simulated thepossible interaction between stratospheric aerosols, cloud particles, and insoluble aircraft exhaust. This soot wasexhaust buildup of JP-4 fuel from an engine of a F-104 Starfighter, an aircraft capable of flying to 70,000 ft. Thesoot for these runs was obtained by scraping residue from the rear of the exhaust nozzles of the aircraft. Thisparticular aircraft had not been used for at least 6 months and it was unclear as to the exact composition and whatadditional materials (such as sand, metal, smoke, etc.) that may have been contained in the residue. This aircraft,considered one of the dirtiest burning engines, puts many grams of soot aerosols per pound of fuel into theatmosphere. The interest of soot may be important due to the increase of the nucleation rate of aerosols leading tothe production of aircraft contrails and early nucleation of stratospheric aerosols, a precursor to the PSCs. Theprocedures were identical to those used to determine the growth rate of acid concentrations with no soot.
CHAPTER 4: EXPERIMENTAL RESULTS
Supercooling is the reduction of temperature of any liquid below the melting point of that liquid’s solid phase —that is, cooling beyond its nominal freezing point. Results from the various experiments are displayed in this section.Data plots are presented showing the effects of tube diameter on growth rate and degree of supercooling. Crystalgrowth rates are plotted as a function of supercooling and temperature for the selected acid and salt solutions. Theseplots all show good experimental data. Also, three series of photographs showing the growth fronts and crystalshapes at intervals during the course of the experiments under specific conditions are presented.
Growth vs. Tube Diameter
The use of different size glass tubes or capillaries provided the intended data array. Growth rates as a functionof supercooling and tube diameter differed with the larger diameter (4.0 mm) tubing, which has an environment moreconducive to higher crystal growth rates. That is, the diameter of the tubing was large enough to allow the crystalsto grow in a semi-free environment, free of container walls. On the other hand, the smaller diameter tubing (0.5 mm)restricts the growth rate, which appears to be strongly influenced by tube diameter. Figure 11 shows the effects oftube diameter on growth velocity for a supercooled 1 m solution of ammonium sulfate at a temperature of –11 °C(7.3 K supercooled). This trend shows a direct relationship between tube diameter and growth rate. Similarly,figure 12 shows the growth rates and degree of supercooling as a function of temperature and tube diameter. Whilethe 4.0 mm tubing does support a faster growth rate, the 0.5 mm tubing provides for an additional 5 degrees ofsupercooling, due to a small volume. This was a compromise that will be discussed later. Since this study is mainlyinterested in simulating the high degree of supercooling experienced in the real atmosphere, the 0.5 mm tubing, withits small volume, was used to provide these conditions. Upon further inspection of figure 11, it appears at some pointabove 4.0 mm that free growth rate may approach a constant.
20

21
Figure 11. Tubing diameter in supercooling for 1 m solution of ammonium sulfate at a temperature of about –11 °C(7.3 K supercooled).
Figure 12. Growth rates as a function of tube diameter and temperature. Equilibrium ice-solution temperature isshown at –4 °C.
765432100.5
0.6
0.7
0.8
0.9
1.0
Diameter, mm
Gro
wth
Vel
oci
ty,
cm s
ec-1

Data from the larger tube provided important information not obtainable from the smaller tubing—a good viewof the growing crystal shapes. Figures 13(a through i) show the growth front within the 4.0 mm tubing containingammonium sulfate at low, medium, and large supercooling. The crystals observed growing in a small supercooling,< 5 K, resembled long thin hollow columns. Crystals that grow in a small supercooling often grow at angles up to 90°from the tube axis and are often difficult to observe. The medium supercooling, 9 K, had crystals that grew alongthe sides slightly faster than through the middle, showing a more organized structure of growing plates, similar tofeathers; this was observed in figures 13(b and c). The larger supercooling, >12 K, had a growth front with crystalsgrowing from the middle shaped like small plate crystals. Figure 13(j) show the shapes of the crystals for dilutesolutions experienced over a range of supercoolings (Wedum, 1979). These crystals represented growth in weaksodium sulfate solutions.
22
Figure 13(a). Crystal growth of a 1 m solution of ammonium sulfate in a 4.0 mm diameter tube at 4.0 K supercooledat 7 sec.
Figure 13(b). Crystal growth of a 1 m solution of ammonium sulfate in a 4.0 mm diameter tube at 4.0 K supercooledat 11 sec.
2 cm

23
Figure 13(c). Crystal growth of a 1 m solution of ammonium sulfate in a 4.0 mm diameter tube at 4.0 K supercooledat 16 sec.
Figure 13(d). Crystal growth of a 1 m solution of ammonium sulfate in a 4.0 mm diameter tube at 9.0 K supercooledat 2 sec.

24
Figure 13(e). Crystal growth of a 1 m solution of ammonium sulfate in a 4.0 mm diameter tube at 9.0 K supercooledat 4 sec.
Figure 13(f). Crystal growth of a 1 m solution of ammonium sulfate in a 4.0 mm diameter tube at 9.0 K supercooledat 6 sec.

25
Figure 13(g). Crystal growth of a 1 m solution of ammonium sulfate in a 4.0 mm diameter tube at 12.0 K supercooledat 1 sec.
Figure 13(h). Crystal growth of a 1 m solution of ammonium sulfate in a 4.0 mm diameter tube at 12.0 K supercooledat 2 sec.

26
Figure 13(i). Crystal growth of a 1 m solution of ammonium sulfate in a 4.0 mm diameter tube at 12.0 K supercooledat 4 sec.
Figure 13(j). Crystal shapes as a function of concentration and supercooling. (Wedum, 1979)

During the stage of determination of the growth rates for weak solutions, interest was expressed in observinghow the growth rates varied with each run. These runs were conducted 10 times. Data for each run was plotted(figs. 14 and 15) as a function of total time for a low (5 K) and high (10 K) supercooling using the 0.5 mm tubing.These plots show good agreement between each run to 4.0% for the higher supercooling and approximately 5.0%for lower supercooling. The variability was not significant because human error in timing the growth fronts mayprovide the largest part of this variability.
27
Figure 14. Growth rate errors due to uncertainties in stop-watch timing at low supercooling.
Figure 15. Growth rate errors due to uncertainties in stop-watch timing at high supercooling.

Supercooling and Growth
Salts
The sodium chloride and ammonium sulfate experiments were successful and predictable, particularly due tothe ease and stability of these substances in solution. It should be noted that sodium chloride and ammonium sulfateare solubility-limited at extremely cold temperatures and have a finite solubility at any temperature (InternationalCritical Tables, 1922). Figures 16 and 17 show the growth rates of each salt against temperature for eachconcentration with equilibrium points (zero supercooling) from International Critical Tables, 1922. Also displayedare curve fit lines for each concentration. It should be noted that all the plots have the first few curve fit data pointseliminated from the figures, the reason being that the growth rates for the first few degrees of supercooling showeda large degree of variability from one run to another, which require greater study. It is clear that at smallsupercoolings and molality, the crystallization velocity increases with supercooling. This is consistent with earlierresults, as is the decrease with molality for a given supercooling (O’Hare and Reed, 1973).
As a solid, ammonium bisulfate is very hygroscopic (taking up water vapor) when left in the open for any periodof time. Ammonium bisulfate in solution also takes up water vapor from the atmosphere, and therefore care must betaken when handling and storing. Similar problems exist for sulfuric acid solutions. Not much data could be foundfor ammonium bisulfate with the exception that it nearly completely dissociates when put into solution, becoming
28
Figure 16. Growth velocity as a function of molality and temperature for sodium chloride; freezing point depressionis 3.37 K per 1 m.

Figure 17. Growth velocity as a function of temperature and molality for ammonium sulfate; with growth rate forpure water; equilibrium freezing point depression is 3.86 K at 1 m.
dilute sulfuric acid. Figure 18 illustrates the growth curves for each concentration. These curves are similar to thesodium chloride and ammonium sulfate for weaker concentrations, but at higher concentrations a largersupercooling can be achieved with a much colder self nucleation temperature. Also the growth rate curves begin toshow signs of a constant growth rate with decreasing temperature. Since ammonium bisulfate produces a weaksulfuric acid solution, this means that when the solute comes out of solution there is no longer any simple way ofdetermining which crystal is growing, or if the crystal is of purely one substance (either ice or sulfuric acid hydrate).
Acids
Unlike the salts, the acids are a little trickier to work with, but are infinitely soluble within the temperature rangesof these experiments, – 4° to –54 °C. Figures 19 and 20 provide the growth rates for nitric and sulfuric acid. Alsoillustrated are the curve fits of the data. These data show that the growth rates for the weakest solutions are nearlythe same as for the salts. However, for the higher concentrations (2 m and greater) the growth rates are reducedsignificantly. On these figures, the point farthest to the right for each curve represents the maximum supercoolingthat could be achieved.
At the higher concentrations and increased supercooling it is clear that as the growth rate slows it approaches amaximum. This is indicative of the increased solution viscosity. The key to this study is the growth rates at the high
29

30
Figure 18. Growth velocity as a function of temperature and molarity for ammonium bisulfate; freezing pointdepression is 3.8 K at 1 m.
Figure 19. Growth velocity as a function of temperature and molarity for nitric acid; freezing point depression is3.6 K at 1 m.

Figure 20. Growth velocity as a function of temperature and molarity for sulfuric acid; freezing point depression is3.8 K at 1 m.
end of supercooling with increased concentration. The curve fit data trends show that if the temperatures could bereduced further providing a higher supercooling, a reduction in growth rate should take place. Extrapolating thegrowth rate for the acids by 20 K supercooling illustrates nearly a 20-fold decrease in growth rate with a smallincrease in concentration, from 1.0 to 3.0 M.
Growth Rate at High Concentration
The growth rates observed for higher concentrations are similar to those at lower concentrations, except that thevelocities are more influenced by temperature and concentration (i.e., viscosity). Figure 21(a) shows the growth ratesfor the higher concentrations of nitric acid. These curves show a trend that is generally unclear; for example, theweakest concentration has the coldest equilibrium temperature and the second slowest growth rate. It should beremembered that for the higher acid concentrations the use of molarity (M) instead of molality (m) was used. As theconcentration increases, the equilibrium temperature increases, as does the growth rates. Figure 21(b) shows thegrowth rate for hydrate crystals as a function of molarity for supercoolings of 10, 20, and 30 K. This can be seen onfigure 22 where the two concentrations, 9.9 M and 10.9 M, have the same equilibrium temperature. While both havenearly the same equilibrium temperature, the growth rate for the higher concentration is slightly slower, as wasexpected since more solute is present. The growth rate at the warmest temperature and weakest concentration, 48%by weight (M = 9.9), is found to actually have the fastest growth rate. Conversely, the slowest growth rate has thehighest concentration and the coldest temperature, 62% by weight (M = 13.5). Figure 22 illustrates the equilibriumfreezing points for nitric acid from Pickering (1893) and all freezing points for specific concentrations measuredduring this study. This figure graphically illustrates the location of the temperatures from data in figures 19 and 21.
Sulfuric acid in our study, unlike nitric acid, becomes very difficult to nucleate when concentration rises above3.5 M. In this study 3.5 M was the last concentration to be nucleated, partly because no growth was observed at the
31

32
(a) Nitric acid.
(b) 3H2O hydrate crystals.
Figure 21. Growth velocities for nitric acid and 3H2O hydrate crystals as a function of supercooling and molarities.Equilibrium temperatures are –30 °C for 40%, –20 °C for 48%, –20 °C or 52%, and –22 °C for 62% by weight.(Pickering, 1893)

Figure 22. Equilibrium freezing temperatures and experimental data showing temperatures and molarity wherenucleation was initiated. (Pickering, 1893)
next higher concentration, and because our equipment could not obtain sufficiently cold temperatures. At thesetemperatures, sulfuric acid became highly viscous. This is shown in appendix A where sulfuric acid became veryviscous with a slight decrease in temperature, which will be discussed later. Figure 23 illustrates the equilibriumfreezing curve of sulfuric acid solution by Gable, et al. (1950) with freezing and measurement points from the survey.This figure also presents data showing we were unable to nucleate concentrations above 35% by weight attemperatures the equipment could attain.
Mixtures of Acids
Much is generally known about sulfuric and nitric acid independently but information on the behavior of theirmixtures is needed to understand PSC formation processes. Studies show that they behave very differently in thepresence of a cold environment. The supercooling procedure remained identical to that used for the unmixedsolutions. Sulfuric and nitric acids were mixed, making two concentrations and each concentration having twodifferent mixtures: 5% H2SO4 to 95% HNO3 and 20% H2SO4 to 80% HNO3 at 1.0 M and 3.0 M. The growth ratesobserved were quite uniform, and as expected, the growth rates increased with supercooling. This was observed forboth the 1.0 M and 3.0 M concentrations. A surprise was that the growth rates for the mixtures were higher than forthe 1.0 M and 3.0 M solutions of sulfuric and nitric acid independently; figures 24 and 25 show these results. Eachgrowth rate test was conducted several times and the results averaged. Again, the curve fit line intentionally deletedthe first few less precise data points. These growth rate curves provided show what appears to be a dependence onthe concentration of sulfuric acid. For example, the growth rate for the 3.0 M 95–5% nitric is generally higher thanfor 80–20% nitric at the low supercooling, and at the larger supercooling the growth rate is significantly higher. Thesame description can be made for the 1 m concentration growth rates.
33

34
Figure 23. Equilibrium freezing temperatures and experimental data showing temperatures and molarity ofnucleation. Triangles indicate points where nucleation was not initiated. (Gable, et al., 1950)

35
Figure 24. Growth velocity curves for 80% and 95% HNO3 and 20% and 5% H2SO4 mixtures at 1 m.
Figure 25. Growth velocity curves for 80% and 95% HNO3 and 20% and 5% H2SO4 mixtures at 3 m. Curves alsoshow the growth velocities for the same mixtures with a small amount of soot added.

Addition of Non-Soluble Material
Soot is generally a non-soluble material and does not dissolve within a solution of sulfuric and nitric acid, butmay affect the crystallization characteristics of the solution by acting as an impurity. As an impurity the soot shouldact to decrease the degree of supercooling and act to nucleate the solution earlier. Figure 24 shows the resultingcurves for the addition of a small amount of soot into the 3.0 M mixtures. Indications by these growth curves seemto show a decrease in the growth rate for both mixtures. Also the data reveals that the addition of the soot hasproduced a few additional degrees of supercooling. If the soot were truly an active nucleating impurity, thenucleation point would actually be warmer. Hence the data from this experiment are suspect. As mentioned earlier,the exact age and composition of the soot is highly questionable. However, if the data are in fact valid, there mustbe some part of the soot particle that becomes part of the solution. The likelihood of aging processes or contaminantsacquired postflight by the soot must be considered.
CHAPTER 5: DISCUSSION OF RESULTS
Growth rates of solution are generally described by the equation where P is the best fit slope ofthe growth velocity on a log-log plot (figures 26 through 30). These plots show the slope for ammonium sulfate,ammonium bisulfate, sodium chloride, nitric acid, and sulfuric acid for each molality and molarity. The P values foreach are listed below:
The values for A, are constant for a given substance; V is in cm sec–1.
These experimental results illustrate the point that ammonium sulfate, ammonium bisulfate, sodium chloride,and sulfuric and nitric acid, have complicated dependences of growth rate as compared to concentration. On theselog-log plots it can be easily shown the approximate supercooling in which the viscosity effects begin to dominate.This is shown by the bending over of the curves to a slower growth rate. The experimental setup worked well overthe course of this study, and has been shown to be very effective in obtaining growth velocities and supercoolingdata over the entire range of temperatures and concentrations.
Ammonium Sulfate Ammonium Bisulfate Sodium Chloride
P = 1.7 ±0.2 (1 m) P = 1.88 ±0.2 (1 m) P = 2.0 ±0.2 (1 m)
P = 1.5 ±0.2 (2 m) P = 1.7 ±0.1 (2 m) P = 2.0 ±0.2 (2 m)
P = 1.3 ±0.2 (3 m) P = 1.3 ±0.1 (3 m) P = 1.9 ±0.2 (3 m)
P = 0.99 ±0.1 (4 m) P = 1.3 ±0.1 (4 m) P = 1.7 ±0.2 (4 m)
P = 0.71 ±0.1 (5 m) P = 1.1 ±0.2 (5 m) P = 1.3 ±0.2 (5 m)
A = 0.015 A = 0.02 A = 0.022
Nitric Acid Sulfuric Acid
P = 1.9 ±0.2 (2 M) P = 1.0 ±0.1 (1 M)
P = 0.55 ±0.1 (2 M) P = 0.64 ±0.1 (2 M)
P = 0.44 ±0.1 (3 M) P = 0.30 ±0.1 (3 M)
P = 0.50 ±0.2 (3.5 M)
A = 0.011 A = 0.007
V A ∆T( )P=
36

37
Figure 26. Growth velocity as a function of supercooling for sodium chloride.
Figure 27. Growth velocity as a function of supercooling for ammonium bisulfate.

38
Figure 28. Growth velocity as a function of supercooling for ammonium sulfate.
Figure 29. Growth velocity as a function of supercooling for nitric acid.

Figure 30. Growth velocity as a function of supercooling for sulfuric acid.
The growth rates as a function of tube diameter show a strong dependence on tube diameter. The data showcrystal growth rates within a glass tube are significantly reduced with decreasing diameter; conversely, the crystalgrowth rate increases with larger diameters. However, the data also show a limit in the crystallization rate withincreasing diameter. In comparison, stratospheric cloud particles exist in relatively small volumes, on the order ofabout 4.0 µm3, compared to the smallest volume used in this study of about 0.0412 cm3 (22 ⁄ 7 × (0.025)2 × 21 cm),or about 10 million times smaller. These results were similar to those found by Yang and Good (1966), who foundthat the size of the tubing directly affected the growth rate. The growth rates depend on the tube diameter, degree ofsupercooling, and the thermal conductivity of the tubing material. However, it is not clear which parameter controlsthe growth rates, and at what temperature the influence of these parameters change. A challenge exists to develop asystem that will support the large supercooling of the smaller diameter tubing while allowing the growth rate of thelarger diameters.
The growth rates for ammonium sulfate, ammonium bisulfate, and sodium chloride show that for a givenconcentration the growth rate increases with increasing supercooling, and at a given supercooling the growth ratedecreases with increasing concentration. These results are consistent with those of O’Hare and Reed (1973).Indications from solubility tables (International Critical Tables, 1922) suggest that these materials may notcontribute to the existence of the PSCs at normal stratospheric conditions, 1% relative humidity at 200 K. Asillustrated by Twomey (1977), the phase transition of a particle from a solid to liquid will not occur until a sufficientrelative humidity exists, shown in table 2. These conditions, in general, never exist. However, these materials are thenatural material by which tropospheric processes such as fog and haze occur, with relative humidity significantlygreater than the stratosphere.
The growth rate data suggest, as the concentrations increase, a tendency for the growth curves to reach amaximum followed by leveling off with supercooling. Consider the possibility that once this maximum rate isreached, and provided additional supercooling can be obtained, a decrease in growth rate can be observed, as
39

suggested by the alternate curve. If this actually occurs, and the volume is reduced sufficiently, it may be possibleto achieve a point where no growth occurs, leaving the droplet in a so-called “glass transition.” This glass transitionhas been characterized by a solution becoming so viscous due to the extreme supercooling, the droplet actually takeson glass-like characteristics. This glass, however, still a liquid, exhibits a high viscosity where the diffusionproperties are reduced to those of a solid. In addition, the reduction of these properties may cause the heterogeneousreactions which once took place internally, to now occur only on the surface. However, because our test uses asample volume many magnitudes larger than actual droplets it is difficult to determine whether a glass transitionoccurs with the volumes in this study. Appendices A and B show additional data describing the affects of temperatureand viscosity on sulfuric and nitric acid respectively.
Sulfuric acid is very hygroscopic; it may not freeze at 100% by weight, and may never freeze as an aerosoldue to viscosity effects. Figure 23 shows the assumed sulfuric acid equilibrium freezing temperature with respectto concentration, where at 38% by weight (7.5 M), a temperature of nearly –80 °C is required before nucleationcan occur. This study was only able to nucleate sulfuric acid up to 3.5 M (31% by weight). Ohtake’s (1993) workillustrates similar problems. In his work he tried to nucleate sulfuric acid at all concentrations; however, atconcentrations between 37.5% and 65% he was able to nucleate sulfuric acid at temperatures near – 65 °C, butwas not successful in attempts to nucleate sulfuric acid above concentrations of 65% by weight at temperatures of–104 °C. Ohtake discovered that the phase diagrams (represented in fig. 24) used from Gable, et al. (1950) wereactually the melting points of sulfuric acid and its hydrates, instead of nucleation temperatures. Figure 6 showshow sulfuric acid deliquesces as a function of temperature in cases of a fixed mixing ratio.
For nitric acid the lowest equilibrium temperature was – 40 °C, whereas sulfuric was – 80 °C. Anothercharacteristic that separated the two acids was viscosity as a function of concentration. At 100% by weight, sulfuricacid has a viscosity of 25.2 cP (Centipoise) at 20 °C, where nitric acid at 100% by weight has a viscosity less thanwater at 0.88 cP. For the higher concentrations, the nucleation temperatures were warmer, and nitric acid permittednucleation. This became important when temperatures fell below 195 K. Figure 21(a) shows a change of growthrate because of temperature and viscosity changes. Significant growth rates are observed for equilibrium curves attemperatures between –10 to –25 °C. These curves show an increase in growth rate due to temperature. Also, whentemperatures are below –25 °C the growth rates decrease due to viscosity effects. These conditions showed agrowth rate increase of a factor of three, with a 2.0 M increase in concentration and 10 °C warming. At the sametemperature and a concentration increase of 1.0 M, for example, the viscosity increased and the growth ratedecreased by one-third.
A phenomena was observed for nitric acid which demonstrates the presence of a hydrate. This consisted of asecondary crystallization. Initial crystal growth occurred in the normal observed way for 7.6 M nitric acid at atemperature near –50 °C, 20 K supercooled at 0.2 cm sec–1. The secondary growth occurred several minutes afterthe completion of the first, at a growth rate of about 0.01 cm sec–1. This data was not illustrated on the figurepresented. The second front had a whiter appearance, suggesting very fine crystals. This secondary front generallyoccurred at the higher concentrations, and could not be reliably repeated.
A significant increase in the growth rate is observed in a mixture of nitric and sulfuric acid for both the 1.0 Mand 3.0 M concentrations. In addition, the data suggest that an increase in the equilibrium temperature freezing pointmay occur. Several runs were conducted showing good repeatability in the data. Molina, et al. (1993) have alsoshown that the growth rates will greatly increase with the addition of nitric acid into bulk sulfuric acid.
A limited number of runs were carried out in this study, with aircraft soot being added to the acid mixtures. Themost important feature is the decrease of the nucleation temperature, which lowers the contribution from the mixtureto nearly its original values. It is possible that in the atmosphere, the ternary H2SO4 ⁄ H2O ⁄ HNO3 exists and soot
40

mixes with a particle. If so, the aerosol may contain a small portion of unburned fuel that may contribute to anincreased viscosity and concentration, thus reducing the crystal growth rate.
Diffusion Chamber
Another method in analyzing the processes in PSC formation will involve the use of a thermal diffusion chamber.This study will combine processes to show the stages of PSC growth from aerosol activation to NAT crystal growth.This technique will be used to study the shape of the growing crystal under the influence of temperature, saturationratio and supersaturation. This diffusion chamber will provide the controlled conditions necessary to aid in thesimulated growth of the PSC, particularly the formation of the NAT particles. As a result of the experience with thepresent thermal diffusion chamber, recommendations for future test apparatus are described below. Thisrecommended system will contain sulfate aerosols, water, and nitric acid vapor within two parallel plates separatedby 3 cm. These two plates will each be temperature controlled by the use of thermoelectrics, and cooled by anexternal circulation bath system to withdraw heat produced by these thermoelectrics. Each plate will have a specifiedtemperature with the top plate being warmer to provide the source of vapor, made of an acid resistant stainless steel,while the bottom plate will be colder to produce the supersaturation. The chamber walls will be made of acidresistant plastic. Temperature range will be from –90° C on the lower plate to – 60 °C on the upper plate. A lineartemperature gradient will establish a saturation vapor pressure curve (according to the Clausius-Clapeyron equation,as a function of temperature) between the lower and upper plates. This chamber can be adjusted to the desiredtemperature providing many degrees of supersaturations. However, since the nitric acid and water vapor each willhave their own independent saturation profiles, there will exist two independent points of supersaturations betweenthe plates. This point of maximum supersaturation will be the location where the crystals grow.
Recommendations
In the future, improved testing techniques and equipment for temperatures to –100 °C should be considered anecessity in order to obtain the high degree of supercooling needed to validate the theory which describes the growthrate with decreasing temperatures. To complete the analysis of the supercooling effects, a design like the diffusionchamber would be useful to obtain the crystallization properties of the sulfuric-nitric acid mixtures, and to examinethe true effects of supercooling and viscosity in a free environment on extremely small aerosol particles.
Conclusions
Results from the present experiments indicate and support a theory that sulfuric acid aerosols may not be frozenat the temperatures where nitric acid uptake begins. This conclusion is obtained by the fact that HNO3 uptakes ontoaerosols at temperatures near 195 K. At that temperature, assuming normal stratospheric conditions, the droplet isabout 50% H2SO4 by weight, and only 10 K supercooled. As shown in this study, sulfuric acid is not nucleatedabove 31% by weight (3.5 M). In addition, at temperatures below –50 °C, the viscosity effect is such that theprobability of nucleation taking place becomes very low. However, this study has shown that if nitric acid can beadded into the solution droplet, nucleation may be possible at higher temperatures.
The acid mixture data show a growth rate dependence on the H2SO4-HNO3 mixture fraction and temperature.This implies that the probability of nucleation for a sulfuric acid particle increases with the presence of nitric acid.The adding of a non-reactive soot to a solution decreases the growth rate. Applying the volume theory, the dropletcould become a glass at lower temperatures. To a small degree, the addition of soot to a solution tends to show areduction in growth rate and supercooling. Whether this is considered important remains to be seen, but at a firstglance may suggest some important factors regarding the formation of contrails, which are always observed withpassing aircraft in cold atmospheric conditions.
41

In a realistic environment, sodium chloride, ammonium sulfate and ammonium bisulfate would not beconsidered a significant contribution to stratospheric aerosol. Since these salts would only be found as a solid aerosol,and their deliquescence point is too high, >70% RH, they could be neglected as a participant in PSC formation.However, these aerosols can be transported into the upper troposphere and lower stratosphere by deep convection,and depending upon the relative humidity reaching the deliquescence point, these particles may activate and becomea high altitude haze or cirrus cloud. Figures 29 through 31 illustrate the change in equilibrium size with increasinghumidity for ammonium sulfate, nitric acid, and sulfuric acid in Kohler curves. These Kohler curves also indicate thechange in molality and molarity of each of the particles ranging in mass from 10–17 to 10–14 grams. Aerosols mayalso contribute to the production of visible contrails at high humidities. Cold temperatures, < – 60 °C, during late falland early spring, combined with the moisture advected by storm systems, may often provide these conditions.
Implications
Increasing viscosity of high concentration solutions with decreasing temperature indicates a lowering of thediffusion coefficient. The diffusion coefficient for water is about 10–4; glass approaches 10–12 cm2 sec–1,comparable with a solid. The rate of diffusion of any size droplet is described by r
2/D. For a droplet of 1 µm, thismeans it takes 10–4 sec for water and 104 sec for a glass. With lifetimes of some clouds being 103 s, for PSC andcirrus, surface absorption reactions become important for ice and deeply supercooled stratospheric cloud particles;for liquid water droplets, the diffusion process occurs readily. It is not readily understood which process is the mostimportant to each type of cloud.
42
(a) Ammonium sulfate.
Figure 31. Kohler curves for ammonium sulfate, nitric acid, sulfuric acid with molar and molal concentrationsindicated.

43
(b). Nitric acid.
(c) Sulfuric acid.
Figure 31. Kohler curves for ammonium sulfate, nitric acid, sulfuric acid with molar and molal concentrationsindicated.

The addition of aircraft exhaust soot has been shown to hinder the growth and nucleation process of solutions.Why and how these effects occur need to be studied further and exhaust from a variety of aircraft must be used. Itappears that depending on temperature and stratospheric water content, stratospheric cloud particles are able to existin metastable compounds; however, these situations are extremely difficult to predict and should be viewed as thenext research challenge.
The abundance of lower atmosphere aerosols may be useful as condensation cloud nuclei (CCN) for contrails.In addition to the natural aerosols present, the current aircraft fleet deposits a significant amount of particulatematter which produce contrails on a regular basis. There is some evidence, as observed by studying the skysometime after a contrail has been produced, that on occasion the contrails will eventually form a cirrus cloud.However, because such material exists in the upper troposphere and lower stratosphere this matter should beconsidered by future investigations.
The overall implication is that particles at cirrus and PSC levels are capable of existing in a metastable condition.These particles may provide significant effects on chemical reaction rates through internal mixing, leading to ozonedestruction; however, for highly viscous liquids only surface reactions occur.
44

BIBLIOGRAPHY
Cadle, R. D., Grahek, F. E., Gandrud, B. W., and Lazrus, A. L., 1973: “Relative Efficiencies of Filters and Impactorsfor Collecting Stratospheric Particulate Matter,” J. Atmos. Sci., vol. 30, pp. 745–747.
Carslaw, H. S. and Jaeger, J. C., 1959: Conduction of Heat in Solids, 2nd ed., Clarendon Press.
Crutzen, Paul J. and Arnold, Frank, 1986: “Nitric Acid Cloud Formation in the Cold Arctic Stratosphere - A MajorCause for the Springtime ‘Ozone Hole’,” Nature, vol. 324, pp. 651–655.
Farman, J. C., Gardiner, B. G., and Shanklin, J. D., 1985: “Large Losses of Total Ozone in Antarctica RevealSeasonal ClO(x) ⁄ NO(x) Interaction,” Nature, vol. 315, pp. 207–210.
Friend, James P., Leifer, Robert, and Trichon, Morris, 1973: “On the Formation of Stratospheric Aerosols,” J. Atmos.Sci., vol. 30, pp. 465–479.
Gable, C. M., Batz, H. F., and Maron, S. H., 1950: “Phase Equilibria of the System Sulfur Trioxide-Water,” J. Amer.Chem. Soc., vol. 72, pp. 1445–1448.
Garcia, R. R. and Soloman, S., 1983: “A Numerical Model of the Zonally Averaged Dynamic and ChemicalStructure of the Middle Atmosphere,” J. Geophys. Res., vol. 88, pp. 1379–1400.
Glasstone, Samuel and Lewis, David, 1960: Elements of Physical Chemistry, 2nd ed., Van Neustrian Co., Princeton,New Jersey.
Gmitro, John Irving and Vermeulen, Theodore, 1964: “Vapor-Liquid Equilibria for Aqueous Sulfuric Acid,” Amer.Inst. of Chem. Eng. J., vol. 10, no. 5, pp. 740–746.
Goodman, J., Toon, O. B., Pueschel, R. F., Snetsinger, K. G., and Verma, S., 1989: “Antarctic Stratospheric IceCrystals,” J. Geophys. Res., vol. 94, pp. 16449–16457.
Hallett, J., 1964: “Experimental Studies of the Crystallization of Supercooled Water,” J. Atmos. Sci., vol. 21,pp. 671–682.
Hallett, J. and Lewis, R. E. J., 1967: “Mother-of-Pearl Clouds,” Weather, vol. 22, no.2, pp. 56–65.
Hamill, P., Toon, O. B., and Kiang, C. S., 1977: “Microphysical Process Affecting Stratospheric Aerosol Particles,”J. Atmos. Sci., vol. 34, pp. 1104–1119.
Hamill, P., Turco, R. P., Kiang, C. S., Toon, O. B., and Whitten, R. C., 1982: “An Analysis of Various NucleationMechanism for Sulfate Particles in the Stratosphere,” J. Aerosol Sci., vol. 13, no. 6, pp. 561–585.
Hamill, P., McMaster, L. R., 1983: “Proceeding of a Workshop on Polar Stratospheric Clouds: Their Role inAtmospheric Processes,” NASA-CP-2318.
Hamill, Patrick, Turco, R. P., and Toon, O. B., 1988: “On the Growth of Nitric and Sulfuric Acid Aerosol ParticlesUnder Stratospheric Conditions,” J. Atmos. Chem, vol. 7, pp. 287–315.
Hamill, Patrick and Toon, Owen B., 1991: “Polar Stratospheric Clouds and the Ozone Hole,” Physics Today, vol. 44,pp. 34–42.
Hanson, David and Mauersberger, Konrad, 1988: “Laboratory Studies of the Nitric Acid Trihydrate - Implicationsfor the South Polar Stratosphere,” Geophys. Res. Lett., vol. 15, pp. 855–858.
Hofmann, D. J., Rosen, J. M., Pepin, T. J., and Pinnick, R. G., 1975: “Stratospheric Aerosol Measurements. I - TimeVariation at Northern Midlatitudes,” J. Atmos. Sci., vol. 32, pp. 1446–1456.
Hofmann, D. J., 1990: “Increase in the Stratospheric Background Sulfuric Acid Aerosol Mass in the Past 10 Years,”Science, vol. 248, pp. 996–1000.
45

Humphreys-Owen, S. P. F., 1949: “Crystal Growth from Solution,” Proceedings of the Royal Society of London,series A, vol. 197, no. A 1048, pp. 218–237.
Hunten, D. M., Turco, R. P., and Toon, O. B., 1980: “Smoke and Dust Particles of Meteoric Origin in the Mesosphereand Stratosphere,” J. Atmos. Sci., vol. 37, pp. 1342–1357.
International Critical Tables of Numerical Data, Physics, Chemistry and Technology, 1st ed., (1922), vol. 3,McGraw-Hill, New York.
Jet Propulsion Lab., Chemical Kinetics and Photochemical Data for use in Stratospheric Modeling, NASA-CR-176198, 1985. (Also published as JPL-PUB-85-37.)
Junge, Christian E, Chagnon, Charles W., and Manson, James E., 1961: “Stratospheric Aerosols,” J. Meteor., vol. 18,pp. 81–108.
Lindenmeyer, C. S, Orrok, G. T., Jackson, K. A., and Chalmers, B., 1957: “Rate of Growth of Ice Crystals inSupercooled Water,” J. Chem. Phys., vol. 27, no. 6, p. 822.
Low, Richard D. H., 1969: “A General Equation for the Solution Effect in Droplet Growth,” J. Atmos. Sci., vol. 26,pp. 608–611.
Mastenbrook, H. J., 1968: “Water Vapor Distribution in the Stratosphere and High Troposphere,” J. Atmos. Sci.,vol. 25, pp. 299–311.
McCormick, M. P., Chu, W. P., Steele, H. M., Hamill, P., and Swissler, T. J., 1982: “Polar Stratospheric CloudSightings by SAM II—Stratospheric Aerosol Measurement Onboard Nimbus 7,” J. Atmos. Sci., vol. 39,pp. 1388–1397.
Molina, M. J., Zhang, R., Wooldridge, P. J., McMahon, J. R., Kim, J. E., Chang, H. Y., and Beyer, K. D., 1993:“Physical Chemistry of the H2SO4 ⁄ HNO3 ⁄ H2O System: Implications for Polar Stratospheric Clouds,” Science,vol. 261, pp. 1418–1423.
Nair, P. V. N. and Vohra, K. G., 1974: “Growth of Aqueous Sulfuric Acid Droplets as a Function of RelativeHumidity,” J. Aerosol Sci., vol. 6, pp. 265–271.
Ohtake, Takeshi, 1993: “Freezing Points of H2SO4 Aqueous Solutions and Formation of Stratospheric Ice Clouds,”Tellus, Series B - Chemical and Physical Meteorology, vol. 45B, no. 2, pp. 138-144.
O’Hare, M. and Reed, C. R., 1973: Modeling Crystal Growth Rates From Solution, Prentice-Hall, Inc., EnglewoodCliffs, New Jersey, (out of print).
Pickering, S. U., 1893: “Isolation of Two Predicted Hydrates of Nitric acid,” J. Chem. Soc., vol. 63, pp. 436–443.
Poole, Lamont R. and McCormick, M. Patrick, 1988: “Polar Stratospheric Clouds and the Antarctic Ozone Hole,”J. Geophys. Res., vol. 93, pp. 8423–8430.
Pruppacher, H. R. and Neiburger, M., 1963: “The Effects of Water Soluble Substances on the Supercooling of WaterDroplets,” J. Atmos. Sci., vol. 20, pp. 376–385.
Pueschel, R. F., Ferry, G. V., Snetsinger, K. G., Goodman, J., Dye, J. E., Baumgardner, D., and Gandrud, B. W., 1992:“A Case of Type I Polar Stratospheric Cloud Formation by Heterogeneous Nucleation,” J. Geophys. Res., vol. 97,no.D8, pp. 8105–8114.
Rosen, James M, 1964: “The Vertical Distribution of Dust to 30 Kilometers,” J. Geophys. Res., vol. 69, no. 21,pp. 4673–4676.
Rosen, J. M., Hofmann, D. J., and Laby, J., 1975: “Stratospheric Aerosol Measurements. II - The WorldwideDistribution,” J. Atmos. Sci., vol. 32, pp. 1457–1462.
46

Salawitch, R. J., Gobbi, G. P., Wofsy, S. C., and McElroy, M. B., 1989: “Denitrofication in the AntarcticStratosphere,” Nature, vol. 339, pp. 525–527.
Steele, Helen M., and Hamill, Patrick, 1981: “Effects of Temperature and Humidity on the Growth and OpticalProperties of Sulfuric Acid-Water Droplets in the Stratosphere,” J. Aerosol. Sci., vol. 12, no. 6, pp. 517–528.
Steele, H. M., Hamill, P., Swissler, T. J., and McCormick, M. P., 1983: “The Formation of Polar StratosphericClouds,” J. Atmos. Sci., vol. 40, pp. 2055–2067.
Toon, Owen B., Pinto, Joseph, Hamill, Patrick, and Turco, Richard P., 1986: “Condensation of HNO3 and HCl in theWinter Polar Stratospheres,” Geophys. Res. Lett., vol. 13, pp. 1284–1287.
Toon, Owen B., Ferry, G., Turco, R. P., Jordan, J., and Goodman, J., 1989: “Physical Processes in Polar StratosphericIce Clouds,” J. Geophys. Res., vol. 94, pp. 11359–11380.
Turco, Richard P., Toon, Owen B., and Hamill, Patrick, 1989: “Heterogeneous Physicochemistry of the Polar OzoneHole,” J. Geophys. Res., vol. 94, pp. 16493–16510.
Twomey, S., 1977: Atmospheric Aerosols, Series 7, Elsevier Scientific Publishing Co., New York.
U. S. Standard Atmosphere, 1976, U. S. Government Printing Office, Washington, D.C.
Yang, L. C. and Good, W. B., 1966: “Crystallization Rate of Supercooled Water in Cylindrical Tubes,” J. Geophys.Res., vol. 71, no.10, pp. 2465–2469.
Wedum, Ellen Elisabeth, 1979: “Schlieren Studies of Crystallization in Supercooled Sodium Sulfate Solution,”M. S. Thesis, University of Nevada, Reno.
47

APPENDIX A: CHEMICAL REACTIONS WHICH PRODUCE SULFURIC ACID
According to laboratory experiments conducted by Friend, et al. (1973), the proposed stratospheric chemicalreactions that lead to stratospheric sulfate aerosols are:
Table A-1. Vapor pressures (mm Hg) H2SO4 and H2O in solution. (Gmitro and Vermeulen, 1964).
Temperature,(K)
Weight percent H2SO4
70 72 74 76 78 80
218.16H2SO4 1.3 × E–14 3.58 × E–14 1.0 × E–13 2.86 × E–13 8.25 × E–13 2.52 × E–12
H2O 4.17 × E–4 2.68 × E–3 1.6 × E–3 8.97 × E–5 4.97 × E–5 2.18 × E–5
223.16H2SO4 5.02 × E–14 1.35 × E–13 3.7 × E–13 1.03 × E–12 2.93 × E–12 8.69 × E–12
H2O 8.16 × E–4 5.23 × E–4 3.17 × E–4 1.8 × E–4 9.46 × E–5 4.49 × E–5
228.16H2SO4 1.81 × E–13 4.7 × E–13 1.29 × E–12 3.51 × E–12 9.78 × E–12 2.82 × E–11
H2O 1.54 × E–3 9.93 × E–4 6.08 × E–4 3.5 × E–4 1.86 × E–4 8.99 × E–5
233.16H2SO4 6.17 × E–13 1.51 × E–12 4.23 × E–12 1.13 × E–11 3.08 × E–11 8.67 × E–11
H2O 2.82 × E–3 1.83 × E–3 1.13 × E–3 6.58 × E–4 3.55 × E–4 1.75 × E–4
238.16H2SO4 1.99 × E–12 5.12 × E–12 1.32 × E–11 3.47 × E–11 9.24 × E–11 2.43 × E–10
H2O 5.03 × E–3 3.23 × E–3 2.06 × E–3 1.21 × E–3 6.6 × E–4 3.3 × E–4
O3 h+ v λ 200 300 nm–=( ) O2 O+→
SO2 g( ) O M SO3 M+→+ +
SO3 H2O(1) H2SO4 1( )→+
H2SO4 H2O H2SO4 H2O⋅→+
48
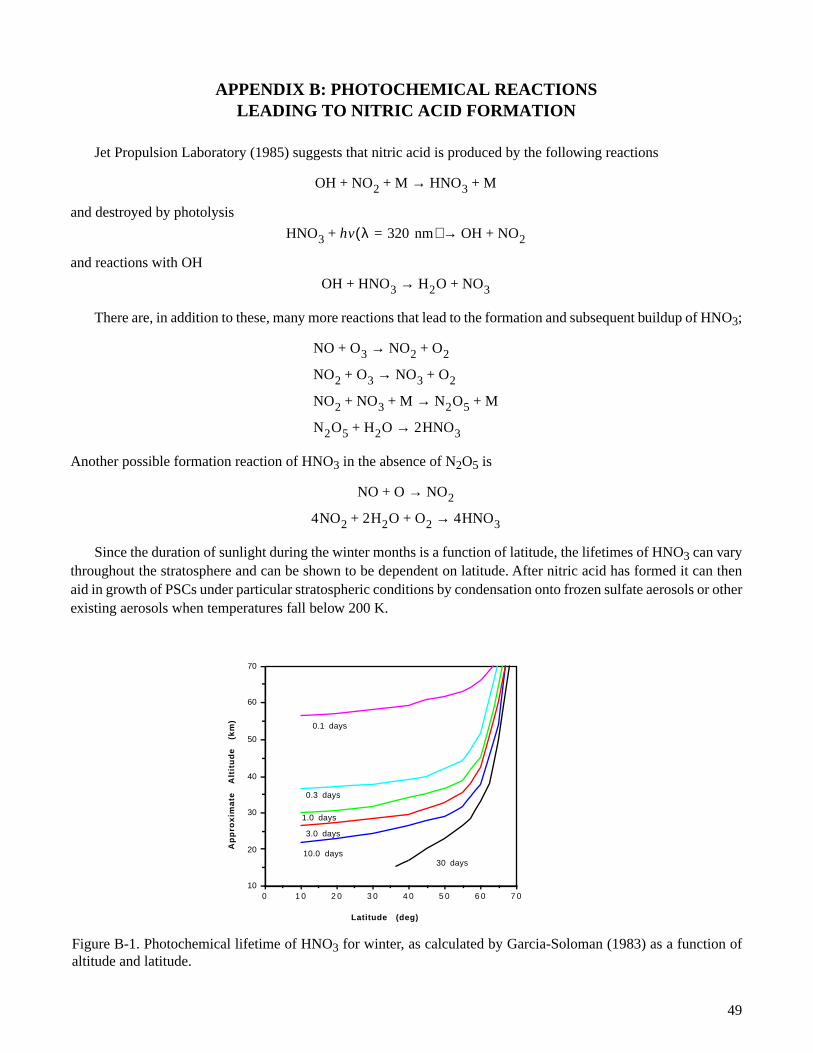
APPENDIX B: PHOTOCHEMICAL REACTIONSLEADING TO NITRIC ACID FORMATION
Jet Propulsion Laboratory (1985) suggests that nitric acid is produced by the following reactions
and destroyed by photolysis
and reactions with OH
There are, in addition to these, many more reactions that lead to the formation and subsequent buildup of HNO3;
Another possible formation reaction of HNO3 in the absence of N2O5 is
Since the duration of sunlight during the winter months is a function of latitude, the lifetimes of HNO3 can varythroughout the stratosphere and can be shown to be dependent on latitude. After nitric acid has formed it can thenaid in growth of PSCs under particular stratospheric conditions by condensation onto frozen sulfate aerosols or otherexisting aerosols when temperatures fall below 200 K.
OH NO2 M HNO3 M+→+ +
HNO3 hv λ 320 nm=( ) OH NO2+→+
OH HNO3 H2O NO3+→+
NO O3 NO2 O2+→+
NO2 O3 NO3 O2+→+
NO2 NO3 M N2O5 M+→+ +
N2O5 H2O 2HNO3→+
NO O NO2→+
4NO2 2H2O O2+ 4HNO3→+
49
Figure B-1. Photochemical lifetime of HNO3 for winter, as calculated by Garcia-Soloman (1983) as a function ofaltitude and latitude.
7 06 05 04 03 02 01 0010
20
30
40
50
60
70
Ap
pro
xim
ate
A
ltit
ud
e
(km
)
Latitude (deg)
0.1 days
0.3 days
1.0 days
3.0 days
10.0 days30 days

APPENDIX C
Table C-1. Thermal properties of common substances. (Carslaw and Jaeger, 1959)
SubstanceDensity,g cm–3
Specific heat,cal g–1 K–1
Conductivity,cal cm–1 sec–1 K–1
Diffusivity,cm2 sec–1
Copper 10.49 0.0556 1.00 1.14
Silver 9.94 0.93 0.93 1.71
Brass 8.5 0.09 0.25 0.33
Steel 7.85 0.118 0.11 0.12
Air 0.00129 0.24 0.000058 0.187
Ice 0.92 0.502 0.0053 0.0115
Glass 2.4 0.20 0.0028 0.0058
Snow 0.1 0.5 0.00025 0.005
Water 1.0 1.0 0.00144 0.00144
50

REPORT DOCUMENTATION PAGE Form ApprovedOMB No. 0704-0188
1. AGENCY USE ONLY (Leave blank) 2. REPORT DATE 3. REPORT TYPE AND DATES COVERED
4. TITLE AND SUBTITLE 5. FUNDING NUMBERS
6. AUTHOR(S)
8. PERFORMING ORGANIZATION REPORT NUMBER
7. PERFORMING ORGANIZATION NAME(S) AND ADDRESS(ES)
9. SPONSORING/MONITORING AGENCY NAME(S) AND ADDRESS(ES) 10. SPONSORING/MONITORING AGENCY REPORT NUMBER
11. SUPPLEMENTARY NOTES
12a. DISTRIBUTION/AVAILABILITY STATEMENT 12b. DISTRIBUTION CODE
13. ABSTRACT (Maximum 200 words)
14. SUBJECT TERMS 15. NUMBER OF PAGES
16. PRICE CODE
17. SECURITY CLASSIFICATION OF REPORT
18. SECURITY CLASSIFICATION OF THIS PAGE
19. SECURITY CLASSIFICATION OF ABSTRACT
20. LIMITATION OF ABSTRACT
NSN 7540-01-280-5500 Standard Form 298 (Rev. 2-89)Prescribed by ANSI Std. Z39-18298-102
Public reporting burden for this collection of information is estimated to average 1 hour per response, including the time for reviewing instructions, searching existing data sources, gathering andmaintaining the data needed, and completing and reviewing the collection of information. Send comments regarding this burden estimate or any other aspect of this collection of information,including suggestions for reducing this burden, to Washington Headquarters Services, Directorate for Information Operations and Reports, 1215 Jefferson Davis Highway, Suite 1204, Arlington,VA 22202-4302, and to the Office of Management and Budget, Paperwork Reduction Project (0704-0188), Washington, DC 20503.
A Laboratory Study on the Phase Transition for Polar Stratospheric CloudParticles
WU 529-10-04
Edward H. Teets, Jr.
NASA Dryden Flight Research CenterP.O. Box 273Edwards, California 93523-0273
H-2147
National Aeronautics and Space AdministrationWashington, DC 20546-0001
NASA CR-198056NASA Contract NAG-2572
The nucleation and growth of different phases of simulated polar stratospheric cloud (PSC) particles wereinvestigated in the laboratory. Solutions and mixtures of solutions at concentrations 1 to 5 m (molality) ofammonium sulfate, ammonium bisulfate, sodium chloride, sulfuric acid, and nitric acid were supercooled toprescribed temperatures below their equilibrium melting point. These solutions were contained in smalldiameter glass tubing of volumes ranging from 2.6 to 0.04 ml. Samples were nucleated by insertion of an icecrystal, or in some cases by a liquid nitrogen cooled wire. Crystallization velocities were determined by timingthe crystal growth front passages along the glass tubing. Solution mixtures containing aircraft exhaust (soot)were also examined. Crystallization rates increased as ∆T2, where ∆T is the supercooling for weak solutions(2 m or less). The higher concentrated solutions (>3 m) showed rates significantly less than ∆T2. This reducedrate suggested an onset of a glass phase. Results were applied to the nucleation of highly concentrated solutionsat various stages of polar stratospheric cloud development within the polar stratosphere.
Cloud research, Crystals, Stratospheric circulation, Temperature effects,Thermodynamic properties of liquids
A04
58
Unclassified Unclassified Unclassified Unlimited
March 1997 Contractor Report
Available from the NASA Center for AeroSpace Information, 800 Elkridge Landing Road, Linthicum Heights, MD 21090; (301)621-0390
Unclassified—UnlimitedSubject Category 46