A KNOWLEDGE MANAGEMENT FRAMEWORK FOR REDUCING THE COST … · Quality (COPQ) while the resultant...
351
A KNOWLEDGE MANAGEMENT FRAMEWORK FOR REDUCING THE COST OF POOR QUALITY ON CONSTRUCTION PROJECTS Raymond Afolarin Olayinka BSc. (Hons), MBA A thesis submitted in partial fulfilment of the requirements of the University of Wolverhampton for the degree of Doctor of Philosophy (PhD) August 2015 This work or any part thereof has not previously been presented in any form to the University or to any other body whether for the purposes of assessment, publication or for any other purpose (unless otherwise indicated). Save for any express acknowledgements, references and/or bibliographies cited in the work, I can confirm that the intellectual content of the work is the result of my own efforts and of no other person. The right of Raymond Afolarin Olayinka to be identified as author of this work is asserted in accordance with ss. 77 and 78 of the Copyright, Design and Patents Act 1988. At this date, the author owns copyright. Signature………………………………………………… Date……………………………………………………….
Transcript of A KNOWLEDGE MANAGEMENT FRAMEWORK FOR REDUCING THE COST … · Quality (COPQ) while the resultant...

A KNOWLEDGE MANAGEMENT FRAMEWORK FOR REDUCING
THE COST OF POOR QUALITY ON CONSTRUCTION
PROJECTS
Raymond Afolarin Olayinka
BSc. (Hons), MBA
A thesis submitted in partial fulfilment of the requirements of the
University of Wolverhampton for the degree of Doctor of Philosophy (PhD)
August 2015
This work or any part thereof has not previously been presented in any form to
the University or to any other body whether for the purposes of assessment,
publication or for any other purpose (unless otherwise indicated). Save for any
express acknowledgements, references and/or bibliographies cited in the work,
I can confirm that the intellectual content of the work is the result of my own
efforts and of no other person.
The right of Raymond Afolarin Olayinka to be identified as author of this work is
asserted in accordance with ss. 77 and 78 of the Copyright, Design and Patents
Act 1988. At this date, the author owns copyright.
Signature…………………………………………………
Date……………………………………………………….

ii
ABSTRACT
Knowledge management (KM) implementation strategies on construction
projects can reap benefits such as improved performance and continuous
improvement yet many projects are characterised by inefficiencies, repetition of
mistakes and lack of lessons learnt. Poor skills, design changes, errors and
omissions contribute to the internal failure cost element of the Cost of Poor
Quality (COPQ) while the resultant effect of client dissatisfaction contributes to
the external failure cost. COPQ is prevalent regardless of project type and has
been found to be over 10% of total project cost in certain cases. While the need
to reduce COPQ is definite, it is uncertain what impact KM has in its reduction.
The aims of the research therefore are twofold (i) to investigate the impact of
KM in reducing COPQ on construction projects (ii) to develop a KM framework
for reducing COPQ on construction projects.
A mixed method approach was adopted for the research with an exploratory
sequential research design utilising both qualitative and quantitative inquiries to
address the research aims. Semi-structured interviews and questionnaire
survey were selected as the method for qualitative and quantitative data
collection respectively. The interviews were conducted with 25 industry experts
involved in KM strategies for large construction organisations across UK to
obtain data, based on their experiences and expertise on projects, which were
then analysed using content analysis. The output from the analysis yielded
variables and working hypotheses which were tested through the questionnaire
survey. Further data were obtained from 114 survey respondents who have

iii
been mostly involved in KM initiatives for large construction organisations
across UK. The data was analysed using descriptive statistics.
From the interpretation of the entire qualitative and quantitative data, it was
found that KM can be complex and difficult to manage within organisations and
on projects. Although KM was perceived to have positive impact in reducing
COPQ, organisations did not, and could not quantify COPQ neither could they
measure the extent of the impact of KM on COPQ. Causal links were found
between COPQ elements i.e. errors and omissions, design changes and poor
skills, contrary to the theoretical suggestion of being mutually exclusive. It was
found that KM currently has not been optimised to reduce COPQ due to a
number of barriers. Optimising KM to reduce COPQ therefore involves
overcoming the barriers as follows: develop performance metrics to assess the
impact of KM on COPQ on projects; appoint knowledge champions to facilitate
KM activities to reduce COPQ; adopt a positive organisational culture towards
KM; allocate adequate time and budget for KM activities on projects; select
procurement strategies that support and facilitate KM.
A KM framework for reducing COPQ on construction projects was developed as
an output of the research and evaluated by industry practitioners. It can be
concluded that the optimisation of KM can significantly reduce COPQ. A key
recommendation for industry practitioners therefore is to adopt a holistic
approach to quantifying COPQ and assessing the impact of KM in reducing
COPQ such as the one presented in this research. The research contributes to
the body of knowledge in the area of cost reduction, quality improvements and
knowledge management on projects.

iv
TABLE OF CONTENTS
ABSTRACT .................................................................................................................................... ii
LIST OF TABLES .......................................................................................................................... ix
LIST OF FIGURES ........................................................................................................................ xi
ACKNOWLEDGEMENTS ............................................................................................................ xii
CHAPTER 1 ................................................................................................................................ 13
INTRODUCTION TO RESEARCH .............................................................................................. 13
1.1 STATEMENT OF THE RESEARCH PROBLEM .............................................................. 13
1.2 RATIONALE FOR THE RESEARCH ................................................................................ 15
1.2.1 The need to reduce the cost of poor quality on construction projects ....................... 15
1.2.2 The need to harness and integrate knowledge across boundaries ........................... 16
1.3 KNOWLEDGE GAPS ........................................................................................................ 18
1.3.1 The body of work on the cost of poor quality ............................................................. 18
1.3.2 The body of work on knowledge management .......................................................... 19
1.3.3 Integrating knowledge management and the cost of poor quality ............................. 20
1.4 RESEARCH QUESTIONS ................................................................................................ 20
1.5 RESEARCH AIMS AND OBJECTIVES ............................................................................ 21
1.6 NOVELTY OF THE RESEARCH ...................................................................................... 22
1.6.1 Synthesis of previous body of work............................................................................ 23
1.6.2 New approach to addressing an endemic research problem .................................... 23
1.7 RELEVANCE OF THE RESEARCH ................................................................................. 24
1.8 BENEFICIARIES OF THE RESEARCH............................................................................ 24
1.9 CONTRIBUTIONS TO THE BODY OF KNOWLEDGE .................................................... 25
1.10 STRUCTURE OF THE THESIS ...................................................................................... 27
CHAPTER 2 ................................................................................................................................ 32
A REVIEW OF LITERATURE ON KNOWLEDGE MANAGEMENT ........................................... 32
2.1 CONCEPTUALISATIONS OF KNOWLEDGE .................................................................. 32
2.1.1 Definition of knowledge .............................................................................................. 32
2.1.2 Distinguishing between data, information, knowledge and wisdom ........................... 36
2.1.3 Types of knowledge ................................................................................................... 39
2.2 CONCEPTUALISATIONS OF KNOWLEDGE MANAGEMENT ....................................... 42
2.2.1 Operationalising the definition of knowledge management ....................................... 42
2.2.2 Harnessing and integrating knowledge ...................................................................... 45
2.2.3 Adopting a knowledge management process ............................................................ 51
2.2.4 Utilising knowledge management tools ...................................................................... 59
2.2.5 Aligning knowledge management with organisational strategy ................................. 62
2.3 APPLICATION OF KNOWLEDGE MANAGEMENT IN CONSTRUCTION ...................... 76
2.3.1 Overview of the UK construction industry .................................................................. 76

v
2.3.2 Application of the SECI model to the construction supply chain ................................ 79
2.3.3 Issues relating to knowledge management in construction ....................................... 81
2.4 SUMMARY OF CHAPTER 2 ............................................................................................. 85
CHAPTER 3 ................................................................................................................................ 86
A REVIEW OF LITERATURE ON THE COST OF POOR QUALITY ......................................... 86
3.1 CONCEPTUALISATIONS OF QUALITY .......................................................................... 86
3.1.1 Definition of quality ..................................................................................................... 87
3.1.2 Defining quality in the construction project context .................................................... 91
3.2 CAUSES OF POOR QUALITY IN CONSTRUCTION ..................................................... 101
3.3 THE COST OF POOR QUALITY .................................................................................... 103
3.4 AN INTEGRATED MODEL FOR THE COST OF POOR QUALITY ............................... 108
3.5 QUANTIFYING THE COST OF POOR QUALITY .......................................................... 110
3.6 REDUCING THE COST OF POOR QUALITY ................................................................ 114
3.6.1 Initiatives for reducing the cost of poor quality ......................................................... 114
3.6.2 Quality management tools ....................................................................................... 122
3.7 ISSUES RELATING TO THE COST OF POOR QUALITY ............................................ 123
3.8 SUMMARY OF CHAPTER 3 ........................................................................................... 124
CHAPTER 4 .............................................................................................................................. 126
CONCEPTUAL FRAMEWORK ................................................................................................. 126
4.1 SYNTHESISING KM AND COPQ ................................................................................... 126
4.1.1 Findings from literature review on KM and COPQ ................................................... 127
4.1.2 Issues and challenges relating to KM and COPQ .................................................... 129
4.1.3 Knowledge gaps ....................................................................................................... 130
4.1.4 Key research questions to be addressed ................................................................. 132
4.2 SETTING IMPACT MEASURES ..................................................................................... 133
4.3 CONCEPTUAL FRAMEWORK ....................................................................................... 136
4.3.1 Theory, concept and framework ............................................................................... 136
4.3.2 Theoretical framework versus conceptual framework .............................................. 139
4.4 DESIGN OF THE CONCEPTUAL FRAMEWORK FOR THE STUDY ........................... 144
4.5 SUMMARY OF CHAPTER 4 ........................................................................................... 147
CHAPTER 5 .............................................................................................................................. 148
RESEARCH METHODOLOGY ................................................................................................. 148
5.1 OVERVIEW OF RESEARCH METHODOLOGY ............................................................ 148
5.2 RESEARCH APPROACHES .......................................................................................... 150
5.2.1 Qualitative research approach ................................................................................. 150
5.2.2 Quantitative research approach ............................................................................... 155
5.2.3 Mixed methods approach ......................................................................................... 158
5.3 SELECTION OF RESEARCH APPROACH FOR THIS STUDY .................................... 162
5.3.1 Philosophical assumptions underlying the study ..................................................... 164
5.3.2 Selection of research design for the study ............................................................... 165

vi
5.3.3 Selection of research methods for the study ............................................................ 166
5.4 QUALITATIVE DATA COLLECTION AND ANALYSIS ................................................... 170
5.4.1 Design of the semi-structured interviews ................................................................. 174
5.4.2 Pilot study debate for semi-structured interviews .................................................... 176
5.4.3 Sampling strategy..................................................................................................... 178
5.4.4 Analysis of the semi-structured interview data ......................................................... 180
5.5 QUANTITATIVE DATA COLLECTION AND ANALYSIS ................................................ 190
5.5.1 Questionnaire design ............................................................................................... 193
5.5.2 Piloting the survey .................................................................................................... 196
5.5.3 Sampling strategy for the pilot survey ...................................................................... 197
5.5.4 Contributions of the pilot survey to the main questionnaire design ......................... 197
5.6 ETHICAL CONSIDERATIONS FOR THE RESEARCH .................................................. 198
5.7 SUMMARY OF CHAPTER 5 ........................................................................................... 201
CHAPTER 6 .............................................................................................................................. 202
QUALITATIVE STUDY ON THE IMPACT OF KNOWLEDGE MANAGEMENT ON THE COST
OF POOR QUALITY ................................................................................................................. 202
6.1 PROFILE OF INTERVIEWEES ....................................................................................... 202
6.2 CONTRIBUTORY FACTORS TO THE COST OF POOR QUALITY .............................. 206
6.2.1 Contributory factors to the cost of errors and omissions .......................................... 207
6.2.2 Contributory factors to the cost of design changes .................................................. 213
6.2.3 Contributory factors to the cost of poor skills ........................................................... 221
6.2.4 Discussion of findings on the contributory factors .................................................... 226
6.3 IMPACT OF KNOWLEDGE MANAGEMENT ON THE COST OF POOR QUALITY ..... 230
6.3.1 Impact of knowledge management on the cost of errors and omissions ................. 230
6.3.2 Impact of knowledge management on the cost of design changes ......................... 232
6.3.3 Impact of knowledge management on the cost of poor skills .................................. 233
6.3.4 Discussion of findings on the impact of KM on COPQ ............................................. 234
6.4 OPTIMISATION OF KNOWLEDGE MANAGEMENT TO REDUCE THE COST OF POOR
QUALITY ............................................................................................................................... 235
6.4.1 Key barriers to be addressed to optimise KM .......................................................... 236
6.4.2 Strategy for optimising KM to reduce COPQ ........................................................... 239
6.5 IMPLICATIONS OF FINDINGS ....................................................................................... 239
6.6 MODIFICATION OF THE CONCEPTUAL FRAMEWORK ............................................. 241
6.7 SUMMARY OF CHAPTER 6 ........................................................................................... 243
CHAPTER 7 .............................................................................................................................. 244
QUANTITATIVE STUDY ON THE IMPACT OF KNOWLEDGE MANAGEMENT ON THE COST
OF POOR QUALITY ................................................................................................................. 244
7.1 RESPONDENT PROFILE ............................................................................................... 244
7.2 IMPACT OF KM PROCESSES ON COPQ ..................................................................... 246
7.2.1 Impact of KM processes on design changes ........................................................... 247

vii
7.2.2 Impact of KM processes on errors and omissions ................................................... 248
7.2.3 Impact of KM processes on poor skills..................................................................... 249
7.3 EFFECTIVENESS OF KM TOOLS IN REDUCING COPQ ............................................ 251
7.3.1 Effectiveness of KM tools in reducing design changes ............................................ 252
7.3.2 Effectiveness of KM tools in reducing errors and omissions ................................... 253
7.3.3 Effectiveness of KM tools in reducing poor skills ..................................................... 255
7.4 BARRIERS TO KM IN REDUCING COPQ ..................................................................... 257
7.5 BENEFITS OF REDUCING COPQ THROUGH KM OPTIMISATION ............................ 259
7.6 MEASUREMENT OF THE IMPACT OF KM ON COPQ ................................................. 260
7.7 IMPLICATION OF FINDINGS ......................................................................................... 262
7.8 SUMMARY OF CHAPTER 7 ........................................................................................... 264
CHAPTER 8 .............................................................................................................................. 265
KNOWLEDGE MANAGEMENT FRAMEWORK FOR REDUCING THE COST OF POOR
QUALITY IN CONSTRUCTION PROJECTS ............................................................................ 265
8.1 INTERPRETATION OF THE ENTIRE DATA .................................................................. 265
8.1.1 Impact of KM on errors and omissions..................................................................... 272
8.1.2 Impact of KM on design changes ............................................................................. 273
8.1.3 Impact of KM on poor skills ...................................................................................... 274
8.2 KM FRAMEWORK FOR REDUCING COPQ ON CONSTRUCTION PROJECTS ........ 279
8.3 EVALUATION OF THE FRAMEWORK .......................................................................... 283
8.4 SUMMARY OF CHAPTER 8 ........................................................................................... 292
CHAPTER 9 .............................................................................................................................. 293
CONCLUSIONS AND RECOMMENDATIONS ......................................................................... 293
9.1 REFLECTIVE REVIEW OF THE METHODOLOGICAL PROCESS ............................... 293
9.1.1 How the research objectives were achieved ............................................................ 295
9.2 KEY FINDINGS ............................................................................................................... 301
9.2.1 Findings from theoretical work ................................................................................. 301
9.2.2 Findings from fieldwork ............................................................................................ 303
9.3 RECOMMENDATIONS ................................................................................................... 305
9.3.1 Recommendations for industry practitioners ............................................................ 305
9.3.2 Recommendations for academics ............................................................................ 306
9.4 LIMITATIONS OF THE RESEARCH .............................................................................. 306
9.5 FURTHER WORK AND FUTURE STUDIES .................................................................. 307
9.6 SUMMARY OF CHAPTER 9 ........................................................................................... 307
REFERENCES .......................................................................................................................... 308
APPENDICES ........................................................................................................................... 333
Appendix 1: Invitation to participate in a research interview ................................................. 333
Appendix 2: Information Sheet for Interview Participants ..................................................... 334
Appendix 3: Consent Form for Participants .......................................................................... 335
Appendix 4: Semi-structured Interview Template ................................................................. 336

viii
Appendix 5: Survey questionnaire and cover letter .............................................................. 338
Appendix 6: Evaluation template ........................................................................................... 347
Appendix 7: Excel Spreadsheet format of the KM framework for reducing COPQ .............. 349
Appendix 8: Excerpts from participant responses on the evaluation of the framework ........ 350
ix
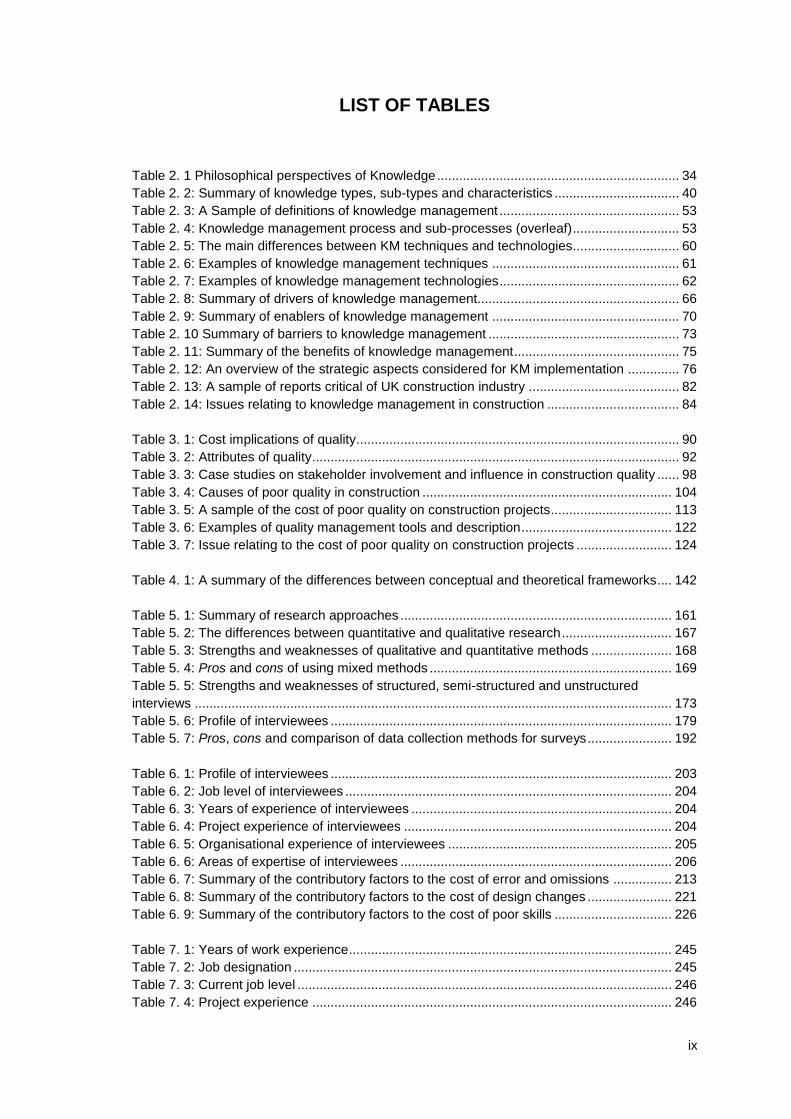
LIST OF TABLES
Table 2. 1 Philosophical perspectives of Knowledge .................................................................. 34
Table 2. 2: Summary of knowledge types, sub-types and characteristics .................................. 40
Table 2. 3: A Sample of definitions of knowledge management ................................................. 53
Table 2. 4: Knowledge management process and sub-processes (overleaf) ............................. 53
Table 2. 5: The main differences between KM techniques and technologies............................. 60
Table 2. 6: Examples of knowledge management techniques ................................................... 61
Table 2. 7: Examples of knowledge management technologies ................................................. 62
Table 2. 8: Summary of drivers of knowledge management....................................................... 66
Table 2. 9: Summary of enablers of knowledge management ................................................... 70
Table 2. 10 Summary of barriers to knowledge management .................................................... 73
Table 2. 11: Summary of the benefits of knowledge management ............................................. 75
Table 2. 12: An overview of the strategic aspects considered for KM implementation .............. 76
Table 2. 13: A sample of reports critical of UK construction industry ......................................... 82
Table 2. 14: Issues relating to knowledge management in construction .................................... 84
Table 3. 1: Cost implications of quality ........................................................................................ 90
Table 3. 2: Attributes of quality .................................................................................................... 92
Table 3. 3: Case studies on stakeholder involvement and influence in construction quality ...... 98
Table 3. 4: Causes of poor quality in construction .................................................................... 104
Table 3. 5: A sample of the cost of poor quality on construction projects ................................. 113
Table 3. 6: Examples of quality management tools and description ......................................... 122
Table 3. 7: Issue relating to the cost of poor quality on construction projects .......................... 124
Table 4. 1: A summary of the differences between conceptual and theoretical frameworks .... 142
Table 5. 1: Summary of research approaches .......................................................................... 161
Table 5. 2: The differences between quantitative and qualitative research .............................. 167
Table 5. 3: Strengths and weaknesses of qualitative and quantitative methods ...................... 168
Table 5. 4: Pros and cons of using mixed methods .................................................................. 169
Table 5. 5: Strengths and weaknesses of structured, semi-structured and unstructured
interviews .................................................................................................................................. 173
Table 5. 6: Profile of interviewees ............................................................................................. 179
Table 5. 7: Pros, cons and comparison of data collection methods for surveys ....................... 192
Table 6. 1: Profile of interviewees ............................................................................................. 203
Table 6. 2: Job level of interviewees ......................................................................................... 204
Table 6. 3: Years of experience of interviewees ....................................................................... 204
Table 6. 4: Project experience of interviewees ......................................................................... 204
Table 6. 5: Organisational experience of interviewees ............................................................. 205
Table 6. 6: Areas of expertise of interviewees .......................................................................... 206
Table 6. 7: Summary of the contributory factors to the cost of error and omissions ................ 213
Table 6. 8: Summary of the contributory factors to the cost of design changes ....................... 221
Table 6. 9: Summary of the contributory factors to the cost of poor skills ................................ 226
Table 7. 1: Years of work experience ........................................................................................ 245
Table 7. 2: Job designation ....................................................................................................... 245
Table 7. 3: Current job level ...................................................................................................... 246
Table 7. 4: Project experience .................................................................................................. 246

x
Table 7. 5: Impact of KM processes on design changes .......................................................... 248
Table 7. 6: Impact of KM processes on errors and omissions .................................................. 249
Table 7. 7: Impact of KM processes on poor skills ................................................................... 250
Table 7. 8: Five highest ranking KM processes impacting COPQ ............................................ 251
Table 7. 9: Five lowest ranking KM processes impacting COPQ ............................................. 251
Table 7. 10: Effectiveness of KM tools in reducing design changes ......................................... 253
Table 7. 11: Effectiveness of KM tools in reducing errors and omissions ................................ 254
Table 7. 12: Effectiveness of KM tools in reducing poor skills .................................................. 255
Table 7. 13: Five highest ranking KM tools for reducing COPQ ............................................... 257
Table 7. 14: Five lowest ranking KM tools for reducing COPQ ................................................ 257
Table 7. 15: Barriers to KM in reducing COPQ ......................................................................... 258
Table 7. 16: Benefits of reducing COPQ through KM optimisation ........................................... 260
Table 8. 1: Exploratory sequential mixed methods research findings and conclusions ........... 267
Table 8. 2: Profile of participants ............................................................................................... 287
Table 9. 1: A summary of how the research objectives were achieved .................................... 300

xi
LIST OF FIGURES
Figure 1. 1: Structure of the thesis and the methodological process of the research ................. 28
Figure 2. 1: The DIKW hierarchy ................................................................................................. 37
Figure 2. 2: Alternative DIKW model ........................................................................................... 38
Figure 2. 3: The ‘DIKIW’ model ................................................................................................... 38
Figure 2. 4: Relationships between knowledge types and characteristics .................................. 42
Figure 2. 5: The SECI model showing the modes of knowledge conversion.............................. 48
Figure 2. 6: Creating knowledge with outside constituents ......................................................... 49
Figure 2. 7: KM sub-process classification based on author definitions ..................................... 58
Figure 2. 8: Application of the SECI model to the construction supply chain ............................. 80
Figure 3. 1: Causes of poor quality on construction projects .................................................... 103
Figure 3. 2: Interrelationship between the COQ, COGQ and COPQ ........................................ 106
Figure 3. 3: Components of cost of poor quality ....................................................................... 107
Figure 3. 4: An integrated model for the cost of poor quality on construction projects ............. 109
Figure 4. 1: Integrated model showing the areas of investigation on the impact of KM on COPQ
................................................................................................................................................... 134
Figure 4. 2: Derivation of conceptual and theoretical frameworks ............................................ 140
Figure 4. 3: Initial conceptual framework on the impact of KM on COPQ ................................ 146
Figure 5. 1: Overview of the methodological process for the research ..................................... 163
Figure 5. 2: Data analysis for qualitative research .................................................................... 181
Figure 6. 1: Contributory factors to COPQ in practice .............................................................. 228
Figure 6. 2: Modified conceptual framework on the impact of KM in reducing COPQ ............. 242
Figure 7. 1: Modified conceptual framework on the impact of KM in reducing COPQ ............. 263
Figure 8. 1: Impact of KM in reducing COPQ (High-impact KM processes) ............................. 275
Figure 8. 2: Impact of KM in reducing COPQ (Low-impact KM processes) .............................. 276
Figure 8. 3: Impact of KM in reducing COPQ (Highly effective KM tools) ................................ 277
Figure 8. 4: Impact of KM in reducing COPQ (Less effective KM tools) ................................... 278
Figure 8. 5: KM framework for reducing COPQ on construction projects ................................. 280
Figure 9. 1: A review of the methodological process for the research ...................................... 297

xii
ACKNOWLEDGEMENTS
I would like to express my appreciation and thanks to the School of Architecture
and the Built Environment of the Faculty of Science and Engineering of the
University of Wolverhampton for awarding me a fully funded studentship to
undertake this research project.
I would like to express my sincere gratitude to my supervisory team consisting
of Dr. Subashini Suresh (Director of Studies) and Dr. Ezekiel Chinyio both of
whom have been immense sources of knowledge, understanding, criticality and
encouragement throughout the research period. Thanks to Roy Casey for his
support and for being a channel for high level industry contacts. I would also like
to acknowledge the Black Country Constructing Excellence Club steering
committee for readily providing me with industry insights particularly through the
organisation of the monthly Communities of Practice events.
I would like to express my profound appreciation and gratitude to Elizabeth
Millman who has been a very good friend and a great host during my study
period in Wolverhampton. I would like to acknowledge and express my gratitude
my parents Chief Rufus Olayinka and Mrs Modupe Olayinka; and my siblings
Bukola, Soji, Yetunde, Lanre and Tolu for your immense contributions in every
aspect. I would also like to acknowledge and thank the following people who
have supported me in various capacities over the years; Dr. David Oloke,
Ayodele Balogun, Olakunle Otele, Kayode Dada, and Tolu Taiwo.
Most of all I give thanks to God Almighty for the gift of life and for the grace to
complete the research.

xiii
CHAPTER 1
INTRODUCTION TO RESEARCH
This chapter discusses the research problem, the rationale for the research and
the knowledge gap the research aims to fill. It presents the research questions,
states the research aims and discusses the research objectives. It identifies the
novelty of the research and discusses the research benefits. It discusses the
contributions of the research output to the body of knowledge. The chapter
finally presents the structure of the thesis.
1.1 STATEMENT OF THE RESEARCH PROBLEM
Knowledge management (KM) is invaluable to the construction industry due to
its potential in integrating knowledge across personal, organisational, project
and industry boundaries. KM implementation strategies can reap benefits such
as improved project performance and continuous improvement yet many
projects are plagued with inefficiencies, repetition of mistakes and lack of
lessons learnt thereby contributing to additional project costs (Al-Ghassani et
al., 2004; Egbu, 2005; Suresh et al., 2008; Carrillo et al., 2013; Ren et al., 2013;
Garstenauer et al., 2014). A major area of focus is on the cost attached to the
unnecessary effort of re-doing processes or activities incorrectly implemented
the first time often referred to as the cost of poor quality (COPQ). This
constitutes the cost of errors and omissions, cost of design changes, cost of
poor skills and the consequential costs associated with client dissatisfaction
(Feigenbaum, 1991; Juran and Godfrey, 1999; Josephson and Hammarlund,

CHAPTER 1: INTRODUCTION TO RESEARCH
14
1999; Love and Edwards 2005; Rosenfeld, 2009; Urbancová and Vnoučková,
2015).
Studies have found COPQ to be prevalent on projects regardless of project type
or size. Burati et al. (1992) found quality deviations in nine engineering projects
to be an average of 12.4% of the contract value. Abdul-Rahman (1995) found
non-conformance costs to be 5% of contract value on a highway project. Nylen
(1996) found quality failures to be 10% of contract value on a railway project.
Love and Li (2000) found rework costs in residential and industrial buildings to
be 3.15% and 2.4% of contract value respectively. Researchers have attempted
to find the mean value of costs. Love (2002) found the mean direct and indirect
rework costs on 161 construction projects to be 6.4% and 5.6% of the original
contract value respectively.
Hwang (2009) obtained data from 359 construction projects and found direct
rework costs alone to be 5% of total construction costs. Love et al. (2010) found
the mean rework costs to be 10% of the contract value in civil infrastructure
projects. COPQ is endemic and is a major contributory factor to client
dissatisfaction, reduced profitability of the supply chain and reduced reputation
of the construction industry as a whole (Egan 1998, 2002; Wolstenholme,
2009). As a result there is critical need to formulate strategies for reducing
COPQ particularly in a post-recession economy in which the construction
industry is still adversely affected. Moreover the need for cost efficiency has
become a major driver and a source of competitive advantage for construction
organisations.

CHAPTER 1: INTRODUCTION TO RESEARCH
15
1.2 RATIONALE FOR THE RESEARCH
The rationale or the logical basis for undertaking the research was driven by the
research problem i.e. the endemic COPQ on construction projects. While
COPQ may be regarded as a quality management problem in which case
initiatives such as Total Quality Management (TQM), Six Sigma and Lean
principles are applicable (De Feo and Barnard,2005; Pyzdek and Keller, 2009;
Koskela et al., 2013), the study takes a different approach by exploring the link
between KM and COPQ. While not suggesting that quality management
initiatives may be replaceable with KM, the study focuses on KM aspects such
as the repetition of mistakes and lack of lessons learnt which may lead to
COPQ issues. The rationale therefore is based on the need to reduce COPQ on
projects and the need to harness and integrate knowledge across personal,
organisation, project and industry boundaries.
1.2.1 The need to reduce the cost of poor quality on
construction projects
COPQ can be sub-divided into internal failure costs and external failure costs.
Internal failure costs are incurred when rectifying errors or defects before a
product is handed over to the client, while external failure costs are incurred due
to errors or defects detected after the product has been handed over
(Feigenbaum, 1991; Juran and Godfrey, 1999; Defeo and Juran, 2010). Internal
failure costs can be referred to as the cost of non-conformities and inefficient
processes with cost indicator measured in terms of plant and material usage,
labour and time. External failure costs consist of the cost associated with client
dissatisfaction which includes the cost of penalties and the costs of potential

CHAPTER 1: INTRODUCTION TO RESEARCH
16
loss of opportunities for future revenue. Unlike the manufacturing industry which
has made significant progress in improving efficiency and reducing costs, the
construction industry still lags behind in this area. This has been indicated in
several industry reports over the years (e.g. Latham, 1994; Egan, 1998,
Wolstenholme, 2009; Cabinet Office, 2011; BIS, 2013). Indeed the reports have
continually highlighted the construction industry’s under-achievement, low
profitability of the supply chain and client dissatisfaction with products and
services provided. . One of the ‘drivers’ which needed to be in place to secure
improvement in the construction process and end-product was identified as ‘a
quality driven agenda’ (Egan, 1998). Evidence, however suggests that the
construction industry in its current state is yet to achieve the quality agenda
(Wolstenholme, 2009; BIS, 2013). Both governmental and customer demands
for enhanced product quality and lower product and production cost in
construction creates a need to investigate and identify opportunities for
improving quality, reducing costs, thereby reducing customer dissatisfaction
with the goods or services received. The rationale for this research therefore
originates from the need to reduce the endemic COPQ problem on construction
projects.
1.2.2 The need to harness and integrate knowledge across
boundaries
Construction contributes £90 billion gross value added to the UK economy
(nearly 7% of the total GDP), comprises over 280,000 businesses and accounts
for 3 million jobs; this is equivalent to about 10% of total UK employment (HM
Government, 2013). Despite its enormous size, the construction industry is

CHAPTER 1: INTRODUCTION TO RESEARCH
17
overwhelmingly made up of small, local firms with fewer than 20 employees,
and a few larger firms employing thousands of people. For a regional project,
the subcontract size may be even smaller, with examples of projects where
70% of sub-contracts were below £10,000. Because of the very large number of
small firms, the industry is often characterised as un-concentrated. This is clear
evidence of the fragmentation of the industry and a real demonstration of the
challenge of building integrated supply chains with a close focus on the end
product and customer value. There are limited numbers of general contractors
who are capable of managing very large projects, whereas there are large
numbers of small subcontractors. The large contractors however engage the
small and medium size contractors on large construction projects. According to
EC Harris (2013), in a typical large building project (i.e. £20 - £25 million range),
the main contractor may be directly managing around 70 sub-contracts of which
a large proportion are small organisations (£50,000 or less)
KM is therefore invaluable to the construction industry as it is deemed critical for
construction organisations to harness and integrate knowledge in order to
improve efficiency and increase profitability. It is particularly important due to
the arguably unique characteristics of projects such as the complicated nature
of operations, multitude of occupations, professions and organisations,
temporary team members, heavy reliance on experience, one-off nature of
projects, tight schedules and limited budgets (Zin and Egbu, 2010; Zarzu and
Scarlat, 2015). The nature in which the construction industry is organised
means that, efficiency in project delivery is less than expected, resulting in
dissatisfied clients and low profitability for construction organisations. There is
an awareness of the need to strategically manage employee-owned tacit
CHAPTER 1: INTRODUCTION TO RESEARCH
18
knowledge within construction organisations (Carrillo and Chinowsky, 2006;
Anand et al., 2010) and the need for knowledge integration across personal,
organisational and project boundaries (Ruan et al. 2012). This suggests that KM
is becoming increasingly important in construction.
The construction industry however remains criticised for being poor at learning,
often ‘reinventing the wheel’, repeating mistakes and wasting resources
(Robertson, 2002; Grimaldi and Rippa, 2011). Specialist and technical
knowledge is often lost from one project to the next, stifling an organisation’s
ability to retain and re-use knowledge (Egbu and Botterill, 2000; Liu et al.,
2013). The project-based, fragmented and unstable nature of the industry has
led to significant knowledge loss compared with other industries (Graham and
Thomas 2008). The need to attract, retain and develop more of the right people
to improve industry capability has also been recognised (Wolstenholme 2009).
The rationale in this case therefore is rooted in the need to harness and
integrate knowledge across boundaries.
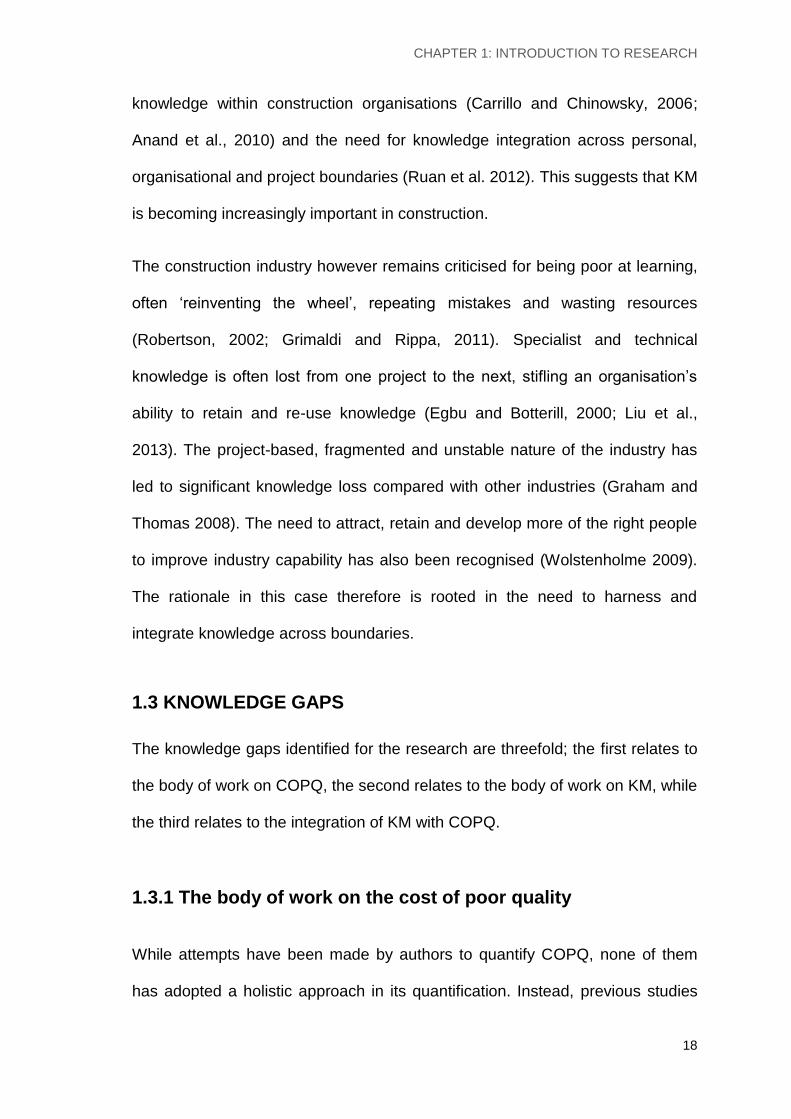
1.3 KNOWLEDGE GAPS
The knowledge gaps identified for the research are threefold; the first relates to
the body of work on COPQ, the second relates to the body of work on KM, while
the third relates to the integration of KM with COPQ.
1.3.1 The body of work on the cost of poor quality
While attempts have been made by authors to quantify COPQ, none of them
has adopted a holistic approach in its quantification. Instead, previous studies

CHAPTER 1: INTRODUCTION TO RESEARCH
19
have focused on the constituent aspects of COPQ, such as quality failures (e.g.
Nylen, 1996), non-conformance costs (e.g. Abdul-Rahman, 1995), deviation
costs (e.g. Cnuddle, 1991; Burati et al., 1992), direct and indirect rework costs
(e.g. Love et al., 2002; Hwang, 2009), design and construction related change
orders (e.g. Cox et al., 1999; Love et al., 2010). While all these aspects relate to
COPQ, none of the authors adopted an integrated approach in quantifying all
the aspects. The aspects include errors and omissions, design changes, and
poor skills, which lead to rework, delays and wastage, which are then quantified
in terms of plant, material, labour, time, and penalty costs. There is therefore no
unified methodology or consistent approach to quantifying COPQ neither is
there a unified terminology in describing the aspects of COPQ. This creates
difficulty in comparing ‘like-for-like’ performance from project to project, which is
a crucial step to formulating strategies for reducing COPQ. This research
intends to bridge the knowledge gap by integrating all the aspects and
presenting a holistic model to quantifying COPQ.
1.3.2 The body of work on knowledge management
Much of the research and many of the publications in the area of KM take an
organisational perspective and relatively little attention has been given to the
impact of KM exploitation on construction projects. These studies typically focus
on ways of managing the knowledge resources and capabilities of an
organisation through the use of KM processes and tools with the overall aim of
gaining competitive advantage over potential competitors (e.g. Newell et al.,
2009; Skyrme, 2011; Garstenauer and Olson, 2014). In an ideal construction
project environment however, the aim of the supply chain organisations should

CHAPTER 1: INTRODUCTION TO RESEARCH
20
not be to gain competitive advantage against one another but to work
collaboratively to deliver successful projects that bring the best products and
services to clients (e.g. Smyth, 2010; BIS, 2013). In this case KM should
advance beyond organisational level through the utilisation of a more robust
approach in developing a push-pull strategy for knowledge integration across
personal, organisational, project and industry interfaces in order to retain
existing knowledge and to create new knowledge. This key aspect is missing in
the existing body of work on KM; this research therefore intends to bridge the
gap in this area.
1.3.3 Integrating knowledge management and the cost of poor
quality
While KM and COPQ may be viewed as two distinct areas in practice, evidence
suggests a link between the two. However none of the existing body of work
has examined the interconnectedness of KM and COPQ. Furthermore no
research has been found to date that has investigated the impact of KM on
COPQ neither have there been any framework or tools developed to measure
the impact. This study therefore intends to bridge the identified gap in this
significant research area.
1.4 RESEARCH QUESTIONS
A key methodological step in undertaking research is to identify and specify the
research questions to be addressed. The research questions are based on the
research problem and the knowledge gap the research intends to bridge. The
main research questions for this study are stated as follows:

CHAPTER 1: INTRODUCTION TO RESEARCH
21
(1) What are the contributory factors to the cost of poor quality on
construction projects in practice?
(2) What is the impact of knowledge management in reducing the cost of
poor quality based on the identified contributory factors?
(3) How can knowledge management be optimised to reduce the cost of
poor quality on construction projects?
1.5 RESEARCH AIMS AND OBJECTIVES
The aims of the research are stated as follows:
(1) To investigate the impact of knowledge management in reducing the cost
of poor quality on construction projects
(2) To develop a knowledge management framework for reducing the cost of
poor quality on construction projects.
In order to address the aims, the following research objectives were identified:
(1) To critically review existing literature in the area of KM from both general
and construction industry perspectives in order to explore, identify and
document the key concepts, processes, tools, KM drivers, enablers,
benefits, barriers and issues relating to KM and the possible link to
COPQ
(2) To critically review existing literature in the area of quality management
with a specific focus on COPQ in construction, in order to explore,
identify and document the key concepts of quality, the causes of poor
quality, the costs associated with poor quality, the quality management
initiatives for reducing COPQ, the issues relating to COPQ in
construction and the possible link to KM.

CHAPTER 1: INTRODUCTION TO RESEARCH
22
(3) To develop a conceptual framework on the impact of KM in reducing
COPQ on construction projects based on the output from literature
review, in order to synthesise KM and COPQ concepts and to guide the
research in the collection, interpretation and explanation of data.
(4) To collect qualitative and quantitative data from construction
organisations across UK in order to investigate the impact of KM in
reducing COPQ on construction projects in practice.
(5) To analyse the data from objective 4, comparing the theoretical
constructs from objectives 1 – 3 with the analysed data in order to
interpret and document the findings, modify the conceptual framework
and present a final KM framework for reducing COPQ on construction
projects.
(6) To evaluate the proposed framework using selected construction
practitioners involved in knowledge management activities.
(7) To summarise the findings, draw final conclusions and recommendations
on the impact of KM in reducing COPQ on construction projects.
1.6 NOVELTY OF THE RESEARCH
Novelty relates to the quality of research being new or original. The novelty of
this research is closely linked to the knowledge gaps identified as a result of an
extensive search and critical review of existing literature relevant to the
research. In this research, the novelty is based on two aspects: (1) synthesis of
previous body of work (2) new approach to addressing an endemic research
problem.

CHAPTER 1: INTRODUCTION TO RESEARCH
23
1.6.1 Synthesis of previous body of work
As identified in the research gap, previous studies lack a unified methodology in
calculating COPQ on construction projects. While authors have only attempted
to calculate aspects of COPQ in parts, this study presents a holistic approach to
quantifying it. This is achieved by synthesising aspects of previous studies to
create a robust and unified model for quantifying COPQ regardless of project
type and size.
Previous studies on KM have focused on ways of managing the knowledge
resources and capabilities of an organisation through the use of KM processes
and tools with relatively little attention given to the impact of KM exploitation on
construction projects. However this research goes further from the
organisational context by synthesising the ‘knowledge conversion’ model with
the project supply chain model to create knowledge interfaces across personal,
organisational, project and industry boundaries with measurable impact.
1.6.2 New approach to addressing an endemic research
problem
Despite the quality management initiatives such as Total Quality Management
(TQM), Six Sigma and Lean principles, COPQ is still endemic on construction
projects. While COPQ may be regarded as a quality management problem, this
study takes a different approach by examining the interconnectedness between
KM and COPQ. The key reasons for this approach are based on the on-going
issues in the construction industry such as lack of lessons learnt, repetition of
mistakes, loss of vital project knowledge, poor knowledge retention and re-use.

CHAPTER 1: INTRODUCTION TO RESEARCH
24
The research therefore aims to investigate the impact of KM in reducing COPQ
on construction projects. The output of the research is a KM framework for
reducing COPQ. No previous studies have covered this area therefore
contributing to the novelty of this research.
1.7 RELEVANCE OF THE RESEARCH
There is tendency for research to become obsolete over the course of the
research project for a number of reasons e.g. changes to the research status
quo due to new findings, or due to the research problem being solved already
elsewhere. This research however has been found to be valid and relevant to
date as COPQ remains endemic. Recent industry reports (e.g. BIS, 2013; HM
Government, 2013) have re-iterated the need to reduce the cost of construction
across all types of projects. It can therefore not be over-stated that the industry
needs improvement in this area which the research presents a solution and
offers real practical application for reducing COPQ on construction projects.
Continuous updates on literature review also ensure that there is no duplication
of work with other ongoing research.
1.8 BENEFICIARIES OF THE RESEARCH
The beneficiaries of this research are diverse and they include:
Organisations in the construction supply chain particularly the main
contractors since they execute the practical aspects projects and engage
several other sub-contractors. Depending on the contract type, the main
contractor organisation typically forms the core of the supply chain,
interfacing with the client organisation, consultants, and suppliers. The
CHAPTER 1: INTRODUCTION TO RESEARCH
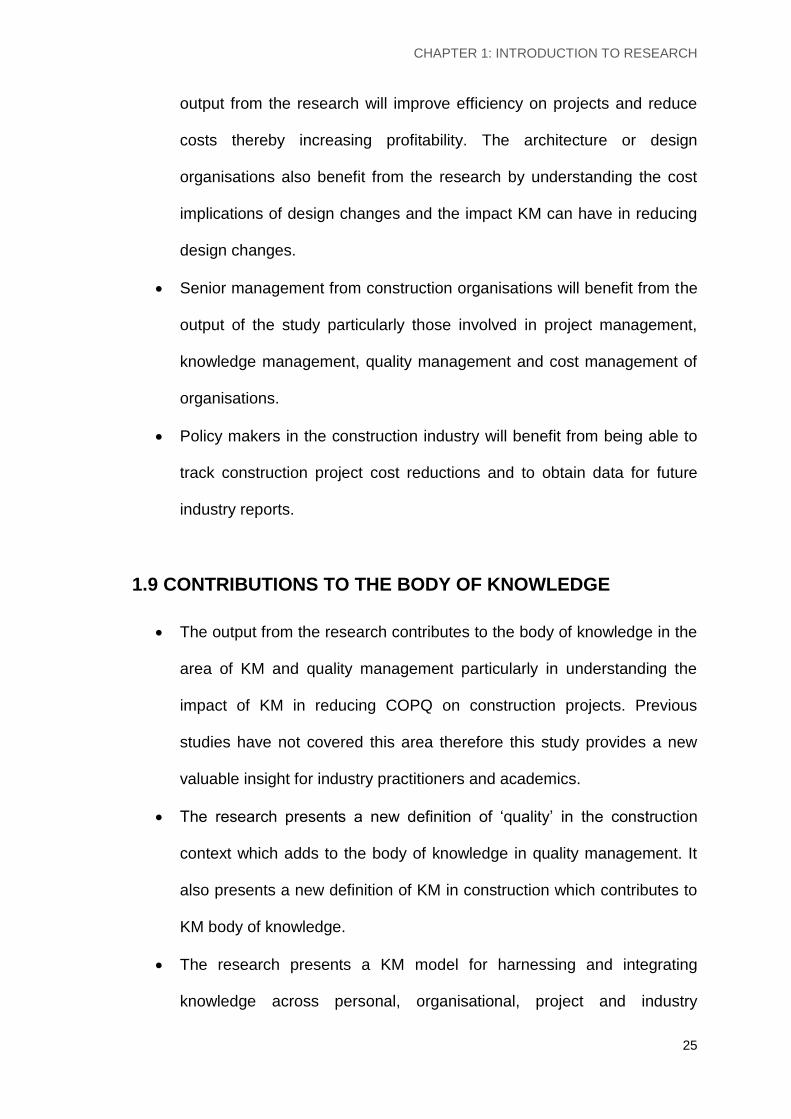
25
output from the research will improve efficiency on projects and reduce
costs thereby increasing profitability. The architecture or design
organisations also benefit from the research by understanding the cost
implications of design changes and the impact KM can have in reducing
design changes.
Senior management from construction organisations will benefit from the
output of the study particularly those involved in project management,
knowledge management, quality management and cost management of
organisations.
Policy makers in the construction industry will benefit from being able to
track construction project cost reductions and to obtain data for future
industry reports.
1.9 CONTRIBUTIONS TO THE BODY OF KNOWLEDGE
The output from the research contributes to the body of knowledge in the
area of KM and quality management particularly in understanding the
impact of KM in reducing COPQ on construction projects. Previous
studies have not covered this area therefore this study provides a new
valuable insight for industry practitioners and academics.
The research presents a new definition of ‘quality’ in the construction
context which adds to the body of knowledge in quality management. It
also presents a new definition of KM in construction which contributes to
KM body of knowledge.
The research presents a KM model for harnessing and integrating
knowledge across personal, organisational, project and industry
CHAPTER 1: INTRODUCTION TO RESEARCH
26
boundaries which adds to the body of knowledge both for academics and
industry practitioners.
The research presents a holistic approach to quantifying COPQ by
integrating elements of previous studies in areas such as rework, delays,
and wastage on projects. The new COPQ model is applicable for use in
the industry and for studies in academia.
The research presents a KM framework for reducing COPQ on
construction projects which has never before been presented in
academia and industry. This framework is different from the KM model
aforementioned.
The research provides new insight into how organisations can improve
project efficiency, reduce repetition of mistakes and reduce ‘re-inventing
the wheel’.
Output from the study contributes to industry knowledge in the area of
best practice and continuous improvement on projects.
Different aspects of the research work have been disseminated at
various academic seminars, workshops and conferences which have
stimulated positive debates and created new knowledge in the areas of
KM and COPQ.
Aspects of the research work have led to academic publications while the
main outputs are currently in the process of being published e.g.
Olayinka R., Suresh, S., and Chinyio, E. (2012) Reducing the Cost of
Poor Quality through Knowledge Management. Proceedings of COBRA,
RICS Foundation 11 – 13 September, Arizona State University, Arizona
USA

CHAPTER 1: INTRODUCTION TO RESEARCH
27
Olayinka R., Suresh, S., Chinyio, E., and Proverbs, D. (2011) A critique
on the Definitions of ‘Quality’ in the Construction Industry’ Proceedings of
the 10th International Post Graduate Research Conference (IPGRC),
14th -15th September. Pp 217-283
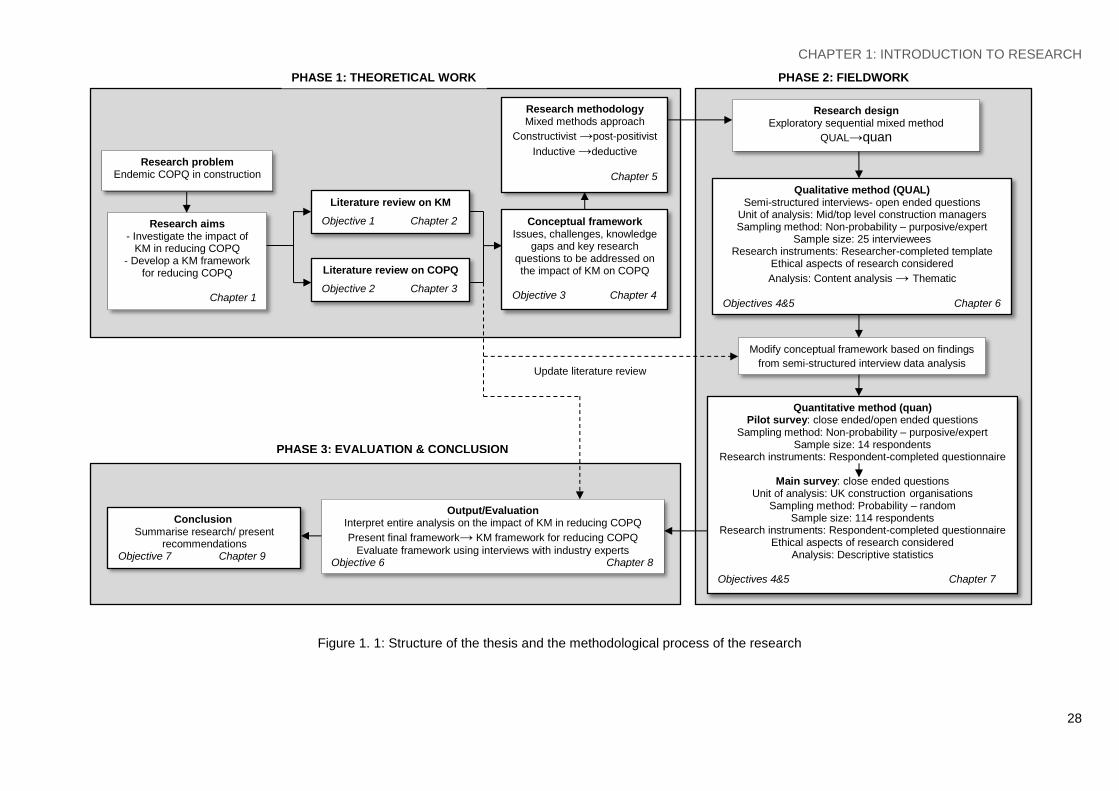
1.10 STRUCTURE OF THE THESIS
The structure of the thesis is explained by the methodological process of the
research shown in Figure 1.1. The thesis contains 9 chapters which are
arranged in a sequential and logical manner commencing with the Introduction
in this Chapter 1 and ending with Conclusion in Chapter 9.
Chapter 2 examines the existing body of work on knowledge management. It
critically reviews past and current literature on the conceptualisations of
knowledge and knowledge management. It explores knowledge management
processes and supporting tools. It examines strategic aspects such as the key
drivers, enablers, barriers and benefits of knowledge management. It also
examines knowledge management initiatives and applications within the
construction industry. It finally identifies the issues relating to knowledge
management within the construction project management context.
Chapter 3 examines the existing body of work on quality management with a
specific focus on the cost of poor quality on construction projects. It discusses
the conceptualisations of quality including key definitions and applications. The
chapter reviews and presents findings from three case studies obtained from a
secondary source which deal with construction stakeholders’ influence on the
definition of quality on construction projects.
CHAPTER 1: INTRODUCTION TO RESEARCH
28
Figure 1. 1: Structure of the thesis and the methodological process of the research
Research problem Endemic COPQ in construction
Research aims - Investigate the impact of
KM in reducing COPQ - Develop a KM framework
for reducing COPQ
Chapter 1
Literature review on KM
Objective 1 Chapter 2
Literature review on COPQ
Objective 2 Chapter 3
Conceptual framework Issues, challenges, knowledge
gaps and key research questions to be addressed on the impact of KM on COPQ
Objective 3 Chapter 4
Research methodology Mixed methods approach
Constructivist →post-positivist
Inductive →deductive
Chapter 5
PHASE 1: THEORETICAL WORK PHASE 2: FIELDWORK
Research design Exploratory sequential mixed method
QUAL→quan
Qualitative method (QUAL) Semi-structured interviews- open ended questions
Unit of analysis: Mid/top level construction managers Sampling method: Non-probability – purposive/expert
Sample size: 25 interviewees Research instruments: Researcher-completed template
Ethical aspects of research considered
Analysis: Content analysis → Thematic
Objectives 4&5 Chapter 6
Modify conceptual framework based on findings
from semi-structured interview data analysis
Quantitative method (quan) Pilot survey: close ended/open ended questions
Sampling method: Non-probability – purposive/expert Sample size: 14 respondents
Research instruments: Respondent-completed questionnaire
Main survey: close ended questions Unit of analysis: UK construction organisations
Sampling method: Probability – random Sample size: 114 respondents
Research instruments: Respondent-completed questionnaire Ethical aspects of research considered
Analysis: Descriptive statistics
Objectives 4&5 Chapter 7
Update literature review
Output/Evaluation Interpret entire analysis on the impact of KM in reducing COPQ
Present final framework→ KM framework for reducing COPQ
Evaluate framework using interviews with industry experts Objective 6 Chapter 8
Conclusion Summarise research/ present
recommendations Objective 7 Chapter 9
PHASE 3: EVALUATION & CONCLUSION

CHAPTER 1: INTRODUCTION TO RESEARCH
29
It explores the causes of poor quality and examines the resultant costs
associated with poor quality on construction projects. It quantifies the cost of
poor quality based on the work of previous authors. The chapter explores
quality management initiatives and tool used by organisations in reducing costs
of poor quality. It finally discusses the issues relating to COPQ in construction
project management.
Chapter 4 synthesises the bodies of work on knowledge management and the
cost of poor quality. It examines the links between knowledge management and
the prevalent cost of poor quality on construction projects. It identifies the
issues, challenges, knowledge gaps and key research questions on the impact
of knowledge management in reducing the cost of poor quality. It presents the
key research questions together with a matrix showing the areas of inquiry. It
distinguishes between a theoretical framework and a conceptual framework. It
also presents an initial conceptual framework for the study which is subject to
modifications at later stages of the study.
Chapter 5 discusses the methodology used for the research. It provides an
overview of the methodological process comprising of literature review,
conceptual framework, the research approach and the validation of framework.
It examines different research approaches and their underlying philosophical
assumptions. It explores different research designs or strategies of inquiry
available for research including methods for data collection and analysis. It
discusses the selection and justification of the research approach, research
design and research methods for this study. The chapter also discusses the
sampling strategies and ethical issues considered for the research.
CHAPTER 1: INTRODUCTION TO RESEARCH
30
Chapter 6 discusses the results from the qualitative study on the impact of
knowledge management on the cost of poor quality. It presents the profile of the
interviewees involved in the study. It discusses the findings on the contributory
factors to the cost of poor quality in practice which includes the cost of errors
and omissions, cost of design changes and the cost of poor skills. The chapter
discusses the findings on the impact of knowledge management on these costs.
It presents and discusses the findings on the optimisation of knowledge
management to reduce the cost of poor quality on construction projects. It
discusses the implications of the findings and presents the hypotheses to be
tested in a subsequent quantitative study. The chapter also presents a modified
conceptual framework incorporating the hypotheses and draws conclusions on
the overall qualitative study.
Chapter 7 presents the results and analysis of the quantitative data obtained
through questionnaire survey. It discusses the findings on the impact of KM
processes for reducing COPQ on construction projects, the effectiveness of KM
tools in reducing COPQ, the barriers to KM in reducing COPQ, the benefits of
reducing COPQ through KM optimisation, and the measurement of the impact
of KM on COPQ. The chapter also discusses the implications of the findings
and conclusions.
Chapter 8 presents an interpretation of the entire data i.e. qualitative and
quantitative. It connects all aspects of the research including the main research
questions, findings and conclusions from both qualitative and quantitative
inquiries. It discusses the overall impact of knowledge management on errors
and omissions, design changes and poor skills. It presents the knowledge

CHAPTER 1: INTRODUCTION TO RESEARCH
31
management framework for reducing the cost of poor quality on construction
projects. It also discusses the evaluation of the framework.
Chapter 9 presents a reflective review of the methodological process of the
research. It re-states the research aims and objectives. It discusses how the
research objectives were achieved. It reviews the research methods and
research outputs and their links to the research objectives. It presents the key
findings of the research from both theoretical work and fieldwork. It also
presents the recommendations, limitations of the research and direction for
further work and future studies.

CHAPTER 2: LITERATURE REVIEW ON KNOWLEDGE MANAGEMENT
32
CHAPTER 2
A REVIEW OF LITERATURE ON KNOWLEDGE MANAGEMENT
This chapter examines the existing body of work on knowledge management. It
critically reviews past and current literature on the conceptualisations of
knowledge and knowledge management. It explores knowledge management
processes and supporting tools. It examines strategic aspects such as the key
drivers, enablers, barriers and benefits of knowledge management. It also
examines knowledge management initiatives and applications within the
construction industry. It finally identifies the issues relating to knowledge
management within the construction project management context.
2.1 CONCEPTUALISATIONS OF KNOWLEDGE
This section addresses the following areas of inquiry relevant to the
conceptualisations of knowledge e.g. what is knowledge? How is knowledge
conceptualised? How is knowledge distinguished from data, information and
wisdom? What are the types of knowledge? Which types of knowledge are
relevant to knowledge management?
2.1.1 Definition of knowledge
It is fundamental to examine the basic foundations of KM in order to set the
background for the study and to establish a working definition of knowledge
itself. Epistemology, the branch of philosophy dealing with knowledge attempts
to answer the basic question ‘what is knowledge?’ Epistemology aims at; (1)
‘understanding ourselves and the environment that surrounds us’; (2) searching

CHAPTER 2: LITERATURE REVIEW ON KNOWLEDGE MANAGEMENT
33
for judgemental criteria that distinguish truth from falsehood. (Goldman, 1986;
Russell, 1948) Epistemology therefore is concerned with the process of
knowing or how to justify true knowledge as a result, scientific methods have
conceptually become an integral part of many epistemologies.
Efforts to define knowledge can be traced back to the days of Greek philosophy.
Plato (427-347 BC) provided three definitions; (1) knowledge is perception (2)
knowledge is true judgement (3) knowledge is justified true belief (Annas 2003).
Aristotle (384-322 BC) on the other hand put more emphasis on logical and
empirical methods for gathering knowledge but still accepts the view that such
knowledge is concerned with necessary and universal principles. Subsequent
philosophers who explored the concept of knowledge were divided between
Plato's and Aristotle's viewpoints. Consequently, two philosophical perspectives
of knowledge emerged namely the idealist and empiricist perspectives.
The idealist perspective is based on Plato's viewpoints that knowledge is a state
of being, while the empiricist perspective is based on Aristotle's viewpoint that
knowledge is doing (Jashapara, 2003; 2011). The idealist perspective starts
with perception and then true judgment develops and this translates into true
judgment together with an account. On the other hand, the empiricist
perspective starts with appearance, works through puzzles and then comes
back to appearance. Idealistic postulations of knowledge are existentialist while
empiricist postulations are pragmatic (Oluipke, 2007).

CHAPTER 2: LITERATURE REVIEW ON KNOWLEDGE MANAGEMENT
34
Table 2. 1 Philosophical perspectives of Knowledge
(Source: Hegel and Gray, 1997)
Idealist (being) Year Empiricist (doing) Year
Plato 427-347 BC Aristotle 384-322 BC
Descartes 1596-1650 Locke 1632-1704
Kant 1724-1804 Hume 1711-1976
Hegel 1770-1831 Pierce 1839-1914
Husserl 1859-1938 Dewey 1859-1952
Heidegger 1889-1976 Wittgenstein 1889-1951
Sartre 1905-1980
The philosophical concept of knowledge is very broad and often complex and
will not be discussed in this study but it is worth mentioning the two
philosophical viewpoints that have emerged. Early philosophical work also has
great influence on the logic of recent literature and the concept of knowledge
and its management in the present day. For instance, Nonaka and Takeuchi
(1995) defined knowledge as a dynamic human process of justifying personal
belief toward the ‘truth’. This reflects the earlier discussed philosophical view of
Plato who defined knowledge as ‘justified true belief’.
Scarborough (1996) defined knowledge as a canonical body of fact and rational
laws which is similar to Aristotle’s rational and empirical view point. According
to Merriam Webster (1996), knowledge is ‘the fact or condition of knowing
something with familiarity gained through experience or association’. Familiarity
with someone or something can include information, descriptions, facts, or skills
acquired through experience or education. Davenport and Prusak (1998) further
defined knowledge as a fluid mix of framed experiences, values, contextual
information and expert insight that provides a framework for evaluating and
incorporating new experiences and information. Gardner (1995) summarised

CHAPTER 2: LITERATURE REVIEW ON KNOWLEDGE MANAGEMENT
35
the definitions of knowledge as; (1) ‘know what’ - knowing which information is
needed; (2) ‘know why’ - knowing why information is needed; (3) ‘know how’ -
knowing how information must be processed; (4) ‘know where’ - knowing where
information can be found to achieve a specific result; and (5) ‘know when’ -
knowing when which information is needed.
The definition of knowledge has also varied from one era to another
(Jashapara, 2011). The world has undergone various eras such as the antiquity
era, agriculture era, industrial era, information era and now the knowledge era.
During the antiquity era, knowledge was associated with manners and custom
guides (Bennett, 2003; Jashapara, 2011), however during the agricultural era
knowledge related to agriculture and the work force (Wiig, 1997). In the
industrial era, knowledge was focused on product leadership, operational
excellence, finance, production statistics, metrics for reporting and standards
(Skyrme, 2000). As time progressed into the information era, knowledge
focused on leadership, management, organisational theory and capitalism
(Bennett, 2003). The knowledge era is associated with harnessing intangible
assets, creating value, innovation statistics, and metrics for managing (Skyrme,
2000).
From the plethora of definitions to date it would appear that there is no final
coherent definition of knowledge, however definitions can be classified into
traditional (e.g. Plato and Aristotle) and contemporary (e.g. Davenport and
Prusak, 1998; Skyrme, 2000). Traditional epistemology can only be of limited
use to knowledge management since it focuses on the origins and justification
of personal knowledge rather than the pragmatics of knowledge use. The
CHAPTER 2: LITERATURE REVIEW ON KNOWLEDGE MANAGEMENT
36
contemporary definitions are more relevant to knowledge management as they
focus on the pragmatics of knowledge use and on the notion of knowledge as a
practical tool for framing experiences, sharing insights and assisting with
practical tasks. Although knowledge management entails the justification
knowledge, more importantly it deals with the understanding of the uses of
knowledge in order to effectively deal with tasks that involve knowledge-based
activity. This study therefore focuses on the contemporary definitions, concepts
and applications.
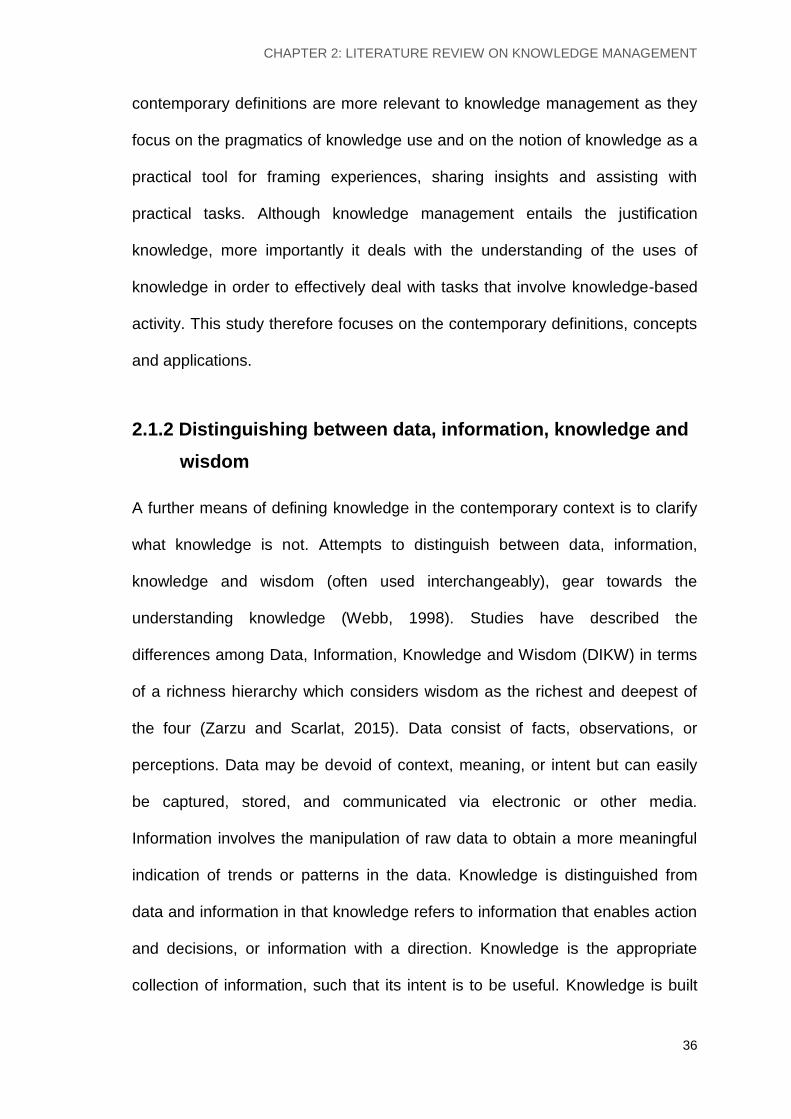
2.1.2 Distinguishing between data, information, knowledge and
wisdom
A further means of defining knowledge in the contemporary context is to clarify
what knowledge is not. Attempts to distinguish between data, information,
knowledge and wisdom (often used interchangeably), gear towards the
understanding knowledge (Webb, 1998). Studies have described the
differences among Data, Information, Knowledge and Wisdom (DIKW) in terms
of a richness hierarchy which considers wisdom as the richest and deepest of
the four (Zarzu and Scarlat, 2015). Data consist of facts, observations, or
perceptions. Data may be devoid of context, meaning, or intent but can easily
be captured, stored, and communicated via electronic or other media.
Information involves the manipulation of raw data to obtain a more meaningful
indication of trends or patterns in the data. Knowledge is distinguished from
data and information in that knowledge refers to information that enables action
and decisions, or information with a direction. Knowledge is the appropriate
collection of information, such that its intent is to be useful. Knowledge is built

CHAPTER 2: LITERATURE REVIEW ON KNOWLEDGE MANAGEMENT
37
from data, which is first processed into information. Wisdom brings together
experience, cognitive abilities, and affect for good decisions to be made (Ackoff,
1989; Sternberg, 1990; Blumentritt and Johnston, 1999; Becerra-Fernandez et
al., 2004; Becerra-Fernandez and Leidner, 2008; Nurnberger, and Wenzel,
2011; Zarzu and Scarlat, 2015).
Figure 2. 1: The DIKW hierarchy
Although the DIKW hierarchy has been widely adopted within the knowledge
management circle, researchers have critiqued and proposed alternative
models. Clarke (2005) for example included ‘understanding’ to the DIKW as an
interpolative and probabilistic process which is cognitive and analytical (see
Figure 2.2). It was described as the process by which new knowledge can be
synthesised from the previously held knowledge. The difference between
understanding and knowledge is the difference between ‘learning’ and
‘memorising’. People who have understanding could undertake useful actions
because they can synthesize new knowledge, or in some cases, at least new
information, from what is previously known and understood. Understanding
therefore can build upon currently held information, knowledge and
understanding itself. Another example is the ‘DIKIW’ model proposed by Liew
(2013) which included ‘intelligence’ as the unit of analysis in the DIKW hierarchy
Data
Information
Knowledge
Wisdom

CHAPTER 2: LITERATURE REVIEW ON KNOWLEDGE MANAGEMENT
38
stating that intelligence has inseparable relationships with knowledge and
wisdom (see Figure 2.3). Examining the various concepts in their entirety is
beyond the scope of this study however it was important to utilise the DIKW
hierarchy as a means of gaining more insight into what knowledge is and what it
is not. This lays the background to knowledge management.
Figure 2. 2: Alternative DIKW model (Adapted from Clarke, 2005)
Figure 2. 3: The ‘DIKIW’ model (Source: Liew, 2013)
Data
Wisdom
Knowledge
Information
Understanding
Conte
xt
Joining the
wholes
Gathering
of parts
Connection
of parts
Formation
of a whole
Researching Absorbing Doing Interacting Reflecting
Understanding universal truth
Sound judgment
Appropriate execution
Internalised
Processed and analysed Externalised
Conceptualised and constructed
Restructuring mental process
Data
Intelligence
Knowledge
Information
Wisdom
Captured and stored

CHAPTER 2: LITERATURE REVIEW ON KNOWLEDGE MANAGEMENT
39
2.1.3 Types of knowledge
There are two main types and several sub-types of knowledge identified from
previous studies. The main types are explicit knowledge and tacit. Explicit
knowledge is knowledge that can be expressed in formal and systematic
language and shared in the form of data, scientific formula, specifications, and
manuals and among a wide range of knowers. Tacit knowledge however is
subjective and experience based, not visible thus not easily expressed,
understood or measured, hard to encode and communicate (Polanyi, 1966;
Nonaka, 1994; Nonaka et al. 2000). There are two dimensions to tacit
knowledge; technical, and cognitive. Technical dimension encompasses
informal skills, crafts, expertise or ‘know-how’ acquired through years of
experience but difficult to articulate in a formal way. Cognitive dimension
consists of schema, mental models, beliefs and perceptions so ingrained that
they are taken for granted (Nonaka and Takeuchi, 1995).
The sub-types include procedural knowledge, declarative knowledge, causal
knowledge, conditional knowledge and relational knowledge (see Table 2.2).
Procedural knowledge or ‘know-how’ is a process whereby knowledge about
how to perform a task accumulates with experience over time (Argote and
Epple, 1990; Swart et al., 2014). Prior experience often dictates future
knowledge possibilities thereby rendering the process a cumulative and path-
dependent phenomenon. Once created such knowledge may reside in
individuals, organisational routines and processes (Argote, 1995; Jain and
Moreno, 2015). Declarative knowledge or ‘know what’ results from knowledge
generated through interactions, for example between producers and users of
their products. Such knowledge are usually documented (Karnoe, 1993).

CHAPTER 2: LITERATURE REVIEW ON KNOWLEDGE MANAGEMENT
40
Causal knowledge or ‘know why’ involves controlled experimentation and
simulation to understand the principles and underlying theories underlying the
functioning of a system. Accumulation of knowledge is cumulative within the
confines of an overall paradigm (Laudan, 1984) Prior knowledge is essential to
assimilate new knowledge (Cohen and Levinthal, 1990). Conditional knowledge
refers to knowing when and why to use declarative and procedural knowledge.
Relational knowledge or ‘know with’ is the knowledge that resides intangibly
with individuals through relations with others.
Table 2. 2: Summary of knowledge types, sub-types and characteristics
Description
Knowledge types
Explicit knowledge Knowledge that can be expressed in formal and systematic language
Tacit knowledge Subjective and experience based, not easily expressed, understood or measured, hard to encode and communicate
Knowledge sub-types
Procedural knowledge ‘Know-how’- process whereby knowledge about how to perform a task accumulates with experience over time
Declarative knowledge ‘Know-what’- results from knowledge generated through interactions, for example between producers and users of their products. Such knowledge are usually documented
Causal knowledge ‘Know-why’- involves controlled experimentation and simulation to understand the principles and underlying theories underlying the functioning of a system.
Conditional knowledge Refers to knowing when and why to use declarative and procedural knowledge
Relational knowledge ‘Know-with’- knowledge that resides intangibly with individuals through relations with others
Knowledge characteristics
Knowledge is embedded Resides within routines. It relates to the relationships between roles, technologies, formal procedures within a complex system
Knowledge is embodied Action oriented and consists of contextual practices over time
Knowledge is embrained Dependent on conceptual skills and cognitive abilities, and is considered to be practical, high-level knowledge, where objectives are met through perpetual recognition and revamping
Knowledge is encoded Information that is conveyed in signs and symbols (e.g. books, manuals, data bases) and de-contextualised into codes of practice.
Knowledge is encultured Shared understandings through socialisation and acculturation

CHAPTER 2: LITERATURE REVIEW ON KNOWLEDGE MANAGEMENT
41
Studies have explored the characteristics of knowledge and found that:
knowledge is embedded in practice; knowledge is embodied; knowledge is
embrained; knowledge is encoded; and knowledge is encultured. Embedded
knowledge is explicit and resides within routines. It relates to the relationships
between roles, technologies, formal procedures and emergent routines within a
complex system (Blackler 1995). Embodied knowledge is action oriented and
consists of contextual practices i.e. ‘knowledge by doing’ (Tsoukas, 1996).
Embrained knowledge is dependent on conceptual skills and cognitive abilities,
and is considered to be practical, high-level knowledge, where objectives are
met through perpetual recognition and revamping.
Tacit knowledge may also be embrained, even though it is mainly
subconscious. Encoded knowledge is information that is conveyed in signs and
symbols (e.g. books, manuals, data bases) and de-contextualised into codes of
practice. Rather than being a specific type of knowledge, it deals more with the
transmission, storage and interrogation of knowledge (Lam, 2000). Encultured
knowledge is the process of achieving shared understandings through
socialisation and acculturation (Zins, 2007; Urbancová and Vnoučková, 2015).
A summary of knowledge types, knowledge characteristics and description are
shown in Table 2.2. Lam (2000) explained that four of the types of knowledge,
excluding encultured knowledge which was not mentioned, arose from the
explicit-tacit and individual-collective dimensions of knowledge. This is shown in
the Figure 2.4. There exists a plethora of other knowledge types and sub-types,
most of which can be classified under tacit or explicit knowledge.

CHAPTER 2: LITERATURE REVIEW ON KNOWLEDGE MANAGEMENT
42
Individual Collective
Explicit Embrained knowledge Encoded knowledge
Tacit Embodied knowledge Embedded knowledge
Figure 2. 4: Relationships between knowledge types and characteristics (Source: Lam, 2000)
For example Grunstein and Barthes (1996) presented ‘intangible’ and ‘tangible’
knowledge dichotomy while Kimble et al. (2001) presented ‘soft’ and ‘hard’
knowledge being two parts of a duality. However both can be classified under
tacit and explicit knowledge respectively. Other knowledge types include:
product, process and people (Robinson et al., 2001); domain, organisational,
project (Whetherill et al., 2002); factual, catalogue, cultural (Heron, 1996);
company, corporate, technical, management (Grenstein and Barthes, 1996);
personal, organisational (Cheung, 2006), all of which possess tacit and explicit
knowledge elements
2.2 CONCEPTUALISATIONS OF KNOWLEDGE MANAGEMENT
This section addresses the following areas of inquiry relevant to the
conceptualisations of knowledge management e.g. What is knowledge
management? How is knowledge management conceptualised? What are
knowledge management processes and tools? How does knowledge
management fit into organisational strategy?
2.2.1 Operationalising the definition of knowledge management
There exists an in-exhaustive list of definitions of KM, several of which were
generated in the last two decades, the period in which KM gained enormous

CHAPTER 2: LITERATURE REVIEW ON KNOWLEDGE MANAGEMENT
43
popularity among researchers and practitioners. The multitude of definitions
can appear daunting and confusing (Jashapara 2011), conflicting and
overlapping (Anan and Singh 2011). Yet it has been argued that the cause can
be linked to the multidisciplinary nature of KM having its roots in a number of
other distinct disciplines such as philosophy, human resource management,
information systems, linguistics, and business (Dalkir 2005, Schwartz 2006). As
a result there is a tendency of each definition toward the root discipline it
originated from.
According to Davenport and Prusack (1998), ‘knowledge management draws
from existing resources that an organisation may already have in place, good
information systems management, organisational change management and
human resource management practices'. This definition has its roots in
information systems and human resource management. Newell et al. (2009)
defined KM from a business perspective as '…improving the ways in which
firms facing highly turbulent environments can mobilise their knowledge base in
order to ensure continuous innovation'. Similarly, Skyrme (2011) defined KM as
‘the explicit and systematic management of vital knowledge and its associated
processes of creation, organisation, diffusion, use and exploitation in pursuit of
business objectives.
Apart from the multidisciplinary perspective, it is often debated whether KM is a
tool, a process or strategy. As a tool, Bounfour (2003) defined KM as a set of
procedures, infrastructures, technical and managerial tools, designed towards
creating, sharing and leveraging information and knowledge within and around
organisation. As a process, Fischer (2001) defined KM as a cyclic process
CHAPTER 2: LITERATURE REVIEW ON KNOWLEDGE MANAGEMENT
44
involving, creation, integration and dissemination of knowledge. Similarly,
Skyrme (2002) presented KM as a continuous cyclic process comprising of
knowledge identification, collection, classification, storage, sharing, access,
usage, and new knowledge creation. As a strategy, O'Dell and Grayson (1997)
defined KM as a conscious strategy of getting the right knowledge to the right
people at the right time, and helping people to share and put the information
into action in ways that strive to improve organisational performance. Despite
the differences and variations in definitions of knowledge management,
commonalities were found and can be summarised as the operational definition
as follows:
‘Knowledge management entails harnessing and integrating knowledge across
boundaries through the adoption of processes and supporting tools for the
strategic benefit of an organisation’
Harnessing and integrating knowledge involve the interactions between the two
types of knowledge namely tacit and explicit. The interactions between the
knowledge types have been conceptualised by Nonaka and Takeuchi (1995)
who proposed a model for their facilitation. The model is known as the ‘SECI’
(Socialisation, Externalisation, Combination, Internalisation) and is widely
adopted in knowledge management circles. Having explored the definitions of
knowledge management, the four commonalities were found and are stated as
follows:
Harnessing and integrating knowledge (conceptualised by the SECI
model)
Adopting a knowledge management process

CHAPTER 2: LITERATURE REVIEW ON KNOWLEDGE MANAGEMENT
45
Utilising knowledge management tools
Aligning knowledge management with organisational strategy
The study therefore critically examines the each of the four commonalities in
order to develop a framework for application in the construction management
context.
2.2.2 Harnessing and integrating knowledge
An organisation harnesses and integrates knowledge through the interactions
between explicit knowledge and tacit knowledge. The interactions between the
two types are referred to as knowledge conversion which results in the creation
of new knowledge. There are four modes of knowledge conversion namely
Socialisation (tacit to tacit conversion), Externalisation (tacit to explicit),
Combination (Explicit to explicit) and Internalisation (Explicit to tacit), hence the
acronym ‘SECI’. The SECI model resulted from the work of Nonaka and
Takeuchi (1995). This is briefly discussed as follows:
Socialisation is the process of converting new tacit knowledge through shared
experiences. Since tacit knowledge is difficult to formalise and often time- and
space-specific, tacit knowledge can be acquired only through shared
experience, such as spending time together or living in the same environment.
Socialisation typically occurs in a traditional apprenticeship, where apprentices
learn the tacit knowledge needed in their craft through hands-on experience,
rather than from written manuals or textbooks. Socialisation may also occur in
informal social meetings outside of the workplace, where tacit knowledge such
as world views, mental models and mutual trust can be created and shared.
Socialisation also occurs beyond organisational boundaries. Firms often acquire

CHAPTER 2: LITERATURE REVIEW ON KNOWLEDGE MANAGEMENT
46
and take advantage of the tacit knowledge embedded in customers or suppliers
by interacting with them.
Externalisation is the process of articulating tacit knowledge into explicit
knowledge. When tacit knowledge is made explicit, knowledge is crystallised,
thus allowing it to be shared by others, and it becomes the basis of new
knowledge. Concept creation in new product development is an example of this
conversion process. Another example is a quality control circle, which allows
employees to make improvements on the manufacturing process by articulating
the tacit knowledge accumulated on the shop floor over years on the job. The
successful conversion of tacit knowledge into explicit knowledge depends on
the sequential use of metaphor, analogy and model.
Combination is the process of converting explicit knowledge into more complex
and systematic sets of explicit knowledge. Explicit knowledge is collected from
inside or outside the organisation and then combined, edited or processed to
form new knowledge. The new explicit knowledge is then disseminated among
the members of the organisation. Creative use of computerised communication
networks and large-scale databases can facilitate this mode of knowledge
conversion. When the comptroller of a company collects information from
throughout the organisation and puts it together in a context to make a financial
report, that report is new knowledge in the sense that it synthesises knowledge
from many different sources in one context. The combination mode of
knowledge conversion can also include the ‘breakdown’ of concepts. Breaking
down a concept such as a corporate vision into operationalised business or
product concepts also creates systemic, explicit knowledge.

CHAPTER 2: LITERATURE REVIEW ON KNOWLEDGE MANAGEMENT
47
Internalisation is the process of embodying explicit knowledge into tacit
knowledge. Through internalisation, explicit knowledge created is shared
throughout an organisation and converted into tacit knowledge by individuals.
Internalisation is closely related to ‘learning by doing'. Explicit knowledge, such
as the product concepts or the manufacturing procedures, has to be actualised
through action and practice. For example, training programmes can help
trainees to understand an organisation and themselves. By reading documents
or manuals about their jobs and the organisation, and by reflecting upon them,
trainees can internalise the explicit knowledge written in such documents to
enrich their tacit knowledge base.
Explicit knowledge can be also embodied through simulations or experiments
that trigger learning by doing. When knowledge is internalised to become part of
individuals' tacit knowledge bases in the form of shared mental models or
technical ‘know-how’, it becomes a valuable asset. This tacit knowledge
accumulated at the individual level can then set off a new spiral of knowledge
creation when it is shared with others through socialisation. Knowledge created
through each of the four modes of knowledge conversion interacts in the spiral
of knowledge creation. Figure 2.5 shows the four modes of knowledge
conversion and the evolving spiral movement of knowledge through the SECI
process. In the spiral of knowledge creation, the interaction between tacit and
explicit knowledge is amplified through the four modes of knowledge
conversion. The spiral becomes larger in scale as it moves up through the
ontological levels. Knowledge created through the SECI process can trigger a
new spiral of knowledge creation, expanding horizontally and vertically across
organisations.

CHAPTER 2: LITERATURE REVIEW ON KNOWLEDGE MANAGEMENT
48
Figure 2. 5: The SECI model showing the modes of knowledge conversion
(Source: Nonaka and Takeuchi, 1995; Nonaka et al., 2000)
It is a dynamic process, starting at the individual level and expanding as it
moves through communities of interaction that transcend sectional,
departmental, divisional and even organisational boundaries. Organisational
knowledge creation is a never-ending process that upgrades itself continuously.
This interactive spiral process takes place both intra- and inter-organisationally.
Knowledge is transferred beyond organisational boundaries, and knowledge
from different organisations interacts to create new knowledge. Through
dynamic interaction, knowledge created by the organisation can trigger the
mobilisation of knowledge held by outside constituents such as consumers,
affiliated companies, universities or distributors. For example, an innovative new
manufacturing process may bring about changes in the suppliers'
manufacturing process, which in turn triggers a new round of product and
process innovation at the organisation. Another example is the articulation of
tacit knowledge possessed by customers that they themselves have not been
able to articulate. A product works as the trigger to elicit tacit knowledge when
Explic
it E
xplic
it
Explicit Explicit
Socialisation
Empathising
Externalisation
Articulating
Embodying
Internalisation
Connecting
Combination
Tacit
Tacit
Tacit Tacit

CHAPTER 2: LITERATURE REVIEW ON KNOWLEDGE MANAGEMENT
49
customers give meaning to the product by purchasing, adapting, using, or not
purchasing it. Their actions are then reflected in the innovation process of the
organisation, and a new spiral of organisational knowledge creation starts
again.
Figure 2. 6: Creating knowledge with outside constituents (Source: Nonaka et al., 2000)
Figure 2.6 shows how the organisation interacts with outside constituents to
create knowledge. Knowledge creation is a self-transcending process, in which
individuals reach out beyond the boundaries of their own existence. In
knowledge creation, individuals transcend the boundary between themselves
and others, inside and outside, past and present. In socialisation, self-
transcendence is fundamental because tacit knowledge can only be shared
through direct experiences which go beyond individuals. For example, in the
socialisation process people empathise with their colleagues and customers,
which diminish barriers between individuals. In externalisation, an individual
transcends the inner- and outer-boundaries of the self by committing to the
Knowledge about products & market, Mental models
Explicit
Knowledge
Explicit
Knowledge
Needs, Knowledge,
Mental models
Exchange explicit knowledge through
dialogues
and Mutual understanding and
trust through shared experiences
Customer/supplier Company
Externalise

CHAPTER 2: LITERATURE REVIEW ON KNOWLEDGE MANAGEMENT
50
group and becoming one with the group. Here, the sum of the individuals'
intentions and ideas fuse and become integrated with the group's mental world.
In combination, new knowledge generated through externalisation transcends
the group in analogue or digital signals. In internalisation, individuals access the
knowledge realm of the group and the entire organisation. This again requires
self-transcendence, as individuals have to find themselves in a larger entity.
2.2.2.1 Implicit and Explacit knowledge
Despite the wide adoption of the SECI model, it is important to recognise the
debates relating to the tacit-explicit knowledge dichotomy. One of such debates
suggests that rather than tacit and explicit knowledge representing separate
and distinct types of knowledge, they represent two aspects of knowledge and
are in fact inseperable, and are mutually constituted (Tsoukas, 1996; Werr and
Stjernberg, 2003). One consequence of this is that there is no such thing as
fully explicit knowledge as all knowledge will have tacit dimensions. Clark
(2000) uses the term ‘explacit knowledge’ to linguistically symbolise their
inseparability for example text which is often referred to as a form of codified
knowledge has tacit components without which no reader could make sense of
it. Examples of these tacit elements include an understanding of the language in
which they are written and the grammar or syntax used to structure them.
Polanyi (1969, 1985) suggests that ‘the idea of a strictly explicit knowledge is
indeed self-contradictory; deprived of their tacit coefficients, all spoken words all
formulae, all maps and graphs are strictly meaningless’. While Polanyi’s work is
often used to justify the tacit-explicit dichotomy, a number of authors suggest
that this misunderstands his analysis (Brown and Duguid 2001; Prichard 2000).

CHAPTER 2: LITERATURE REVIEW ON KNOWLEDGE MANAGEMENT
51
Other debates surround the notion that the tacit-explicit characterisation is
rather too simplistic. According to Sternberg and Horvath (1999), a much more
nuanced and useful characterisation is to describe knowledge as explicit,
implicit, and tacit. Explicit represents knowledge that is set out in tangible form.
Tacit represents knowledge that one would have extreme difficulty operationally
setting out in tangible form. Implicit however should represent knowledge that is
not set out in tangible form but could be made explicit (Benjamin and Shepherd,
2003; Goujon et al., 2014; Bates, 2015). It would seem that the implicit concept
represents the cognitive dimension to knowledge which can be articulated
unlike the technical dimension which is difficult to articulate. This debate
therefore reinforces the SECI model rather than disprove it.
2.2.3 Adopting a knowledge management process
It has been established that despite the magnitude of research and available
literature on knowledge management there is yet to be a succinct definition of
the term neither is there consensus on what constitutes a good definition. What
is even more daunting is the lack of common terminology describing the
knowledge management process and sub-processes. In addition to the
complexity, there is no agreed sequence to the sub-processes neither is it clear
if the sub-processes should be cyclic. It is therefore important to examine the
processes presented by authors. A sample is drawn from the processes and
sub-processes presented by authors particularly in the past two decades when
knowledge management gained popularity in the industry and academia. A
sample of the definitions is shown on Table 2.3. Observing the table critically, it

CHAPTER 2: LITERATURE REVIEW ON KNOWLEDGE MANAGEMENT
52
is quite daunting to compare one author's presentation with another for several
reasons one of which is the variation in the use of terminology. Van der Spek
and Spijkervet (1995) presented KM as a process of 'creating knowledge',
'securing knowledge', 'distributing knowledge', and 'retrieving knowledge'. The
'distributing knowledge' aspect of the definition for example is also termed
'disseminate' (Wiig 1997, Shapiro 1999, Behin 2005), 'deploy' (Egbu et al. 2001,
Preece 2001), 'diffuse' (Ten Have et al. 2003). All these refer to the same
process of spreading or dispersing knowledge. It can be observed that there are
overlaps in terminology. Swan et al. (2000) identified 'sharing' and 'using' of
knowledge as part of the KM process, similarly, Tiwana (2002) identified
'sharing' and 'utilisation'.
It can be argued that 'sharing' is a subset of 'utilisation', therefore comes under
the 'utilisation' sub-process and not at per with 'utilisation' within the KM process
cycle. Another observation from the table is the disparity in the sequence of KM
processes. Wiig (1997) and Bhatt (2001) commenced the KM process with the
creation of knowledge. Wunram (1999) began with identification of knowledge
while Holsapple and Joshi (2000) began with acquisition of knowledge.
Davenport (1994) offered the still widely quoted definition: ‘Knowledge
management is the process of capturing, distributing, and effectively using
knowledge’. A total of 42 terminologies for KM sub-processes were identified
from the definitions shown in Table 2.4. Eight (8) distinct sub-processes
emerged namely: 'identify', 'capture', 'codify', 'store', 'access', 'exploit', 'create',
and 'assess'. Other sub-processes or terminologies can be classified under the
8 sub-processes as follows:

CHAPTER 2: LITERATURE REVIEW ON KNOWLEDGE MANAGEMENT
53
Table 2. 3: A Sample of definitions of knowledge management
Author(s) Knowledge management processes
Van der Spek and Spijkervet (1995)
Identified four areas within the process as: creating knowledge, securing knowledge, distributing knowledge, retrieving knowledge
Coombs (1997) Reviewed the common dimensions with KM processes and identified four common processes; capture or retrieval of knowledge, modifying knowledge format, validation of knowledge and making the knowledge of the appropriate context.
Liebowitz (1997) Formulated a nine-step KM approach from a process perspective: transform information into knowledge, identify and verify, capture and security, organisation, retrieval and application, combinations, creation, learning, selling/distributing.
Wiig (1997) Identified four activities, with a focus on the knowledge itself: creation and sourcing, compilation and transformation, dissemination, application and value realisation.
Davenport and Prusak (1998)
KM systems involve the following processes: generation, codification and coordination, transfer
Shapiro (1999) Identified four steps in inter project learning from a KM perspective: abstractions and generalisations, embodiment of learning, dissemination of learning and application of learning.
Swan et al. (2000) Defined KM as: process or practice of creating, acquiring, capturing, sharing and using knowledge, wherever it resides to enhance learning and performance in organisations
Wunram (1999) Presented seven elements: identification, acquisition, generation, structuring, storing, distribution, and assessment/evaluation.
Studer et al. (2000) Focused on acquiring, maintaining and accessing weakly structured information sources via three processes: acquiring, maintaining and accessing knowledge.
Holsapple and Joshi (2000)
Presented six activities: acquiring knowledge, selecting knowledge, internalising knowledge, using knowledge, generating knowledge, externalising knowledge
Bhatt (2001) KM processes involve the five areas: creation, validation, presentation, distribution, application
Egbu et al. (2001) Five processes of KM were identified as: creating knowledge, identifying knowledge, strategising knowledge, mobilising knowledge, deploying knowledge
Preece (2001) Identified three key facets to KM: knowledge capture, knowledge storage and knowledge deployment
Robinson et al. (2001) Identified five distinct but interrelated processes: discovering and capturing, organisation and storage, distribution and sharing, creation and leverage, archiving and retirement
Tiwana (2002) KM process consists of three areas: acquisition, sharing, utilisation
Ten Have et al. (2003) Characterised KM process in terms of the ‘learning organisation', this consists of four sub-processes: absorption, diffusion, generation and exploitation of knowledge.
(Behin 2005) Developed the knowledge virtuous circle, comprising six KM functions: acquiring skills, developing skills, building knowledge, applying knowledge, codifying knowledge and dissemination of knowledge.
Jashapara (2011) Defined KM as the effective learning process associated with exploitation and sharing of human knowledge that use appropriate technology and cultural environments to enhance an organisation's intellectual capital and performance
Table 2. 4: Knowledge management process and sub-processes (overleaf)

CHAPTER 2: LITERATURE REVIEW ON KNOWLEDGE MANAGEMENT
54
KM Process Selected terminology
Terminology found in literature V
an d
er
Spek
& S
pijk
erv
et
(1995)
Coom
bs
(1997)
Lie
bow
itz
(1997)
Wiig
(1997)
Davenport
and
Pru
sak (
1998)
Shapiro (
1999)
Wunra
m
(1999)
Stu
der
et al.
(2000)
Hols
apple
and
Joshi (2
000)
Arm
bre
cht
(2001)
Bhatt (
2001)
Egbu e
t al.
(2001)
Pre
ece (
2001)
Robin
son e
t
al. (
2001)
Vorb
eck a
nd
Fe
nke (
2001)
Tiw
ana (
2002)
Shapiro (
1999);
Te
n H
ave e
t al.
(2003)
(Behin
2005)
Jashapara
(2011)
To
tal fr
om
sam
ple
1. Identify Identify 3
Source 1
Select 1
Discover 1
2. Capture Capture 5
Acquire 5
Absorb 1
Abstract 1
3. Codify Codify 2
Modify 1
Organise 1
Transform 1
Compile 1
Coordinate 1
Structure 1
Develop 1
Filter 1
4. Store Store 4
Maintain 1
Secure 1
5. Access Access 1
Retrieve 3
6. Exploit Exploit 2
Disseminate 3
Share 3
Transfer 1
Distribute 5
Sell 1
Deploy 2
Diffuse 1
Mobilise 1
Learn 1
Use 1
Re-use 1
Apply 5
Leverage 1
Strategise 1
Utilise 2
7. Create Create 8
Generate 4
8. Assess Assess 2
Validate 2
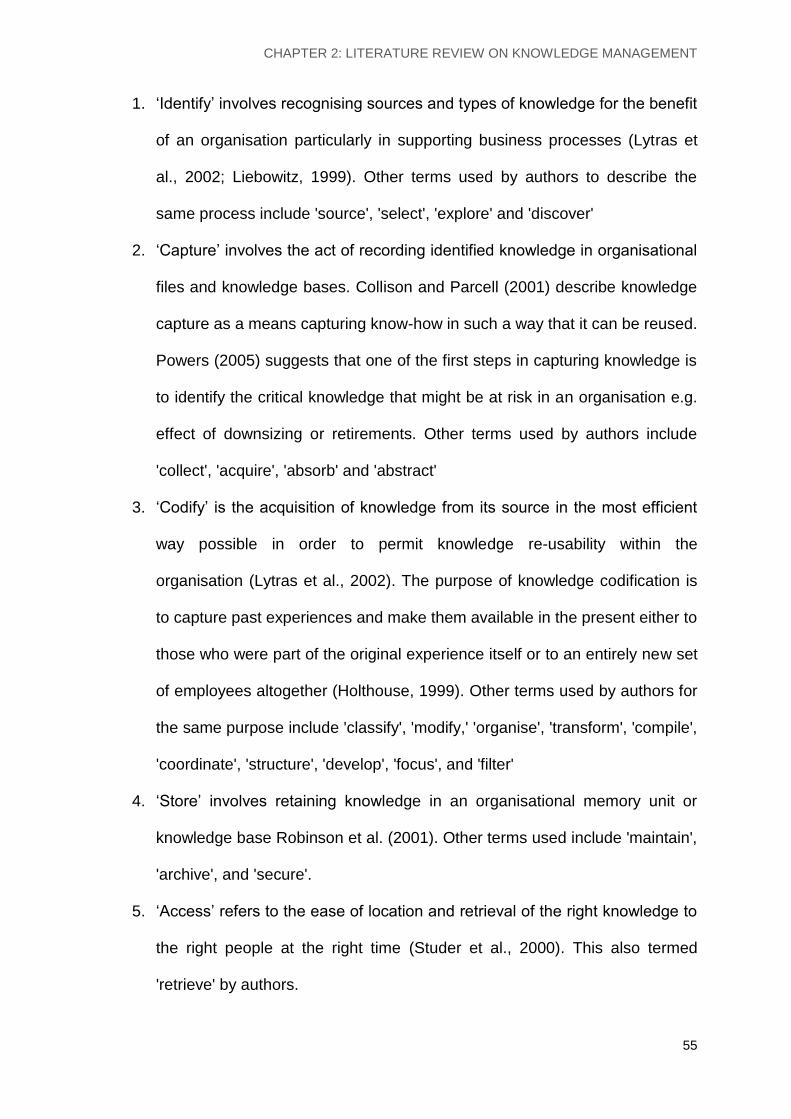
CHAPTER 2: LITERATURE REVIEW ON KNOWLEDGE MANAGEMENT
55
1. ‘Identify’ involves recognising sources and types of knowledge for the benefit
of an organisation particularly in supporting business processes (Lytras et
al., 2002; Liebowitz, 1999). Other terms used by authors to describe the
same process include 'source', 'select', 'explore' and 'discover'
2. ‘Capture’ involves the act of recording identified knowledge in organisational
files and knowledge bases. Collison and Parcell (2001) describe knowledge
capture as a means capturing know-how in such a way that it can be reused.
Powers (2005) suggests that one of the first steps in capturing knowledge is
to identify the critical knowledge that might be at risk in an organisation e.g.
effect of downsizing or retirements. Other terms used by authors include
'collect', 'acquire', 'absorb' and 'abstract'
3. ‘Codify’ is the acquisition of knowledge from its source in the most efficient
way possible in order to permit knowledge re-usability within the
organisation (Lytras et al., 2002). The purpose of knowledge codification is
to capture past experiences and make them available in the present either to
those who were part of the original experience itself or to an entirely new set
of employees altogether (Holthouse, 1999). Other terms used by authors for
the same purpose include 'classify', 'modify,' 'organise', 'transform', 'compile',
'coordinate', 'structure', 'develop', 'focus', and 'filter'
4. ‘Store’ involves retaining knowledge in an organisational memory unit or
knowledge base Robinson et al. (2001). Other terms used include 'maintain',
'archive', and 'secure'.
5. ‘Access’ refers to the ease of location and retrieval of the right knowledge to
the right people at the right time (Studer et al., 2000). This also termed
'retrieve' by authors.

CHAPTER 2: LITERATURE REVIEW ON KNOWLEDGE MANAGEMENT
56
6. ‘Exploit’ involves the optimal use of knowledge for organisational and
individual benefits. It includes activities facilitates the knowledge conversion
process (Nonaka and Takeuchi, 1995) at individual, organisational or inter-
organisation levels.Knowledge exploitation involves several sub-processes
which have been identified by authors as: 'disseminate', 'share', 'transfer',
'distribute', 'sell', 'deploy', 'diffuse', 'mobilise', 'learn', 'use', 're-use', 'apply',
'leverage', 'strategise' and 'utilise'.
7. ‘Create’ is the strategic organisational ability to bring into existence and
originate new knowledge continuously and repeatedly in a circular process
with no ultimate end (Egbu et al., 2001; Storey and Quintas, 2001).
Knowledge creation involves the generation and discovery of new
knowledge. According to Takeuchi (1998) knowledge creation should be
viewed as a process whereby the organisation amplifies the knowledge
created by employees and crystallises it as part of the knowledge network of
the organisation. Similarly Tiwana (2002) stated that a successful KM project
must begin with knowledge that already exists, deliver initial results, and
then continue to expand. New knowledge is usually created as one of the
outcomes of managing existing knowledge. Other authors use the synonym
‘generate’.
8. Assess: refers to the measurement and benchmarking of KM outcomes
within an organisation. Authors have use the terms 'validate', 'evaluate' and
'measure'
The 8 sub-processes can be further classified under 3 main headings (Figure
2.7):

CHAPTER 2: LITERATURE REVIEW ON KNOWLEDGE MANAGEMENT
57
1. Knowledge acquisition – the process of absorbing and storing knowledge,
the success of which is often gauged by how well the knowledge can later
be retrieved. Sub-processes 1-5 fit into knowledge acquisition (i.e. identify,
capture, codify, store, access)
2. Knowledge exploitation – involves optimal unitisation of knowledge for the
benefit and profit of an organisation. Sub-processes 6-7 belong to this
category (e.g. disseminate, share, transfer, create new knowledge)
3. Knowledge evaluation – a systematic determination of merit using criteria
governed by a set of standards which assists an organisation to ascertain
the degree of achievement or value in regards to the aim and objectives of
an undertaken project. Sub-process 8 belong to this category (i.e. validate,
evaluate, measure)

CHAPTER 2: LITERATURE REVIEW ON KNOWLEDGE MANAGEMENT
58
Figure 2. 7: KM sub-process classification based on author definitions
Knowledge evaluation
Knowledge exploitation
Knowledge acquisition
Identify
Assess
Create
Exploit
Codify
Access
Store
Capture
Compile
Develop
Transform
Coordinate
Structure
Filter
Store
Disseminate
Exploit
Retrieve
Access
Secure
Maintain
Transfer
Deploy
Share
Distribute
Sell
Diffuse
Mobilise
Strategise
Leverage
Apply
Re-use
Use
Learn
Source
Capture
Identify
Select
Discover
Acquire
Organise
Modify
Codify
Abstract
Absorb
Utilise
Assess
Generate
Create
Validate
Knowledge Management Process

CHAPTER 2: LITERATURE REVIEW ON KNOWLEDGE MANAGEMENT
59
2.2.4 Utilising knowledge management tools
Knowledge management processes are typically supported by tools (Piorkowski
et al., 2013). The complexities encountered in defining knowledge and
knowledge management extend to the definition of tools as there is no
consensus to what constitutes a knowledge management tool. Attempt has
been made by authors to define tools as all those instrument that include
anything that serves as a means for performing functions, processes,
operations or tasks in KM. These tools have the capability to integrate, classify,
and codify knowledge from various sources, the ability to enable search
retrieval and discovery knowledge, and the capacity to support knowledge
sharing between people or other agents (Wensley, 2000; Benbya et al., 2004).
Some authors use the term KM tools to mean IT tools, however this would be
erroneous as it was identified that not all KM tools are IT-based as everyday
tools such as papers, pens, and videos can be utilised to support KM. Some
authors define tools as technologies for example Ruggles (1997) described
tools as the technologies used to enhance and enable the implementation of
knowledge management sub-processes (e.g. knowledge generation,
codification, and transfer). Some authors refer to tools as techniques or use the
two terms interchangeably. Wenger et al., (2002) referred to techniques as
procedures and methods by which knowledge is managed often through the
use of tools. This brings about the questions: what are the differences between
tools, techniques and technologies? What is the role of IT in KM?
According to Al-Ghassani (2002) KM tools refer to both non-IT tools and IT
tools. To distinguish between them, the terms ‘KM techniques’ and ‘KM

CHAPTER 2: LITERATURE REVIEW ON KNOWLEDGE MANAGEMENT
60
Technologies’ were used to represent ‘non-IT tools’ and ‘IT tools’ respectively.
KM techniques have more involvement of people and focus on tacit knowledge
for example brainstorming, communities of practice and face to face
interactions. KM technologies require IT infrastructure and have more focus on
explicit knowledge for example intranets and knowledge bases. This view is
supported by other authors but using different terminologies. The terminologies
used to refer to non-IT and IT tools include ‘personalisation’ and ‘codification’
tools (Hansen et al.,1999; Dingsoyr, 2002; Love et al., 2005), ‘soft’ and ‘hard’
(Sveiby, 2001), ‘organic’ and ‘mechanistic’ (Kamara et al., 2002), ‘people track’
and ‘IT track’ (Sveiby, 2002). The main differences between KM techniques
and technologies are presented in Table 2.5.
Table 2. 5: The main differences between KM techniques and technologies (Source: Al-Ghassani, 2002)
KM tools
KM techniques KM technologies
Require strategies for learning
More involvement of people
Affordable to most organisations
Easy to implement and maintain
More focus on tacit knowledge
Require IT infrastructure
Require IT skills
Expensive to acquire and maintain
Sophisticated implementation and maintenance
More focus on explicit knowledge
There exists a wide range of techniques and technologies available to support
knowledge management. Unlike techniques, technologies are made up of
hardware and software. Hardware technologies are very important for a KM
system as they form the platform for the software technologies to perform and
the medium for the storage and transfer of knowledge. Examples of the
hardware requirements for a KM system are personal computers and network
servers. Software technologies however deal more with IT content which play
an important part in facilitating the implementation of KM. Examples of KM
techniques and technologies are described in Tables 2.6 and 2.7 respectively.

CHAPTER 2: LITERATURE REVIEW ON KNOWLEDGE MANAGEMENT
61
Table 2. 6: Examples of knowledge management techniques
KM techniques Description
Apprenticeships
Form of training in a particular trade carried out mainly by practical experience or learning by doing (not through formal instruction). Apprentices often work with their masters and learn craftsmanship through observation, imitation, and practice.
Brainstorming Process where a group of people meet to focus on a problem, or idea, and explore such ideas with a view to coming up with solutions, or further developing the ideas.
Communities of practice
Also called knowledge communities, knowledge networks, learning communities, communities of interest and thematic groups. These consist of a group of people of different skill sets, development histories and experience backgrounds that work together to achieve commonly shared goals
Face-to-face interactions
Traditional approach for sharing the tacit knowledge (socialisation) owned by an organisation’s employees. It usually takes an informal approach and is very powerful
Mentoring Process where a trainee or a junior staff is attached or assigned to a senior member of an organisation for advice related to career development. The mentor provides a coaching role to facilitate the development of the trainee by identifying training needs and other development aspirations.
Post project reviews Debriefing sessions used to highlight lessons learnt during the course of a project. These reviews are important for knowledge capture
Recruitment Easy way for knowledge buy-in. This is a ‘tool’ for acquiring external tacit knowledge especially of experts. This approach adds new knowledge and expands the organisational knowledge base. Members within the organisation can also learn from the recruited member formally and informally so that knowledge will be transferred and retained if the individual leaves the organisation.
Training Helps in improving staff skills and therefore increasing their knowledge. Its implementation depends on plans and strategies developed by the organisation to ensure that employees’ knowledge is continuously updated.
The challenge for organisations lies in the selection of the appropriate tools for
knowledge management (Choudhary et al., 2013; Pietrzak et al., 2015).
Different tools may be required to support different aspects of the knowledge
management sub-processes of knowledge identification, capture, codification,
storage, access, exploitation (e.g. sharing, dissemination), knowledge creation
and assessment. The appropriate tool for knowledge storage for example could
be the use of a knowledge base (technology) while that of knowledge
codification could lie in the use of data/text mining (technology). The tool for
knowledge sharing could be the use of communities of practice (technique).

CHAPTER 2: LITERATURE REVIEW ON KNOWLEDGE MANAGEMENT
62
Table 2. 7: Examples of knowledge management technologies
KM technologies Description
Data and text mining
Extracting meaningful knowledge from masses of data or text. Data are single facts (structured) about events while text refers to unstructured data. The process of data/text mining enables meaningful patterns and associations of data (words and phrases) to be identified from one or more large databases or ‘knowledge-bases’. The approach is also very useful for identifying hidden relationships between data and hence creating new knowledge
Groupware Software product that helps groups of people to communicate and share information. Useful for group decision-making. Supports distributed and virtual project teams where team members are from multiple organisations and in geographically dispersed locations. Groupware tools usually contain email communications, instant messaging, discussion areas, file area or document repository, information management tools
Intranet/extranet Inter-organisational network that is guarded against outside access by security tools called firewalls. Extranet is an Intranet with limited access to outsiders, making it possible for them to collect and deliver certain knowledge. Useful for making organisational knowledge available to geographically dispersed staff members and is therefore used by many organisations.
Knowledge bases Repositories that store knowledge about a topic in a concise and organised manner. They present facts that can be found in a book, a collection of books, web sites or even human knowledge.
Knowledge maps Used to locate sources of knowledge and experience within or outside an organisation. Knowledge maps are created by transferring aspects of knowledge location and type into a graphical form resulting in a map of where knowledge resides within and outside of the organisation. Knowledge maps can point to people, documents and databases
Taxonomy/ontologies Collection of terms and the relationships between them that is commonly used in an organisation. Examples of a relationship are hierarchical, functional and networked. Ontologies support deep (refined) representation (for both descriptive and procedural knowledge) of each of the terms (concepts) as well as defined domain theory or theories that govern the permissible operations with the concepts in the ontology.
The selection of techniques and technologies is informed, for example, by the
type of knowledge management sub-process to be supported, the nature and
location of knowledge the capabilities of the tool and most importantly the goal
of adopting knowledge management and how it fits into the overall
organisational strategy (Lefika and Mearns, 2015).
2.2.5 Aligning knowledge management with organisational
strategy
Knowledge management has been linked to business performance therefore
making the case for its adoption in organisational strategy (Carrillo et al., 2003;
CHAPTER 2: LITERATURE REVIEW ON KNOWLEDGE MANAGEMENT
63
Nonaka and von Krogh, 2009; Ollila et al., 2015). According to Kluge et al.,
(2001) knowledge is at the heart of much of today’s global economy, and
managing knowledge has become vital to organisational success. The question
therefore is: how can organisations systematically exploit all dimensions of
knowledge and fully utilise them to improve revenues, profits and growth? The
solutions are perhaps embedded in the context that organisations have widely
different goals, scope, and success criteria for knowledge management. Failure
or successes will be dependent on the set criteria. It is therefore important to
examine the aspects relating to knowledge management and organisational
strategy. The aspects are:
Drivers of knowledge management
Enablers of knowledge management
Barriers of knowledge management
Benefits of knowledge management
2.2.5.1 Drivers of knowledge management
Drivers refer to the catalysts for the implementation of knowledge management
i.e. those market catalysts that make knowledge management imperative for
organisations to maintain or improve their competitive market position (Du
Plessis, 2005; Argote and Miron-Spektor, 2011; Budihardjo 2015). A simplistic
question to be asked therefore is ‘what drives organisations to adopt and
implement knowledge management strategies?’ One of such drivers is the need
to leverage knowledge. Knowledge can be leveraged from both inside (e.g.
employees and internal customers) and outside (shareholders and customers)
of an organisation. In the current knowledge era, knowledge is being treated as
a key asset and thus competitive advantage can be achieved by sharing

CHAPTER 2: LITERATURE REVIEW ON KNOWLEDGE MANAGEMENT
64
knowledge internally with employees and externally with customers and
stakeholders (Liebowitz, 2000; Love et al., 2005; Nitzan and Procaccia, 2015).
Organisations are driven to acquire knowledge from valued individuals and to
analyse business activities in order to learn from both successes and failures
which in turn leads to continuous improvement and profitability. This leads to
another driver which is the need to improve business performance. Markets
change rapidly demanding shorter development times and product lifecycles, as
a result knowledge management aids research and development and
operations necessary to achieve reduced development times including up-to-
date reviews of customer behaviour and strategic activities of competitors.
(O’Leary, 2001; Armbretch, 2001; Liebowitz, 2002; Chua, 2004; Love et al
2005; Chen and Fong, 2015). From a resource based view, by sharing best
practices across an organisation, the performance of the less well performing
units can be brought closer to that of the best.
Constant re-organisations mean that the relationships in which informal
knowledge is shared are often broken; some organisations have a demographic
situation in which many experienced and knowledgeable staff will reach retiring
age within a short period of time. Recognising that expertise critical to the
organisation’s core competencies is held within an ageing and perhaps mobile
workforce prompts serious and valid concerns regarding retention of this
important knowledge serves as the key driver for implementing knowledge
management (Johne, 2001; Wilson, 2001; Rumizen, 2002; Liebowitz, 2002;
Mason, 2003; Widmer, 2005; Tubigi and Alshawi, 2015). Globalisation and a
distributed workforce have placed businesses everywhere in a new and
different competitive situation, where integrating knowledge provides the

CHAPTER 2: LITERATURE REVIEW ON KNOWLEDGE MANAGEMENT
65
competitive edge. A key feature of globalisation is the distributed nature of an
organisation’s employees and the increasing complexity of organisations
resulting in more complicated and risky decision-making (Metaxiotis 2003;
Galati, 2015). Knowledge management coupled with appropriate technology
provides the capability for organisations to work effectively across continents
and time zones with a distributed workforce, using appropriate
telecommunications (Chua, 2004) and virtual teams (Satyadas, 2001). In effect
knowledge management can be used to leverage global capabilities of an
organisation for the purposes of getting the right experience to the right person
at the right time to solve business problems and achieve the required solutions
(Behin, 2005; Costa and Lima, 2015)
In the case of staff development, knowledge management can enhance staff
capabilities (Liebowitz, 2002; Olomolaiye, 2007), enable employee perform
knowledge intensive tasks (Fischer 2001), decrease time to completion
(Satyadas 2001) and improve an organisation’s ability to disseminate learning
effectively from one part of the organisation to others within it (Kakabadse,
2003; Love et al, 2005; Lefika and Mearns, 2015). Knowledge management can
provide an environment to foster and enhance skilled people (Sharkie, 2003).
Another driver for knowledge management is the need for better enabling
technology. The growth of functionality of the internet, including collaborative
workspaces, discussion groups, content management systems and portals,
makes it easier to assemble and share information across organisational
boundaries (Wilson, 2001; Leybourne and Kennedy, 2015). Faster, better,
cheaper is the result of more effective innovation.
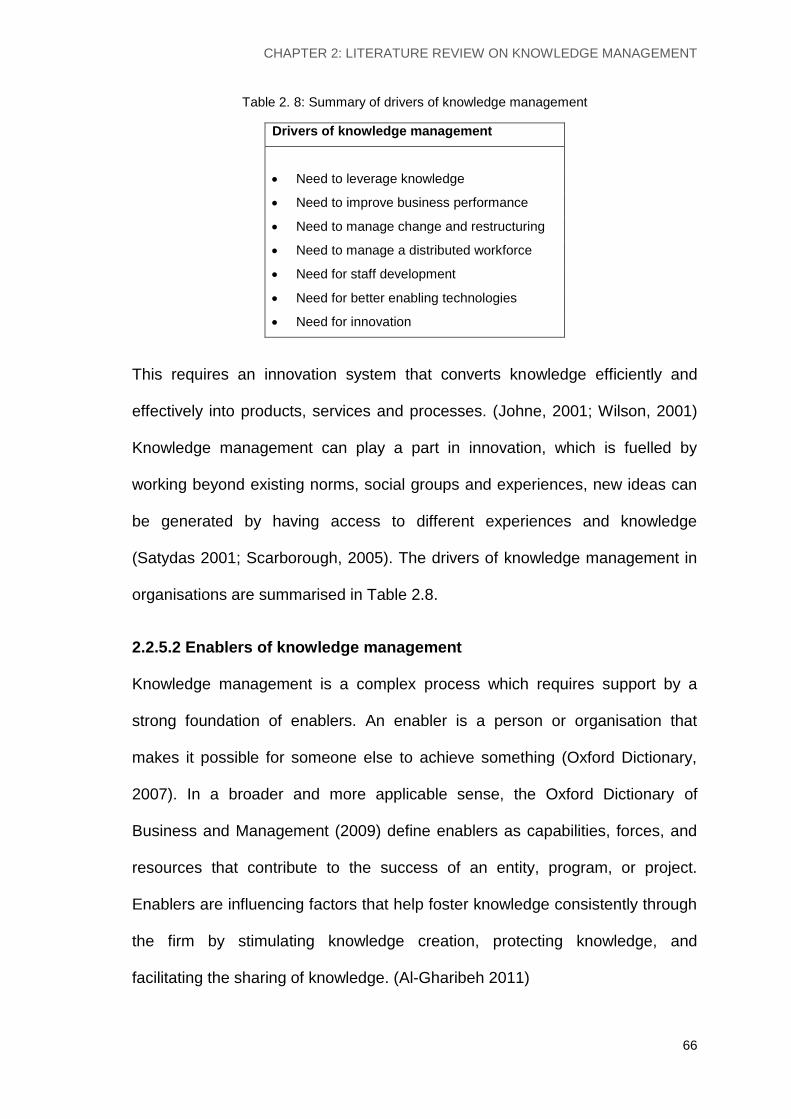
CHAPTER 2: LITERATURE REVIEW ON KNOWLEDGE MANAGEMENT
66
Table 2. 8: Summary of drivers of knowledge management
Drivers of knowledge management
Need to leverage knowledge
Need to improve business performance
Need to manage change and restructuring
Need to manage a distributed workforce
Need for staff development
Need for better enabling technologies
Need for innovation
This requires an innovation system that converts knowledge efficiently and
effectively into products, services and processes. (Johne, 2001; Wilson, 2001)
Knowledge management can play a part in innovation, which is fuelled by
working beyond existing norms, social groups and experiences, new ideas can
be generated by having access to different experiences and knowledge
(Satydas 2001; Scarborough, 2005). The drivers of knowledge management in
organisations are summarised in Table 2.8.
2.2.5.2 Enablers of knowledge management
Knowledge management is a complex process which requires support by a
strong foundation of enablers. An enabler is a person or organisation that
makes it possible for someone else to achieve something (Oxford Dictionary,
2007). In a broader and more applicable sense, the Oxford Dictionary of
Business and Management (2009) define enablers as capabilities, forces, and
resources that contribute to the success of an entity, program, or project.
Enablers are influencing factors that help foster knowledge consistently through
the firm by stimulating knowledge creation, protecting knowledge, and
facilitating the sharing of knowledge. (Al-Gharibeh 2011)

CHAPTER 2: LITERATURE REVIEW ON KNOWLEDGE MANAGEMENT
67
According to APQC (2000) and Aurum et al. (2007) the enablers for KM are;
leadership, culture, measurement, and technology. Each of these must be
designed and managed in alignment with the other and in support of the
process. Aurum et al. (2007) considered leadership to be the most significant as
knowledge management requires a top-down approach for its successful
implementation. Nonaka and Toyama (2005) also found that leadership is vital
enabler for successful knowledge management. Vitala (2004) defined some
dimensions of knowledge leadership as orienteering of learning, creating
climate that supports learning, supporting individual and group level learning
process and acting as a role model.
Leadership plays various roles in knowledge creating process such as providing
vision, creating, energising, enabling and promoting the continuous spiral of
knowledge creation. Von Krogh, et al. (2000) similarly stated that managers
need to support knowledge creation rather than control it. They identified
enablers for strategy and knowledge creation thus: Instill a knowledge vision,
manage conversations and mobilise knowledge activists. According to them,
good conversations are the cradle of social knowledge in any organisation as
they allow the first and most essential step of knowledge creation, which is
sharing tacit knowledge within a micro-community. Knowledge Activists are
persons who facilitate the knowledge creation process, create right context and
globalise local knowledge aiming at transferring locally created knowledge
throughout perhaps globally distributed company. Culture is an important
enabler concerned with the ‘climate’ of the knowledge sharing environment, as
well as the culture in the organisation that promotes the knowledge sharing.
Organisational culture is the common belief, conduct rules and values shared

CHAPTER 2: LITERATURE REVIEW ON KNOWLEDGE MANAGEMENT
68
by all organisational members (e.g. Hofstede, 1993). According to Wen-bao
(2007), organisational culture can be classified into bureaucratic, innovative and
supportive. Bureaucratic culture means that most of the work in an organisation
is standardised and operates on the basis of control and power (Wen-bao,
2007; Romero, 2014). Tasks are completed in proper sequence and enterprise
ethic is specially emphasised. Innovative culture means that the work in an
organisation is challenging and innovative in which case organisational
members are encouraged for adventure and initiative (Romero, 2014). A
supportive culture refers to an open and harmonious working environment in
which participation, teamwork and interpersonal relationship are specially
emphasised (Man and Luvison, 2014).
According to Jennex and Olfman (2004), an organisational culture should
support learning and sharing. Examples of organisational cultures are altruism,
reciprocity, trust, repute, openness, solidarity, sociability, motivation, and
commitment. Measuring and evaluating knowledge performance are key
enablers and important factors that can serve a number of purposes including
gathering evidence on the cost and benefits of implementing knowledge
management within an organisation, monitoring progress and learning from past
activities (Stanfield and Mullan, 2008). It is important for organisations to map
out key performance indicators to benchmark the progress of knowledge
management activities. Hartz et al. (2001) identified areas desirable for
replication and measurement throughout an organisation, they include
measurement of business value, retention of knowledge, cultural impact, and
effectiveness of sharing communities.

CHAPTER 2: LITERATURE REVIEW ON KNOWLEDGE MANAGEMENT
69
There have been a number of technologies enabling or facilitating knowledge
management activities in organisations, including expert systems, knowledge
bases, software help desk tools, and document management systems.
According to Hein (2004) and Brink (2003), technology supports knowledge by
enabling communication, collaboration, storing and retrieval of knowledge. The
advent of the Internet brought with it further enabling technologies, including e-
learning, web conferencing, collaborative software, content management
systems, corporate directories, email lists, wikis, blogs, and other technologies.
Each enabling technology can expand the level of inquiry available to an
employee, while providing a platform to achieve specific goals or actions.
Technology therefore plays a role in integrating knowledge and creating new
knowledge within an organisation.
In addition to technology, Al-Gharibeh (2011) highlighted six other enablers of
knowledge management namely collaboration, trust, learning, centralisation,
formalisation, and T-shaped skills. Collaboration relates to the degree of active
support and help in an organisation. Trust refers to degree of reciprocal faith in
others intentions, behaviours, and skills toward organisational goals. Learning
relates to the degree of opportunity, variety, satisfaction, and encouragement
for learning and development in an organisation. Centralisation is degree of
authority and control over decisions. Formalisation is the degree of formal rules,
procedures, and standard polices. T-shaped skills relates to the degree of
understanding of employees own and other’s task areas. A summary of the
enablers to knowledge management are summarised in Table 2.9.

CHAPTER 2: LITERATURE REVIEW ON KNOWLEDGE MANAGEMENT
70
Table 2. 9: Summary of enablers of knowledge management
Enablers of knowledge management
Leadership
Knowledge activists
Organisational culture
Measurement and evaluation
Technology
Collaboration
Trust
Learning
Centralisation
Formalisation
T-shaped skills
2.2.5.3 Barriers to knowledge management
Barriers can be defined as circumstances, situations or people that impede the
progress of knowledge management initiatives or activities (Sharma et al.,
2012). A number of barriers have been identified from existing literature; one of
such is the lack of senior management commitment. Senior management are
instrumental in the development of organisational structure, technological
infrastructure and various decisions making processes which are essential for
effective creation, sharing and use of knowledge.
Effective knowledge creation and sharing require long term commitment and
support from top management in recruitment and retention of right people
(Brand, 1998; Cheikhrouhou et al., 2013). According to Chong and Choi (2007),
lack of top management is the most critical barrier for a successful knowledge
management implementation, particularly in knowledge creation and sharing.
Senior management therefore have to conceptualise a vision about what type of

CHAPTER 2: LITERATURE REVIEW ON KNOWLEDGE MANAGEMENT
71
knowledge should be developed and integrated into a management system for
implementation (Nonaka and Takeuchi, 1995; Nonaka et al, 2000; Nonaka and
Toyama, 2005).
The role of technology cannot be overlooked in knowledge management. The
lack of technological infrastructure therefore is a key barrier in implementation
of knowledge management. Technological infrastructure provides a stronger
platform to knowledge management and enhances its impact in an organisation,
by helping and leveraging its knowledge systematically and actively (Singh and
Kant, 2007; Jayaram and Pathak, 2013). The wide varieties of technology such
as business intelligence, knowledge base, collaboration, portals, customer
management systems, and data mining support knowledge management
activities and the selection of appropriate technology improves the performance
of businesses (Singh et al., 2007; Dulipovici and Robey, 2013).
Apart from the lack of technology, it was found that the lack of methodology is a
barrier. Knowledge management is a group of clearly defined processes or
methods used to search important knowledge among different knowledge
management operations (Wiig, 1995). Even if there were senior management
commitment and technological support, knowledge management initiatives may
fail if there is a lack of a well-defined and structured approach to knowledge
management. Another barrier is the lack of organisational structure. According
to Ebert and Griffin (2005), organisational structure refers to the specification of
jobs to be done within an organisation and the ways in which those jobs relate
to one another. This includes the division of labour, departmentalisation and
distribution of power which is necessary to support the information and decision

CHAPTER 2: LITERATURE REVIEW ON KNOWLEDGE MANAGEMENT
72
process of the organisations. Creating an organisational structure is by no
means a guarantee for the success of knowledge management, but is an
important ingredient for its success (Davenport and Volpel, 2001). Adversarial
organisational culture towards knowledge management was identified as a
barrier (Chase, 1997; Pugnaa and Boldeanu, 2014). Organisational culture
relates to the core beliefs, value norms and social customs that govern the way
individuals act and behave in an organisation. It is the sum of shared
philosophies, assumptions, values, expectations, attitudes, and norms that bind
the organisations together (Lemken et al., 2000). Organisation culture entails
the aspects of trust and collaboration.
Trust is one of the aspects of the knowledge friendly cultures that fosters the
relationship between individuals and groups, thereby, facilitating a more
proactive and open knowledge sharing (Alawi 2007; Robertson et al., 2015).
Absence or minimal level of collaboration hinders the transfer of knowledge
between individuals and between groups. Organisational goals are sometimes
not achieved unless they integrate the concept of motivation and rewards to
employees. Lack of motivation and reward system can therefore be a barrier as
it discourages people to create, share, and use knowledge. Motivation can be
provided through recognition, visibility, and inclusion of knowledge performance
in appraisal systems and incentives (Hariharan 2002).
Employees are more likely to share their knowledge easily when motivated
(Bhirud 2005; Urbancová and Vnoučková, 2015). Without the establishment of
organisational reward and recognition systems, it may be difficult to align
knowledge management and business needs of the organisation (Witt, 1999;

CHAPTER 2: LITERATURE REVIEW ON KNOWLEDGE MANAGEMENT
73
Cai et al., 2013). There is the barrier of lack of ownership of problem where no
employee is ready to take up the jobs unless it has been properly assigned.
This situation makes it difficult to nurture knowledge management within the
organisation especially if employees perceive it as an extra task rather than part
of the organisational culture, knowledge management presents new ways of
decision-making and people have to share knowledge and know-how.
Knowledge being often associated with power, promoting knowledge sharing is
not an easy task particularly if employees do not see how they can directly
benefit from it. Lack of time is regarded as a barrier. Sharing knowledge
demands additional effort (Carrillo et al., 2000; Cai et al., 2013 ). This effort may
be minimised by work practices and the introduction of better knowledge
sharing tools. Construction projects for example are always working to tight
deadlines. Any activity that detracts from the main business is seen as of
diminished importance. The barriers to knowledge management are
summarised in Table 2.10.
Table 2. 10 Summary of barriers to knowledge management
Barriers to knowledge management
Lack of senior management commitment
Lack of technological infrastructure
Lack of methodology
Lack of organisational structure
Lack of organisational culture
Lack of motivation and rewards
Lack of ownership of problem
Lack of time

CHAPTER 2: LITERATURE REVIEW ON KNOWLEDGE MANAGEMENT
74
2.2.5.4 Benefits of knowledge management
According to Clark and Soliman (1999), many of the benefits of knowledge
management are intangible and difficult to quantify. Since traditional financial
measure such as return on asset (ROA) or return on equity (ROE) cannot
sufficiently evaluate the intangible aspects of organisational assets, such as
knowledge or knowledge workers. Notwithstanding, several benefits have been
identified. They include: improved service quality; rapid and effective enterprise-
wide problem-solving; improved decision making; increased revenue and
business growth; increased innovation; practice and process improvement;
higher levels of expertise and knowledge; increased customer satisfaction;
enhanced employee capability and organisation learning; increased employee
morale, creativity and ingenuity; employee stimulation and motivation; raised
company professional image; increased flexibility and adaptability (Beckman,
1997; Wiig, 1999; Liebowitz, 2000; Mousavizadeh et al., 2015).
The benefits of knowledge management are evident in various industry sectors.
In manufacturing, knowledge management has been empirically proven to help
the improvement of performance in terms of the quality, time, speed and
reliability while reducing production costs (Armstead, 1999). In the business
sector, the benefits of knowledge management can be measured as a key
capability which can generate sustainable competitive advantage (Skryme and
Amidon, 1997; Davenport et al., 1998; McCampbell et al., 1999; Soliman and
Spooner, 2000). Intellectual capital is one of the measures receiving attention
from academia and practice (Edvinsson, 1997). Benefits from KM projects
involve money saved or earned (O’Dell and Grayson, 1998; McCampbell et al,
1999). In the construction industry, the key benefits of knowledge management

CHAPTER 2: LITERATURE REVIEW ON KNOWLEDGE MANAGEMENT
75
to organisations include: innovation; improved performance; improved
construction project delivery; facilitated transfer of knowledge across a variety of
project interface; quick response to clients’ needs and other external factors;
improved support for teams of knowledge workers; retained tacit knowledge;
and increased value (Robinson et al., 2001; Al-Ghassani et al., 2004; Carrillo et
al., 2004; Egbu, 2004; Anumba et al., 2005; Todorović et al., 2015). The
benefits of knowledge management are summarised in Table 2.11.
Table 2. 11: Summary of the benefits of knowledge management
Benefits of knowledge management
Improved service quality
Increased revenue and business growth
Increased innovation
Improved performance
Increased customer satisfaction
Enhanced employee capability
Employee stimulation and motivation
Raised company professional image
Increased flexibility and adaptability
Reduced production costs
Sustained competitive advantage
Retained tacit knowledge

CHAPTER 2: LITERATURE REVIEW ON KNOWLEDGE MANAGEMENT
76
Table 2. 12: An overview of the strategic aspects considered for KM implementation
Drivers Enablers Barriers Benefits
Need to leverage knowledge
Need to improve business performance
Need to manage change and restructuring
Need to manage a distributed workforce
Need for staff development
Need for better enabling technologies
Need for innovation
Leadership
Knowledge activists
Organisational culture
Measurement and evaluation
Technology
Collaboration
Trust
Learning
Centralisation
Formalisation
T-shaped skills
Lack of senior management commitment
Lack of technological infrastructure
Lack of methodology
Lack of organisational structure
Lack of organisational culture
Lack of motivation and rewards
Lack of ownership of problem
Lack of time
Improved service quality
Increased revenue and business growth
Increased innovation
Improved performance
Increased customer satisfaction
Enhanced employee capability
Employee stimulation and motivation
Raised company professional image
Increased flexibility and adaptability
Reduced production costs
Sustained competitive advantage
Retained tacit knowledge
2.3 APPLICATION OF KNOWLEDGE MANAGEMENT IN
CONSTRUCTION
This section addresses the following areas of inquiry relevant to the application
of knowledge management e.g. How is knowledge applied in the construction
industry? What is the significance of knowledge management in the
construction supply chain? What are the knowledge types relevant to
construction management? How is knowledge harnessed and integrated in
construction management? What are the issues relating to knowledge
management in construction?
2.3.1 Overview of the UK construction industry
The UK construction industry’s significance is due not only to the fact that it
provides the buildings and infrastructure on which virtually every other sector
depends, but to the fact that it is such a sizeable sector in its own right.

CHAPTER 2: LITERATURE REVIEW ON KNOWLEDGE MANAGEMENT
77
Construction contributes £90 billion gross value added to the UK economy
(nearly 7% of the total), comprises over 280,000 businesses and accounts for 3
million jobs; this is equivalent to about 10% of total UK employment (HM
Government, 2013). Despite its enormous size, the construction industry is
overwhelmingly made up of small, local firms with fewer than 20 employees,
and a few larger firms employing thousands of people. For a regional project,
the subcontract size may be even smaller, with examples of projects where
70% of sub-contracts were below £10,000. Because of the very large number of
small firms, the industry is often characterised as unconcentrated. This is clear
evidence of the fragmentation of the industry and a real demonstration of the
challenge of building integrated supply chains with a close focus on the end
product and customer value.
Figure 2.8: A simplified representation of the construction supply chain
(Source: BIS 2013)
Architect
Raw materials M&E engineer
Structural engineer
Quantity surveyor
Subcontractor
Subcontractor
Subcontractor
Project manager
Finance
Main contractor
Component manufacturer
Component manufacturer
Component manufacturer Client/
End user
Information flow, orders, schedules etc. Material flow, supplies, production, deliveries etc.

CHAPTER 2: LITERATURE REVIEW ON KNOWLEDGE MANAGEMENT
78
There are limited numbers of general contractors who are capable of managing
very large projects, whereas there are large numbers of small subcontractors.
The large contractors however engage the small and medium size contractors
on large construction projects. According to EC Harris (2013), in a typical large
building project (i.e. £20 - £25 million range), the main contractor may be
directly managing around 70 sub-contracts of which a large proportion are small
organisations (£50,000 or less). Figure 2.8 shows a simplified representation of
the construction supply chain although in practice a construction project may
rely on tens of subcontractors and component manufacturers.
The construction industry is project-based engaging a variety of separate firms
in a temporary multidisciplinary organisation, to produce investment goods
which are custom built to unique specifications. During project conception, the
client establishes the need for a project and develops a set of requirements,
which are converted into an appropriate design. At the construction stage, the
design is transformed into a facility for the use of the client. Project phases can
be simplistically classified into design, construction and handover (See Figure
2.9)
Figure 2.9: Simplified model of construction process (Source: Kamara et al., 2002)
Output:
Design drawings etc.
1
Project Conception
4
Use of Facility
2
Design of Facility
3
Construction of Facility
Output:
Client requirements
Output:
Completed facility
Feedback
Client (demand for facility) Construction Industry (supply of facility) Client (use of facility)
Construction Process

CHAPTER 2: LITERATURE REVIEW ON KNOWLEDGE MANAGEMENT
79
2.3.2 Application of the SECI model to the construction supply
chain
A dominant KM concept is that of knowledge conversion in which new
knowledge is created through the interfaces between tacit and explicit
knowledge. While explicit knowledge is formal, systematic and can be easily
shared, tacit knowledge is personal, hard to formalise and can be difficult to
capture or communicate to others (Polanyi 1966, Nonaka and Takeuchi 1995,
Nonaka and Toyama 2005). Knowledge conversion is made up of four
interfaces known by the acronym ‘SECI’ model: Socialisation (i.e. the
conversion of tacit to tacit); Externalisation (tacit to explicit); Combination
(explicit to explicit); and Internalisation (explicit to tacit). The model is often
facilitated by KM tools.
According to Al-Ghassani (2002) KM tools refer to both non-IT tools and IT
tools. To distinguish between them, the terms ‘KM techniques’ and ‘KM
Technologies’ were used to represent ‘non-IT tools’ and ‘IT tools’ respectively.
KM techniques have more involvement of people and focus on tacit knowledge
for example brainstorming, communities of practice and face to face
interactions. KM technologies require IT infrastructure and have more focus on
explicit knowledge for example intranets and knowledge bases. The challenge
therefore is to identify and utilise the most effective tools (Oduoza and Harris,
2011; Chong et al., 2013; Fornasiero and Zangiacomi, 2013). The SECI model
and tools are applicable to the construction supply chain in facilitating
knowledge interactions across personal, organisational, project and industry
boundaries (Figure 2.10). They are also applicable to managing construction

CHAPTER 2: LITERATURE REVIEW ON KNOWLEDGE MANAGEMENT
80
Figure 2. 8: Application of the SECI model to the construction supply chain
Organisational level KM
- Socialisation (S) among personnel across organisations.
- Externalisation (E) between personnel and their organisation
- Combination across organisations
Personal level KM
- Socialisation (S) among personnel from same organisation
- Internalisation (I) between personnel and their organisation
Project level KM - Combination (C) between
organisations and the project knowledge base.
- Combination (C) between project knowledge bases.
Industry level KM
- Combination (C) between project knowledge bases and industry
knowledge base
Subcontractor Subcontractor
Project
knowledge
base
Industry
knowledge
base
Main
contractor
P
P P
Client/End-
user Project
manager
P
P P
P
P P
P
P P
P
P P
Personnel (P)

CHAPTER 3: LITERATURE REVIEW ON THE COST OF POOR QUALITY
81
challenges such as; the arguably unique characteristics of construction projects,
the complicated nature of operations, multitude of professions and
organisations, temporary team members, heavy reliance on experience, the
one-off nature of the projects, tight schedules and limited budgets (Zin and
Egbu, 2011; Tiwari, 2015). The underlying rationale is the need to strategically
manage employee-owned tacit knowledge within construction organisations
(Carrillo and Chinowsky 2006) and the need for knowledge integration across
organisational and project boundaries (Ruan et al. 2012; Garstenauer, 2014)
leading to measurable outcomes such as retained knowledge, improved
performance, reduced costs, client satisfaction and increased profitability
(Armbrecht et al. 2001; Chua 2004, Boyd and Chinyio 2006; Liebowitz, 2009)
thereby driving continuous improvement in the industry (Egan, 1998; Smyth,
2010; Shan et al., 2013).
2.3.3 Issues relating to knowledge management in construction
Knowledge management is invaluable to the construction industry as it is
deemed critical for construction organisations to harness and integrate
knowledge in order to improve efficiency and increase profitability. It is
particularly important due to the arguably unique characteristics of projects such
as the complicated nature of operations, multitude of occupations, professions
and organisations, temporary team members, heavy reliance on experience,
one-off nature of projects, tight schedules and limited budgets (Zin and Egbu,
2010). The nature in which the construction industry is organised means that,
efficiency in project delivery is less than expected, resulting in dissatisfied
clients and low profitability for construction organisations (Egbu et al., 1999;
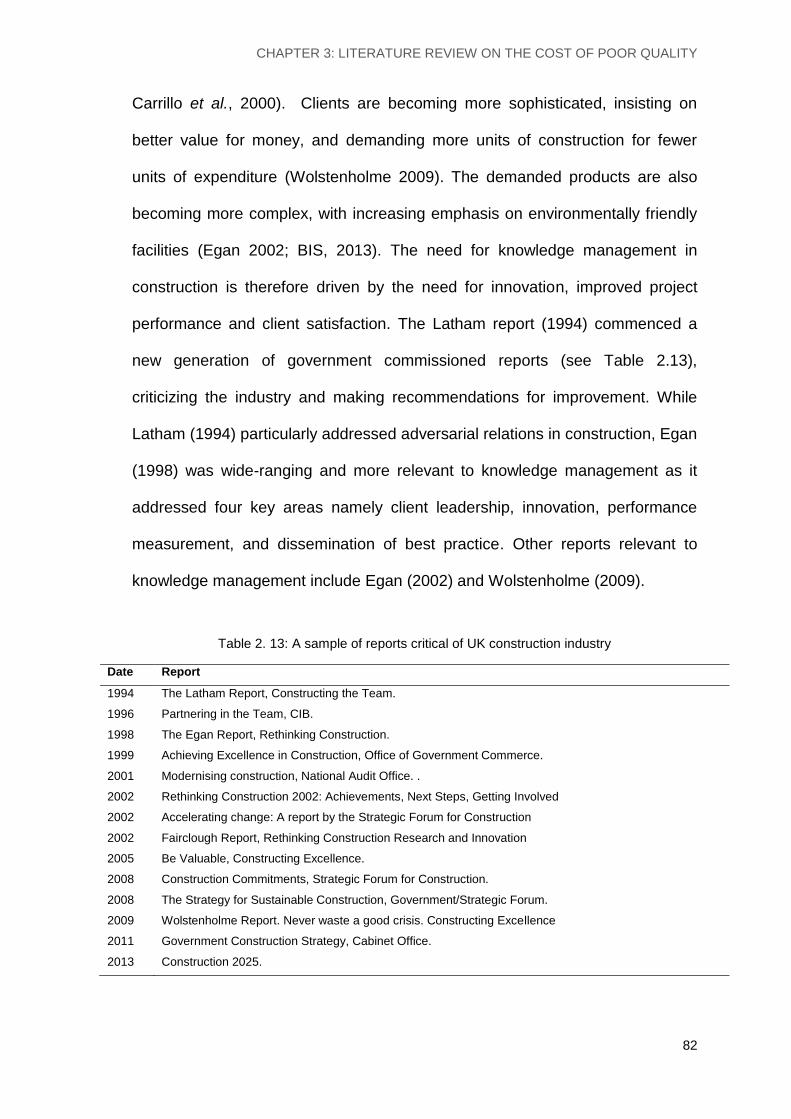
CHAPTER 3: LITERATURE REVIEW ON THE COST OF POOR QUALITY
82
Carrillo et al., 2000). Clients are becoming more sophisticated, insisting on
better value for money, and demanding more units of construction for fewer
units of expenditure (Wolstenholme 2009). The demanded products are also
becoming more complex, with increasing emphasis on environmentally friendly
facilities (Egan 2002; BIS, 2013). The need for knowledge management in
construction is therefore driven by the need for innovation, improved project
performance and client satisfaction. The Latham report (1994) commenced a
new generation of government commissioned reports (see Table 2.13),
criticizing the industry and making recommendations for improvement. While
Latham (1994) particularly addressed adversarial relations in construction, Egan
(1998) was wide-ranging and more relevant to knowledge management as it
addressed four key areas namely client leadership, innovation, performance
measurement, and dissemination of best practice. Other reports relevant to
knowledge management include Egan (2002) and Wolstenholme (2009).
Table 2. 13: A sample of reports critical of UK construction industry
Date Report
1994 The Latham Report, Constructing the Team.
1996 Partnering in the Team, CIB.
1998 The Egan Report, Rethinking Construction.
1999 Achieving Excellence in Construction, Office of Government Commerce.
2001 Modernising construction, National Audit Office. .
2002 Rethinking Construction 2002: Achievements, Next Steps, Getting Involved
2002 Accelerating change: A report by the Strategic Forum for Construction
2002 Fairclough Report, Rethinking Construction Research and Innovation
2005 Be Valuable, Constructing Excellence.
2008 Construction Commitments, Strategic Forum for Construction.
2008 The Strategy for Sustainable Construction, Government/Strategic Forum.
2009 Wolstenholme Report. Never waste a good crisis. Constructing Excellence
2011 Government Construction Strategy, Cabinet Office.
2013 Construction 2025.

CHAPTER 3: LITERATURE REVIEW ON THE COST OF POOR QUALITY
83
In addition to the industry reports, efforts have been made in academia to
develop strategies for knowledge management within construction
organisations and on projects. The issues addressed include knowledge
capture, knowledge sharing, new knowledge creation, techniques and
technologies (e.g. Al-Ghassani et al., 2004; Egbu, 2005; Suresh et al., 2008;
Carrillo et al., 2013; Ren et al., 2013; Garstenauer, 2014).
Organisations have also made efforts to implement knowledge management
strategies; a survey of leading construction organisations in the UK showed that
about 42% have a knowledge management strategy, and 32% plan to have a
strategy within a short term (Carrillo et al, 2004). Over 90% of larger
organisations have or intend to have a strategy compared to half of the smaller
organisations. A study by Robinson et al, (2001) found that for construction
organisations, the most important reasons for commencing knowledge
management were: dissemination of best practices to key sets of employees,
retention of the tacit knowledge of key employees, continuous improvement, the
need for quick customer response and the need to share knowledge.
There is an increasing awareness of the need to strategically manage
employee-owned tacit knowledge within construction organisations in UK
(Carrillo and Chinowsky, 2006) and the need for knowledge integration across
personal, organisational and project boundaries (Ruan et al. 2012). This
suggests that knowledge management is becoming increasingly important in
construction. Knowledge management also appears to be even more important
to larger organisations as it is difficult to determine 'who knows what' in such
organisations. Larger organisations are also more likely to have a leader or a

CHAPTER 3: LITERATURE REVIEW ON THE COST OF POOR QUALITY
84
knowledge management champion and to have the resources to support the
strategy.
Despite the knowledge management efforts, the construction industry remains
criticised for being poor at learning, often ‘reinventing the wheel’, repeating
mistakes and wasting resources (Robertson, 2002; Flar, 2002; Grimaldi and
Rippa, 2011). Specialist and technical knowledge is often lost from one project
to the next stifling an organisation’s ability to retain and re-use knowledge (Egbu
and Botterill, 2000; Akdere, 2009). The project-based, fragmented and unstable
nature of the industry has led to significant knowledge loss compared with other
industries (Graham and Thomas 2008; Jayaram and Pathak, 2013). The need
to attract, retain and develop more of the right people to improve industry
capability has also been recognised (Wolstenholme 2009). A summary of the
issues relating to knowledge management in construction are summarised in
Table 2.14 below.
Table 2. 14: Issues relating to knowledge management in construction
Issues relating to knowledge management in construction
The construction industry is project-based thereby posing the challenge of knowledge capture, retention and re-use
The industry is fragmented thereby brings about the challenge of knowledge integration across organisations
The industry is criticised for being poor at learning, ‘reinventing the wheel’, repeating mistakes and wasting resources
Multiple organisations are typically involved in a single project creating the challenge of integration and collaborative working with a focus on the end product and customer value
Clients are often dissatisfied with project performance, project process and product quality
Low profitability of organisations as a result of knowledge management related inefficiencies
Larger organisations are more likely to formally practice knowledge management than the majority of small organisations

CHAPTER 3: LITERATURE REVIEW ON THE COST OF POOR QUALITY
85
2.4 SUMMARY OF CHAPTER 2
This chapter examined the existing body of work on knowledge management. It
critically reviewed past and current literature on the conceptualisations of
knowledge and knowledge management. It was found that knowledge
management relates not so much on the justification knowledge but on
understanding the uses of knowledge in order to effectively deal with tasks that
involve knowledge-based activity. This shaped the direction of the study into
focusing on the contemporary definitions, concepts and applications of
knowledge management. Knowledge types, sub-types and characteristics were
identified. Despite the existence of a plethora of definitions of knowledge
management which are daunting and confusing, four commonalities were
found: (1) Harnessing and integrating knowledge (2) Adopting a knowledge
management process (3) Utilising knowledge management tools, and (4)
Aligning knowledge management with organisational strategy. The drivers,
enablers, barriers and benefits of knowledge management were identified. The
chapter also discussed the application of knowledge management in
construction, and presented a model for applying SECI to the construction
supply chain. Finally, the issues relating to knowledge management in
construction were identified.

CHAPTER 3: LITERATURE REVIEW ON THE COST OF POOR QUALITY
86
CHAPTER 3
A REVIEW OF LITERATURE ON THE COST OF POOR QUALITY
This chapter examines the existing body of work on quality management with a
specific focus on the cost of poor quality on construction projects. It discusses
the conceptualisations of quality including key definitions and applications. The
chapter reviews and presents findings from three case studies obtained from a
secondary source which deal with construction stakeholders’ influence on the
definition of quality on construction projects. It explores the causes of poor
quality and examines the resultant costs associated with poor quality on
construction projects. It quantifies the cost of poor quality based on the work of
previous authors. The chapter explores quality management initiatives and tool
used by organisations in reducing costs of poor quality. It finally discusses the
issues relating to COPQ in construction project management.
3.1 CONCEPTUALISATIONS OF QUALITY
Quality management can reap benefits such as increased productivity, reduced
waste, increased profit, increased customer satisfaction and retention (ISO
9000: 2005) yet defining the term ‘quality’ itself can be challenging since it is
often referred to as perceptual, conditional and a subjective attribute that may
be conceptualised in different ways. It is therefore fundamental to examine the
conceptualisations of quality before proceeding to the causes and the cost of
poor quality on construction projects.’

CHAPTER 3: LITERATURE REVIEW ON THE COST OF POOR QUALITY
87
3.1.1 Definition of quality
There exists a plethora of definitions of quality most of which originate from
backgrounds such as manufacturing, operations management and business
(Pryzdek and Keller, 2009; Nasim et al., 2014). These definitions date as far
back as the 1950s when the quality movement arguably started in Japan and
became popular in the United States in the 80s and 90s (Ebrahimi and Sadeghi,
2013; Johnstone, 2015). It is therefore important to review the historical trends
in the definition of quality by renowned industry practitioners and academics.
Quality has been defined in various terms such as user-perception,
conformance to requirements, zero defects, customer satisfaction, cost
reduction and increased profit. Pirsig (1974) like many other philosophers
suggested that quality cannot be accurately defined but is a subjective
phenomenon that is the emergent emotion resulting from the combination of
perception and expectation. The feeling of high quality occurs when perception
exceeds expectation; the feeling of low quality occurs when perception does not
meet expectation. In this regard, quality in a product or service is not what the
supplier puts in but what the customer gets out and is willing to pay for.
A product is therefore not quality because it is hard to make and costs a lot of
money, customers pay only for what is of use to them and gives them value
(Drucker, 1985; 1999). Crosby (1979; 1996) defined quality as conformance to
requirements, zero defects and ‘right the first time’. This means there is no
allowable number of errors built into a product or process. Taguchi (1993; 2005)
statistically aimed at uniformity around a target value by lowering the standard
deviation in product outcomes, and to keep the range of outcomes to a certain

CHAPTER 3: LITERATURE REVIEW ON THE COST OF POOR QUALITY
88
number of standard deviations, with rare exceptions. The Six Sigma approach
expects six standard deviations, that is, 99.99966% of the products
manufactured should be free from defects (Feigenbaum and Feigenbaum,
2009; García-Bernal and García-Casarejos, 2014). A defect is defined as any
process output that does not meet customer specifications, or that could lead to
creating an output that does not meet customer specifications. Pyzdek (2003)
further described the tools applied within a simple performance improvement
model known as Define-Measure-Analyse-Improve-Control or DMAIC. The
acronym stands for: Define the goals of the improvement activity; Measure the
existing system; Analyse the system to identify ways to eliminate the gap
between the current performance of the system or process and the desired
goal; Improve the system; Control the new system. DMAIC is followed by
design for Six Sigma (DFSS) principles and practices. DFSS methodology
focuses on the Define-Analyse-Design-Verify DMADV approach which builds on
the understanding of DMAIC.
The definition of quality is not restricted to conformance to requirements and
zero defects; Kano et al. (1984) for instance defined quality in terms of
customer satisfaction by distinguishing between three types of product
requirements which influence customer satisfaction in different ways when met.
They are the ‘must-be requirements’, ‘one-dimensional requirements’, and
‘attractive requirements’. The must-be requirements are basic criteria of a
product. Fulfilling the must-be requirements will only lead to a state of ‘not
dissatisfied’. The customer regards the must-be requirements as prerequisites,
takes them for granted and therefore does not explicitly demand them. Must-be
requirements are in any case a decisive competitive factor, and if they are not

CHAPTER 3: LITERATURE REVIEW ON THE COST OF POOR QUALITY
89
fulfilled, the customer will not be interested in the product at all. One-
dimensional requirements are usually explicitly demanded by the customer.
Customer satisfaction therefore is proportional to the level of fulfillment. This
means that the higher the level of fulfillment, the higher the customer’s
satisfaction. Attractive requirements are attributes that provide satisfaction when
achieved fully, but do not cause dissatisfaction when not fulfilled
Feigenbaum (1986) integrated economics into customer satisfaction by defining
quality as ‘best for the customer use and selling price’ and quality control as ‘an
effective method for coordinating the quality maintenance and quality
improvement efforts of the various groups in an organisation so as to enable
production at the most economical levels which allow for full customer
satisfaction’. Costs go down and productivity goes up as improvement of quality
is accomplished by better management of design, engineering, testing and by
improvement of processes (Deming, 1982; Feigenbaum and Feigenbaum,
2009). Juran and Godfrey (1999) summarised the cost implications of quality
(see Table 3.1) in two ways:
1. Higher quality provides greater customer satisfaction thereby increasing
income. This implies that providing more and better quality features requires an
investment and hence usually involves increase in costs. Higher quality in this
sense usually costs more.
2. Quality means freedom from deficiencies and errors that require doing work
over again (rework) or that result in field failures and ultimately customer
dissatisfaction. This implies that if there are no errors, then the cost of poor
quality will be eliminated. In essence, improved quality can mean reduced cost.

CHAPTER 3: LITERATURE REVIEW ON THE COST OF POOR QUALITY
90
Having examined the different perceptions of quality it can be summarised that
quality is about meeting and satisfying needs, usually the needs of the paying
customer.
Table 3. 1: Cost implications of quality (Juran and Godfrey, 1999; De Feo and Juran 2010)
Product features that meet customer needs Freedom from deficiencies
Higher quality enables organisations to:
Increase customer satisfaction
Makes products salable
Meet competition
Increase market share
Provide sales income
Secure premium prices
Higher quality enables organisations to:
Reduce error rates
Reduce rework, waste
Reduce field failures, warranty charges
Reduce customer dissatisfaction
Reduce inspection, test
Shorten time to put new products on the market
Increase yields, capacity
Improve delivery performance
The major effect is on sales Major effect is on costs
Usually higher quality costs more Usually higher quality costs less
This is validated by the American Society for Quality (ASQ) which defined
quality as the characteristics of a product or service that bear on its ability to
satisfy stated or implied needs and a product or service free of deficiencies. ISO
9000 (2005) puts this as the totality of characteristics of an entity that bear on its
ability to satisfy stated and implied needs. In order to meet these needs,
organisations adopt a range of management approaches such as the Total
Quality Management (TQM). TQM functions on the premise that the quality of
the products and processes is the responsibility of everyone who is involved
with the creation or consumption of the products or services offered by the
organisation. TQM ensures the involvement of all workforce including
management, suppliers and customers in order to meet customer expectations
(Kemp, 2005; Jafari and Rodchua, 2014; Johnstone, 2015). The European
CHAPTER 3: LITERATURE REVIEW ON THE COST OF POOR QUALITY
91
Foundation for Quality Management’s EFQM Excellent Model (2010) further
stipulates that ‘excellent organisations know that customers are their primary
reason for being and strive to innovate and create value for them by
understanding and anticipating their needs and expectations’.
Having examined the concepts and definitions of quality the observations are
summarised in a matrix shown in Table 3.2. Several attributes of quality
emerged from different authors some of which overlap, are similar or repeated.
While one author discussed ‘appearance’, another discussed ‘aesthetics’, in the
same manner, ‘serviceability’ share similarities with ‘maintainability’.
Nevertheless, 15 distinct attributes emerged from 21 definitions. There are
causal relationships among the attributes, for example ‘conformance to
requirements’ can lead to ‘customer satisfaction’, in a similar way, ‘functional
efficiency’ can lead to ‘cost reduction’. The most recurring attributes (Table 3.2)
are customer satisfaction, conformance to requirements, and freedom from
deficiencies. The least recurring attributes are durability, performance and
reliability. This implies that most definitions of quality point towards keeping the
customer satisfied through the provision of superior products and services
conforming to requirements and free from deficiencies.
3.1.2 Defining quality in the construction project context
According to Lal (2008), since quality is a measure of the customer satisfaction
provided by a product, it should include the following characteristics: functional
efficiency, appearance, ease of installation and operation, safety, reliability,
maintainability, running and maintenance cost. The above mentioned quality
features do not just occur in the product.

CHAPTER 3: LITERATURE REVIEW ON THE COST OF POOR QUALITY
92
Table 3. 2: Attributes of quality
Literature Attributes of Quality
Pirsig
(197
4)
Cro
sby (
1979)
Dem
ing (
1982)
Kan
o e
t al. (
198
4)
Dru
cker
(1985)
Feig
enb
aum
(198
6)
TQ
M
AS
Q (
Glo
ssary
)
Six
Sig
ma (
1986)
Taguchi (1
99
3)
Ow
lia &
Aspin
wa
ll (1
99
6)
Beckfo
rd (
19
98)
Jura
n &
Godfr
ey (
19
99)
Malo
ney (
2002)
Yasam
is e
t al. (
200
2)
Pyzdek (
200
3)
BS
EN
IS
O 9
000
:20
05
Sub
ir (
20
05)
Rose, K
. H
. (2
005)
Delg
ado-H
ern
andez &
Aspin
wa
ll (2
008)
EF
QM
(20
10)
Tota
l
1 Aesthetics 1
2 Capability 2
3 Competence 4
4 Conformance to requirements 11
5 Cost reduction 3
6 Customer satisfaction 14
7 Durability 1
8 Fit for purpose 2
9 Freedom from deficiencies 8
10 Functional efficiency 1
11 Increased profit 2
12 Perceived Quality 2
13 Performance 1
14 Reliability 1
15 Serviceability 2

CHAPTER 3: LITERATURE REVIEW ON THE COST OF POOR QUALITY
93
They have to be specially incorporated in the design and a conscious effort is
required during manufacture, to achieve them in the actual product. This brings
about two facets of quality namely ‘quality of design’ and ‘quality of
conformance’. Quality is initially created by the designer in the form if product
specifications and manufacturing instructions. The extent to which design is
inherently capable of providing user satisfaction can be termed as quality of
design, on the other hand, quality of conformance relates to the fidelity with
which the product conforms to the design.
As with cost control, the most important decisions regarding the quality of a
completed facility are made during the design and planning stages rather than
during construction. It is during these preliminary stages that component
configurations, material specifications and functional performance are decided.
Quality control during construction consists largely of ensuring conformance to
these original designs and planning decisions. (Delgado-Hernandez and
Aspinwall, 2008; García-Bernal and García-Casarejos, 2014).
Owlia and Aspinwall (1996) presented a classification of quality as; corporate
quality, product quality and service quality. Corporate quality refers to the image
that customers have of an organisation. Furthermore, quality-conscious
companies normally have a strong quality culture, which is helpful for achieving
customer satisfaction. The foundations of corporate quality are, therefore,
defined at organisational rather than project level. With product quality, the final
output of the construction process consists of products and services, customer
satisfaction therefore at this level will result from both elements. Service quality
is mainly associated with the users and the level of service they receive after

CHAPTER 3: LITERATURE REVIEW ON THE COST OF POOR QUALITY
94
the delivery of the product. Parasuraman (1985) suggested ten dimensions for
service quality, which according to Maloney (2002), could be adopted in the
construction industry. These are performance, features, reliability, conformance,
durability, serviceability, aesthetics, and perceived quality.
Construction organisations adopt various methods in assessing quality, one of
such is the Design Quality Indicator (DQI) toolkit which interprets quality in
buildings in terms of functionality, build quality and impact. Functionality deals
with the arrangement, quality and interrelationship of spaces and how the
building is designed to be useful to all. Build quality relates to the engineering
performance of the building, which includes structural stability and the
integration, safety and robustness of the systems, finishes and fittings. Impact
refers to a building’s ability to create a sense of place and have a positive effect
on the local community and environment.
3.1.2.1 ‘Customer-centric’ vs ‘Stakeholder-centric’ definitions of quality
During the different stages of a construction project i.e. from initiation to
handover, a vast number of interests are affected, both positively and negatively
(Olander, 2007; Yongjian et al., 2015). Representatives of these interests are
referred to as the project’s stakeholders. These are individuals and
organisations that are actively involved in the project or whose interests may be
affected as a result of project execution or project completion (Freeman, 1984;
PMI, 2004; Sunindijo, 2015). McElroy and Mills (2000) narrowed the definition
into persons or group of people who have a vested interest in the success of a
project and the environment within which the project operates. The term ‘vested
interest’ can here be viewed as equal to the key term ‘stake’ which is the actual

CHAPTER 3: LITERATURE REVIEW ON THE COST OF POOR QUALITY
95
or perceived benefits, risks or harms from organisational activities (Donaldson
and Preston, 1995; Post et al., 2002; Azam et al., 2015). Stakeholders include
clients, project managers, designers, subcontractors, suppliers, funding bodies,
users and the community at large (Newcombe, 2003). These can be
categorised as people ‘inside’ the project, e.g. designers and contractors; and
people ‘outside’ the project, e.g. users and the community (Johnson and
Scholes, 1993). The two categories can also be referred to as internal
stakeholders e.g. those actively involved in project execution; and external
stakeholders e.g. those affected by the project.
Furthermore, Mitchell et al. (1997) categorised stakeholders as dormant,
discretionary, demanding, dominant, dangerous, dependent and definitive.
Dormant stakeholders possess power to impose their will, but do not have any
legitimate relationship or urgent claim. Their power remains unused.
Discretionary stakeholders possess the attribute of legitimacy, but they have no
power or urgent claim. There is no absolute pressure for managers to engage in
an active relationship, although they may choose to do so. Demanding
stakeholders possess an urgent claim, but have no power or legitimate
relationship. This is bothersome, but does not warrant more than passing
management attention.
Dominant stakeholders are both powerful and legitimate. It seems clear that the
expectations of any stakeholders perceived by managers to have power and
legitimacy will matter. Dangerous stakeholders lack legitimacy, but possess
power and urgency. They will be coercive and possibly violent, making the
stakeholder ‘dangerous’. Dependent stakeholders have urgent and legitimate

CHAPTER 3: LITERATURE REVIEW ON THE COST OF POOR QUALITY
96
claims, but possess no power. These stakeholders depend upon others for the
power necessary to carry out their will. Definitive stakeholders are those that
possess both power and legitimacy. They are usually members of an
organisation’s dominant coalition. When such a stakeholder’s claim is urgent,
managers have a clear and immediate mandate to attend to and give priority to
that claim.
Contrary to the definitions of quality as customer satisfaction (e.g. Kano, 1984;
Ek and Çıkış, 2015), it appears that in the construction project context
stakeholders have influence on how quality is defined. The former can be
referred to as ‘customer-centric‘, and the latter ‘stakeholder-centric’. This study
therefore further investigated stakeholder influence on customer decisions on
project process and product quality. This was achieved through three case
studies.
3.1.2.2 A review of three case studies on stakeholder influence on quality
A selection of three case studies was obtained from the Commission for
Architecture and the Built Environment (CABE) as a source of secondary data
to investigate stakeholder influence on quality. CABE was the government’s
advisor on architecture, urban design and public space in England. Its function
was to influence and inspire the people making decisions about the built
environment. It championed well-designed buildings, spaces and places, ran
public campaigns and provided expert, practical advice. The three case studies
were particularly selected due to their relevance to the investigation namely:
(1) Chelsea Barracks re-development, London – a proposed re-development
of former army barracks in south-west London into mixed housing

CHAPTER 3: LITERATURE REVIEW ON THE COST OF POOR QUALITY
97
development comprising of luxury flats and affordable flats. This
represents a case whereby stakeholders were able to change customer’s
end product quality even before the commencement of the project.
(2) Cheonggyecheon Restoration Project, Seoul, South Korea –
Cheonggyecheon is a 5.8 km creek that was covered with concrete
roads and an elevated highway during the post-Korean war economic
development. In 2003, a project was initiated to remove the elevated
highway and restore the stream to create a public recreation space. This
represents a case whereby stakeholders were able to modify the quality
of the end product after product commissioning.
(3) Frederick Bremer School in Waltham Forest – School was built as part of
the Building Schools for the Future programme (BSF). School was
developed to join together two Walthamstow schools, Aveling Park and
Warwick Boys. The school was built as part of a redevelopment of the
former Hawker Siddley factory site that included the provision of 256
residential units. This represents a case whereby the stakeholders were
included right from the concept stage of the project. Stakeholders were
involved in the definition of quality. No further changes were made after
project completion. The details of the three cases are summarised in
Table 3.3.
3.1.2.3 Findings from the case studies
The Chelsea barracks re-development project was ultimately halted and
reviewed because of the influence of a coalition of stakeholders including the
residents association and the Prince’s Foundation. Mitchell et al. (1997) refers
to them as definitive stakeholders who possess both power and legitimacy.

CHAPTER 3: LITERATURE REVIEW ON THE COST OF POOR QUALITY
98
Table 3. 3: Case studies on stakeholder involvement and influence in construction quality
Project Title/Year
Description Stakeholders Initial Plan Stakeholder issues/ influence
Outcome/New Plan
Attributes of quality influenced by stakeholder action
1. Chelsea Barracks re-development. London/2007-date
Proposed re-development of former army barracks in south-west London into mixed housing development comprising of luxury flats and affordable flats.
Local residents (Belgravia Residents Association), Local authority (Westminster City Council), Commission for Architecture and the Built Environment (CABE), The Prince’s Foundation, Greater London Authority, English Heritage
Buildings from 5 to 13 storeys for 638 homes, leisure uses and public space on south-west London site
Local residents complained that: the proposed steel and glass mini skyscrapers did not fit in with the characteristics of the local area; there would be overcrowding with the influx of over 2000 new residents; large public space would be lost
Project was halted and reviewed: 3 apartment blocks were revised from 9 storeys to 4 storeys to match existing adjacent terrace; tallest building on site was reduced from 13 storeys to 8 storey; the affordable housing units were cut by 13% from 638 to 552; central public space was increased from 0.8 hectares to 2.5 hectares; the scheme has been pushed back further 1.2 metres from the main road; new designers were drafted to re-design the public spaces to reflect and commemorate the site’s army history.
Aesthetics, Conformance to requirements, Fit for purpose, Functional efficiency, Perceived quality.
2. Cheonggyecheon Restoration Project, Seoul, South Korea/2005 completed
Cheonggyecheon is a 5.8 km creek that was covered with concrete roads and an elevated highway during the post-Korean war economic development. In 2003, a project was initiated to remove the elevated highway and restore the stream to create a public recreation space
Seoul Mayor, Seoul Metropolitan Government, Citizen's Committee, Union of merchants, Research Corps, General public including school children and older people.
The £550 million urban renewal project is on the site of the stream. Creation of ecologically friendly metropolis, public facilities, such as the Dongdaemun plaza and various seating schemes, and a museum, situated on the embankment
There was limited consideration of certain user groups, for example older people, people with visual impairments and people with mobility problems. In September 2005, a group led a protest march demanding the right to access the new pathways alongside the stream
Lifts were later provided at seven locations, together with free wheelchairs for users with mobility problems. The failure to integrate these needs from the start meant that these final design interventions were bolt-on solutions. E.g. irregular surfaces are uncomfortable for people using wheelchair and poorly-lit, congested tunnels are difficult for people with visual impairments and may be threatening to certain groups.
Capability Conformance to requirements Fit for purpose Functional efficiency
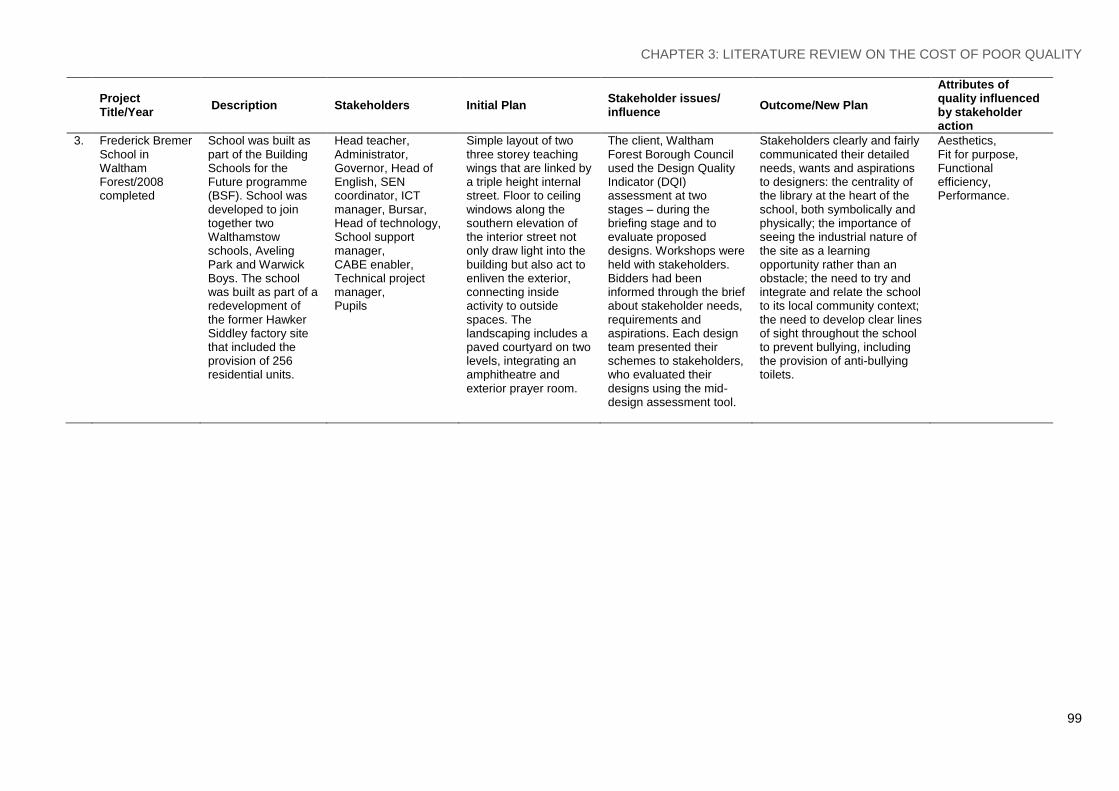
CHAPTER 3: LITERATURE REVIEW ON THE COST OF POOR QUALITY
99
Project Title/Year
Description Stakeholders Initial Plan Stakeholder issues/ influence
Outcome/New Plan
Attributes of quality influenced by stakeholder action
3. Frederick Bremer School in Waltham Forest/2008 completed
School was built as part of the Building Schools for the Future programme (BSF). School was developed to join together two Walthamstow schools, Aveling Park and Warwick Boys. The school was built as part of a redevelopment of the former Hawker Siddley factory site that included the provision of 256 residential units.
Head teacher, Administrator, Governor, Head of English, SEN coordinator, ICT manager, Bursar, Head of technology, School support manager, CABE enabler, Technical project manager, Pupils
Simple layout of two three storey teaching wings that are linked by a triple height internal street. Floor to ceiling windows along the southern elevation of the interior street not only draw light into the building but also act to enliven the exterior, connecting inside activity to outside spaces. The landscaping includes a paved courtyard on two levels, integrating an amphitheatre and exterior prayer room.
The client, Waltham Forest Borough Council used the Design Quality Indicator (DQI) assessment at two stages – during the briefing stage and to evaluate proposed designs. Workshops were held with stakeholders. Bidders had been informed through the brief about stakeholder needs, requirements and aspirations. Each design team presented their schemes to stakeholders, who evaluated their designs using the mid-design assessment tool.
Stakeholders clearly and fairly communicated their detailed needs, wants and aspirations to designers: the centrality of the library at the heart of the school, both symbolically and physically; the importance of seeing the industrial nature of the site as a learning opportunity rather than an obstacle; the need to try and integrate and relate the school to its local community context; the need to develop clear lines of sight throughout the school to prevent bullying, including the provision of anti-bullying toilets.
Aesthetics, Fit for purpose, Functional efficiency, Performance.

CHAPTER 3: LITERATURE REVIEW ON THE COST OF POOR QUALITY
100
When such stakeholder’s claim is urgent, managers have a clear and
immediate mandate to attend to and give priority to that claim as was done in
this case. The stakeholders, against the customer’s specifications scaled down
the scope and quality, and also offset the scheme further away from the road.
The Cheonggyecheon Project lacked public consultation. There was limited
consideration of certain user groups, for example older people, people with
visual impairments and people with mobility problems so their views and needs
were not raised. For the scope of the project to be truly public and genuinely
designed for everybody was undermined by lack of inclusive planning. This
degenerated into a public protest march demanding the right to access the new
pathways alongside the stream. As a result they were able to modify and even
improve the quality of the scheme through the provision of lifts and wheelchairs.
In the Frederick Bremer School case, stakeholders were included from initiation
of the project and were given the opportunity to clearly and fairly communicate
their detailed needs, wants and aspirations to designers. The inclusion of
stakeholders in quality definition was instrumental to the project success.
3.1.2.4 Operational definition for quality
It has been established that construction projects need to engage stakeholders
in a dialogue of value delivery to understand what they need from their products
and services. This is evident in the Frederick Bremer School case study in
which the project success was dependent on the inclusion of all stakeholders.
The concept of the customer (or client) as a single entity therefore does not
reflect the reality of stakeholder configurations for projects in which case the
client is only one stakeholder out of many. This is evident in all the three case

CHAPTER 3: LITERATURE REVIEW ON THE COST OF POOR QUALITY
101
studies examined as they revealed the reality of stakeholder power in
influencing quality. Quality therefore should not be defined only in terms of
customer satisfaction but should be defined in a broader sense to include
stakeholders. Moreover since the definition of quality is subjective, an
operational definition is put forward for the purpose of this study which is stated
as follows:
“Quality in construction is based on an agreed set of criteria defined by internal
and external project stakeholders”.
The criteria may include conformance to requirements, zero defects, efficient
processes, client satisfaction, cost reduction and increased profit (Crosby, 1979;
Crosby, 1996; Kano et al., 1984; Taguchi, 1993; ISO 9000: 2005; Gašparík and
Gašparíková, 2013; Ek and Çıkış, 2015). Deviation from the set criteria
therefore would tend towards poor quality. Poor quality on the contrary can be
defined as non-conformance, unfit for purpose, defective, which in turn can
result in increased costs, reduced profits, and stakeholder dissatisfaction. This
leads to the next question: what are the causes of poor quality?
3.2 CAUSES OF POOR QUALITY IN CONSTRUCTION
There are several causes of poor quality in construction which have been
identified and presented by various authors. Griffith (1990) attributed the causes
of poor quality to design issues such as: inaccurate or inadequate detailing;
incorrectly specified or inappropriate materials and components; inadequate
knowledge or disregard for legislation or guidelines; inadequate coordination
between client and designers; poor interaction between client, designers and

CHAPTER 3: LITERATURE REVIEW ON THE COST OF POOR QUALITY
102
contractors; inadequate supervision by designers; lack of design empathy for
construction. Hammarlund and Josephson (1991) researched the causes of
poor quality beyond design issues and identified them as: poor skills; defective
workmanship; effects in products; insufficient work separation; inadequate
construction planning; disturbances in personnel planning, delays; alterations;
failures in setting-out; coordination failure. Burati et al. (1992) classified the
causes of poor quality at both design and construction stages as: changes (e.g.
design revisions, construction methods); errors (erroneous design or
construction procedures) and omissions (e.g. omissions of certain steps in
design or construction activities
Chung (1999) further elaborated that poor quality can be as a result of: cases
defects are found to be the result of: misinterpretation of drawings and
specifications; the use of superceded drawings and specifications; poor
communication with the architect, engineer, subcontractors and material
suppliers; poor coordination of subcontracted work; ambiguous instructions;
unqualified operators and workers; inadequate supervision and verification on
site. Love et al. (1999) summarised the causes of poor quality as: poor detailing
and workmanship; omissions of brief details; lack of attention to quality by
consultants; design errors; lack of integration of services to architectural
drawings; design changes; poor quality documentation; verbal or
undocumented instructions by architect and engineers to contractor; poor skills
resulting in defective workmanship; poor motivation levels of workforce.
Similarly, Hwang et al. (2009) identified changes, errors and omissions as the
main sources of poor quality. Love et al. (2004, 2010), and Jafari and Love
(2013) also found that poor quality results from design changes, errors, and

CHAPTER 3: LITERATURE REVIEW ON THE COST OF POOR QUALITY
103
omissions that often stem from scope uncertainty and the contracting strategy
adopted. The causes of poor quality are shown in Figure 3.1.
Figure 3. 1: Causes of poor quality on construction projects
The causes of poor quality are in-exhaustive as different projects pose
numerous and sometimes unique quality issues. A classification of the causes
can however be drawn by examining patterns, similarities and differences
identified from the causes presented in previous studies. These are
summarised in Table 3.4
3.3 THE COST OF POOR QUALITY
The cost of poor quality (COPQ) situates within the cost of quality (COQ)
concept of quality management. COQ has been defined by the American
Society for Quality Control (ASQC, 1971) and Total Quality Management 177
BS6143 Part 2 (1990) as the costs incurred in ensuring quality, together with
the loss incurred when quality is not achieved. Juran, (1951, 1989) defined it as
the sum of those costs that would vanish if there were no quality problems.
While Juran (1951) established the COQ economic framework, Feigenbaum
(1956) and Masser (1957) classified it in today’s familiar categories of
Prevention, Appraisal and Failure (PAF) costs. Prevention costs include the
sum of all amounts spent or invested to prevent or at least significantly reduce
Errors and omissions Design changes Poor skills
Causes of poor quality

CHAPTER 3: LITERATURE REVIEW ON THE COST OF POOR QUALITY
104
errors or defects, in essence to finance activities aimed at eliminating the
causes of possible defects and errors before they occur.
Table 3. 4: Causes of poor quality in construction (Sources: Griffith 1990; Hammarlund and Josephson, 1991; Burati et al. 1992; Chung, 1999;
Hwang et al., 2009; Love et al., 2004, 2010; Jafari and Love, 2013)
Causes of poor quality
Design stage (examples) Construction stage (examples)
Design Changes Change made at request of the contractor
Change made by the client/clients representative to the design
Design revisions, modifications and improvements initiated by the architect, client/endusers, consultants, contractor/subcontractor
Result caused by the client changing the project definition, scope or requirements
External stakeholder changes
A change in the method of construction in order to improve constructability
Changes in construction methods due to site conditions
Change made by the client/clients representative after some work has been performed on site
Contractor request to improve quality
Inadequate information during design stage e.g. site conditions.
Use of superceded drawings and specifications
Project definition, scope or requirements changed by client
External stakeholder changes
Errors and Omissions
Incorrectly specified materials
Defects in products
Erroneous construction methods procedures
Omissions of certain construction activities
Errors in transportation of wrong or defected materials
Poor Skills Inadequate knowledge/disregard for legislation or guidelines.
Inadequate coordination between client and designers
Poor interaction between client, designers and contractors
Inadequate supervision by designers
Lack of design empathy for construction
Failures in setting-out
Coordination failure
Poor quality documentation
Defective workmanship
Insufficient work separation
Inadequate construction planning
Disturbances in personnel planning
Misinterpretation of drawings and specifications
Poor communication with the architect, engineer, subcontractors and material suppliers
Poor coordination of subcontracted work
Ambiguous instructions or unqualified operators / workers
Inadequate supervision and verification on site.
Poor detailing and workmanship
Poor quality documentation
Verbal/undocumented instructions by architect and engineers to contractor
Poor skills resulting in defective workmanship
Poor motivation levels of workforce

CHAPTER 3: LITERATURE REVIEW ON THE COST OF POOR QUALITY
105
Appraisal costs include all amounts spent on the detection of errors or defects
by measuring the conformity of different items to the required level or
specifications of quality. Items include issued architectural and structural
drawings, work in progress, incoming materials and finished products. Failure
costs can be either internal or external. Internal failure costs are those incurred
when rectifying an error or defect before a product leaves the construction
organisation or while it is still under its control. Conversely, external failure costs
are those incurred due to errors or defects in the product detected when the
product has left the organisation or is no longer under its control (Aliverdi et al.,
2013; Nabipoor et al., 2014).
Appraisal and prevention costs are unavoidable costs that must be borne by
construction organisations if their products or services are to be delivered right
the first time. Failure costs, on the other hand, are avoidable. By eliminating the
causes of re-doing processes, substantial reductions in appraisal costs can also
be achieved (Low and Hensen, 1998; Jafari and Love, 2013). Over time, COQ
was broken down into two elements (1) the cost of good quality (COGQ) and (2)
the cost of poor quality (COPQ). This has been elaborated by Beecroft (2000),
Douglas (2012), Cosmin and Ana-Maria (2013). While COGQ constitutes
prevention and appraisal costs, COPQ constitutes internal and external failure
costs (See Figure 3.2). COGQ and COPQ can be referred to as the cost of
conformance and the cost of non-conformance respectively (Crosby, 1979;
1996). The focus of the study is on COPQ due to the fact that they are
unnecessary costs associated with rectifying quality failures.

CHAPTER 3: LITERATURE REVIEW ON THE COST OF POOR QUALITY
106
Figure 3. 2: Interrelationship between the COQ, COGQ and COPQ
According to Bland et al. (1998) COPQ is the difference between the actual
operating cost and what the operating cost would have been if there were no
failures in its systems and no mistakes by its staff. This can imply that poor
quality comes from system failure, human error or incompetence. Campanella
(1999) puts this as the difference between costs in the actual situation and
costs in the ‘ideal’ situation, that is, in which no failures occur.
Similarly, Chiadamrong (2003) defined COPQ as the difference between the
actual cost of a product or service and what the cost could be if the quality was
perfect. It can therefore be deduced that COPQ is the cost of rectifying poor
quality; the challenge therefore is to eliminate the causes of poor quality. Juran
and Godfrey (1999) broke down COPQ into three components namely; cost of
non-conformities, cost of inefficient processes and the cost of lost opportunities
for sales revenue (See Figure 3.3). These categories were also highlighted by
Atkinson et al. (1994), Dale and Plunkett (1995) and Sorqvist (1998) and Defeo
and Juran (2010). According to Love et al (1998), COPQ is the total cost
derived from problems occurring before and after a product or service is
delivered.
Cost of Poor Quality
Failure costs (internal) Failure costs (External) Prevention costs Appraisal costs
Cost of Quality
Cost of Good Quality

CHAPTER 3: LITERATURE REVIEW ON THE COST OF POOR QUALITY
107
Figure 3. 3: Components of cost of poor quality (Source: Juran and Godfrey, 1999; Defeo and Juran, 2010)
Costs associated with failure arise from both internal and external sources.
Internal failure costs increase an organisational operations, for example,
rework, material waste, and other avoidable process losses. However external
failure costs results in loss of profit for example contractual claims, defects
rectification and loss of future business. This means the cost of nonconformities
and cost of inefficient processes relate to internal failure costs while the cost of
lost opportunities for sales revenue relates to external failure costs.
There are other COPQ components that have been proposed by authors.
Modarress and Ansari (1985) proposed two components namely the cost of
quality design, and the cost of inefficient utilisation of resources. Sugiura (1997)
proposed adjustment cost, and quality-design cost. According to Yang (2008)
these new components have not been widely accepted by practitioners and
researchers because the cost items entailed in these new categories are
difficult to identify and quantify. There is also the ‘hidden quality cost’
component proposed by Chiadamrong (2003) as the costs of handling the
quality problems that go beyond the visible costs of activities such as
inspection, testing, rework, and improvement. The term ‘hidden’ or ‘invisible’ is
used to indicate failure costs that are inadequately recorded or that are never
Cost of Poor Quality
Cost of nonconformities Cost of inefficient
processes Cost of lost opportunities
for sales revenue

CHAPTER 3: LITERATURE REVIEW ON THE COST OF POOR QUALITY
108
actually discovered. Such hidden costs might be manifested as extra
manufacturing costs as a result of defects or as additional costs for materials,
machining time, and inventory space for scrapped and reworked parts
(Dahlgaard et al., 1992). It can also occur as a result of a loss of goodwill or as
a result of additional costs incurred in internal inefficiencies. While the proposed
components are not widely used in academia and industry, what can be
deduced is that there are tangible and intangible costs attached to poor quality.
Tangible costs are easily quantifiable unlike intangible costs. This is true for all
COPQ definitions and concepts from all authors.
3.4 AN INTEGRATED MODEL FOR THE COST OF POOR
QUALITY
An integrated model for the cost of poor quality has been derived by
synthesising the existing concepts on; the definition of quality (Crosby, 1979;
Kano et al., 1984; Taguchi, 1993; ISO 9000: 2005; Ek and Çıkış, 2015), the
causes of poor quality (Griffith 1990; Hammarlund and Josephson, 1991; Burati
et al. 1992; Chung, 1999; Hwang et al., 2009; Love et al., 2004, 2010; Jafari
and Love, 2013), the ‘PAF’ classification of the cost of poor quality
(Feigenbaum,1956; Masser, 1957; Juran, 1989), and the components of the
cost of poor quality (Juran and Godfrey, 1999; Defeo and Juran, 2010). The
integrated concept is presented in Figure 3.4. The model shows the links
between the various elements of the cost of poor quality. From the bottom up,
errors and omissions, design changes and poor skills represent the contributory
factors to poor quality. The effects of poor quality are usually threefold. They
are: rework i.e. re-doing processes that should have been implemented
correctly the first time; project delays; and wastage of resources (human and

CHAPTER 3: LITERATURE REVIEW ON THE COST OF POOR QUALITY
109
Figure 3. 4: An integrated model for the cost of poor quality on construction projects
Cost of Poor Quality (COPQ)
(Unnecessary-avoidable costs)
Errors and omissions
Design changes
Effects of poor quality: Rework/delays/wastage
Failure costs (internal) Failure costs (External) Prevention costs Appraisal costs
Cost of Quality (COQ)
Cost of Good Quality (COGQ)
(Necessary-unavoidable costs)
Cost indicator (tangible- quantifiable): Plant/ material/ labour/ time
Poor skills
Contributory factors to poor quality
Nonconformities and inefficient processes
Cost indicator (tangible-quantifiable): Penalty costs
Cost indicator (intangible-non quantifiable): Lost opportunities for sales revenue
Customer dissatisfaction
Cost implication (Direct costs)
Cost implication (Indirect costs)

CHAPTER 3: LITERATURE REVIEW ON THE COST OF POOR QUALITY
110
material). The effects of poor quality are classified under nonconformities and
inefficient processes which have direct and indirect cost implications.
Direct costs are tangible and quantifiable in terms of plant hire and usage,
construction materials and products usage, labour (additional man hours), and
time incurred to rectify issues. Indirect costs are associated with customer
dissatisfaction. Indirect costs can be tangible and quantifiable in terms of
penalty costs particularly to the contractor organisation. Indirect costs can also
be intangible and non-quantifiable in terms of loss of goodwill from the customer
(client) and lost opportunities for sales revenue. While nonconformities and
inefficient processes contribute to internal failure costs, customer dissatisfaction
contributes to external failure costs. Both internal and external failure costs add
up to the cost of poor quality which is avoidable and unnecessary. The
challenge therefore is to devise strategies to reduce errors and omissions,
design changes and poor skills issues which ultimately lead to reduced cost of
poor quality.
3.5 QUANTIFYING THE COST OF POOR QUALITY
Quantifying COPQ is crucial to the development of a quality plan consistent with
an organisation’s strategy. Estimates made as to the magnitude of quality costs
in typical firms may explain the interest among researchers and practitioners.
Chronologically, Crosby (1979) estimated that the COPQ amounts to 25–30%
of turnover in manufacturing organisations and to 40–50% of direct operational
costs in service organisations. Stephenson (1989) estimated the maximum as
15–20% of turnover regardless of business type. Researchers and practitioners
have gone further to seek empirical evidence on COPQ. Empirical data
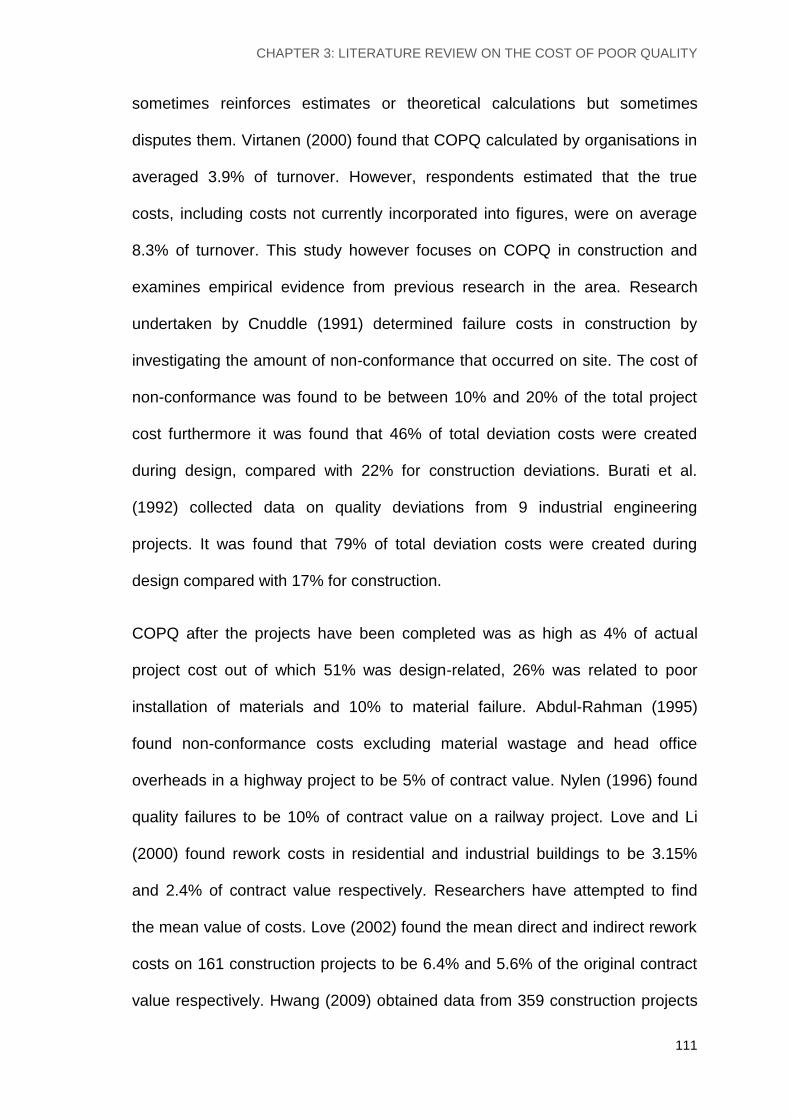
CHAPTER 3: LITERATURE REVIEW ON THE COST OF POOR QUALITY
111
sometimes reinforces estimates or theoretical calculations but sometimes
disputes them. Virtanen (2000) found that COPQ calculated by organisations in
averaged 3.9% of turnover. However, respondents estimated that the true
costs, including costs not currently incorporated into figures, were on average
8.3% of turnover. This study however focuses on COPQ in construction and
examines empirical evidence from previous research in the area. Research
undertaken by Cnuddle (1991) determined failure costs in construction by
investigating the amount of non-conformance that occurred on site. The cost of
non-conformance was found to be between 10% and 20% of the total project
cost furthermore it was found that 46% of total deviation costs were created
during design, compared with 22% for construction deviations. Burati et al.
(1992) collected data on quality deviations from 9 industrial engineering
projects. It was found that 79% of total deviation costs were created during
design compared with 17% for construction.
COPQ after the projects have been completed was as high as 4% of actual
project cost out of which 51% was design-related, 26% was related to poor
installation of materials and 10% to material failure. Abdul-Rahman (1995)
found non-conformance costs excluding material wastage and head office
overheads in a highway project to be 5% of contract value. Nylen (1996) found
quality failures to be 10% of contract value on a railway project. Love and Li
(2000) found rework costs in residential and industrial buildings to be 3.15%
and 2.4% of contract value respectively. Researchers have attempted to find
the mean value of costs. Love (2002) found the mean direct and indirect rework
costs on 161 construction projects to be 6.4% and 5.6% of the original contract
value respectively. Hwang (2009) obtained data from 359 construction projects

CHAPTER 3: LITERATURE REVIEW ON THE COST OF POOR QUALITY
112
and found direct rework costs alone to be 5% of total construction costs. Love et
al. (2010) found the mean rework costs to be 10% of the contract value in 115
civil infrastructure projects studied. A sample of findings from previous studies
on the cost of poor quality is shown in Table 3.5. It can be deduced from the
findings that a substantial part of deviation costs are created during design (e.g.
Cnuddle, 1991; Burati et al., 1992), in which case more attention need to be
paid to design. According to Schneider (1997) 32% of errors can be detected
through rigorous design checks. In addition, if an independent third party is
used then as much as 55% of design errors could be accounted for.
Kvitrud et al., (2001) stated that while design checks and verifications are useful
for identifying errors, their usefulness is restricted if lessons are not learnt from
previous projects and appropriate training and skill development implemented.
There is therefore a knowledge management aspect to quality management in
reducing quality related costs. Although Abdul-Rahman (1995) made the point
that non-conformance costs may be significantly higher in projects where poor
quality management is implemented, Cox et al. (1999) found that the costs of
design-related change orders affect contract value, even when projects are
managed effectively, as most of the changes are initiated by clients. Love et al.
(2010) also identified client change as one of the predictors for the cost of
rework. This implies that the design change aspect of COPQ is inevitable as
long as clients change their minds. Love et al. (2002), having examined 161
construction projects found that rework costs did not to vary significantly with
project type and procurement method used. While this finding was presented by
one author it is difficult to compare the finding with those of other authors.

CHAPTER 3: LITERATURE REVIEW ON THE COST OF POOR QUALITY
113
Table 3. 5: A sample of the cost of poor quality on construction projects
Author Areas of investigation Cost of poor quality
Cnuddle(1991)
Non-conformance that occurred on site
Cost of non-conformance was between 10% and 20% of the total project cost. 46% of total deviation costs were created during design, compared with 22% for construction deviations
Burati et al. (1992) Nine major engineering projects to determine the cost associated
with correcting deviations to meet specified requirements
Quality deviations accounted for an average of 12.4% of the contract
value
Abdul-Rahman (1995) Nonconformance costs excluding material wastage and head office overheads in a highway project
5% of the contract value
Nylen (1996)
Quality management practices in a railway project Quality failures were found to be 10% of the contract value
Cox et al. (1999) Costs of design-related change orders in projects Costs ranged from 5% to 8% of the contract value
Josephson and Hammarlund (1999) Residential, industrial, and commercial building projects Quality costs ranged from 2% to 6% of their contract values
Love and Li (2000) Residential and industrial buildings Costs of rework were found to be 3.15% and 2.40% of contract
value respectively
Love (2002)
Data obtained from 161 construction projects Mean direct and indirect rework costs were found to be 6.4% and 5.6% of the original contract value respectively
Hwang (2009) Data obtained from 359 construction projects to assess the impact
of different sources of rework on construction cost performance
Direct costs often tally to 5% of total construction costs
Love et al. (2010) Rework costs and probable causes were obtained from 115 civil infrastructure projects
Mean rework costs were found to be 10% of the contract value

CHAPTER 4: CONCEPTUAL FRAMEWORK
114
This is due to the fact that authors did not adopt the same methodology neither
did they examine the same aspects of COPQ. The varying aspects examined
include; quality failures (Nylen, 1996), non-conformance cost (Cnuddle, 1991),
direct and indirect rework costs (Love, 2002; Love et al., 2010), design and
construction related change orders (Cox et al., 1999; Borg and Song, 2015).
While all these aspects relate to COPQ none of the authors adopted an
integrated approach of examining all aspects of COPQ. The aspects include
design changes, errors and omissions, poor skills, which lead to rework, delays
and wastage, which are quantified in terms of plant, material, labour, time, and
penalty costs. The challenge for researchers and industry practitioners therefore
is to establish a unified methodology for quantifying COPQ which is a crucial
step to formulating strategies for reducing it.
3.6 REDUCING THE COST OF POOR QUALITY
There exists a diverse range of initiatives and tools that are applicable for
reducing the cost of poor quality, most of which originate from quality
management in the manufacturing industry but have found application in the
construction industry.
3.6.1 Initiatives for reducing the cost of poor quality
Crosby (1979) presented four absolutes to quality as follows: (1) quality is
defined as adherence to requirements (2) prevention is the best way to ensure
quality (3) ‘zero defects’ is the performance standard for quality (4) quality is
measured by the price of non-conformity. Crosby (1979) presented fourteen

CHAPTER 4: CONCEPTUAL FRAMEWORK
115
steps to continuous quality improvement: (1) attain total commitment from
management (2) form a quality improvement team (3) create metrics for each
quality improvement activity (4) determine cost of quality and show how
improvement will contribute to gains (5) train supervisors appropriately (6)
encourage employees to fix defects and keep issues logs (7) create a zero-
defects committee (8) ensure that employees and supervisors understand the
steps to quality (9) demonstrate company's commitment by holding a zero
defects day (10) set goals on 30, 60, or 90 day schedule (11) determine root
causes of errors, remove them from processes (12) create incentives programs
for employees (13) create a quality council and hold regular meetings (14)
repeat from step one.
Deming (1985) presented the theory of Total Quality Management (TQM) which
rests upon fourteen points of management: (1) create constancy of purpose (2)
adopt the new philosophy (3) stop dependencies on mass inspections (4) do not
award business based upon the price (5) aim for continuous production and
service improvement (6) bring in cutting-edge on the job training (7) implement
cutting-edge methods for leadership (8) abolish fear from the company (9)
deconstruct departmental barriers (10) get rid of quantity-based work goals (11)
get rid of quotas and standards (12) support pride of craftsmanship (13) ensure
everyone is trained and educated (14) make sure the top management structure
supports the previous thirteen points. A cycle was also created for continuous
improvement known as Plan-Do-Check-Act (PDCA). Firstly in the planning
phase, objectives and actions are outlined. Secondly, actions are ‘done’ or
undertaken to implement the process improvements. Thirdly, checks are made
to ensure quality against the original. Finally, acting requires determining where

CHAPTER 4: CONCEPTUAL FRAMEWORK
116
changes need to occur for continued improvement before returning to the plan
phase.
Juran and Godfrey (1998) presented a methodology for quantifying and
reducing COPQ in five steps: (1) quantify the size of the quality problem in a
language that will have impact on upper management: the language of money
improves communication between middle managers and upper managers (2)
identify major opportunities for cost reductions: a major by-product of evaluation
of cost is identification of costs of specific segments, each traceable to some
specific cause (3) identify opportunities for reducing customer dissatisfaction
and associated threats to product salability (or services): some costs of poor
quality are the result of product failures which takes place after the sale. (4)
provide a means of measuring the result of quality improvement activities
instituted to achieve the opportunities in 2 and 3 above: measuring progress
helps to keep a focus on improvement and also spotlights any lack of progress
that requires removal of obstacles to improvement (5) align quality goals with
organisation goals: measuring the cost of poor quality is one of the four key
inputs for assessing the current status of quality. Knowing the cost of poor
quality (and the other elements) leads to the development of a quality action
plan consistent with overall strategic organisational goals. Deployment of
strategic quality goals includes specific quality improvement and quality
planning projects to pursue the opportunities in 2 and 3 above. These projects
become the link between strategic goals and day-to-day quality activities.
ISO 9000 family of standards can also be utilised in reducing COPQ as they
focus on quality management in organisations no matter what size or industry
CHAPTER 4: CONCEPTUAL FRAMEWORK
117
so that they become better managed, more efficient and more customer-
focused. If well implemented, it results in 'cultural transition' to an atmosphere of
continuous improvement. The ISO 9000 standard is a supplemental document
that defines the vocabulary used in ISO 9001 and ISO 9004. The ISO 9001
standard is the core component of the ISO 9000 standards series: it contains
the requirements for an organisation’s quality management system (QMS). ISO
9004 contains optional guidelines to extend the benefits of ISO 9001 to a wider
range of interested parties including society in general. ISO 9000 is based
around eight quality management principles: (1) customer focus (2) leadership
(3) involvement of people (4) process approach (5) system approach to
management (6) continual improvement (7) factual approach to decision making
(8) mutually beneficial supplier relationships.
The European Foundation for Quality Management (EFQM, 2010; Gašparík and
Gašparíková, 2013) model is based upon nine criteria for quality management.
There are five enablers (i.e. criteria covering the basis of how an organisation
does things) and four results (i.e. criteria covering outcomes which are targeted,
measured and achieved). The model refrains from prescribing any one
methodology, but rather recognises the diversity in quality management
methodologies. The nine criteria presented by the EFQM Model are: (1)
Leadership: how leaders develop and facilitate the achievement of the mission
and vision, create values required for long term success and implement these
via appropriate actions and behaviours and are personally involved in ensuring
that the organisation’s management system is developed and implemented (2)
Policy and strategy: how the organisation implements its mission and vision via
a clear stakeholder focused strategy supported by relevant policies, plans,

CHAPTER 4: CONCEPTUAL FRAMEWORK
118
objectives, targets and processes (3) People: how the organisation manages,
develops and releases the knowledge and full potential of its people at an
individual, team-based and organisation-wide level and how these activities are
planned in order to support its policy and strategy and the effective operation of
its processes. (4) Partnerships and resources: How the organisation plans and
manages its external partnerships and internal resources in order to support its
policy and strategy and the effective operation of its processes. (5) Processes:
how the organisation designs, manages and improves its processes to support
the policy and strategy and fully satisfies and generates increasing value for its
customers and other stakeholders. (6) Customer results: what the organisation
is achieving in relation to its external customers. (7) People results: what the
organisation is achieving in relation to its people. (8) Society results: what the
organisation is achieving in relation to local, national and international society
as appropriate. (9) Key performance results: what the organisation is achieving
in relation to its planned performance.
Lean principles requires highly controlled processes operated in a well
maintained and ordered environment that incorporates principles of employee-
involved, system-wide, continual improvement. This involves five overriding
principles: (1) Identify customers and specify value: only a small fraction of the
total time and effort in any organisation actually adds value for the end
customer. By clearly defining ‘value’ for a specific product or service from the
end customer’s perspective, all the non-value activities or waste can be
targeted and removed. (2) Identify and map the value stream: the value stream
relates to the entire set of activities across all parts of the organisation involved
in jointly delivering the product or service. This represents the end-to-end

CHAPTER 4: CONCEPTUAL FRAMEWORK
119
process that delivers the value to the customer. (3) Create flow by eliminating
waste: eliminating waste ensures that products or services flow to the customer
without any interruption, detour or waiting. (4) Respond to customer pull:
involves understanding customer demands and creating processes to respond
to this. So that only ‘what’ the customer wants is produced ‘when’ the customer
wants it. (5) Pursue perfection: creating ‘flow’ and ‘pull’ requires radically
reorganising individual process steps, but the gains become truly significant as
the entire steps link together. As this happens more and more layers of waste
become visible and the process continues towards the theoretical end point of
perfection, where every asset and every action adds value for the end
customer.
Six Sigma is utilised to improve the quality of process outputs by identifying and
removing the causes of errors and minimising variability in manufacturing and
business processes. It uses a set of quality management methods, including
statistical methods, and creates a special infrastructure of people or
‘champions’ within the organisation who are Six Sigma experts. Each Six Sigma
project follows a defined sequence of steps and has quantified value targets
such as; reduced process cycle time, reduced costs, increased customer
satisfaction, and increased profits. The Six Sigma methodology consists of five
phases represented by the acronym ‘DMAIC’ and described as: (1) Define the
system, the voice of the customer, their requirements and the project goals
specifically (2) Measure key aspects of the current process and collect relevant
data (3) Analyse the data to investigate and verify cause-and-effect
relationships. Determine what the relationships are, and attempt to ensure that
all factors have been considered. Seek out root cause of the defect under

CHAPTER 4: CONCEPTUAL FRAMEWORK
120
investigation. (4) Improve or optimise the current process based upon data
analysis using techniques such as design of experiments to create a new, future
state process. Set up pilot runs to establish process capability. (5) Control the
future state process to ensure that any deviations from the target are corrected
before they result in defects. Implement control systems such as statistical
process control, production boards, visual workplaces, and continuously monitor
the process. While the DMAIC is used for projects aimed at improving an
existing business process, a further methodology known by the acronym
‘DMADV’ is used for projects aimed at creating new product or process designs,
and described as (1) Define design goals that are consistent with customer
demands and the enterprise strategy (2) Measure and identify the
characteristics that are critical to quality (CTQs), product capabilities, production
process capability and risks (3) Analyse to develop and design alternatives (4)
Design an improved alternative, best suited per analysis in the previous step (5)
Verify the design, set up pilot runs, implement the production process and hand
it over to the process owner.
It has been documented that a significant percentage of COPQ can be traced
back to design (e.g. Cnuddle, 1991; Burati et al.,1992; Jafari and Love, 2013),
more so the construction supply chains are constantly challenged to deliver
successful projects despite tight budgets, limited manpower, accelerated
schedules, and limited or conflicting information. There have been initiatives to
reduce costs related to these aspects and to integrate the design and
construction processes. A recent and prominent initiative in the construction
industry is the Building Information Modelling (BIM) which is a digital
representation of physical and functional characteristics of a facility (NBS,

CHAPTER 4: CONCEPTUAL FRAMEWORK
121
2014). A BIM is a shared knowledge resource for information about a facility
forming a reliable basis for decisions during its life-cycle i.e. from earliest
conception to demolition. Though not a quality management initiative in its
entirety, it incorporates quality management aspects such as ‘just-in-time’
production strategy that strives to improve a business' return on investment by
reducing in-process inventory and associated carrying costs. It also
incorporates aspects of knowledge management such as knowledge sharing
among supply chain organisations and individuals. The model is expected to
save time, reduce errors and reduce waste on site therefore leading to better
value, quality and resultant customer satisfaction.
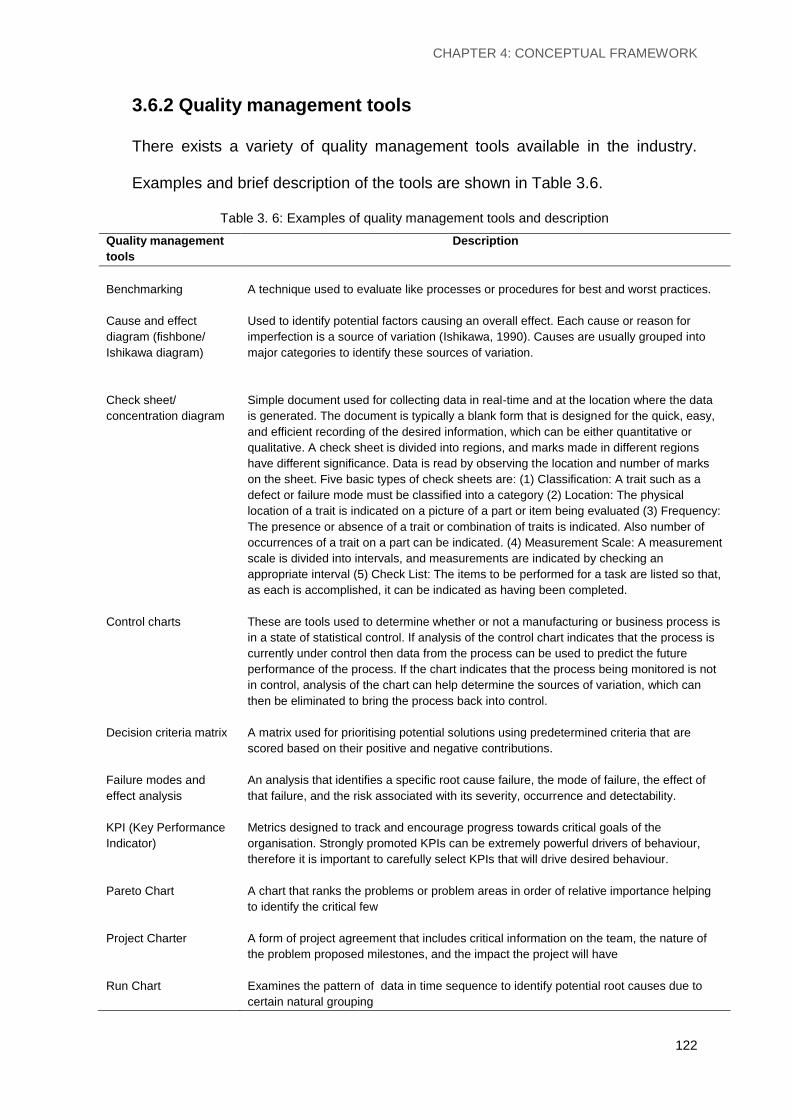
CHAPTER 4: CONCEPTUAL FRAMEWORK
122
3.6.2 Quality management tools
There exists a variety of quality management tools available in the industry.
Examples and brief description of the tools are shown in Table 3.6.
Table 3. 6: Examples of quality management tools and description
Quality management
tools
Description
Benchmarking A technique used to evaluate like processes or procedures for best and worst practices.
Cause and effect
diagram (fishbone/
Ishikawa diagram)
Used to identify potential factors causing an overall effect. Each cause or reason for
imperfection is a source of variation (Ishikawa, 1990). Causes are usually grouped into
major categories to identify these sources of variation.
Check sheet/
concentration diagram
Simple document used for collecting data in real-time and at the location where the data
is generated. The document is typically a blank form that is designed for the quick, easy,
and efficient recording of the desired information, which can be either quantitative or
qualitative. A check sheet is divided into regions, and marks made in different regions
have different significance. Data is read by observing the location and number of marks
on the sheet. Five basic types of check sheets are: (1) Classification: A trait such as a
defect or failure mode must be classified into a category (2) Location: The physical
location of a trait is indicated on a picture of a part or item being evaluated (3) Frequency:
The presence or absence of a trait or combination of traits is indicated. Also number of
occurrences of a trait on a part can be indicated. (4) Measurement Scale: A measurement
scale is divided into intervals, and measurements are indicated by checking an
appropriate interval (5) Check List: The items to be performed for a task are listed so that,
as each is accomplished, it can be indicated as having been completed.
Control charts These are tools used to determine whether or not a manufacturing or business process is
in a state of statistical control. If analysis of the control chart indicates that the process is
currently under control then data from the process can be used to predict the future
performance of the process. If the chart indicates that the process being monitored is not
in control, analysis of the chart can help determine the sources of variation, which can
then be eliminated to bring the process back into control.
Decision criteria matrix A matrix used for prioritising potential solutions using predetermined criteria that are
scored based on their positive and negative contributions.
Failure modes and
effect analysis
An analysis that identifies a specific root cause failure, the mode of failure, the effect of
that failure, and the risk associated with its severity, occurrence and detectability.
KPI (Key Performance
Indicator)
Metrics designed to track and encourage progress towards critical goals of the
organisation. Strongly promoted KPIs can be extremely powerful drivers of behaviour,
therefore it is important to carefully select KPIs that will drive desired behaviour.
Pareto Chart A chart that ranks the problems or problem areas in order of relative importance helping
to identify the critical few
Project Charter A form of project agreement that includes critical information on the team, the nature of
the problem proposed milestones, and the impact the project will have
Run Chart Examines the pattern of data in time sequence to identify potential root causes due to
certain natural grouping

CHAPTER 4: CONCEPTUAL FRAMEWORK
123
3.7 ISSUES RELATING TO THE COST OF POOR QUALITY
There are issues relating to the cost of poor quality in construction which need
to be addressed. One of such issues is that cost of poor quality is endemic and
has been found to range from around 2% to over 10% of total project cost
regardless of project type and size. Reducing the cost of poor quality can lead
to significant savings due to the size of the construction industry. While attempts
have been made by authors to quantify the cost of poor quality, none of them
has adopted a holistic approach to quantifying it. Previous studies have focused
on the constituent aspects of cost of poor quality instead, such as quality
failures (e.g. Nylen, 1996), non-conformance costs (e.g. Abdul-Rahman, 1995),
deviation costs (e.g. Cnuddle, 1991; Burati et al., 1992), direct and indirect
rework costs (e.g. Love et al., 2002; Hwang, 2009), design and construction
related change orders (e.g. Cox et al., 1999; Love et al., 2010).
While all these aspects relate to the cost of poor quality, none of the authors
adopted an integrated approach in quantifying all the aspects. The aspects
include errors and omissions, design changes, and poor skills, which lead to
rework, delays and wastage, which are then quantified in terms of plant,
material, labour, time, and penalty costs (Golob et al., 2013; Nabipoor et
al.,2014. There is therefore no unified methodology for quantifying the cost of
poor quality neither is there a unified terminology in describing the aspects of
the cost of poor quality. This creates difficulty in comparing ‘like-for-like’
performance from project to project, which is a crucial step to formulating
strategies for benchmarking and continuous improvement. There exists the
critical need to formulate strategies for reducing the cost of poor quality on
construction projects not only because government reports have criticised the

CHAPTER 4: CONCEPTUAL FRAMEWORK
124
industry for underperforming but because clients are becoming more
sophisticated, insisting on better value for money, and demanding more units of
construction for fewer units of expenditure.
Table 3. 7: Issue relating to the cost of poor quality on construction projects
Issues relating to COPQ
COPQ is endemic and has been found to range from 2% to over 10% of total project cost. This is very significant due to the size of the construction industry.
While attempts have been made to quantify COPQ, there has been no unified methodology in quantifying it thereby making ‘like-for-like’ comparisons of projects difficult
There are no unified terminologies describing aspects of COPQ
There exists a critical need to formulate strategies for reducing COPQ due to government and client demands
3.8 SUMMARY OF CHAPTER 3
This chapter examined the existing body of work on quality management with a
specific focus on the cost of poor quality on construction projects. It discussed
the conceptualisations of quality including key definitions and applications. It
reviewed and presented findings from three case studies obtained from a
secondary source which deal with construction stakeholders’ influence on the
definition of quality on construction projects. It was found that quality is not just
defined by the customer (construction client) but is also influenced by external
stakeholders. The causes of poor quality were found to be errors and
omissions, design changes and poor skills. The cost of poor quality was found
to constitute the cost of non-conformities, cost of inefficient processes and the
cost of lost opportunity for revenue. It was discovered that the cost of poor

CHAPTER 4: CONCEPTUAL FRAMEWORK
125
quality is endemic and is found to be over 10% of total project costs in certain
cases. The chapter explored quality management initiatives and tools used by
organisations in reducing the costs of poor quality. It also identified the issues
relating to COPQ in construction project management.

CHAPTER 4: CONCEPTUAL FRAMEWORK
126
CHAPTER 4
CONCEPTUAL FRAMEWORK
This chapter synthesises the body of work on knowledge management and the
cost of poor quality. It examines the links between knowledge management and
the prevalent cost of poor quality on construction projects. It identifies the
issues, challenges, knowledge gaps and key research questions on the impact
of knowledge management in reducing the cost of poor quality. It presents the
key research questions together with a matrix showing the areas of inquiry. It
distinguishes between a theoretical framework and a conceptual framework. It
also presents an initial conceptual framework for the study which is subject to
modifications at later stages of the study.
4.1 SYNTHESISING KM AND COPQ
The rationale for undertaking the research was driven by the need to reduce
COPQ on construction projects. While COPQ may be regarded as a quality
management problem, the study takes a novel approach by exploring the link
between KM and COPQ. This chapter focuses on integrating the concepts of
KM and COPQ in order to develop a conceptual framework on the impact of KM
in reducing COPQ. Although none of the previous studies have investigated the
impact of KM on COPQ nor shown any empirical evidence on the extent of the
impact, literature suggests that poor KM contributes to COPQ and that
optimising KM can reduce COPQ thereby leading to improved project
performance, increased profitability, increased customer satisfaction and
improved industry reputation. Before developing the framework, it is
fundamental to summarise the followings:

CHAPTER 4: CONCEPTUAL FRAMEWORK
127
Findings from literature review on KM and COPQ
Issues and challenges relating to KM and COPQ
Knowledge gaps
Key research questions to be addressed.
4.1.1 Findings from literature review on KM and COPQ
The first objective of the research is to critically review existing literature in the
area of KM from both general and construction industry perspectives in order to
explore, identify and document the key concepts, processes, tools, KM drivers,
enablers, benefits, barriers and issues relating to KM and the possible link to
COPQ. The second objective is to critically review existing literature in the area
of quality management with a specific focus on COPQ in construction, in order
to explore, identify and document the key concepts of quality, the causes of
poor quality, the costs associated with poor quality, the quality management
initiatives for reducing COPQ, the issues relating to COPQ in construction and
the possible link to KM. The details of the first and second objectives have been
discussed in the previous two chapters. The key findings however are
summarised as follows:
KM is invaluable to the construction industry as it is deemed critical for
construction organisations to harness and integrate knowledge in order
to improve efficiency and increase profitability.
Despite KM initiatives, construction projects are still plagued with
inefficiencies, repetition of mistakes and lack of lessons learnt thereby
contributing to additional project costs.

CHAPTER 4: CONCEPTUAL FRAMEWORK
128
A major area of focus is on the cost attached to the unnecessary effort
of re-doing processes or activities incorrectly implemented the first time
often referred to as the cost of poor quality. This includes the cost of
errors and omissions, cost of design changes, cost of poor skills and the
consequential costs associated with client dissatisfaction
COPQ is endemic and has been found to range from around 2% to over
10% of total project cost regardless of project type and size
Previous studies have focused on the constituent aspects of COPQ
such as quality failures, non-conformance cost, direct and indirect
rework costs, design and construction related change orders. None of
the studies have attempted a holistic approach of integrating all these
aspects which include design changes, errors and omissions, poor skills
which lead to rework, delays and wastage, and quantified in terms of
plant, material, labour, time, and penalty costs.
Previous studies have also adopted different methodologies in
quantifying aspects of COPQ, which makes it difficult to compare COPQ
from project to project and to benchmark progress in the industry.
Government reports have criticised the industry for underperforming.
Clients are becoming more sophisticated, insisting on better value for
money, and demanding more units of construction for fewer units of
expenditure. There exists therefore the critical need to formulate
strategies for reducing the COPQ in construction.
Furthermore no research has been found to date that has investigated
the impact of KM in reducing COPQ on construction projects.

CHAPTER 4: CONCEPTUAL FRAMEWORK
129
4.1.2 Issues and challenges relating to KM and COPQ
The construction industry is project-based thereby posing the challenge
of knowledge capture, retention and re-use
The industry is fragmented thereby brings about the challenge of
knowledge integration across organisations
The industry is criticized for being poor at learning, ‘reinventing the
wheel’, repeating mistakes and wasting resources
Multiple organisations are typically involved in a single project creating
the challenge of integration and collaborative working with a focus on
the end product and customer value
Clients are often dissatisfied with project performance, project process
and product quality
There is low profitability of organisations as a result of KM related
inefficiencies
Larger organisations are more likely to formally practice KM than the
majority of small organisations
COPQ is endemic and may be difficult to quantify, especially the
intangible aspects of external failure costs.
There exists a critical need to formulate strategies for reducing COPQ
due to government and client demands
In addition, the current trends in the UK construction industry is presented in the
Industry Performance Report (2014) based on the Construction Industry Key
Performance Indicators. This showed that industry profitability has fallen to just
2.1% continuing the trend of decline that took hold during the depression of

CHAPTER 4: CONCEPTUAL FRAMEWORK
130
2008/09. Project costs were on budget or better for 69% of projects. Contractor
satisfaction with the client’s provision of information fell back during 2013/14
from a survey high recorded previously. Design costs came in on or under
budget 79% of the time. Predictability in the cost of construction was broadly
unchanged with 57% coming in on budget or better compared to 58% in 2012
and 59% in 2011. Projects as a whole were completed to, or ahead of schedule
45% of the time. This is in line with the survey average since 2003. The design
was delivered on time or better for 52% of all projects, but smaller projects
outperformed larger ones. The construction phase was on time or better for
67% of projects.
4.1.3 Knowledge gaps
Knowledge gaps refer to the missing element(s) in previous research literature
that is intended to be filled by the current research. They also indicate findings
from previous research in which key questions have not been answered.
According to Sarewitz (1996) knowledge gaps can be perceived in four ways (1)
as a barrier on the linear path towards complete understanding (2) as
contingent on the changeable social and cultural processes which drive the
production of scientific knowledge (3) as a lack of sufficient integration of
knowledge from different sources and disciplines; and (4) as a space where a
thickening of knowledge can occur through the addition of new layers of
meaning and significance to understandings of reality. All these ways of
understanding knowledge gaps are present in the current study on the impact of
KM in reducing COPQ which are summarised as follows:

CHAPTER 4: CONCEPTUAL FRAMEWORK
131
Attempts have been made by authors to quantify COPQ, but none of
them has adopted a holistic approach in its quantification. Instead,
previous studies have focused on the constituent aspects of COPQ. This
research intends to bridge the knowledge gap by integrating all the
aspects and presenting a holistic model to quantifying COPQ.
Much of the research in the area of KM take an organisational
perspective and relatively little attention have been given to the impact of
KM exploitation on construction projects. These studies typically focus on
ways of managing the knowledge resources and capabilities of an
organisation through the use of KM processes and tools with the overall
aim of gaining competitive advantage over potential competitors. KM
however needs to advance beyond organisational level through the
utilisation of a more robust approach in developing a push-pull strategy
for knowledge integration across personal, organisational, project and
industry interfaces in order to retain existing knowledge and to create
new knowledge. This key aspect is missing in the existing body of work
on KM.
While KM and COPQ may be viewed as two distinct areas in practice,
evidence suggests a link between the two. However none of the existing
body of work has examined the interconnectedness of KM and COPQ.
Furthermore no research has been found to date that has investigated
the impact of KM on COPQ neither have there been any framework or
tools developed to measure the impact.

CHAPTER 4: CONCEPTUAL FRAMEWORK
132
4.1.4 Key research questions to be addressed
The research questions identified were based on the research problem and the
knowledge gap the research intends to bridge. The main research questions for
this study are stated as follows:
(1) What are the contributory factors to the cost of poor quality on
construction projects in practice?
(2) What is the impact of knowledge management in reducing the cost of
poor quality based on the identified contributory factors?
(3) How can knowledge management be optimised to reduce the cost of
poor quality on construction projects?
The first research question investigates the contributory factors to COPQ in
practice. While the key elements to COPQ have been identified through
literature review as the costs of errors and omissions, the cost of design
changes and the cost of poor skills, it is unclear if there are more of these
elements and it the findings from literature can be localised in the current UK
construction industry context. The research therefore seeks to investigate these
elements in practice and also identify the contributory factors to each element.
The second research question explores the impact of KM in reducing COPQ
based on the contributory factors identified in practice. This helps to identify the
current KM initiatives and practices at personal, organisational, project and
industry levels and their impact in reducing unnecessary costs associated with
poor quality in construction. The research question also investigates KM
processes and tools utilised by organisations to reduce COPQ. The third
research question investigates the optimisation of KM to reduce COPQ. This

CHAPTER 4: CONCEPTUAL FRAMEWORK
133
question investigates the impediments and facilitators of KM, together with the
actions required to make the best and the most effective use of KM in reducing
COPQ on construction projects.
The three research questions follow a logical sequence in which the first
investigates the underlying causes of the research problem. While the second
question investigates the current impact of KM on COPQ (i.e. how does KM
impact COPQ?), the third question investigates the potential impact of KM on
COPQ (i.e. how should KM impact COPQ?). The aim of the research therefore
is to bridge the gap between the current impact and potential impact i.e. raising
KM performance from its current level to an optimised level to reduce COPQ.
An integrated KM-COPQ model is presented in Figure 4.1 which shows the
areas of investigation on the impact of KM on COPQ. The integrated model
combines the SECI application model (Figure 2.10, Chapter 2) with the COPQ
model (Figure 3.4, Chapter 3) which forms a template for investigation.
4.2 SETTING IMPACT MEASURES
A key aim of the research is to investigate the impact of KM in reducing COPQ
(Figure 4.1). The key questions to be asked therefore are: What is impact? How
is impact measured? Impact can be defined as a marked effect or influence of
one phenomenon on the other. It is a measure of consequences of one thing’s
or entity’s action over another. Impact can be direct or indirect, positive or
negative, tangible or intangible, short term or long term. Impact can be
measured by creating indicators to measure and track the outcomes of impact.
For any outcome, there is a range of possible signs, symptoms or hints by
which these outcomes can be observed, measured or detected with varying

CHAPTER 4: CONCEPTUAL FRAMEWORK
134
Cost of Poor Quality (COPQ)
(Unnecessary-avoidable costs)
Errors and omissions
Design changes
Effect of poor quality: Rework/delays/wastage
Failure costs (internal) Failure costs (External)
Cost indicator (tangible- quantifiable): Plant/ material/ labour/ time
Poor skills
Contributory factors to poor quality
Nonconformities and inefficient processes
Cost indicator (tangible-quantifiable): Penalty costs
Cost indicator (intangible-non quantifiable): Lost opportunities for sales revenue
Customer dissatisfaction
Cost implication (Direct costs)
Cost implication (Indirect costs)
Organisational level KM - Socialisation (S) among
personnel across organisations. - Externalisation (E) between
personnel and their organisation - Combination across organisations
Personal level KM - Socialisation (S) among personnel
from same organisation - Internalisation (I) between
personnel and their organisation
Project level KM - Combination (C) between
organisations and the project knowledge base.
- Combination (C) between project knowledge bases.
Industry level KM - Combination (C) between project
knowledge bases and industry knowledge base
What is the impact of
knowledge management on
errors and omissions?
What is the impact of
knowledge management on
design changes?
What is the impact of
knowledge management on
poor skills?
Figure 4. 1: Integrated model showing the areas of investigation on the impact of KM on COPQ
CHAPTER 4: CONCEPTUAL FRAMEWORK
135
degrees of certainty. Indicators can be either quantitative or qualitative
(Oyewobi et al., 2015).
While Qualitative indicators help to demonstrate, describe or measure that
something has happened, quantitative indicators help to answer questions
about things that are inherently expressed in numbers. Both are considered for
this research. It is important to select indicators of performance, quality, or
outcomes that are within the organisation’s scope to measure and use. Four
criteria for choosing indicators (Walker et al., 2000; Mayoux, 2002; Jackson
2004) are:
(1) Action focused: Does knowing about this issue help the organisation or
its key stakeholders to do things better or more effectively? Is it within the
organisation’s power to influence it?
(2) Important: Is it relevant to the organisation? Is it a priority for a core
stakeholder or group of stakeholders?
(3) Measurable: Can information be obtained and measured?
(4) Simple: Is it clear and direct enough to be understood by all
stakeholders? Is it easy enough to get information without expert
assistance if none is available?
The integrated concept is presented in Figure 3.4. The model shows the links
between the various elements of the COPQ. From the bottom up, errors and
omissions, design changes and poor skills represent the contributory factors to
poor quality. The effects of poor quality are usually threefold. They are: rework
i.e. re-doing processes that should have been implemented correctly the first

CHAPTER 4: CONCEPTUAL FRAMEWORK
136
time; project delays; and wastage of resources (human and material). The
effects of poor quality are classified under nonconformities and inefficient
processes which have direct and indirect cost implications. Direct costs are
tangible and quantifiable in terms of plant hire and usage, construction materials
and products usage, labour (additional man hours), and time incurred to rectify
issues. Indirect costs are associated with customer dissatisfaction. Indirect
costs can be tangible and quantifiable in terms of penalty costs particularly to
the contractor organisation. Indirect costs can also be intangible and non-
quantifiable in terms of loss of goodwill from the customer (client) and lost
opportunities for sales revenue. While nonconformities and inefficient processes
contribute to internal failure costs, customer dissatisfaction contributes to
external failure costs. Both internal and external failure costs add up to the cost
of poor quality which is avoidable and unnecessary.
4.3 CONCEPTUAL FRAMEWORK
A conceptual framework is the system of concepts, assumptions, expectations,
beliefs, and theories that supports and informs research and is a key part of
research design (Miles and Huberman, 1994; Robson, 2011). Miles and
Huberman (1994) defined a conceptual framework as a visual or written
product, one that explains, either graphically or in narrative form, the main items
to be studied, the key factors, concepts, or variables and the presumed
relationships among them.
4.3.1 Theory, concept and framework
Before proceeding to the conceptual framework design, it is important to define
and clarify the terms ‘theory’, ‘concept’, and ‘framework’ within the context of the

CHAPTER 4: CONCEPTUAL FRAMEWORK
137
research. Fox and Bayat (2007) defined theory as a set of interrelated
propositions, concepts and definitions that present a systematic point of view of
specifying relationships between variables with a view to predicting and
explaining phenomena. In a similar way Liehr and Smith (1999) defined theory
as a set of interrelated concepts, which structure a systematic view of
phenomena for the purpose of explaining or predicting. A theory is similar to a
blueprint or a guide for modelling a structure. Blueprint depicts the elements of
a structure and the relation of each element to the other, just as a theory depicts
the concepts, which compose it and the relation of concepts with each other.
Furthermore, Liehr and Smith (1999) made a connection between theory and
practice such that theory guides practice while practice enables testing of theory
and generates questions for research. Research therefore contributes to theory-
building and selecting practice guidelines.
Chinn and Kramer (1999) described theory as an expression of knowledge, a
creative and rigorous structuring of ideas that project a tentative, purposeful,
and systematic view of phenomena. According to Wacker (1998), theory has
four components namely: definition of terms, concepts or variables; a domain to
which the theory is applicable; a set of relationships amongst the variables; and
specific predictive claims. Putting all these elements together, a theory is
therefore a careful outline of the precise definitions in a specific domain to
explain why and how the relationships are logically tied so that the theory gives
specific predictions. Thus, a good theory is taken to be one which gives a very
clear and precise picture of events of the domain it seeks to explain. Therefore
a theory’s precision and limitations are founded in the definitions of terms, the

CHAPTER 4: CONCEPTUAL FRAMEWORK
138
domain of the theory, the explanation of relationships, and the specific
predictions.
A concept can be defined as an image or symbolic representation of an abstract
idea (Liehr and Smit, 1999), or as the component of theory which conveys the
abstract ideas within a theory (Chinn and Kramer, 1999). A concept is also
viewed as a complex mental formulation of experience in which case, meanings
and interpretations are largely influenced by their context. Concepts can be of
real or ‘concrete’ phenomena (e.g. buildings) and can also be of agreed-upon or
‘abstract’ phenomena (e.g. quality). According to Thompson (2006) three
classes of things can be measured: direct observables such as height, weight,
or colour; indirect observables such as questionnaires that provide information
on gender, age or income; and constructs which are theoretical creations that
are based on observations but which cannot be seen either directly or indirectly
such as IQ, leisure satisfaction, or environmental values. Lehman et al., (2005)
further described conceptualisation as the process of specifying what is meant
by a term. In deductive research conceptualisation helps to translate portions of
an abstract theory into testable hypothesis involving specific variables. In
inductive research, conceptualisation is an important part of the process used to
make sense of related observations.
Framework in research has been defined as a structure that provides guidance
for the researcher as research questions are fine-tuned, methods for measuring
variables are selected, and analyses are planned (Liehr and Smith, 1999). Once
data is collected and analysed, the framework is used as a tool to check
whether the findings agree with the framework or whether there are

CHAPTER 4: CONCEPTUAL FRAMEWORK
139
discrepancies. Where discrepancies exist, a further question is asked whether
or not the framework can be used to explain them. In the context of this
research, a framework can act as a guide in explaining and interpreting the
impact of knowledge management in reducing the cost of poor quality in
construction with respective levels of academic integrity and acceptability.
Furthermore, a framework is a broad overview, outline, or skeleton of interlinked
items which supports a particular approach to a specific objective, and serves
as a guide that can be modified as required by adding or deleting items (Fox
and Bayat, 2007).
4.3.2 Theoretical framework versus conceptual framework
A theoretical framework refers to the theory adopted by researchers to guide
research. A theoretical framework therefore is the application of a theory, or a
set of concepts drawn from one and the same theory, to offer an explanation of
an event, or shed light on a particular phenomenon or research problem. This
could refer to, for instance, the Set theory, evolution, quantum mechanics,
particulate theory of matter, or similar pre-existing generalisation such as
Newton’s laws of motion, gas laws, that could be applied to a given research
problem deductively. On the other hand, if a research problem cannot
meaningfully be researched in reference to only one theory, or concepts
resident within one theory, the researcher may have to synthesise the existing
views in the literature concerning a given situation both from theoretical and
empirical findings. The synthesis may be called a ‘model’ or conceptual
framework, which essentially represents an integrated way of looking at the
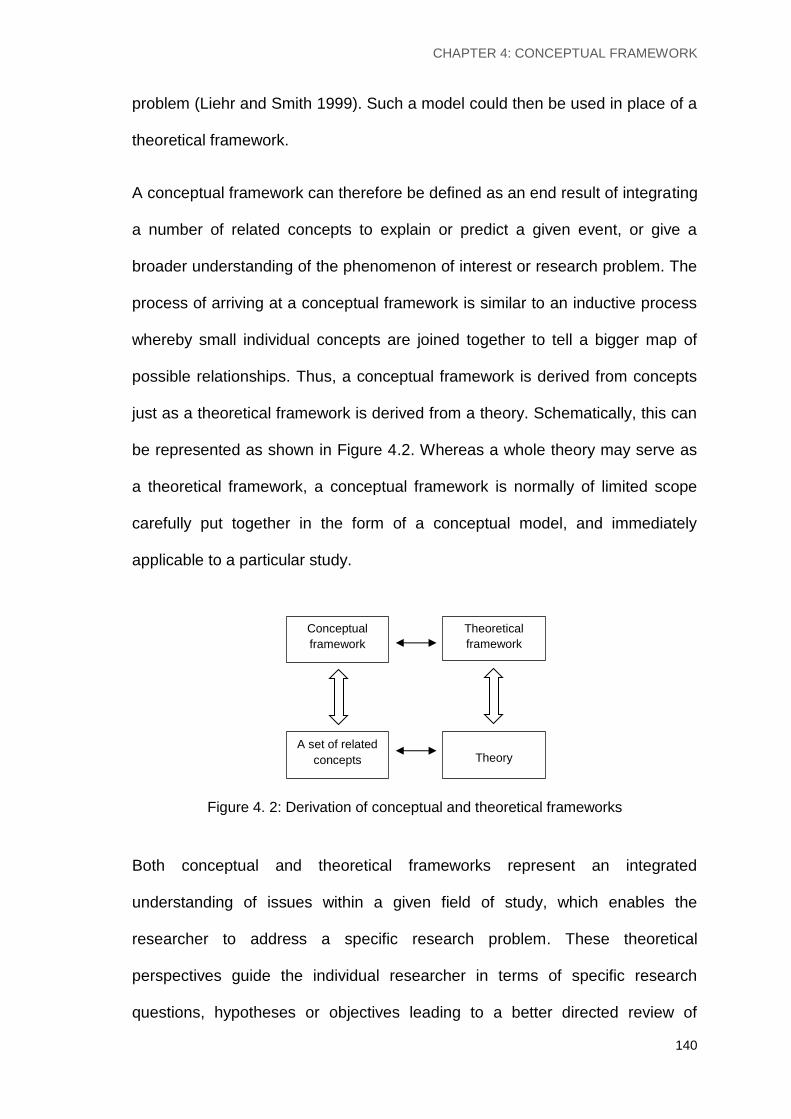
CHAPTER 4: CONCEPTUAL FRAMEWORK
140
problem (Liehr and Smith 1999). Such a model could then be used in place of a
theoretical framework.
A conceptual framework can therefore be defined as an end result of integrating
a number of related concepts to explain or predict a given event, or give a
broader understanding of the phenomenon of interest or research problem. The
process of arriving at a conceptual framework is similar to an inductive process
whereby small individual concepts are joined together to tell a bigger map of
possible relationships. Thus, a conceptual framework is derived from concepts
just as a theoretical framework is derived from a theory. Schematically, this can
be represented as shown in Figure 4.2. Whereas a whole theory may serve as
a theoretical framework, a conceptual framework is normally of limited scope
carefully put together in the form of a conceptual model, and immediately
applicable to a particular study.
Figure 4. 2: Derivation of conceptual and theoretical frameworks
Both conceptual and theoretical frameworks represent an integrated
understanding of issues within a given field of study, which enables the
researcher to address a specific research problem. These theoretical
perspectives guide the individual researcher in terms of specific research
questions, hypotheses or objectives leading to a better directed review of
A set of related
concepts
Theory
Conceptual
framework Theoretical
framework

CHAPTER 4: CONCEPTUAL FRAMEWORK
141
literature, the selection of appropriate research methods, and the interpretation
of results. A number of researchers can work on the same research problem,
using different theoretical or conceptual frameworks, and each arriving at
legitimate findings. In deductive research, researchers normally use a dominant
theory to address a given research problem, while in inductive research, many
aspects of different theoretical perspectives are brought together to build up a
generalisation with enough ‘power’ to guide the study (Liehr and Smith 1999).
Induction moves from the particular to the general, from a set of specific
observations to the discovery of a pattern that represents some degree of order
among all the given events (de Vos et al. 2005). According to Borgatti (1999),
theoretical frameworks are obviously critical in deductive or theory-testing sorts
of studies. Hence, in attempting to distinguish between theoretical and
conceptual framework, it can be deduced that; while research based on
deductive reasoning makes use of a pre-existing theory, or theoretical
framework, research based of inductive reasoning tends to be theory-building.
Both conceptual and theoretical frameworks refer to the epistemological
paradigm a researcher utilises to examine a given research problem. However,
the scope of conceptual frameworks is usually applicable only to the specific
research problem for which it was created. Application to other research
problems may be limited. Since theoretical frameworks refer to the application
of theories, they tend to have a much wider scope of use beyond one research
problem. Table 4.1 summarises the key differences between theoretical and
conceptual frameworks. These differences are embedded in their genesis,
conceptual meanings, how they each relate to the process of literature review,
the methodological approaches they evoke and their scope of application. Once
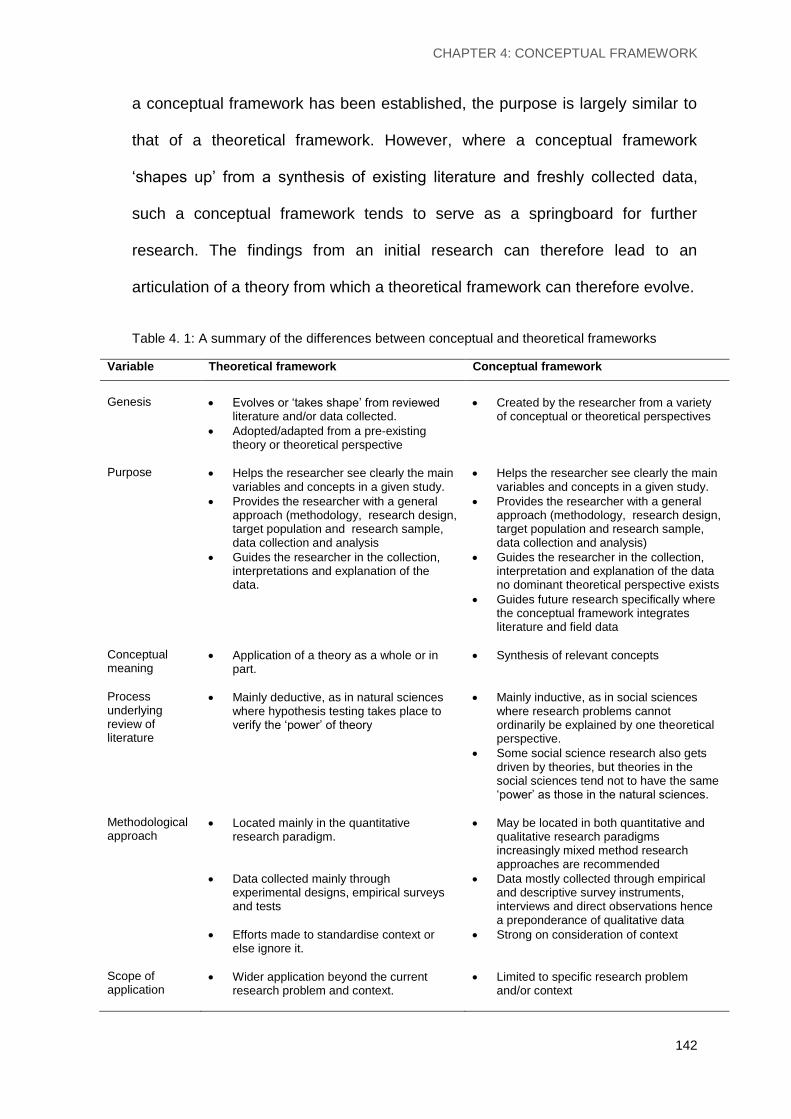
CHAPTER 4: CONCEPTUAL FRAMEWORK
142
a conceptual framework has been established, the purpose is largely similar to
that of a theoretical framework. However, where a conceptual framework
‘shapes up’ from a synthesis of existing literature and freshly collected data,
such a conceptual framework tends to serve as a springboard for further
research. The findings from an initial research can therefore lead to an
articulation of a theory from which a theoretical framework can therefore evolve.
Table 4. 1: A summary of the differences between conceptual and theoretical frameworks
Variable Theoretical framework Conceptual framework
Genesis
Evolves or ‘takes shape’ from reviewed literature and/or data collected.
Adopted/adapted from a pre-existing theory or theoretical perspective
Created by the researcher from a variety of conceptual or theoretical perspectives
Purpose Helps the researcher see clearly the main variables and concepts in a given study.
Provides the researcher with a general approach (methodology, research design, target population and research sample, data collection and analysis
Guides the researcher in the collection, interpretations and explanation of the data.
Helps the researcher see clearly the main variables and concepts in a given study.
Provides the researcher with a general approach (methodology, research design, target population and research sample, data collection and analysis)
Guides the researcher in the collection, interpretation and explanation of the data no dominant theoretical perspective exists
Guides future research specifically where the conceptual framework integrates literature and field data
Conceptual meaning
Application of a theory as a whole or in part.
Synthesis of relevant concepts
Process underlying review of literature
Mainly deductive, as in natural sciences where hypothesis testing takes place to verify the ‘power’ of theory
Mainly inductive, as in social sciences where research problems cannot ordinarily be explained by one theoretical perspective.
Some social science research also gets driven by theories, but theories in the social sciences tend not to have the same ‘power’ as those in the natural sciences.
Methodological approach
Located mainly in the quantitative research paradigm.
Data collected mainly through experimental designs, empirical surveys and tests
Efforts made to standardise context or else ignore it.
May be located in both quantitative and qualitative research paradigms increasingly mixed method research approaches are recommended
Data mostly collected through empirical and descriptive survey instruments, interviews and direct observations hence a preponderance of qualitative data
Strong on consideration of context
Scope of application
Wider application beyond the current research problem and context.
Limited to specific research problem and/or context

CHAPTER 4: CONCEPTUAL FRAMEWORK
143
Having examined the key differences between a theoretical framework and a
conceptual framework it is evident that a conceptual framework is more
appropriate than a theoretical framework for the purpose of this research. The
research therefore adopts the use of a conceptual framework to investigate the
impact of knowledge management in reducing the cost of poor quality in
construction. It is also important to note that this research process commences
with an inductive approach (qualitative method) followed by a deductive
approach (quantitative method). The main difference between inductive and
deductive approaches to research is that while a deductive approach is aimed
at testing theory, an inductive approach is concerned with the generation of new
theory emerging from data.
A deductive approach usually begins with a hypothesis while an inductive
approach will usually use research questions to narrow the scope of the study.
For deductive approaches the emphasis is generally on causality while for
inductive approaches the aim is usually focused on exploring new phenomena
or examining previously researched phenomena from a different perspective.
While inductive approaches are generally associated with qualitative research
and a conceptual framework, deductive approaches are more commonly
associated with quantitative research and a theoretical framework. Although this
research adopts mixed method approach, utilising a conceptual framework is
deemed appropriate particularly as the research commences with qualitative
method.
CHAPTER 4: CONCEPTUAL FRAMEWORK
144
4.4 DESIGN OF THE CONCEPTUAL FRAMEWORK FOR THE
STUDY
The conceptual framework (Figure 4.3) consists of 7 components which are
labelled from [A] to [G]. The conceptual framework has been developed as an
output from the critical review of literature on KM and COPQ.
Component [A] forms the core of the study which stems from findings from
literature that COPQ is prevalent on projects regardless of project type and size.
It was also rooted in the findings that construction projects are still plagued with
inefficiencies, repetition of mistakes and lack of lessons learnt thereby
contributing to additional project costs. The study therefore suggests that there
is a link between KM and COPQ. This is reflected in this component of the
conceptual framework. The component suggests through arrow diagrams that:
(1) poor KM leads to prevalent COPQ, which appears to be the current status
quo (2) optimised KM leads to reduced COPQ. The challenge therefore is to
explore how KM can be optimised to reduce COPQ i.e. bridging the gap
between poor KM and optimised KM to reduce COPQ.
Component [B] shows the KM levels identified from literature review namely;
personal, organisational, project and industry. KM entails harnessing and
integrating knowledge across the interfaces of the four levels. Component [C]
shows the contributory factors to COPQ identified from literature review namely;
errors and omissions, design changes, and poor skills. These three factors were
found to contribute to the internal failure cost element of COPQ. Since external
failure costs results from internal failure costs, the conceptual idea therefore is
that reducing internal failure cost automatically reduces external failure costs.

CHAPTER 4: CONCEPTUAL FRAMEWORK
145
[D] Qualitative research method
Semi-structured interviews with selected industry experts
Reduced
COPQ
Optimised KM
Poor KM
Prevalent
COPQ
3. Poor skills
2. Design changes
1. Errors and omissions
Industry knowledge management
Project knowledge management
Organisational knowledge management
Personal knowledge management
[C] Contributory factors to COPQ
(Internal failure costs)
[B] Knowledge
management levels
3. How can knowledge
management be optimised to reduce the cost of poor
quality?
Continuous improvement
Increased customer satisfaction
Increased profitability
Increased revenue for growth
Improved project performance
Improved reputation
Increased competitive advantage
[E] Quantitative research method
Industry-wide questionnaire survey
2. What is the impact of knowledge management in reducing the cost of poor
quality based on the contributory factors?
[G] Result
Test if the findings from qualitative study can be generalised on the impact of KM in reducing COPQ
1. What are the contributory factors to the cost of poor
quality in practice?
[A]
[F] Output
Evaluate KM framework
for reducing COPQ
Present KM framework
for reducing COPQ

CHAPTER 5: RESEARCH METHODOLOGY
146
Figure 4. 3: Initial conceptual framework on the impact of KM on COPQ
The focus of study was therefore based on reducing internal failure costs.
Component [D] connects components [B] and [C] through qualitative research to
investigate the impact of [B] on [C]. This involves semi-structured interviews with
selected industry experts to investigate the impact of KM on COPQ. This component
is derived from the key research questions to be addressed which are stated as
follows: (1) What are the contributory factors to the cost of poor quality in practice?
(2) What is the impact of knowledge management in reducing the cost of poor quality
based on the contributory factors? (3) How can knowledge management be
optimised to reduce the cost of poor quality? There are also follow-on questions
attached to the key questions. The output from component [D] leads to the
modification of the conceptual framework, and the generation of propositions,
hypothesis or further research questions on the impact of KM in reducing COPQ.
Component [E] tests the output from component [D] through an industry-wide
questionnaire survey across the UK, the output of which leads to component [F] i.e.
the development of a KM framework for reducing COPQ. Component [F] presents
and validates the framework. The purpose of the framework is to present a holistic
approach to optimising KM to reduce COPQ as shown in component [A] with
measureable results shown in Component [G]. The results include increased
customer satisfaction, improved project performance, increased profitability,
increased revenue for growth, improved industry reputation and increased
competitive advantage for organisations in the supply chain. The conceptual
framework can be ‘fine-tuned’ through continuous improvement in other to constantly
find ways to further reduce COPQ. The conceptual framework is expected to evolve
as the study progresses.

CHAPTER 5: RESEARCH METHODOLOGY
147
4.5 SUMMARY OF CHAPTER 4
This chapter synthesised the body of work on knowledge management and the cost
of poor quality. It examined the links between knowledge management and the
prevalent cost of poor quality on construction projects. It identified the issues,
challenges, knowledge gaps and key research questions on the impact of knowledge
management in reducing the cost of poor quality. One of the knowledge gaps is that
no research has been found to date that has investigated the impact of knowledge
management on the cost of poor quality in construction. While the cost of poor
quality may be regarded as a quality management problem the study takes a
different approach of exploring the link between knowledge management and the
cost of poor quality. This contributes to the novelty of the research. The chapter
presented the key research questions together with a matrix showing the areas of
inquiry. The research questions posed were: (1) what are the contributory factors to
the cost of poor quality in practice? (2) What is the impact of knowledge
management in reducing the cost of poor quality based on the contributory factors?
(3) How can knowledge management be optimised to reduce the cost of poor
quality? The chapter distinguished between a theoretical framework and a
conceptual framework. It also presented an initial conceptual framework for the study
which is subject to modifications at later stages of the study.

CHAPTER 5: RESEARCH METHODOLOGY
148
CHAPTER 5
RESEARCH METHODOLOGY
This chapter discusses the methodology used for the research. It provides an
overview of the methodological process comprising of literature review, conceptual
framework, the research approach and the validation of framework. It examines
different research approaches and their underlying philosophical assumptions. It
explores different research designs or strategies of inquiry available for research
including methods for data collection and analysis. It discusses the selection and
justification of the research approach, research design and research methods for this
study. The chapter also discusses the sampling strategies and ethical issues
considered for the research.
5.1 OVERVIEW OF RESEARCH METHODOLOGY
Research methodology has been defined as the principles underlying the methods
by which research can be carried out (Creswell, 2007; Fellows and Liu, 2008). It is a
general approach to which research is undertaken (Silverman, 2008). Research
methodology thus covers the entire process of a study. It demonstrates how
research can be carried out and how data can be gathered and analysed to achieve
its aims and objectives. It refers to the principles and procedures of logical thought
processes, which are applied to a scientific investigation (Fellows and Liu, 2008).
The methodology for this study includes literature review, conceptual framework,
research approach, research methods of data collection and analysis, validation of
framework and conclusion. The literature review aspect of this study examined the

CHAPTER 5: RESEARCH METHODOLOGY
149
critical points of current body of work in the areas of knowledge management and
the cost of poor quality.
According to Marshall and Rossman (2006), literature review accomplishes several
purposes including gaining insight into previous work being done in the area whilst
also filling the gaps or extending prior studies. Information sources for the literature
review included printed journals, online gateways and databases, online journals,
reference texts, conference papers and various books in the context of the topic.
Some of the sources used for literature review include; Architectural Engineering and
Design Management (AEDM), Journal of Construction Engineering and
Management, Quality Management Journal, Construction Management and
Economics (CME), American Society for Quality (ASQ), International Journal of
Productivity and Quality Management, Journal of Quality Management, International
Journal of Project Management (IJPM), Engineering, Construction and Architectural
Management (ECAM), Journal of Information and Knowledge Management, Journal
of Knowledge Management.
Other sources include industry reports from organisations such as; the Commission
for Architecture and the Built Environment (CABE), National Audit Office, Office of
National Statistics, Department for Business Innovation and Skills, Office of
Government Commerce, Constructing Excellence and Glenigan. The output from
literature review was used to develop the conceptual framework which integrates
knowledge management with the cost of poor quality and sets the direction for data
collection, analysis and validation. The literature review and outputs have been
covered in chapters 2 and 3; the conceptual framework was covered in chapter 4;

CHAPTER 5: RESEARCH METHODOLOGY
150
the research approach including research methods of data collection and analysis is
covered in the current chapter.
5.2 RESEARCH APPROACHES
Research approaches systematically describe the activities to be undertaken in order
to achieve the research aims and objectives. According to Creswell (2014), research
approaches are plans and procedures for research that span the steps from broad
assumptions to detailed methods of data collection, analysis and interpretation. This
involves several decisions which are informed by: (1) the philosophical assumptions
brought to the study by the researcher, (2) the procedures of inquiry or research
designs, and (3) specific research methods of data collection, analysis and
interpretation (Punch, 1999; Fellows and Liu, 2003; Neuman, 2006; Creswell, 2014).
The selection of a research approach is based on the nature of the research problem
or issue being addressed. It is also based on the researcher’s personal experiences
as well as the audiences for the study. According to Creswell (2014) there are three
types of research approaches: (1) Qualitative research approach (2) Quantitative
research approach (3) Mixed methods approach.
5.2.1 Qualitative research approach
Qualitative research approach deals with the procedure for exploring and
understanding the meaning individuals or groups ascribe to a social or human
problem. It involves emerging questions and procedures in which data is typically
collected in the participant’s setting, with data analysis inductively building from
particular to general themes, and the researcher making interpretations of the

CHAPTER 5: RESEARCH METHODOLOGY
151
meaning of the data (Creswell, 2013). In other words qualitative research is based
on text rather than numbers. Moreover, Kaplan and Maxwell (1994) argued that it is
essential to understand the informant’s point of view and the particular social and
institutional context at play and such is not possible when textual data are quantified.
Maxwell (1998) further argued that the strengths of qualitative research are founded
on its inductive process, focus on specific situations or people, and emphasis on
words rather than numbers.
5.2.1.1 Philosophical assumptions underlying a qualitative approach
Constructivism or social constructivism, often referred to as interpretivism, underlies
a qualitative approach to research (Berger and Luekmann, 1967; Lincoln and Guba,
1985; Crotty, 1998; Mertens, 2010). One of the philosophical assumptions is that
humans construct meanings as they engage with the world they are interpreting.
Qualitative researchers therefore tend to use open-ended questions so that the
participants can share their views. Another assumption is that humans engage with
their world and make sense of it based on their historical and social perspectives.
Thus, qualitative researchers seek to understand the context or setting of the partici-
pants through visiting this context and gathering information personally. They also
interpret what they find, an interpretation shaped by the researcher’s own
experiences and background.
The basic generation of meaning is always social, arising in and out of interaction
with a human community. The process of qualitative research is largely inductive; the
inquirer generates meaning from the data collected in the field. Further to the
constructivist worldview is the transformative worldview which holds that research
inquiry needs to be intertwined with politics and a political change agenda to confront

CHAPTER 5: RESEARCH METHODOLOGY
152
social oppression at whatever levels it occurs (McTaggart, 2000; Neuman, 2009;
Mertens, 2009, 2010). Thus, the research contains an action agenda for reform that
may change lives of the participants, the institutions in which individuals work or live,
and the researcher’s life. Moreover, specific issues need to be addressed that speak
to important social issues of the day, issues such as empowerment, inequality,
oppression, domination, suppression, and alienation. The transformative worldview
or paradigm places central importance on the study of lives and experiences of
diverse groups that have traditionally been marginalised. Of special interest for these
diverse groups is how their lives have been constrained by oppressors and the
strategies that they use to resist, challenge, and subvert these constraints. In
studying these diverse groups, the research focuses on inequities based on gender,
race, ethnicity, disability, sexual orientation, and socioeconomic class that result in
asymmetric power relationships. The research in the transformative worldview links
political and social action to these inequities. Transformative research uses a
program theory of beliefs about how a program works and why the problems of
oppression, domination, and power relationships exist.
5.2.1.2 Research designs for qualitative approach
There are different research designs available for different research aims. Creswell
(2013) identified five qualitative research designs which encompass a continuum
from narrow to broad focus. These research designs were classified as; narrative,
ethnography, phenomenology, case study and grounded theory. Narrative research
involves the study of lives and experiences of individuals which are retold as
chronological narratives. A narrative typically focuses on gathering data from stories
and discussing the meaning of the experiences in them. Examples of narratives

CHAPTER 5: RESEARCH METHODOLOGY
153
include biographies and autobiographies. Some advocates of narrative research
(e.g. Clandinin and Connelly, 2000; Garson, 2008) assert that it is an empowering
social science approach insofar as it affords respondents the opportunity to articulate
their view points.
Ethnography research relates to the study of an intact cultural group in a natural
setting over prolonged period of time, using mainly observation methods (Creswell,
2013). Ethnography is considered one of the most in-depth research methods
possible as long involvement of the researcher affords the opportunity to observe not
only what people say they do but what they actually do (LeCompte and Schensul,
1999). It is a flexible research process and typically evolves contextually in response
to the realities encountered in the field setting (Walcott, 2008; Fetterman 2010).
Phenomenological research involves the study of ways a person’s world is formed in
part by the person who lives it (Fischer and Wertz, 2002). It is therefore concerned
with the ‘lived experiences’ of people regarding a phenomenon of interest and
requires the researcher to ‘bracket’ taken-for-granted assumptions and unusual ways
of perceiving the phenomenon. The emphasis often is to describe personal
perspectives and interpretations rather than to explain them. Phenomenology
typically involves conducting interviews (Moustakas, 1994; Giorgi, 2009)
Case study encompasses the holistic, in-depth study of a phenomenon typically
using a variety of data sources and procedures (Stake, 1995; Yin, 2009). Case
studies are most useful when the boundaries between phenomenon and context are
not clearly evident. Cases are bounded by time and activity, and researchers collect
detailed information using a variety of data collection procedures over a sustained
CHAPTER 5: RESEARCH METHODOLOGY
154
period of time (Stake, 1995; Yin, 2009, 2012). Yin (2012) provided a useful treatise
on design and implementation of case study research.
Grounded theory is a systematic process of generating theory that explains, at a
broad conceptual level, process, an action or interaction about a substantive topic,
grounded in the views of the participants in the study (Creswell, 2008). This often
involves multiple stages of data collection, constant refinement of findings and the
continuous search for interrelationships among emerging categories of information
(Corbin and Strauss, 2008). Grounded research often requires theoretical sampling
in which the emerging patterns of information dictate subsequent information
requirements and hence research sites or cases.
5.2.1.3 Research methods for qualitative approach
Data is usually collected in the field at the site where participants experience the
issue or problem under study. This up close information, gathered by actually talking
directly to people and seeing them behave and act within their context, is a major
characteristic of qualitative method. Data is typically collected by the researcher
through examining documents, observing behaviour or interviewing participants. The
data is reviewed and organised into categories or themes that cut across all of the
data sources. This involves building their patterns, categories and themes from the
bottom up by organising the data into increasingly more abstract units of information.
This inductive process illustrates working back and forth between themes and the
database until a comprehensive set of themes is established by the researcher. The
entire qualitative research process is focused on learning the meaning that the
participants hold about the problem or issue not the meaning that the researchers
bring to the research or writers express in literature. The research process for

CHAPTER 5: RESEARCH METHODOLOGY
155
qualitative research is ‘emergent’ i.e. the initial plan for research cannot tightly be
prescribed and all phases of the process may change or shift during and after data
collection.
5.2.2 Quantitative research approach
Quantitative research approach involves the procedure for testing objective theories
by examining the relationship among variables. These variables, in turn, can be
measured, typically on instruments, so that numerical data can be analysed using
statistical procedures (Creswell, 2014). The approach deals with research problems
by using mathematical and statistical techniques to identify facts and causal
relationships. It therefore adheres to the practices and norms of the natural scientific
model (Fitzgerald and Howcroft, 1998; Naoum, 2007). Quantitative research
approach is therefore deductive in nature as it focuses on developing theories or
hypotheses, operationalising concepts and subjecting them to rigorous empirical
testing.
5.2.2.1 Philosophical assumptions underlying quantitative approach
The post-positivist assumptions have represented the traditional form of research,
and these assumptions hold true more for quantitative research than qualitative
research. This worldview is sometimes called the scientific method, or doing science
research. It is also called positivist research or empirical research. The term ‘post--
positivism’ is preferred for use in this study because it represents the thinking after
positivism, challenging the traditional notion of the absolute truth of knowledge
(Phillips and Burbules, 2000; Creswell, 2014) and recognising researchers cannot be
positive about claims of knowledge when studying the behaviour and actions of

CHAPTER 5: RESEARCH METHODOLOGY
156
humans. In a post-positive worldview, knowledge is conjectural and antifoundational
i.e. absolute truth can never be found. Thus, evidence established in research is
always imperfect and fallible. It is for this reason that researchers state that they do
not prove a hypothesis; instead, they indicate a failure to reject the hypothesis
(Phillips and Burbules, 2000). Research, in this case, is the process of making
claims and then refining or abandoning some of them for other claims more strongly
warranted. Most quantitative research, for example, start with the test of a theory
where data, evidence, and rational considerations shape knowledge.
5.2.2.2 Research designs for quantitative approach
Quantitative research designs can be classified into experimental and non-
experimental (surveys). Experiments are further classified into true or classical
experiments and quasi-experiments. Experimental research involves the postulation
of a priori hypotheses, which are then tested empirically. The true or classical
experiment derives its logic from manipulating, comparing, and looking for
differences among, subjects. Thus, it is also known as ‘the method of difference’.
The main focus is to create causal relationships between the independent and the
dependent variables. By manipulating the incidence of the independent variable and
controlling the effects of the extraneous variables, causal relationships are
developed to explain the phenomenon. To satisfy requirements for internal validity, it
is important to ensure that control and experimental groups are equivalent. This is
achieved through random sampling or the use of systematic controls.
Quasi-experiments, while regarded as unscientific and unreliable by pure scientists,
the method is nevertheless useful in social sciences particularly in measuring
social variables. The inherent weaknesses in the methodology do not undermine
CHAPTER 5: RESEARCH METHODOLOGY
157
the validity of the data, as long as they are recognised and allowed for during the
whole experimental process. Quasi-experimental design involves selecting groups,
upon which a variable is tested, without any random pre-selection processes.
Non-experimental (surveys) designs are those in which standardised questionnaire
is designed and administered to measure the thoughts, attitudes, feelings or
behaviours of a sample drawn from a population. However, the choice and design of
a survey instrument will generally depend on the aims of the research, that is,
whether it is: analytic, where it investigates causal relationships between
phenomena; descriptive, where it assesses the attributes of a population of subjects,
or exploratory, where it tests grounded theory using structured questionnaire as part
of the study plan (Gill and Johnson, 1997).
5.2.2.3 Research methods for quantitative approach
The experimental method is usually taken to be the most scientific of all methods,
perhaps because the non-experimental method lack control over situation. The
experimental method therefore is a means of trying to overcome this problem. An
experimental method studies cause and effect. It differs from the non-experimental
method in that it involves the deliberate manipulation of one variable, while trying to
keep all other variables constant. Experiments can be carried out in the laboratory,
on the field or in natural environments. In the case of surveys, a typical survey
method can indicate whether the survey will be cross-sectional with the data
collected at one point in time of whether it will be longitudinal with data collected over
time; specify form of data collection. Survey methods can take several forms which
include a written document (questionnaire) in which the respondent self-completes or
a document administered face-to-face or through a telephone interview by the

CHAPTER 5: RESEARCH METHODOLOGY
158
researcher. The data collected may also involve creating a web-based or internet
survey and administering it online (Nesbary, 2000; Sue and Ritter, 2007). Surveys
are, however prone to three main flaws (Mitchell and Jolley, 2001): researcher not
knowing what he or she wants; poor construct validity of measures; and poor
external validity when biased samples are used. These flaws however can be
mitigated thoughtful planning and design of surveys. In this regard several authors
(e.g. Fowler, 2002; Scheuren, 2004; Czaja and Blair, 2005; Dillman, 2007) provide
useful guidance.
5.2.3 Mixed methods approach
Although most researchers utilise either quantitative or qualitative approaches in
their work, it is becoming commonplace to combine both methods in a single study.
The combination of the two approaches is known as mixed methods approach
(Creswell and Piano Clark, 2011). The core assumption is that the combination of
qualitative and quantitative approaches provides a more complete understanding of
a research problem than either approach alone.
5.2.3.1 Philosophical assumptions underlying mixed methods approach
Mixed methods approach stems from a pragmatist worldview which arises out of
actions, situations, and consequences rather than antecedent conditions as in post-
positivism (Patton, 1990; Cherryholmes, 1992). Instead of focusing on methods,
researchers emphasise the research problem and use all approaches available to
understand the problem (Rossman and Wilson, 1985). As a philosophical
underpinning for mixed methods approach, Morgan (2007), Patton (1990), and
Tashakkori and Teddlie (2010) convey its importance for focusing attention on the

CHAPTER 5: RESEARCH METHODOLOGY
159
research problem and then using pluralistic approaches to derive knowledge about
the problem. Pragmatism therefore is not committed to any one system of philosophy
and reality neither does it see the world as an absolute unity. Thus, for the mixed
approach to research, pragmatism opens the door to multiple methods, different
worldviews, and different assumptions, as well as different forms of data collection
and analysis.
5.2.3.2 Research designs for mixed methods approach
There are different variations or sub-types of mixed methods used in research, three
of which are regarded as primary (Creswell and Piano Clark, 2011; Creswell, 2008,
2014). They are: convergent parallel mixed methods; explanatory sequential mixed
methods; and exploratory sequential mixed methods.
Convergent parallel mixed method is a form of mixed methods design in which the
researcher converges or merges quantitative and qualitative data in order to provide
a comprehensive analysis of the research problem. In this design, the investigator
typically collects both forms of data at roughly the same time and then integrates the
information in the interpretation of the overall results. Contradictions or incongruent
findings are explained or further probed in this design.
Explanatory sequential mixed method is that in which the researcher first conducts
quantitative research, analyses the results and then builds on the results to explain
them in more detail with qualitative research. It is considered explanatory because
the initial quantitative data results are explained further with the qualitative data. It is
considered sequential because the initial quantitative phase is followed by the
qualitative phase. This type of design is popular in fields with a strong quantitative

CHAPTER 5: RESEARCH METHODOLOGY
160
orientation, but it presents challenges of identifying the quantitative results to further
explore and the unequal sample sizes for each phase of the study.
Exploratory sequential mixed method is the reverse sequence from the explanatory
sequential design. In the exploratory sequential approach the researcher first begins
with a qualitative research phase and explores the views of participants. The data
are then analysed, and the information used to build into a second, quantitative
phase. The qualitative phase may be used to build an instrument that best fits the
sample under study, to identify appropriate instruments to use in the follow-up quan-
titative phase, or to specify variables that need to go into a follow-up quantitative
study. The above three basic designs can then be used in more advanced mixed
methods designs such as transformative mixed method, embedded mixed method,
and multiphase mixed method.
5.2.3.3 Research methods for mixed approach
Mixed research method involves collecting both qualitative and quantitative data,
integrating the two forms of data, and using distinct designs that may involve
philosophical assumptions and theoretical frameworks. Data can be collected
concurrently or sequentially and only the data is integrated at one or more stages in
the process of the research (Teddlie and Tashakkori, 2010). This approach can also
be used to reduce or eliminate disadvantages of each individual approach while
gaining the advantages of each and of the combination (Fellows and Liu, 2008).
Researchers often use the terms ‘mixed methods’, ‘multi-methods’ and ‘triangulation’
synonymously, however the terms have differences in meaning. According to Morse
(2003), a multi-method design is different from a mixed method research in the
sense that is involves qualitative and quantitative projects that are relatively

CHAPTER 5: RESEARCH METHODOLOGY
161
Table 5. 1: Summary of research approaches (Sources: Creswell and Piano Clark, 2013, Creswell, 2014)
Qualitative approach Quantitative approach Mixed methods approach
Philosophical assumptions Constructivist/transformative
knowledge claims
Post-positivist knowledge claims
Pragmatic knowledge claims
Research design Phenomenology, grounded theory,
ethnography, case study and narrative Surveys and experiments Sequential, concurrent, and
transformative
Research methods
Open-ended questions, emerging approaches, text or image data
Closed-ended questions, instrument based questions, predetermined approaches
Both open and closed ended questions, both emerging and predetermined approaches
Research instruments E.g. interview template
E.g. survey questionnaire E.g. interview template/survey
questionnaire
Research practices
Collects participant meanings
Focus on a single concept or phenomenon
Brings personal values into the study
Studies the context or setting of participants
Validates the accuracy of findings
Makes interpretations of the data
Creates an agenda for change or reform
Collaborates with the participants
Tests or verifies theories or explanations
Identifies variables to study
Relates variables in questions or hypotheses
Uses standards of validity and reliability
Observes and measures information numerically
Uses unbiased approaches
Employs statistical procedures
Collects both quantitative and qualitative data
Develops a rationale for mixing
Integrates the data at different stages of inquiry
Presents visual pictures of the procedures in the study
Employs the practices of both qualitative and quantitative research

CHAPTER 5: RESEARCH METHODOLOGY
162
complete on their own and then used together to form essential components of
one research program. Thus each study is planned and conducted to answer a
particular sub-question, and the results of the research triangulated to form a
comprehensive whole. Mixed methods utilises various combinations of data
collection methods associated with both qualitative and quantitative research.
Qualitative data tends to be open-ended without predetermined responses while
quantitative data usually includes closed-ended responses such as found on
questionnaires.
5.3 SELECTION OF RESEARCH APPROACH FOR THIS STUDY
The research approach for this study situates within the methodological process
shown in Figure 5.1. The process constitutes three phases: (1) theoretical work
(2) fieldwork (3) evaluation and conclusion. The theoretical work covers
objectives 1 – 3 of the study and chapters 1 – 5 of the thesis. Chapters 1 – 4
have already been discussed. The current chapter discusses the research
methodology, particularly the selection of research approach which forms the
basis for Phase 2 (fieldwork) of the study. Phase 2 discusses the fieldwork in
details covering objectives 4 and 5 of the study and chapters 6 – 7 of the thesis.
Phase 3 discusses the evaluation and conclusion of the study which covers
objectives 6 and 7 of the study and chapters 8 – 9 of the thesis. Having critically
examined the three types of research approaches (qualitative, quantitative and
mixed methods), mixed method approach was selected for the study. This is
due to the inductive and deductive nature of the research problem. The details
of the rationale for selecting a mixed method approach are discussed in
Sections 5.3.1, 5.3.2 and 5.3.3.
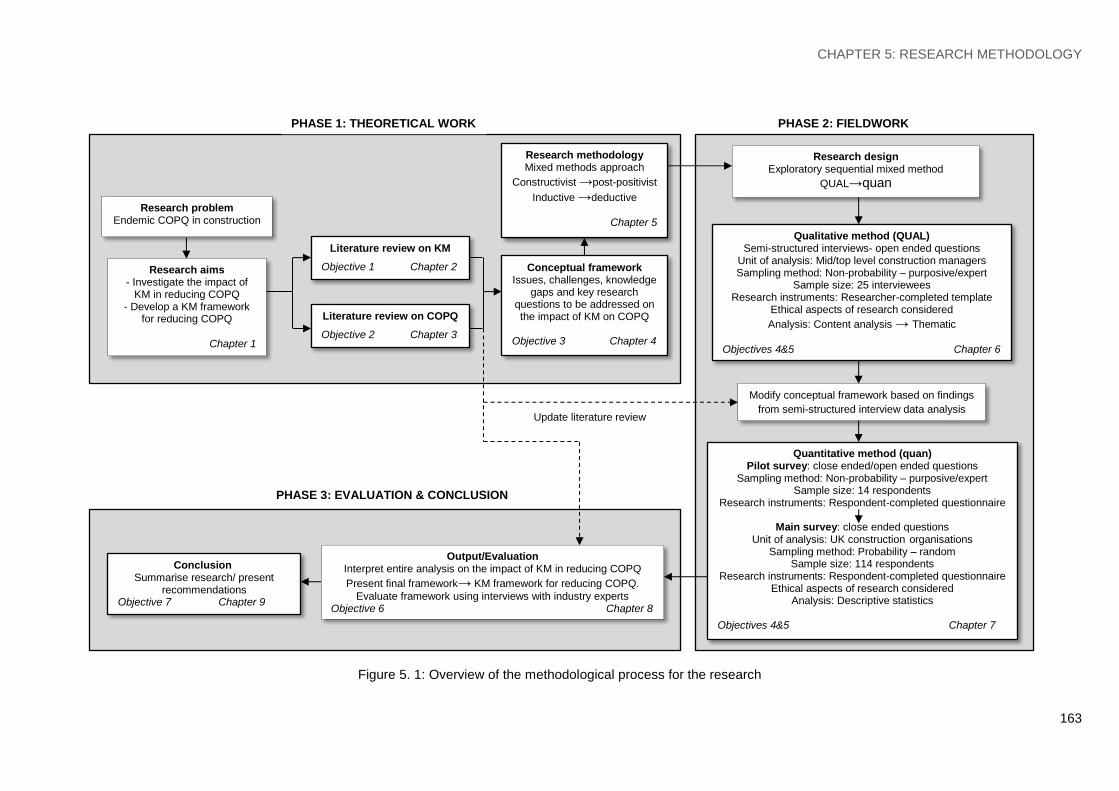
CHAPTER 5: RESEARCH METHODOLOGY
163
Figure 5. 1: Overview of the methodological process for the research
Research problem Endemic COPQ in construction
Research aims - Investigate the impact of
KM in reducing COPQ - Develop a KM framework
for reducing COPQ
Chapter 1
Literature review on KM
Objective 1 Chapter 2
Literature review on COPQ
Objective 2 Chapter 3
Conceptual framework Issues, challenges, knowledge
gaps and key research questions to be addressed on the impact of KM on COPQ
Objective 3 Chapter 4
Research methodology Mixed methods approach
Constructivist →post-positivist
Inductive →deductive
Chapter 5
PHASE 1: THEORETICAL WORK PHASE 2: FIELDWORK
Research design Exploratory sequential mixed method
QUAL→quan
Qualitative method (QUAL) Semi-structured interviews- open ended questions
Unit of analysis: Mid/top level construction managers Sampling method: Non-probability – purposive/expert
Sample size: 25 interviewees Research instruments: Researcher-completed template
Ethical aspects of research considered
Analysis: Content analysis → Thematic
Objectives 4&5 Chapter 6
Modify conceptual framework based on findings
from semi-structured interview data analysis
Quantitative method (quan) Pilot survey: close ended/open ended questions
Sampling method: Non-probability – purposive/expert Sample size: 14 respondents
Research instruments: Respondent-completed questionnaire
Main survey: close ended questions Unit of analysis: UK construction organisations
Sampling method: Probability – random Sample size: 114 respondents
Research instruments: Respondent-completed questionnaire Ethical aspects of research considered
Analysis: Descriptive statistics
Objectives 4&5 Chapter 7
Update literature review
Output/Evaluation Interpret entire analysis on the impact of KM in reducing COPQ
Present final framework→ KM framework for reducing COPQ.
Evaluate framework using interviews with industry experts Objective 6 Chapter 8
Conclusion Summarise research/ present
recommendations Objective 7 Chapter 9
PHASE 3: EVALUATION & CONCLUSION

CHAPTER 5: RESEARCH METHODOLOGY
164
According to Newman and Benz (1998), quantitative and qualitative strategies
should not be viewed as rigid, distinct categories, polar opposites or
dichotomies; instead they represent different ends on a continuum. A study can
tend to be more qualitative than quantitative or vice versa. A mixed method
approach therefore resides in the middle of this continuum because it
incorporates elements of both qualitative and quantitative strategies.
5.3.1 Philosophical assumptions underlying the study
The selection of mixed methods approach for this study was based on the
researcher’s pragmatic worldview which arises out of actions, situations, and
consequences rather than antecedent conditions encountered in post-positivist
view. The researcher holds the view that all available approaches must be
utilised to understand a research problem. As a philosophical underpinning for
mixed methods studies, Patton (1990), Morgan (2007), and Tashakkori and
Teddlie (2010) convey the importance of pragmatism in addressing a research
problem. Pragmatism is not committed to any one system of philosophy and
reality, thus applies to mixed methods research by drawing liberally from both
quantitative and qualitative assumptions.
However it is important to note that not all situations justify the use of mixed
method approach. There are times when qualitative approach may be best and
other times when quantitative approach may be best. The most significant
determinant for selecting a research approach is the nature of the research
problem itself. Creswell (2008) identified the categories of research problems
suited for mixed methods approach as those in which: (1) one data source may

CHAPTER 5: RESEARCH METHODOLOGY
165
be insufficient (2) results need to be explained (3) exploratory findings need to
be generalised (4) a second method is needed to enhance a primary method (5)
a theoretical stance need to be employed (6) an overall research objective can
be best addressed with multiple phases, or projects. This research situates
within the third category because the need exists to generalise exploratory
findings on the impact of KM in reducing COPQ on construction projects.
In this case, it is fundamental to explore qualitatively to learn what questions,
variables, theories, and so forth need to be studied and then follow up with a
quantitative study to generalise and test what was learned from the exploration.
The main research questions in this study are exploratory in nature e.g. what
are the contributory factors to the cost of poor quality on construction projects?
What is the impact of knowledge management in reducing the cost of poor
quality? How can knowledge management be optimised to reduce the cost of
poor quality? There are also several follow-on questions such as ‘why….?’, or
‘how…?’ These are open-ended exploratory questions requiring a qualitative
approach and then followed up with a quantitative approach to test whether the
qualitative findings can be generalised.
5.3.2 Selection of research design for the study
The research designs considered for this study were: convergent parallel mixed
methods; explanatory sequential mixed methods; exploratory sequential mixed
methods; transformative mixed methods, embedded mixed methods; and multi-
phase mixed methods. These mixed methods were discussed sub-section
5.2.3.2. Due to the nature of the research problem and the research questions

CHAPTER 5: RESEARCH METHODOLOGY
166
to be addressed on the impact of KM in reducing COPQ on construction
projects, exploratory sequential mixed methods was considered most suitable to
address the questions. In this design, the qualitative phase was used; firstly to
build an instrument that best fits the sample under study, secondly to identify
the appropriate research instruments for the follow-up quantitative phase, and
thirdly to specify variables that need to go into the quantitative study. Mixed
method designs are often described using notations which provides shorthand
labels and symbols that convey important aspects of mixed methods research
(Creswell, 2008; Tashakkori and Teddlie, 2010). The notation for exploratory
sequential mixed method is shown in Figure 5.2. ‘QUAL’ (in upper case)
represents qualitative method as a major element of the mixed methods while
‘quan’ (in lower case) represents the follow-up or supporting quantitative
methods
Figure 5.2: Notation for exploratory sequential mixed method design (Source:
Creswell, 2008)
5.3.3 Selection of research methods for the study
In accordance with the choice of research approach and research design, the
study utilises mixed methods for data collection, analysis and interpretation. The
selection of mixed methods for this study capitalises on the strengths of both
qualitative and quantitative methods while offsetting both of their weaknesses.
QUAL
quan
Data
Collection
QUAL
Data
Analysis
QUAL
Data
collection
Exploratory Sequential Design
quan
quan
Data
Analysis
Interpretation of
Entire Analysis
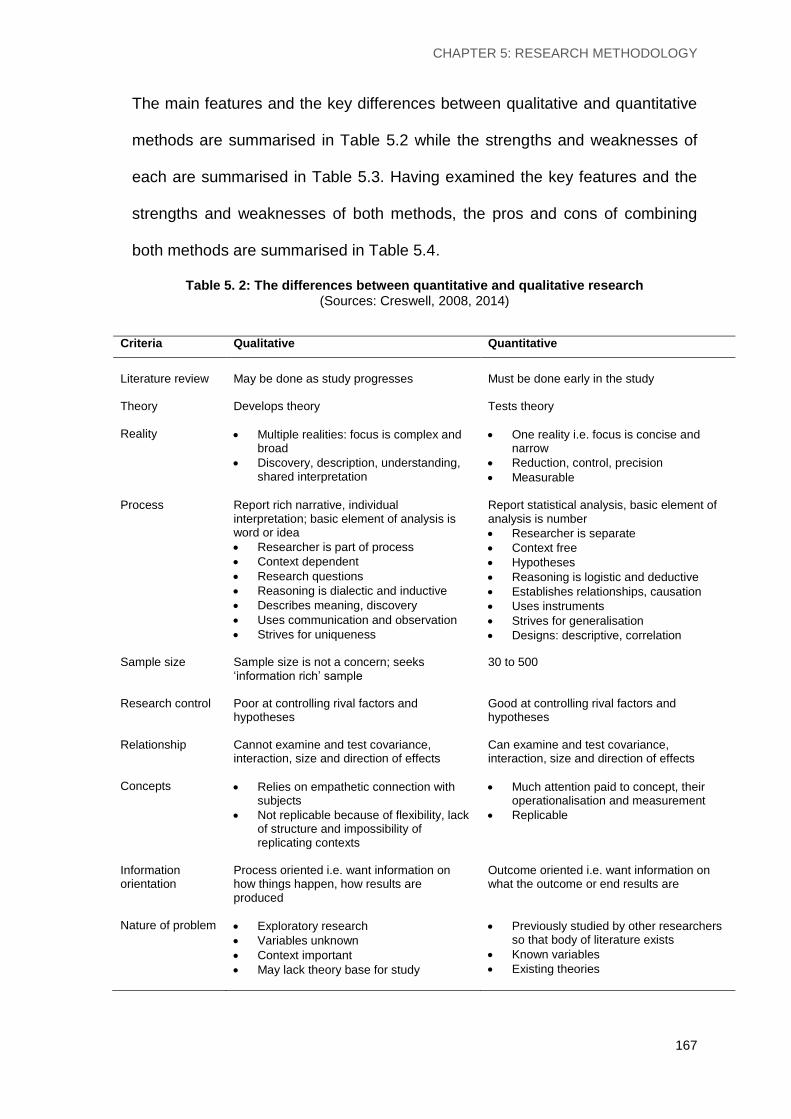
CHAPTER 5: RESEARCH METHODOLOGY
167
The main features and the key differences between qualitative and quantitative
methods are summarised in Table 5.2 while the strengths and weaknesses of
each are summarised in Table 5.3. Having examined the key features and the
strengths and weaknesses of both methods, the pros and cons of combining
both methods are summarised in Table 5.4.
Table 5. 2: The differences between quantitative and qualitative research (Sources: Creswell, 2008, 2014)
Criteria Qualitative Quantitative
Literature review
May be done as study progresses
Must be done early in the study
Theory Develops theory
Tests theory
Reality Multiple realities: focus is complex and broad
Discovery, description, understanding, shared interpretation
One reality i.e. focus is concise and narrow
Reduction, control, precision
Measurable Process Report rich narrative, individual
interpretation; basic element of analysis is word or idea
Researcher is part of process
Context dependent
Research questions
Reasoning is dialectic and inductive
Describes meaning, discovery
Uses communication and observation
Strives for uniqueness
Report statistical analysis, basic element of analysis is number
Researcher is separate
Context free
Hypotheses
Reasoning is logistic and deductive
Establishes relationships, causation
Uses instruments
Strives for generalisation
Designs: descriptive, correlation
Sample size Sample size is not a concern; seeks ‘information rich’ sample
30 to 500
Research control Poor at controlling rival factors and hypotheses
Good at controlling rival factors and hypotheses
Relationship Cannot examine and test covariance, interaction, size and direction of effects
Can examine and test covariance, interaction, size and direction of effects
Concepts Relies on empathetic connection with subjects
Not replicable because of flexibility, lack of structure and impossibility of replicating contexts
Much attention paid to concept, their operationalisation and measurement
Replicable
Information orientation
Process oriented i.e. want information on how things happen, how results are produced
Outcome oriented i.e. want information on what the outcome or end results are
Nature of problem Exploratory research
Variables unknown
Context important
May lack theory base for study
Previously studied by other researchers so that body of literature exists
Known variables
Existing theories

CHAPTER 5: RESEARCH METHODOLOGY
168
Table 5. 3: Strengths and weaknesses of qualitative and quantitative methods (Sources: Creswell, 2008; Tashakkori and Teddlie, 2010; Denzin and Lincoln, 2011; Creswell and Piano Clark, 2013)
Qualitative methods Quantitative methods
Strengths
Data is based on the participants’ own categories of meaning
Useful for studying a limited number of cases in depth
Provides individual case information
Can conduct cross-case comparisons and analysis
Provides understanding and description of people’s personal experiences of phenomena
Can describe in rich detail phenomena as they are situated and embedded in local contexts
Researcher almost always identifies contextual and setting factors as they relate to the phenomenon of interest
Researcher can use the primarily qualitative method of grounded theory to inductively generate a tentative but explanatory theory about a phenomenon
Can determine how participants interpret constructs
Data are usually collected in naturalistic settings in qualitative research
Qualitative approaches are especially responsive to local situations, conditions, and stakeholders’ needs
Qualitative researchers are especially responsive to changes that occur during the conduct of a study and may shift the focus of their studies as a result
Testing and validating already constructed theories about how and why phenomena occur
Testing hypotheses that are constructed before the data are collected
Can generalise research findings when the data are based on random samples of sufficient size
Can generalise a research finding when it has been replicated on many different populations and subpopulations
Useful for obtaining data that allow quantitative predictions to be made
The researcher may construct a situation that eliminates the confounding influence of many variables, allowing one to more credibly establish cause-and-effect relationships
Data collection using certain quantitative methods is relatively quick (e.g. telephone interviews)
Provides precise, quantitative, numerical data
Data analysis is relatively less time consuming (using statistical software)
The research results are relatively independent of the researcher (e.g. statistical significance)
It is useful for studying large numbers of respondents.
Weaknesses
Knowledge produced may not be generalised to other people or other settings (i.e., findings may be unique to the relatively few participants included in the research study)
It is difficult to make quantitative predictions.
It is more difficult to test hypotheses and theories with large participant pools
There may be perceived issues with the credibility of outcomes.
It generally takes more time to collect the data when compared to quantitative research.
Data analysis is often time consuming.
The results are more easily influenced by the researcher’s personal biases and idiosyncrasies
Researcher’s categories that are used might not reflect local constituencies’ understandings
Researcher’s theories that are used might not reflect local constituencies’ understandings
Researcher might miss out on phenomena occurring because of the focus on theory or hypothesis testing rather than on theory or hypothesis generation (called the confirmation bias) Knowledge produced might be too abstract and general for direct application to specific local situations, contexts, and individuals

CHAPTER 5: RESEARCH METHODOLOGY
169
Table 5. 4: Pros and cons of using mixed methods (Sources: Creswell, 2008; Fellows and Liu, 2008; Tashakkori and Teddlie, 2010; Creswell and
Piano Clark, 2013)
Pros of using mixed methods Cons of using mixed methods
Mixed method research provides strengths that offset the weakness of quantitative research e.g. quantitative research is arguably weak in understanding the context or setting in which people talk; the voices of participants are not directly heard; researchers are in the background and their own personal biases and interpretations are seldom discussed. Qualitative research therefore makes up for these weaknesses.
It also provides strengths that offset the weakness of qualitative research e.g. qualitative research is seen as deficient because of personal interpretations made by the researcher; the ensuing bias by this; and the difficulty in generalising findings to a large group because of the limited number of participants studied. Quantitative research therefore makes up for these weaknesses.
Mixed methods research provides more evidence for studying a research problem than either quantitative or qualitative research alone.
Researchers are enabled to use all of the tools of data collection available rather than being restricted to the types of data collection typically associated with quantitative research or qualitative research.
Mixed methods research helps answer questions that cannot be answered by quantitative or qualitative approaches alone. For example, ‘Do participant views from interviews and from standardised instruments converge or diverge?’ is a mixed methods question.
Mixed methods provides a bridge across the sometimes adversarial divide between quantitative and qualitative researchers as divisions between quantitative and qualitative research only serve to narrow the approaches and the opportunities for collaboration.
Mixed methods research encourages the use of multiple worldviews, or paradigms, rather than the typical association of certain paradigms with quantitative research and others for qualitative research.
Mixed methods research is ‘practical’ in the sense that the researcher is free to use all methods possible to address a research problem.
Mixed method is a realistic approach only if the researcher has the requisite skills. The researcher need to gain in-depth experiences first with both quantitative research and qualitative research separately before undertaking a mixed methods study. Researchers undertaking this approach to research need to have a solid grounding in mixed methods research.
Even when researchers have basic quantitative and qualitative research skills, mixed methods approach may not always be feasible given time and resources. These are important issues to consider early in the planning stage. Mixed methods studies may require extensive time, resources, and effort on the part of the researchers.
Mixed methods research is relatively new in terms of methodologies available to researchers. As such, others may not be convinced of or understand the value of mixed methods. Some may see it as a ‘new’ approach. Others may feel that they do not have time to learn a new approach to research, and some may object to mixed methods on philosophical grounds regarding the mixing of different philosophical positions.
Mixed methods studies can be difficult to locate in the literature, because only recently have researchers begun to use the term mixed methods in their titles or in their methods’ discussions. Also, some disciplines may use different terms for naming this research approach.
The arguments for using mixed methods (pros) for this study are stronger than
the arguments against (cons). The main arguments against mixed methods are
that it is tedious, time consuming, and requires researcher skills. However,

CHAPTER 5: RESEARCH METHODOLOGY
170
these have all been taken into consideration by the researcher and provisions
made to mitigate such effects. The strong argument in support of mixed
methods is that the qualitative method covers the aspects not covered by
quantitative methods and vice versa in the same research. Since the research
adopts exploratory sequential mixed methods, the details of the qualitative data
collection and analysis, and quantitative data collection and analysis are will be
discussed.
5.4 QUALITATIVE DATA COLLECTION AND ANALYSIS
Various options were considered for data collection for qualitative procedures
out of which one was selected for this study. The options include (Creswell,
2008; Denzin and Lincoln, 2011):
Observations; are those in which the researcher takes field notes on the
behaviour and activities of individuals at the research site. In these field
notes the researcher records in an unstructured or semi-structured way,
activities at the research site. Observers may also engage in roles varying
from a non-participant to a complete participant.
Documents; qualitative data can be collected through public documents
such as minutes of meetings and official reports, or private documents such
as personal journals and diaries.
Audio-visual materials; qualitative data can be collected from audio and
visual materials which can take the form of photographs, art objects,
videotapes or any forms of sound.
Interviews; qualitative data can be collected through interviews where the
researcher conducts face-to-face interviews with participants, interviews

CHAPTER 5: RESEARCH METHODOLOGY
171
participants by telephone or engages in focus group interviews with 6 to 8
interviewees in each group. Interview questions are usually few in number,
typically open-ended intended to elicit views and opinions from the
participants.
Interviews were selected as the preferred method for qualitative data collection
for the study because it provides the best avenue for participants to share their
experiences, expertise and inner perceptions with the interviewer. The nature of
the research questions for the study do not require observations of participants
or activities at the research site but are based on years of professional
experiences and insights of individual participants. The qualitative data
collection procedure for the study does not require direct abstractions from
public or private documents neither does it require direct abstractions from
audio-visual materials. Interviews were therefore selected as most appropriate
for the study. Based on the degree of structuring, interviews can be divided into
three categories: structured interviews, semi-structured interviews, and
unstructured interviews (Fontana and Frey, 2005; Denzin and Lincoln, 2011).
A structured interview has a set of predefined questions and the questions
would be asked in the same order for all respondents. This standardisation is
intended to minimise the effects of the instrument and the interviewer on the
research results. Structured interviews are similar to surveys except that they
are administered orally rather than in writing. Semi-structured interviews are
more flexible. An interview guide, usually including both closed-ended and
open-ended questions, is prepared but in the course of the interview, the
interviewer has a certain amount of room to adjust the sequence of the

CHAPTER 5: RESEARCH METHODOLOGY
172
questions to be asked and to add questions based on the context of the
participants’ responses. Unstructured interviews can be defined as interviews in
which neither the question nor the answer categories are predetermined.
Instead, they rely on social interaction between the interviewer and the
participant. Unstructured interviews have been described as a way to
understand the complex behaviour of people without imposing any a priori
categorisation which might limit the field of inquiry. In considering the most
appropriate option for the study, the strengths and weaknesses of each type of
interview were examined (See Table 5.5).
A useful concept in describing types of interview is the continuum; any particular
interview can be placed somewhere between ‘unstructured’ and ‘structured’.
The ‘unstructured’ pole is closer to observation, while the ‘structured’ use of
‘closed’ questions is similar to types of questionnaire. The nature of the
research problem and the research questions to be addressed situates
somewhere in the middle of the continuum therefore requiring semi-structured
interviews as a procedure of enquiry on the impact of knowledge management
in reducing the cost of poor quality in construction. Also having considered the
strengths and weaknesses of the three categories of interviews, semi-structured
interviews were selected as the most appropriate for the study because they
draw from the strengths of structured and unstructured interviews while
offsetting their weaknesses; in which case the ‘rigidity’ of structured interviews
and the ‘laxity’ of unstructured interviews are compensated for using semi-
structured interviews. The practicality of using semi-structured interviews were
duly considered, which include factors of time, cost, and the capabilities of the
researcher in handling interviews and interviewees.

CHAPTER 5: RESEARCH METHODOLOGY
173
Table 5. 5: Strengths and weaknesses of structured, semi-structured and unstructured interviews (Sources: Fontana and Frey, 2005; Denzin and Lincoln, 2011)
Structured interviews Semi-structured interviews Unstructured interviews
Strengths
Enables the researcher to examine the level of understanding a respondent has about a particular topic usually in slightly more depth than with a postal questionnaire.
Can be used as a form of formative assessment before using a second method e.g. observation or in-depth interviewing
All respondents are asked the same questions in the same way, making it easy to replicate the interview i.e. research method is easy to standardise
Provides a reliable source of quantitative data.
The researcher is able to contact large numbers of people quickly, easily and efficiently
It is relatively quick and easy to create, code and interpret.
There is a formal relationship between the researcher and the respondent with the latter knowing exactly what is required from them in the interview.
The researcher does not have to worry about response rates, biased samples and incomplete questionnaires
Positive rapport between interviewer and interviewee.
Very simple, efficient and practical way of getting data about things that can’t be easily observed
High validity: people are able to talk about something in detail and depth. The meanings behind an action may be revealed as the interviewee is able to speak for themselves with little direction from interviewer.
Complex questions and issues can be discussed or clarified
The interviewer can probe areas suggested by the respondent's answers, picking up information that had either not occurred to the interviewer or of which the interviewer had no prior knowledge.
Pre-judgement: problem of researcher pre-determining what will or will not be discussed in the interview is resolved. With few pre-set questions involved, the interviewer is not pre-judging what is and is not important information.
Easy to record interview e.g. video / audio tapes
The interaction between the participant and the interviewer allows for richer, more valid data. This is because the interviewer can ask follow up questions
Also the interaction allow the interviewer to develop a relationship with the participant which could mean they are more open and honest with their answers
Ambiguities in an answer can be probed to further understand the meaning of that answer
The interviewer can change the questions if, over the course of the study they think the hypothesis should change or they want to take the study in a new direction
Provides highly detailed and valid data.
Extremely flexible.
Natural and unrestricted, it can reveal more about the participant.
Weaknesses
Can be time consuming if sample group is very large because the researcher needs to be present during the interviews.
The quality and usefulness of the information is highly dependent upon the quality of the questions asked.
The interviewer cannot add or subtract questions.
Substantial amount of pre-planning is required.
The format of questionnaire design makes it difficult for the researcher to examine complex issues and opinions.
There is limited scope for the respondent to answer questions in any detail or depth
There is the possibility that the presence of the researcher may influence the way a respondent answers various questions, thereby biasing the responses. This is known as the interview effect.
Depends on the skill of the interviewer and articulacy of respondent.
Interviewer may give out unconscious signals or cues that guide respondent to give answers expected by interviewer.
Time consuming and expensive
Not very reliable: difficult to exactly repeat interviews; respondents may be asked different questions (non-standardised); samples tend to be small.
Depth of qualitative information may be difficult to analyse e.g. deciding what is and is not relevant; personal nature of interview may make findings difficult to generalise; respondents may effectively be answering different questions.
Validity: the researcher has no real way of knowing if the respondent is lying; the respondent may not consciously lie but may have imperfect recall.
With unstructured interviews a trained interviewer is required who can only interview one participant at a time, this means this method is time-consuming and costly
The interviewer does not ask exactly the same question every time, it can therefore be said that this method is less reliable
The changing questions also mean it is difficult to replicate the study.
The data is qualitative which means it is hard to analyse and compare with other pieces of data
Unstructured interviews can take up a great amount of time and cost for the interviews to take place.
Problem with reliability and generalising.

CHAPTER 5: RESEARCH METHODOLOGY
174
Finally the use of semi-structured interviews meets the overall research
objectives, the details of which are discussed in the next sub-section.
5.4.1 Design of the semi-structured interviews
The interviews were carefully designed to elicit the interviewees’ in-depth ideas,
opinions and responses to each research question together with the follow on
questions. A researcher-completed semi-structured interview template was
developed to ensure consistency in the approach to which the interviews were
conducted. The interview questions stems from extensive literature review and
the development of a conceptual framework on the impact of knowledge
management in reducing the cost of poor quality in construction. Four levels of
knowledge management relating to the construction industry were identified
from literature review namely; personal, organisational, project and industry.
Three main contributory factors to the cost of poor quality were also identified
from literature namely; design changes, errors and omissions, and poor skills.
The main research questions to be addressed are linked to knowledge
management levels and the contributory factors of the cost of poor quality.
These are therefore incorporated into the semi-structure interview template
thus: (1) What are the contributory factors to the cost of poor quality in practice?
(2) What is the impact of knowledge management in reducing the cost of poor
quality based on the contributory factors? (3) What are the barriers to the
optimisation of knowledge management to reduce the cost of poor quality? An
interview template was developed as a guide for the interviewer (researcher) in
order to ensure consistency in the way in which the questions are put forward to

CHAPTER 5: RESEARCH METHODOLOGY
175
the interviewees (See Appendix 4). The template consists of three sections.
Section A contains general information about the interviewee such as; how
many years of construction industry experience do you have? Which types of
construction projects have you worked on? What types of organisations have
you previously worked for?
Section B investigated the contributory factors to the cost of poor quality on
projects. The questions to be addressed under this section are related to the
contributory factors to the cost of errors and omissions, design changes and
poor skills in construction projects. Section C investigates the impact of
knowledge management in reducing the cost of poor quality based on the
identified contributory factors. Section D investigates the barriers to the
optimisation of knowledge management to reduce the cost of poor quality.
Apart from the main questions, follow-on questions were posed to the
interviewee to further probe into the original questions asked e.g. ‘can you
please elaborate on….’ Other follow-on questions include the use of ‘why…’,
‘how…’, ‘which…’, and ‘when…’ The objective is to explore the research
questions in details, particularly to identify what types of knowledge
management initiatives were set in place by construction organisations at
personal, organisational, project and industry levels to reduce the costs
associated with design changes, errors and omissions, and poor skills. The
researcher-completed template served as a guide for the interviews however
the details of the interview were recorded through the use of digital audio
equipment.

CHAPTER 5: RESEARCH METHODOLOGY
176
5.4.2 Pilot study debate for semi-structured interviews
A pilot study refers to a small scale preliminary study conducted in order to
evaluate feasibility, time, cost, adverse events as well as the specific pre-testing
of a particular research instrument such as a questionnaire or interview
schedule (Teijlingen and Hundley, 2001). This can also be referred to as a mini
version of a full scale study. While a pilot study may be extremely useful for a
questionnaire survey, it may be argued otherwise in the case of semi-structured
interviews. According to Baker (1994) supported by Polit et al., (2001), a pilot
study can be the pre-testing or trying-out of a particular research instrument in
preparation for the major study, however most semi-structured interviews utilise
very basic instruments if any is used at all, therefore may not require prior
testing. Although pilot studies can be useful for semi-structured interviews for
certain studies but in the context of this research, the need for a pilot study
cannot be truly justified.
It is acknowledged that pilot studies can be used to acquire early contextual
sensitivity through the collection of essential information for effective research
design and development of greater awareness of dynamic events, agents and
circumstances that can positively modify the research process flow and affect
decision-making. Moreover, pilot studies hold the potential of minimising
problems associated with cold, unreflecting immersion in the field. De Vaus
(1993) therefore warned that to avoid unpleasant surprises, “do not take the
risk, pilot test first” This position suggests that a considerable advantage of
conducting a pilot study is anticipating the debilities of the research project,
namely by controlling the adequacy of protocols, methods and instruments.

CHAPTER 5: RESEARCH METHODOLOGY
177
Sampson (2004) also suggested that it is often only when data is evaluated that
any gaps in a research design begin to show up, hence running a pilot can save
time invested in unfeasible projects.
Contrary to the supporting arguments, pilot studies are not without drawbacks
especially where data from the pilot study are included in the main results. This
is more so where pilot participants are included in the main study, but new data
are collected from these people. However, Teijlingen and Hundley (2001) argue
that contamination is less of a concern in qualitative research, where researcher
so often use some or all of their pilot data as part of the main study. Some
researchers have therefore argued that in qualitative approaches separate pilot
studies are not necessary (e.g. Holloway 1997). Having considered the merits
and demerits of using a pilot study, it was concluded that it was not entirely
necessary for the semi-structured interviews due to the following explanations:
The semi-structured interviews for this study are exploratory in nature
therefore any data collected during the ‘pilot study’ would have also been
used in the ‘main study’ data analysis. Utilising a pilot study would therefore
be superfluous. Moreover the exploratory nature of the interviews does not
require an additional feasibility.
A pilot study has been defined as a small scale preliminary study pre-testing
a particular research instrument such as a questionnaire or interview
schedule for a bigger study. In the case of the semi-structured interviews for
this research, the instrument involved is the interview template containing
three main research questions relating to the impact of knowledge
management in reducing the cost of poor quality in construction.

CHAPTER 5: RESEARCH METHODOLOGY
178
Pilot studies hold the potential of minimising problems associated with cold,
unreflecting immersion in the field. In the case of the semi-structured
interviews for the study, the researcher is conversant in conducting
interviews and is familiar with construction organisational territory therefore
does not envisage issues in dealing with participants.
Undertaking a pilot study for the semi-structure interviews is time consuming
and not cost effective.
Since pilot studies are deemed fit for large scale surveys rather than small scale
in-depth or exploratory interviews, the research utilises pilot study for the
quantitative element (questionnaire survey) rather than the qualitative element
(semi-structured interviews)
5.4.3 Sampling strategy
There are several sampling techniques available in research, all of which can
be classified under two sampling strategies namely probability sampling (e.g.
simple random sampling, stratified random sampling, cluster sampling) and
non-probability sampling (e.g. purposive sampling, homogeneous sampling,
snowball sampling). The details of sampling strategies and techniques have
been elaborated by Patton (1990), Mutes and Huberman (1994), Omwuegbuzie
and Leech, (2007). In probability sampling, every subject in the population has a
known, non-zero probability of being included in the sample. In non-probability
sampling, the probability of inclusion of each subject is not known and many of
the elements may have zero probability (Gillham, 2000; Churchill and
Lacobucci, 2002; Creswell, 2008). Non-probability sampling strategy was
adopted in the selection of interviewees due to its suitability for in-depth
qualitative research in which the focus is to understand complex social

CHAPTER 5: RESEARCH METHODOLOGY
179
phenomena (Marshall 1996; Creswell 2009). Purposive sampling was applied
as a technique and a crucial element to the strategy which enabled a deliberate
selection of the most appropriate interviewees for the study. Expert sampling
was utilised as a sub-technique to identify and select interviewees with the
required expertise who could provide credible insight into the study. The
interviewees were selected from industry communities of practice and expert
forums across UK based on eligibility criteria which included project experience,
organisational experience and job designation (see Table 5.6).
Table 5. 6: Profile of interviewees
Interviewee ID
Years of experience
Project experience*
Organisation experience*
Current designation
A 40 1, 2, 3, 4, 5, 6 1, 2, 3, 5, 8 Director/continuous improvement B 35 1, 6 1, 2, 3, 4, 8 Director/architecture C 33 1, 2, 4, 6 1, 2, 3, 4, 7 Supply chain manager D 32 1, 6 1, 2, 3, 7 Senior consultant/strategy innovation E 30 1 1, 2, 3, 5 Director/supply chain knowledge management F 30 1 1, 2, 3 Director/technology G 30 1, 2 1, 2, 3 Director/performance improvement H 29 4 3, 4 Project design engineer I 25 1 1, 2, 3 Cost consultant J 23 1, 2, 3 1, 2, 3 Director/knowledge management K 23 1, 2, 4 2, 3, 6 Director/operations L 15 2 2, 3 Site engineer M 14 4 2, 3, 4, 5 Project engineer N 14 1, 2, 3, 4, 5 2, 3, 5 Projects control manager O 14 4 2, 3, 5 Project risk engineer P 12 1 3, 5 Project manager Q 12 4 3, 4 Senior design engineer R 10 1, 2 2, 3 Change manager/ knowledge management S 10 4 3, 4 Project design engineer T 8 5 1, 3 Project engineer U 8 2 3 Site surveyor V 8 5 1, 3 Engineer/water W 7 1 3 Senior quantity surveyor X 6 4 3 Design engineer Y 5 4 3 Design engineer
*Key
Project experience Organisation experience
1 – Building construction 2 – Highways 3 – Rail 4 – Utility (power) 5 – Utility (water) 6 – Other
1 – Client organisation 2 – Consultancy 3 – Main contractor 4 – Design organisation 5 – Project management 6 – Sub-contractor 7 – Supplier 8 – Other

CHAPTER 5: RESEARCH METHODOLOGY
180
The interviewees have acquired years of experience in large construction
organisations (over 250 employees) particularly with main contractors, and have
been involved in a diverse range of projects. Although the UK construction
industry is made up mostly of small and medium sized organisations (up to 250
employees), large organisations particularly the main contractors undertaking
large projects tend to engage several of these smaller organisations in their
supply chain (BIS 2013). The study therefore adopted a top-down approach by
selecting interviewees from the main contractor organisations.
The sample size grew up to 25 interviewees at which point saturation was
reached whereby data collection neither led to more information nor gave
further insight into the study (Crouch and McKenzie, 2006). The sample size
nevertheless falls within what is acceptable for qualitative research of this
nature (Morse, 2003). Depending on interviewee’s proximity and convenience,
60% of the interviews were conducted face-to-face, 28% by video call and 12%
by telephone. The interviews lasted for 2 hours averagely.
5.4.4 Analysis of the semi-structured interview data
As discussed in the earlier sections, qualitative data analysis seek to describe
textual data in ways that capture the setting or participants who produced the
text on their own terms rather than in terms of predefined measures and
hypotheses. What this means is that qualitative data analysis tends to be
inductive. The researcher therefore identifies important categories in the data,
as well as patterns and relationships, through a process of discovery. Good
qualitative data analyses also are distinguished by their focus on the
interrelated aspects of the setting, group, or person under investigation. For this

CHAPTER 5: RESEARCH METHODOLOGY
181
research the semi-structured interview data was analysed utilising the steps
highlighted by Creswell (2008). They are presented as follows:
1. Organise and prepare the data for analysis
2. Read through all the data. Gain a general sense of the information and
reflect on the overall meaning.
3. Conduct analysis based on the specific theoretical approach and
method. This involves coding or organising related segments of data into
categories.
4. Generate a description of the setting or participants and identify themes
from the coding. Search for theme connections.
5. Represent the data within a research report.
6. Interpret the larger meaning of the data
Figure 5. 2: Data analysis for qualitative research (Source: Creswell 2008)
Raw data
(Transcripts/ field notes)
Organising and preparing data for
analysis
Interrelating themes/description
Themes
Coding the data
(Manual or computer)
Reading through all data
Description
Interrelating the meaning of
themes/descriptions
Validating the
accuracy of the
information

CHAPTER 5: RESEARCH METHODOLOGY
182
These steps are elaborated in a diagram format (see Figure 5.2), which shows
the process of analysis from the collection of raw data to the validation of the
accuracy of the information obtained. These are further discussed in sub-
sections 5.4.4.1 to 5.4.4.6.
5.4.4.1 Organising and preparing the data for analysis
All the interview sessions were audio-recorded on a digital audio recorder.
According to Patton (2002), no matter what style of interviewing is used and no
matter how carefully the questions are worded, it all becomes naught if the
interviewer fails to capture the actual words of the person being interviewed.
However the recordings did not eliminate the need for taking field notes, but did
allow the interviewer to concentrate on taking strategic and focused notes,
rather than attempting verbatim notes. The manual taking of notes were also
useful to help formulate new questions as the interview progressed. The
recordings were listened to by the researcher several times to gain more
insight, and better understanding of what the interviewees were trying to convey
in broader terms and within the context of the study.
5.4.4.2 Reading through all the data
The next step was to convert the interview data into written form. The interview
recordings were transcribed verbatim into Microsoft Word document. The
transcriptions were read and re-read to gain a general sense of the information
and again reflect on the overall meaning. Further impressions about the
interview data was written down and noted for use in the subsequent analysis.
CHAPTER 5: RESEARCH METHODOLOGY
183
5.4.4.3 Conducting analysis based on the specific theoretical approach
and method
The interview data was analysed using content analysis, which is a systematic,
replicable technique for compressing many words of text into fewer content
categories based on explicit rules of coding (Weber, 1990; Krippendorff, 2004;
Creswell, 2014). Nachmias and Nachmias (1996) suggested applications of
content analysis which are: to describe the attributes of the message; and to
make inferences about the effect of the message on the interviewer. The
content that is analysed can be in any form to begin with, but is often converted
into written words before it is analysed. The advantages of content analysis are
that it is unobtrusive, accepts unstructured material, is context sensitive, can
process symbolic forms, and can cope with large volumes of data (Krippendorff,
2004).
Perhaps the most common notion in qualitative research is that a content
analysis simply means doing a word-frequency count. The assumption made is
that the words that are mentioned most often are the words that reflect the
greatest concerns. While this may be true in some cases, there are several
counterpoints to consider when using simple word frequency counts to make
inferences about matters of importance. One thing to consider is that synonyms
may be used by interviewees or even regional dialects (e.g. the interviewees for
this study originate from different parts of the United Kingdom) and thus may
lead the researcher to underestimate the importance of a concept (Weber,
1990; Babbie, 2004). Also important to note is that each word may not represent
a category equally well. In performing word frequency counts therefore, it is
worthy to note that some words may have multiple meanings. For instance the

CHAPTER 5: RESEARCH METHODOLOGY
184
word ‘state’ could mean a political body, a situation, or a verb meaning ‘to
speak’. As a result, this study adopted a thematic approach to content analysis
which focused on identifying and describing both implicit and explicit ideas
within the data i.e. themes. Consideration for this approach was based on its
appropriateness in advancing beyond counting words or phrases and focusing
on drawing interpretation and meaning consistent with the data collected
(Hatch, 2002).
Nachmias and Nachmias (1996) noted that in content analysis, the researcher
can guarantee objectivity by carrying out analyses according to explicit rules
that enable different investigators to obtain the same results from the same
messages or documents. The researcher therefore maintained this objectivity in
analysing the data. Content analysis can be done manually or through the use
of computer programs such as NVivo. Although computers can assist in
organising and indexing qualitative data, they do little with the analysis of the
data particularly relating to themes and meanings being conveyed by
interviewees. The qualitative aspect of this study involved twenty five (25)
interviewees and it was decided to conduct the analysis manually since this
number was manageable enough for a rigorous thematic analysis.
5.4.4.4 Generating a description of the setting or participants and
identifying themes from the coding
The interview data analysis involves coding and organising related segments of
the data into categories. Codes are tags, names or labels, and coding is
therefore the process of putting tags, names or labels against pieces of data
(Miles and Huberman, 1994; Huberman and Miles, 2002). The pieces may be

CHAPTER 5: RESEARCH METHODOLOGY
185
individual words, small or large chunks of the data. The point of assigning labels
is to attach meaning to the pieces of data and these labels serve a number of
functions. They index data, providing a basis for storage and retrieval. The first
labels permit more advanced coding which enables the summarising of data by
pulling together themes and by identifying patterns. In view of the volume and
complexity of much qualitative data, these early labels become an essential part
of subsequent analysis. In the Miles and Huberman’s (1994) approach, there
are two main types of codes: (1) descriptive codes and (2) inferential (or
pattern, or thematic) codes. Early labels may be descriptive codes requiring little
or no inference beyond the piece of data itself.
There are especially valuable in getting the analysis started and in enabling the
researcher to get a ‘feel’ for the data. Glaser and Straus (1967) use the term ‘in
vivo’ codes in the same way in grounded theory coding. Richards (2005) uses
the term ‘topic’ coding in much the same way. First level coding mainly uses
descriptive, low inference codes which are very useful in summarising
segments of data and which provide basis for later higher order coding (Miles
and Huberman, 1994; Huberman and Miles, 2002). In this research, the
descriptive coding covers the first section of the interview template in which
interviewees are asked questions such as: How many years of construction
industry experience do you have? Which types of construction projects have
you worked on? Table 5.6.1 shows the excerpts from the coding of the
transcript of Interviewee A. Later codes are more interpretive, requiring some
degree of inference beyond the data. Thus second level coding tends to focus
on pattern code. A pattern code is more inferential and a sort of ‘meta-code’
(Miles and Huberman, 1994; Huberman and Miles, 2002). Pattern codes pull

CHAPTER 5: RESEARCH METHODOLOGY
186
together material into smaller more meaningful units. There is usually the range
of possibilities when it comes to bringing codes to the data or finding them in the
data. At one end of the continuum there are pre-specified codes or more
general coding frameworks. At the other end there are no pre-specified codes
but the data suggests the initial codes. An example is shown in Table 5.6.2
which is an excerpt from coding of Section A of the interview transcript of
Interviewee H. The pattern ‘rule-based mistakes’ and ‘slips/lapses of attention
were drawn from the response data. Table 5.6.3 and Table 5.6.4 show the
excerpts from how different interviewees respond to the same question. This
allows for deduction of common themes and patterns from the data.
Table 5.6.1: Excerpts from the coding of Section A of the interview transcript
Interview questions (Researcher)
Excerpts from interviewee response (Interviewee A)
Descriptive codes (Researcher)
Q1. How many years of construction industry experience do you have? Q2. Which types of construction projects have you worked on?
“I’ve been in this industry 40 odd years…” “All sorts, I’ve worked on a wide range of projects including building projects both private and commercial. I was involved in Network Rail projects, highway projects, National Grid project construction, Water projects, infrastructure to name a few”
40 years Building construction Highways Rail Utility (power) Utility (water) Other
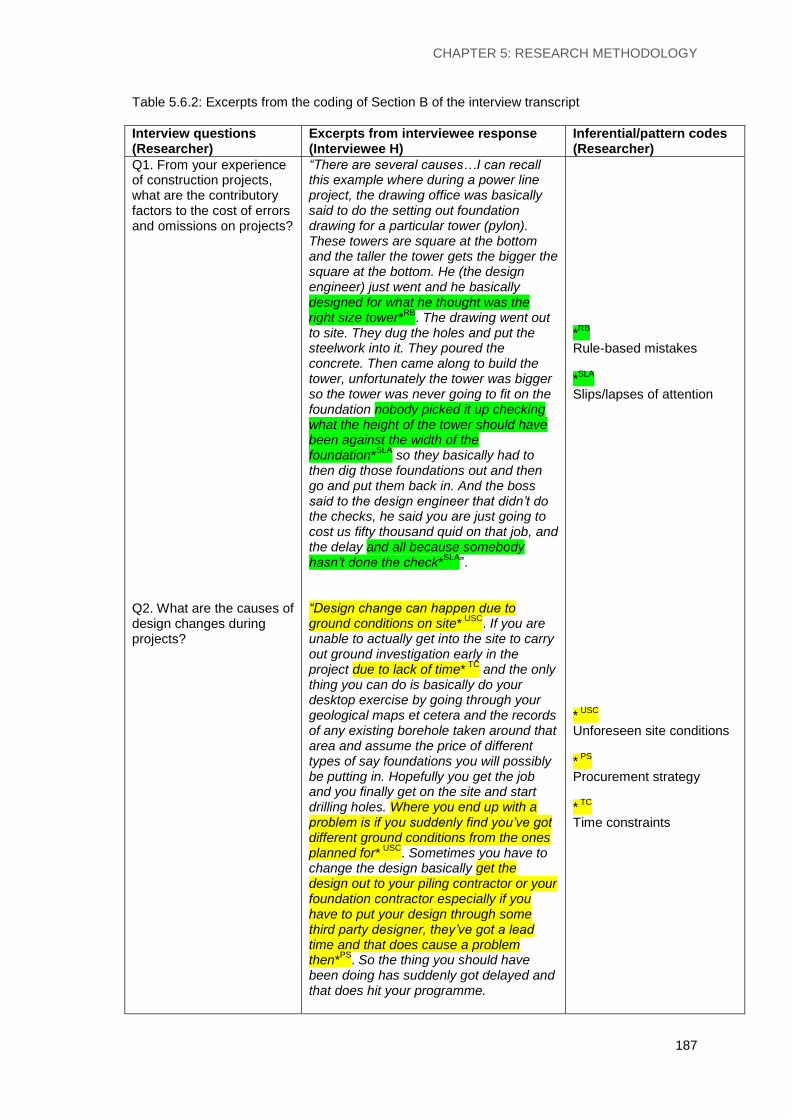
CHAPTER 5: RESEARCH METHODOLOGY
187
Table 5.6.2: Excerpts from the coding of Section B of the interview transcript
Interview questions (Researcher)
Excerpts from interviewee response (Interviewee H)
Inferential/pattern codes (Researcher)
Q1. From your experience of construction projects, what are the contributory factors to the cost of errors and omissions on projects? Q2. What are the causes of design changes during projects?
“There are several causes…I can recall this example where during a power line project, the drawing office was basically said to do the setting out foundation drawing for a particular tower (pylon). These towers are square at the bottom and the taller the tower gets the bigger the square at the bottom. He (the design engineer) just went and he basically designed for what he thought was the right size tower*
RB. The drawing went out
to site. They dug the holes and put the steelwork into it. They poured the concrete. Then came along to build the tower, unfortunately the tower was bigger so the tower was never going to fit on the foundation nobody picked it up checking what the height of the tower should have been against the width of the foundation*
SLA so they basically had to
then dig those foundations out and then go and put them back in. And the boss said to the design engineer that didn’t do the checks, he said you are just going to cost us fifty thousand quid on that job, and the delay and all because somebody hasn’t done the check*
SLA”.
“Design change can happen due to ground conditions on site*
USC. If you are
unable to actually get into the site to carry out ground investigation early in the project due to lack of time*
TC and the only
thing you can do is basically do your desktop exercise by going through your geological maps et cetera and the records of any existing borehole taken around that area and assume the price of different types of say foundations you will possibly be putting in. Hopefully you get the job and you finally get on the site and start drilling holes. Where you end up with a problem is if you suddenly find you’ve got different ground conditions from the ones planned for*
USC. Sometimes you have to
change the design basically get the design out to your piling contractor or your foundation contractor especially if you have to put your design through some third party designer, they’ve got a lead time and that does cause a problem then*
PS. So the thing you should have
been doing has suddenly got delayed and that does hit your programme.
*
RB
Rule-based mistakes
*
SLA
Slips/lapses of attention
*
USC
Unforeseen site conditions *
PS
Procurement strategy *
TC
Time constraints

CHAPTER 5: RESEARCH METHODOLOGY
188
Table 5.6.3:
Excerpts from the coding of Section B of the interview transcript showing theme connections
Interviewee ID
Q2. From your experience of construction projects, what are the contributory factors to the cost of design changes? Excerpts from Interviewee responses:
Inferential/pattern codes (Researcher)
Interviewee A “I was part of the team that built the shopping centre, most of the design changes was due to the client changing their minds…”
Client change
Interviewee B “…design change can be due to client change because they are not very good at communicating with the professional team to identify what they want at the inception…”
Interviewee C “…the quality of information on the drawings is not good enough to allow people to work from those drawings. Clients also tend to change design specifications frequently…”
Interviewee D “…sometimes changes are needed really because of the evolution of the design in generalities obviously some changes are because the client physically changes his mind and the key thing to me with regard to changes is that they are inevitable”.
Interviewee E “…during the construction of a multi-story building, the client suddenly wants a swimming pool on the 40th floor. This cost a lot of money and time. There will always be design changes during the life of a project. It keeps changing and nothing can be done about it”.
Interviewee F “…so where you might take a contract for thirty eight million pounds you know it’s going to end forty four how many design changes usually by the client you have to go through. Expect more time in the design and planning, quantifying cost before you went to submit, that’s the trick”.
Interviewee G “…that’s where designers should be made to design to cost from the onset so they build-in products and materials that are appropriate to cost that the client can afford so you build it up using the correct components and avoid future design changes by the client”.
Interviewee H “Client change is common in projects. People go ahead to design without adequate information or knowledge about what the project entails”.
Interviewee I “…that’s generally where the client isn’t given approval brief or the client then starts saying this was all going to be agreed at a later stage now we want to agree a fit out sale not before you got the shell built…some clients just think oh well I’m paying the bills I can change my mind whenever I want, still get it done on time and on price and everything that’s when you run into trouble on these big and complex projects”
Interviewee J “Clients change the design because they change their minds, they make irrational decisions to change it for a reason based on the information that they have…”
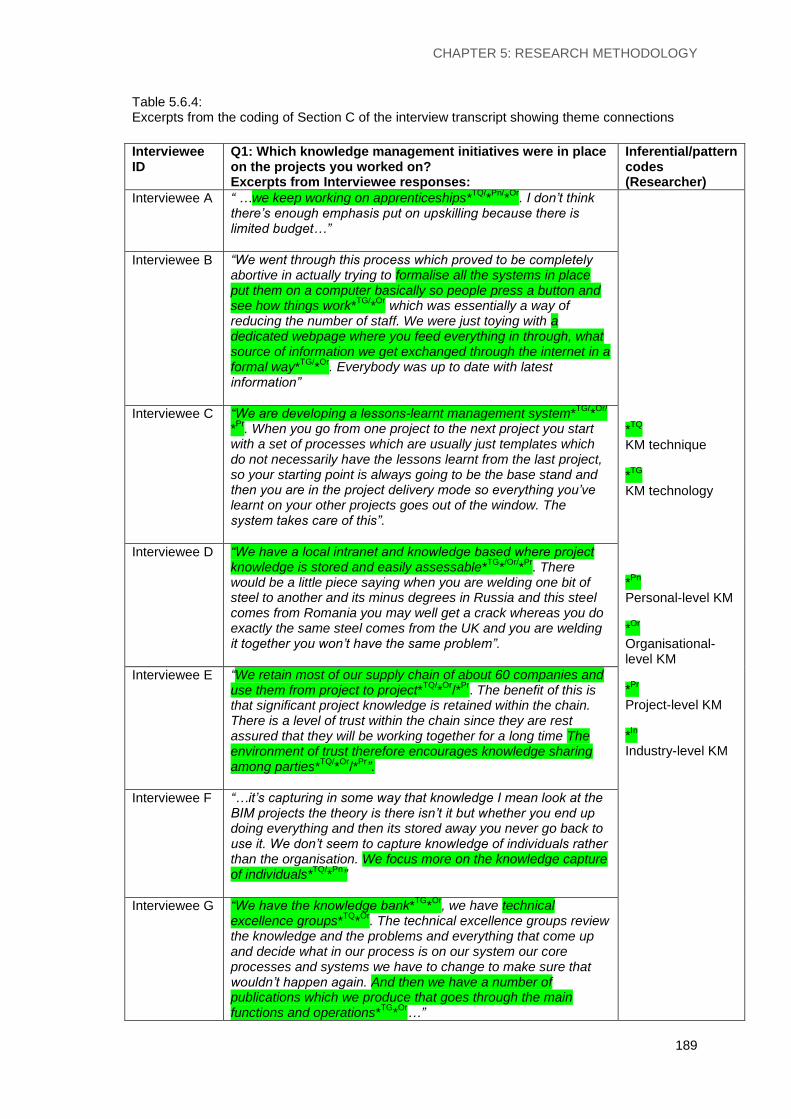
CHAPTER 5: RESEARCH METHODOLOGY
189
Table 5.6.4: Excerpts from the coding of Section C of the interview transcript showing theme connections
Interviewee ID
Q1: Which knowledge management initiatives were in place on the projects you worked on? Excerpts from Interviewee responses:
Inferential/pattern codes (Researcher)
Interviewee A “ …we keep working on apprenticeships*TQ/
*Pn/
*Or
. I don’t think there’s enough emphasis put on upskilling because there is limited budget…”
*
TQ
KM technique *
TG
KM technology *
Pn
Personal-level KM *
Or
Organisational-level KM *
Pr
Project-level KM *
In
Industry-level KM
Interviewee B “We went through this process which proved to be completely abortive in actually trying to formalise all the systems in place put them on a computer basically so people press a button and see how things work*
TG/*
Or which was essentially a way of
reducing the number of staff. We were just toying with a dedicated webpage where you feed everything in through, what source of information we get exchanged through the internet in a formal way*
TG/*
Or. Everybody was up to date with latest
information”
Interviewee C “We are developing a lessons-learnt management system*TG/
*Or/
*Pr
. When you go from one project to the next project you start with a set of processes which are usually just templates which do not necessarily have the lessons learnt from the last project, so your starting point is always going to be the base stand and then you are in the project delivery mode so everything you’ve learnt on your other projects goes out of the window. The system takes care of this”.
Interviewee D “We have a local intranet and knowledge based where project knowledge is stored and easily assessable*
TG*
/Or/*
Pr. There
would be a little piece saying when you are welding one bit of steel to another and its minus degrees in Russia and this steel comes from Romania you may well get a crack whereas you do exactly the same steel comes from the UK and you are welding it together you won’t have the same problem”.
Interviewee E “We retain most of our supply chain of about 60 companies and use them from project to project*
TQ/*
Or/*
Pr. The benefit of this is
that significant project knowledge is retained within the chain. There is a level of trust within the chain since they are rest assured that they will be working together for a long time The environment of trust therefore encourages knowledge sharing among parties*
TQ/*
Or/*
Pr”.
Interviewee F “…it’s capturing in some way that knowledge I mean look at the BIM projects the theory is there isn’t it but whether you end up doing everything and then its stored away you never go back to use it. We don’t seem to capture knowledge of individuals rather than the organisation. We focus more on the knowledge capture of individuals*
TQ/*
Pn”
Interviewee G “We have the knowledge bank*TG
*Or
, we have technical excellence groups*
TQ*
Or. The technical excellence groups review
the knowledge and the problems and everything that come up and decide what in our process is on our system our core processes and systems we have to change to make sure that wouldn’t happen again. And then we have a number of publications which we produce that goes through the main functions and operations*
TG*
Or…”

CHAPTER 5: RESEARCH METHODOLOGY
190
5.4.4.5 Representing the data within a research report
The identified patterns or themes within the data were organised into coherent
categories that summarised and brought meaning to the text. This involved
reading and re-reading the text and identifying coherent categories. The themes
and connections were used to explain the findings which are presented and
discussed in details in Chapter 6.
5.4.4.6 Interpreting the larger meaning of the data
This aspect presents the findings from the data analysis and synthesises the
findings with the interview questions and with the overall research questions.
This interpretation of the larger meaning of the data is presented in Chapter 6.
5.5 QUANTITATIVE DATA COLLECTION AND ANALYSIS
The need for a quantitative procedure was based on the sequential exploratory
research strategy which involves a first phase of qualitative data collection and
analysis, followed by a second phase of quantitative data collection and
analysis that builds on the results of the first qualitative phase. It was discussed
in the previous sections that a quantitative method can be executed either by
experiments or by surveys. Experiments however were not considered for this
research as they do not fit into the overall research aims and objectives. Rather
than perform experiments to test theory, the research adopts the use of survey
for the purpose of generalising the findings from the qualitative study i.e. semi-
structured interviews. Surveys can take several forms which include;
respondent-completed documents (e.g. postal or electronic questionnaires),
face-to-face (personal) interviews, and telephone interviews. Surveys are,
however prone to three main flaws (Mitchell and Jolley, 2001); researcher not

CHAPTER 5: RESEARCH METHODOLOGY
191
knowing what he or she wants, poor construct validity of measures, and poor
external validity when biased samples are used. These flaws however can be
mitigated thoughtful planning and design of surveys. In this regard several
authors (e.g. Fowler, 2002; Scheuren, 2004; Czaja and Blair, 2005; Dillman,
2007) provide useful guidance in this area. The choice of survey method for this
study was based on the pros and cons of each, which includes the
considerations for the sample population, characteristics of the sample, types of
questions, question topic, response rate, costs and time (Table 5.7). Having
considered the methods, postal survey was chosen for the following reasons:
Adopting face-to-face or telephone surveys for this study would be
impracticable and costly due to the sample size and the nature of the
questionnaire.
The length and format of the questionnaire is not entirely suitable for
internet survey. Respondents may find the internet version tedious and
may be discouraged to continue after clicking on a few pages. This may
lead to low response rate.
The relatively lower cost of administering postal questionnaire survey to
the sample size was a key determinant in using postal survey.
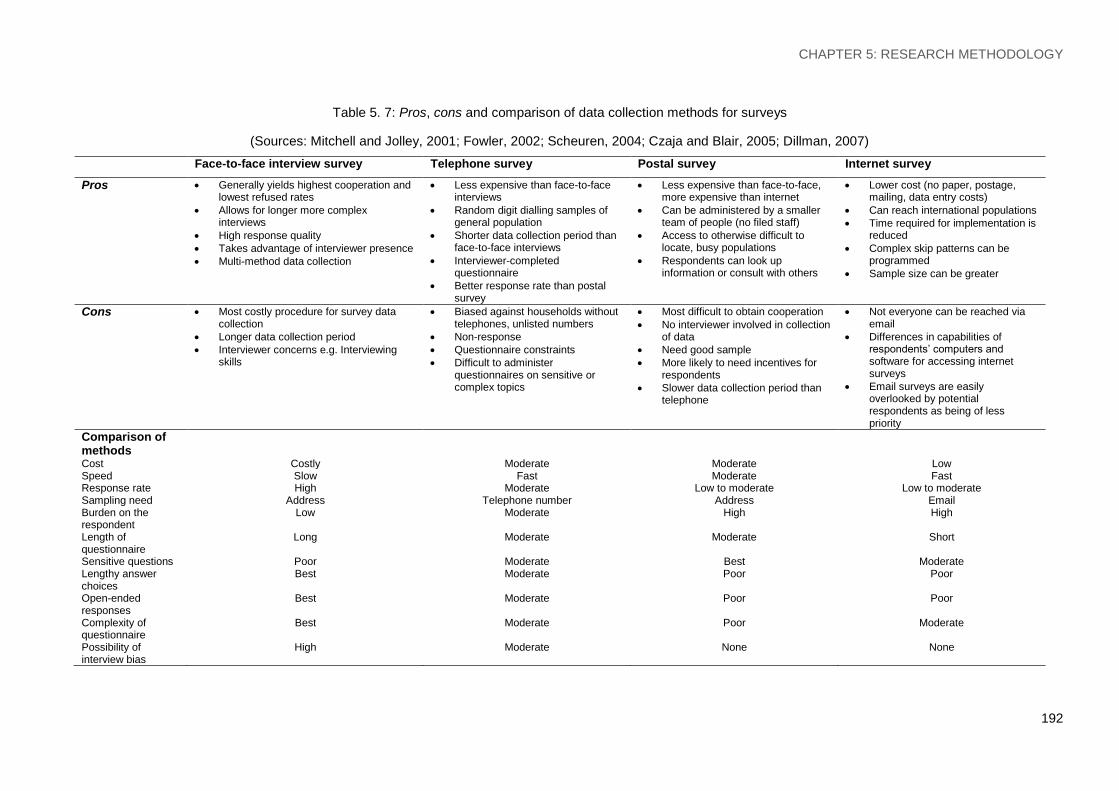
CHAPTER 5: RESEARCH METHODOLOGY
192
Table 5. 7: Pros, cons and comparison of data collection methods for surveys
(Sources: Mitchell and Jolley, 2001; Fowler, 2002; Scheuren, 2004; Czaja and Blair, 2005; Dillman, 2007)
Face-to-face interview survey Telephone survey Postal survey Internet survey
Pros Generally yields highest cooperation and lowest refused rates
Allows for longer more complex interviews
High response quality
Takes advantage of interviewer presence
Multi-method data collection
Less expensive than face-to-face interviews
Random digit dialling samples of general population
Shorter data collection period than face-to-face interviews
Interviewer-completed questionnaire
Better response rate than postal survey
Less expensive than face-to-face, more expensive than internet
Can be administered by a smaller team of people (no filed staff)
Access to otherwise difficult to locate, busy populations
Respondents can look up information or consult with others
Lower cost (no paper, postage, mailing, data entry costs)
Can reach international populations
Time required for implementation is reduced
Complex skip patterns can be programmed
Sample size can be greater
Cons Most costly procedure for survey data collection
Longer data collection period
Interviewer concerns e.g. Interviewing skills
Biased against households without telephones, unlisted numbers
Non-response
Questionnaire constraints
Difficult to administer questionnaires on sensitive or complex topics
Most difficult to obtain cooperation
No interviewer involved in collection of data
Need good sample
More likely to need incentives for respondents
Slower data collection period than telephone
Not everyone can be reached via email
Differences in capabilities of respondents’ computers and software for accessing internet surveys
Email surveys are easily overlooked by potential respondents as being of less priority
Comparison of methods
Cost Costly Moderate Moderate Low Speed Slow Fast Moderate Fast Response rate High Moderate Low to moderate Low to moderate Sampling need Address Telephone number Address Email Burden on the respondent
Low Moderate High High
Length of questionnaire
Long Moderate Moderate Short
Sensitive questions Poor Moderate Best Moderate Lengthy answer choices
Best Moderate Poor Poor
Open-ended responses
Best Moderate Poor Poor
Complexity of questionnaire
Best Moderate Poor Moderate
Possibility of interview bias
High Moderate None None

CHAPTER 5: RESEARCH METHODOLOGY
193
5.5.1 Questionnaire design
The purpose of the questionnaire in this study is to utilise quantitative data and
results to assist in the interpretation of qualitative findings and to ascertain if the
findings can be generalised in the wider construction industry context. The
design of the questionnaire affects the richness’ of the data collected, the
number and quality of the responses, and the range of methods suitable for
analysing the data gathered. The external and construct validity of surveys can
generally be improved by the following actions (Mitchell and Jolley, 2001;
Fowler, 2002): ensuring that the survey instrument promotes cooperation, is
sufficient in detail and scope, and focuses on the objectives of study; ensuring
that questions are clear, intelligible, logically sequenced, and match the
knowledge-base of target respondents; and paying greater attention to the
potential for sampling bias (especially non-response bias), interviewer bias and
subject biases. Pilot testing the survey instrument before using it on a larger
study can reasonably ensure these features are achieved. The questionnaire
took a six-page Likert scale format excluding two introductory pages. This can
be considered to be of a moderate length. Evidence from the literature
suggested that the effect of questionnaire length on response rates have been
mixed.
Denscombe (2003) showed that there is no correlation between questionnaire
length and lack of response. According to Jankowicz (2005), the most important
factor in assuring high response rate is whether the respondents are interested
in the subject matter of the survey. Yates (2004) noted that a high response rate
could be attained if the respondents are knowledgeable about the issues

CHAPTER 5: RESEARCH METHODOLOGY
194
covered by the survey. The questionnaire design for the study commences with
an introductory letter to the respondent introducing the researcher, the research
institution and the research team. The letter briefly discusses the rationale for
the research, overview of the research, benefits of the research especially to
the respondent, aim of the questionnaire, key definitions and guidelines to
completing the questionnaire, contact details of the researcher and the return
address for the completed questionnaire. A consent form was attached to the
letter which the respondents are required to sign and return to the researcher
(See Appendix 3). The questionnaire consists of seven sections labelled from A
to G (See Appendix 5).
Section A contains general information about the respondents and their
organisations. The information required include: years of experience in the
construction industry; current job role; job level; number of employees in the
organisation; organisations’ area of operation; respondents’ familiarity with
knowledge management and quality management.
Section B measures the impact of knowledge management in reducing the
cost of poor quality on construction projects by presenting a list of
knowledge management processes normally utilised in practice. The
processes include knowledge identification, knowledge capture, knowledge
codification, knowledge storage, knowledge sharing and dissemination.
Respondents are required to rate from 1 to 4, the impact of these processes
on the cost of design changes, cost of errors and omissions, and cost of
poor skills. The rating scale represents; 1=strong negative impact,
2=negative impact, 3=positive impact, 4=strong positive impact.

CHAPTER 5: RESEARCH METHODOLOGY
195
Section C measures the effectiveness of knowledge management
techniques and technologies in reducing the cost of poor quality on
construction projects. The techniques and technologies include
brainstorming, collaborative workspaces, intranets, knowledge base,
learning reviews etc. Respondents are required to rate from 1 to 4 the
effectiveness of the techniques and technologies in reducing the cost of
design changes, cost of errors and omissions, and cost of poor skills. The
rating scale represents; 1=not at all effective, 2=fairly effective, 3=effective,
4=very effective.
Section D measures the barriers to knowledge management in reducing the
cost of poor quality. The barriers were identified from the qualitative data
collection aspect of the research and they include; lack of senior
management support, adversarial organisational culture, complacency of
project staff, knowledge hoarding, high staff turnover, high perceived costs
of investing in knowledge management initiatives etc. Respondents are
required to rate these barriers on a scale of 1 to 4. The rating scale
represents; 1=very weak barrier, 2=weak barrier, 3=strong barrier, 4=very
strong barrier.
Section E measures the benefits of reducing the cost of poor quality through
the optimisation of knowledge management. The benefits include; improved
cost efficiency, increased customer satisfaction, improved project
performance, increased revenue for growth, increased competitive
advantage etc. Respondents are expected to rate their level of agreement to
each of the benefits on a scale of 1 to 4. The rating scale represents;
1=strongly disagree, 2=disagree, 3=agree, 4=strongly agree.
CHAPTER 5: RESEARCH METHODOLOGY
196
Section F investigates whether organisations measure the impact of
knowledge management on the cost of poor quality on projects. It also
investigates whether organisations currently have knowledge management
tools for reducing the cost of poor quality in construction. This section
contains a series of questions in which respondents are to answer either
‘yes’ or ‘no’.
Section G gives the respondents opportunity to express their thoughts or
add any comments relating to the content of the questionnaire. The section
also contains a ‘thank you’ note, a question whether the respondent would
like to have a copy of key findings. The survey design is cross-sectional
rather than longitudinal, in other words the survey data is collected at one
point in time rather than repeated observations of the same variables over
long periods of time.
5.5.2 Piloting the survey
It was necessary to conduct a pilot survey for the questionnaire by
administering the questionnaire to pilot subjects in exactly the same way as it
will be administered in the main study. This enables feedback to be obtained
from participants to: identify ambiguities and difficult questions; record the time
taken to complete the questionnaire and decide whether it is reasonable;
discard all unnecessary, difficult or ambiguous questions; assess whether each
question gives an adequate range of responses; establish that replies can be
interpreted in terms of the information that is required; check that all questions
are answered ; re-word or re-scale any questions that are not answered as
expected; shorten, revise and, if possible, pilot again.
CHAPTER 5: RESEARCH METHODOLOGY
197
5.5.3 Sampling strategy for the pilot survey
According to Jankowicz, (2005), pre-testing of the questionnaire should be
carried out and that it should include different groups, such as colleagues and
potential users of the data. In the case of the pilot survey, non-probability
sampling strategy was adopted in the selection of respondents since the aim
was to pre-test the questionnaire for the main study. Convenience sampling
technique was used in identifying and selecting respondents from within the
construction industry and academia based on their expertise and relative ease
of access. An initial draft of the questionnaire was posted to ten (10)
construction industry practitioners from large construction companies, six (6) of
which were in management, and four (4) in operations. The questionnaire was
also presented to four (4) academics, two of which were in senior positions. All
of the selected respondents completed the questionnaire and returned their
critiques and comments.
5.5.4 Contributions of the pilot survey to the main
questionnaire design
The critiques and comments from the respondents were incorporated into the
final version of the questionnaire such as; shortening the length of the
questionnaire from eight pages to six pages, re-wording the instruction to
respondents for more clarity, making the layout more attractive, re-calibrating
the rating scales, re-ordering the sequence of questions and defining key terms.
In doing this, the researcher ensured that the final questions were direct,
specific, clear while avoiding double-barrelled questions, leading or emotive

CHAPTER 5: RESEARCH METHODOLOGY
198
questions, and questions which are too complex or ambiguous. The finalised
main questionnaire was subsequently signed off by the supervisory team to be
administered to the selected industry practitioners.
5.6 ETHICAL CONSIDERATIONS FOR THE RESEARCH
Research involves collecting data from people (Punch, 2005), it is therefore
important to anticipate ethical issues that may arise during research (Hesse-
Bieber and Leavey, 2006). Researchers need to protect their research
participants; develop a trust with them; promote the integrity of research; guard
against misconduct and impropriety that might reflect on their organisations or
institutions; and cope with new challenging problems (Israel and Hay, 2006).
Interviewing in qualitative research is increasingly being seen as a moral
inquiry. According to Kvale (2007), interviewers need to consider how the
interview will improve the human situation as well as enhance scientific
knowledge; how a sensitive interview interaction may be stressful for the
participants, whether the participants have a say in how their statements are
interpreted, how critically the interviewees might be questioned and what the
consequences of the interview for the interviewees and the groups to which
they belong might be.
Ethics approval was for this research was sought through the School of
Architecture and the Built Environment, Faculty of Science and Engineering of
the University of Wolverhampton. This was approved by the university’s ethics
committee which also stipulated the following ethics approval guidelines that
were adhered to by the researcher:

CHAPTER 5: RESEARCH METHODOLOGY
199
Telephone contact with other individuals or organisations; Participants were
fully informed of the risks and benefits of the procedures and of their right to
refuse participation or withdraw from the research at any time
Interviews; Final versions of the interview questions were submitted to the
research supervisory team for confirmation of ‘fitness for purpose’ before
any data is collected.
Confidential information: Measures were put in place to ensure continued
confidentiality. The confidentiality and anonymity of all participants were
maintained during data collection, analysis, dissemination and subsequent
storage in line with the Data Protection Act (1998).
Research integrity: Under no circumstances were data fabricated to support
any conclusion, regardless of how seemingly noble or interesting that
conclusion might be. All findings were reported with the utmost professional
honesty. In addition, full credit was given appropriately where deserved in
the acknowledgment of this thesis.
In the case of the semi-structured interview aspect of the research, all the
interview sessions were audio-recorded and the participants were made aware
of this. Patton (2002) suggested that no matter what style of interviewing is
used and no matter how carefully the questions are worded, it all becomes
naught if the interviewer fails to capture the actual words of the person being
interviewed. For this research, a digital voice recorder was used to capture the
audio of the interviews. The recording of the interviews did not eliminate the
need for taking field notes, but did allow the interviewer to concentrate on taking
strategic and focused notes, rather than attempting verbatim notes. The manual
taking of notes were also useful to help formulate new questions as the

CHAPTER 5: RESEARCH METHODOLOGY
200
interview progressed. All audio recordings from the interviews were transcribed
in preparation for data analysis.
Unlike semi-structured interviews which require direct contact with the
participants, the quantitative procedure in this research involves the postage of
questionnaires to respondents which they are required to self-complete. In this
case the researcher clearly has the responsibility to fully inform participants
about the nature of the activities in the process of obtaining consent, and make
it clear to participants that their consent may be withdrawn and they may elect
to discontinue the activities at any time. Ethical issues exist in conducting
surveys where the researcher does not impose or manipulate conditions.
Although ethics in surveys are often less complex or harmful than semi-
structured interviews, it is important for the researcher to be aware of basic
principles for protecting the respondents, including full disclosure and consent.
For example, in survey research, each respondent should be fully informed as
to the purpose of the study, confidentiality of responses, how the results are
intended to be used, and who will have access to the data. Bacon and Olsen
(2005) also indicate that survey researchers have the ethical responsibility of
not wasting a respondent’s time and to only collect data that has utility.
In addition to the ethics approval, an ‘informed consent’ form was stipulated by
the university and was sent to all the participants to sign before they engaged in
research. This form acknowledges that participants’ rights will be protected
during data collection. Elements of the informed consent form include the
following:

CHAPTER 5: RESEARCH METHODOLOGY
201
Identification of the researcher
Identification of the sponsoring institution
Indication of how participants were selected
Identification of the purpose of the research
Identification of the benefits for participating
Identification of the level and type of participant involvement
Notation of risks to the participant
Guarantee of confidentiality to the participant
Assurance that the participant can withdraw at any time
Provision of names of persons to contact if questions arise
5.7 SUMMARY OF CHAPTER 5
This chapter discussed the methodology used for the research. It provided an
overview of the methodological process comprising of literature review,
conceptual framework, the research approach and the validation of framework.
It examined different research approaches and their underlying philosophical
assumptions. It explored different research designs or strategies of inquiry
available for research including methods for data collection and analysis. It
discussed the selection and justification of the research approach, research
design and research methods for this study. The chapter also discussed the
sampling strategies and ethical issues considered for the research.

CHAPTER 6: QUALITATIVE STUDY ON THE IMPACT OF KM ON COPQ
202
CHAPTER 6
QUALITATIVE STUDY ON THE IMPACT OF KNOWLEDGE
MANAGEMENT ON THE COST OF POOR QUALITY
This chapter discusses the results from the qualitative study on the impact of
knowledge management on the cost of poor quality. It presents the profile of the
interviewees involved in the study. It discusses the findings on the contributory
factors to the cost of poor quality in practice which includes the cost of errors
and omissions, cost of design changes and the cost of poor skills. The chapter
discusses the findings on the impact of knowledge management on these costs.
It presents and discusses the findings on the optimisation of knowledge
management to reduce the cost of poor quality on construction projects. The
chapter also presents a modified conceptual framework and draws conclusions
on the qualitative study.
6.1 PROFILE OF INTERVIEWEES
The interviewees were selected from industry communities of practice and
expert forums across UK based on eligibility criteria which included project
experience, organisational experience and job designation (see Table 6.1). The
interviewees have acquired years of experience in large construction
organisations (over 250 employees) in the supply chain. All of the interviewees
have worked with main contractors, and have been involved in a diverse range
of projects. Although the UK construction industry is made up mostly of small
and medium sized organisations (up to 250 employees), large organisations
particularly the main contractors undertaking large projects tend to engage
several of these smaller organisations in their supply chain (BIS 2013).

CHAPTER 6: QUALITATIVE STUDY ON THE IMPACT OF KM ON COPQ
203
Table 6. 1: Profile of interviewees
Interviewee ID
Years of experience
Project experience*
Organisation experience*
Current designation
A 40 1, 2, 3, 4, 5, 6 1, 2, 3, 5, 8 Director/continuous improvement B 35 1, 6 1, 2, 3, 4, 8 Director/architecture C 33 1, 2, 4, 6 1, 2, 3, 4, 7 Supply chain manager D 32 1, 6 1, 2, 3, 7 Senior consultant/strategy innovation E 30 1 1, 2, 3, 5 Director/supply chain knowledge management F 30 1 1, 2, 3 Director/technology G 30 1, 2 1, 2, 3 Director/performance improvement H 29 4 3, 4 Project design engineer I 25 1 1, 2, 3 Cost consultant J 23 1, 2, 3 1, 2, 3 Director/knowledge management K 23 1, 2, 4 2, 3, 6 Director/operations L 15 2 2, 3 Site engineer M 14 4 2, 3, 4, 5 Project engineer N 14 1, 2, 3, 4, 5 2, 3, 5 Projects control manager O 14 4 2, 3, 5 Project risk engineer P 12 1 3, 5 Project manager Q 12 4 3, 4 Senior design engineer R 10 1, 2 2, 3 Change manager/ knowledge management S 10 4 3, 4 Project design engineer T 8 5 1, 3 Project engineer U 8 2 3 Site surveyor V 8 5 1, 3 Engineer/water W 7 1 3 Senior quantity surveyor X 6 4 3 Design engineer Y 6 4 3 Design engineer
*Key
Project experience Organisation experience
1 – Building construction 2 – Highways 3 – Rail 4 – Utility (power) 5 – Utility (water) 6 – Other
1 – Client organisation 2 – Consultancy 3 – Main contractor 4 – Design organisation 5 – Project management 6 – Sub-contractor 7 – Supplier 8 – Other
The study therefore adopted a top-down approach by selecting interviewees
from the main contractor organisations. Interviewee job levels were categorised
into either ‘managerial’ or ‘operational’ to allow for variation and comparison of
perspectives (see Table 6.2). Thirteen (13) of the interviewee job levels were
managerial while twelve (12) of them were operational. This represents 52%
and 48% of total interviewees respectively.

CHAPTER 6: QUALITATIVE STUDY ON THE IMPACT OF KM ON COPQ
204
Table 6. 2: Job level of interviewees
Job level No of interviewees
Managerial 13
Operational 12
Total 25
The years of experience of interviewees ranged from just over five (5) years to
over thirty (30) years (Table 6.3). This allowed for a wide distribution of years of
experiences which positively influenced the variation of responses from
interviewees.
Table 6. 3: Years of experience of interviewees
Years of experience No of interviewees
>30 4
>20 ≤ 30 7
>10 ≤ 20 6
>5 ≤ 10 8
Total 25
Interviewees have acquired a variety of experiences from different sectors in the
construction industry (Table 6.4). Majority of the interviewees (56%) have
worked in building construction, 44% have worked in utility (power) while 36%
have worked in the highway sector. 16% of the interviewees have worked in
utility (water) while 12% have worked in the rail sector.
Table 6. 4: Project experience of interviewees
Project experience No of interviewees % of Interviewees
1. Buildings 14 56%
2. Highways 9 36%
3. Rail 3 12%
4. Utility (power) 11 44%
5. Utility (water) 4 16%
6. Other 4 16%

CHAPTER 6: QUALITATIVE STUDY ON THE IMPACT OF KM ON COPQ
205
Interviewees not only possessed various project experiences but also various
organisational experiences (Table 6.5). All of the interviewees have worked for
main contractors at various stages of their work experience. 44% of the
interviewees have worked for client organisations, 36% for consultancies, 24%
have each worked for design organisations and project management
organisations. Few of the interviewees (4%) have worked with sub-contractors.
It was important however that all of them worked with main contractors as they
form the core of the investigation on the impact of KM on COPQ.
Table 6. 5: Organisational experience of interviewees
Organisational experience No of interviewees % of interviewees
1. Client organisation 11 44%
2. Consultancy 9 36%
3. Main contractor 25 100%
4. Design organisation 6 24%
5. Project management 6 24%
6. Sub-contractor 1 4%
7. Supplier 2 8%
8. Other 2 8%
Despite the current job designation of the interviewees, their main areas of
expertise were found to be in knowledge management, quality management,
cost management, project management and design management (Table 6.6).
Seven (7) interviewees are experts in knowledge management, six (6) each in
project management and design management, four (4) in quality management
and two (2) in cost management.

CHAPTER 6: QUALITATIVE STUDY ON THE IMPACT OF KM ON COPQ
206
Table 6. 6: Areas of expertise of interviewees
Areas of expertise No of interviewees Interviewee ID % of interviewees
Knowledge management 7 A, C, D, E, G, J, R 28%
Quality management 4 F, K, N, O 16%
Cost management 2 I, W 8%
Project management 6 L, M, P, T, U, V 24%
Design management 6 B, H, Q, S, X, Y 24%
The expertise of the interviewees is not limited to one type of project or
organisation. What they all have in common however is that they have worked
for main contractors and have all been involved in industry-wide KM initiatives.
The research methodology has been discussed in Chapter 5. This chapter
discusses the results.
6.2 CONTRIBUTORY FACTORS TO THE COST OF POOR
QUALITY
The findings presented in this section are based on the interviewee responses
to the interview questions from Section B of the interview questions template
(Appendix 4). The questions were as follows:
(1) From your experience of construction projects, what are the contributory
factors to the cost of errors and omissions on projects? (2) What are the
contributory factors to the cost of design changes during projects? (3) What are
the contributory factors to the cost of poor skills on projects? The interview data
analysis was discussed in section 5.4.1. The sample coding for the data are
shown in Table 5.2.2 and 5.2.3 under sub-section 5.4.4.4. The findings were
based on recurrent themes and commonality of responses across all
interviewees. This enables the identification of factors that are widespread and
CHAPTER 6: QUALITATIVE STUDY ON THE IMPACT OF KM ON COPQ
207
cut across all project types. The contributory factors to COPQ are discussed in
the next three sub-sections.
6.2.1 Contributory factors to the cost of errors and omissions
The cost of errors and omissions include costs associated with erroneous
construction methods and procedures, and omissions of construction activities.
Errors and omissions were found mostly within the construction phase of
projects which usually involved the activities of the main contractor and how
they manage their sub-contractors. According to Interviewee B, “It’s usually a
contractor problem, my suggestion is how they should be controlling the
workforce better so that these things don’t happen…”. The themes that
emerged from the coding of the interview data are: rule-based mistakes;
knowledge based mistakes; slips and lapses of attention; lack of lessons learnt;
habits; organisational culture; time constraints; budget constraints; poor
communication; procurement strategy; design issues; and construction product
issues.
6.2.1.1 Rule-based mistakes
Rule-based mistakes arise from selecting a wrong solution to a problem. These
are actions that match intentions but do not achieve their intended outcome due
to incorrect application of a rule or inadequacy of the plan. Rule-based mistakes
involve utilising old methods for new challenges. An example of this was
described by one of the interviewees in which a particular rule applied on a
utility (power) project was attempted on a similar and new project but was due
to fail.

CHAPTER 6: QUALITATIVE STUDY ON THE IMPACT OF KM ON COPQ
208
“… we’ve got a project that we are working and it’s a prototype of what’s
being delivered in France so our assumption was that we were going to
take the design from France and execute it in the UK but along the line
we got to realised that the building regulations over here is not making
the design from France work … if we had progressed to deliver it we
would have had a lot of issues with construction at the end of the day” –
Interviewee N
6.2.1.2 Knowledge based mistakes
Knowledge-based mistakes arise from insufficient knowledge about how to
perform a task. This results in the development of a solution that is incorrectly
expected to work. Personnel are usually faced with this problem when working
with new concepts, unfamiliar designs or construction processes.
“Basically I will say that some of the challenges we faced on that project
(building project) was that some of these concepts that were not well
thought through and was not totally based on previous design it was a
great departure from well known design” – Interviewee M
In this particular case, the sequence of work was not entirely understood. This
led to project delays, errors and additional costs.
6.2.1.3 Slips and lapses of attention
This type of error occurs at the point of task execution, and includes actions
performed by unintentionally skipping or reordering a step in a procedure,
performing the right action on the wrong object, or performing the wrong action
on the right object.

CHAPTER 6: QUALITATIVE STUDY ON THE IMPACT OF KM ON COPQ
209
6.2.1.4 Lack of lessons learnt
This relates to the repetition of mistakes due to lack of learning from past
experiences or trying to ‘re-invent the wheel’. Lack of lessons learnt is one of
the most common contributors to the cost of errors and can sometimes lead to
unquantifiable costs such as fatalities. Two examples of this were given by one
of the interviewees who worked on a highway project. One of the examples
involved fatalities as a result of lack of lessons learnt.
“I started hearing things like…a mini digger had fallen over on site
causing somebody injury obviously causing the impact on the
work…then a few weeks later I heard another mini-digger had fallen over
on another site and I just thought why are we not learning from each
other basically the incline they were using was too steep for this
particular mini-digger so its common sense really but why havn’t we
learnt from the first thing happening and why is it happening again” –
Interviewee R
“Lack of lessons learnt can lead to fatalities. Two people died while I was
there..(motorist fatalities due to company’s errorneous placement of
cones)… and that happened twice while I was there in five years… but
we didn’t learn the first time” – Interviewee R
6.2.1.5 Habits
Habits relate to the routine of behaviour that is repeated regularly and tends to
occur unconsciously, sometimes negative. The negative habits that were
identified during the interviews include; site personnel trying to cut corners,
laziness, and general non-compliance with guidelines.

CHAPTER 6: QUALITATIVE STUDY ON THE IMPACT OF KM ON COPQ
210
6.2.1.6 Organisational culture
This represents the collective values, beliefs and principles of organisational
personnel which can sometimes be adversarial. This includes blame culture in
which personnel point the ‘finger of blame’ in an adversarial way, which in effect
reduces innovation potential. Knowledge hoarding was also identified as an
embedded in certain organisational culture in which personnel are reluctant to
share their knowledge in order not to lose their competitive advantage.
6.2.1.7 Time constraints
Time constraints were identified as a significant factor contributing to the cost or
errors and omissions. Interviewees suggested that personnel are bound to
commit errors if they are under time pressure. An example was given by one of
the interviewees who worked on a highway project.
“While taking levels, the benchmark was moved, the staff was read
upside down. Consequently an error of up to one metre was transferred
to all the levels and that cost us thousands of pounds. Everybody makes
mistakes you know… I don’t care if you have five years experience if
somebody is rushing you, if you are under pressure you must make a
mistake ...” – Interviewee U
6.2.1.8 Budget constraints
Margins were being squeezed by low bidding and excessive competition
encouraged by clients, leading to shortage of resources to do good quality jobs.
Lowest bidding usually lead to ‘penny wise pound foolish’ syndrome in which
incompetent contractors are unknowingly hired and end up costing more in
errors or damages in the course of the project.

CHAPTER 6: QUALITATIVE STUDY ON THE IMPACT OF KM ON COPQ
211
“People (clients) hack down the price and then expecting better value
…and you know what happens is the cheaper price looks very nice on
paper, you accept it you go with it, the guy that gives you the cheaper
price hasn’t got the means… business is not well supported and probably
doesn’t have the right level of health and safety, quality control, quality
assurance and what ends up happening is these guys get spread too
thinly and they then can’t do the job they then become quite unproductive
they then lose money they then go out of business” – Interviewee K
6.2.1.9 Poor communication
This includes poor information flow on-site, poor definition of tasks, language
barrier and so on. While poor communication within the project team can
increase costs associated with errors, good communication at all levels can
lead to innovation and better technical solutions.
6.2.1.10 Procurement strategy
Errors were found more likely to occur on projects adopting procurement
strategies that are less favourable to collaboration and knowledge sharing
among supply chain.
6.2.1.11 Design issues
Errors on site can result from design issues from the drawing office. A relevant
example was given by one of the interviewees working on a utility (power)
project.
“There is a project where they did everything before doing site
investigation and because they didn’t do the site investigation they had
many problems on site and also because of steel structure design was

CHAPTER 6: QUALITATIVE STUDY ON THE IMPACT OF KM ON COPQ
212
wrong, they had faulty steel manufactured members. When they took
these members to the site for installation they didn’t fit and it was too late
and they had to do everything from the beginning and they lost loads of
time. According to the contract, it was the full responsibility of (the
company) to provide the correct design and on time” – Interviewee S
6.2.1.12 Construction product issues
Multiplicity of new construction products and interfaces create installation
challenges on site thereby leading to errors. Sub-standard and defective
products also contribute to these errors. Personnel in these cases do not
understand how the products worked which results in workmanship issues. The
use of cheap materials also contributes to errors.
“Sometimes it is poor products, poor design, sometimes poor
workmanship, sometimes it is the unexpected consequences of
materials not working very well” – Interviewee D

CHAPTER 6: QUALITATIVE STUDY ON THE IMPACT OF KM ON COPQ
213
Table 6. 7: Summary of the contributory factors to the cost of error and omissions
Contributory factors to the
cost of errors and omissions
Description
Rule-based mistakes
Selecting a wrong solution to a problem. These are actions that match intentions but do not achieve their intended outcome due to incorrect application of a rule or inadequacy of the plan.
Knowledge based mistakes Insufficient knowledge about how to perform a task results in the development of a solution that is incorrectly expected to work
Slips and lapses of attention
Error occurs at the point of task execution, and includes actions performed by unintentionally skipping or reordering a step in a procedure, performing the right action on the wrong object, or performing the wrong action on the right object
Lack of lessons learnt
Repetition of mistakes due to lack of learning from past experiences
Habits Routine of behaviour that is repeated regularly and tends to occur unconsciously, sometimes negative e.g. trying to cut corners, laziness, non-compliance
Organisational culture Represents the collective values, beliefs and principles of organisational personnel which can sometimes adversarial e.g. blame culture, knowledge hoarding.
Time constraints
The notion that projects are time constrained therefore workers are bound to commit errors under time pressure
Budget constraints Margins being squeezed by low bidding and excessive competition encouraged by clients, leading to shortage of resources to do good quality jobs.
Poor communication This includes poor information flow on-site, poor definition of tasks, language barrier etc.
Procurement strategy Errors are more likely to occur on projects adopting procurement strategies that are less favourable to collaboration and knowledge sharing among supply chain.
Design issues
Transference of errors from design to construction
Construction product issues Multiplicity of new construction products and interfaces create installation challenges on site thereby leading to errors. Sub-standard, and defective products also contribute to errors
6.2.2 Contributory factors to the cost of design changes
Design changes include design revisions, modifications and improvements
during the design and construction phase of a project. There is a level of
tolerance for design changes during the design phase; however, frequent
changes during the construction phase constitute additional unnecessary costs
in rework. The focus therefore is on the design changes that occur during the
construction phase. It was found that changes were mostly initiated by the client
and sometimes by other organisations in the supply chain e.g. the main

CHAPTER 6: QUALITATIVE STUDY ON THE IMPACT OF KM ON COPQ
214
contractor, the architect or the structural engineer. There was a notion that
design change is inevitable and that design is an iterative process in which
provision has to be made for. According to Interviewee E, “design changes are
mainly due to client changes. For example during the construction of (building
name), the client suddenly wants a swimming pool on the 40th floor. This cost a
lot of money and time. There will always be design changes during the life of a
project. It keeps changing and nothing can be done about it…” Other
contributory factors to design changes were found to be: unforeseen site
conditions; poor communication among supply chain; poor client expertise;
constructability issues; errors and omissions on site; procurement strategy; time
constraints; and budget constraints.
6.2.2.1 Client/end-user change
Most changes that occur during construction projects are initiated by the client
or the end-user. Client usually request changes to product requirement, project
definition or project scope. This has significant effect on the cost of poor quality.
A few of the experiences relating to client change are described by the
interviewees.
“The project (building project) was challenging, we didn’t deliver to time,
we didn’t deliver to budget. Why was that? The reason was an unclear
definition what the requirements were by the client. There was a lower
level involvement of the business in the definition of the project initially” –
Interviewee C
“I’ve come across a number of design changes, some of these changes
do come due to client requests, clients changing their minds on what

CHAPTER 6: QUALITATIVE STUDY ON THE IMPACT OF KM ON COPQ
215
they want or what they don’t want. Those are changes we still try to
manage within the design phase” – Interviewee O
“Some clients just think oh well I’m paying the bills I can change my mind
whenever I want, still get it done on time and on price and everything,
that’s when you run into trouble on these big and complex projects”. –
Interviewee I
6.2.2.2 Other changes
Other changes are initiated by the contractor, the architect, structural engineer
and even external stakeholders who are not part of the project team. They
usually make request to change product requirement and definition, project
scope or construction process. The contractor for example may request design
change as a result constructability issues. In the case of external stakeholder
change, according to Interviewee X, “…change can occur due to building
regulations”
6.2.2.3 Design change inevitable
In construction project management, there is a general perception that design is
an iterative process, and is bound to change throughout the construction phase.
In other words, design evolves in the course of the project therefore the contract
should make provision for this.
“Design change is normal in certain types of contract. Design and build
contract allows for the design to evolve during the duration of the
contractual period” – Interviewee J

CHAPTER 6: QUALITATIVE STUDY ON THE IMPACT OF KM ON COPQ
216
“Some changes are needed really because of the evolution of the design
in generalities obviously some changes occur because the client
physically changes his mind and the key thing to me with regard to
changes which are inevitable, it’s going to actually happen”
– Interviewee D
6.2.2.4 Unforeseen site conditions
Unforeseen site conditions were found to contribute to design changes and
associated costs. This includes unforeseen ground conditions, inclement
weather, location of utilities underground etc. this situation is usually brought
about by lack of thorough site investigation, or lack of time to conduct the
investigations.
“I’ll pick on an instance, we have got a substation to connect (with
transmission lines), it’s a brand new substation. You are not always able
at the beginning of the scheme to basically fix the interface between you,
the ovehead line and also the substation so when the substation people
finally get on site and its not exactly a flat site, but they’ve got to cut and
fill with their big bulldozers so you start to see the levels going up and
down and things moving that means we have to basically going back and
revisit the design” – Interviewee H
“There is a project where they did everything before doing site
investigation and because they didn’t do the site investigation they had
many problems on site and also because the steel structure design was
wrong, they had faulty steel manufactured members. When they took
these members to the site for installation they didn’t fit and it was too
CHAPTER 6: QUALITATIVE STUDY ON THE IMPACT OF KM ON COPQ
217
late. They had to do everything from the beginning and they lost loads of
time and money” – Interviewee S
6.2.2.5 Poor communication
Poor communication among project team was found to be a recurrent
contributor to the cost of design changes. This includes poor communication of
client need to the designer or poor communication between the designer and
the contractor. Poor communication can come as a result of lack of flow of
design information, poor document control, unclear definition of client
requirement or even language barrier among personnel.
“Certainly they (clients) are not experts in contruction, they don’t know
the language, they don’t know what they want, and when you actually
give it to them they realise its not what they want, so I think that possibly
the greatest problem is actually communicating effectively with the client”
– Interviewee B
“...the problem really was lack of communication because the
construction site was in Scotland and project team was there but the
design team, they are in India and the manufacturing company is in
Turkey. So management could not coordinate all these three groups.
India didn’t get the up to date information from site and prepare the
design on all the information and the design went to the manufacturing
company and the members were manufactured according to the wrong
design and they were shipped to scotland” – Interviewee S

CHAPTER 6: QUALITATIVE STUDY ON THE IMPACT OF KM ON COPQ
218
6.2.2.6 Poor client expertise
Clients are not necessarily experts in construction, the costs associated to
design changes can also be attributed to this factor. Clients sometimes do not
fully understand the implications of design and construction scope changes
particularly quality implications, time implications, and cost implications.
6.2.2.7 Constructability issues
The learning curve is usually steep when experimenting with non-conventional
designs or never-before-tested concepts. There is bound to be design changes
in the course of these types of projects. Architects sometimes lack adequate
construction experience therefore producing impracticable or incompatible
designs. Multiple examples were cited by interviewees, two of which were
presented below.
“Our mega projects where you’ve got multiple components multiple
systems coming in, if you miss one, you’ve got a potential 6 months
delay on the project and you could be running into substantial capital
costs to fix the problem so dimensional control is always a challenge as
well as interface control” – Interviewee O
“Just because it works on paper doesn’t mean it works in reality. It’s lack
of knowledge and poor skills but it is also because we have such a
plethora of materials to chose from so it’s hard to know how every
interface with new products materials work together” – Interviewee G

CHAPTER 6: QUALITATIVE STUDY ON THE IMPACT OF KM ON COPQ
219
6.2.2.8 Errors and omissions on site
Sometimes construction errors committed on site can lead to a change or
modification of existing design to accommodate the errors. This may seem
unprofessional but it is often practiced.
“The one that actually stands out in my mind is foundation design for a
particular tower. The orientation on the design was ok but on site they
didn’t place the foundation very well so the tower was out of place and
would not sit on the foundation so we had to tink round our design and
do some reconstruction both on site and work our design to make the
tower fit on the foundation” – Interviewe Q
6.2.2.9 Procurement strategy
The choice of procurement strategy or contract type can influence the cost
performance of a project. It was found that some of the procurement strategies
did not facilitate early involvement and collaboration of supply chain in
contributing to the design phase of a project. It was also found that some
procurement strategies did not support design innovation.
“It all depends on the procurement process because some procurement
processes do not allow for design innovation to happen. If you are using
a fast track approach to construction where you almost started on site
before the designs are completed and as the construction is commencing
you are actually desinging the project” – Interviewee J
“If you can get all the parties involved to buy in from the design stage all
the way through the project, you sort of eliminate stupidity waste” –
Interviewee I

CHAPTER 6: QUALITATIVE STUDY ON THE IMPACT OF KM ON COPQ
220
6.2.2.10 Time constraints
Time pressure to commence construction quickly can imply that in-adequate
time is spent on design and planning. It is very common in the construction
industry to rush to commence work on site before the design stage is thoroughly
reviewed.
“I would say as for jobs originally being scoped out correctly or in
sufficient detail, it is easier for the contractor to correctly tender for that
work…but has the contractor during its tendering process put sufficient
time and resourcing to identify all the work that is required? The other
one comes from the client to give you sufficient time before you are
expected to be on site to build…” – Interviewee H
“Where the client, architect, engineers or project management people
didn’t get their end sorted by the time the contractor was appointed, it
just became a battle throughout the actual construction stage. There is
sort of design as you go mentality” – Interviewee I
6.2.2.11 Budget constraints
Not designing to cost from inception leads to future design changes e.g. scaling
down scope of work.
“We design to cost so actually the client gets the bespoke building they want for
the price they can afford. Designers should be made to design to cost from the
onset so they build in products and materials that are appropriate to cost that
the client can afford so you build it up using the correct components” –
Interviewee G
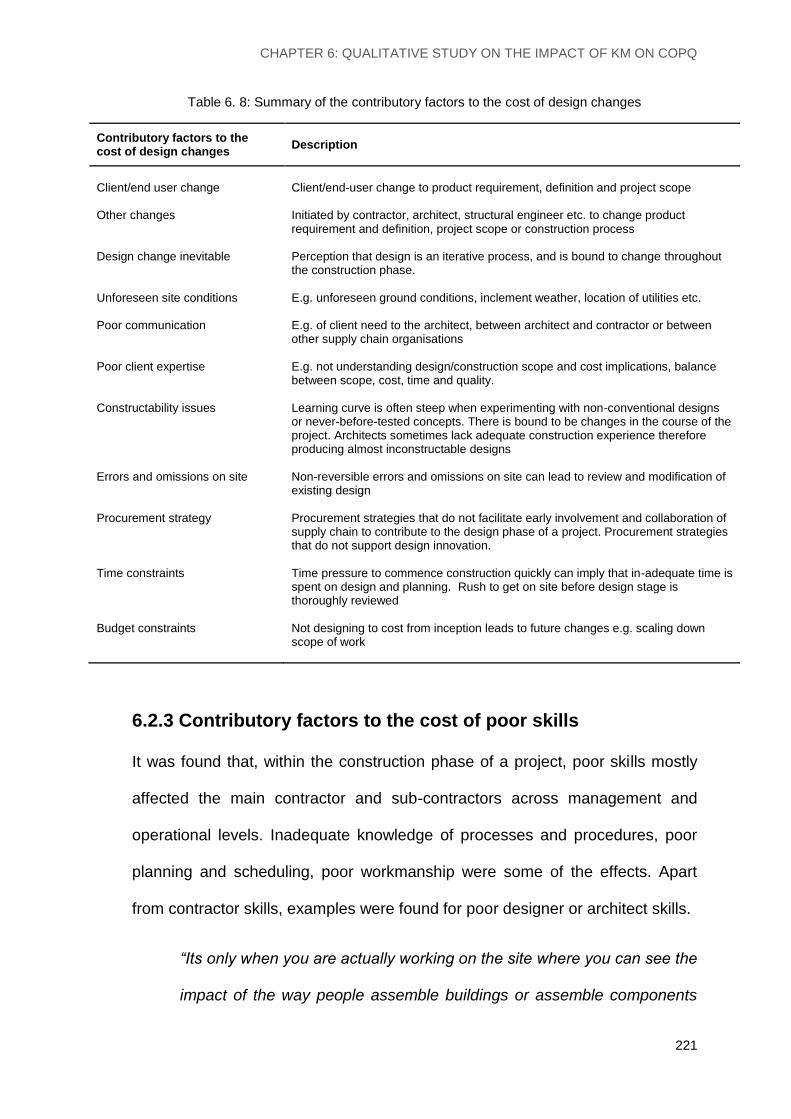
CHAPTER 6: QUALITATIVE STUDY ON THE IMPACT OF KM ON COPQ
221
Table 6. 8: Summary of the contributory factors to the cost of design changes
Contributory factors to the cost of design changes
Description
Client/end user change
Client/end-user change to product requirement, definition and project scope
Other changes
Initiated by contractor, architect, structural engineer etc. to change product requirement and definition, project scope or construction process
Design change inevitable
Perception that design is an iterative process, and is bound to change throughout the construction phase.
Unforeseen site conditions
E.g. unforeseen ground conditions, inclement weather, location of utilities etc.
Poor communication E.g. of client need to the architect, between architect and contractor or between other supply chain organisations
Poor client expertise E.g. not understanding design/construction scope and cost implications, balance between scope, cost, time and quality.
Constructability issues Learning curve is often steep when experimenting with non-conventional designs or never-before-tested concepts. There is bound to be changes in the course of the project. Architects sometimes lack adequate construction experience therefore producing almost inconstructable designs
Errors and omissions on site Non-reversible errors and omissions on site can lead to review and modification of existing design
Procurement strategy Procurement strategies that do not facilitate early involvement and collaboration of supply chain to contribute to the design phase of a project. Procurement strategies that do not support design innovation.
Time constraints Time pressure to commence construction quickly can imply that in-adequate time is spent on design and planning. Rush to get on site before design stage is thoroughly reviewed
Budget constraints Not designing to cost from inception leads to future changes e.g. scaling down scope of work
6.2.3 Contributory factors to the cost of poor skills
It was found that, within the construction phase of a project, poor skills mostly
affected the main contractor and sub-contractors across management and
operational levels. Inadequate knowledge of processes and procedures, poor
planning and scheduling, poor workmanship were some of the effects. Apart
from contractor skills, examples were found for poor designer or architect skills.
“Its only when you are actually working on the site where you can see the
impact of the way people assemble buildings or assemble components

CHAPTER 6: QUALITATIVE STUDY ON THE IMPACT OF KM ON COPQ
222
safely in that environment, it automatically changes the framework of the
way that you think, people (designers) who have not got that experience
tend to say I just designed it, I’m not a skilled installer or erector of these
things that’s the contractors problem or issue so there is a lack of holistic
thinking that sometimes goes on with regards to designer who does
design individual components” – Interviewee D
‘One of the things we are finding is actually a lot of architects don’t know
how to specify. What they are actually specifying is incorrect and it’s the
buildability and the experience of our guys (building contractor
personnel) challenging them to say that’s not right or it shouldn’t be done
like that or…the way you showed the tiles…or where you showed the
damp proof is wrong…and working in the firm to get it right’
– Interviewee G
The contributory factors to the costs of poor skills were identified as: high
personnel turnover; lack of training; lack of dedication; complacency; time
constraints; budget constraints; project based nature of the industry; and
organisational culture.
6.2.3.1 High personnel turnover
Uncertainties associated with winning new work by supply chain organisations
often lead to a cycle of redundancies and re-recruitment. The widespread use of
temporary workers prevents the capture and retention of knowledge within
organisations. There is also a difficulty in attracting and retaining younger
workforce. Unfortunately the construction industry is heavily reliant on
experience which is only built over a long period of time. The inability to retain

CHAPTER 6: QUALITATIVE STUDY ON THE IMPACT OF KM ON COPQ
223
personnel therefore contributes immensely to the costs associated with poor
skills in construction.
“In this industry, they come and they go out very fast. Money is another
issue as well for construction people and a lot of these young people
think the job is going to be easy, so the graduates when they come in
they do like office work not outside work, they are not very exposed and
are not getting proper guidance from the senior engineers”
– Interviewee L
6.2.3.2 Lack of training
There was a consensus among all the interviewees that the industry lacks
adequate training construction personnel.
“The problem with the industry at the moment is the trades people
because of the constant ups and downs in the industry we just don’t train
enough quality trades people anymore sort of plumbing electrical
systems even in like domestic build, getting ever and ever more
complex” – Interviewee I
6.2.3.3 Lack of dedication
There is lack of dedication to work especially among younger people, majority
of which are not willing to stay in the industry on the long run.
“Probably its happening everywhere, things like lack of communication
probably they (senior personnel) feel that the youngsters coming into the
industry are not going to be there for very long, some of them come in
and go out, some of them just come because of the salary, some of them

CHAPTER 6: QUALITATIVE STUDY ON THE IMPACT OF KM ON COPQ
224
come because of the benefit, some of them come to learn for a short
period and move on” – Interviewee L
6.2.3.4 Complacency
Complacency relates to the attitudes of personnel and their unwillingness to
learn new things or be criticised.
“Some of our staff they’ve got big attitude you know you’ve been there so
long and they know the job, sometimes they don’t do their jobs (properly)
so we address their seniors and their seniors will always, talk to them
and get everything rectified” – Interviewee L
6.2.3.5 Time constraints
Perceived time pressure prevents organisations from investing time to train
personnel and to transfer knowledge from experienced personnel to less
experienced ones poor time keeping.
6.2.3.6 Budget constraints
Budget constraints often leave little provision for apprenticeships and mentoring
opportunities as well as sourcing for the right personnel for construction
projects. Examples are cited from the interviews:
“It started from the tender team and the project management team, they
didn’t want to spend money to help source for or staff the job properly
really. So its management really, it was their fault” – Interviewee U
“I started to monitor my colleagues on how long things were taking and
then comparing that with how long we had priced in estimate to do the
job and then very quickly we begin to realise that we estimate something

CHAPTER 6: QUALITATIVE STUDY ON THE IMPACT OF KM ON COPQ
225
to take so long but in reality it takes a lot longer so that then creates an
overspend of labour costs against what you are estimating for. If the
whole business takes longer than it takes in the estimates in your bids,
you quickly go out of business” – Interviewee K
6.2.3.7 Project based nature of industry
It is challenging for organisations to make long term commitments to skills
development due to the short term project based nature of the industry.
6.2.3.8 Organisational culture
Adversarial organisational culture has impact on skills in several ways which
include in-adequate knowledge sharing by project personnel and non
trasferrence of knowledge or vital skills from experienced personnel to less
experienced ones. Furthermore there was evidence of disconnect between
experienced personnel and junior ones.
“We had a bridge that collapsed which we are supposed to get our
juniors to go out. We’ve got team of inspectors who’ve been there for 30
odd years never passed on the skills to youngsters or to the juniors so I
think that the the seniors are not passing down their knowledge or their
experience to the juniors”– Interviewee L
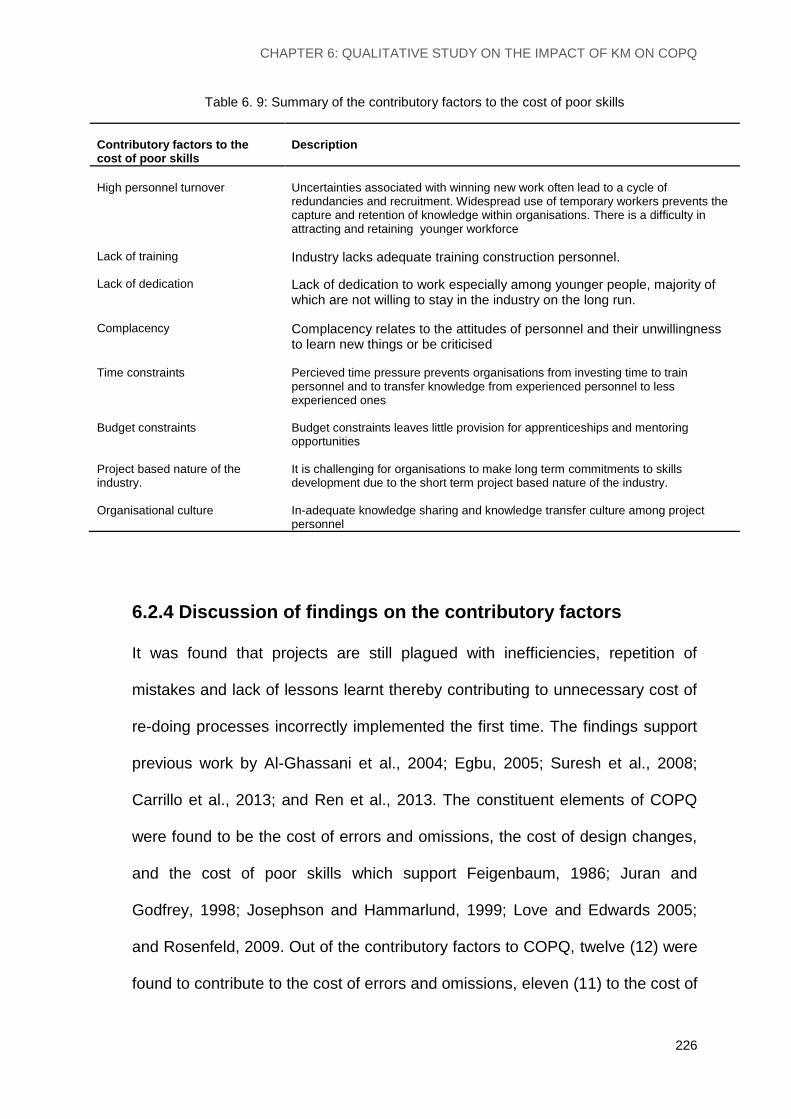
CHAPTER 6: QUALITATIVE STUDY ON THE IMPACT OF KM ON COPQ
226
Table 6. 9: Summary of the contributory factors to the cost of poor skills
Contributory factors to the cost of poor skills
Description
High personnel turnover
Uncertainties associated with winning new work often lead to a cycle of redundancies and recruitment. Widespread use of temporary workers prevents the capture and retention of knowledge within organisations. There is a difficulty in attracting and retaining younger workforce
Lack of training
Industry lacks adequate training construction personnel.
Lack of dedication
Lack of dedication to work especially among younger people, majority of which are not willing to stay in the industry on the long run.
Complacency
Complacency relates to the attitudes of personnel and their unwillingness to learn new things or be criticised
Time constraints
Percieved time pressure prevents organisations from investing time to train personnel and to transfer knowledge from experienced personnel to less experienced ones
Budget constraints
Budget constraints leaves little provision for apprenticeships and mentoring opportunities
Project based nature of the industry.
It is challenging for organisations to make long term commitments to skills development due to the short term project based nature of the industry.
Organisational culture
In-adequate knowledge sharing and knowledge transfer culture among project personnel
6.2.4 Discussion of findings on the contributory factors
It was found that projects are still plagued with inefficiencies, repetition of
mistakes and lack of lessons learnt thereby contributing to unnecessary cost of
re-doing processes incorrectly implemented the first time. The findings support
previous work by Al-Ghassani et al., 2004; Egbu, 2005; Suresh et al., 2008;
Carrillo et al., 2013; and Ren et al., 2013. The constituent elements of COPQ
were found to be the cost of errors and omissions, the cost of design changes,
and the cost of poor skills which support Feigenbaum, 1986; Juran and
Godfrey, 1998; Josephson and Hammarlund, 1999; Love and Edwards 2005;
and Rosenfeld, 2009. Out of the contributory factors to COPQ, twelve (12) were
found to contribute to the cost of errors and omissions, eleven (11) to the cost of
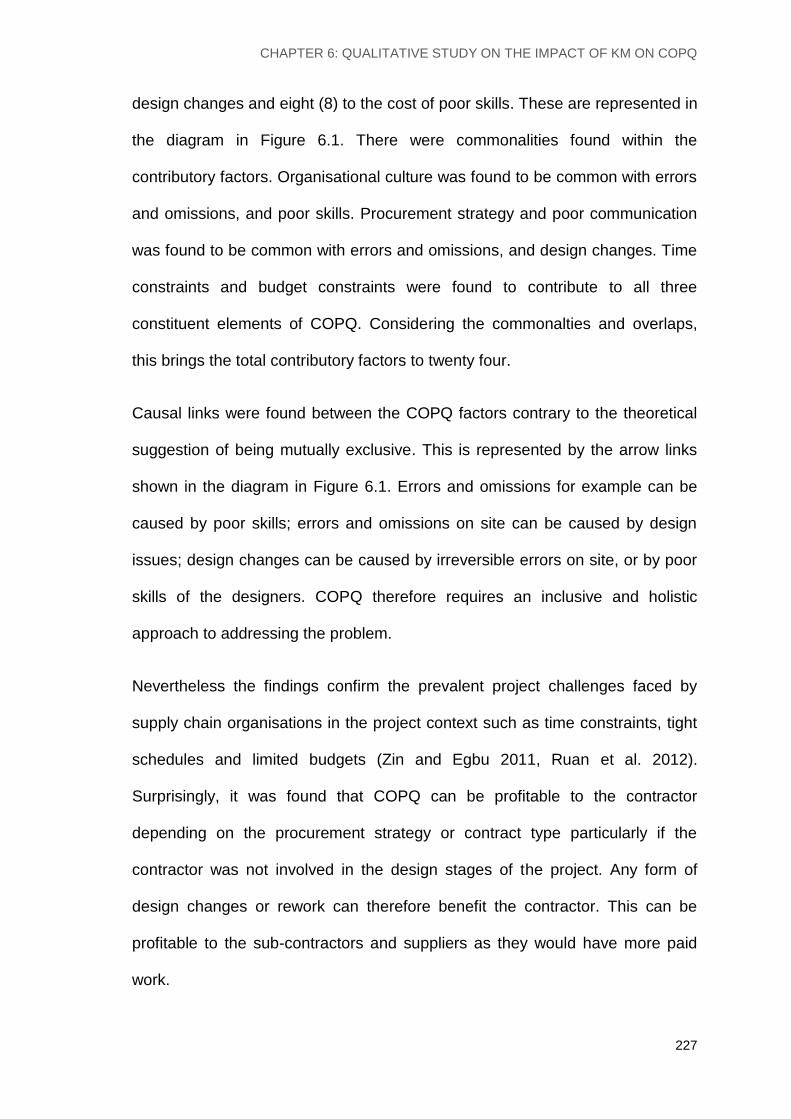
CHAPTER 6: QUALITATIVE STUDY ON THE IMPACT OF KM ON COPQ
227
design changes and eight (8) to the cost of poor skills. These are represented in
the diagram in Figure 6.1. There were commonalities found within the
contributory factors. Organisational culture was found to be common with errors
and omissions, and poor skills. Procurement strategy and poor communication
was found to be common with errors and omissions, and design changes. Time
constraints and budget constraints were found to contribute to all three
constituent elements of COPQ. Considering the commonalties and overlaps,
this brings the total contributory factors to twenty four.
Causal links were found between the COPQ factors contrary to the theoretical
suggestion of being mutually exclusive. This is represented by the arrow links
shown in the diagram in Figure 6.1. Errors and omissions for example can be
caused by poor skills; errors and omissions on site can be caused by design
issues; design changes can be caused by irreversible errors on site, or by poor
skills of the designers. COPQ therefore requires an inclusive and holistic
approach to addressing the problem.
Nevertheless the findings confirm the prevalent project challenges faced by
supply chain organisations in the project context such as time constraints, tight
schedules and limited budgets (Zin and Egbu 2011, Ruan et al. 2012).
Surprisingly, it was found that COPQ can be profitable to the contractor
depending on the procurement strategy or contract type particularly if the
contractor was not involved in the design stages of the project. Any form of
design changes or rework can therefore benefit the contractor. This can be
profitable to the sub-contractors and suppliers as they would have more paid
work.

CHAPTER 6: QUALITATIVE STUDY ON THE IMPACT OF KM ON COPQ
228
Figure 6. 1: Contributory factors to COPQ in practice
Cost of errors and omissions Rule based mistakes
Knowledge based mistakes Slips and lapses of attention
Lack of lessons learnt Habits
Design issues Construction product issues
Procurement strategy Poor communication
Time constraints
Budget constraints
Cost of design changes
Client/end-user change
Other changes
Design change inevitable
Unforeseen site conditions
Poor client expertise
Constructability issues
Errors and omissions on site
Organisational culture
Cost of Poor Skills
High personnel turnover
Lack of training
Lack of dedication
Complacency
Project based nature

CHAPTER 6: QUALITATIVE STUDY ON THE IMPACT OF KM ON COPQ
229
COPQ can also be profitable to the designer in the case of client’s decision to
change the design specification or the scope of work. Two examples are cited
below:
“You can make a fortune out of bad design. For the contractor bad
design is good right? Yeah, if you have a good sight to recognise these
things, delays delays delays and compensation” – Interviewee U
“If you are a construction company and don’t get involved in the design
and you are a contractor, the cost of change can be very good. I worked
for construction companies that when we won the contract we knew that
the client has selected the wrong form of contract. If the contract is right,
the cost of change will benefit who has to do this work. So is there a cost
of change to the client or is it an opportunity of more profit for the
contractor so it all depends on the type of contract you are under”
– Interviewee J
However, in most instances supply chain organisations are responsible for their
own ‘faults’. For example, the contractor is responsible for errors and omissions
on site while the client is responsible for any client changes and so on. An
example of a utility (power) project in which the contractor had to pay is cited
below.
“They (client) were not happy with it. What happened was that on that
scheme we didn’t make any profit we worked at a loss because we
didn’t finish on time, we lost the incentive on it and because we missed
out on the (power) outage, we lost a lot of money because someone had

CHAPTER 6: QUALITATIVE STUDY ON THE IMPACT OF KM ON COPQ
230
to pay for everyday that the line was down we paid significant amount to
people generating the elecrticity” – Interviewee Q
The rationale and the focus of this study is on reducing COPQ thereby
increasing profitability of all the organisations working on a project rather than
for one organisation to make gains to the detriment of another organisation on
the same project.
6.3 IMPACT OF KNOWLEDGE MANAGEMENT ON THE COST
OF POOR QUALITY
The findings presented here are based on Section C of the interview template
(Appendix 4). The main questions asked the interviewees are stated as follows:
Which knowledge management initiatives were in place on the projects you
worked on? How did the initiatives impact the reduction of errors and
omissions? How did the initiatives impact the reduction of design changes?
How did the initiatives impact the reduction of poor skills? The findings were
derived from the coding of the interview data (Section 5.4.4.4) and are
discussed in the next three sections.
6.3.1 Impact of knowledge management on the cost of errors
and omissions
KM was found to have positive impact in reducing rule-based mistakes,
knowledge based mistakes, lack of lessons learnt, poor communication, and
construction product issues. There was evidence of knowledge sharing across
personal, organisational and project levels. Across personal level for example,
Interviewee D stated that “we do encourage teamwork for all areas of our work.
We ensure that we have experts who share their knowledge with the rest of the

CHAPTER 6: QUALITATIVE STUDY ON THE IMPACT OF KM ON COPQ
231
team so that not only one person knows one thing but several people and these
people meet every time in order to keep that knowledge in the company”. In the
case of Interviewee L, “the company do have toolbox talks. Every month each
employee has to come up with a toolbox talk. For example if I pick up a defect
that nobody knows or I pick up a very scientific name or something that I
learned throughout my experience, I’ll give a talk of the month. I exchange my
knowledge in a toolbox talk”. At organisational level, Interviewee G stated that
“we have the knowledge bank, we have technical excellence groups.
The technical excellence group reviews the knowledge and the problems and
everything that come up and decide what is in our core processes and systems
we have to change to make sure that wouldn’t happen again, and then we have
a number of publications which we produce that goes through the main
functions and operations” Another example was from Interviewee Q who stated
that “we have lessons learnt in place and we keep records. They are all
documents but we have a way of putting everything online because immediately
it (issues) happens on site you have to write it down in your technical query log
and from that log book we transfer it to lessons learnt once the whole scheme is
finished”.
At project level, Interviewee E stated that “we ensure that we retain most of our
supply chain of about 60 companies and use them from project to project. The
benefit of this is that significant project knowledge is retained within the chain
there is a level of trust within the chain since they are rest assured that they will
be working together for a long time. The environment of trust therefore
encourages knowledge sharing among parties” Little evidence was found on

CHAPTER 6: QUALITATIVE STUDY ON THE IMPACT OF KM ON COPQ
232
industry level KM initiatives. Overall KM has less impact in reducing slips and
lapses of attention, habits, organisational culture, time constraints, budget
constraints, choice of procurement strategy, and erroneous designs carried over
into the construction phase.
6.3.2 Impact of knowledge management on the cost of design
changes
KM was found to have most impact on the cost of design changes at
organisational and project levels. Despite the notion that design change is
inevitable during the construction phase of a project, it was found that KM had
impact in reducing client and other supply chain changes, poor communication,
poor client expertise, constructability issues, site related errors and omissions.
Although Interviewee E stated that; “design is an iterative process therefore
change is inevitable”, it was found that early involvement and collaboration
among supply chain had positive impact in reducing the cost of design changes.
Interviewee H commented that “there are existing contracts with our client, they
were bringing the (sub) contractors in during the development stage of the job
at the feasibility stage and that does help out enormously cause they probably
get the right skill level and experience to identify all the work thats required for
that paricular project… that does have cost implications”. Similarly Interviewee I
commented that “If you can get all the parties involved to buy in from the design
stage all the way through the project, you sort of eliminate stupidity waste” KM
was found to have less impact on procurement strategy, time constraints and
budget constraints. The choice of procurement strategy however has impact on
KM. Organisations in the supply chain particularly the contractor stands to gain

CHAPTER 6: QUALITATIVE STUDY ON THE IMPACT OF KM ON COPQ
233
from design changes therefore would prefer continuous changes on projects to
increase profit margin. Interviewee U noted that “you can make a fortune out of
bad design. For the contractor bad design is good right? Yeah, if you have a
good sight to recognise these things, delays delays delays and compensation”.
Interviewee J similarly stated that “If you are a construction company and don’t
get involved in the design, the cost of change can be very good. I worked for
construction companies that when we won the contract we knew that the client
has selected the wrong form of contract. If the contract is right, the cost of
change will benefit who has to do this work. So is there a cost of change to the
client or is it an opportunity of more profit for the contractor so it all depends on
the type of contract you are under”.
6.3.3 Impact of knowledge management on the cost of poor
skills
It was found that KM has low impact in reducing high staff turnover however it
has strong impact in reducing the knowledge vacuum created by it. There was
evidence of knowledge sharing and knowledge transfer through mentoring in
order to retain knowledge of experienced staff and to improve the skills of the
less experienced ones. Interviewee O commented that “we’ve got mentoring
system, we’ve got line management system, we’ve got what is called functional
and their delivery line management system which is like dual role on its own so
that kinds of reduce the impact of knowledge erosion or knowledge loss”
Similarly Interviewee D commented that “people always work together in a
group basically for every position you find out that there are two or three other
people that are involved at times unfortunately we lose a good staff another

CHAPTER 6: QUALITATIVE STUDY ON THE IMPACT OF KM ON COPQ
234
person is there as capable as the other guy leaving. A loss of someone
probably does not mean that the knowledge is being lost”. There was a general
notion that the construction industry is project based and that every project is
unique therefore adversely affecting the impact of KM. Interviewee J
commented that “we are the only industry that is like a mobile factory, other
industries have a base, a facility, our business is the only business where the
construction site is the factory, and the factory is created to build this thing,
when you finish, the factory is taken away and the building is left. The only
industry in which we create a factory in each place we build and that’s why it’s a
satelite to all businesses”.
Perhaps this effect is felt by personnel and teams who have to split and move
on to other various projects. Interviewee A gave a related example; “At the end
of this scheme (infrastructure project), there was a review on what has gone
well, best practice and what has not gone as well and what you’re then hoping
for…and this is where I think we fall down a little bit, when you come to the next
scheme, or the scheme in 5 years time, unfortunately the people who have
gone through that painful experience on the earlier job either are not around
with the company or are not the people allocated with the experience of that to
the new scheme” KM was found to have less impact on time constraints, budget
constraints and organisational culture.
6.3.4 Discussion of findings on the impact of KM on COPQ
There was consensus in the responses from all the interviewees that KM has
positive impact in reducing COPQ however, the extent of the impact could not
be determined in terms of cost savings as it is neither measured nor tracked by

CHAPTER 6: QUALITATIVE STUDY ON THE IMPACT OF KM ON COPQ
235
organisations. According to Interviewee C, “there is no measurement in place. If
you can’t measure you can’t manage”. Interviewee G asserted that “the one
thing you will find extremely difficult in construction is to find anyone who can
put a figure on the cost of poor quality because none of us know how to do it,
and I meet up with my counterparts from half a dozen big contractors on a
regular basis and its one of the things we talk about and its really difficult we
just do not know how to cost it”. KM can be complex and difficult to manage
within organisations and on projects. Provision of data such as the cost and
benefits analysis on the amount invested in KM initiatives and the amount
saved by reducing COPQ could have helped in understanding the extent of the
impact. From literature review, it was revealed that larger organisations in the
construction industry are more likely to formally practice KM than the majority of
small and medium sized organisations. This study focused on large
organisations most of which actually practiced KM but not entirely in a
structured way. There was evidence of harnessing and integrating knowledge
utilising KM processes (e.g. knowledge sharing and knowledge codification) and
tools (e.g. knowledge bases and virtual collaborative workspaces). Other new
insights from the findings include the need to develop toolkits to track the impact
of KM on COPQ on projects and the need to adopt procurement strategies that
support KM at personal, organisational, project and industry levels.
6.4 OPTIMISATION OF KNOWLEDGE MANAGEMENT TO
REDUCE THE COST OF POOR QUALITY
The findings from this section are based on the interview questions relating to
the barriers to the optimisation of KM to reduce CoPQ which has been
discussed in section 5.4.1 (i.e. the design of the semi-structured interviews).

CHAPTER 6: QUALITATIVE STUDY ON THE IMPACT OF KM ON COPQ
236
The analysis of the interview data has also been discussed in section 5.4.4.
Interviewees were asked the following question: “From your experience in
construction projects and organisations, what are the barriers to the
optimisation of knowledge management to reduce the cost of poor quality?”
Optimisation in the context of this study means making the most effective use of
KM to reduce COPQ. It was found that KM currently has not been optimised to
reduce COPQ due to a number of barriers which emerged during the interviews.
6.4.1 Key barriers to be addressed to optimise KM
The barriers identified are; lack of assessment, lack of leadership, adversarial
organisational culture, time constraints, budget constraints, and procurement
strategy.
6.4.1.1 Lack of assessment
It was found that organisations lack tools or frameworks to assess the impact of
KM on COPQ. The common theme that emerged from all interviewee
responses was that KM has positive impact in reducing certain aspects of
COPQ however, none of the interviewees could evaluate the impact. It was
found that organisations neither measured nor tracked the impact which is
fundamental for optimisation. According to Interviewee C, “If you can’t measure
you cant manage, there is a whole new toolkit that needs to come out”.
Interviewee E noted that ‘there is no KPI for knowledge management’. It was
found that organisations did not have a systematic, structured approach to KM
with measurable outputs on COPQ reduction. Interviewee S for example
commented that “although we do a lot of knowledge management work, we
don’t formally have tools or structured methods”. At industry level, Interviewee A

CHAPTER 6: QUALITATIVE STUDY ON THE IMPACT OF KM ON COPQ
237
commented that “something that the industry lack is a common data capture
format. I think from an industry perspective if we had a common method of
collecting data so they could be aggregated and we could share from that, it
would help. So a lot have KPIs but they are not universally accepted. If we
could collect data in a common fashion then it would be easier for the industry
to aggregate their data and learn from it”.
6.4.1.2 Lack of leadership
Apart from lack of performance metrics, there was a lack of leadership i.e. the
absence or ineffectiveness of knowledge champions or coordinators to facilitate
KM within organisations and on projects. In certain cases where there were
knowledge champions, they did not get full support of senior management.
According to Interviewee R, “you have to have a knowledge champion,
sometimes these people wouldn’t send bits of information in so I had to set up a
process of visiting them regularly and phoning them regularly to keep them
motivated and part of the job was getting the information in”
6.4.1.3 Adversarial organisational culture
Organisational culture can be adversarial to the optimisation of KM. One of the
most significant adversarial culture is ‘knowledge hoarding’ by personnel i.e.
unwillingness of individuals to share knowledge. Personnel tend to to crave
authority and influence, guarding information therefore is perceived as gaining
upper hand or competitive advantage. Some feel that their jobs may be at risk if
they share all they know with their organisation and their colleagues therefore
the way to maintain job security is to be the only person who knows how to
perform a specific function. Blame culture is another significant adversarial

CHAPTER 6: QUALITATIVE STUDY ON THE IMPACT OF KM ON COPQ
238
culture within organisations and on projects. Blame culture holds individuals or
organisations responsible for comitting errors or mistakes rather than
incentivising for success. This discourages individuals or organisations from
reporting mistakes thereby preventing lessons learnt. There is also a culture of
“build it wrong and then fix it afterwards” in the construction industry whereby
errors, mistakes or snags are percieved as ‘normal’, and provisions standardly
made in the contracts to rectify them.
6.4.1.4 Time constraints
The barrier of time contraints relate to the perception that KM activities are time
consuming therefore adversely affecting project schedule and the productivity of
staff. According to Inerviewee G “some of the barriers are time and having the
time because we are so task focused they just want to get on and when they
finish that project they just want to get on and do the next project they don’t take
the time to think about what has gone well what didn’t go well, what could we
improve, they just want to get on to do the next job”. Interviewee E commented
that “no one has too much time to sit on a round table discussing knowledge
sharing et cetera, they’ve got to get to work”.
6.4.1.5 Budget constraints
Budget constraints barrier stems from the evidence that construction has gone
back to the adversarial cost driven era rather than the value driven one. The
supply chain organisations are too cost constrained to carry out KM activities.
6.4.1.6 Procurement strategy
Procurement strategy can be a key barrier if it does not facilitate integration and
collaborative working of supply chain which is crucial to new knowledge creation

CHAPTER 6: QUALITATIVE STUDY ON THE IMPACT OF KM ON COPQ
239
on processes and products. The right strategy can minimise supply chain
organisations striving for competitive advantage and maximisation of profit
rather than collaborating for the best outcome of the project. One of such
examples was given by Interviewee U thus ‘I think it depends on the type of
contract, sometimes the NEC contract or the ECI contract has a lot of early
involvement so you spot the problems but if its like ICE7 and so on, you get the
drawings and the tenders first, then the bill of quantities”. In other words certain
contracts stipulate early involvement of the supply chain while others do not.
6.4.2 Strategy for optimising KM to reduce COPQ
Optimising or making the most effective use of KM to reduce COPQ therefore
involves overcoming the barriers identified. These are summarised in 6 steps:
(1) Develop performance metrics to assess the impact of KM on COPQ on
projects
(2) Appoint knowledge champions to facilitate KM activities to reduce COPQ
(3) Adopt a positive organisational culture towards KM
(4) Allocate adequate time for KM activities on projects
(5) Allocated adequate budget for KM activities on projects
(6) Select procurement strategies that support and facilitate KM
6.5 IMPLICATIONS OF FINDINGS
The qualitative study provided an insight into the current KM practices within the
construction supply chain. It identified the contributory factors to COPQ and the
impact of KM in reducing the costs related to those factors. It identified the key
steps to optimising KM to reduce COPQ. Findings from the qualitative study has
practical relevance and potential application in providing construction

CHAPTER 6: QUALITATIVE STUDY ON THE IMPACT OF KM ON COPQ
240
organisations with the insight that; investing in KM and quality management
techniques, technologies and systems is important but what is more important is
the ability to track the impact of the investment in cost terms. The output from
the study is envisaged to enable organisations surmount the barriers identified
in order to optimise KM to reduce COPQ. However the findings from the study
generated further questions. Since the interviewees could not measure the
impact of KM on COPQ, this raises a further question: What is the level of
impact of KM in reducing COPQ? The barriers to KM were identified from the
findings but another question is: How strong are these barriers? In other words,
how easy or how difficult is it to overcome the barriers? There are perceived
benefits to KM optimisation which were identified, but do these hold true for the
rest of the industry?
It is also important to note that the knowledge generated from the qualitative
study cannot be generalised as in the case of most qualitative studies in which
findings may be unique to the relatively few participants included in the study.
As a result, a follow-up quantitative study is conducted with a larger sample of
participants in order to address further questions that were generated from the
qualitative study. The impact of KM will be assessed in terms of processes and
tools. Four key questions are to be addressed in the quantitative study:
(1) What is the level of impact of KM processes on design changes, errors
and omissions, and poor skills?
(2) How effective are KM tools in reducing design changes, errors and
omissions, and poor skills?
(3) How strong are the barriers to KM optimisation in reducing COPQ?
(4) What are the key benefits of KM optimisation?

CHAPTER 6: QUALITATIVE STUDY ON THE IMPACT OF KM ON COPQ
241
6.6 MODIFICATION OF THE CONCEPTUAL FRAMEWORK
The conceptual framework has been modified to incorporate further questions
to be addressed through quantitative study (see Figure 6.2). The four further
questions identified in Section 6.5 have been incorporated to Element [E] of the
framework. A final KM framework for reducing COPQ can then be developed
through the findings from the quantitative study and the analysis of the entire
research data.
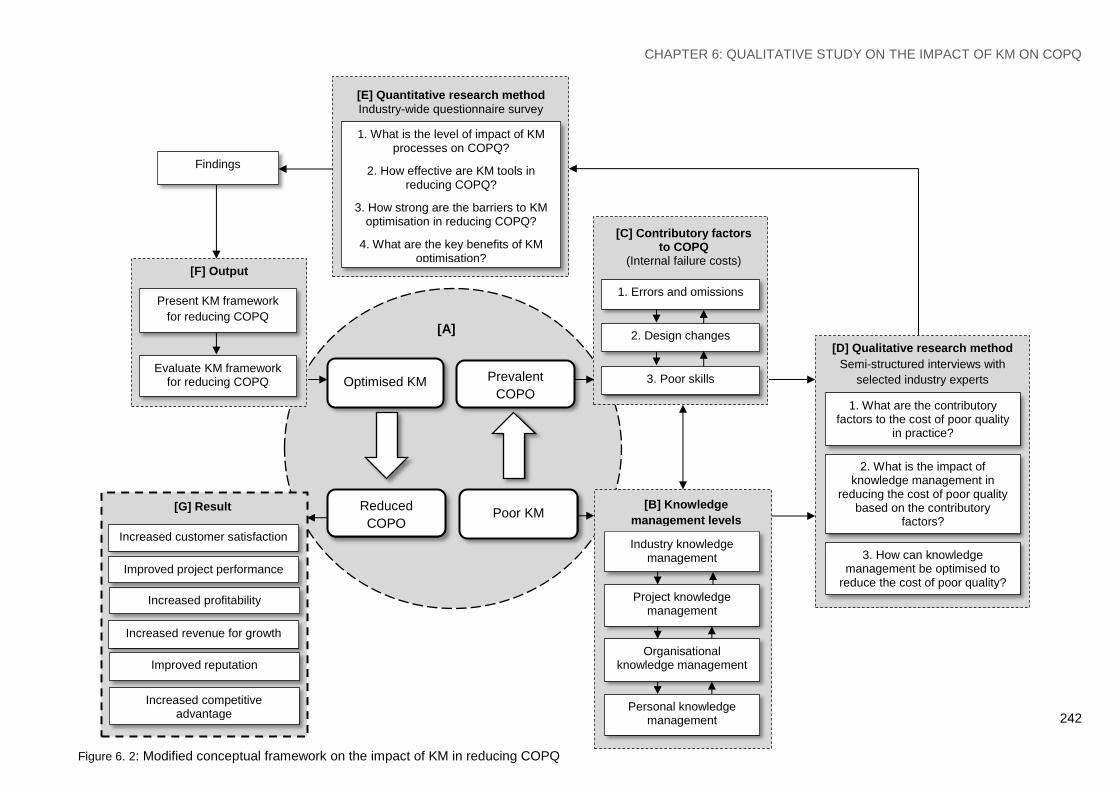
CHAPTER 6: QUALITATIVE STUDY ON THE IMPACT OF KM ON COPQ
242
[D] Qualitative research method
Semi-structured interviews with
selected industry experts
Reduced
COPQ
Optimised KM
Poor KM
Prevalent
COPQ
3. Poor skills
2. Design changes
1. Errors and omissions
Industry knowledge management
Project knowledge management
Organisational knowledge management
Personal knowledge management
[C] Contributory factors to COPQ
(Internal failure costs)
[B] Knowledge
management levels
3. How can knowledge management be optimised to
reduce the cost of poor quality?
Increased customer satisfaction
Increased profitability
Increased revenue for growth
Improved project performance
Improved reputation
Increased competitive advantage
[E] Quantitative research method
Industry-wide questionnaire survey
2. What is the impact of knowledge management in
reducing the cost of poor quality based on the contributory
factors?
[G] Result
1. What is the level of impact of KM processes on COPQ?
2. How effective are KM tools in reducing COPQ?
3. How strong are the barriers to KM optimisation in reducing COPQ?
4. What are the key benefits of KM optimisation?
1. What are the contributory factors to the cost of poor quality
in practice?
[A]
Figure 6. 2: Modified conceptual framework on the impact of KM in reducing COPQ
[F] Output
Evaluate KM framework for reducing COPQ
Present KM framework
for reducing COPQ
Findings

CHAPTER 7: QUANTITATIVE STUDY ON THE IMPACT OF KM ON COPQ
243
6.7 SUMMARY OF CHAPTER 6
Chapter 6 discussed the results from the qualitative study on the impact of KM
on COPQ. It presented the profile of the interviewees involved in the study. It
discussed the findings on the contributory factors to the COPQ in practice which
includes the cost of errors and omissions, cost of design changes and the cost
of poor skills. The chapter discussed the findings on the impact of KM on these
costs. It presented and discussed the findings on the optimisation of KM to
reduce the COPQ on construction projects. It was found that KM had positive
impact in reducing these costs but it is uncertain by how much. In order to
optimise KM, organisations need to: develop performance metrics to measure
or track the impact of KM on COPQ; appoint knowledge champions or
knowledge coordinators to facilitate KM; cultivate positive organisational culture
towards KM e.g. willingness to readily share knowledge and also pull
knowledge from existing knowledge resources within the organisation; allocate
appropriate time and budget for KM activities; encourage integration and
collaborative working among the supply chain. The chapter discussed the
implications of the findings and presented four further questions to be
addressed through quantitative study. It also presented a modified conceptual
framework incorporating these questions, and draws conclusions on the overall
qualitative study.
CHAPTER 7: QUANTITATIVE STUDY ON THE IMPACT OF KM ON COPQ
244
CHAPTER 7
QUANTITATIVE STUDY ON THE IMPACT OF KNOWLEDGE
MANAGEMENT ON THE COST OF POOR QUALITY
This chapter presents the results of the quantitative data obtained through
questionnaire survey. It discusses the findings on the impact of KM processes
for reducing COPQ on construction projects, the effectiveness of KM tools in
reducing COPQ, the barriers to KM in reducing COPQ, the benefits of reducing
COPQ through KM optimisation. The chapter also discusses the implications of
the findings and conclusions.
7.1 RESPONDENT PROFILE
The survey questionnaire design, content and administration have been
discussed in Section 5.5.1. The questionnaire template is found in Appendix 5.
The profile of the respondents to the survey questionnaire is presented in this
section. It includes the respondents’ years of work experience, their job
designation, current job level, project experience, and their level of familiarity
with knowledge management and quality management. Table 7.1 shows the
years of experience of the respondents which range from less than 5 years to
over 25 years. This represents a wide range of experiences within the
construction industry which adds to the richness of the data collected. While
4.4% have less than 5 years of experience, 12.3% have over 25 years of
experience. Majority of the respondents work experience fall between 11 years
and 20 years (55.2% of total).

CHAPTER 7: QUANTITATIVE STUDY ON THE IMPACT OF KM ON COPQ
245
Table 7. 1: Years of work experience
Frequency Percent Valid Percent Cumulative %
<5yrs 5 4.4 4.4 4.4
6 - 10yrs 15 13.2 13.2 17.5
11 - 15yrs 33 28.9 28.9 46.5
16 - 20yrs 30 26.3 26.3 72.8
21 - 25yrs 17 14.9 14.9 87.7
>25yrs 14 12.3 12.3 100.0
Total 114 100.0 100.0
Respondents’ jobs cut across 11 designations with project engineering and
project management representing 40.4% of total. Project managers and project
engineers play a significant role in ensuring that projects are delivered in
accordance to original project plans. Civil engineering and architecture
represent 17.5% and 8.8% of total while knowledge management and quality
management represent 7% each.
Table 7. 2: Job designation
Frequency Percent Valid Percent Cumulative %
Project Engineering 23 20.2 20.2 20.2
Project Management 23 20.2 20.2 40.4
Civil Engineering 20 17.5 17.5 57.9
Architecture 10 8.8 8.8 66.7
Quantity Surveying 10 8.8 8.8 75.4
Knowledge Management 8 7.0 7.0 82.5
Quality Management 8 7.0 7.0 89.5
Cost Management 6 5.3 5.3 94.7
Mechanical & Electrical 2 1.8 1.8 96.5
Site Management 2 1.8 1.8 98.2
Site Supervision 2 1.8 1.8 100.0
Total 114 100.0 100.0
Respondents’ job level ranges from director level to operational level enabling a
wide spectrum of responses. Operational level amounts to 26.3% of total.
Management level can be summed up as 59.6% while director level represents
14%.

CHAPTER 7: QUANTITATIVE STUDY ON THE IMPACT OF KM ON COPQ
246
Table 7. 3: Current job level
Frequency Percent Valid Percent Cumulative %
Operational 30 26.3 26.3 26.3
Junior Management 25 21.9 21.9 48.2
Mid-level Management 22 19.3 19.3 67.5
Senior Management 21 18.4 18.4 86.0
Director 16 14.0 14.0 100.0
Total 114 100.0 100.0
Respondents’ project experiences include highways, utility and rail, with building
construction having 53.5% of total.
Table 7. 4: Project experience
Frequency Percent Valid Percent Cumulative %
Building Construction 61 53.5 53.5 53.5
Highways 23 20.2 20.2 73.7
Utility (Power) 19 16.7 16.7 90.4
Rail 6 5.3 5.3 95.6
Utility (Water) 3 2.6 2.6 98.2
Other (Please specify) 2 1.8 1.8 100.0
Total 114 100.0 100.0
7.2 IMPACT OF KM PROCESSES ON COPQ
Respondents were asked to rate the level of impact of KM processes on the
constituent elements of COPQ i.e. design changes, errors and omissions, and
poor skills, based on their own experiences on construction projects. A four
point Likert scale was utilised to rate the impact as follows: 1 = Strong Negative
Impact, 2 = Negative Impact, 3 = Positive Impact, 4 = Strong Positive
Impact. The mean values for the ratings were then calculated and ranked in
descending order in order to identify the processes that have had most impact
and least impact on COPQ in practice. Fifteen KM process-related variables
were presented to the respondents to rate their impact on COPQ. The results
are presented under three sub-headings (1) Impact of KM processes on design

CHAPTER 7: QUANTITATIVE STUDY ON THE IMPACT OF KM ON COPQ
247
changes (2) Impact of KM processes on errors and omissions (3) Impact of KM
processes on poor skills.
7.2.1 Impact of KM processes on design changes
The data from Table 7.5 shows 114 valid responses for each variable. The
minimum and maximum ratings for all the variables are 3 and 4 respectively.
These signify ‘positive impact’ and ‘strong positive impact’ respectively for the
variables. The mean values for the variables shown in the table are ranked in
descending order from the highest (3.5175) to the lowest (3.1053). The five
highest ranking variables that impact design changes are: knowledge sharing-
early involvement; knowledge creation; knowledge capture- project to project;
knowledge sharing among project team; and knowledge dissemination.
It is apparent from the table that early involvement of the supply chain has the
strongest impact in reducing design changes and associated costs. This is
linked to the second highest ranking variable i.e. knowledge creation.
Knowledge creation often results from collaborative working among personnel
from supply chain organisations particularly in the early stages of a project. New
knowledge is usually created around processes and products e.g. new product
interfaces and constructability of design. Knowledge capture from project to
project has also ranked high among other variables. This implies that design
change-related issues have reduced as a result of knowledge capture from
other projects. Knowledge sharing among project team members and
knowledge dissemination have also ranked high. The five lowest ranking
variables that impact design changes are: knowledge champions; knowledge

CHAPTER 7: QUANTITATIVE STUDY ON THE IMPACT OF KM ON COPQ
248
identification; knowledge dissemination- communities of practice; and
knowledge transfer- mentoring.
Table 7. 5: Impact of KM processes on design changes
N Range Minimum Maximum Mean Std. Deviation
Knowledge sharing- early involvement 114 1.00 3.00 4.00 3.5175 .50190
Knowledge creation 114 1.00 3.00 4.00 3.5088 .50213
Knowledge capture- project to project 114 1.00 3.00 4.00 3.3772 .48682
Knowledge sharing among project team 114 1.00 3.00 4.00 3.3070 .46329
Knowledge dissemination- publications 114 1.00 3.00 4.00 3.2632 .44229
Knowledge capture- project to organisation 114 1.00 3.00 4.00 3.2456 .43235
Knowledge codification- project to document 114 1.00 3.00 4.00 3.2018 .40308
Knowledge capture- personnel to organisation 114 1.00 3.00 4.00 3.2018 .40308
Knowledge codification- personnel to document 114 1.00 3.00 4.00 3.1754 .38202
Knowledge transfer- apprenticeships 114 1.00 3.00 4.00 3.1754 .38202
Knowledge champions 114 1.00 3.00 4.00 3.1667 .37432
Knowledge identification 114 1.00 3.00 4.00 3.1579 .36625
Knowledge dissemination- communities of practice 114 1.00 3.00 4.00 3.1316 .33952
Knowledge storage 114 1.00 3.00 4.00 3.1316 .33952
Knowledge transfer- mentoring 114 1.00 3.00 4.00 3.1053 .30825
7.2.2 Impact of KM processes on errors and omissions
As shown in Table 7.6, the minimum and maximum ratings for all the variables
are 3 and 4 respectively. These signify ‘positive impact’ and ‘strong positive
impact’ respectively for the variables. The mean values for the variables shown
in the table are ranked in descending order from the highest (3.5) to the lowest
(3.1404). The five highest ranking variables that impact errors and omissions
are: knowledge capture- project to organisation; knowledge champions;
knowledge sharing among project team; knowledge creation: and knowledge
transfer- mentoring. Knowledge capture from projects to organisation involves
capturing project knowledge and lessons learnt from previous projects and
applying the knowledge on current and future projects. According to the results

CHAPTER 7: QUANTITATIVE STUDY ON THE IMPACT OF KM ON COPQ
249
on the table, this has the most impact in reducing errors and omissions. It is
interesting to find that the highest ranking variables are related to
personalisation approach to knowledge management rather than the use of
technologies. The five lowest ranking variables are knowledge identification;
knowledge codification- project to document; knowledge codification- personnel
to document; knowledge dissemination- communities of practice; and
knowledge storage.
Table 7. 6: Impact of KM processes on errors and omissions
N Range Minimum Maximum Mean Std. Deviation
Knowledge capture- project to organisation 114 1.00 3.00 4.00 3.5000 .50221
Knowledge champions 114 1.00 3.00 4.00 3.4649 .50097
Knowledge sharing among project team 114 1.00 3.00 4.00 3.4561 .50027
Knowledge creation 114 1.00 3.00 4.00 3.3333 .47349
Knowledge transfer- mentoring 114 1.00 3.00 4.00 3.3158 .46688
Knowledge capture- project to project 114 1.00 3.00 4.00 3.2632 .44229
Knowledge capture- personnel to organisation 114 1.00 3.00 4.00 3.2632 .44229
Knowledge transfer- apprenticeships 114 1.00 3.00 4.00 3.2632 .44229
Knowledge sharing- early involvement 114 1.00 3.00 4.00 3.2281 .42144
Knowledge dissemination- publications 114 1.00 3.00 4.00 3.2281 .42144
Knowledge identification 114 1.00 3.00 4.00 3.1930 .39638
Knowledge codification- project to document 114 1.00 3.00 4.00 3.1667 .37432
Knowledge codification- personnel to document 114 1.00 3.00 4.00 3.1491 .35778
Knowledge dissemination- communities of practice 114 1.00 3.00 4.00 3.1404 .34888
Knowledge storage 114 1.00 3.00 4.00 3.1404 .34888
7.2.3 Impact of KM processes on poor skills
As shown in Table 7.7, the minimum and maximum ratings for all the variables
are 3 and 4 respectively. These signify ‘positive impact’ and ‘strong positive
impact’ respectively for the variables. The mean values for the variables shown
in the table are ranked in descending order from the highest (3.6053) to the
lowest (3.1140). The five highest ranking variables that impact poor skills are:

CHAPTER 7: QUANTITATIVE STUDY ON THE IMPACT OF KM ON COPQ
250
knowledge transfer- mentoring; knowledge transfer- apprenticeships;
knowledge identification; knowledge capture- personnel to organisation; and
knowledge champions. The five lowest ranking variables are knowledge
storage; knowledge creation; knowledge dissemination- publications;
knowledge codification- project to document; and knowledge capture- project to
project.
Table 7. 7: Impact of KM processes on poor skills
N Range Minimum Maximum Mean Std. Deviation
Knowledge transfer- mentoring 114 1.00 3.00 4.00 3.6053 .49095
Knowledge transfer- apprenticeships 114 1.00 3.00 4.00 3.6053 .49095
Knowledge identification 114 1.00 3.00 4.00 3.5351 .50097
Knowledge capture- personnel to organisation 114 1.00 3.00 4.00 3.5263 .50151
Knowledge champions 114 1.00 3.00 4.00 3.2982 .45951
Knowledge codification- personnel to document 114 1.00 3.00 4.00 3.2544 .43744
Knowledge capture- project to organisation 114 1.00 3.00 4.00 3.2368 .42702
Knowledge sharing among project team 114 1.00 3.00 4.00 3.2105 .40948
Knowledge sharing- early involvement 114 1.00 3.00 4.00 3.1842 .38937
Knowledge dissemination- communities of practice 114 1.00 3.00 4.00 3.1491 .35778
Knowledge storage 114 1.00 3.00 4.00 3.1491 .35778
Knowledge creation 114 1.00 3.00 4.00 3.1228 .32966
Knowledge dissemination- publications 114 1.00 3.00 4.00 3.1228 .32966
Knowledge codification- project to document 114 1.00 3.00 4.00 3.1140 .31926
Knowledge capture- project to project 114 1.00 3.00 4.00 3.1140 .31926
Table 7.8 shows a summary of the five highest ranking KM processes impacting
design changes, errors and omissions and poor skills elements of COPQ. The
commonality among the three elements is knowledge capture i.e. project to
project knowledge capture in the case of design changes; project to
organisation knowledge capture in the case of errors and omissions; and
personnel to organisation knowledge capture in the case of poor skills.

CHAPTER 7: QUANTITATIVE STUDY ON THE IMPACT OF KM ON COPQ
251
Table 7. 8: Five highest ranking KM processes impacting COPQ
Design changes Mean Errors and omissions Mean Poor skills Mean
Knowledge sharing- early
involvement 3.5175
Knowledge capture- project to
organisation 3.5000
Knowledge transfer-
mentoring 3.6053
Knowledge creation 3.5088 Knowledge champions 3.4649 Knowledge transfer-
apprenticeships 3.6053
Knowledge capture- project
to project 3.3772
Knowledge sharing among
project team 3.4561 Knowledge identification 3.5351
Knowledge sharing among
project team 3.3070 Knowledge creation 3.3333
Knowledge capture-
personnel to organisation 3.5263
Knowledge dissemination-
publications 3.2632
Knowledge transfer-
mentoring 3.3158 Knowledge champions 3.2982
The five lowest ranking KM processes impacting COPQ are shown in Table 7.9.
Knowledge dissemination was found to be common with the three elements of
COPQ i.e. communities of practice in the case of design changes and errors;
publications in the case of poor skills. Knowledge storage was also found as a
commonality of the three elements.
Table 7. 9: Five lowest ranking KM processes impacting COPQ
Design changes Mean Errors and omissions Mean Poor skills Mean
Knowledge champions 3.1667 Knowledge identification 3.1930 Knowledge storage 3.1491
Knowledge identification 3.1579 Knowledge codification-
project to document 3.1667 Knowledge creation 3.1228
Knowledge dissemination-
communities of practice 3.1316
Knowledge codification-
personnel to document 3.1491
Knowledge dissemination-
publications 3.1228
Knowledge storage 3.1316 Knowledge dissemination-
communities of practice 3.1404
Knowledge codification-
project to document 3.1140
Knowledge transfer-
mentoring 3.1053 Knowledge storage 3.1404
Knowledge capture-
project to project 3.1140
7.3 EFFECTIVENESS OF KM TOOLS IN REDUCING COPQ
Respondents were asked to rate the level of effectiveness of KM tools on the
constituent elements of COPQ i.e. design changes, errors and omissions, and
poor skills, based on their own experiences on construction projects. A four
point Likert scale was utilised to rate the effectiveness as follows: 1 = Not at all
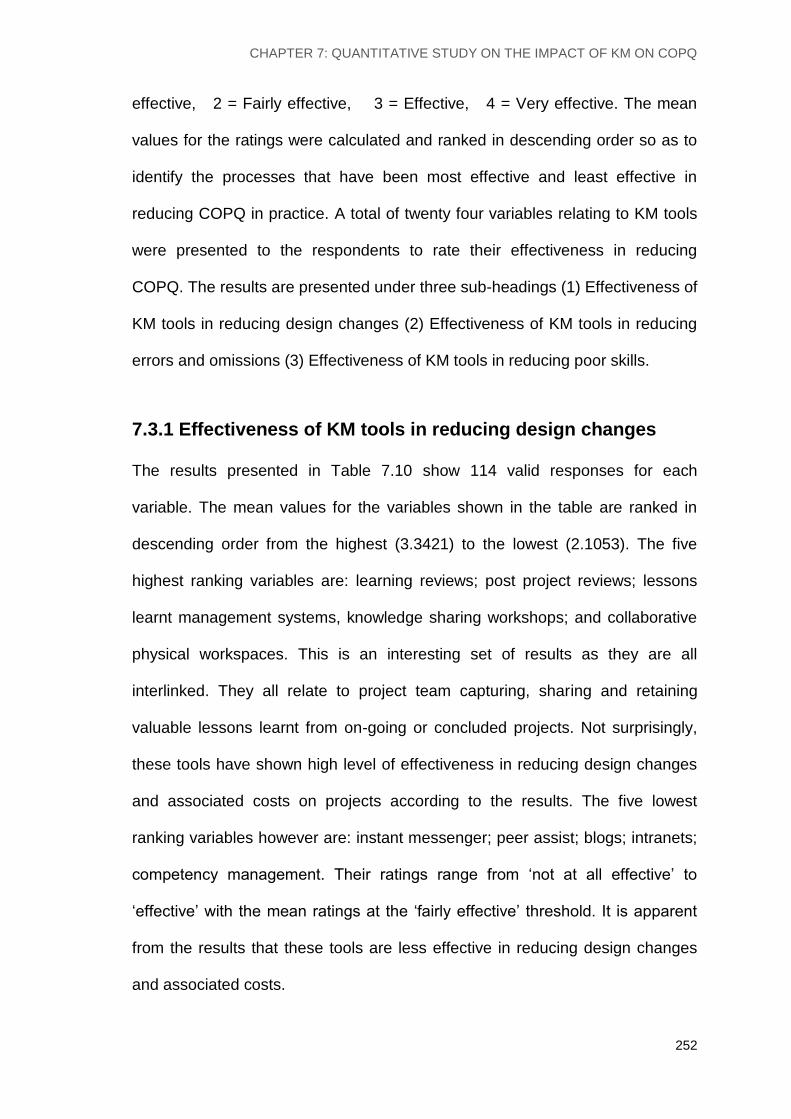
CHAPTER 7: QUANTITATIVE STUDY ON THE IMPACT OF KM ON COPQ
252
effective, 2 = Fairly effective, 3 = Effective, 4 = Very effective. The mean
values for the ratings were calculated and ranked in descending order so as to
identify the processes that have been most effective and least effective in
reducing COPQ in practice. A total of twenty four variables relating to KM tools
were presented to the respondents to rate their effectiveness in reducing
COPQ. The results are presented under three sub-headings (1) Effectiveness of
KM tools in reducing design changes (2) Effectiveness of KM tools in reducing
errors and omissions (3) Effectiveness of KM tools in reducing poor skills.
7.3.1 Effectiveness of KM tools in reducing design changes
The results presented in Table 7.10 show 114 valid responses for each
variable. The mean values for the variables shown in the table are ranked in
descending order from the highest (3.3421) to the lowest (2.1053). The five
highest ranking variables are: learning reviews; post project reviews; lessons
learnt management systems, knowledge sharing workshops; and collaborative
physical workspaces. This is an interesting set of results as they are all
interlinked. They all relate to project team capturing, sharing and retaining
valuable lessons learnt from on-going or concluded projects. Not surprisingly,
these tools have shown high level of effectiveness in reducing design changes
and associated costs on projects according to the results. The five lowest
ranking variables however are: instant messenger; peer assist; blogs; intranets;
competency management. Their ratings range from ‘not at all effective’ to
‘effective’ with the mean ratings at the ‘fairly effective’ threshold. It is apparent
from the results that these tools are less effective in reducing design changes
and associated costs.

CHAPTER 7: QUANTITATIVE STUDY ON THE IMPACT OF KM ON COPQ
253
Table 7. 10: Effectiveness of KM tools in reducing design changes
N Range Minimum Maximum Mean Std. Deviation
Learning reviews 114 2.00 2.00 4.00 3.3421 .52930
Post project reviews 114 2.00 2.00 4.00 3.3333 .55918
Lessons learnt management systems 114 2.00 2.00 4.00 3.3070 .53426
Knowledge sharing workshops 114 2.00 2.00 4.00 3.2895 .60563
Collaborative physical work spaces 114 2.00 2.00 4.00 3.1404 .54654
Learning histories 114 2.00 2.00 4.00 3.1228 .53448
Collaborative virtual work spaces 114 2.00 2.00 4.00 2.9737 .61631
Email 114 2.00 2.00 4.00 2.9386 .56888
Knowledge cafes 114 2.00 2.00 4.00 2.8509 .73150
Cross project learning 114 3.00 1.00 4.00 2.8421 .54169
Knowledge mapping 114 2.00 2.00 4.00 2.8421 .49024
Web conferencing 114 2.00 2.00 4.00 2.7368 .49872
Social networking 114 2.00 2.00 4.00 2.7018 .53098
Knowledge bases 114 3.00 1.00 4.00 2.6579 .91040
Brainstorming 114 3.00 1.00 4.00 2.6491 .57963
Wikis 114 2.00 2.00 4.00 2.6316 .53651
Knowledge exchange- interviews 114 2.00 2.00 4.00 2.6228 .57052
Storytelling 114 3.00 1.00 4.00 2.5614 .53274
Corporate yellow pages 114 3.00 1.00 4.00 2.5351 .53513
Competency management 114 3.00 1.00 4.00 2.4737 .69398
Intranets 114 3.00 1.00 4.00 2.4211 .59340
Blogs 114 3.00 1.00 4.00 2.3860 .77011
Peer assist 114 2.00 1.00 3.00 2.3246 .65845
Instant messenger 114 2.00 1.00 3.00 2.1053 .62921
7.3.2 Effectiveness of KM tools in reducing errors and
omissions
The mean values for the variables shown in Table 7.11 the table are ranked in
descending order from the highest (3.3421) to the lowest (2.2807). The five
highest ranking variables are: learning reviews; lessons learnt management
systems; knowledge sharing workshops; post project reviews; and collaborative
physical workspaces. The results on this table are comparable to those on
Table 7.10 which ranks knowledge sharing, reviews and collaboration high in
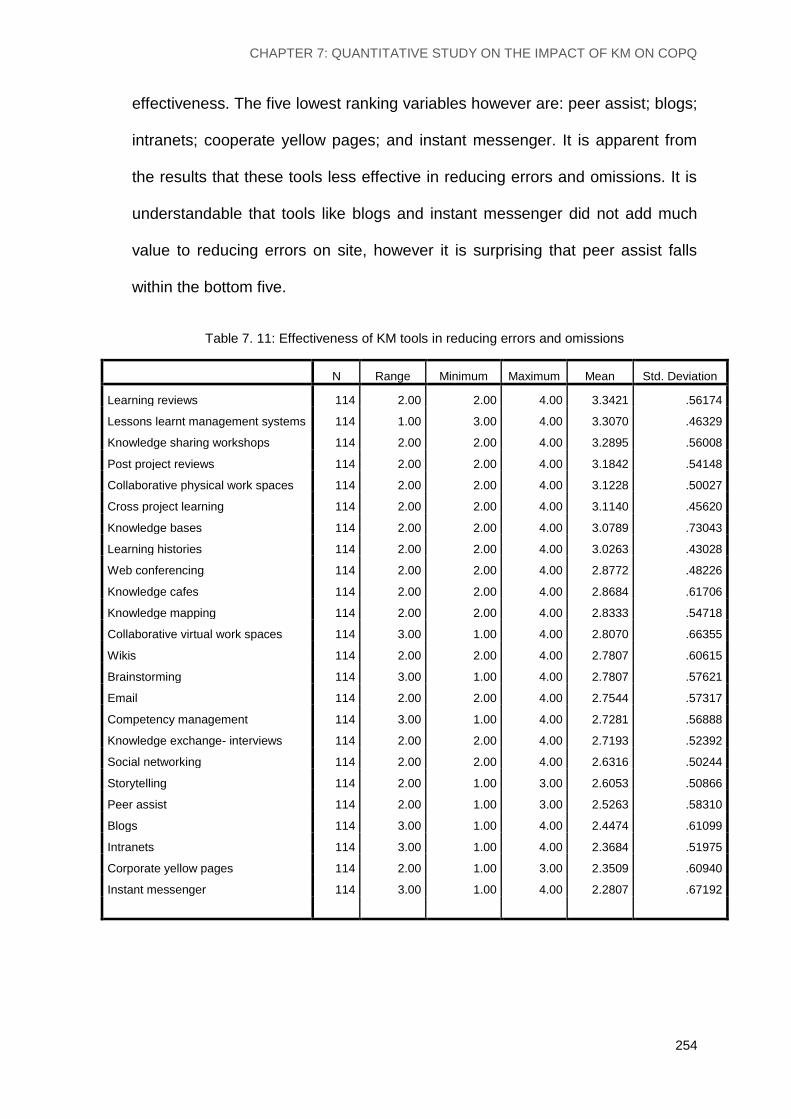
CHAPTER 7: QUANTITATIVE STUDY ON THE IMPACT OF KM ON COPQ
254
effectiveness. The five lowest ranking variables however are: peer assist; blogs;
intranets; cooperate yellow pages; and instant messenger. It is apparent from
the results that these tools less effective in reducing errors and omissions. It is
understandable that tools like blogs and instant messenger did not add much
value to reducing errors on site, however it is surprising that peer assist falls
within the bottom five.
Table 7. 11: Effectiveness of KM tools in reducing errors and omissions
N Range Minimum Maximum Mean Std. Deviation
Learning reviews 114 2.00 2.00 4.00 3.3421 .56174
Lessons learnt management systems 114 1.00 3.00 4.00 3.3070 .46329
Knowledge sharing workshops 114 2.00 2.00 4.00 3.2895 .56008
Post project reviews 114 2.00 2.00 4.00 3.1842 .54148
Collaborative physical work spaces 114 2.00 2.00 4.00 3.1228 .50027
Cross project learning 114 2.00 2.00 4.00 3.1140 .45620
Knowledge bases 114 2.00 2.00 4.00 3.0789 .73043
Learning histories 114 2.00 2.00 4.00 3.0263 .43028
Web conferencing 114 2.00 2.00 4.00 2.8772 .48226
Knowledge cafes 114 2.00 2.00 4.00 2.8684 .61706
Knowledge mapping 114 2.00 2.00 4.00 2.8333 .54718
Collaborative virtual work spaces 114 3.00 1.00 4.00 2.8070 .66355
Wikis 114 2.00 2.00 4.00 2.7807 .60615
Brainstorming 114 3.00 1.00 4.00 2.7807 .57621
Email 114 2.00 2.00 4.00 2.7544 .57317
Competency management 114 3.00 1.00 4.00 2.7281 .56888
Knowledge exchange- interviews 114 2.00 2.00 4.00 2.7193 .52392
Social networking 114 2.00 2.00 4.00 2.6316 .50244
Storytelling 114 2.00 1.00 3.00 2.6053 .50866
Peer assist 114 2.00 1.00 3.00 2.5263 .58310
Blogs 114 3.00 1.00 4.00 2.4474 .61099
Intranets 114 3.00 1.00 4.00 2.3684 .51975
Corporate yellow pages 114 2.00 1.00 3.00 2.3509 .60940
Instant messenger 114 3.00 1.00 4.00 2.2807 .67192

CHAPTER 7: QUANTITATIVE STUDY ON THE IMPACT OF KM ON COPQ
255
7.3.3 Effectiveness of KM tools in reducing poor skills
The results presented in Table 7.12 shows the mean values for each of the
twenty four (24) KM tool-related variables which are ranked in descending order
from the highest (3.4737) to the lowest (2.1579). The five highest ranking
variables are: post project reviews; competency management; peer assist;
lessons learnt management systems; and knowledge sharing workshops.
Table 7. 12: Effectiveness of KM tools in reducing poor skills
N Range Minimum Maximum Mean Std. Deviation
Post project reviews 114 2.00 2.00 4.00 3.4737 .55192
Competency management 114 2.00 2.00 4.00 3.2368 .58450
Peer assist 114 2.00 2.00 4.00 3.2018 .56724
Lessons learnt management systems 114 2.00 2.00 4.00 3.1754 .53622
Knowledge sharing workshops 114 2.00 2.00 4.00 3.1667 .57863
Cross project learning 114 2.00 2.00 4.00 3.1316 .55675
Knowledge exchange- interviews 114 2.00 2.00 4.00 3.1228 .46354
Storytelling 114 2.00 2.00 4.00 3.0614 .56888
Knowledge cafes 114 2.00 2.00 4.00 3.0088 .58741
Learning reviews 114 2.00 2.00 4.00 3.0000 .57990
Corporate yellow pages 114 3.00 1.00 4.00 2.9912 .54033
Collaborative physical work spaces 114 2.00 2.00 4.00 2.8860 .56064
Web conferencing 114 2.00 2.00 4.00 2.8596 .47740
Knowledge mapping 114 2.00 2.00 4.00 2.8509 .53600
Learning histories 114 2.00 2.00 4.00 2.7719 .51586
Social networking 114 2.00 2.00 4.00 2.7632 .50313
Knowledge bases 114 2.00 2.00 4.00 2.7456 .51200
Collaborative virtual work spaces 114 3.00 1.00 4.00 2.6930 .63979
Blogs 114 3.00 1.00 4.00 2.5351 .59763
Brainstorming 114 3.00 1.00 4.00 2.4035 .60557
Wikis 114 2.00 1.00 3.00 2.3947 .52577
Instant messenger 114 2.00 1.00 3.00 2.2719 .62803
Intranets 114 2.00 1.00 3.00 2.2105 .48834
Email 114 3.00 1.00 4.00 2.1579 .60351

CHAPTER 7: QUANTITATIVE STUDY ON THE IMPACT OF KM ON COPQ
256
The results on this table are also comparable to those on Table 7.10 and Table
7.11 which ranks knowledge sharing, reviews and collaboration high in
effectiveness. An addition to the top ranking tools however is peer assist. This is
not surprising though as peer assist brings together group of peers to elicit
feedback on a problem, project, or activity, and draw lessons from the
participants' knowledge and experience. The five lowest ranking variables
however are: brainstorming; wikis; instant messenger; intranets; and email. This
is understandable as it may be difficult to envisage the use of emails and instant
messenger effectively to reduce poor skills.
Examining Tables 7.10, 7.11, and 7.12, there is a clear trend, pattern and
consistency to the five highest ranking tools. Firstly they all relate to
collaboration in sharing knowledge and learning from past mistakes to reduce
COPQ. Secondly, they are all personalisation tools (techniques) except for
lessons learnt management systems which is a codification tool (technologies).
Thirdly, there are three commonalities of variables to the elements of COPQ.
They are: post project reviews; lessons learnt management systems; and
knowledge sharing workshops. It is evident that these three variables seem
important and are very effective in reducing design changes, errors and
omissions and poor skills. Collaborative physical work places and learning
reviews cut across design changes and errors and omissions while competency
management and peer assist are more effective in reducing poor skills and
associate costs (Table 7:13).

CHAPTER 7: QUANTITATIVE STUDY ON THE IMPACT OF KM ON COPQ
257
Table 7. 13: Five highest ranking KM tools for reducing COPQ
Design changes Mean Errors and omissions Mean Poor skills Mean
Learning reviews 3.3421 Learning reviews 3.3421 Post project reviews 3.4737
Post project reviews 3.3333 Lessons learnt management
systems 3.3070 Competency management 3.2368
Lessons learnt management
systems 3.3070
Knowledge sharing
workshops 3.2895 Peer assist 3.2018
Knowledge sharing
workshops 3.2895 Post project reviews 3.1842
Lessons learnt
management systems 3.1754
Collaborative physical work
spaces 3.1404
Collaborative physical work
spaces 3.1228
Knowledge sharing
workshops 3.1667
Table 7.14 shows the summary of the five lowest ranking KM tools for reducing
COPQ. The common tools that cut across design changes, errors and
omissions and poor skills are; intranets and instant messenger. Apart from peer
assist, competency management and brainstorming, it is interesting to find that
most of the lowest ranking tools are codification tools which involve the use of
technologies and technological infrastructure. Instant messenger has ranked
lowest in two categories and is also included in the third category which makes
it almost the least effective tool in reducing COPQ.
Table 7. 14: Five lowest ranking KM tools for reducing COPQ
Design changes Mean Errors and omissions Mean Poor skills Mean
Competency management 2.4737 Peer assist 2.5263 Brainstorming 2.4035
Intranets 2.4211 Blogs 2.4474 Wikis 2.3947
Blogs 2.3860 Intranets 2.3684 Instant messenger 2.2719
Peer assist 2.3246 Corporate yellow pages 2.3509 Intranets 2.2105
Instant messenger 2.1053 Instant messenger 2.2807 Email 2.1579
7.4 BARRIERS TO KM IN REDUCING COPQ
Respondents were presented with 16 variables relating to KM barriers to
reducing COPQ and were asked to rate the level of strength of the barriers
based on their own experiences on construction projects. A four-point Likert

CHAPTER 7: QUANTITATIVE STUDY ON THE IMPACT OF KM ON COPQ
258
was utilised to rate the barriers as follows: 1 = Very Weak Barrier, 2 = Weak
Barrier, 3 = Strong Barrier, 4 = Very Strong Barrier. The rationale behind this is
to identify the most critical barriers that need to be addressed in order to
optimise KM to reduce COPQ. The mean values for the ratings of each variable
were calculated and ranked in descending order so as to identify the barriers
that are most critical to address. The results presented in Table 7.15 show 114
valid responses for each variable. The mean values for the variables shown in
the table are ranked in descending order from the highest (3.5965) to the lowest
(2.6842). The five highest ranking variables are: lack of performance metrics;
adversarial organisational culture; lack of collaborative working; perception of
errors as inevitable; and adversarial procurement strategy.
Table 7. 15: Barriers to KM in reducing COPQ
N Range Minimum Maximum Mean Std. Deviation
Lack of performance metrics 114 1.00 3.00 4.00 3.5965 .49277
Adversarial organisational culture 114 2.00 2.00 4.00 3.4737 .64094
Lack of collaborative working 114 1.00 3.00 4.00 3.3860 .48897
Perception of errors as inevitable 114 1.00 3.00 4.00 3.3860 .48897
Adversarial procurement strategy 114 1.00 3.00 4.00 3.3596 .48202
Time constrained nature of projects 114 2.00 2.00 4.00 3.3158 .62847
High staff turnover 114 2.00 2.00 4.00 3.2456 .45236
Lack of knowledge champions 114 2.00 2.00 4.00 3.2018 .50097
Lack of senior management support 114 2.00 2.00 4.00 3.1404 .66355
KM activities are unnecessary burden 114 2.00 2.00 4.00 3.0439 .61530
High cost of investing in KM 114 2.00 2.00 4.00 2.9912 .55647
Complacency of personnel 114 2.00 2.00 4.00 2.9737 .57161
Lack of incentives to motivate personnel 114 2.00 2.00 4.00 2.9035 .54803
Knowledge hoarding 114 2.00 2.00 4.00 2.8684 .73488
Lack of understanding of KM concepts 114 2.00 2.00 4.00 2.8596 .59313
Lack of KM technological infrastructure 114 3.00 1.00 4.00 2.6842 .50337

CHAPTER 7: QUANTITATIVE STUDY ON THE IMPACT OF KM ON COPQ
259
The five lowest ranking variables are: complacency of personnel; lack of
incentives to motivate personnel; knowledge hoarding; lack of understanding of
KM concepts; and lack of technological infrastructure.
7.5 BENEFITS OF REDUCING COPQ THROUGH KM
OPTIMISATION
Respondents were presented with a list of 11 variables relating to the benefits
of reducing COPQ through the optimisation of KM. They were asked to rate the
benefits based on their experiences on construction projects utilising a four-
point Likert scale as follows: 1 = Strongly disagree, 2 = Disagree, 3 = Agree,
4 = Strongly Agree. The rationale behind this is to identify the top benefits
organisations gain from reducing COPQ and how they fit into their
organisational strategy. The mean values for the ratings of each variable were
calculated and ranked in descending order so as to identify the top benefits of
reducing COPQ through KM. The results presented in Table 7.16 show 114
valid responses for each variable. The mean values for the variables shown in
the table are ranked in descending order from the highest (3.1842) to the lowest
(3.0614). The three highest ranking variables are: increased revenue for growth;
improved process quality; and improved project performance. The three lowest
ranking variables are: increased staff motivation; improved reputation of
organisation; and increased profitability.

CHAPTER 7: QUANTITATIVE STUDY ON THE IMPACT OF KM ON COPQ
260
Table 7. 16: Benefits of reducing COPQ through KM optimisation
N Range Minimum Maximum Mean Std. Deviation
Increased revenue for growth 114 1.00 3.00 4.00 3.1842 .38937
Improved process quality 114 1.00 3.00 4.00 3.1667 .37432
Improved project performance 114 1.00 3.00 4.00 3.1404 .34888
Increased customer satisfaction 114 2.00 2.00 4.00 3.1316 .41033
Improved product quality 114 1.00 3.00 4.00 3.1316 .33952
Increased competitive advantage 114 1.00 3.00 4.00 3.1316 .33952
Improved cost efficiency 114 1.00 3.00 4.00 3.1228 .32966
Improved service quality 114 2.00 2.00 4.00 3.1140 .37057
Increased staff motivation 114 2.00 2.00 4.00 3.1140 .34587
Improved reputation of organisation 114 2.00 2.00 4.00 3.1140 .34587
Increased profitability 114 2.00 2.00 4.00 3.0614 .40539
7.6 MEASUREMENT OF THE IMPACT OF KM ON COPQ
Respondents were asked ten questions relating to the measurement of the
impact of KM on COPQ based on the findings from qualitative data analysis.
The questions relate to respondents’ experiences in their organisation and on
projects they have been involved in. Respondents were given two options to
either answer ‘yes’ or ‘no’ to the questions asked. All responses received were
unanimous and are summarised below.
Do you currently have a tool to quantify COPQ?
Frequency Percent Valid Percent Cumulative Percent
No 114 100.0 100.0 100.0
Do you currently have a tool that measures the impact of KM on COPQ?
Frequency Percent Valid Percent Cumulative Percent
No 114 100.0 100.0 100.0
Do you currently have performance metrics to assess the impact of KM on COPQ?
Frequency Percent Valid Percent Cumulative Percent
No 114 100.0 100.0 100.0

CHAPTER 7: QUANTITATIVE STUDY ON THE IMPACT OF KM ON COPQ
261
Would you welcome a new tool for:
Quantifying COPQ?
Frequency Percent Valid Percent Cumulative Percent
Yes 114 100.0 100.0 100.0
Measuring the impact of KM on COPQ?
Frequency Percent Valid Percent Cumulative Percent
Yes 114 100.0 100.0 100.0
Developing performance metrics for assessing the impact of KM on COPQ?
Frequency Percent Valid Percent Cumulative Percent
Yes 114 100.0 100.0 100.0
Comparing the performances of various projects on the impact of KM on COPQ?
Frequency Percent Valid Percent Cumulative Percent
Yes 114 100.0 100.0 100.0
Measuring the costs and benefits of KM in reducing COPQ?
Frequency Percent Valid Percent Cumulative Percent
Yes 114 100.0 100.0 100.0
Tracking periodical progress of KM in reducing COPQ?
Frequency Percent Valid Percent Cumulative Percent
Yes 114 100.0 100.0 100.0
Assessing the impact of KM on overall project cost?
Frequency Percent Valid Percent Cumulative Percent
Yes 114 100.0 100.0 100.0

CHAPTER 7: QUANTITATIVE STUDY ON THE IMPACT OF KM ON COPQ
262
7.7 IMPLICATION OF FINDINGS
The implication of the findings is the modification of the conceptual framework.
Component [E] of the framework has been updated to include the findings from
the industry questionnaire survey which identified the followings: the high
impact KM processes in reducing COPQ; high impact KM tools for reducing
COPQ; top barriers to KM optimisation; and the key benefits of KM. The
modified conceptual framework is presented in Figure 7.1.

CHAPTER 7: QUANTITATIVE STUDY ON THE IMPACT OF KM ON COPQ
263
[D] Qualitative research method
Semi-structured interviews with
selected industry experts
Reduced
COPQ
Optimised KM
Poor KM
Prevalent
COPQ
3. Poor skills
2. Design changes
1. Errors and omissions
Industry knowledge management
Project knowledge management
Organisational knowledge management
Personal knowledge management
[C] Contributory factors to COPQ
(Internal failure costs)
[B] Knowledge
management levels
3. How can knowledge management be optimised to
reduce the cost of poor quality?
Increased customer satisfaction
Increased profitability
Increased revenue for growth
Improved project performance
Improved reputation
Increased competitive advantage
2. What is the impact of knowledge management in
reducing the cost of poor quality based on the contributory
factors?
[G] Result
1. What are the contributory factors to the cost of poor quality
in practice?
[A]
Figure 7. 1: Modified conceptual framework on the impact of KM in reducing COPQ
[F] Output
Evaluate KM framework for reducing COPQ
Present KM framework
for reducing COPQ
[E] Quantitative research method Industry-wide questionnaire survey
1. High impact KM processes identified 2. High impact KM tools identified KM 3. Top KM barriers identified 4. Key KM benefits identified

CHAPTER 8: KM FRAMEWORK FOR REDUCING COPQ ON PROJECTS
264
7.8 SUMMARY OF CHAPTER 7
The chapter presented the results of the quantitative data obtained through
questionnaire survey. It discussed the findings on the impact of KM processes
for reducing COPQ on construction projects, the effectiveness of KM tools in
reducing COPQ, the barriers to KM in reducing COPQ, the benefits of reducing
COPQ through KM optimisation, and the measurement of the impact of KM on
COPQ. It was found that the KM processes that had the most impact in
reducing COPQ are related to the socialisation aspect of the SECI model such
as knowledge sharing, new knowledge creation, knowledge transfer through
mentoring and apprenticeships. Similarly the most effective KM tools for
reducing COPQ were related to socialisation such as learning reviews, post
project reviews, knowledge sharing workshops and collaborative physical
workspaces. The top barriers to KM in reducing COPQ were identified as lack of
performance metrics, adversarial organisational culture, lack of collaborate
working, perception of errors as inevitable, and adversarial procurement
strategy. The top benefits were identified as increased revenue for growth,
improved process quality, improved project performance and increased
customer satisfaction.

CHAPTER 8: KM FRAMEWORK FOR REDUCING COPQ ON PROJECTS
265
CHAPTER 8
KNOWLEDGE MANAGEMENT FRAMEWORK FOR REDUCING
THE COST OF POOR QUALITY IN CONSTRUCTION PROJECTS
This chapter presents an interpretation of the entire data i.e. qualitative and
quantitative. It connects all aspects of the research including the main research
questions, findings and conclusions from both qualitative and quantitative
inquiries. It discusses the overall impact of knowledge management on errors
and omissions, design changes and poor skills. It presents the knowledge
management framework for reducing the cost of poor quality on construction
projects. It also discusses the evaluation of the framework.
8.1 INTERPRETATION OF THE ENTIRE DATA
Exploratory sequential mixed methods research design was adopted due to the
nature of the research problem and the research questions being addressed on
the impact of KM in reducing COPQ on construction projects. This commenced
with a qualitative research phase which explored the views of participants and
addressed the key research questions. The data collected from this phase were
then analysed, and the findings used to build into a second, quantitative phase.
The qualitative phase was used to build an instrument that best fits the sample
under study, to identify appropriate instruments to use in the follow-up quan-
titative phase and to specify variables for the follow-up quantitative study.
Qualitative data was collected using semi-structured interviews while
quantitative data was collected using survey questionnaires. It was therefore
important to synthesise and interpret the entire data in order to reach logical
conclusions for the research. This requires examining the link between the main
CHAPTER 8: KM FRAMEWORK FOR REDUCING COPQ ON PROJECTS
266
research questions, the findings from the qualitative study, further questions
generated and findings from the quantitative study.
Table 8.1 summarises the exploratory sequential mixed methods research
findings and conclusions. Three main research questions were addressed
through qualitative inquiry while further questions and hypotheses were
addressed by quantitative inquiry. The first research question was aimed at
investigating the contributory factors to COPQ in practice. Although the causes
or the key elements to COPQ have been identified from literature review as
design changes, errors and omissions, and poor skills, this may not be entirely
accurate in the local context of the UK construction industry moreover these
causes identified from literature were closely linked with the manufacturing
industry. It was therefore important to investigate the main causes of COPQ and
their contributory factors through exploratory study conducted with construction
industry experts. It was found from the analysis of the qualitative data that the
main causes of COPQ identified from literature can be localised in the UK
construction industry.
Other causes were also identified such as product damages resulting from
transportation, vandalism on site and other unforeseen risks however the
findings were site-specific and could not be generalised for the industry
moreover these causes were not entirely related to KM issues. The rationale
behind investigating the contributory factors to COPQ is to identify the
commonality of the factors that cut across all project types based on
participants’ experiences. A total of 12 factors were found in common that
contributed to the cost of errors and omissions regardless of project types.
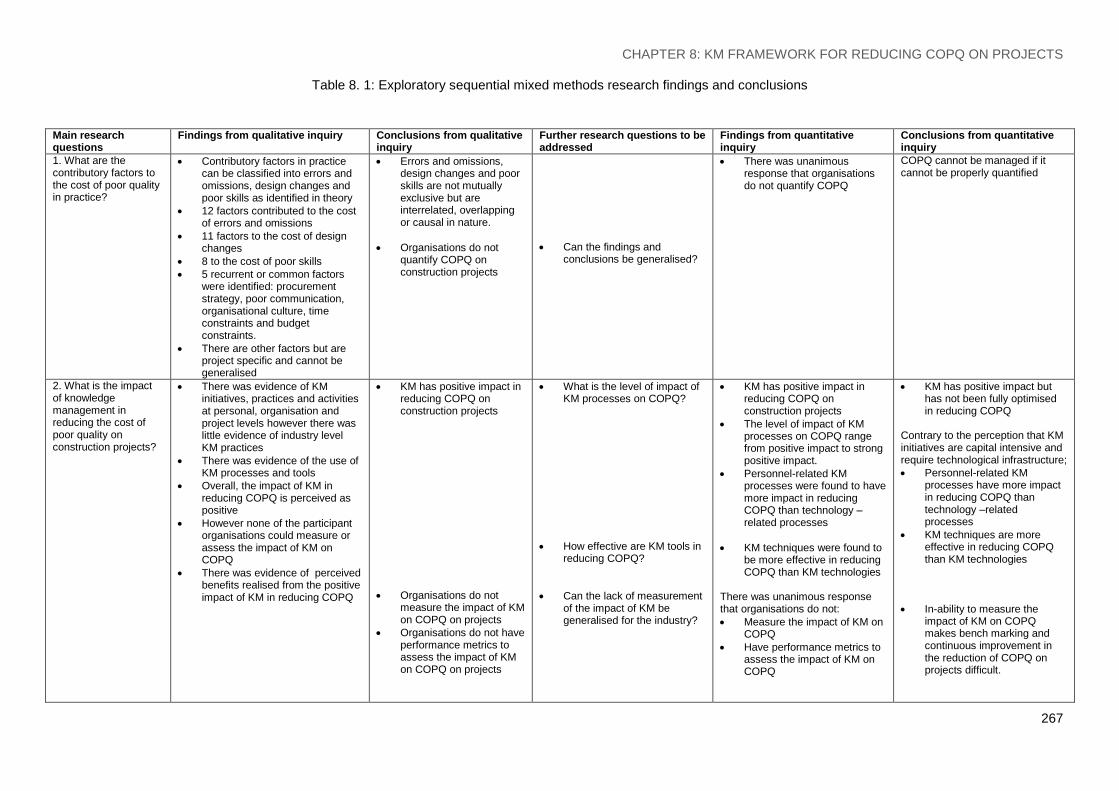
CHAPTER 8: KM FRAMEWORK FOR REDUCING COPQ ON PROJECTS
267
Table 8. 1: Exploratory sequential mixed methods research findings and conclusions
Main research questions
Findings from qualitative inquiry Conclusions from qualitative inquiry
Further research questions to be addressed
Findings from quantitative inquiry
Conclusions from quantitative inquiry
1. What are the contributory factors to the cost of poor quality in practice?
Contributory factors in practice can be classified into errors and omissions, design changes and poor skills as identified in theory
12 factors contributed to the cost of errors and omissions
11 factors to the cost of design changes
8 to the cost of poor skills
5 recurrent or common factors were identified: procurement strategy, poor communication, organisational culture, time constraints and budget constraints.
There are other factors but are project specific and cannot be generalised
Errors and omissions, design changes and poor skills are not mutually exclusive but are interrelated, overlapping or causal in nature.
Organisations do not quantify COPQ on construction projects
Can the findings and conclusions be generalised?
There was unanimous response that organisations do not quantify COPQ
COPQ cannot be managed if it cannot be properly quantified
2. What is the impact of knowledge management in reducing the cost of poor quality on construction projects?
There was evidence of KM initiatives, practices and activities at personal, organisation and project levels however there was little evidence of industry level KM practices
There was evidence of the use of KM processes and tools
Overall, the impact of KM in reducing COPQ is perceived as positive
However none of the participant organisations could measure or assess the impact of KM on COPQ
There was evidence of perceived benefits realised from the positive impact of KM in reducing COPQ
KM has positive impact in reducing COPQ on construction projects
Organisations do not measure the impact of KM on COPQ on projects
Organisations do not have performance metrics to assess the impact of KM on COPQ on projects
What is the level of impact of KM processes on COPQ?
How effective are KM tools in reducing COPQ?
Can the lack of measurement of the impact of KM be generalised for the industry?
KM has positive impact in reducing COPQ on construction projects
The level of impact of KM processes on COPQ range from positive impact to strong positive impact.
Personnel-related KM processes were found to have more impact in reducing COPQ than technology –related processes
KM techniques were found to be more effective in reducing COPQ than KM technologies
There was unanimous response that organisations do not:
Measure the impact of KM on COPQ
Have performance metrics to assess the impact of KM on COPQ
KM has positive impact but has not been fully optimised in reducing COPQ
Contrary to the perception that KM initiatives are capital intensive and require technological infrastructure;
Personnel-related KM processes have more impact in reducing COPQ than technology –related processes
KM techniques are more effective in reducing COPQ than KM technologies
In-ability to measure the impact of KM on COPQ makes bench marking and continuous improvement in the reduction of COPQ on projects difficult.

CHAPTER 8: KM FRAMEWORK FOR REDUCING COPQ ON PROJECTS
268
KM has perceived benefits in reducing COPQ on projects
Which are the top benefits of KM in reducing COPQ?
Top benefits are: increased revenue for growth, improved process quality, improved project performance, improved customer satisfaction
3. How can knowledge management be optimised to reduce the cost of poor quality?
KM can be optimised to reduce COPQ by addressing the key barriers:
Lack of performance metrics to assess the impact of KM on COPQ on projects
Lack of knowledge champions to facilitate KM activities to reduce COPQ
Adversarial organisational culture towards KM
In-adequate time for KM activities
In-adequate budget for KM activities
Procurement strategy
KM has currently not been optimised to reduce COPQ due to key barriers
KM has further potential in reducing COPQ
Can the findings be generalised?
What is the level of strength of the barriers?
Which are the top barriers?
The top KM barriers in the wider construction industry are:
Lack of performance metrics
Adversarial organisational culture
Lack of collaborative working
Perception of errors as inevitable
Adversarial procurement strategy
The key barriers identified from qualitative inquiry can be generalised in the industry. KM can therefore be optimised to reduce COPQ by addressing the key barriers
There is a link between the contributory factors to COPQ and the barriers to KM. They are: procurement strategy, organisational culture, time and budget constraints

CHAPTER 8: KM FRAMEWORK FOR REDUCING COPQ ON PROJECTS
269
They include rule-based mistakes, knowledge-based mistakes, slips and lapses
and attention. 11 factors were found to contribute to the cost of design changes
which include changes initiated by clients, organisations in the supply chain or
external stakeholders. 8 factors were found to contribute to poor skills which
include high personnel turnover, lack of training and lack of dedication. A total of
5 recurrent or common factors were identified which cut across at least two of
the causes of COPQ. They are procurement strategy, poor communication,
organisational culture, time constraints and budget constraints therefore making
these factors critical to address.
The second research question was aimed at investigating the impact of KM in
reducing COPQ on construction projects. There was evidence of KM initiatives,
practices and activities at personal, organisational and project levels however
there was little evidence of industry level initiatives and practices. There was
evidence of the utilisation of KM processes e.g. knowledge capture and
knowledge sharing. There was also evidence of the utilisation of KM-supporting
tools (techniques and technologies) such as learning reviews, post-project
reviews, lessons learnt management systems and collaborative physical
working spaces. Overall, the impact of KM in reducing COPQ was concluded as
positive however none of the participant experts in the qualitative study could
substantiate this with calculated data. None of the participant organisations
could measure or assess the impact of KM on COPQ although there was
evidence of perceived benefits realised from the positive impact.

CHAPTER 8: KM FRAMEWORK FOR REDUCING COPQ ON PROJECTS
270
The third research question relates to the optimisation of KM in reducing COPQ.
It was found that KM is not currently being optimised or utilised to its maximum
potential due to certain barriers which were identified as: lack of performance
metrics to assess the impact of KM on COPQ on projects; lack of knowledge
champions to facilitate KM activities to reduce COPQ; adversarial organisational
culture towards KM; in-adequate time for KM activities; in-adequate budget for
KM activities; and procurement strategy. Conclusions were drawn from the
qualitative inquiry as follows: errors and omissions, design changes and poor
skills are not mutually exclusive but are interrelated, overlapping and causal in
nature; organisations do not quantify COPQ on construction projects; KM has
positive impact in reducing COPQ on construction projects; organisations do not
measure the impact of KM on COPQ on projects; organisations do not have
performance metrics to assess the impact the impact of KM on COPQ on
projects; KM has perceived benefits in reducing COPQ on projects; KM has
currently not been optimised to reduce COPQ due to the key barriers; KM has
further potential in reducing COPQ on projects.
Despite the conclusions reached at the end of the qualitative inquiry, further
questions emerged which needed to be addressed through quantitative inquiry
e.g. can the findings and conclusions from the qualitative study be generalised
for the UK construction industry? What is the level of impact of KM processes
on COPQ? How effective are KM tools in reducing COPQ? Can the lack of
measurement of the impact of KM be generalised for the industry? Which are
the top benefits of KM in reducing COPQ? What is the level of strength of the
barriers to KM in reducing COPQ? Can the top barriers of KM be generalised in
the industry?

CHAPTER 8: KM FRAMEWORK FOR REDUCING COPQ ON PROJECTS
271
The findings from the quantitative inquiry confirm that organisations do not
quantify COPQ on projects and that KM has positive impact in reducing COPQ
on construction projects. It was found that the level of impact of KM processes
on COPQ range from positive impact to strong positive impact. Personnel-
related KM processes were found to have more impact in reducing COPQ than
technology-related processes. KM techniques were also found to be more
effective in reducing COPQ than KM technologies. It could be generalised that
organisations do not measure the impact of KM on COPQ neither do they have
performance metrics to assess the impact of KM on COPQ.
The top benefits of KM in reducing COPQ were identified as; increased revenue
for growth, improved process quality, improved project performance, improved
customer satisfaction. The top KM barriers identified was confirmatory of the
ones identified through qualitative inquiry which include lack of performance
metrics, adversarial organisational culture, lack of collaborative working,
perception of errors as inevitable, and adversarial procurement strategy. The
conclusions drawn from the quantitative inquiry was that COPQ cannot be
managed if it cannot be properly quantified. The in-ability to measure the
impact of KM on COPQ makes bench marking and continuous improvement in
the reduction of COPQ on projects difficult. The key barriers identified from
qualitative inquiry can be generalised in the industry. KM can therefore be
optimised to reduce COPQ by addressing the key barriers. Interestingly there is
a link between the contributory factors to COPQ and the barriers to KM. They
are; procurement strategy, organisational culture, time and budget constraints.

CHAPTER 8: KM FRAMEWORK FOR REDUCING COPQ ON PROJECTS
272
Having concluded that KM has positive impact in reducing COPQ, the impact
can be further classified into high impact and low impact based on research
findings. The classification is based on the impact of KM processes and the
effectiveness of KM tools. The synthesis of the outputs from both qualitative and
quantitative inquiries are interpreted and presented under three sub-headings;
Impact of KM on errors and omissions; impact of KM on design changes; and
impact of KM on poor skills.
8.1.1 Impact of KM on errors and omissions
The top five KM processes that impact the reduction of errors and omissions,
design changes and poor skills were identified from data analysis and
redistributed on the KM – COPQ model (Figure 8.1). Socialisation at
organisational level KM had the most impact on the reduction of errors and
omissions. The facilitation of KM across organisations in the supply chain using
knowledge champions; knowledge sharing among project team members; and
the creation of new knowledge have particularly ranked high in this area. There
was also evidence of socialisation at personal level in form of knowledge
transfer from senior personnel of an organisation to junior ones through
mentoring. Combination at project level entailed knowledge capture of project
knowledge by organisations in the supply chain. However the KM processes
having low impact in reducing errors and omissions were found to be
knowledge identification, knowledge codification through the conversion of
personnel knowledge into organisational knowledge, and knowledge
dissemination through communities of practice (Figure 8.2). At project level,
knowledge codification from project to document and knowledge storage have
low impact.

CHAPTER 8: KM FRAMEWORK FOR REDUCING COPQ ON PROJECTS
273
In terms of the effectiveness of KM tools, socialisation at organisational level
was found to be highly effective for reducing errors and omissions (Figure 8.3).
This includes learning reviews, knowledge sharing workshops, post project
reviews and collaborative physical workspaces. Lessons learnt management
system was also found effective at project level. However bottom five and the
least effective tools include blogs, the use of intranets, corporate yellow pages
and instant messenger at organisational level (Figure 8.4). Peer assist was
found less effective.
8.1.2 Impact of KM on design changes
Socialisation at organisational level also had high impact in reducing design
changes (Figure 8.1). This includes early involvement of stakeholders and
organisations in the supply chain; knowledge creation; and knowledge sharing
among project team personnel. Combination at project level involved knowledge
capture from project to project. Combination at industry level also had impact on
design changes through knowledge dissemination of publications and case
studies on best practices. The low impact processes at organisational level
include knowledge champions, knowledge identification, and knowledge
dissemination through communities of practice (Figure 8.2). At personal level,
knowledge transfer ranked low while at project level, knowledge storage ranked
low.
Highly efficient tools for reducing design changes were found to be similar to
those used for reducing errors and omissions. They are learning reviews, post
project reviews, knowledge sharing workshops (Figure 8.3). At project level,

CHAPTER 8: KM FRAMEWORK FOR REDUCING COPQ ON PROJECTS
274
lessons learnt management systems were highly effective. The less effective
tools include competency management, intranets, blogs and instant messenger
(Figure 8.4)
8.1.3 Impact of KM on poor skills
Socialisation at personal level and externalisation at organisational level have
the most impact in reducing poor skills (Figure 8.1). While knowledge transfer
through mentoring apprenticeships impact poor skills at personal level,
knowledge identification and capture of personnel knowledge impact poor skills
at organisational level. Knowledge facilitation through knowledge champions
also ranks high in this area. The low impact processes are: knowledge creation
at organisational level; knowledge storage, knowledge codification from project
to document and from project to project (Figure 8.2). KM tools were found to be
effective in reducing poor skills. At personal level, peer assist was found very
effective (Figure 8.3). At organisational level, post project reviews, competency
management, and knowledge sharing workshops were found very effective. At
project level, lessons learnt management systems were found very effective
however instant messenger, intranets, email, brainstorming and wikis were
found less effective in reducing the cost of poor skills.

CHAPTER 8: KM FRAMEWORK FOR REDUCING COPQ ON PROJECTS
275
Cost of Poor Quality (COPQ)
(Unnecessary-avoidable costs)
Errors and omissions
Design changes
Effect of poor quality: Rework/delays/wastage
Failure costs (internal) Failure costs (External)
Cost indicator (tangible- quantifiable): Plant/ material/ labour/ time
Poor skills
Contributory factors to poor quality
Nonconformities and inefficient processes
Cost indicator (tangible-quantifiable): Penalty costs
Cost indicator (intangible-non quantifiable): Lost opportunities for sales revenue
Customer dissatisfaction
Cost implication (Direct costs)
Cost implication (Indirect costs)
Organisational level KM - Socialisation (S) among
personnel across organisations. - Externalisation (E) between
personnel and their organisation - Combination across organisations
Personal level KM - Socialisation (S) among personnel
from same organisation - Internalisation (I) between
personnel and their organisation
Project level KM - Combination (C) between
organisations and the project knowledge base.
- Combination (C) between project knowledge bases.
Industry level KM - Combination (C) between project
knowledge bases and industry knowledge base
Figure 8. 1: Impact of KM in reducing COPQ (High-impact KM processes)
Knowledge transfer- mentoring (S)
Knowledge transfer- apprenticeships (S)
- Knowledge transfer- mentoring (S)
Knowledge champions (S) Knowledge sharing among
project team (S) Knowledge creation (S)
Knowledge sharing- early involvement (S)
Knowledge creation (S) Knowledge sharing-project
team (S)
Knowledge identification (E) Knowledge capture- personnel
to organisation (E)
Knowledge capture- project to organisation (C)
Knowledge capture- project to project (C)
Knowledge champions (S)
- Knowledge dissemination- publications (C)
-

CHAPTER 8: KM FRAMEWORK FOR REDUCING COPQ ON PROJECTS
276
Cost of Poor Quality (COPQ)
(Unnecessary-avoidable costs)
Errors and omissions
Design changes
Effect of poor quality: Rework/delays/wastage
Failure costs (internal) Failure costs (External)
Cost indicator (tangible- quantifiable):
Plant/ material/ labour/ time
Poor skills
Contributory factors to poor quality
Nonconformities and
inefficient processes
Cost indicator (tangible-quantifiable): Penalty costs
Cost indicator (intangible-non quantifiable): Lost opportunities for sales revenue
Customer dissatisfaction
Cost implication (Direct costs)
Cost implication (Indirect costs)
Organisational level KM - Socialisation (S) among
personnel across organisations. - Externalisation (E) between
personnel and their organisation - Combination across organisations
Personal level KM - Socialisation (S) among personnel
from same organisation - Internalisation (I) between
personnel and their organisation
Project level KM - Combination (C) between
organisations and the project knowledge base.
- Combination (C) between project knowledge bases.
Industry level KM - Combination (C) between project
knowledge bases and industry knowledge base
Figure 8. 2: Impact of KM in reducing COPQ (Low-impact KM processes)
- Knowledge transfer- mentoring (S)
-
Knowledge identification (E) Knowledge codification-
personnel to document (E) Knowledge dissemination- communities of practice(S)
Knowledge champions (S) Knowledge identification (E) Knowledge dissemination- communities of practice(S)
Knowledge creation (S)
Knowledge codification- project to document (C)
Knowledge storage (C)
Knowledge storage (C)
Knowledge storage (C) Knowledge codification- project
to document (C) Knowledge capture- project to
project (C)
- - Knowledge dissemination- publications (C)

CHAPTER 8: KM FRAMEWORK FOR REDUCING COPQ ON PROJECTS
277
Cost of Poor Quality (COPQ)
(Unnecessary-avoidable costs)
Errors and omissions
Design changes
Effect of poor quality: Rework/delays/wastage
Failure costs (internal) Failure costs (External)
Cost indicator (tangible- quantifiable): Plant/ material/ labour/ time
Poor skills
Contributory factors to poor quality
Nonconformities and
inefficient processes
Cost indicator (tangible-quantifiable): Penalty costs
Cost indicator (intangible-non quantifiable): Lost opportunities for sales revenue
Customer dissatisfaction
Cost implication (Direct costs)
Cost implication (Indirect costs)
Organisational level KM - Socialisation (S) among
personnel across organisations. - Externalisation (E) between
personnel and their organisation - Combination across organisations
Personal level KM - Socialisation (S) among personnel
from same organisation - Internalisation (I) between
personnel and their organisation
Project level KM - Combination (C) between
organisations and the project knowledge base.
- Combination (C) between project knowledge bases.
Industry level KM - Combination (C) between project
knowledge bases and industry knowledge base
Figure 8. 3: Impact of KM in reducing COPQ (Highly effective KM tools)
Peer assist (S) - -
Learning reviews (S) Knowledge sharing workshops
(S) Post project reviews (S) Collaborative physical
workspaces (S)
Learning reviews (S) Post project reviews (S)
Knowledge sharing workshops (S)
Collaborative physical work spaces (S)
Post project reviews (S) Competency management (E)
Knowledge sharing workshops(S)
Lessons learnt management systems (C)
Lessons learnt management systems (C)
Lessons learnt management systems (C)
- - -

CHAPTER 8: KM FRAMEWORK FOR REDUCING COPQ ON PROJECTS
278
Cost of Poor Quality (COPQ)
(Unnecessary-avoidable costs)
Errors and omissions
Design changes
Effect of poor quality: Rework/delays/wastage
Failure costs (internal) Failure costs (External)
Cost indicator (tangible- quantifiable): Plant/ material/ labour/ time
Poor skills
Contributory factors to poor quality
Nonconformities and
inefficient processes
Cost indicator (tangible-quantifiable): Penalty costs
Cost indicator (intangible-non quantifiable): Lost opportunities for sales revenue
Customer dissatisfaction
Cost implication (Direct costs)
Cost implication (Indirect costs)
Organisational level KM - Socialisation (S) among
personnel across organisations. - Externalisation (E) between
personnel and their organisation - Combination across organisations
Personal level KM - Socialisation (S) among personnel
from same organisation - Internalisation (I) between
personnel and their organisation
Project level KM - Combination (C) between
organisations and the project knowledge base.
- Combination (C) between project knowledge bases.
Industry level KM - Combination (C) between project
knowledge bases and industry knowledge base
Figure 8. 4: Impact of KM in reducing COPQ (Less effective KM tools)
Brainstorming (S) Wikis (I)
Peer assist (S)
Peer assist (S)
Blogs (E) Intranets (E)
Corporate yellow pages (E) Instant messenger (E)
Competency management (E) Intranets (E)
Blogs (E) Instant messenger (E)
Instant messenger (E) Intranets (E)
Email (E)
- - -
- - -

CHAPTER 8: KM FRAMEWORK FOR REDUCING COPQ ON PROJECTS
279
8.2 KM FRAMEWORK FOR REDUCING COPQ ON
CONSTRUCTION PROJECTS
The KM framework for reducing COPQ on construction projects is the final
framework resulting from the modification of three previous conceptual
frameworks. The first conceptual framework was developed based on the
output from literature review to synthesise KM and COPQ concepts and to
guide the research in the collection, interpretation and explanation of data. This
was presented before the qualitative data collection phase and contained
components relating to outputs from literature review, key research questions to
be addressed and possible outcomes to be expected. The conceptual
framework was modified after the qualitative data collection and analysis. A
second framework was presented, the components of which contains the
conclusions from the qualitative study and four further questions for the
quantitative study. The framework was modified again after the quantitative
study data analysis; a third framework was presented which linked the outputs
from both qualitative and quantitative studies.
Having synthesised and interpreted the entire data, the final framework is
presented in Figure 8.5. The framework is similar to previous framework except
that the research questions and hypotheses have been replaced by the findings
and conclusions. The framework consists of 5 components labelled from [A] to
[E]. Component [A] forms the core of the research and shows the logic between
KM and COPQ. The status quo is that COPQ is prevalent and perhaps stems
from poor KM. optimising KM therefore is expected to cause a reduction in
COPQ.

CHAPTER 8: KM FRAMEWORK FOR REDUCING COPQ ON PROJECTS
280
Figure 8. 5: KM framework for reducing COPQ on construction projects
Adopt a KM-supportive procurement strategy
Appoint knowledge champion(s)
Create project knowledge base
Allocate adequate time and budget
for KM initiatives/activities
Encourage KM-supportive organisational and project culture
1. Identify the contributory factors to COPQ. Classify factors into design
changes, errors and omissions, poor skills or others
[D] Assess the impact of KM on COPQ
4. Calculate total cost of KM initiatives as percentage of total project cost
2. Categorise the effects of the factors into rework, delays or wastage
[B] Address the key barriers to KM
3. Calculate the cost implications in terms of plant, material, labour and
time
4. Calculate the total COPQ as a percentage of total project cost
[C] Quantify COPQ 1. Review KM initiatives implemented (at
personal, organisational, project and industry levels) pre-COPQ issues
3. Implement new KM initiatives or reinforce ongoing ones to reduce COPQ.
5. Calculate the impact of KM on COPQ as percentage cost of KM investment versus
the percentage reduction of COPQ
[E] Identify the benefits of reducing
COPQ through KM
Reduced
COPQ
Optimised KM
Poor KM
Prevalent
COPQ
[A] KM-COPQ Link
Improved product quality
Increased revenue for growth
Improved process quality
Improved project performance
Increased customer satisfaction
2. Review KM initiatives post-COPQ issues

CHAPTER 8: KM FRAMEWORK FOR REDUCING COPQ ON PROJECTS
281
The rationale behind component [A] relates to the two of the main research
questions; what is the impact of KM on COPQ? And how can KM be optimised
to reduce COPQ? In other words; how does KM currently impact COPQ? And
how should KM impact COPQ? The aim of the research therefore is to provide
the solution for bridging the gap between poor KM and optimised KM to reduce
COPQ.
Component [B] is derived from the qualitative and quantitative data analyses
which concluded that in order to optimise KM to reduce COPQ, there are
existing key barriers which need to be addressed. Organisations need to
therefore adopt a KM-supportive procurement strategy; appoint knowledge
champion(s) on every project; create a project knowledge base; allocate
adequate time and budget for KM initiatives; and encourage a KM-supportive
organisational and project culture.
Component [C] is derived from extensive literature review and qualitative data
analysis. An integrated COPQ model was presented in Chapter 3 which showed
how all aspects of previous studies of COPQ are interlinked particularly the
causes, effects and cost implications of COPQ. One of the conclusions from
qualitative data analysis is that organisations do not quantify COPQ neither do
they know how to quantify it. A key step to managing COPQ however is the
ability to quantify it. The integrated COPQ model therefore was used as a
framework for Component [C] to quantify COPQ. A four step approach was
adopted as follows: (1) identify the contributory factors to COPQ and classify
the factors into design changes, errors and omissions, poor skills and other
project-specific classifications (2) categorise the effects of the factors into

CHAPTER 8: KM FRAMEWORK FOR REDUCING COPQ ON PROJECTS
282
rework, delays or wastage (3) calculate the cost implications in terms of plant,
material, labour, time or penalties (4) calculate the total COPQ as a percentage
of total project cost.
Component [D] relates to the assessment of the impact of KM in COPQ and is
derived from the critical review of literature and the findings from qualitative and
quantitative data. One of the novelty of the research is the categorisation of KM
into four levels and the investigation of KM initiatives no the four levels. It was
concluded that despite KM initiatives currently in use, it was found that
organisations do not assess the impact of KM on COPQ. A five-step approach
was therefore presented as follows: (1) review KM initiatives implemented at
personal, organisational, project and industry levels before the COPQ issues (2)
review KM the initiatives post-COPQ issues (3) implement new KM initiatives or
reinforce ongoing initiatives to reduce COPQ (4) calculate total cost of KM
initiatives as percentage of total project cost (5) calculate the impact of KM on
COPQ as percentage cost of KM investments versus the percentage reduction
of COPQ.
Component [E] is derived from literature data collection and analysis. This is the
output of the impact of KM on COPQ in which the benefits are categorised as
applicable to particular projects. The benefits include increased revenue for
growth, improved process quality, improved project performance, increased
customer satisfaction and improved product quality. There are so many benefits
that can be realised from reducing COPQ through KM, the ones presented in
the framework are the ones that ranked highest in the quantitative data
analysis.

CHAPTER 8: KM FRAMEWORK FOR REDUCING COPQ ON PROJECTS
283
The framework is a cyclic process which should be repeated periodically e.g.
monthly unlike the current practices whereby KM is reviewed at the end of a
project phase. This assessment should be conducted regularly especially while
the project is still ongoing. This enables knowledge champions or knowledge
managers to track repetition of mistakes and lessons learnt. With the use of the
framework, no two COPQ issues if any must be the same. Periodical progress
report of projects must be produced while the performance on one project can
easily be compared with another, using the same methodology.
8.3 EVALUATION OF THE FRAMEWORK
The research adopted a mixed method approach and an exploratory sequential
research design. This means that the main aspect of the research is qualitative
with a supporting quantitative aspect. In evaluating the KM framework, it is
important first to examine the concept validity in research which is described by
a wide range of terms. This concept is not a single, fixed or universal, but rather
a contingent construct, inescapably grounded in the processes and intentions of
particular research methodologies and projects (Winter, 2000).
Although some qualitative researchers have argued that the term validity is not
applicable to qualitative research, but at the same time, they have realised the
need for some kind of qualifying check or measure for their research. For
example, Creswell and Miller (2000) suggest that the validity is affected by the
researcher’s perception of validity in the study and the choice of paradigm
assumption. As a result, researchers have developed their own concepts of
validity and have often generated or adopted what they consider to be the more
CHAPTER 8: KM FRAMEWORK FOR REDUCING COPQ ON PROJECTS
284
appropriate terms, such as, quality, rigor and trustworthiness (e.g. Stenbacka,
2001; Davies and Dodd, 2002). The discussion of quality in qualitative research
stems from the concerns about validity and reliability in quantitative tradition
which involved substituting new term for words such as validity and reliability to
reflect interpretivist or qualitative conceptions (Seale, 1999).
According to Stenbacka (2001), the concept of validity should be redefined for
qualitative researches. In searching for the meaning of rigor in research, Davies
and Dodd (2002) found that the term rigor in research appears in reference to
the discussion about reliability and validity. Davies and Dodd (2002) argued that
the application of the notion rigor in qualitative research should differ from those
in quantitative research by accepting that there is a quantitative bias in the
concept of rigor, in which case, one can now move on to develop a re-
conception of rigor by exploring subjectivity, reflexivity, and the social interaction
of interviewing.
In this research therefore, the term ‘evaluation’ is used rather than ‘validation’.
Evaluation is the systematic determination of a subject's merit, worth and
significance, using set criteria. Participant evaluation was carried out in which
the data and/or findings were returned to participants in order to obtain
their evaluation. This involves research participants responding either to forms
of initial data, e.g. transcripts of interviews, or observations of activities, in order
to check them for accuracy, or to first drafts of interpretive reports to respond,
again, to their accuracy, but also to the interpretive claims that are being made
(Lincoln and Guba, 1985; Creswell, 2003; Teddlie and Tashakkori, 2009). Mixed
methods researchers are increasingly acknowledging the importance of

CHAPTER 8: KM FRAMEWORK FOR REDUCING COPQ ON PROJECTS
285
engaging with the views and perspectives of research participants in order to
represent these perspectives as fully and validly as possible (Christ 2009, 2010,
Mertens et. al. 2010).
The proposed KM framework for reducing COPQ which consolidates much of
the research findings were presented to selected industry experts to evaluate
based on the following objectives:
To assess the KM – COPQ link or relationship presented in Component [A]
of the framework if the dynamics are truly reflective of situation in practice.
To confirm that the key barriers identified in Component [B] of the framework
are the critical ones to be addressed in the optimisation of KM in reducing
COPQ in practice.
To assess the adequacy and completeness of the four (4) steps to
quantifying COPQ presented in Component [C].
To assess the adequacy and completeness of the five (5) steps to assessing
the impact of KM on COPQ presented in Component [D].
To confirm that the benefits of reducing COPQ through KM presented in
Component [E] are consistent with the ones found in practice.
To assess the dynamics and the interconnectedness of the entire
framework.
To evaluate the usefulness of the framework in driving continuous
improvement in the construction industry through the optimisation of KM to
reduce COPQ.
To assess the feasibility of the uptake of the framework and its application in
practice.
To identify how the framework can be improved.

CHAPTER 8: KM FRAMEWORK FOR REDUCING COPQ ON PROJECTS
286
In order to achieve these objectives, interviews were carried out with the
selected participants. An evaluation template was developed which contained
interview questions that needed to be addressed by the participants (see
Appendix 6). The template was developed to ensure consistency in the
approach to which the interviews were conducted. Although the interviews
were conducted face-to-face, the template served as a guide for the researcher.
The template consists of two sections. Section A contains general information
about the participants i.e. years of experience in the construction industry, types
of construction projects they have undertaken, type of organisations they have
worked for, current job designation, job level and area of expertise and so on.
Section B contains the evaluation questions stated below:
1. Are the dynamics of the KM – COPQ link reflective of the situation in
practice?
2. Are the key barriers identified the critical ones to be addressed in the
optimisation of KM in reducing COPQ in practice?
3. Are the four (4) to quantifying COPQ adequate and complete?
4. Are the five (5) steps to assessing the impact of KM on COPQ adequate
and complete?
5. Are the benefits of reducing COPQ through KM consistent with the ones
found in practice?
6. Are the dynamics and interconnectedness of the framework congruous?
7. Will the framework useful in driving continuous improvement in the
construction industry through the optimisation of KM to reduce COPQ?
8. What are your comments on the practicality of the framework; as
demonstrated on a spreadsheet?
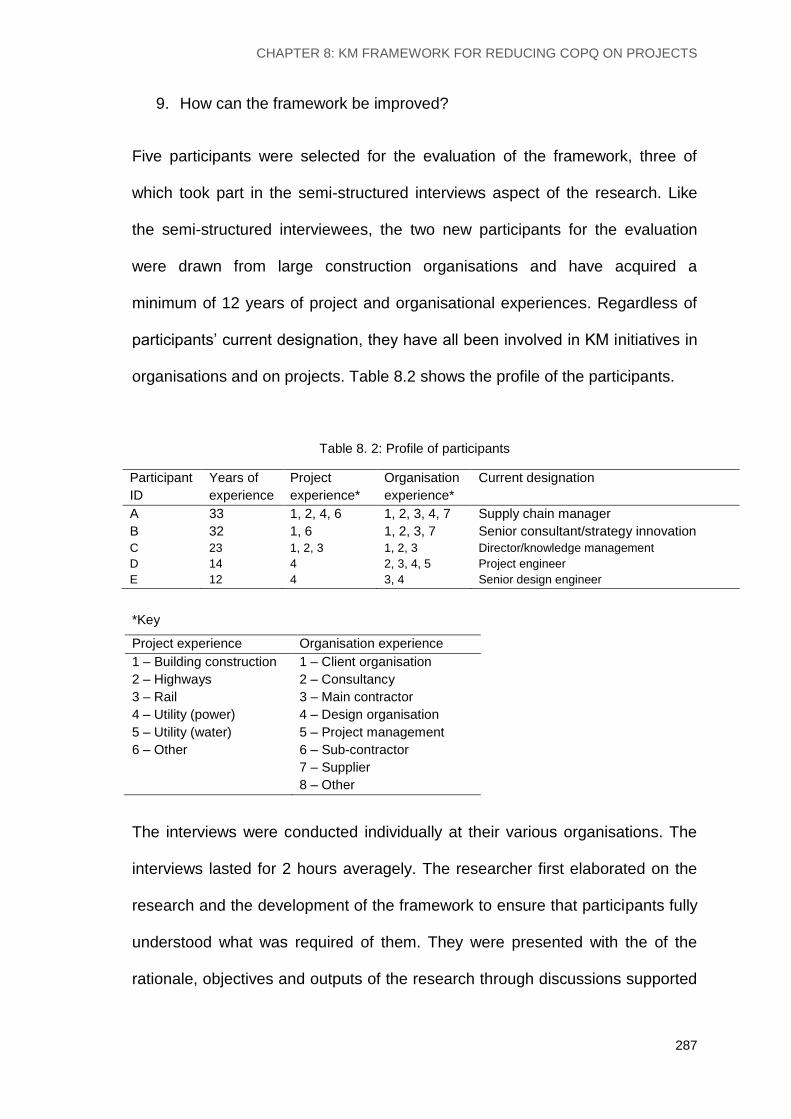
CHAPTER 8: KM FRAMEWORK FOR REDUCING COPQ ON PROJECTS
287
9. How can the framework be improved?
Five participants were selected for the evaluation of the framework, three of
which took part in the semi-structured interviews aspect of the research. Like
the semi-structured interviewees, the two new participants for the evaluation
were drawn from large construction organisations and have acquired a
minimum of 12 years of project and organisational experiences. Regardless of
participants’ current designation, they have all been involved in KM initiatives in
organisations and on projects. Table 8.2 shows the profile of the participants.
Table 8. 2: Profile of participants
Participant
ID
Years of
experience
Project
experience*
Organisation
experience*
Current designation
A 33 1, 2, 4, 6 1, 2, 3, 4, 7 Supply chain manager
B 32 1, 6 1, 2, 3, 7 Senior consultant/strategy innovation
C 23 1, 2, 3 1, 2, 3 Director/knowledge management
D 14 4 2, 3, 4, 5 Project engineer
E 12 4 3, 4 Senior design engineer
*Key
Project experience Organisation experience
1 – Building construction
2 – Highways
3 – Rail
4 – Utility (power)
5 – Utility (water)
6 – Other
1 – Client organisation
2 – Consultancy
3 – Main contractor
4 – Design organisation
5 – Project management
6 – Sub-contractor
7 – Supplier
8 – Other
The interviews were conducted individually at their various organisations. The
interviews lasted for 2 hours averagely. The researcher first elaborated on the
research and the development of the framework to ensure that participants fully
understood what was required of them. They were presented with the of the
rationale, objectives and outputs of the research through discussions supported

CHAPTER 8: KM FRAMEWORK FOR REDUCING COPQ ON PROJECTS
288
by research documents, tables and diagrams to ensure that the participants
fully understand the background to the development of the framework. The
framework components and dynamics were discussed in details. All the
participants are experts in the field of knowledge management particularly
within the construction project management context therefore were able to
understand and relate to the research.
An Excel spreadsheet version of the framework was also presented to the
participants to see how the framework can be practically applied (see Appendix
7). Appendix 8 shows the excerpts from participant responses on the evaluation
of the framework. When asked the question about the dynamics of the KM-
COPQ link in Element [A] of the framework if it is reflective of the situation in
practice, all of the participants agreed that this is reflective of the situation in
practice.
“Yes definitely, the importance and relevance of knowledge management
cannot be overemphasised. We can save tons of money by optimising
knowledge management” – Participant A
“I think this is reflective of the situation in practice”. I think we struggle a
lot in this industry with knowledge management and that’s why we
haven’t been able to make most of it” – Participant B
When asked about the key barriers identified in Element [B] of the framework,
they all agreed to the barriers but with different focus on different areas. While
Participant B and Participant D focused on the culture aspect, Participant E
focused on the need for knowledge champions.
CHAPTER 8: KM FRAMEWORK FOR REDUCING COPQ ON PROJECTS
289
“Yes especially the culture aspect. At the end of the day it all comes to
behaviour. We ought to take knowledge management culture as
seriously as we take health and safety” – Participant B
“Yes as far as I can think of, having a knowledge base is good but most
importantly an organisational culture in which people willingly push and
pull knowledge into and from the knowledge base” – Participant D
“Yes these are the barriers that need to be addressed particularly
knowledge champions. We had no knowledge champions on most of the
projects I’ve worked on. This had significant impact on project cost as no
one championed lessons learnt from mistakes” – Participant E
When asked about the four (4) steps to quantifying COPQ shown in Element [C]
of the framework if adequate and complete, participants agreed to its adequacy
and completeness. According the participants, measuring COPQ has always
been an issue and having a framework to measure it is beneficial.
“Measuring the cost of poor quality and benchmarking performance has
always been a major issue. No one does it so I think the steps are
adequate to offer a solution in this area” – Participant A
“We have never quantified the cost of poor quality on projects. But I think
the steps can help in quantifying the cost of poor quality” – Participant C
Participants were asked if the five (5) steps to assessing the impact of KM on
COPQ shown in [D] are adequate and complete. All the participants agreed to
the five steps as complete and adequate for tracking the cost of KM

CHAPTER 8: KM FRAMEWORK FOR REDUCING COPQ ON PROJECTS
290
investments versus cost savings due to COPQ reduction. However Participant
B noted that it might be a bit complex yet achievable. Participant E suggested
the use of KPIs to benchmark the impact.
“Though it would appear a bit complex to assess the impact of
knowledge management on the cost of poor quality, I would say yes to
adequacy of the framework to address this area” – Participant B
“Yes. You may want to include the use of KPIs to benchmark the impact
of knowledge management” – Participant E
Participants were asked if the benefits of reducing COPQ through KM shown in
Element [E] of the framework are consistent with the ones found in practice.
Although all the participants agreed, Participant B noted the subjectivity of what
benefits mean to different organisations.
“Yes but is subjective, organisations have different drivers for knowledge
management and what sort of benefits they wish to gain from it. Benefits
can therefore vary” – Participant B
All the participants agreed that the dynamics and interconnectedness of the
framework are congruous. Four of the participants (A, B, C and E) agreed that
the framework would be a useful tool for driving continuous improvement in the
industry. Participant C however commented that “…the industry still has a
reputation for doing things the same old ways by repeating mistakes and re-
inventing the wheel”. Participant D commented that it depends on the
knowledge management technologies available to organisations.

CHAPTER 8: KM FRAMEWORK FOR REDUCING COPQ ON PROJECTS
291
“It depends. If we can have a central industry database or knowledge
base to store project data, then we can start aggregating data to see if
there is continuous improvement” – Participant D
Participants were asked to comment on the practicality of the framework as
demonstrated on a spreadsheet. They all commented that it was practicable
and workable as long as organisations make project data available.
“It’s practical and workable as long as organisations can provide the data
required to do the calculations” – Participant A
Participant C however noted that: “entering the project data in the spreadsheet
could be tedious but the benefits certainly outweighs this”
When asked how the framework can be improved, Participant A and Participant
C commented that this will be known with more tests. The rest of the
participants had no comments on how the framework can be improved.
“I think we will know in due course after running it with a number of
projects” – Participant A
“With more tests come improvement” – Participant C
Other excerpts from the framework evaluation can be found in Appendix 8. The
participants’ comments have been useful in achieving the objectives set out for
the evaluation of the framework.

CHAPTER 8: KM FRAMEWORK FOR REDUCING COPQ ON PROJECTS
292
8.4 SUMMARY OF CHAPTER 8
This chapter presented an interpretation of the qualitative and quantitative data
obtained from the exploratory sequential mixed method research. It connected
all aspects of the research including the main research questions, findings and
conclusions from both qualitative and quantitative inquiries. It discussed the
overall impact of knowledge management on errors and omissions, design
changes and poor skills by revisiting the KM-COPQ model matrix presented in
previous chapters. It presented the knowledge management framework for
reducing the cost of poor quality on construction projects. It also discussed the
evaluation of the framework.

CHAPTER 9: CONCLUSIONS AND RECOMMENDATIONS
293
CHAPTER 9
CONCLUSIONS AND RECOMMENDATIONS
This chapter presents a reflective review of the methodological process of the
research. It re-states the research aims and objectives. It discusses how the
research objectives were achieved. It reviews the research methods and
research outputs and their links to the research objectives. It presents the key
findings of the research from both theoretical work and fieldwork. It also
presents the recommendations, limitations of the research and direction for
further work and future studies.
9.1 REFLECTIVE REVIEW OF THE METHODOLOGICAL
PROCESS
The aims of the research were stated as follows:
(1) To investigate the impact of knowledge management in reducing the cost
of poor quality on construction projects
(2) To develop a knowledge management framework for reducing the cost of
poor quality on construction projects.
In order to address the aims, the following research objectives were identified:
(1) To critically review existing literature in the area of KM from both general
and construction industry perspectives in order to explore, identify and
document the key concepts, processes, tools, KM drivers, enablers,
benefits, barriers and issues relating to KM and the possible link to
COPQ

CHAPTER 9: CONCLUSIONS AND RECOMMENDATIONS
294
(2) To critically review existing literature in the area of quality management
with a specific focus on COPQ in construction, in order to explore,
identify and document the key concepts of quality, the causes of poor
quality, the costs associated with poor quality, the quality management
initiatives for reducing COPQ, the issues relating to COPQ in
construction and the possible link to KM.
(3) To develop a conceptual framework on the impact of KM in reducing
COPQ on construction projects based on the output from literature
review, in order to synthesise KM and COPQ concepts and to guide the
research in the collection, interpretation and explanation of data.
(4) To collect qualitative and quantitative data from construction
organisations across UK in order to investigate the impact of KM in
reducing COPQ on construction projects in practice.
(5) To analyse the data from objective 4, comparing the theoretical
constructs from objectives 1 – 3 with the analysed data in order to
interpret and document the findings, modify the conceptual framework
and present a final KM framework for reducing COPQ on construction
projects.
(6) To evaluate the proposed framework using selected construction
practitioners involved in knowledge management activities.
(7) To summarise the findings, draw final conclusions and recommendations
on the impact of KM in reducing COPQ on construction projects.
The research was carried out in three phases (1) theoretical work (2) fieldwork
(3) evaluation and conclusion (Figure 9.1). The theoretical work constitutes
objectives 1 – 3 of the study and chapters 1 – 5 of the thesis. The fieldwork

CHAPTER 9: CONCLUSIONS AND RECOMMENDATIONS
295
constitutes objectives 4 and 5 of the study and chapters 6 – 7 of the thesis. The
evaluation and conclusion phase covers objectives 6 and 7 of the study and
chapters 8 – 9 of the thesis.
9.1.1 How the research objectives were achieved
Objective 1 was achieved through examining the critical points of current body
of work in KM through extensive review of literature obtained from multiple
sources which included printed journals, online gateways and databases, online
journals, reference texts, conference papers and various books in the context of
the topic. Past and current literature on the conceptualisations of knowledge
and KM were critically reviewed. It was found that KM related not so much on
the justification knowledge but on understanding the uses of knowledge in order
to effectively deal with tasks that involve knowledge-based activity. This shaped
the direction of the study into focusing on the contemporary definitions,
concepts and applications of KM.
Knowledge types, sub-types and characteristics were identified. Despite the
existence of a plethora of definitions of KM which are daunting and confusing,
four commonalities were found: (1) Harnessing and integrating knowledge (2)
Adopting a knowledge management process (3) Utilising knowledge
management tools, and (4) Aligning knowledge management with
organisational strategy. The drivers, enablers, barriers and benefits of
knowledge management were identified. The application of KM in construction
was examined while a model for applying SECI to the construction supply chain
was presented. The issues relating to KM in construction were identified.
CHAPTER 9: CONCLUSIONS AND RECOMMENDATIONS
296
Objective 2 was achieved by examining the critical points of current body of
work in quality management with particular focus on COPQ through extensive
review of literature obtained from multiple sources as those for KM. The existing
body of work on quality management was examined with a specific focus on
COPQ on construction projects. The conceptualisations of quality including key
definitions and applications were examined. Three case studies obtained from a
secondary source which deal with construction stakeholders’ influence on the
definition of quality on construction projects were reviewed and findings
presented.
It was found that quality is not just defined by the customer (construction client)
but is also influenced by external stakeholders. The causes of poor quality were
found to be errors and omissions, design changes and poor skills. COPQ was
found to constitute the cost of non-conformities, cost of inefficient processes
and the cost of lost opportunity for revenue. It was discovered that the cost of
poor quality is endemic and is found to be over 10% of total project costs in
certain cases. Quality management initiatives and tools used by organisations
in reducing the costs of poor quality were explored. The issues relating to
COPQ in construction project management were also identified.

CHAPTER 9: CONCLUSIONS AND RECOMMENDATIONS
297
Figure 9. 1: A review of the methodological process for the research
Research problem Endemic COPQ in construction
Research aims - Investigate the impact of
KM in reducing COPQ - Develop a KM framework
for reducing COPQ
Chapter 1
Literature review on KM
Objective 1 Chapter 2
Literature review on COPQ
Objective 2 Chapter 3
Conceptual framework Issues, challenges, knowledge
gaps and key research questions to be addressed on the impact of KM on COPQ
Objective 3 Chapter 4
Research methodology Mixed methods approach
Constructivist →post-positivist
Inductive →deductive
Chapter 5
PHASE 1: THEORETICAL WORK PHASE 2: FIELDWORK
Research design Exploratory sequential mixed method
QUAL→quan
Qualitative method (QUAL) Semi-structured interviews- open ended questions
Unit of analysis: Mid/top level construction managers Sampling method: Non-probability – purposive/expert
Sample size: 25 interviewees Research instruments: Researcher-completed template
Ethical aspects of research considered
Analysis: Content analysis → Thematic
Objectives 4&5 Chapter 6
Modify conceptual framework based on findings
from semi-structured interview data analysis
Quantitative method (quan) Pilot survey: close ended/open ended questions
Sampling method: Non-probability – purposive/expert Sample size: 14 respondents
Research instruments: Respondent-completed questionnaire
Main survey: close ended questions Unit of analysis: UK construction organisations
Sampling method: Probability – random Sample size: 114 respondents
Research instruments: Respondent-completed questionnaire Ethical aspects of research considered
Analysis: Descriptive statistics
Objectives 4&5 Chapter 7
Update literature review
Output/Evaluation Interpret entire analysis on the impact of KM in reducing COPQ
Present final framework→ KM framework for reducing COPQ
Evaluation framework using interviews with industry experts Objective 6 Chapter 8
Conclusion Summarise research/ present
recommendations Objective 7 Chapter 9
PHASE 3: EVALUATION & CONCLUSION

CHAPTER 9: CONCLUSIONS AND RECOMMENDATIONS
298
Objective 3 was achieved through the synthesis of the body of work on KM and
COPQ. It examined the links between KM and the prevalent COPQ on
construction projects. It identified the issues, challenges, knowledge gaps and
key research questions on the impact of KM in reducing COPQ. One of the
knowledge gaps is that no research has been found to date that has
investigated the impact of KM on COPQ in construction. While the COPQ may
be regarded as a quality management problem the study takes a different
approach of exploring the link between KM and COPQ. This contributes to the
novelty of the research.
Key research questions were also presented together with a matrix showing the
areas of inquiry. The research questions posed were: (1) what are the
contributory factors to the cost of poor quality in practice? (2) What is the impact
of knowledge management in reducing the cost of poor quality based on the
contributory factors? (3) How can knowledge management be optimised to
reduce the cost of poor quality? The conceptual framework was developed
based on: the findings from literature on KM and COPQ; issues and challenges
relating to KM and COPQ; knowledge gaps; and key research questions to be
addressed. The framework was also modified as the research progressed
through the data collection and analyses phase.
Objectives 4 and 5 were achieved by utilising mixed methods of data collection
and analysis. An exploratory sequential research design was adopted which
commenced with qualitative study and was followed up with a quantitative
study. The qualitative aspect utilised semi-structured interviews with industry
experts as a means of data collection while the quantitative aspect utilised

CHAPTER 9: CONCLUSIONS AND RECOMMENDATIONS
299
survey questionnaire. Qualitative data was analysed using content analysis
while quantitative data was analysed using descriptive and analytical statistics.
It was found that KM had positive impact in reducing COPQ but it is uncertain
by how much. Quantitative data analysis identified highest ranking and lowest
ranking KM processes impacting COPQ. It also identified the highest and lowest
ranking KM tools for reducing COPQ. In order to optimise KM, it was found that
organisations need to: develop performance metrics to measure or track the
impact of KM on COPQ; appoint knowledge champions or knowledge
coordinators to facilitate KM; cultivate positive organisational culture towards
KM e.g. willingness to readily share knowledge and also pull knowledge from
existing knowledge resources within the organisation; allocate appropriate time
and budget for KM activities; encourage integration and collaborative working
among the supply chain. The conceptual framework was modified as a result of
the data analysis from both qualitative and quantitative studies.
Objective 6 was achieved through the interpretation of the entire research data
which led to the development of the final framework i.e. KM framework for
reducing COPQ on construction projects. The framework was evaluated
through participant evaluation by industry experts. KM framework for reducing
COPQ on construction projects evaluated.
Objective 7 was achieved by drawing together and documenting all the aspects
of the research, including the conclusions and recommendation, in a final report
or thesis on the KM framework for reducing COPQ on construction projects.
Table 9.1 summarises how the research objectives were achieved through the
research methods and outputs.

CHAPTER 9: CONCLUSIONS AND RECOMMENDATIONS
300
Table 9. 1: A summary of how the research objectives were achieved
Objectives Methods Outputs
Thesis chapters
1: Introduction to research
1. To critically review existing literature in the area of KM from both general and construction industry perspectives in order to explore, identify and document the key concepts, processes, tools, KM drivers, enablers, benefits, barriers and issues relating to KM and the possible link to COPQ
Examined the critical points of current body of work in KM through extensive review of literature obtained from multiple sources which included printed journals, online gateways and databases, online journals, reference texts, conference papers and various books in the context of the topic. The findings were identified and documented.
Definition of KM for the study derived from critical review of the work of previous authors.
KM model for the construction supply chain, derived from the integration of the SECI model with the construction supply chain model
Processes, tools, KM drivers, enablers, benefits, barriers and issues relating to KM and the link to COPQ identified and documented.
2: Literature review on knowledge management
2. To critically review existing literature in the area of quality management with a specific focus on COPQ in construction, in order to explore, identify and document the key concepts of quality, the causes of poor quality, the costs associated with poor quality, the quality management initiatives for reducing COPQ, the issues relating to COPQ in construction and the possible link to KM.
Examined the critical points of current body of work in quality management with particular focus on COPQ through extensive review of literature obtained from multiple sources which included printed journals, online gateways and databases, online journals, reference texts, conference papers and various books in the context of the topic. The findings were identified and documented.
Definition of quality derived from critical review of previous work and secondary data analysis
COPQ model developed from integrating previous models
Key concepts of quality, causes of poor quality, costs associated with poor quality, quality management initiatives for reducing COPQ, issues relating to COPQ in construction and the link to KM identified and documented.
3: Literature review on the cost of poor quality
3. To develop a conceptual framework on the impact of KM in reducing COPQ on construction projects based on the output from literature review, in order to synthesise KM and COPQ concepts and to guide the research in the collection, interpretation and explanation of data.
The conceptual framework was developed based on: the findings from literature on KM and COPQ; issues and challenges relating to KM and COPQ; knowledge gaps; and key research questions to be addressed. The framework was also modified as the research progressed through the data collection and analyses phase.
Conceptual framework on the impact of KM in reducing COPQ on construction projects developed.
4: Conceptual framework
5: Research methodology
4. To collect qualitative and quantitative data from construction organisations across UK in order to investigate the impact of KM in reducing COPQ on construction projects in practice.
5. To analyse the data from objective 4, comparing the theoretical constructs from objectives 1 – 3 with the analysed data in order to interpret and document the findings, modify the conceptual framework and present a final KM framework for reducing COPQ on construction projects.
Mixed methods of data collection and analysis was utilised for the research. Exploratory sequential research design was adopted which commenced with qualitative study and was followed up with a quantitative study. The qualitative aspect utilised semi-structured interviews with industry experts as a means of data collection while the quantitative aspect utilised survey questionnaire. Qualitative data was analysed using content analysis while quantitative data was analysed using descriptive and analytical statistics.
Contributory factors to COPQ identified from qualitative data analysis
Impact of KM on errors and omissions, design changes and poor skills were also identified.
Conceptual framework modified as a result of qualitative data analysis.
Impact of KM processes, efficiencies of KM tools, top barriers and benefits of KM were identified through quantitative data analysis.
Conceptual framework modified as a result of quantitative data analysis.
6: Qualitative study on the impact of knowledge management on the cost of poor quality
7: Quantitative study on the impact of knowledge management on the cost of poor quality
6. To evaluate the proposed framework using selected construction practitioners involved in knowledge management activities.
Framework was evaluated through participant evaluation by industry experts.
KM framework for reducing COPQ on construction projects evaluated.
8: KM framework for reducing COPQ on construction projects
7. To summarise the findings, draw final conclusions and recommendations on the impact of KM in reducing COPQ on construction projects.
Achieved by drawing together and documenting all the aspects of the research to present a final report/thesis on the KM framework for reducing COPQ on construction projects.
Research report/thesis presented. 9: Conclusions and recommendations

CHAPTER 9: CONCLUSIONS AND RECOMMENDATIONS
301
9.2 KEY FINDINGS
The key findings are two-fold; the first relates to the output from theoretical work
while the second relates to the output from field work.
9.2.1 Findings from theoretical work
KM is invaluable to the construction industry as it is deemed critical for
construction organisations to harness and integrate knowledge in order
to improve efficiency and increase profitability.
Despite KM initiatives, construction projects are still plagued with
inefficiencies, repetition of mistakes and lack of lessons learnt thereby
contributing to additional project costs.
A major area of focus is on the cost attached to the unnecessary effort
of re-doing processes or activities incorrectly implemented the first time
often referred to as the cost of poor quality. This includes the cost of
errors and omissions, cost of design changes, cost of poor skills and the
consequential costs associated with client dissatisfaction
COPQ is endemic and has been found to range from around 2% to over
10% of total project cost regardless of project type and size
Previous studies have focused on the constituent aspects of COPQ
such as quality failures, non-conformance cost, direct and indirect
rework costs, design and construction related change orders. None of
the studies have attempted a holistic approach of integrating all these
aspects which include design changes, errors and omissions, poor skills
which lead to rework, delays and wastage, and quantified in terms of
plant, material, labour, time, and penalty costs.

CHAPTER 9: CONCLUSIONS AND RECOMMENDATIONS
302
Previous studies have also adopted different methodologies in
quantifying aspects of COPQ, which makes it difficult to compare COPQ
from project to project and to benchmark progress in the industry.
Government reports have criticised the industry for underperforming.
Clients are becoming more sophisticated, insisting on better value for
money, and demanding more units of construction for fewer units of
expenditure. There exists therefore the critical need to formulate
strategies for reducing the COPQ in construction.
Furthermore no research has been found to date that has investigated
the impact of KM in reducing COPQ on construction projects.
The construction industry is project-based thereby posing the challenge
of knowledge capture, retention and re-use
The industry is fragmented thereby brings about the challenge of
knowledge integration across organisations
The industry is criticised for being poor at learning, ‘reinventing the
wheel’, repeating mistakes and wasting resources
Multiple organisations are typically involved in a single project creating
the challenge of integration and collaborative working with a focus on
the end product and customer value
Clients are often dissatisfied with project performance, project process
and product quality
There is low profitability of organisations as a result of KM related
inefficiencies
Larger organisations are more likely to formally practice KM than the
majority of small organisations

CHAPTER 9: CONCLUSIONS AND RECOMMENDATIONS
303
COPQ is endemic and may be difficult to quantify, especially the
intangible aspects of external failure costs.
There exists a critical need to formulate strategies for reducing COPQ
due to government and client demands
9.2.2 Findings from fieldwork
It was found that projects are still plagued with inefficiencies, repetition of
mistakes and lack of lessons learnt thereby contributing to unnecessary
cost of re-doing processes incorrectly implemented the first time.
The constituent elements of COPQ were found to be the cost of errors
and omissions, the cost of design changes, and the cost of poor skills.
Out of the contributory factors to COPQ, 12 were found to contribute to
the cost of errors and omissions, 11 to the cost of design changes and 8
to the cost of poor skills.
There were commonalities found within the contributory factors.
Organisational culture was found to be common with errors and
omissions, and poor skills. Procurement strategy and poor
communication was found to be common with errors and omissions, and
design changes. Time constraints and budget constraints were found to
contribute to all three constituent elements of COPQ. Considering the
commonalties and overlaps, this brings the total contributory factors to
twenty four.
Causal links were found between the COPQ factors contrary to the
theoretical suggestion of being mutually exclusive. Errors and omissions
for example can be caused by poor skills; errors and omissions on site

CHAPTER 9: CONCLUSIONS AND RECOMMENDATIONS
304
can be caused by design issues; design changes can be caused by
irreversible errors on site, or by poor skills of the designers. COPQ
therefore requires an inclusive and holistic approach to addressing the
problem. Nevertheless the findings confirm the prevalent project
challenges faced by supply chain organisations in the project context
such as time constraints, tight schedules and limited budgets.
Surprisingly, it was found that COPQ can be profitable to the contractor
depending on the procurement strategy or contract type particularly if the
contractor was not involved in the design stages of the project. Any form
of design changes or rework can therefore benefit the contractor. This
can be profitable to the sub-contractors and suppliers as they would have
more paid work. COPQ can also be profitable to the designer in the case
of client’s decision to change the design specification or the scope of
work
KM can be complex and difficult to manage within organisations and on
projects. It is even more difficult to assess the impact of KM on COPQ.
Overall, KM was found to have positive impact in reducing COPQ
however it was found that organisations could not quantify COPQ neither
could they measure the extent of the impact of KM on COPQ.
There was evidence of harnessing and integrating knowledge utilising
KM processes (e.g. knowledge sharing and knowledge codification) and
tools (e.g. knowledge bases and virtual collaborative workspaces). Other
new insights from the findings include the need to develop toolkits to
track the impact of KM on COPQ on projects and the need to adopt

CHAPTER 9: CONCLUSIONS AND RECOMMENDATIONS
305
procurement strategies that support KM at personal, organisational,
project and industry levels.
It was found that KM currently has not been optimised to reduce COPQ
due to a number of barriers. Optimising KM to reduce COPQ involves:
developing performance metrics to assess the impact of KM on COPQ
on projects; appointing knowledge champions to facilitate KM activities to
reduce COPQ; adopting a positive organisational culture towards KM;
allocating adequate time for KM activities on projects; allocating
adequate budget for KM activities on projects; selecting procurement
strategies that support and facilitate KM
9.3 RECOMMENDATIONS
This study makes recommendations for both industry practitioners and
academics as follows.
9.3.1 Recommendations for industry practitioners
The recommendations for industry practitioners are closely connected to the
findings from the fieldwork phase of this research. This is particularly useful for
project managers, knowledge champions, quality managers and continuous
improvement managers within the construction supply chain. The study has
practical relevance and application in providing construction organisations with
the insight that investing in KM and quality management techniques,
technologies and systems is important but what is more important is the ability
to track the impact of the investment in cost terms. Organisations need to
understand and accept that there is an endemic COPQ problem which urgently
needs to be addressed. Organisations need to adopt a holistic approach and a

CHAPTER 9: CONCLUSIONS AND RECOMMENDATIONS
306
robust methodology in quantifying COPQ such as the one presented in this
study. Quantifying COPQ forms the basis on which to measure the impact of
KM on COPQ. Develop performance metrics to assess the impact of KM on
COPQ on projects. Organisations need to appoint leadership in form of
knowledge champions to facilitate KM activities to reduce COPQ on projects.
Knowledge champions must be adequately supported senior management or
project leadership. Senior management need to adopt and encourage a positive
organisational and project culture towards KM. Adequate time and budget need
to be allocated for KM initiatives and activities. Construction clients need to be
aware of the various procurement routes available, hence they need to select
procurement routes that facilitate KM especially in the aspects of early
involvement, integration and collaborative working of the supply chain.
Organisations need to progress beyond personal and organisational level KM to
project and industry level KM
9.3.2 Recommendations for academics
The variables generated from this study on KM and COPQ can be useful for
academics in extending the current study into other contexts e.g. small and
medium size organisations. An exploratory sequential mixed method was
adopted for this study, academics may use other approaches to study the same
phenomenon. An important recommendation will be to test the KM framework
for reducing COPQ on diverse case studies within the construction industry.
9.4 LIMITATIONS OF THE RESEARCH
This research focused on large construction organisations however the UK
construction industry is made up of significantly small and medium sized

CHAPTER 9: CONCLUSIONS AND RECOMMENDATIONS
307
organisations. Some of the findings and recommendations from this study may
not be applicable to them. A generic supply chain model for construction project
was adopted for this research, however different projects have different supply
chain arrangements and procurement strategies. This should therefore be taken
into consideration when administering the KM framework for reducing COPQ on
specific projects.
9.5 FURTHER WORK AND FUTURE STUDIES
This study focused on multi-projects by investigating the commonalities of KM
and COPQ issues regardless of project type. Further work therefore needs to
be carried out by identifying project-specific case studies in the industry and
piloting the KM framework for reducing COPQ. The case studies will cover
various construction industry sectors such as building projects, highways, rail
and utility projects. The study also has academic implication as it provides
groundwork for further research and extension of study for researchers in the
area.
9.6 SUMMARY OF CHAPTER 9
This chapter presented a reflective review of the methodological process of the
research. It re-stated the research aims and objectives. It discussed how the
research objectives were achieved. It reviewed the research methods and
research outputs and their links to the research objectives. It presented the key
findings of the research from both theoretical work and fieldwork. It also
presented the recommendations, limitations of the research and direction for
further work and future studies.

308
REFERENCES
Abdul-Rahman H (1995) The cost of non-conformance during a highway project: a case study. Construction Management and Economics 13(1): 23.
Abdul‐Rahman, H., Thompson, P.A., Whyte, I.L. (1996) Capturing the cost of non‐conformance on construction sites: An application of the quality cost matrix, International Journal of Quality and Reliability Management, 13(1), pp.48 - 60
Ackoff, R. L., (1989) From Data to Wisdom, Journal of Applies Systems Analysis, vol. 16, pp. 3-9.
Akdere, M. (2009). The role of knowledge management in quality management practices: Achieving performance excellence in organisations. Advances in Developing Human Resources, 11(3), 349 361.
Alavi M and Leidner D (1999) Knowledge Management Systems: Issues, Challenges and Benefits, Communications of the Association for Information Systems, 1(2).
Alawi, A., Marzooqi, A., and Mohammed, Y. (2007) Organizational culture and knowledge sharing: critical success factors. Journal of Knowledge Management. 11(2): 22–42.
Al-Gharibeh K. M. (2011) IBIMA Business Review http://www.ibimapublishing.com/journals/IBIMABR/ibimabr.html Vol. 2011. Article ID 328944, 13 pages DOI: 10.5171/2011.328944
Al-Ghassani A M, Anumba C J, Carrillo P.M. Robinson H.S. (2005) Tools and Techniques for knowledge management, In: Anumba C J, Egbu C O and Carrillo P M, Knowledge Management
in Construction, Blackwell Publishing, Oxford.
Al-Ghassani A M, Kamara J M, Anumba C J and Carrillo P M (2004) An Innovative Approach To Identifying Knowledge Management Problems, Engineering, Construction and Architectural Management 11(5), pp: 349-357
Al-Ghassani, A.M. (2002), Literature Review on KM Tools, Technical Report, July 2002,
Department of Civil and Building Engineering, Loughborough University, UK.
Aliverdi, R., Moslemi Naeni, L., and Salehipour, A. (2013). Monitoring project duration and cost in a construction project by applying statistical quality control charts. International Journal of Project Management, 31(3), 411-423.
American Society of Quality (ASQ) Glossary http://asq.org/glossary/q.html
Anand A., and Singh, M. D. (2011). Understanding Knowledge Management; A Literature Review. Int. J. Eng. Sci. Technol. 3(2): 926-939.
Anand, G., Ward, P.T., and Tatikonda, M.V. (2010). Role of explicit and tacit knowledge in Six Sigma projects: An empirical examination of differential project success. Journal of Operations Management, 28(4), 303-315.
Anumba C J, Egbu C O and Carrillo P M (2005), Knowledge Management in Construction, Blackwell Publishing, Oxford
APQC. (2000). Stages of implementation: A guide for your journey to knowledge management best practices.
Argote, L., and Miron-Spektor, E. (2011). Organizational learning: From experience to knowledge. Organization Science, 22(5), 1123-1137.
Argote, L., Darr, E. D., and Epple, D. (1995). The acquisition, transfer, and depreciation of knowledge in a service organizations: productivity in franchises. Management Science 14(1),
1750–1763.;

309
Argotes, L., Beckmanan, L., and Epple, D. (1990), The Persistence and Transfer of Learning in Industrial Settings, Management Science, 36, 140-154.
Armbrecht F.M.R., Chapas, R.B., Chappelow C.C. (2001) Knowledge management in research and development. Research-Technology Management, 44(4), pp: 28-48.
Armbrecht, F. M. R., Chapas, R. B., Chappelow, C. C., Farris, G. F., Friga, P. N., Hartz, C. A., McIlvaine, M. E., Postle, S. R., and Whitwell, G. E. (2001) Knowledge Management in Research and Development. Research-Technology Management, Vol. 44, n° 4, pp. 28-48.
Armstead C (1999) KM and process Performance, Journal of Knowledge management, vol. 3
No 2, pp 143-154.
Armstrong M (2000) A Handbook of Human Resource Management Techniques, 7th ed., Kogan
Page, London.
Ashford, J. L. (1989) Management of Quality in Construction. London, GBR: Spon Press.
Atkinson, H., Hamburg, J., and Ittner, C. (1994) Linking Quality to Profits: Quality-based Cost Management. Milwaukee: Quality Press.
Aurm A, Daneshgar F and Ward J. (2007) Investigating knowledge management practices in software development organisations – An Australian Experience. Information and Software Technology. Elsevier, Vol. 50. Pp. 511-533.
Azam Haron, N., Abdul-Rahman, H., Wang, C., and Wood, L. C. (2015). Quality function deployment modelling to enhance industrialised building system adoption in housing projects. Total Quality Management and Business Excellence, 26(7/8), 703-718.
Babbie, E. (2001). The practice of social research (9th ed.). Belmont: Wadsworth.
Babbie, E. (2004) Laud Humphreys and research ethics, International Journal of Sociology and Social Policy, Vol. 24 Issue 3/4/5 pp. 12 - 19
Bacon and Olsen (2005). Ethical issues in conducting research. [online] Available at: http://www.sagepub.com/upm-data/26094_3.pdf. [Accessed 24th Dec 2012]
Baker, T. L. (1994), Doing Social Research. 2nd Ed. New York: McGraw-Hill Inc.
Barnett, T. J. (2006) Knowledge Management Solutions and Selection Tool for Engineering Organisations. PhD Thesis
Bates, M. E. (2015). Making Our Implicit Knowledge Visible. Online Searcher, 39(1), 80.
Becca-Fernandez, I., and Leidner, D. (2008). Individual, group, and organizational learning: A knowledge management perspective. În I. Becca-Fernandez, & D. Leidner, Knowledge Management: An Evolutionary View. pg. 13-39. New York: M. E. Sharpe.
Becerra-Fernandez, I., Gonzalez, A. and Sabherwal, R. (2004) Knowledge Management: Challenges, Solutions, and Technologies, Pearson Prentice-Hall, New Jersey.
Beckford, J. (1998) Quality: A Critical Introduction. Florence, KY, USA: Routledge.
Beckman, T., (1997). A Methodology for Knowledge Management. In: Proceedings
Beecroft, D. (2000). Cost of Quality. Quality Planning, Canada : GDB Inc.
Behin, D. (2005) Knowledge Management @ McKinsey. The Strategic Knowledge Management Forum. Osney Media. London
Benbya, H., Passiante, G., and Belbaly, N. (2004), Corporate portal: a tool for knowledge management synchronization. International Journal of Information Management. Vol. 24, pp. 201–220

310
Benjamin Martz, W., and Shepherd, M. M. (2003). Testing for the Transfer of Tacit Knowledge: Making a Case for Implicit Learning. Decision Sciences Journal Of Innovative Education, 1(1), 41-56.
Bennet, A., and Bennet, D. (2003). A Partnership between Organizational Learning and Knowledge Management. In: Handbook on Knowledge Management, Volume 1: Knowledge Matters, C. W. Holsapple (ed.), Springer-Verlag, Heidelberg, pp. 439-460.
Berg, B. L., and Lune, H. (2012). Qualitative Research Methods for the Social Sciences (8th ed.) p. 408. Harlow, Essex, England: Pearson.
Berger, P. L., and Luckman, T. (1967). The Social Construction of Reality; a Treatise in the Sociology of Knowledge. Penguin, Harmondsworth
Bhatt, G. D. (2001) Knowledge Management in Organisation Examining the Interaction between Technology, Techniques and People, Journal of Knowledge Management, 5(1), 68-75.
Bhirud, S., Rodrigues, L., and Desai, P. (2005) Knowledge sharing practices in KM: A case study in Indian software subsidiary. Journal of Knowledge Management Practice.
BIS (Department for Business, Innovation and Skills) (2013) UK Construction: An economic analysis of the sector. London UK.
Bisgaard (2008) Quality Management and Juran’s Legacy in Quality Engineering, 20:390-401. Taylor & Francis Group.
Blackler, F. (1995) Knowledge, Knowledge Work and Organisations: An Overview and Interpretation. Organization Studies, Vol. 16, No. 6
Blumentritt, R., Johnston, R. (1999) Towards a Strategy for Knowledge Management. Technology Analysis and Strategic Management. Vol. 11, No. 3, pp287-300.
Borg, L., and Song, H. (2015). Quality Change and Implications for Productivity Development: Housing Construction in Sweden 1990-2010. Journal of Construction Engineering and Management, 141(1), -1.
Borgatti, S. P., and Everett, M. G. (1999) Models of core/periphery structures. Social Networks 21:375–395.
Bounfour, A. (2003). The Management of Intangibles. The Organization’s Most Valuable Assest. Routledge. London. New York
Boyd D and Chinyio E (2006) Understanding the Construction Client. John Wiley & Sons.
Brand, A. (1998). Knowledge management and innovation at 3M. Journal of Knowledge Management 2: 1, 17-22.
Brelade, S. and Harman, C. (2003) Practical Guide to Knowledge Management. London, GBR:
Thorogood Publishing.
Brophy, P. (2004). The quality of libraries. In: Hilgermann, K. and te Borkhorst, P. (eds.) Die
Brown, Seely, J., and Duguid, P. (2001). Knowledge and Organization: A Social- Practice Perspective. Organization Science 12(2): 198-213.
Budihardjo Surijah, A. (2015). Knowledge Management Support, Employee Engagement, Knowledge Sharing and Corporate Performance. Annual International Conference on Business Strategy and Organizational Behaviour (Bizstrategy), 24-30.
Burati JL, Farrington JJ and Ledbetter WB (1992), Causes of quality deviations in design and construction. ASCE Journal of Construction Engineering and Management 118: 34-49.
Burrows, A. and Harvey, L. (1992) Defining Quality in Higher Education: The Stakeholder
311
Cabinet Office (2011) Government Construction Strategy May 2011 [online]; available from https://www.gov.uk/government/publications/government-construction-strategy [accessed June 2013]
Cai, S., Goh, M., De Souza, R., and Li, G. (2013). Knowledge sharing in collaborative supply chains: twin effects of trust and power. International Journal Of Production Research, 51(7), 2060-2076.
Campanella, J. (Ed.) (1999). Principles of Quality Costs: Principles, Implementation and Use,
3rd ed. Milwaukee, WI: ASQ Quality Press.
Campenella, J. (1990), Principles of Quality Costs, ASQC Quality Press, New York, NY.
Carrillo P and Chinowsky P (2006) Exploiting knowledge management: the engineering and construction perspective. ASCE Management in Engineering 22(1) 2-10.
Carrillo P M, Anumba C J and Kamara J M (2000) Knowledge Management for Construction; Key IT and Contextual Issues, Construction Informatics Digital Library http://itc.scix.net/paper
w78-2000-155.content
Carrillo P, Ruikar K, Fuller, P (2013) When will we learn? Improving lessons learned practice in construction. International Journal of Project Management 31(2013): 567–578.
Carrillo PM, Robinson HS, Al-Ghassani AM and Anumba CJ (2004) Knowledge management in UK construction: strategies, resources and barriers. Project Management Journal 35(1): 46-56.
Carrillo, P., Robinson, H. Anumba, C. and Al-Ghassani, A. (2003) IMPaKT: A Framework for Linking Knowledge Management to Business Performance. Electronic Journal of Knowledge Management,
Carrillo, P., Robinson, H., Al-Ghassani, A. and Anumba, C. (2004) Knowledge Management in UK Construction: Strategies, Resources and Barriers. Project Management Journal
Carrillo, P., Robinson, H., Al-Ghassani, A. and Anumba, C. (2004) Knowledge Management in UK Construction: Strategies, Resources and Barriers. Project Management Journal
Chase, R. (1997) The knowledge-based organization: An international survey. Journal of Knowledge Management. 38–49.
Chatzimichailidou, M. M., Katsavounis, S., and Lukac, D. (2015). A Conceptual Grey Analysis Method for Construction Projects. Management (1820-0222), (74), 25-36.
Cheikhrouhou, N., Tawil, A. H., and Choudhary, A. (2013). Modelling Competence-Based Virtual Organisations Using the Unified Enterprise Competence Modelling Language. International Journal of Production Research 51 (7): 2138–2159.
Chen, C., and Yang, J. (2015). Causes of Budget Changes in Building Construction Projects: An Empirical Study in Taiwan. Engineering Economist, 60(1), 1-21.
Chen, L., and Fong, P. S. (2015). Evaluation of knowledge management performance: An organic approach. Information & Management, 52(4), 431-453.
Cherryholmes, C. H. (1992). Notes on pragmatism and scientific realism. Educational Researcher, 14, 13-17.
Cheung, L., Chung, P., Stone, R. and Dai, W. (2005) A Personal Knowledge Management Tool that Supports Organizational Knowledge Management. Loughborough University Institutional Repository
Cheung, S. O., Yiu, T. W., and Lam, M. C. (2013). Interweaving Trust and Communication with Project Performance. Journal Of Construction Engineering and Management, 139(8), 941-950.
Chiadamrong, N. (2003). The development of an economic quality cost model, Total Quality Management and Business Excellence, 14(9), 999-1014.

312
Chiang, Y.-H. and Tang, B.-S. (2003), Submarines don’t leak, why do buildings? Building quality, technological impediment and organization of the building industry in Hong Kong, Habitat International, Vol. 27, pp. 1-17
Chinn, P. L., and Kramer, M. K. (1999): Theory and nursing: a systematic approach. 5the ed. Mosby. St Louis. USA.
Chong, A.Y., Chan, F. T. S., Goh, M., and Tiwari, M.K. (2013) Do Inter-organisational Relationships and Knowledge-Management Practices Enhance Collaborative Commerce Adoption? International Journal of Production Research 51 (7): 2006–2018.
Chong, S., and Choi, Y. (2005) Critical factors in the successful implementation of knowledge management. Journal of Knowledge Management Practice.
Choudhary, A. K., Harding, J., Camarinha-Matos, L. M., Lenny Koh, S., and Tiwari, M. K. (2013). Knowledge management and supporting tools for collaborative networks. International Journal Of Production Research, 51(7), 1953-1957.
Chowdhury, S. (2002) Design for Six Sigma : The Revolutionary Strategy for Achieving Extraordinary Profits. Chicago, IL, USA: Dearborn Trade, A Kaplan Professional Company.
Chowdhury, S. (2005) Ice Cream Maker : An Inspiring Tale about Making Quality the Key Ingredient in Everything You Do. Westminster, MD, USA: Doubleday Publishing.
Chua A (2004) Knowledge management system architecture: a bridge between KM consultants and technologists. International Journal of Information Management 24: 87–98.
Chung HW (1999) Understanding Quality Assurance in Construction: A Practical Guide to ISO 9000 for Contractors. London, GBR: Routledge.
Chung, H. W. (1999) Understanding Quality Assurance in Construction : A Practical Guide to ISO 9000 for Contractors. London, GBR: Routledge.
Churchill, G. A., Jr., and Lacobucci, D. (2002). Marketing research: Methodological foundations (8th ed.). Fort Worth, TX: Harcourt.
Clandinin, D. J. and Connelly, F. M. (2000). Narrative inquiry: Experience and story in qualitative research. San Francisco: Jossey-Bass.
Clark J and Soliman F (1999), A graphical method for assessing knowledge-based investments, Journal of Logistics and Information Management, Vol. 12 No. 1, pp. 63-77.
Clark, P. (2000) Organisations in action: competition between contexts, London: Routledge
Clarke, A. E. (2005). Situational analysis: Grounded theory after the postmodern turn. Thousand Oaks, CA: Sage.
Cnuddle, M. (1991). Lack of quality in construction – economic losses, Proceedings of 1991 European Symposium on Management, Quality and Economics in Housing and other Building Sectors, pp. 508-515.
Cohen, W. M., and Levinthal, D. A. (1990). Absorptive Capacity: A New Perspective on Learning and Innovation. Administrative Science Quarterly 35 128-152.
Collison, C. and Parcell, G. (2001) Learning to fly: Practical lessons from one of the world’s leading knowledge companies, Capstone, Oxford.
Collison, C., Geoff P. (2005) Learning to Fly: Practical Lessons from One of the World's Leading Knowledge Companies, 2d ed. Capstone Publishing.
Committee on Advancing the, C. and Productivity of the, U. S. C. I. (2009) Advancing the Competitiveness and Efficiency of the U.S. Construction Industry. Washington, DC, USA:
National Academies Press.
Conheeney K., Stephenson P. And Griffiths A. (2000), Issues In Knowledge Transfer Within A Construction Training And Learning Organisation. Proceedings Of The International

313
Conference On Construction Information Technology (CIT2000), G. Gudson Ed., Reykjavik, Iceland, 28-30 June, Vol. 1, pp.229-240
Conheeney K., Stephenson P. And Griffiths A. (2000), Issues In Knowledge Transfer Within A Construction Training And Learning Organisation. Proceedings Of The International Conference On Construction Information Technology (CIT2000), G. Gudson Ed., Reykjavik, Iceland, 28-30 June, Vol. 1, pp.229-240
Corbin, J., and Strauss, A. (2008). The basics of qualitative research (3rd ed.) Los Angeles, CA:
Sage.
Cosmin, D., and Ana-Maria, S. (2013). Cost of Quality and Taguchi Loss Function. Annals of the University Of Oradea, Economic Science Series, 22(1), 1479-1485.
Costa, R., and Lima, C. (2015). Management of Knowledge Sources Supported by Domain Ontologies: Building and Construction Case Studys. Intelligent Systems In Accounting, Finance and Management, 22(1), 29-64.
Creswell, J. W. (2003). Research Design: Qualitative, Quantitative and Mixed Methods Approaches (2nd edition). Thousand Oaks, CA.: Sage.
Creswell, J. W. (2007). Qualitative inquiry and research design: Choosing among five approaches (2nd ed.). Thousand Oaks. CA: Sage.
Creswell, J. W. (2008) Educational Research: Planning, Conducting, and Evaluating Quantitative and Qualitative Research. Upper Saddle River, N.J.: Pearson/Merrill Prentice Hall.
Creswell, J. W. (2013). Qualitative Inquiry and Research Design Choosing Among Five Approaches (3rd ed.) p. 472. Los Angeles, CA: SAGE Publications.
Creswell, J. W. (2014). Research Design Qualitative, Quantitative, and Mixed Methods Approaches (4th ed., p. 304). Thousand Oaks, CA: SAGE Publications
Creswell, J. W. and Miller, D. L. (2000). Determining validity in qualitative inquiry. Theory into Practice, 39(3), 124-131.
Creswell, J. W., and Plano Clark, V. L. (2011). Designing and conducting mixed methods research (2nd ed.). Thousand Oaks, CA: Sage.
Creswell, J.W. (2009) Research Design: Quantitative, Qualitative and Mixed Methods Approaches, SAGE Publications, London
Crosby, P. B. (1979) Quality is Free: The Art of Making Quality Certain. New York McGraw-Hill.
Crosby, P.B. (1996) Quality is still free: making quality certain in uncertain times. New York/London, McGraw-Hill,
Crotty, M. (1998). The foundations of social research: Meaning and perspective in the research process. Thousand Oaks, CA: Sage.
Crouch M and McKenzie H (2006). The logic of small samples in interview based qualitative research. Social Science Information 45(4): 483-499.
Czaja, R. and Blair, J. (2005), Designing Surveys - a guide to decisions and procedures, 2nd Ed. Pine Forge Press.
Dahlgaard, J. J., Kristensen, K., and Kanji, G.K. (1992) Quality costs and total quality management. Total Quality Management, Vol. 3, No. 3, pp. 211-221.
Dahlgaard-Park, S. M. (2006) Consistency and Transformation in the Quality Movement.
Bradford, GBR: Emerald Group Publishing Ltd.
Dainty A, Bryman A and Price A (2002), Empowerment within the UK construction sector,
Leadership and Organisation Development Journal, Vol. 23, No. 6, pp. 333-342.

314
Dainty, A., Qin, J. and Carrillo, P. (2005) HRM Strategies for Promoting Knowledge Sharing within Construction Project Organisations: A Case Study. In: A.S. Kazi, (ed.) Knowledge Management in the Construction Industry: A Socio-Technical Perspective. London: Idea Group
Publishing.
Dale, B. G. and Plunkett, J. J. (1995) Quality Costing. 2nd ed. London: Chapman and Hall.
Dalkir, K. (2005) Knowledge Management in Theory and Practice. Butterworth-Heinemann.
Davenport T, De Long D and Beers D (1998) Successful Knowledge Management Projects,
Sloan Management Review, MIT, winter.
Davenport, T. H. (1994) Saving IT's Soul: Human Centered Information Management. Harvard Business Review. March-April, 72 (2)pp. 119-131. Duhon, Bryant (1998), It's All in our Heads. Inform, September, 12 (8).
Davenport, T.H., and Prusak, L. (1998) Working Knowledge: How Organizations Manage What They Know. Harvard Business School Press.
Davies, D., and Dodd, J. (2002). Qualitative research and the question of rigor. Qualitative Health Research, 12(2), 279-289.
De Feo, J. A., and Barnard, W. (2005). Juran Institute's Six Sigma Breakthrough and Beyond - Quality Performance Breakthrough Methods. New York, NY: McGraw-Hill Professional.
De Long W and Liam F (2000) Diagnosing Cultural Barriers to Knowledge Management, the
Academy of Management Executive, vol. 14, no.4, pp. 113-127.
De Vaus, D. A. (1993) Surveys in Social Research (3rd
ed.). London: UCL Press
De Vos, A. S., Strydom, H., Fouché, C. B., and Delport, C. S. L. (2005). Research at grass roots for the social sciences and human service professions. 3rd edition. Pretoria: Van Schaik
Publishers.
Defeo, J., and Juran, J.M. (2010) Juran's Quality Handbook: The Complete Guide to Performance Excellence. 6
th ed. McGraw Hill.
Delgado-Hernandez, D, and Aspinwall, E. (2008). A framework for building quality into construction projects - Part I. Total Quality Management and Business Excellence, 19, 10, pp.
1013-1028, Business
Deming, W. E. (1986) Out of the Crisis: Quality, Productivity and Competitive Position.
Cambridge: Cambridge University Press.
Deming, W.E. (1982) Quality, Productivity and Competitive Position. Massachusetts Institute of Technology, MA.
Denscombe, M. (2003) The Good Research Guide: For Small-Scale Social Research Projects,
2nd
edition. London: Open University Press.
Denzin, N. K., and Lincoln, Y. S. (2011). The SAGE Handbook of Qualitative Research (4th ed.) p. 984. Thousand Oaks, CA: SAGE Publications.
Department for Business Innovation and Skills (2014) UK Industry Performance Report Based on the UK Construction Industry Key Performance Indicators.
Desouza, Kevin C., and Yukika Awazu. (2005) Engaged Knowledge Management: Engagement with New Realities. Palgrave Macmillan
Despres C and Chauvel D (1999) Knowledge management(s), Journal of Knowledge Management, Volume 3, Number 2 . pp. 110-120.
Dillman, D. A. (2007) Mail and internet surveys - the tailored design method, 2nd ed. New York.
Wiley.

315
Dingsoyr, T. (2002) Knowledge management in medium-sized software consulting companies. Empirical Software Engineering. 7, 383–386.
Donaldson, T. and Preston, L. (1995) The stakeholder theory of the corporation: concepts, evidence, and implications. Academy of Management Review, 20(1), 65–91.
Dougherty V., (1999), Knowledge Is About People, Not Databases, Industrial and Commercial
Training, Vol.31 No. 7 pp. 262-266, MCB University Press
Douglas, C. (2012). Principles of Quality Costs, USA, ASQ Quality Management Division.
Drucker (1999) Management Challenges for 21st Century (New York: Harper Business)
Drucker P F (1989) What Businesses Can Learn from Nonprofits, Harvard Business Review, Vol. 67 pp.88-93 cited in Ahmad P K, Lim K K and Loh Y E (2002) Learning through Knowledge Management, Butterworth-Heinemann.
Drucker PF (1999) Management Challenges for the 21st Century. Elsevier Butterworth
Heinemenn.
Drucker, P. F. (1985) Innovation and Entrepreneurship: Practice and Principles. London:
Heinemann.
Drucker, P. F. (1993) Post-capitalist Society, Heinemann: Oxford.
Du Plessis, M. (2005) International Journal of Information Management. 25, 193–202 201
Duffy J (2000) Knowledge Management: To Be Or Not To Be? Information Management Journal, vol. 34 no. 1, pp 64-67.
Dulipovici, A., and Robey, D. (2013). Strategic Alignment and Misalignment of Knowledge Management Systems: A Social Representation Perspective. Journal Of Management Information Systems, 29(4), 103-126.
Ebert, R., and Griffin, R. (2005) Business Essential, 5th ed. Prentice Hall, Upper Saddle River, NJ.
Ebrahimi, M., and Sadeghi, M. (2013). Quality management and performance: An annotated review. International Journal of Production Research, 51(18), 5625-5643.
EC Harris (2013) Supply Chain Analysis into the Construction Industry – A Report for the Construction Industrial Strategy. Department for Business Innovation and Skills, BIS, London, UK.
Edvinsson L (1997) Developing Intellectual Capital at Skandia, Long Range Planning, Vol. 30
No.3, pp.366-73.
EFQM (2010) http://www.efqm.org.
Egan, J. (1998), Rethinking Construction: Report of the construction task force on the scope for improving the quality and efficiency of UK construction. Department of the Environment,
Transport and the Regions, London
Egan, J. (2002) Accelerating change: A report by the strategic forum for construction. Construction Industry Council, London.
Egbu C, Sturgesand J and Bates B (1999) Learning From Knowledge Management and Trans-
Organisational Innovations in Diverse Project Management Environments in Huges, W.P (ed)
Egbu C. and Botteril K (2001) Information technologies for knowledge management: their usage and effectiveness, Electronic Journal of Information Technology in Construction, Vol. 7 pp.p125.
Egbu C. O. and Robinson H S (2005) Construction as a Knowledge-Based Industry, in Anumba C J, Egbu C O and Carrillo P M, Knowledge Management in Construction, Blackwell Publishing, Oxford.
316
Egbu CO (2005) Knowledge management as a driver for innovation. Knowledge Management in Construction, Blackwell Publishing, Oxford, U.K., 121-131.
Egbu, C O, Kurul E, Quintas P, Hutchinson V, Anumba C, Al-Ghassani A and Ruikar K (2003) Report On The Knowledge Management User Requirement Workshop. Held on 6 December
(2002) , London, UK. www.knowledgemanagement.uk.net. Accessed on 20/04/09
Egbu, C. O., Botterill, K and Bates, M. (2001) A conceptual framework for studying knowledge management in project-based environments. Proceedings of the First International Conference on Postgraduate Research in the Built Environment, 15 – 16 March, University of Salford, UK, pp. 186 – 195.
Egbu, C., And Botterill K., (2002) Information Technologies For Knowledge Management: Their Usage And Effectiveness, Electronic Journal Of Information Technology In Construction, Vol. 7
Egbu, C., Anumba, C. and Carrillo, P. (2005) Introduction. In: Anumba, C., Egbu, C. and Carrillo, P. (eds.) Knowledge Management in Construction. Oxford: Blackwell Publishing
Egbu, C., Lee, C.C., Boyd, D., Xiao, H., and Chinyo, E. (2005), Graphical Conveyance of Knowledge Amongst Construction SMEs, CIB W102, Information and Knowledge Management in Global Economy: Challenges and Opportunities for Construction Organisations
Egbu,C. (2004) Managing knowledge and intellectual capital for improved organizational innovations in the construction industry: an examination of critical success factors, Engineering, Construction and Architectural Management, Vol. 11 Iss: 5, pp.301 - 315
Ek, F. İ., and Çıkış, Ş. (2015). Integrating the Kano model into architectural design: quality measurement in mass-housing units. Total Quality Management and Business Excellence, 26(3/4), 400-414.
Emerson, R. M., Frietz, R. I., and Shaw, L. L. (2011). Writing Ethnographic Fieldnotes (2nd ed.) p. 320. Chicago, IL: The University of Chicago Press.
Feigenbaum AV (1986) Total Quality Control. McGraw-Hill, New York.
Feigenbaum, A. V. (1956) Total quality control, Harvard Business Review, pp. 93–101.
Feigenbaum, A. V. (1991) Total Quality Control. 3rd edition, New York, NY: McGraw-Hill, Inc.
Feigenbaum, A. V., and Feigenbaum, D. S. (2009). The power of management innovation: 24 keys for sustaining and accelerating business growth and profitability. McGraw-Hill.
Fellows R., Liu A. (2008) Research Methods for Construction. Blackwell Publishing, West
Sussex.
Fellows, R., and Liu, A. (2003) Research methods for construction. Blackwell, UK.
Fetterman, D. M. (2010). Ethnography: Step-by step (3rd ed.). Thousand Oaks, CA:Sage.
Firestone, J.M., and McElroy,M.W. (2003) Key Issues in the New Knowledge Management.
Butterworth-Heinemann.
Fischer, G. (2001) Knowledge management: problems, promises, realities, and challenges. IEEE Intell. Systems. 16(1), 60–73.
Fitzgerald, B., and Howcroft, D. (1998) Competing Dichotomies in IS Research and Possible Strategies for Resolution. 19
th International Conference on Information Systems ICIS 1998,
Helsinki, Finland. pp. 155-164.
Flar, A.A. (2002) Implementing a Solution to Retain Knowledge. Knowledge Management Review, 4(6), pp 30-33.
Flinn, S.D. (2010) The Learning Layer: Building the Next Level of Intellect in Your Organization.
Palgrave Macmillan.

317
Fontana, A., and Frey, J. H. (2005) The interview: From neutral stance to political involvement. In Denzin, N. K., and Lincoln, Y. S. (Eds.) The Sage handbook of qualitative research (3rd Ed.), pp 695-727). Thousand Oaks, CA: Sage.
Fornasiero, R., and A. Zangiacomi (2013) A Structured Approach for Customised Production in SME Collaborative Networks. International Journal of Production Research 51 (7): 2110–2122.
Forsythe, P., Sankaran, S., and Biesenthal, C. (2015). How Far Can BIM Reduce Information Asymmetry in the Australian Construction Context?. Project Management Journal, 46(3), 75-87.
Fowler, F. J. (2002) Survey Research Methods, 3rd Edition. Sage: Thousand Oaks, CA.
Fox, W., and Bayat, M. S. (2007) A Guide To Managing Research; Cape Town: Juta and Co. Ltd.
Frankfort-Nachmias, C., and Nachmias, D. (1996). Research Methods in the Social Sciences, 5th edition. New York: St. Martin's Press.
Frappaolo, C. (2006) Knowledge Management, 2d ed. Capstone
Freeman, R. E. (1984) Strategic Management - A Stakeholder Approach. Pitman Publishing Inc, Marshfield, MA.
Galati, F. (2015). At what level is your organization managing knowledge?. Measuring Business Excellence, 19(2), 57-70.
García-Bernal, J., and García-Casarejos, N. (2014). Economic analysis of TQM adoption in the construction sector. Total Quality Management & Business Excellence, 25(3/4), 209-221.
Gardner, H. (1995). Reflections on Multiple Intelligences: Myths and Messages. Phi Delta
Kappan. 76: 200 - 209.
Garson, D. G. (2008). Factor Analysis: Statnotes. Retrieved March 22, 2008, from North
Carolina State University Public Administration Program.
Garstenauer, A., Blackburn, T., and Olson, B. (2014). A Knowledge Management Based Approach to Quality Management for Large Manufacturing Organizations. Engineering Management Journal,26 (4), 47-58.
Gašparík, J., and Gašparíková, V. (2013). Improvement of Quality Management Level in Construction Company by using EFQM Model. International Journal of Management and Innovation, 5(1), 46-60.
Gill, J., and Johnson, P. (1997), Research Methods for Managers, 2nd edition, London:
Chapman.
Gillham, B. (2000) Developing a Questionnaire. London and New York, Continuum.
Giorgi, A. (2009). The descriptive phenomenological method in psychology: A modified Husserlian approach. Pittsburg, PA: Duquesne University.
Glaser, B. G., and Strauss, A. L. (1999). The Discovery of Grounded Theory: Strategies for Qualitative Research (p. 271). New Brunswick: Aldine Transaction Publishers.
Glaser, Barney G and Strauss, Anselm L., (1967). The Discovery of Grounded Theory: Strategies for Qualitative Research, Chicago, Aldine Publishing Company
Goldman, A. (1986) epistemology and cognition. Cambridge: Harvard university press.
Goll, I., Johnson, N., and Rasheed, A. (2007) Knowledge capability, strategic change, and firm performance: The moderating role of the environment. Management Decision. 45(2): 161 –179.
Golob, K., Bastič, M., and Pšunder, I. (2013). Influence of Project and Marketing Management on Delays, Penalties, and Project Quality in Slovene Organizations in the Construction Industry. Journal Of Management In Engineering, 29(4), 495-502.

318
Goujon, A., Didierjean, A., and Poulet, S. (2014). The emergence of explicit knowledge from implicit learning. Memory and Cognition, 42(2), 225-236.
Graham, B. and Thomas, K. (2006) Knowledge management in Irish construction: the role of CPD accreditation, In: Boyd, D (Ed) 22nd Annual ARCOM Conference, University of Central England, Birmingham U.K. Association of Researchers in Construction Management, 1015-1024.
Graham, B. and Thomas, K. (2008) An Emerging Grounded Theory of Knowledge Management in the Leading Irish Construction Organisations. In: Proceedings of the 9th European Conference on Knowledge Management, Southampton Solent University, Southampton, UK, pp. 225-232.
Graham, B., Thomas, K. and Gahan, D. (2008). Towards a Framework for Capturing and Sharing Construction Project Knowledge. In: Zarli and Scherer (eds.), eWork and eBusiness in Architecture, Engineering and Construction, Proceedings of the 7th European Conference on
Product and Process Modelling, Sophia Antipolis, pp. 589-598, Taylor & Francis Group.
Griffith, A. (1990) Quality Assurance in Building, London: Macmillan.
Grimaldi, M. and Rippa P. (2011) An AHP-Based Framework for Selecting Knowledge Management Tools to Sustain Innovation Process, Knowledge and Process Management, Volume 18 Number 1 pp 45–55 (2011) Published online in Wiley Online Library (wileyonlinelibrary.com) DOI: 10.1002/kpm.365
Groff, Todd R., and Thomas P. Jones. (2003) Introduction to Knowledge Management: KM in Business. Butterworth-Heinemann.
Grunstein, M., and Barthes, J. P. (1996) An Industrial View of the Process of Capitalizing Knowledge, Proceedings of the 4th International Symposium on the Management of Industrial and Corporate Knowledge. p265-85.
Gryna, F.M. (1999), Quality and cost, in Juran, J.M. and Godfrey, A.B. (Eds), Juran’s Quality
Handbook, 5th ed., McGraw-Hill, NewYork, NY.
Hagan, J.T. (1986), Principles of Quality of Costs, American Society for Quality Control,
Milwaukee, WI.
Hammarlund, Y., and Josephson, P. E. (1991). Sources of quality failures in building. In Proceedings of the European Symposium on Management, Quality and Economics in Housing and other Building Sectors, pp. 671-679.
Hansen M T, Nohria N and Tierney, T (1999) What’s Your Strategy for Managing Knowledge? Harvard Business Review, 77(2):106–116, 1999.
Hariharan, A. (2005) Knowledge management at bharti tele-ventures - a case study. Journal of Knowledge Management Practice, 6.
Harvey, L. (1995) Editorial: The quality agenda, Quality in Higher Education, 1(1), pp. 5–12
Harvey, L. and Green, D. (1993) Defining quality, Assessment and Evaluation in Higher
Hatch, J. A. (2002). Doing Qualitative Research in Education Settings. Albany, New York: State University of New York Press.
Hayler, R., and Nichols, D. Michael (2007), Six Sigma for financial services: How leading companies are driving results with lean, Six Sigma and process management, McGraw Hill, USA
Hesse-Biber, S. N., and Leavy, P. (2006) The practice of qualitative research. Thousand Oaks, CA: Sage.
Hislop D (2005) Knowledge Management in Organisations. Oxford University Press, Oxford.
HM Government (2013). Construction 2025. Industrial Strategy - government and industry in partnership. HM Government. London.

319
Hofstede, G. J. (1993) Cultural constraints in management theories. In Wren, J. T. (Ed.), The leader’s companion (pp. 253–270). New York: Free Press. Holloway.
Holsapple, C. W., and Joshi, K. D. (2000) An investigation of factors that influence the management of knowledge in organizations. Journal of Strategic Information Systems, Vol. 9 Nos 2/3, pp. 235-61.
Holthouse, D. (1999) Ten Knowledge Domains: Model of a Knowledge Driven Company? Knowledge and Process Management Vol. 6 No. 1 pp3-8.
Hoppe, A., Seising, R., Nurnberger, A. and Wenzel, C. (2011). Wisdom – the blurry top of human cognition in the DIKW-model? http://www.atlantis-press.com/php/download_paper.php?id=2276.
Huberman, M., and Miles, M.B. (2002) (Eds.) (2002). The Qualitative Researcher's Companion. Thousand Oaks: Sage
Hwang, B. (2009), Identifying key sources of rework affecting construction cost performance. Proceedings of RICS COBRA Research Conference, Cape Town. pp 138-149.
Hwang, B., Thomas, S., Haas, C., and Caldas, C. (2009). Measuring the Impact of Rework on Construction Cost Performance. J. Constr. Eng. Manage., 135(3), 187–198.
Ibrahim, C. C., Costello, S. B., and Wilkinson, S. (2015). Key indicators influencing the management of team integration in construction projects. International Journal of Managing Projects In Business, 8(2), 300-323.
Ichijo, K., Ikujiro N. (2006) Knowledge Creation and Management: New Challenges for Managers. Oxford University Press.
Ingirige B., Sexton m., and Betts M., (2002), The Suitability of IT as a Tool to Facilitate Knowledge Sharing in Construction Alliances, International Council for Research and Innovation in Building and Construction, CIB w78 conference 2002, pp. 1-8, Aarhus School of Architecture, 12-14 June 2002
ISO (2005) ISO 9000: Quality management systems – fundamentals and vocabulary. International Organization for Standardization, Geneva, Switzerland.
ISO 9000 (2005) Quality management systems -fundamentals and vocabulary. European Committee for Standardisation. Brussels.
ISO 9000:2005. Quality management systems - Fundamentals and vocabulary, European Committee for Standardisation. Brussels.
Israel, M., & Hay, I. (2006). Research Ethics for Social Scientists. New York: Sage Publications.
Jackson, B. J. (2004). Construction Management JumpStart, Alameda, CA, USA, Sybex.
Jafari, A., and Love, P. D. (2013). Quality Costs in Construction: Case of Qom Monorail Project in Iran. Journal Of Construction Engineering and Management, 139(9), 1244-1249.
Jafari, A., and Rodchua, S. (2014). Survey research on quality costs and problems in the construction environment. Total Quality Management and Business Excellence, 25(3/4), 222-234.
Jain, A. K., and Moreno, A. (2015). Organizational learning, knowledge management practices and firm's performance. Learning Organization, 22(1), 14-39.
Jankowicz, A.D. (2005). Business Research Projects. London: International Thomson Business Press 4
th edition.
Jashapara, A. (2003) Knowledge Management: An Integrated Approach. Essex: Pearson
Education.
Jashapara, A. (2011) Knowledge Management: An Integrated Approach. (2nd ed). Pearson Education. Essex UK.

320
Jayaram, J., and Pathak, S. (2013). A holistic view of knowledge integration in collaborative supply chains. International Journal of Production Research, 51(7), 1958-1972
Jennex, M. E. and Olfman, L. (2004). Modeling Knowledge Management Success. Conference on Information Science and Technology Management, CISTM.
Johnstone, J. (2015). Agile Quality. Quality Progress, 48(7), 63.
Jones, R. and Noble, G. (2007), Grounded theory and management research: a lack of integrity? Qualitative Research in Organizations and Management, Vol. 2, No. 2, pp. 84-96.
Jones, R. and Noble, G. (2007), Grounded theory and management research: a lack of integrity? Qualitative Research in Organizations and Management, Vol. 2, No. 2, pp. 84-96.
Josephson PE and Hammarlund Y (1999) The causes and costs of defects in construction, A Study of Seven Building Projects. Automation in Construction 8(6): 681-642.
Juran JM and Godfrey AB (1999) Juran's Quality Handbook (5th Edition). New York, NY, USA:
McGraw-Hill Professional Publishing.
Juran, J. M. (1989) Juran on Leadership for Quality (New York: The Free Press).
Juran, J. M. and Godfrey, A. B. (1998) Quality in Japan. Blacklick, OH, USA: McGraw-Hill Professional Publishing.
Juran, J. M. and Godfrey, A. B. (1999) Juran's Quality Handbook (5th Edition). New York, NY, USA: McGraw-Hill Professional Publishing.
Juran, J.M. (1951), Quality Control Handbook, 3rd edition, McGraw Hill, New York, NY, USA
Kamara J M, Augenbroe G, Anumba C J and Carrillo P M (2002) Knowledge Management in the Architecture, Engineering and Construction Industry, Construction Innovation 2: 53–67
Kano N (1984) Attractive quality and must be quality. The Journal of the Japanese Society for Quality Control 14(2): 147-156.
Kano, N., (1984) Attractive quality and must be quality, Hinshitsu, The Journal of the Japanese Society for Quality Control. 14 (2) pp 147-156.
Kano, Noriaki (ed.) (1996). Guide to TQM in Service Industries. Tokyo: Asian Productivity Organization.
Kaplan, B. and Maxwell, J. A., (1994). Qualitative research methods for evaluating computer information systems. In Evaluating Health Care Information Systems: Methods and Applications, Anderson, J. G., Aydin, C. E., and Jay, S. J. (eds), CA: Sage, p.45-68.
Karnøe, P., 1993. Approaches to innovation in modern wind energy technology: technology policies, science, engineers and craft traditions. Center for Economic Policy Research Publication 334.
Kemmis, S. and McTaggart, R. (2000) Participatory action research. In Denzin, N. K., and Lincoln, Y. S. (eds) Handbook of Qualitative Research (2nd ed.). Sage, CA, pp. 567–605.
Kemp, S. (2005) Quality Management Demystified. Blacklick, OH, USA: McGraw-Hill
Professional Publishing.
Kluge, J., Stein, W. & Licht, T. (2001) Knowledge Unplugged, Palgrave, Basingstoke, Hampshire.
Knight, A. and Ruddock, L. (2008) Advanced Research Methods in the Built Environment,
Blackwell Publications, West Sussex.
Knowledge Management Research and Practice (2008) Operational Research Society Ltd. All rights reserved 1477–8238/08

321
Koskela L., and Vrijhoef, R. (2001). Is the current theory of construction a hindrance to innovation? Building Research and Information, 29(3)197-207
Koskela, L. (2000) An exploration towards a production theory and its application to construction, VTT Publications 408, VTT, Espoo, Building Technology.
Koskela, L., Bølviken, T. and Rooke, J. (2013). Which Are the Wastes of Construction? In: 21st Annual Conference of the Internatiional Group for Lean Construction, 31st July-2nd August 2013, Fortazela, Brazil , pp. 3-12.
KPMG Management consulting (1999) Knowledge Management: Research Report 2000,
London: KPMG web site.
Kransdorff, A., (1999), Applying Experiential Learning to Work. Knowledge Management
Review, 1(9),pp 12-15
Krippendorff, K. (2004), Content Analysis: An Introduction to Its Methodology. 2nd edition,
Thousand Oaks, CA
Kululanga G K, McCaffer R, Price A D F and Edum-Fotwe F (1999) Learning Mechanisms Employed by Construction Contractor, Journal of Construction Engineering and Management,
15 (4), pp 215-223.
Kvale, Steiner. (2007). Doing interviews. Thousand Oaks: Sage.
Lal, H. (2008) Organizational Excellence Through Total Quality Management. Daryaganj, Delhi,
IND: New Age International.
Lam, A. (2000) Tacit Knowledge, Organizational Learning and Societal Institutions: An Integrated Framework. Organization Studies, Vol. 21, No. 3
Latham, Sir Michael (1994), Constructing the Team: Joint Review of Procurement and Contractual Arrangements in the United Kingdom Construction Industry. London: HMSO.
Laudan, L. (1984) Science and Values. University of California Press.
LeCompte, M. D., and Schensul, J. J. (1999). Analyzing and interpreting ethnographic data. Walnut Creek, CA: AltaMira Press.
Lefika, P. T., and Mearns, M. A. (2015). Adding knowledge cafés to the repertoire of knowledge sharing techniques. International Journal of Information Management, 35(1), 26-32.
Lemken, B., Kahler, H., and Rittenbruch, M. (2000) Sustained knowledge management by organizational culture. In: Proceedings of the 33rd Hawaii International Conference on System Sciences, 2000, 64.
Leybourne, S., and Kennedy, M. (2015). Learning to Improvise, or Improvising to Learn: Knowledge Generation and 'Innovative Practice' in Project Environments. Knowledge and Process Management, 22(1), 1-10.
Liebowitz J (2009) Knowledge Retention: Strategies and Solutions. CRC Press. Boca Raton.
FL.
Liebowitz, J. (1999) Knowledge management handbook. CRC Press, Boca Raton, FL.
Liebowitz, J. (2000). Building organizational intelligence: A knowledge management primer.
Washington, D.C: CRC Press.
Liebowitz, J. (2002) A look at NASA Goddard Space Flight Centres knowledge management initiatives. Computing Trends/IEEE Software. 19(3), p. 40.
Liehr P., and Smith, M. J. (1999) Middle range theory: Spinning research and practice to create knowledge for the new millennium, Advances in Nursing Science 21(4):81-91.
Lincoln, Y. S., and Guba, E. G. (1985). Naturalistic inquiry. Beverly Hills, CA: Sage.
322
Liu, S., Leat, M., Moizer, J., Megicks, P., and Kasturiratne, D. (2013). A decision-focused knowledge management framework to support collaborative decision making for lean supply chain management. International Journal of Production Research, 51(7), 2123-2137.
Lofland, J., Snow, D. A., Anderson, L., and Lofland, L. H. (2006). Analyzing social settings: a guide to qualitative observation and analysis (4th ed.) p. 304. Wadsworth, Inc.
Loosemore M, Dainty, A.R.J and Lingard, H (2003) Human Resource Management in Construction Projects, Strategic and Operational Approaches, Spon Press, London
Love P (2002) Influence of project type and procurement method on rework costs in building construction projects. Journal of Construction Engineering and Management 128(1):18-29.
Love PD, Edwards DJ, Watson H and Davis P (2010). Rework in civil infrastructure projects: determination of cost predictors. Journal of Construction Engineering & Management 136(3):
275-282.
Love PED and Edwards D (2005) Calculating total rework costs in Australian construction projects. Civ. Eng. Environ. Syst. 22(1): 11– 27.
Love PED and Li H (2000) Quantifying the causes and costs of rework in construction. Construction Management and Economics 18: 479-490.
Love PED, Mandal P and Li H. (1999) Determining the causal structure of rework influences in construction. Construction Management and Economics 17(4): 505 – 517.
Love PED, Zahir F and David JE (2004) A rework reduction model for construction projects. IEEE Transactions on Engineering Management 51(4): 426-440 Mechanical Engineers Press,
New York, NY.
Love, P E D and Edwards D J (2004), Determinants of Rework in Building Construction Projects, Engineering, Construction and Architectural Management, 11(4), pp. 259-274.
Love, P. (2002), Influence of project type and procurement method on rework costs in building construction projects, Journal of Construction Engineering and Management, 128 (1), pp. 18-29.
Love, P.E.D., Gunasekaran A., and Li, H. (1998). Concurrent engineering: A strategy for procuring construction projects. International Journal of Project Management, 16 (6), 375-383.
Lubit, R. (2001) Tacit Knowledge and Knowledge Management: The Key to Sustainable Competitive Advantage, Organisational Dynamics, Vol. 29, No. 4
Lytras, M., Pouloudi, A., and Poulymenakou, A. (2002), Knowledge management convergence: expanding learning frontiers. Journal of Knowledge Management, Vol. 6 No. 1, pp. 40-51.
Malone, T.W., Crowston, K., Herman, G.A. (2003) (eds.). Organizing Business Knowledge: The MIT Process Handbook. MIT Press.
Man, A. D., and Luvison, D. (2014). Sense-making's role in creating alliance supportive organizational cultures. Management Decision, 52(3), 259-277.
Mandal, A., and Deshmukh, S. (1994) Vendor selection using interpretive structural modeling (ism). International Journal of Operations and Production Management. 14(6): 52–59.
Marshall MN (1996) Sampling for qualitative research. Family Practice 13: 522 – 525.
Marshall, C., and Rossman, G. B. (2006). Designing Qualitative Research (4 th ed.). Thousand Oaks, CA: Sage.
Mason D and Pauleen DJ (2003) Perception of Knowledge Management: a Qualitative Analysis, Journal of knowledge management, vol 7, no. 4, pp 38-74.
Maxwell, J. (2013). Qualitative Research Design An Interactive Approach (3rd ed.) p. 232. Thousand Oaks, CA: SAGE Publications.

323
Mcadam R., and Reid R., (2001), SME and Large Organisation Perceptions Of Knowledge Management: Comparisons And Contrasts, Journal of Knowledge Management, Vol. 5(3), 99.
pp 231-241
McCampbell A S, Clare L M and Gitters S H (1999) Knowledge Management: The New Challenge for the 21st Century, Journal of Knowledge Management, Volume 3. Number 3, pp.
172-179.
McElroy, B. and Mills, C. (2000) Managing stakeholders, in Turner, R.J. and Sinister, S.J. (eds) Gower Handbook of Project Management, 3rd edn, Gower Publishing Limited, Aldershot, pp. 757–75.
Mentzas G, Apostolou D, Young R and Abecker A (2001) Knowledge Networking: A Holistic Solution for Leveraging Corporate Knowledge, Journal of Knowledge Management, Volume 5. Number 1. pp. 94-106.
Mertens, D. A. (2010). Research and evaluation in education and psychology (3rd ed.). Thousand Oaks, CA: Sage.
Mertens, D. M. and Ginsberg, P. (Eds.) (2009). Handbook of Social Research Ethics. Thousand Oaks, CA: Sage.
Mertens, D. M., Bledsoe, K., Sullivan, M., and Wilson, A. (2010). Utilization of mixed methods for transformative purposes. In C. Teddlie and A. Tashakkori (Eds.), Handbook of Mixed Methods Research. 2nd ed. Thousand Oaks, CA: Sage.
Metaxiotis, K. and Psarras, J. (2003) Applying Knowledge Management in Higher Education: The Creation of a Learning Organisation. Journal of Information & Knowledge Management, Vol. 2, No. 4, pp.353-359.
Miles, M. B., and Huberman, A. M. (1994). Qualitative Data Analysis (2nd edition). Thousand Oaks, CA: Sage Publications.
Miles, M. B., and Huberman, M. A. (1994): Qualitative Data Analysis: An Expanded Sourcebook (2nd edition). Beverley Hills, Sage.
Miles, M. B., Huberman, A. M., and Saldaña, J. (2014). Qualitative Data Analysis: A Methods Sourcebook (3rd ed.) p. 408. Thousand Oaks, CA: SAGE Publications.
Mitchell, M., and Jolley, J. (2001) Research design explained (4th edition). USA: Harcourt
College Publishers.
Mitchell, R. K., Bradley, R. A., and Wood, D.J. (1997) Toward a theory of stakeholder identification and salience: defining the principle of who and what really counts. Academy of Management Review, 22(4), 853–85.
Modarress, B. and Ansari, A., (1985) Two Mew Dimensions in the Cost of Quality. International Journal of Quality and Reliability Management. 4, pp. 9-20.
Moffett S, McAdam R and Parkinson S. (2003) An Empirical Analysis of Knowledge Management Applications, Journal of Knowledge Management, 7(3), pp. 6 – 26.
Mohd Zin, I. N., and Egbu, C. O. (2010) A review of knowledge management strategies – Issues, contexts and benefits for the construction industry , in: CIB World Congress, 10-13 May 2010, The Lowry, Salford Quays, United Kingdom.
Mohd Zin, I.N. and Egbu, C.O. (2010) A Review of Knowledge Management Strategies – Issues, Contexts and Benefits for the Construction Industry. CIB
Morris, P.W.G., (2004), The validity of knowledge in project management and the challenge of learning and competency development, In The Wiley Guide to Managing Projects, edited by
Morris, P.W.G. and Pinto, J.K. New York: John Wiley & Sons, 1137-1149.

324
Morse JM. (2003). Principles of mixed methods and multi-method research design. In A. Tashakkori & C. Teddlie (Eds.), Handbook of Mixed Methods in Social and Behavioural
Research (pp. 189-208). Thousand Oaks, CA: Sage.
Mousavizadeh, M., Harden, G., Ryan, S., and Windsor, J. (2015). Knowledge management and the creation of business value. Journal of Computer Information Systems, 55(4), 35-45.
Moustakas, C. (1994) Phenomenological Research Methods. Thousand Oaks, CA: Sage.
Nabipoor Afruzi, E., Najafi, A. A., Roghanian, E., and Mazinani, M. (2014). A Multi-Objective Imperialist Competitive Algorithm for solving discrete time, cost and quality trade-off problems with mode-identity and resource-constrained situations. Computers and Operations Research, 5080-96.
Nachmias, F. C., and Nachmias, D. (1996) Research Methods in the Social Sciences, 5th edition. New York: St. Martin's Press.
Naoum, S. G. (2007) Dissertation research and writing for construction students. 2nd ed. Oxford: Butterworth-Heinemann.
Nasim, K., Iqbal, M. Z., and Khan, I. A. (2014). Antecedents of TQM implementation capability: a review with a conceptual model. Total Quality Management and Business Excellence, 25(11/12), 1395-1409.
Nesbary, D. K. (2000). Survey Research and the World Wide Web. Massachusetts: Allyn and Bacon Press.
Neuman, W. L. (2006). Social Research Methods: Qualitative and Quantiative Approaches. Toronto: Pearson.
Neuman, W. L. (2009) Understanding Research. Boston: Allyn and Bacon.
Newcombe, R. (2003) From client to project stakeholders: a stakeholder mapping approach, Construction Management & Economics, 21, 8, pp. 841-848.
Newell, S., Robertson, M., Scarbrough, H., et al. (2009). Managing Knowledge Work and Innovation. Palgrave MacMillan (Basingstoke)
Newman, I., and Benz, C. R. (1998). Qualitative-quantitative research methodology: Exploring the interactive continuum. Carbondale, Illinois: Southern Illinois University Press.
Nitzan, S., Procaccia, U., and Tzur, J. (2015). Rising and changing professional knowledge barriers to entry. Journal of Theoretical Accounting Research, 10(2), 25-42.
Nonaka I and Takeuchi H (1995) The Knowledge Creating Company: How Japanese Companies Create The Dynamics Of Innovation. Oxford University Press: New York.
Nonaka I and Toyama R (2005) The theory of the knowledge-creating firm: subjectivity, objectivity and synthesis. Industrial and Corporate Change 14: 419–436.
Nonaka I, Totama R and Nakata A (2000) A Firm as A Knowledge-Creation Entity: A New Perspective on the Theory of The Firm, Industrial and Corporate Change, 9(1), 1-20.
Nonaka, I. and von Krogh, G. (2009). Tacit Knowledge and Knowledge Conversion: Controversy and Advancement in Organizational Knowledge Creation Theory. Organization Science,20, n.3, May-June, pp.635-652.
Nonaka, I., Toyama, R. and Konno, N. (2000). ‘SECI, Ba, and leadership: A unified model of dynamic knowledge creation’. Long Range Planning, 33, pp 5–34.
Nylén KO (1996) Cost of failure in a major civil engineering project. Licentiate thesis, Div. of Construction Management and Economics, Dept. of Real Estate and Construction Management, Royal Institute of Technology, Stockholm, Sweden.
O’Dell C., Grayson, C.J. (1998) If Only We Know What We Know: the Transfer of Internal Knowledge and Best Practice, California Management Review, vol. 40, No. 3

325
Oduoza, C., and Harris, A. (2011). Knowledge management to support product development in cold roll-forming environment. International Journal Of Advanced Manufacturing Technology, 57(5-8), 585-596.
Offsey, S. (1997) Knowledge Management: Linking People to Knowledge from Bottom Line Results, Journal of Knowledge Management, vol. 1, No. 2.
Olander, S (2007) Stakeholder impact analysis in construction project management.
Construction Management and Economics, 25(3), 277–87.
Olawale, Y., and Sun, M. (2015). Construction project control in the UK: Current practice, existing problems and recommendations for future improvement. International Journal of Project Management, 33(3), 623-637.
Ollila, S., Styhre, A., and Werr, A. (2015). Managing knowledge integration: Balancing professional and managerial logics in an engineering consulting firm. Zeitschrift Für Personalforschung, 29(2), 131-148.
Olomolaiye, A. and Egbu, C. (2005) The Impact of Human Resource Policies and Practices on Knowledge Management in the Construction Industry. In: Khosrowshahi, F. (ed.), 21st Annual ARCOM Conference, School of Oriental and African Studies. Association of Researchers in
Construction Management, Vol. 1, 125-135
Olomolaiye, A. O. (2007) The Impact of Human Resource Management for Performance Improvements in Construction Organisations. PhD Thesis, Glasgow Caledonian University
Oluikpe, P. (2007) Knowledge Management in Development Projects PhD thesis, Loughborough University
Onwuegbuzie, A. J., and Leech, N. L. (2007). Validity and qualitative research: An oxymoron? Quality and Quantity: International Journal of Methodology, 41, 233-249.
Owlia, M. S. and Aspinwall, E. M. (1996). A Framework for the dimensions of quality in higher Education. Quality Assurance in Education. 4(2): 12-20.
Oxford Dictionary of Business and Management (2009) ed. Law, J. Oxford University Press. Referenced online Accessed 8 October 2011
Ozorhon, B. (2013). Analysis of Construction Innovation Process at Project Level. Journal of Management In Engineering, 29(4), 455-463.
Parasuraman, A., Zeithaml, V. A., and Berry, L. L. (1985). A conceptual model of service quality and its implications for future research. Journal of Marketing, 49, 41-50.
Parsons, B. (2015). Delays. Canadian Consulting Engineer, 56(4), 22-29.
Patton, M. Q. (1990). Qualitative research and evaluation methods (2nd ed.). Newbury Park, CA: Sage.
Patton, M. Q. (2002). Qualitative research and evaluation methods (3rd ed.). Thousand Oaks, CA: Sage.
Pearson, M. and Smith, D. (1985) Debriefing in experience-based learning, Reflection: Turning Experience into Learning (Edited by Boud, D., Keogh, R. and Walker, D.), Kogan Page, London,
69-84
Phillips, D. C., and Burbules, N. C. (2000). Postpositivism and educational research. Lanham, MD: Rowman and Littlefield.
Pietrzak, M., Jalosinski, K., Paliszkiewicz, J., and Brzozowski, A. (2015). A case study of study of strategic group map application used as a tool for knowledge management. Journal of Computer Information Systems, 55(2), 68-77.

326
Piorkowski, B. A., Gao, J. X., Evans, R. D., and Martin, N. (2013). A dynamic knowledge management framework for the high value manufacturing industry. International Journal of Production Research, 51(7), 2176-2185.
Pirsig, R. M. (1974) Zen And The Art of Motorcycle Maintenance : An Inquiry Into Values.
London: Bodley Head.
PMI (2004) A Guide to the Project Management Body of Knowledge, PMBOK, 3rd ed. Project Management Institute Inc, Newtown Square, PA.
Polanyi M (1966) The Tacit Dimension. London: Routledge and Kegan Paul.
Poll, R., Boekhorst, P. T. and Mundt, S. (2008) Measuring Quality. Performance Measurement.
Berlin, , DEU: K.G. Saur.
Post, J. E., Preston, L. E., and Sachs, S. (2002) Redefining the Corporation—Stakeholder Management and Organizational Wealth, Stanford University Press, Stanford, CA.
Preece, A. (2001) Better knowledge management through knowledge engineering. IEEE Intell. Systems. 1094–7167, 35–43.
Pugna, I. B. and Boldeanu, D. M. (2014) Factors affecting establishment of an institutional knowledge management culture - a study of organizational vision. Accounting and Management Information Systems, Vol. 13, No. 3, pp. 559-583.
Pyzdek, T. (2003) Six Sigma Handbook. Blacklick, OH, USA: McGraw-Hill Trade.
Pyzdek, T., and Keller, P.A. (2009). The Six Sigma Handbook, Third Edition. New York, NY: McGraw-Hill.
Qiu, J. J., and Lui, S. S. (2014). Knowledge role and subunit characteristics in multiunit firms. Journal of General Management, 40(2), 3-25.
Quality Costs: Ideas and Applications. Volume 2 – A Collection of Papers (Milwaukee: ASQC Quality Press) pp. 346–354.
Quintas, P. (2005) The Nature and Dimensions of Knowledge Management. In: Anumba, C., Egbu, C. and Carrillo, P. (eds.) Knowledge Management in Construction. Oxford: Blackwell
Publishing
Rao Madanmohan (2005), Knowledge management tools and techniques: Practitioners and experts evaluate KM solutions, Butterworth-Heinemann, USA
Ren ZZ, Shen GQ, and Xue XL (2013) Failure caused by inappropriate construction methods: an expensive lesson. Journal Of Management In Engineering 29(1): 25-34.
Renzl, B., Kurt, M., Hinterhuber, H. (2006), (eds.). The Future of Knowledge Management.
Palgrave Macmillan.
Research Methods in Anthropology: Qualitative and Quantitative Approaches (5th ed.) p. 681. Lanham, MD: AltaMira Press.
Ribière, V. M., and Khorramshahgol, R. (2004) Integrating Total Quality Management and Knowledge Management. American University- USA Journal of Management Systems, Vol. XVI, No. 1, 2004, Maximilian Press, Publisher pg 39-54
Richards, L. (2005). Handling Qualitative Data: A Practical Guide. London: Sage Publications
Robertson, S. (2002) A Tale of Two Knowledge-Sharing Systems. Journal of Knowledge Management, 6(3), 295-308.
Robinson, H.S., Carrillo, P.M, Anumba, C.J and Al-Ghassani A.M. (2001) Knowledge Management: Towards an Integrated Strategy for Construction Project Organisations, Proceedings of the Fourth European Project Management (PMI) Conference, London, June 6-7.
327
Robinson, H.S., Carrillo, P.M., Anumba, C.J., and Al-Ghassani, A. (2005) Knowledge Management Practices in Large Construction Organisations
Robson, C. (2011). Real world research: A resource for social-scientists and practitioner- researchers. 3rd edition. Oxford: Blackwell Publishing.
Rodney McAdam R and McCreedy S (1999) A Critical Review of Knowledge Management Models, The Learning Organisation Journal, Vol. 6, No. 3, pp: 91-101.
Romero, E. J. (2014). Want Innovation?. Leadership Excellence, 31(2), 13.
Ronbertson, B., Daniel, B., and Beruvides, M. G. (2015). Keeping knowledge is power. Industrial Management, 57(1), 22-25.
Rose, K. H. (2005) Project Quality Management : Why, What and How. Boca Raton, FL, USA:
J. Ross Publishing, Incorporated.
Rosenfeld Y (2009) Cost of quality versus cost of non-quality in construction: the crucial balance. Construction Management & Economics 27(2): 107-117.
Rossman, G. B., and Wilson, B. L. (1985). Numbers and words: Combing quantitative and qualitative methods in a single large-scale evaluation study. Evaluation Review, 9, 627–643.
Ruan X, Ochieng EG, Price AF, and Egbu CO (2012) Knowledge integration process in construction projects: a social network analysis approach to compare competitive and collaborative working. Construction Management & Economics 30(1): 5-19.
Rubinoff, R.A., Shen, D., Timko, M., and Walden, D. (1993) Kano’s method for understanding customer defined quality, Center for Quality of Management Journal Vol 2 No 4 pp 3e35
Ruggles R (1998) The State of the Notion: Knowledge Management in Practice, California Management Review, Vol. 40 No.3, pp.80-9.
Ruggles, R. (1997), Knowledge Tools: using technology to manage knowledge better, Working paper for Ernst and Young, Techniques & Technologies for KM- WP 3 Interim Report
Knowledge Management for Sustainable Construction Competitiveness 20.
Rumizen, M. C. (2002) The complete idiots guide to knowledge management. CWL Publishing Enterprises for Penguin Group.
Ruparathna, R., and Hewage, K. (2015). Review of Contemporary Construction Procurement Practices. Journal of Management In Engineering, 31(3), 1-11.
Russell, B. (1948). Human Knowledge: Its Scope and Limits. London: George Allen and Unwin.
Ryan S D & Prybutok V R (2001) Factors Affecting Knowledge Management Technologies: A Discriminative Approach, Journal of Computer Information Systems, 41(3), pp. 31 – 37.
Sampson, H. (2004) Navigating the waves: the usefulness of a pilot in qualitative research. Qualitative Research. Volume 4, pp.383-402.
Satyadas, A., and Cassaigne, N. P. (2001) Knowledge management tutorial: an editorial overview. IEEE Trans. Systems, Man, and Cybernetics – Part C: Applic. Rev. 31(4), 429–438.
Scarborough, H. (1996) Business process re-design: the knowledge dimension. http://bprc.warwick.ac.uk/rc-rep-8.1, November.
Scarborough, P. H. (2005) Limits of (some) knowledge management. The Strategic Knowledge Management Forum, London, Osney Media.
Scarbrough H, Swan J and Preston J (1999) Knowledge Management: A Literature Review.
London: Institute of Personnel and Development
Scheuren, F., (2004). What is a Survey? American Statistical Association. www.amstat.org/sections/srms/

328
Schwartz, S. H. (2006) Value orientations: Measurement, antecedents and consequences across nations. In R. Jowell, C. Roberts, R. Fitzgerald, and G. Eva (Eds.) Measuring attitudes cross-nationally – lessons from the European Social Survey. London: Sage.
Seale, C. (1999). Quality in qualitative research. Qualitative Inquiry, 5(4), 465-478.
Senge, P. M. (2006) The Fifth Discipline: The Art and Practice of the Learning Organization, revised. Currency.
Shan, S., Zhao, Q., and Hua, F. (2013). Impact of quality management practices on the knowledge creation process: The Chinese aviation firm perspective. Computers & Industrial Engineering, 64(1), 211-223.
Shapiro, G. (1999) Inter-project knowledge capture and transfer: an overview of definitions tools and practices. CoPS Innovation Centre Working paper no. 62, Brighton.
Shariq S.Z., (1999), How Does Knowledge Transform As It Is Transferred? Speculations On The Possibility Of A Cognitive Theory Of Knowledgescapes, Journal Of Knowledge
Management, MCB University Press.
Sharkie, R. (2003). Knowledge creation and its place in the development of sustainable competitive advantage. Journal of Knowledge Management, 7(1), pp. 20-31.
Sharma, B. P., Singh, M. D., and Neha. (2012). Knowledge Sharing Barriers: An Approach of Interpretive Structural Modeling. IUP Journal of Knowledge Management, 10(3), 35-52.
Sheehan, T., Poole, D., Lyttle, I. and Egbu, C. (2005) Strategies and Business Case for Knowledge Management. In: Anumba, C., Egbu, C. and Carrillo, P. (eds.) Knowledge Management in Construction. Oxford: Blackwell Publishing
Siemens, George (2006), Knowing Knowledge, Lulu Publishing
Silverman, D. (2008) Doing Qualitative Research – A Practical Handbook. Sage Publications, London, UK.
Singh, M., and Kant, R. (2007) Knowledge management as competitive edge for indian engineering industries. in: Proc. of the International Conference on Quality and Reliability, Chiang Mai, Thailand. 398–403. 5-7 November , pp.398-403.
Singh, M., Narain, R., and Kant, R. (2007) Critical factors for successful implementation of knowledge management: An interpretive structural modeling approach. In: Proc. of International conf. on Innovation and Knowledge Management of Social and Economic Issues: International Perspective, J.N.U., New Delhi, India. January 9-12.
Skryme D and Amidon D (1997) Creating the Knowledge-Based Business, Business
Intelligence, London.
Skyrme D. J. (2000) Developing a Knowledge Strategy: From Management to Leadership. In Knowledge Management Classic and Contemporary Works. Boston, MIT Press.
Skyrme, D. (2011), A Knowledge-Enriching Culture, [Online], Available at http://www.skyrme.com/kmroadmap/culture.htm
Skyrme, D. J. (2002), Knowledge Management-- Approaches and Policies, available at http://www.skyrme.com/pubs/deeds_km.doc
Smyth H (2010) Construction industry performance improvement programmes: the UK case of demonstration projects in the ‘continuous improvement' programme. Construction Management & Economics 28(3): 255-270.
Soliman F and Spooner K (2000), Strategies for Implementing Knowledge Management: Role of Human Resources Management, Journal of Knowledge Management, 4(4), 337-345.
Sörqvist, L. (1998) Poor Quality Costing, Doctoral thesis No. 23, Royal Institute of Technology, Dept of Materials Processing Production Engineering, Stockholm.

329
Stake, R. E. (1995). The art of case study research. Thousand Oaks, CA: SAGE Publications.
Stenbacka, C. (2001). Qualitative research requires quality concepts of its own. Management Decision, 39(7), 551-555
Stephenson, A. R. (1989) Quality costs and profits – myth or reality?, In Campanella, J. (Ed.)
Sternberg R, J. (1990) Metaphors of mind Conception of the nature of intelligence. New York: Cambridge University Press.
Sternberg, R. J., and Horvath, J. A. (Eds.) (1999). Tacit knowledge in professional practice. Mahwah, NJ: Lawrence Erlbaum Associates.
Stewart, T. A. (1997) Intellectual Capital: The New Wealth of Organizations. Currency/Doubleday.
Stoddart L (2001) Managing Intranets to Encourage Knowledge Sharing: Opportunities and Constraints. Online Information Review, vol. 25, no.1, pp. 19-28.
Storey, J., and Quintas, P. (2001) Knowledge Management and HRM. In Storey, J (Ed) Human Resource Management: A Critical Text. London: Thomson Learning.
Studer, R., Fensel, D., and Staab, S. (2000) Situation and perspective of knowledge engineering. Knowledge Engineering and Agent Technology, IOS Press.
Styhre, A. (2009) Tacit knowledge in rock construction work: a study and a critique of the use of the term Construction Management and Economics 27, 995–1003
Sue, V. M., and Ritter, L. A. (2007). Conducting online surveys. Los Angeles: Sage Publications.
Sunindijo, R. Y. (2015). Project manager skills for improving project performance. International Journal of Business Performance Management, 16(1), 67-83.
Suresh S, Gameson R, and Chinyio E (2008) The Role of Knowledge Management in Reducing the Cost of Poor Quality in the Construction Industry. Proceedings of Cobra 2007, RICS Foundation, 4-5 September, Dublin Institute of Technology.
Suresh, S. (2006) Knowledge Capture in Small and Medium Enterprises in the UK Construction Industry. PhD Thesis Glasgow Caledonian University.
Sveiby, K. (2001) What is knowledge management. Available from www.sveiby.com/articles/knowledgemanagement. Html
Sveiby, K. E. (2002). Methods for measuring intangible assets. [Online]. Available WWW: http://www.sveiby.com (Accessed 25 November 2011)
Swan, J., Newell, S., and Robertson, M. (2000) Limits of IT-driven knowledge management for interactive innovation processes: towards a community-based approach. Proceedings of the 33rd Hawaii International Conference on System Sciences,.
Swart, J., Kinnie, N., Rossenberg, Y., and Yalabik, Z. Y. (2014). Why should I share my knowledge? A multiple foci of commitment perspective. Human Resource Management Journal, 24(3), 269-289.
T. Devenport, S. Volpel (2001). The rise of knowledge towards attention management. Journal of Knowledge Management, 5(3): 212–221.
Taguchi, G. (1993) Taguchi on Robust Technology Development, The American Society of Mechanical Engineers Press, New York, NY.
Taguchi, G., Chowdhury, S., and Wu, Y. (2005). Taguchi's Quality Engineering Handbook. John Wiley.
Tashakkori, A. and C. Teddlie (2010) Sage Handbook of Mixed Methods in Social and Behavioral Research. Thousand Oaks, CA, Sage Publications.

330
Teddlie, C., and Tashakkori, A. (2009). Foundations of mixed methods research: Integrating quantitative and qualitative approaches in the social and behavioral sciences. Thousand Oaks, CA: Sage.
Tedmori, S. (2008) Exploiting Email: Extracting Knowledge to Support Knowledge Sharing. PhD Thesis, Loughborough University
Ten Have, S., Have, W., Stevens, F., and Elst, M. (2003) Key management models. Pearson Education Limited, London.
Thomas, J.C., (2001), Story-Based Mechanisms of Tacit Knowledge Transfer, ECSCW 2001,
Seventh European Conference on Computer Supported Cooperative Work, Bonn, Germany
Thomas, R., Marosszeky, M., Karim, K., Davis, S. and McGeorge, D. (2002), The importance of project cultures in achieving quality outcomes in construction, in Formoso, C.T. and Ballard, G.(Eds), Proceedings of 10th Conference of the International Group for Lean Construction, Federal
Tiwana, A. (2002) The Knowledge Management toolkit, Second Edition Prentice Hall, Canada.
Tiwari, S. R. (2015). Knowledge Integration in Government-Industry Project Network. Knowledge and Process Management, 22(1), 11-21.
Toakley, A.R. and M. Marosszeky, (2003), Towards total project quality – a review of research needs. Engineering, Construction and Architectural Management, 10 (3), pp.219-228.
Todorović, M. L., Petrović, D. Č., Mihić, M. M., Obradović, V. L., and Bushuyev, S. D. (2015). Project success analysis framework: A knowledge-based approach in project management. International Journal of Project Management, 33(4), 772-783.
Tsoukas, H. (1996) The firm as a distributed knowledge system: A constructionist approach. Strategic Management Journal 17 (Special Winter Issue), 11–25.
Tubigi, M., and Alshawi, S. (2015). The impact of knowledge management processes on organisational performance. Journal of Enterprise Information Management, 28(2), 167-185.
UK Industry Performance Report (2014) Based on the UK Construction Industry Key Performance Indicators. Department for Business innovation and Skills. London.
Urbancová, H., and Vnoučková, L. (2015). Application of talent and knowledge management in the Czech and Slovak Republics: First empirical approaches. Ekonomski Anali / Economic Annals. 60(205)
Van den Brink, P. (2003) Social, Organizational and Technological Conditions that Enable Knowledge Sharing. Ph.D thesis, University of Amsterdam, Holland, 2003.
Van Der Wiele, T. and Van Iwaarden, J. (2006) Innovative Quality Management Cases.
Bradford, GBR: Emerald Group Publishing Ltd.
Van Teijlingen, E.R, and Hundley, V. (2001) The importance of pilot studies. Social Research Update, Department of Sociology, University of Surrey.
Velden M V D (2002) Knowledge Facts, Knowledge Fictions: The Role of ICTs in Knowledge Management for Development, Journal of International Development, 14, 25-37.
Viitala, R. (2004) Towards Knowledge Leadership. Leadership and Organization Development Journal, (25:6).528-544.
Virtanen, T. (2000) Kyselytutkimus laatukustannuslaskennan nykytilasta Suomessa [A survey on the cost of poor quality practices in Finland]. Unpublished M.Sc. Thesis, Helsinki School of Economics and Business Administration. A Collaborative Approach for Managing Project Cost of Poor Quality 317
Von Krogh, G., Ichijo, K., and Nonaka, I. (2000). Enabling Knowledge Creation. How to Unlock the Mystery of Tacit Knowledge and Release the Power of Innovation. Oxford University Press, New York.
331
Wacker, J. (1998). A definition of theory: Research guidelines for different theory-building research methods in operations management. Journal of Operations Management, 16 (4), 361 385.doi:10.1016/S0272-6963(98)00019-9
Walker, D. and Wilson, A. (2004) The Knowledge Advantage Concept, Proceedings of the Twentieth Annual Conference, Association of Researchers in Construction Management, Heriot
Watt University, pp. 767-775.
Weaven, S., Grace, D., Dant, R., and Brown, J. R. (2014). Value creation through knowledge management in franchising: a multi-level conceptual framework. Journal of Services Marketing, 28(2), 97-104.
Webb, S.P., (1998). Knowledge Management: Linchpin of Change. The Association for Information Management (ASLIB), London.
Weber, R. P. (1990). Basic Content Analysis (2nd ed.). Newbury Park, CA: Sage. p. 12.
Weiss, R. S. (1995). Learning from Strangers: The Art and Method of Qualitative Interview Studies (p. 256). New York, NY: Free Press.
Wen-bao, L. (2007). The Effect of Knowledge Sharing Model Expert System with Application, l34 (2). 508- 1521.
Wenger, E., McDermott, R., Snyder, W.M. (2002) Cultivating Communities of Practice. Harvard
Business School Press.
Wensley, A.K.P. and Verwijk-O’Sullivan. (2000), Tools for Knowledge Management, Joseph L. Rotman School of Management, University of Toronto, Ontario. <http://www.icasit.org/km/toolsforkm.htm> [20/09/11].
Werr, A., and Stjernberg, T. (2003) Exploring management consulting firms as knowledge systems. Organization Studies, 24(6): 881–908.
Wiig, K. (1995) Knowledge management foundations-thinking about thinking-how people and organizations create, represent, and use knowledge. Schema Press Arlington, Texas.
Wiig, K. M. (1997) Knowledge Management: an introduction and perspective. Journal of Knowledge Management, vol. 1, no. 1, pp. 6-14.
Wiig, K., (1999). What future knowledge management users may expect. Journal of Knowledge Management, 3(2), pp. 155-165.
Wilson, S. (2001). What is Indigenous research methodology? Canadian Journal of Native Education, 25(1), 175-179.
Winter, G. (2000). A comparative discussion of the notion of validity in qualitative and quantitative research. The Qualitative Report, 4(3&4)
Witt, R. (1999) Making sense of portal pandemonium. KM Magazine, 37–53.
Wolcott, H.F. (2009) Writing Up Qualitative Research. 3rd Edition. Sage Publications, California, USA.
Wolstenhome, A. (2009) Never Waste a Good Crisis A Review of Progress since Rethinking Construction and Thoughts for Our Future Constructing Excellence | Published October 2009 [accessed September 2012] www.constructingexcellence.org.uk http://www.constructingexcellence.org.uk/pdf/Wolstenholme_Report_Oct_2009.pdf
Wong, K. Y. (2005) Critical success factors for implementing knowledge management in small and medium enterprises. In Introduction to Knowledge Management. Bradford, GBR: Emerald
Group Publishing Ltd.
Yang, C. (2008) Improving the definition and quantification of quality costs, Total Quality Management and Business Excellence, 19, 3, pp. 175-191.
332
Yates, J. S. (2004). Doing Social Science Research. London, Sage Publications in association with the Open University Press.
Yin, R. K. (2009) Case Study Research. Design and Methods Sage Publications, Thousand Oaks, 4th ed., pp. 240.
Yin, R. K. (2012). Applications of Case Study Research (3rd ed.) p. 264. Thousand Oaks, CA: SAGE Publications.
Yin, R. K. (2014). Case study research: Design and methods (5th ed). p. 312. Thousand Oaks, CA: SAGE Publications.
Yongjian, K., Ling, F. Y., and Zou, P. W. (2015). Effects of Contract Strategy on Interpersonal Relations and Project Outcomes of Public-Sector Construction Contracts in Australia. Journal of Management In Engineering, 31(4), 1-10.
Zarzu, C., and Scarlat, C. (2015). Knowledge Management for Knowledge Development: Lessons Learnt While Implementing International Projects by Multicultural Teams. International Journal of Management Cases, 17(4), 221-231.
Zin, I. N. M., and Egbu, C. (2011) The significance of knowledge sharing approaches in Malaysian construction organisations. In: Egbu, C and Lou, E C W (Eds.), Proceedings 27th Annual ARCOM Conference, Bristol, UK. Association of Researchers in Construction
Management, 525–34.
Zins, C. (2007). Conceptual approaches for defining data, information, and knowledge. Journal of the American Society for Information Science and Technology, 58(4), 479–493.
Zolingen, S. J. V., Streumer, J. N., Stooker, M. (2001) Problems in Knowledge Management: A Case Study of a Knowledge Intensive Company. International Journal of Training and Development. 5(3), pp. 168–184Bernard, H. R. (2011).

333
APPENDICES
Appendix 1: Invitation to participate in a research interview
Invitation to participate in a research interview
Date: ……..……………
Dear …………………………………………………
I am currently carrying out research at the University of Wolverhampton on ‘the Impact of
Knowledge Management in Reducing the Cost of Poor Quality in Construction’ under the
supervision of Dr Subashini Suresh and Dr Ezekiel Chinyio.
I would like to invite you to participate in a semi-structured interview relating to the above
research based on your years of experience in the industry. The purpose of the interview is to
investigate the causes of quality issues in construction and to investigate the impact of
knowledge management on these issues. The interview will last for at least 1 hour. Please note
that your responses will be treated as highly confidential and transcripts will not contain
references to any persons (including yourself) or organisations. Further details about the
research and interview are contained in the Information Sheet attached.
Should you be willing to participate, please fill in the attached Consent Form and I will collect it
from you on the day of the interview. Please email me your available dates. The summary of
results will be available at the conclusion of the academic year. Should you wish to obtain a
copy these, please let me know. Thank you very much for your consideration of this invitation.
Your participation is highly valued as it will contribute to quality improvement and cost
reduction strategies within the construction industry.
I look forward to hearing from you.
Yours Sincerely,
Raymond Olayinka
PhD Researcher MI 229, School of Technology
University of Wolverhampton
WV1 1LY
Mob: 07947331982
Tel: 01902321271
Email: [email protected]
Website: wlv.ac.uk
334
Appendix 2: Information Sheet for Interview Participants
Information Sheet for Interview Participants
Research Project Title: The Impact of Knowledge Management in Reducing the Cost
of Poor Quality in Construction
Project context: The cost of poor quality (COPQ) in construction has been defined as the sum
of all costs that will disappear if there are no quality issues in the delivery of a construction
project. Quality issues can be classified into: people-related quality issues; process-related
quality issues; and product-related quality issues. COPQ have been found to range from 2% to
as high as 50% of the contract value. These costs are unnecessary and avoidable. Researchers
and practitioners have explored and implemented various cost-cutting and quality improvement
strategies yet COPQ is prevalent. Possible reasons may be due to the arguably unique
characteristics of construction projects such as the complicated nature of operations, multitude
of occupations, professions and organisations, temporary team members, one-off nature of
projects, tight schedules and limited budgets. Projects are also people-intensive characterised by
a wealth of experiential knowledge. When staff retire or leave projects, they take significant
knowledge with them to the detriment of the project delivery. These are knowledge
management (KM) issues and challenges which can impact COPQ in diverse ways. A proposed
approach to reducing COPQ can therefore be through the optimisation of KM which involves a
strategy of ‘getting the right knowledge to the right people at the right time’
Definitions
Knowledge Management in this context can be referred to as a strategy of ‘getting the right
knowledge to the right people at the right time’. This involves managing the interfaces between
personal knowledge, organisational knowledge, project knowledge and industry knowledge.
Cost of Poor Quality relates to the sum of all costs that would disappear if there were no quality
issues and inefficiencies in construction. These include the costs of error, costs of changes, costs
of poor skills and the resultant costs associated with customer dissatisfaction.
Purpose of Interview:
To investigate the contributory factors to the cost of poor quality on construction
projects
To investigate the impact of knowledge management in reducing the cost of
poor quality on construction projects
To identify the barriers to the optimisation of knowledge management in
reducing the cost of poor quality on construction projects.
Duration and data storage:
The interview will last for at least 1hour. Please note that interviews will be audio-recorded
then transcribed onto a computer system. You may review, edit or erase the transcripts
and audio recordings of your interview if you wish to do so. Recordings will then be
destroyed. Your responses will be treated as confidential and computer transcripts will
not contain references to any persons (including yourself) or organisations. Such
references will be replaced by codes known only to me, and all data will be stored
securely.

335
Appendix 3: Consent Form for Participants
THE IMPACT OF KNOWLEDGE MANAGEMENT IN REDUCING THE COST OF
POOR QUALITY IN CONSTRUCTION
Consent Statement
I agree to participate in the above research project and give my consent freely.
I understand that the project will be conducted as described in the ‘Information Sheet’,
a copy of which I have retained.
I understand that I can withdraw from the project at any time and do not have to give a
reason for withdrawing.
I consent to participate in an interview with the researcher.
I understand that my personal information will remain confidential to the researcher.
I understand that my organization will not be identified either directly or indirectly.
I have had the opportunity to have questions answered to my satisfaction.
Print Name: _________________________________
Signature: ____________________________ Date: __________________
Contact Address: _________________________________________________________
Phone Number: ____________________
Email Address: ____________________

336
Appendix 4: Semi-structured Interview Template
School of Architecture and Built Environment Faculty of Science and Engineering University of Wolverhampton
RESEARCH TITLE: THE IMPACT OF KNOWLEDGE MANAGEMENT IN REDUCING THE
COST OF POOR QUALITY IN CONSTRUCTION PROJECTS
Semi-structured interview template
Interview ID/No:
Interviewee ID:
Interviewee’s name:
Interview date:
Interview time:
Interview venue:
Interview duration:
Name of interviewee’s organisation:
Section A: General Information
Question
Response
1. How many years of construction industry experience do you have?
2. Which types of construction projects have you worked on? (E.g. Building? Highways?)
3. Which types of organisations have you previously worked for? (E.g. Clients? Contractors?)
4. What is your current job designation?
5. What is your current job level? (Managerial or operational?)
6. What is your area of expertise?

337
Section B: Contributory factors to the cost of poor quality on projects
Question
Response
1. From your experience of construction projects, what are the contributory factors to the cost of errors and omissions on projects?
2. What are the contributory factors to the cost of design changes on projects?
3. What are the contributory factors to the cost of poor skills on projects?
Section C: Impact of knowledge management in reducing the cost of poor quality (based
on the identified contributory factors)
Question
Response
1. Which knowledge management initiatives were in place on the projects you worked on? How did the initiatives impact the reduction of errors and omissions?
2. How did the initiatives impact the reduction of design changes?
3. How did the initiatives impact the reduction of poor skills?
Section D: Optimisation of knowledge management to reduce the cost of poor quality
Question
Response
1. From your experience in construction projects and organisations, what are the barriers to knowledge management in reducing the cost of poor quality?

338
Appendix 5: Survey questionnaire and cover letter
Dear ___________________________________________
I am a PhD researcher at the University of Wolverhampton currently undertaking a
study on the Impact of Knowledge Management in Reducing the Cost of Poor Quality
on Construction Projects under the supervision of Dr Subashini Suresh and Dr Ezekiel
Chinyio. Output from the study is intended to benefit organisations like yours in the
areas of cost reduction and quality improvements through the exploitation and
optimisation of knowledge management.
A survey questionnaire has been developed as part of the study to explore knowledge
management and its impact on the cost of poor quality in construction. I would like to
request your help and participation in this important study by spending about 30
minutes to complete the attached questionnaire. The survey is anonymous so as to allow
freedom of expression. Your responses will be treated with strict confidentiality. If you
have any queries or would like to speak to me, please feel free to contact me on
07947331982. Email: [email protected]
Please return completed questionnaire via enclosed freepost envelope. A summary of
the survey results can be made available to you at the conclusion of the study. If you
wish to obtain a copy of these results, please indicate and also provide your contact
details. Thank you for your help and participation.
Yours sincerely,
Raymond Olayinka
PhD Researcher
MI Building
University of Wolverhampton
Wulfruna Street, WV1 1LY

339
Operational definitions
Knowledge Management (KM): A strategy of ‘getting the right knowledge to the right
people at the right time’. KM involves managing the interfaces between personal
knowledge, organisational knowledge, project knowledge and industry knowledge.
Cost of Poor Quality (COPQ): The sum of all costs that would disappear if there were
no quality issues and inefficiencies in construction. These include the costs of error,
costs of changes, costs of poor skills and the resultant costs associated with customer
dissatisfaction.
Project Organisations: Organisations involved in a construction project such as the
client organisation, designers, consultants, main contractor, sub-contractors and
suppliers.
Project Team: Project team consists of representatives from the project organisations.
Project Staff: Members of the project team
Performance Metrics: Involves establishing critical processes, identifying specific
quantifiable outputs of work, and establishing targets against which results can be
scored.
Structure of the questionnaire
The questionnaire is structured into sections shown in the table below:
Section Description
A General Information
B Knowledge Management Activities for Reducing the Cost of Poor Quality on
Construction Projects
C Effectiveness of Knowledge Management Techniques and Technologies in
Reducing the Cost of Poor Quality
D Barriers to Knowledge Management in Reducing the Cost of Poor Quality
E Benefits of Reducing the Cost of Poor Quality through the Optimisation of
Knowledge Management
F Measurement of the Impact of Knowledge Management on the Cost of Poor
Quality
G Any additional comments

340
Section A: General Information
How many years of construction industry work experience do you have? Please tick [] only one box.
Up to 5years > 5years up to10 years >10years up to 15years
>15years up to 20years > 20years up to 25years > 25years
What is your current job role? Please tick [] only one box.
Civil Engineer Cost Manager Architect
Knowledge Manager Mechanical & Electrical (M&E) Project Engineer
Project Manager Quantity Surveyor Quality Manager
Site Manager Site Supervisor Other, please specify
__________________
What is your job level? Please tick [] only one box.
Director Senior Management Mid-level Management
Junior Management Operational Other, please specify
___________________
Please indicate the number of employees in your organisation? Please tick [] only one box.
1-5 6-10 11-50
51-250 251- 500 More than 500
What size of projects does your organisation normally undertake? Please tick [] only one box.
less than £0.5M £0.5M- £1M £1M - £2M
£2M- £10M More than £10M
Which of the following best describes your organisation? Please tick [] only one box.
Client Organisation Consultancy Contractor
Designer
Supplier
Project Management Sub-contractor
Other please specify__________________
Which of the following describes your organisation’s area(s) of operation? Please tick [] all applicable options.
Building Construction Highways Rail
Utility (Power) Utility (Water) Other (Please specify)
_____________________
What is your level of familiarity with knowledge management? Please tick [] only one box.
Low Moderate High
What is your level of familiarity with quality management? Please tick [] only one box.
Low Moderate High

341
Section B: Knowledge Management Processes for Reducing the Cost of Poor Quality on Construction Projects
The following is a list of knowledge management processes; please indicate their level of impact on reducing the aspects of cost of
poor quality on construction projects by ticking the appropriate number.
Meaning of Scale: 1 = Strong Negative Impact, 2 = Negative Impact, 3 = Positive Impact, 4 = Strong Positive Impact
Knowledge Management Processes
Impact on reducing
the cost of
design changes
Impact on reducing
the cost of
construction
errors
Impact on reducing
the cost of
poor skills
Identifying the right knowledge for the right people at the
right time
1 2 3 4 1 2 3 4 1 2 3 4
Capturing the experiential knowledge of staff for
organisational use
1 2 3 4 1 2 3 4 1 2 3 4
Capturing lessons learnt at various stages of the project
1 2 3 4 1 2 3 4 1 2 3 4
Capturing knowledge from other projects for use on
current project
1 2 3 4 1 2 3 4 1 2 3 4
Converting the experiential knowledge of staff into
written documents accessible to other staff
1 2 3 4 1 2 3 4 1 2 3 4
Converting project knowledge into documents accessible
to organisations
1 2 3 4 1 2 3 4 1 2 3 4
Storing project knowledge in the knowledge bank
accessible to staff
1 2 3 4 1 2 3 4 1 2 3 4
Involving all project stakeholders in the early stages to
share knowledge
1 2 3 4 1 2 3 4 1 2 3 4
Disseminating project knowledge through case study
publications
1 2 3 4 1 2 3 4 1 2 3 4
Disseminating project knowledge through communities of
practice
1 2 3 4 1 2 3 4 1 2 3 4
Sharing of knowledge among project team members
1 2 3 4 1 2 3 4 1 2 3 4
Creating new knowledge through the collaboration of
organisations involved in a project
1 2 3 4 1 2 3 4 1 2 3 4
Using mentoring programmes to facilitate knowledge
transfer among staff
1 2 3 4 1 2 3 4 1 2 3 4
Using apprenticeship programmes to facilitate knowledge
transfer among staff
1 2 3 4 1 2 3 4 1 2 3 4
Engaging experts to facilitate knowledge management on
projects
1 2 3 4 1 2 3 4 1 2 3 4
Assessing the impact of knowledge management on
construction activities
1 2 3 4 1 2 3 4 1 2 3 4

342
Section C: Effectiveness of Knowledge Management Techniques and Technologies in Reducing the Cost of Poor Quality

343
The following is a list of knowledge management techniques and technologies; please indicate their level of effectiveness in
reducing the aspects of cost of poor quality on construction projects by ticking the appropriate number.
Meaning of scale: 1 = Not at all effective, 2 = Fairly Effective, 3 = Effective, 4 = Very Effective
Knowledge management techniques and
technologies
Effectiveness in
reducing the cost of
design changes
Effectiveness in
reducing the cost of
construction errors
Effectiveness in
reducing the cost of
poor skills
Blogs 1 2 3 4 1 2 3 4 1 2 3 4
Brainstorming 1 2 3 4 1 2 3 4 1 2 3 4
Collaborative Physical Workspaces 1 2 3 4 1 2 3 4 1 2 3 4
Collaborative Virtual Workspaces 1 2 3 4 1 2 3 4 1 2 3 4
Competence Management 1 2 3 4 1 2 3 4 1 2 3 4
Corporate Yellow Pages/Expert Locator 1 2 3 4 1 2 3 4 1 2 3 4
Cross Project Learning 1 2 3 4 1 2 3 4 1 2 3 4
Email 1 2 3 4 1 2 3 4 1 2 3 4
Instant Messenger 1 2 3 4 1 2 3 4 1 2 3 4
Intranets 1 2 3 4 1 2 3 4 1 2 3 4
Knowledge Bases/Repositories 1 2 3 4 1 2 3 4 1 2 3 4
Knowledge Cafes 1 2 3 4 1 2 3 4 1 2 3 4
Knowledge Exchange/Interviews 1 2 3 4 1 2 3 4 1 2 3 4
Knowledge Sharing Workshops 1 2 3 4 1 2 3 4 1 2 3 4
Knowledge Mapping 1 2 3 4 1 2 3 4 1 2 3 4
Learning Histories 1 2 3 4 1 2 3 4 1 2 3 4
Lessons Learned Management Systems 1 2 3 4 1 2 3 4 1 2 3 4
Learning Reviews 1 2 3 4 1 2 3 4 1 2 3 4
Peer Assist 1 2 3 4 1 2 3 4 1 2 3 4
Post Project Reviews 1 2 3 4 1 2 3 4 1 2 3 4
Social Networking Services 1 2 3 4 1 2 3 4 1 2 3 4
Storytelling 1 2 3 4 1 2 3 4 1 2 3 4
Web Conferencing 1 2 3 4 1 2 3 4 1 2 3 4
Wikis 1 2 3 4 1 2 3 4 1 2 3 4

344
Section D: Barriers to Knowledge Management in Reducing the Cost of Poor Quality
The following is a list of barriers to knowledge management in reducing the cost of poor quality; from your experience
please indicate their level of strength by ticking the appropriate number.
Meaning of Scale: 1 = Very Weak Barrier, 2 = Weak Barrier, 3 = Strong Barrier, 4 = Very Strong Barrier
Lack of senior management support
1 2 3 4
Adversarial organisational culture
1 2 3 4
Complacency of project staff
1 2 3 4
Knowledge hoarding
1 2 3 4
High staff turnover
1 2 3 4
High perceived costs of investing in KM initiatives
1 2 3 4
Lack of knowledge managers on projects
1 2 3 4
Time constrained nature of projects
1 2 3 4
Lack of understanding of KM concepts by project staff
1 2 3 4
Lack of collaborative working by project organisations to create new knowledge
1 2 3 4
Perception of KM initiatives as ‘unnecessary burden’
1 2 3 4
Perception of errors as inevitable in construction
1 2 3 4
Adversarial contracts detrimental to KM implementation
1 2 3 4
Lack of incentives to motivate project staff
1 2 3 4
Lack of technological infrastructure to support KM initiatives
1 2 3 4
Lack of performance metrics to measure the impact of KM on the cost of poor quality 1 2 3 4
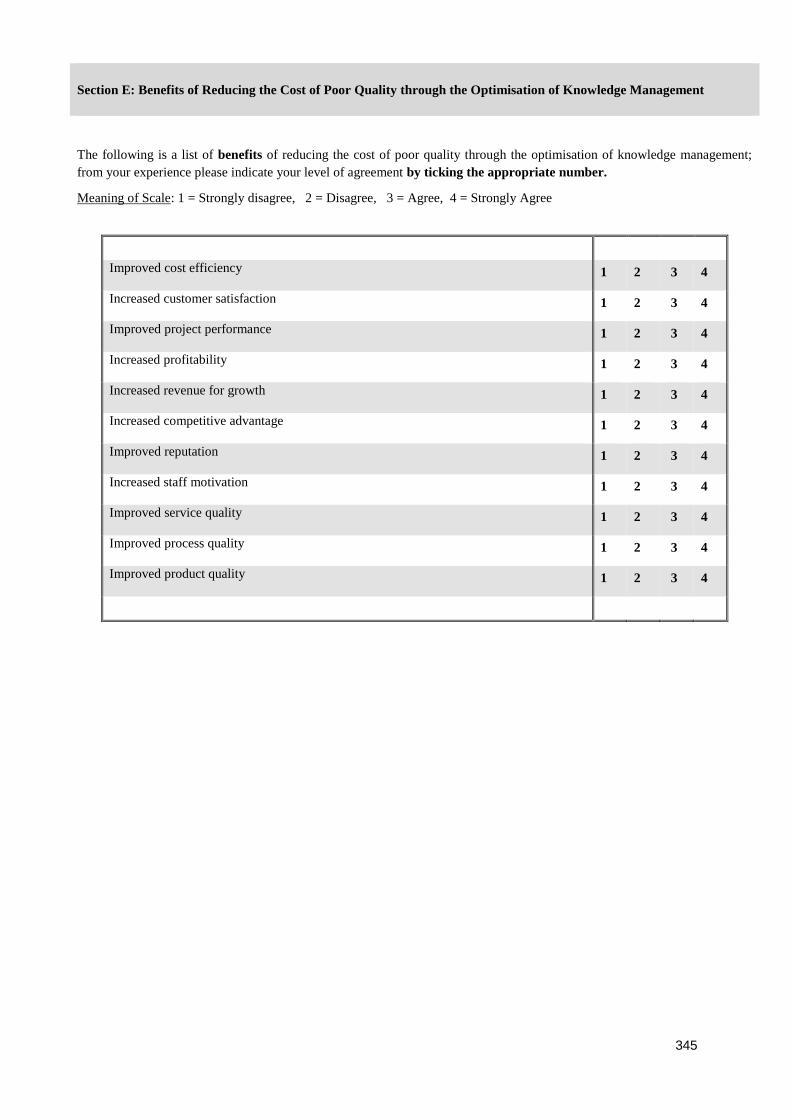
345
Section E: Benefits of Reducing the Cost of Poor Quality through the Optimisation of Knowledge Management
The following is a list of benefits of reducing the cost of poor quality through the optimisation of knowledge management;
from your experience please indicate your level of agreement by ticking the appropriate number.
Meaning of Scale: 1 = Strongly disagree, 2 = Disagree, 3 = Agree, 4 = Strongly Agree
Improved cost efficiency
1 2 3 4
Increased customer satisfaction
1 2 3 4
Improved project performance
1 2 3 4
Increased profitability
1 2 3 4
Increased revenue for growth
1 2 3 4
Increased competitive advantage
1 2 3 4
Improved reputation
1 2 3 4
Increased staff motivation
1 2 3 4
Improved service quality
1 2 3 4
Improved process quality
1 2 3 4
Improved product quality
1 2 3 4

346
Section F: Measurement of the Impact of Knowledge Management on the Cost of Poor Quality
The following is a list of questions on the measurement of the impact of knowledge management on the cost of poor quality;
from your experience please indicate your responses by ticking the appropriate box.
Yes No
Do you currently have a tool to quantify COPQ?
Do you currently have a tool that measures the impact of KM on COPQ?
Do you currently have performance metrics to assess the impact of KM on COPQ?
Would you welcome a new tool for:
Yes No
Quantifying COPQ?
Measuring the impact of KM on COPQ?
Developing performance metrics for assessing the impact of KM on COPQ?
Comparing the performances of various projects on the impact of KM on COPQ?
Measuring the costs and benefits of KM in reducing COPQ?
Tracking periodical progress of KM in reducing COPQ?
Assessing the impact of KM on overall project cost?
Section G: Any additional comments? Please state below:
END OF QUESTIONNAIRE
Thank you very much for your time and input!
Do you want a copy of the key findings? Please tick [] only one box. Yes No
If yes provide details:
Name:
Address:
Email:

347
Appendix 6: Evaluation template
School of Architecture and Built Environment Faculty of Science and Engineering University of Wolverhampton
RESEARCH TITLE: A KNOWLEDGE MANAGEMENT FRAMEWORK FOR REDUCING THE
COST OF POOR QUALITY ON CONSTRUCTION PROJECTS
Evaluation template
Participant ID:
Participant’s name:
Date:
Time:
Venue:
Duration:
Name of Participant’s organisation:
Section A: General Information
Question
Response
1. How many years of construction industry experience do you have?
2. Which types of construction projects have you worked on? (E.g. Building? Highways?)
3. Which types of organisations have you previously worked for? (E.g. Clients? Contractors?)
4. What is your current job designation?
5. What is your current job level? (Managerial or operational?)
6. What is your area of expertise?

348
Section B: Evaluation of the KM/CoPQ framework
Question
Response
1. Are the dynamics of the KM – COPQ link reflective of the situation in practice?
2. Are the key barriers identified the critical ones to be addressed in the optimisation of KM in reducing COPQ in practice?
3. Are the four (4) to quantifying COPQ adequate and complete?
4. Are the five (5) steps to assessing the impact of KM on COPQ adequate and complete?
5. Are the benefits of reducing COPQ through KM consistent with the ones found in practice?
6. Are the dynamics and interconnectedness of the framework congruous?
7. Will the framework useful in driving continuous improvement in the construction industry through the optimisation of KM to reduce COPQ?
8. How can the framework be improved?
9. What are your comments on the spreadsheet demonstrating the practicality of the framework

349
Appendix 7: Excel Spreadsheet format of the KM framework for reducing COPQ
Cause Effect COPQ indicator
ID Contributory factors to COPQ COPQ issue Description Rework Delay Wastage Plant (£) Material (£) Labour (£) Time (Days) KM initiatives pre-CoPQ issues Cost (£) KM initiatives post-CoPQ issues Cost (£) Outcomes
1 Errors and omissions e.g. knowledge sharing e.g. lessons learnt system
a Rule-based mistakes e.g wrong reinforcement was used a a
b Knowledge-based mistakes
c Slips and lapses of attention
d Lack of lessons learnt
e Habits
f Organisational culture
g Time constraints
h Budget constraints
i Poor communication
j Procurement strategy
k Design issues
l Construction product issues
m Others
Total
2 Design changes
a Client/end user change
b Other changes
c Design change inevitable
d Unforseen site conditions
e Poor communication
f Poor client expertise
g Constructability issues
h Errors and omissions on site
i Procurement strategy
j Time constraints
k Budget constraints
l Others
Total
3 Poor skills
a High personnel turnover
b Lack of training
c Lack of dedication
d Complacency
e Time constraints
f Budget constraints
g Project based nature of industry
h Organisational culture
i Others
Total

350
Appendix 8: Excerpts from participant responses on the evaluation of the framework
Question
Participant A Participant B Participant C Participant D Participant E
1. Are the dynamics of the KM – COPQ link in [A] reflective of the situation in practice?
“Yes definitely, the importance and relevance of knowledge management cannot be overemphasised. We can save tons of money by optimising knowledge management”
“This is reflective of the situation in practice”. I think we struggle a lot in this industry with knowledge management and that’s why we haven’t been able to make most of it.
“Yes they are” “With my experience in knowledge management, I think it is reflective of the construction industry in particular”
“Yes”
2. Are the key barriers identified in [B] the critical ones to be addressed in the optimisation of KM in reducing COPQ in practice?
“There is need to actually to benchmark or understand why these problems exist. Yes these barriers are the critical ones to be addressed”
“Yes especially the culture aspect. At the end of the day it all comes to behaviour. We ought to take knowledge management culture as seriously as we take health and safety”
“A key barrier is time because we are so task focused. We just want to get on and when we finish that project we just want to get on and do the next project. We don’t take the time to think about what has gone well what didn’t go well. So I’ll say lack of time is a critical barrier in addition to others”.
“Yes as far as I can think of, having a knowledge base is good but most importantly an organisational culture in which people willingly push and pull knowledge into and from the knowledge base”.
“Yes these are the barriers that need to be addressed particularly knowledge champions. We had no knowledge champions on most of the projects I’ve worked on. This had significant impact on project cost as no one championed lessons learnt from mistakes”
3. Are the four (4) steps to quantifying COPQ shown in [C] adequate and complete?
“Measuring the cost of poor quality and benchmarking performance has always been a major issue. No one does it so I think the steps are adequate to offer a solution in this area”
“Yes they are adequate and complete”.
“We have never quantified the cost of poor quality on projects. But I think the steps can help in quantifying the cost of poor quality”
“I can’t say if they are adequate and complete but it is interesting to be able to calculate the total cost of poor quality as a percentage of total project cost. It is a positive step in managing these sorts of cost in construction”
“Yes”
4. Are the five (5) steps to assessing the impact of KM on COPQ shown in [D] adequate and complete?
“Yes they are”. “Though it would appear a bit complex to assess the impact of knowledge management on the cost of poor quality, I would say yes to adequacy of the framework to address this area”.
“The sequence is correct, adequate and complete”
“Yes” “Yes. You may want to include the use of KPIs to benchmark the impact of knowledge management”

351
Question
Participant A Participant B Participant C Participant D Participant E
5. Are the benefits of reducing COPQ through KM shown in [E] consistent with the ones found in practice?
“Yes definitely the cost of poor quality will reduce if knowledge management is properly implemented”
“Yes but is subjective, organisations have different drivers for knowledge management and what sort of benefits they wish to gain from it. Benefits can therefore vary”.
“Yes. Profitability is currently low in the industry. Organisations can increase their revenues if poor quality is reduced”.
“Yes” “Yes”
6. Are the dynamics and interconnectedness of the framework congruous?
“Yes definitely” “Yes they seem in agreement”
“Yes they connect well”
“Yes it follows a logical flow” “Yes”.
7. Will the framework be useful in driving continuous improvement in the construction industry?
“Yes it should be useful to drive continuous improvement if implemented on multiple projects”
“Yes it can be useful in this area”
“Yes, although the industry still has a reputation for doing things the same old ways by repeating mistakes and re-inventing the wheel”.
“It depends. If we can have a central industry database or knowledge base to store project data, then we can start aggregating data to see if there is continuous improvement”.
“Yes. Perhaps some form of KPIs is needed here”
8. What are your comments on the practicality of the framework; as demonstrated on a spreadsheet?
“It’s practical and workable as long as organisations can provide the data required to do the calculations”
“It’s great. Senior managers will be interested to see the impact of knowledge management in figures. If you can’t measure you can’t manage. This will aid decision-making processes”
“Entering the project data in the spreadsheet could be tedious but the benefits certainly outweighs this”
“It is practical as long as data is readily available”
“It is practical and usable”
9. How can the framework be improved?
“I think we will know in due course after running it with a number of projects”
“No comments on this at the moment”
“With more tests come improvement”
“I can’t say at the moment” “No comments”