A. Introduction - NERC · Variable Renewable (Non-Hydro) 5% * *Steam Turbines of combined cycle...
51
BAL-001-TRE-21 — Primary Frequency Response in the ERCOT Region Page 1 of 14 A. Introduction 1. Title: Primary Frequency Response in the ERCOT Region 2. Number: BAL-001-TRE-21 3. Purpose: To maintain Interconnection steady-state frequency within defined limits. 4. Applicability: 4.1. Functional Entities: 4.1.1 Balancing Authority 4.1.2 Generator Owners 4.1.3 Generator Operators 4.2. Exemptions 4.2.1 Existing generating facilities regulated by the U.S. Nuclear Regulatory Commission prior to the Effective Date are exempt from Standard BAL- 001-TRE-21. 4.2.2 Generating units/generating facilities while operating in synchronous condenser mode are exempt from Standard BAL-001-TRE-21. 4.2.3 Any generators that are not required by the Balancing Authority to provide primary frequency response are exempt from this standard. 5. Effective Date: See Implementation Plan for Regional Standard BAL-001-TRE-2. 6. Background: The ERCOT Interconnection was initially given a waiver of BAL-001 R2 (Control Performance Standard CPS2). In FERC Order 693, NERC was directed to develop a Regional Standard as an alternate means of assuring frequency performance in the ERCOT Interconnection. NERC was explicitly directed to incorporate key elements of the existing Protocols, Section 5.98.5. This required governors to be in service and performing with an un-muted response to assure an Interconnection minimum Frequency Response to a Frequency Measurable Event (FME) (that starts at t(0)). This Rregional Sstandard provides requirements related to identifying Frequency Measureable Events, calculating the Primary Frequency Response of each resource in the Region, calculating the Interconnection minimum Frequency Response and monitoring the actual Frequency Response of the Interconnection, setting Governor deadband and droop parameters, and providing Primary Frequency Response performance requirements. Under this standard, two Primary Frequency Response (PFR) performance measures are calculated: “initial” and “sustained.” The initial PFR performance (R9) measures the actual response compared to the expected response in the period from 20 to 52
Transcript of A. Introduction - NERC · Variable Renewable (Non-Hydro) 5% * *Steam Turbines of combined cycle...

BAL-001-TRE-21 — Primary Frequency Response in the ERCOT Region
Page 1 of 14
A. Introduction 1. Title: Primary Frequency Response in the ERCOT Region
2. Number: BAL-001-TRE-21
3. Purpose: To maintain Interconnection steady-state frequency within defined limits.
4. Applicability:
4.1. Functional Entities:
4.1.1 Balancing Authority
4.1.2 Generator Owners
4.1.3 Generator Operators
4.2. Exemptions
4.2.1 Existing generating facilities regulated by the U.S. Nuclear Regulatory Commission prior to the Effective Date are exempt from Standard BAL-001-TRE-21.
4.2.2 Generating units/generating facilities while operating in synchronous condenser mode are exempt from Standard BAL-001-TRE-21.
4.2.3 Any generators that are not required by the Balancing Authority to provide primary frequency response are exempt from this standard.
5. Effective Date: See Implementation Plan for Regional Standard BAL-001-TRE-2.
6. Background: The ERCOT Interconnection was initially given a waiver of BAL-001 R2 (Control Performance Standard CPS2). In FERC Order 693, NERC was directed to develop a Regional Standard as an alternate means of assuring frequency performance in the ERCOT Interconnection. NERC was explicitly directed to incorporate key elements of the existing Protocols, Section 5.98.5. This required governors to be in service and performing with an un-muted response to assure an Interconnection minimum Frequency Response to a Frequency Measurable Event (FME) (that starts at t(0)). This Rregional Sstandard provides requirements related to identifying Frequency Measureable Events, calculating the Primary Frequency Response of each resource in the Region, calculating the Interconnection minimum Frequency Response and monitoring the actual Frequency Response of the Interconnection, setting Governor deadband and droop parameters, and providing Primary Frequency Response performance requirements. Under this standard, two Primary Frequency Response (PFR) performance measures are calculated: “initial” and “sustained.” The initial PFR performance (R9) measures the actual response compared to the expected response in the period from 20 to 52
BAL-001-TRE-21 — Primary Frequency Response in the ERCOT Region
Page 2 of 14
seconds after an FME starts. The sustained PFR performance (R10) measures the best actual response between 46 and 60 seconds after t(0) compared to the expected response based on the system frequency at a point 46 seconds after t(0).
In this Rregional Sstandard the term “resource” is synonymous with “generating unit/generating facility”.
B. Requirements and Measures
R1. The Balancing Authority shall identify Frequency Measurable Events (FMEs), and
within 14 calendar days after each FME the Balancing Authority shall notify the Compliance Enforcement Authority and make FME information (time of FME (t(0)), pre-perturbation average frequency, post- perturbation average frequency) publicly available. [Violation Risk Factor – Lower] [Time Horizon – Operations Assessment]
M1. The Balancing Authority shall have evidence it reported each FME to the Compliance Enforcement Authority and that it made FME information publicly available within 14 calendar days after the FME as required in Requirement R1.
R2. The Balancing Authority shall calculate the Primary Frequency Response of each
generating unit/generating facility in accordance with this standard and the Primary Frequency Response Reference Document.1 This calculation shall provide a 12-month rolling average of initial and sustained Primary Frequency Response performance. This calculation shall be completed each month for the preceding 12 calendar months. [Violation Risk Factor = Lower] [Time Horizon = Operations Assessment]
2.1. The performance of a combined cycle facility will be determined using an expected performance droop of 5.78%.
2.2. The calculation results shall be submitted to the Compliance Enforcement Authority and made available to the Generator Owner by the end of the month in which they were completed.
2.3. If a generating unit/generating facility has not participated in a minimum of (8) eight FMEs in a 12-month period, its performance shall be based on a rolling eight FME average response.
1 The Primary Frequency Response Reference Document contains the calculations that the Balancing Authority will use to determine Primary Frequency Response performance of generating units/generating facilities. This reference document is a Texas RE-controlled document that is subject to revision by the Texas RE Board of Directors.

BAL-001-TRE-21 — Primary Frequency Response in the ERCOT Region
Page 3 of 14
M2. The Balancing Authority shall have evidence it calculated and reported the rolling average initial and sustained Primary Frequency Response performance of each generating unit/generating facility monthly as required in Requirement R2.
R3. The Balancing Authority shall determine the Interconnection minimum Frequency
Response (IMFR) in December of each year for the following year, and make the IMFR, the methodology for calculation and the criteria for determination of the IMFR publicly available. [Violation Risk Factor = Lower] [Time Horizon = Operations Planning]
M3. The Balancing Authority shall demonstrate that the IMFR was determined in December of each year per per r Requirement R3. The Balancing Authority shall demonstrate that the IMFR, the methodology for calculation and the criteria for determination of the IMFR are publicly available.
R4. After each calendar month in which one or more FMEs occurs, the Balancing Authority shall determine and make publicly available the Interconnection’s combined Frequency Response performance for a rolling average of the last six (6) FMEs by the end of the following calendar month. [Violation Risk Factor = Medium] [Time Horizon = Operations Planning]
M4. The Balancing Authority shall provide evidence that the rolling average of the
Interconnection’s combined Frequency Response performance for the last six (6) FMEs was calculated and made public per Requirement R4.
R5. Following any FME that causes the Interconnection’s six-FME rolling average combined Frequency Response performance to be less than the IMFR, the Balancing Authority shall direct any necessary actions to improve Frequency Response, which may include, but are not limited to, directing adjustment of Governor deadband and/or droop settings. [Violation Risk Factor = Medium] [Time Horizon = Operations Planning]
M5. The Balancing Authority shall provide evidence that actions were taken to improve the Interconnection’s Frequency Response if the Interconnection’s six-FME rolling average combined Frequency Response performance was less than the IMFR, per Requirement R5.

BAL-001-TRE-21 — Primary Frequency Response in the ERCOT Region
Page 4 of 14
R6. Each Generator Owner shall set its Governor parameters as follows:
6.1. Limit Governor deadbands within those listed in Table 6.1, unless directed otherwise by the Balancing Authority. Table 6.1 Governor Deadband Settings
Generator Type Max. Deadband Steam and Hydro Turbines with Mechanical Governors
+/- 0.034 Hz
All Other Generating Units/Generating Facilities*
+/- 0.017 Hz
6.2. Limit Governor droop settings such that they do not exceed those listed in Table 6.2, unless directed otherwise by the Balancing Authority.
Table 6.2 Governor Droop Settings
Generator Type Max. Droop
% Setting Hydro 5% Nuclear 5% Coal and Lignite 5% Combustion Turbine (Simple Cycle and Single-Shaft Combined Cycle)
5%
Combustion Turbine (Combined Cycle)* 4% Steam Turbine* (Simple Cycle) 5% Steam Turbine (Combined Cycle)* 5% Diesel 5% Wind Powered Generator 5% DC Tie Providing Ancillary Services 5% Variable Renewable (Non-Hydro) 5%
**Steam Turbines of combined cycle resources are required to comply with Requirements R6.1, R6.2 and R6.3. Compliance with Requirements R9 and R10 will be determined through evaluation of the combined cycle facility using an expected performance droop of 5.78%.
*Requirements R6.1, R6.2, and R6.3 are not applicable to steam turbine(s) of a combined cycle resource.
BAL-001-TRE-21 — Primary Frequency Response in the ERCOT Region
Page 5 of 14
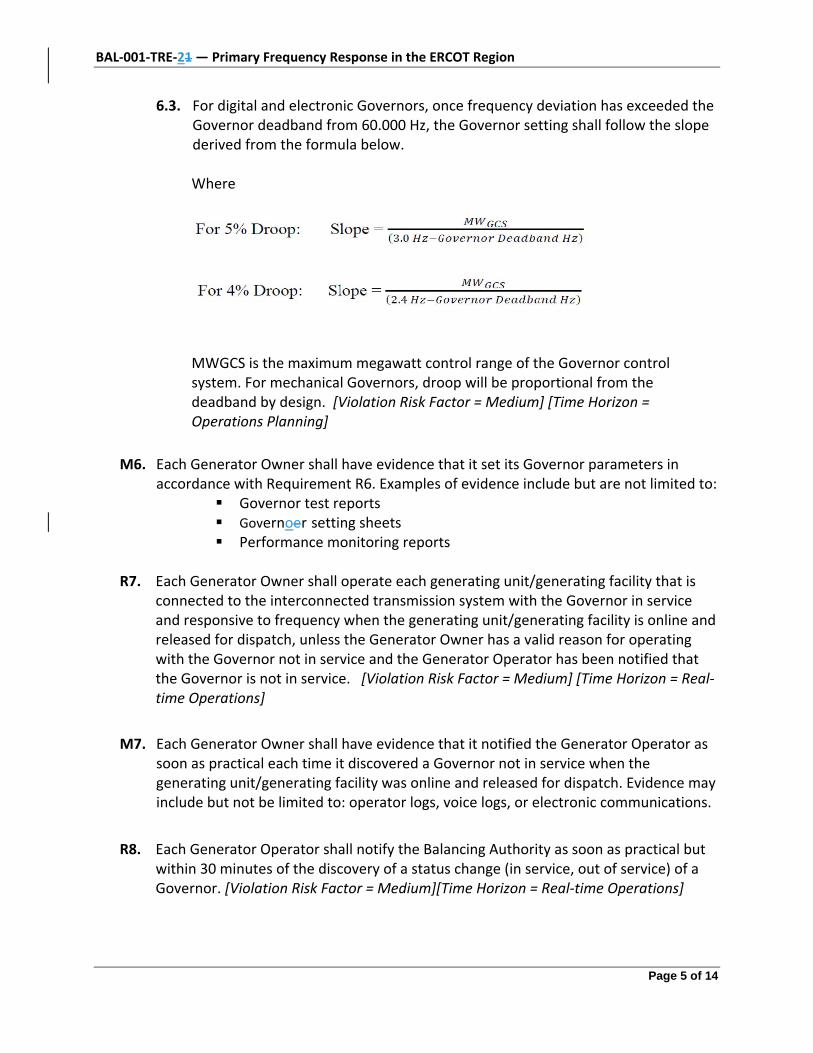
6.3. For digital and electronic Governors, once frequency deviation has exceeded the Governor deadband from 60.000 Hz, the Governor setting shall follow the slope derived from the formula below.
Where
MWGCS is the maximum megawatt control range of the Governor control system. For mechanical Governors, droop will be proportional from the deadband by design. [Violation Risk Factor = Medium] [Time Horizon = Operations Planning]
M6. Each Generator Owner shall have evidence that it set its Governor parameters in accordance with Requirement R6. Examples of evidence include but are not limited to:
Governor test reports Governoer setting sheets Performance monitoring reports
R7. Each Generator Owner shall operate each generating unit/generating facility that is
connected to the interconnected transmission system with the Governor in service and responsive to frequency when the generating unit/generating facility is online and released for dispatch, unless the Generator Owner has a valid reason for operating with the Governor not in service and the Generator Operator has been notified that the Governor is not in service. [Violation Risk Factor = Medium] [Time Horizon = Real-time Operations]
M7. Each Generator Owner shall have evidence that it notified the Generator Operator as
soon as practical each time it discovered a Governor not in service when the generating unit/generating facility was online and released for dispatch. Evidence may include but not be limited to: operator logs, voice logs, or electronic communications.
R8. Each Generator Operator shall notify the Balancing Authority as soon as practical but
within 30 minutes of the discovery of a status change (in service, out of service) of a Governor. [Violation Risk Factor = Medium][Time Horizon = Real-time Operations]
BAL-001-TRE-21 — Primary Frequency Response in the ERCOT Region
Page 6 of 14
M8. Each Generator Operator shall have evidence that it notified the Balancing Authority within 30 minutes of each discovery of a status change (in service, out of service) of a Governor.
R9. Each Generator Owner shall meet a minimum 12-month rolling average initial Primary
Frequency Response performance of 0.75 on each generating unit/generating facility, based on participation in at least eight FMEs.
9.1. The initial Primary Frequency Response performance shall be the ratio of the Actual Primary Frequency Response to the Expected Primary Frequency Response during the initial measurement period following the FME.
9.2. If a generating unit/generating facility has not participated in a minimum of eight FMEs in a 12-month period, performance shall be based on a rolling eight-FME average.
9.3. A generating unit/generating facility’s initial Primary Frequency Response performance during an FME may be excluded from the rolling average calculation by the Balancing Authority due to a legitimate operating condition that prevented normal Primary Frequency Response performance. Examples of legitimate operating conditions that may support exclusion of FMEs include, but are not limited to:
• Operation at or near auxiliary equipment operating limits (such as boiler feed pumps, condensate pumps, pulverizers, and forced draft fans);
• Data telemetry failure. The Compliance Enforcement AuthorityBalancing Authority may request raw data from the Generator Owner as a substitute.
[Violation Risk Factor = Medium] [Time Horizon = Operations Assessment]
M9. Each Generator Owner shall have evidence that each of its generating units/generating facilities achieved a minimum rolling average of initial Primary Frequency Response performance level of at least 0.75 as described in Requirement R9. Each Generator Owner shall have documented evidence of any FMEs where the generating unit performance should bewas excluded from the rolling average calculation.
R10. Each Generator Owner shall meet a minimum 12-month rolling average sustained
Primary Frequency Response performance of 0.75 on each generating unit/generating facility, based on participation in at least eight FMEs. [Violation Risk Factor = Medium] [Time Horizon = Operations Assessment]

BAL-001-TRE-21 — Primary Frequency Response in the ERCOT Region
Page 7 of 14
10.1. The sustained Primary Frequency Response performance shall be the ratio of the Actual Primary Frequency Response to the Expected Primary Frequency Response during the sustained measurement period following the FME.
10.2. If a generating unit/generating facility has not participated in a minimum of eight FMEs in a 12-month period, performance shall be based on a rolling eight- FME average.
10.3. A generating unit/generating facility’s sustained Primary Frequency Response performance during an FME may be excluded from the rolling average calculation by the Balancing Authority due to a legitimate operating condition that prevented normal Primary Frequency Response performance. Examples of legitimate operating conditions that may support exclusion of FMEs include, , but are not limited to: • Operation at or near auxiliary equipment operating limits (such as boiler
feed pumps, condensate pumps, pulverizers, and forced draft fans);
• Data telemetry failure. The Balancing Authority Compliance Enforcement Authority may request raw data from the Generator Owner as a substitute.
M10. Each Generator Owner shall have evidence that each of its generating units/generating facilities achieved a minimum rolling average of sustained Primary Frequency Response performance of at least 0.75 as described in Requirement R10. Each Generator Owner shall have documented evidence of any Frequency Measurable Events where generating unit performance should bewas excluded from the rolling average calculation.
C. Compliance 1. Compliance Monitoring Process
1.1. Compliance Enforcement Authority: “Compliance Enforcement Authority” means NERC or the Regional Entity, or any entity as otherwise designated by an Applicable Governmental Authority, in their respective roles of monitoring and/or enforcing compliance with mandatory and enforceable Reliability Standards in their respective jurisdictions.
1.2. Compliance Monitoring Period and Reset Time Frame: If a generating unit/generating facility completes a mitigation plan and implements corrective action(s) to meet requirements R9 and R10 of the standard, and if approved by the BA and Compliance Enforcement Authority, then the generating unit/generating facility may begin a new rolling event average performance on the next performance during an FME. This will count as the first event in the performance calculation and the entity will have an average frequency performance score after 12 successive months or eight events per R9 and R10.
BAL-001-TRE-21 — Primary Frequency Response in the ERCOT Region
Page 8 of 14
1.3. Evidence Retention: The following evidence retention period(s) identify the
period of time an entity is required to retain specific evidence to demonstrate compliance. For instances where the evidence retention period specified below is shorter than the time since the last audit, the Compliance Enforcement Authority may ask an entity to provide other evidence to show that it was compliant for the full-time period since the last audit.
The applicable entity shall keep data or evidence to show compliance as identified below unless directed by its Compliance Enforcement Authority to retain specific evidence for a longer period of time as part of an investigation.
The Balancing Authority, Generator Owner, and Generator Operator shall keep data or evidence to show compliance, as identified below, unless directed by its Compliance Enforcement Authority to retain specific evidence for a longer period of time as part of an investigation:
• The Balancing Authority shall retain a list of identified Frequency Measurable EventsFMEs and shall retain FME information since its last compliance audit for Requirement R1, Measure M1.
• The Balancing Authority shall retain all monthly PFR performance reports since its last compliance audit for Requirement R2, Measure M2.
• The Balancing Authority shall retain all annual IMFR calculations, and related methodology and criteria documents, relating to time periods since its last compliance audit for Requirement R3, Measure M3.
• The Balancing Authority shall retain all data and calculations relating to the Interconnection’s combined Frequency Response performance, and all evidence of actions taken to increase the Interconnection’s combined Frequency Response performance, since its last compliance audit for Requirements R4 and R5, Measures M4 and M5.
• Each Generator Operator shall retain evidence since its last compliance audit for Requirement R8, Measure M8.
• Each Generator Owner shall retain evidence since its last compliance audit for Requirements R6, R7, R9 and R10, Measures M6, M7, M9 and M10.
If an entity is found non-compliant, it shall retain information related to the non- compliance until found compliant, or for the duration specified above, whichever is longer.
The Compliance Enforcement Authority shall keep the last audit records and all requested and submitted subsequent records.
BAL-001-TRE-21 — Primary Frequency Response in the ERCOT Region
Page 9 of 14
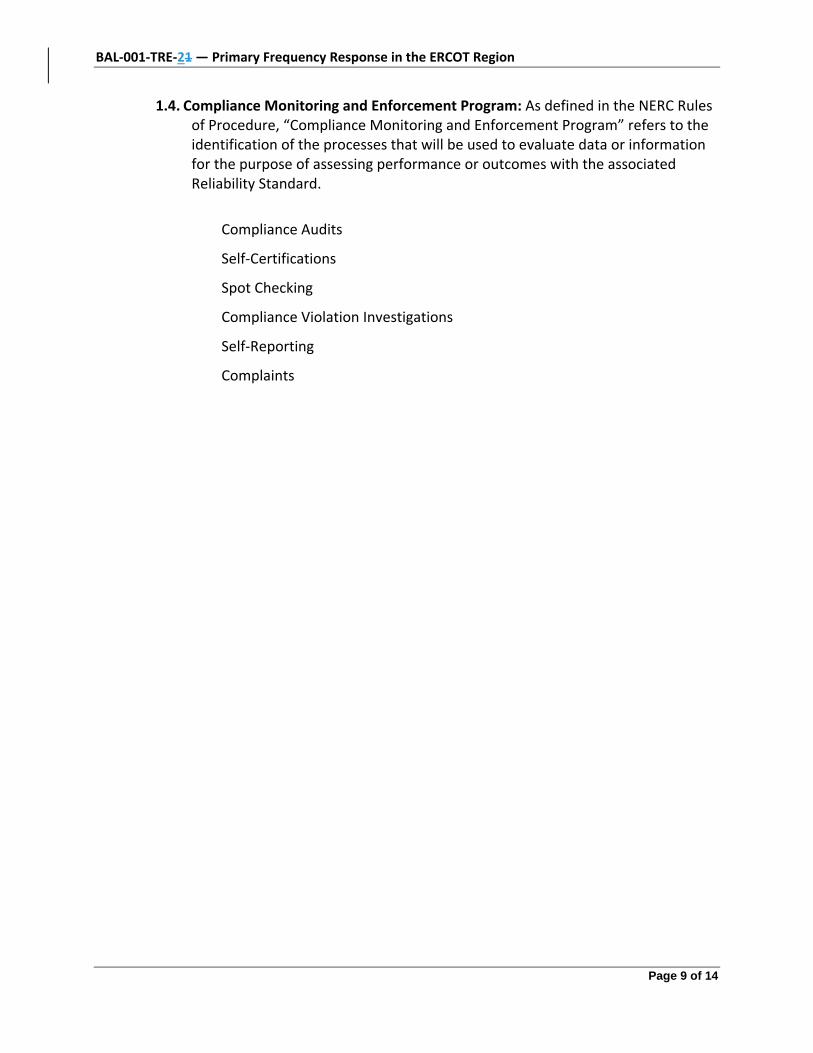
1.4. Compliance Monitoring and Enforcement Program: As defined in the NERC Rules of Procedure, “Compliance Monitoring and Enforcement Program” refers to the identification of the processes that will be used to evaluate data or information for the purpose of assessing performance or outcomes with the associated Reliability Standard.
Compliance Audits
Self-Certifications
Spot Checking
Compliance Violation Investigations
Self-Reporting
Complaints

BAL-001-TRE-21 — Primary Frequency Response in the ERCOT Region
Page 10 of 14
Violation Severity Levels
R # Violation Severity Levels
Lower VSL Moderate VSL High VSL Severe VSL
R1. The Balancing Authority reported an FME more than 14 days but less than 31 days after identification of the event.
The Balancing Authority reported an FME more than 30 days but less than 51 days after identification of the event.
The Balancing Authority reported an FME more than 50 days but less than 71 days after identification of the event.
The Balancing Authority reported an FME more than 70 days after identification of the event.
R2. The Balancing Authority submitted a monthly report more than one month but less than 51 days after the end of the reporting month.
The Balancing Authority submitted a monthly report more than 50 days but less than 71 days after the end of the reporting month.
The Balancing Authority submitted a monthly report more than 70 days but less than 91 days after the end of the reporting month.
The Balancing Authority failed to submit a monthly report within 90 days after the end of the reporting month.
R3. The Balancing Authority did not make the calculation and criteria for determination of the IMFR publicly available.
The Balancing Authority did not make the IMFR publicly available.
The Balancing Authority did not calculate the IMFR for the following year in December.
The Balancing Authority did not calculate the IMFR for a calendar year.
R4. N/A N/A The Balancing Authority did not make public the six-FME rolling average Interconnection combined Frequency Response by the end of the following month.
The Balancing Authority did not calculate the six-
FME rolling average Interconnection combined Frequency Response for any month in which an FME occurred.
R5. N/A N/A N/A The Balancing Authority did not take action to improve
BAL-001-TRE-21 — Primary Frequency Response in the ERCOT Region
Page 11 of 14
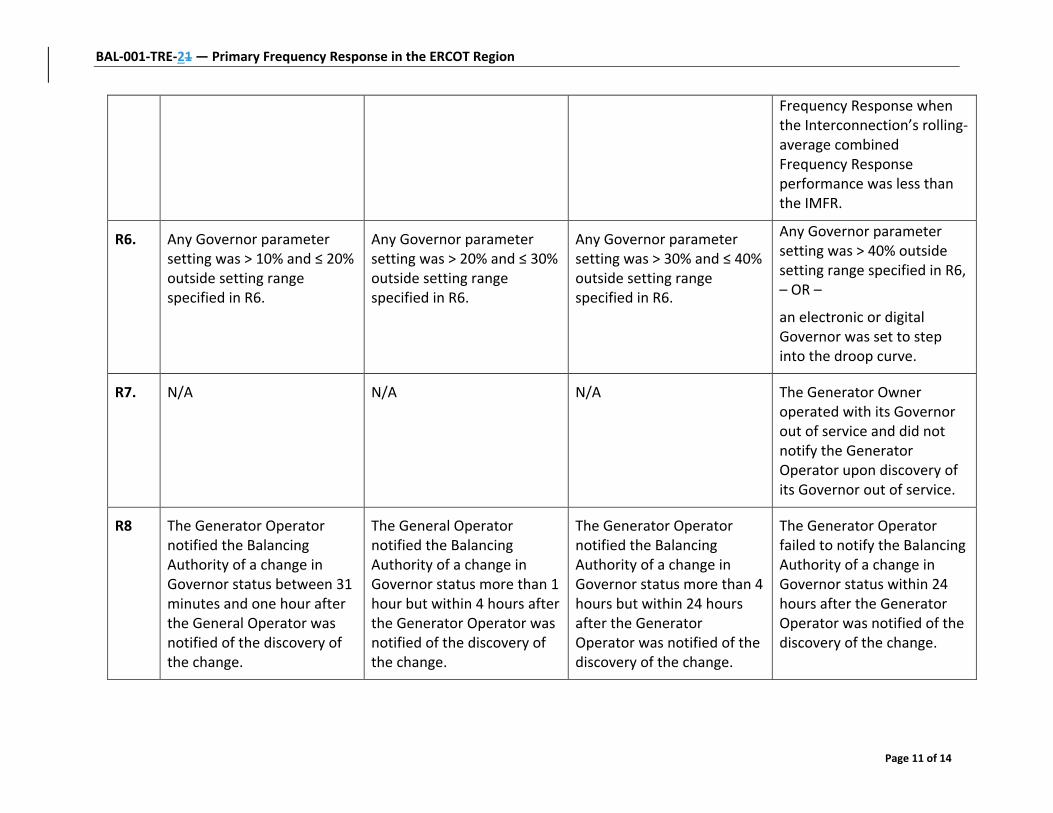
Frequency Response when the Interconnection’s rolling-average combined Frequency Response performance was less than the IMFR.
R6. Any Governor parameter setting was > 10% and ≤ 20% outside setting range specified in R6.
Any Governor parameter setting was > 20% and ≤ 30% outside setting range specified in R6.
Any Governor parameter setting was > 30% and ≤ 40% outside setting range specified in R6.
Any Governor parameter setting was > 40% outside setting range specified in R6, – OR –
an electronic or digital Governor was set to step into the droop curve.
R7. N/A N/A N/A The Generator Owner operated with its Governor out of service and did not notify the Generator Operator upon discovery of its Governor out of service.
R8 The Generator Operator notified the Balancing Authority of a change in Governor status between 31 minutes and one hour after the General Operator was notified of the discovery of the change.
The General Operator notified the Balancing Authority of a change in Governor status more than 1 hour but within 4 hours after the Generator Operator was notified of the discovery of the change.
The Generator Operator notified the Balancing Authority of a change in Governor status more than 4 hours but within 24 hours after the Generator Operator was notified of the discovery of the change.
The Generator Operator failed to notify the Balancing Authority of a change in Governor status within 24 hours after the Generator Operator was notified of the discovery of the change.

BAL-001-TRE-21 — Primary Frequency Response in the ERCOT Region
Page 12 of 14
R9 A Generator Owner’s rolling average initial Primary Frequency Response performance per R9 was < 0.75 and ≥ 0.65.
A Generator Owner’s rolling average initial Primary Frequency Response performance per R9 was < 0.65 and ≥ 0.55.
A Generator Owner’s rolling average initial Primary Frequency Response performance per R9 was < 0.55 and ≥ 0.45.
A Generator Owner’s rolling average initial Primary Frequency Response performance per R9 was < 0.45.
R10 A Generator Owner’s rolling average sustained Primary Frequency Response performance per R10 was < 0.75 and ≥ 0.65.
A Generator Owner’s rolling average sustained Primary Frequency Response performance per R10 was < 0.65 and ≥ 0.55.
A Generator Owner’s rolling average sustained Primary Frequency Response performance per R10 was < 0.55 and ≥ 0.45.
A Generator Owner’s rolling average sustained Primary Frequency Response performance per R10 was < 0.45.
D. Regional Variances
None
E. Associated Documents Regional Standard BAL-001-TRE-2 Implementation Plan
BAL-001-TRE-21 — Primary Frequency Response in the ERCOT Region
Page 13 of 14
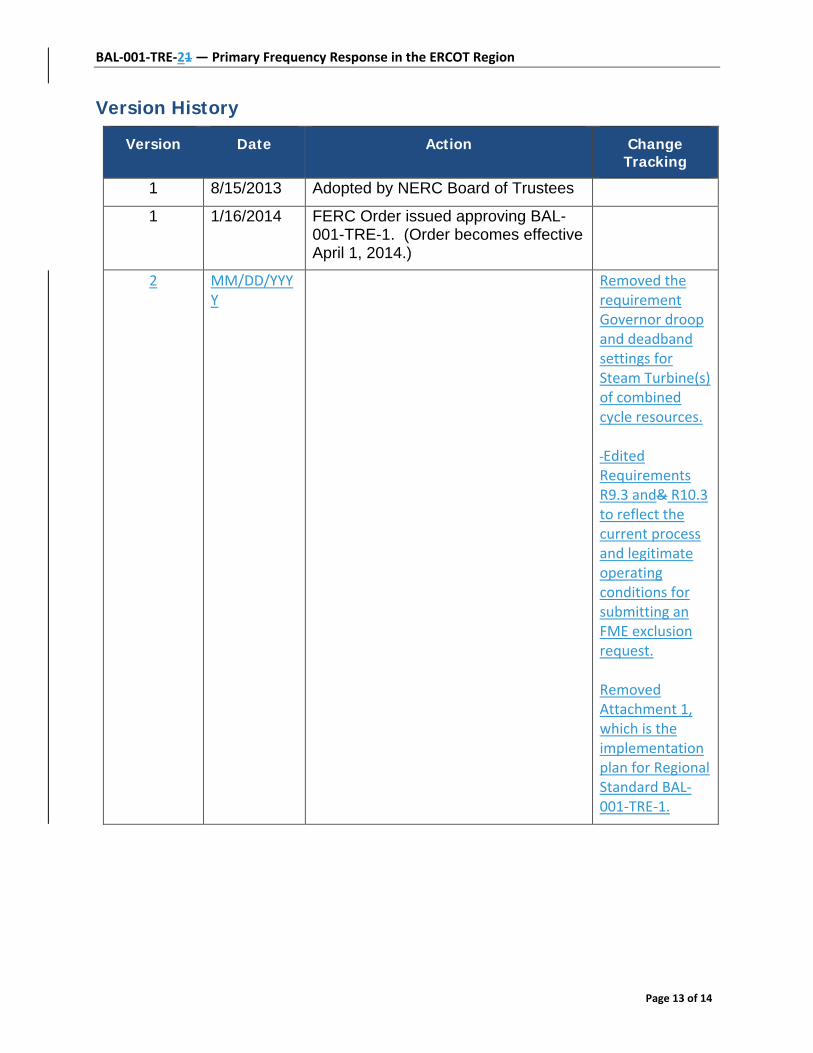
Version History
Version Date Action Change Tracking
1 8/15/2013 Adopted by NERC Board of Trustees
1 1/16/2014 FERC Order issued approving BAL-001-TRE-1. (Order becomes effective April 1, 2014.)
2 MM/DD/YYYY
Removed the requirement Governor droop and deadband settings for Steam Turbine(s) of combined cycle resources. Edited Requirements R9.3 and& R10.3 to reflect the current process and legitimate operating conditions for submitting an FME exclusion request. Removed Attachment 1, which is the implementation plan for Regional Standard BAL-001-TRE-1.

Page 14 of 14
Standard Attachments 1. Attachment 1 – Implementation Plan. 12. Attachment 12 – Primary Frequency Response Reference Document, including Flow Charts A
and B.
a. This document provides implementation details for calculating Primary Frequency Response performance as required by Requirements R2, R9 and R10. This reference document is a Texas RE-controlled document that is subject to revision by the Texas RE Board of Directors. It is not part of the FERC-approved regional standard.
b. The following process will be used to revise the Primary Frequency Response Reference
Document. A Primary Frequency Response Reference Document revision request may be submitted to the Texas RE Reliability Standards Manager, who will present the revision request to the Texas RE Member Representatives Committee (MRC) for consideration. The revision request will be posted in accordance with MRC procedures. The MRC shall discuss the revision request in a public meeting, and will accept and consider verbal and written comments pertaining to the request. The MRC will make a recommendation to the Texas RE Board of Directors, which may adopt the revision request, reject it, or adopt it with modifications. Any approved revision to the Primary Frequency Response Reference Document shall be filed with NERC and FERC for informational purposes.

BAL-001-TRE-21 — Primary Frequency Response in the ERCOT Region
Page 1 of 37
Attachment 12
Primary Frequency Response Reference Document
Texas Reliability Entity, Inc. BAL-001-TRE-12
Requirements R2, R9, and R10 Performance Metric Calculations
I. Introduction This Primary Frequency Response Reference Document provides a methodology for determining the Primary Frequency Response (PFR) performance of individual generating units/generating facilities following Frequency Measurable Events (FMEs) in accordance with Requirements R2, R9 and R10. Flowcharts in Attachment A (Initial PFR) and Attachment B (Sustained PFR) show the logic and calculations in graphical form, and they are considered part of this Primary Frequency Response Reference Document. Several Excel spreadsheets implementing the calculations described herein for various types of generating units are available1
for reference and use in understanding and performing these calculations. This Primary Frequency Response Reference Document is not considered to be a part of the regional standard. This document will beis maintained by Texas RE and will be subject to modifications as approved by the Texas RE Board of Directors, without being required to go through the formal Standard Development Process. Revision Process: The following process will be used to revise the Primary Frequency Response Reference Document. A Primary Frequency Response Reference Document revision request may be submitted to the Texas RE Reliability Standards Manager, who will present the revision request to the Texas RE Member Representatives Committee (MRC) for consideration. The MRC shall discuss the revision request in a public meeting, and will accept and consider verbal and written comments pertaining to the request. The MRC will make a recommendation to the Texas RE Board of Directors, which may adopt the revision request, reject it, or adopt it with modifications. Any approved revision to the Primary Frequency Response Reference Document shall be filed with NERC and FERC for informational purposes.
As used in this document the following terms are defined as shown:
High Sustained Limit (HSL) for a generating unit/generating facility: The limit established by the GO/GOP, continuously updatable in Real‐Time, that describes the maximum sustained energy production capability of a generating unit/generating facility.
Low Sustained Limit (LSL) for a generating unit/generating facility: The limit established by the GO/GOP, continuously updatable in Real‐Time, that describes the minimum sustained energy production capability of a generating unit/generating facility.
In this regional standard, the term “resource” is synonymous with “generating unit/generating facility”.
1 These spreadsheets are available at www.TexasRE.org.
BAL-001-TRE-21 — Primary Frequency Response in the ERCOT Region
Page 2 of 37
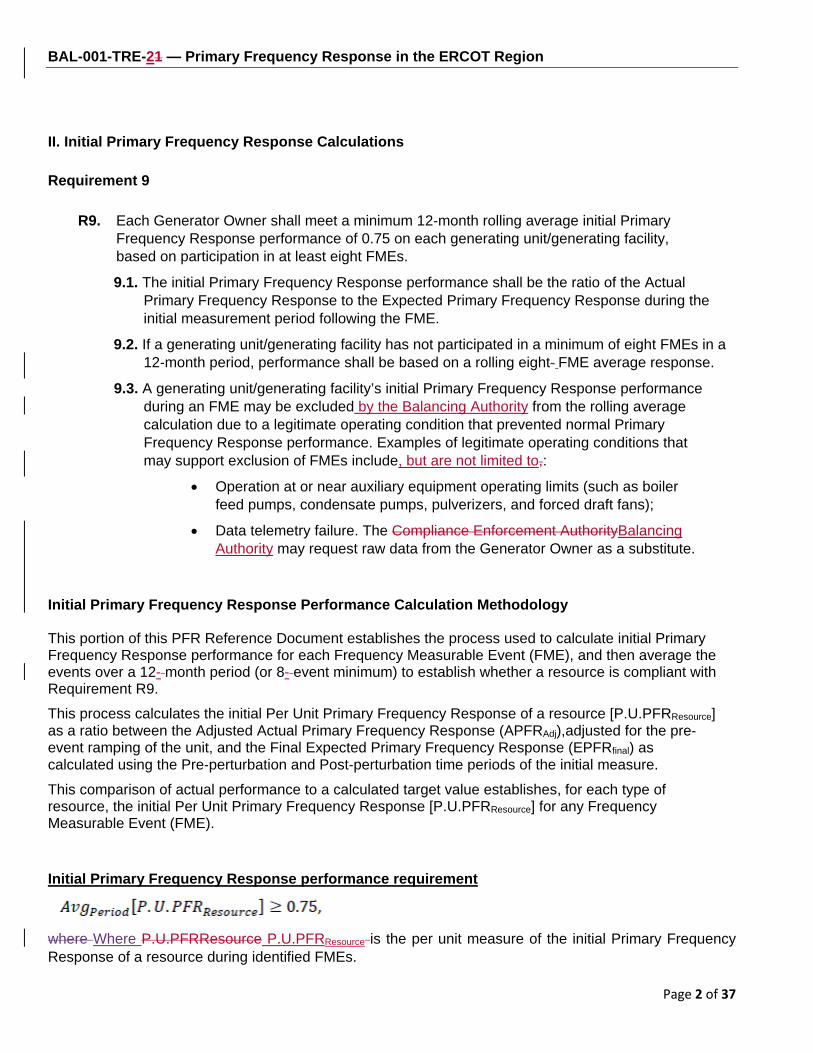
II. Initial Primary Frequency Response Calculations Requirement 9
R9. Each Generator Owner shall meet a minimum 12‐month rolling average initial Primary Frequency Response performance of 0.75 on each generating unit/generating facility, based on participation in at least eight FMEs.
9.1. The initial Primary Frequency Response performance shall be the ratio of the Actual Primary Frequency Response to the Expected Primary Frequency Response during the initial measurement period following the FME.
9.2. If a generating unit/generating facility has not participated in a minimum of eight FMEs in a 12‐month period, performance shall be based on a rolling eight‐ FME average response.
9.3. A generating unit/generating facility’s initial Primary Frequency Response performance during an FME may be excluded by the Balancing Authority from the rolling average calculation due to a legitimate operating condition that prevented normal Primary Frequency Response performance. Examples of legitimate operating conditions that may support exclusion of FMEs include, but are not limited to,:
• Operation at or near auxiliary equipment operating limits (such as boiler feed pumps, condensate pumps, pulverizers, and forced draft fans);
• Data telemetry failure. The Compliance Enforcement AuthorityBalancing Authority may request raw data from the Generator Owner as a substitute.
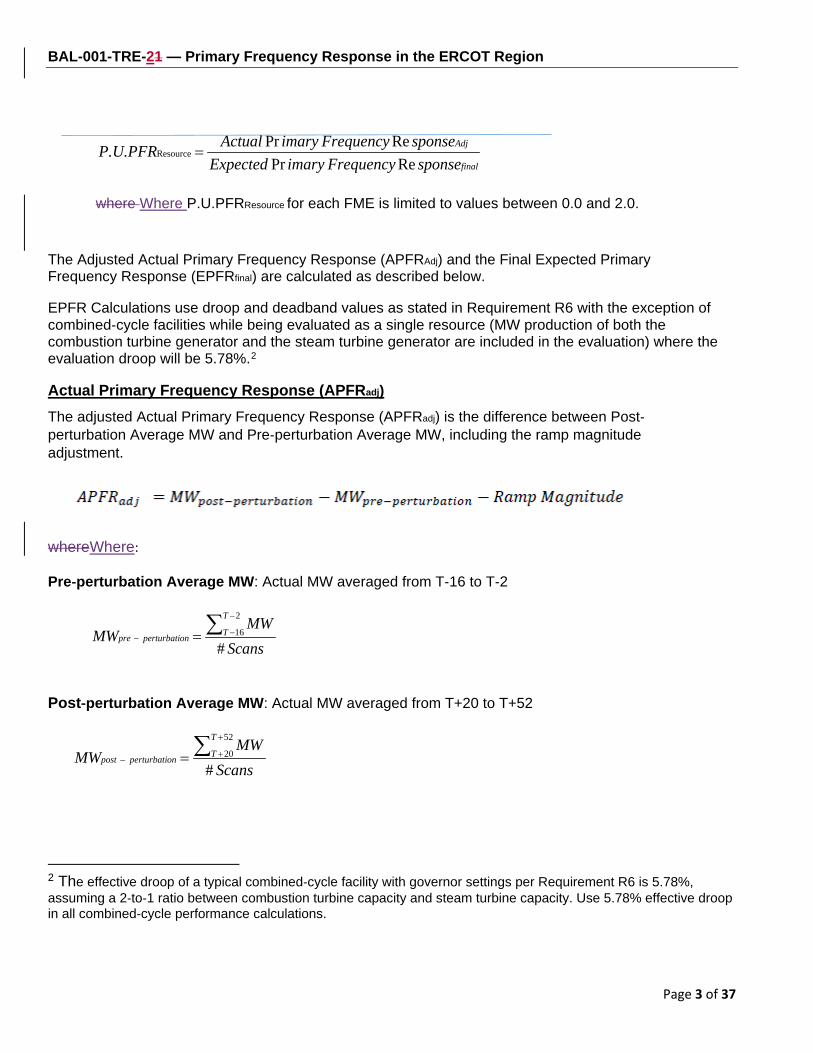
Initial Primary Frequency Response Performance Calculation Methodology This portion of this PFR Reference Document establishes the process used to calculate initial Primary Frequency Response performance for each Frequency Measurable Event (FME), and then average the events over a 12- month period (or 8- event minimum) to establish whether a resource is compliant with Requirement R9. This process calculates the initial Per Unit Primary Frequency Response of a resource [P.U.PFRResource] as a ratio between the Adjusted Actual Primary Frequency Response (APFRAdj),adjusted for the pre‐event ramping of the unit, and the Final Expected Primary Frequency Response (EPFRfinal) as calculated using the Pre‐perturbation and Post‐perturbation time periods of the initial measure. This comparison of actual performance to a calculated target value establishes, for each type of resource, the initial Per Unit Primary Frequency Response [P.U.PFRResource] for any Frequency Measurable Event (FME).
Initial Primary Frequency Response performance requirement
where Where P.U.PFRResource P.U.PFRResource is the per unit measure of the initial Primary Frequency Response of a resource during identified FMEs.
BAL-001-TRE-21 — Primary Frequency Response in the ERCOT Region
Page 3 of 37
final
Adj
sponseFrequencyimaryExpectedsponseFrequencyimaryActualP.U.PFR
RePrRePr
Resource =
where Where P.U.PFRResource for each FME is limited to values between 0.0 and 2.0.
The Adjusted Actual Primary Frequency Response (APFRAdj) and the Final Expected Primary Frequency Response (EPFRfinal) are calculated as described below.
EPFR Calculations use droop and deadband values as stated in Requirement R6 with the exception of combined‐cycle facilities while being evaluated as a single resource (MW production of both the combustion turbine generator and the steam turbine generator are included in the evaluation) where the evaluation droop will be 5.78%.2
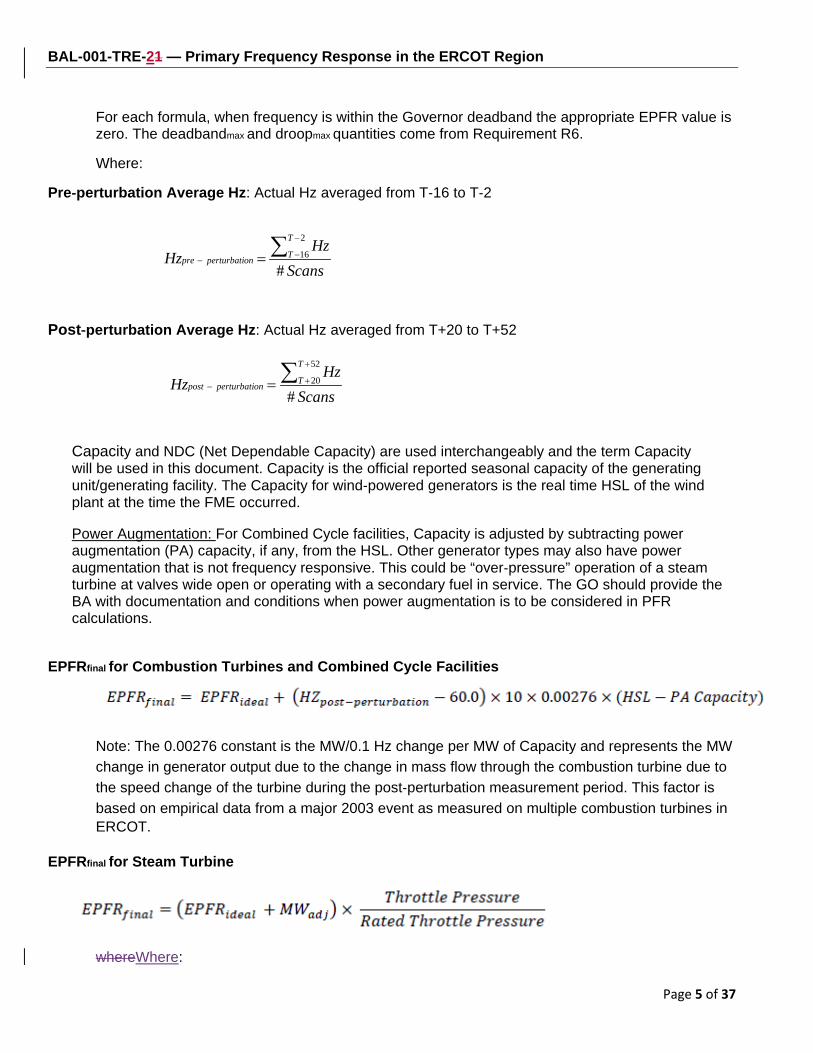
Actual Primary Frequency Response (APFRadj) The adjusted Actual Primary Frequency Response (APFRadj) is the difference between Post‐perturbation Average MW and Pre‐perturbation Average MW, including the ramp magnitude adjustment.
whereWhere:
Pre‐perturbation Average MW: Actual MW averaged from T‐16 to T‐2
ScansMW
MWT
Tonperturbatipre#
2
16∑ −
−− =
Post‐perturbation Average MW: Actual MW averaged from T+20 to T+52
ScansMW
MWT
Tonperturbatipost#
52
20∑ +
+− =
2 The effective droop of a typical combined‐cycle facility with governor settings per Requirement R6 is 5.78%, assuming a 2‐to‐1 ratio between combustion turbine capacity and steam turbine capacity. Use 5.78% effective droop in all combined‐cycle performance calculations.

BAL-001-TRE-21 — Primary Frequency Response in the ERCOT Region
Page 4 of 37
Ramp Adjustment: The Actual Primary Frequency Response number that is used to calculate P.U.PFR is adjusted for the ramp magnitude of the generating unit/generating facility during the pre‐perturbation minute. The ramp magnitude is subtracted from the APFR.
Ramp Magnitude = (MWT‐4 – MWT‐60)*0.59
(MWT‐4 – MWT‐60) represents the MW ramp of the generator resource/generator facility for a full minute prior to the event. The factor 0.59 adjusts this full minute ramp to represent the ramp that should have been achieved during the post‐perturbation measurement period.
Expected Primary Frequency Response (EPFR)
For all generator types, the ideal Expected Primary Frequency Response (EPFRideal) is calculated as the difference between the EPFRpost‐perturbation and the EPFRpre‐perturbation.
When the frequency is outside the Governor deadband and above 60Hz:
When the frequency is outside the Governor deadband and below 60Hz:
BAL-001-TRE-21 — Primary Frequency Response in the ERCOT Region
Page 5 of 37
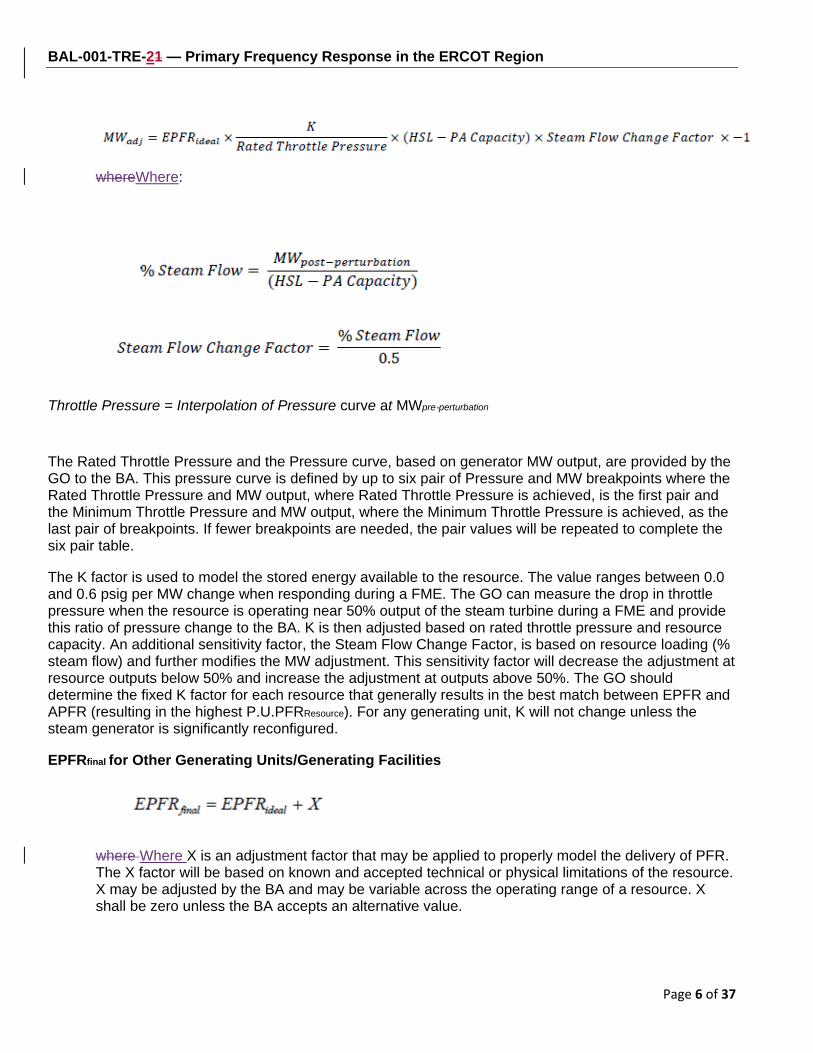
For each formula, when frequency is within the Governor deadband the appropriate EPFR value is zero. The deadbandmax and droopmax quantities come from Requirement R6.
Where:
Pre‐perturbation Average Hz: Actual Hz averaged from T‐16 to T‐2
ScansHz
HzT
Tonperturbatipre#
2
16∑ −
−− =
Post‐perturbation Average Hz: Actual Hz averaged from T+20 to T+52
ScansHz
HzT
Tonperturbatipost#
52
20∑ +
+− =
Capacity and NDC (Net Dependable Capacity) are used interchangeably and the term Capacity will be used in this document. Capacity is the official reported seasonal capacity of the generating unit/generating facility. The Capacity for wind‐powered generators is the real time HSL of the wind plant at the time the FME occurred.
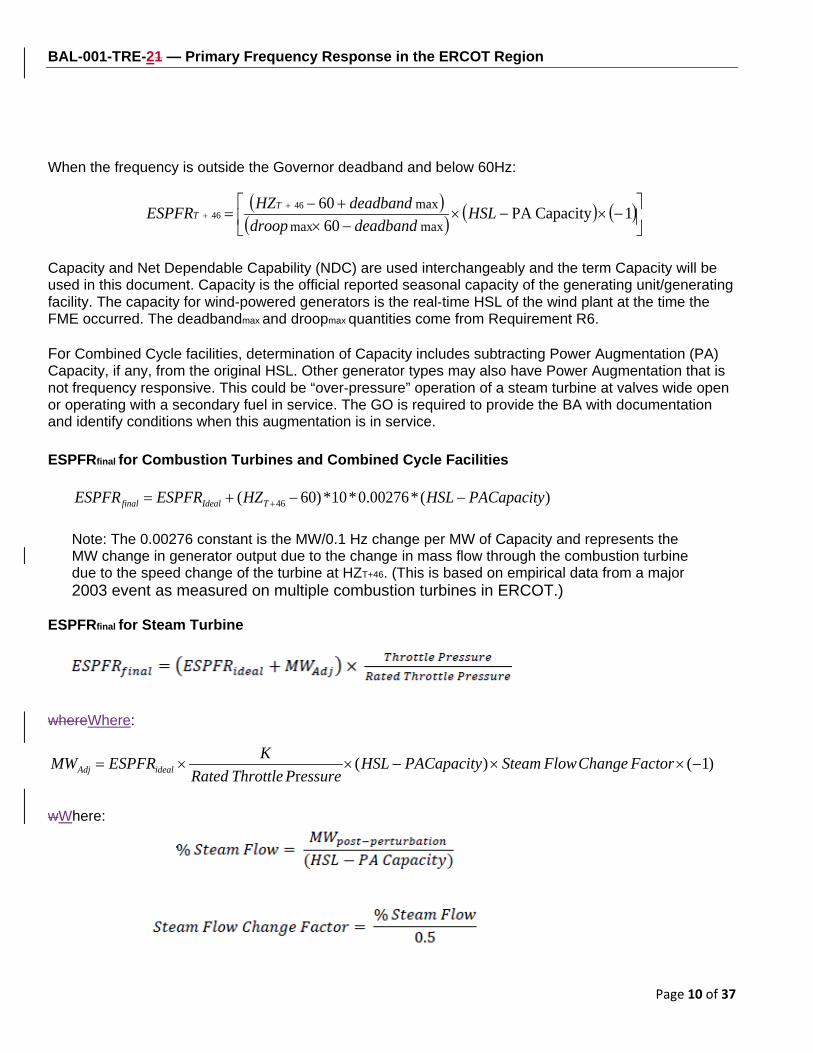
Power Augmentation: For Combined Cycle facilities, Capacity is adjusted by subtracting power augmentation (PA) capacity, if any, from the HSL. Other generator types may also have power augmentation that is not frequency responsive. This could be “over‐pressure” operation of a steam turbine at valves wide open or operating with a secondary fuel in service. The GO should provide the BA with documentation and conditions when power augmentation is to be considered in PFR calculations.
EPFRfinal for Combustion Turbines and Combined Cycle Facilities
Note: The 0.00276 constant is the MW/0.1 Hz change per MW of Capacity and represents the MW change in generator output due to the change in mass flow through the combustion turbine due to the speed change of the turbine during the post‐perturbation measurement period. This factor is based on empirical data from a major 2003 event as measured on multiple combustion turbines in ERCOT.
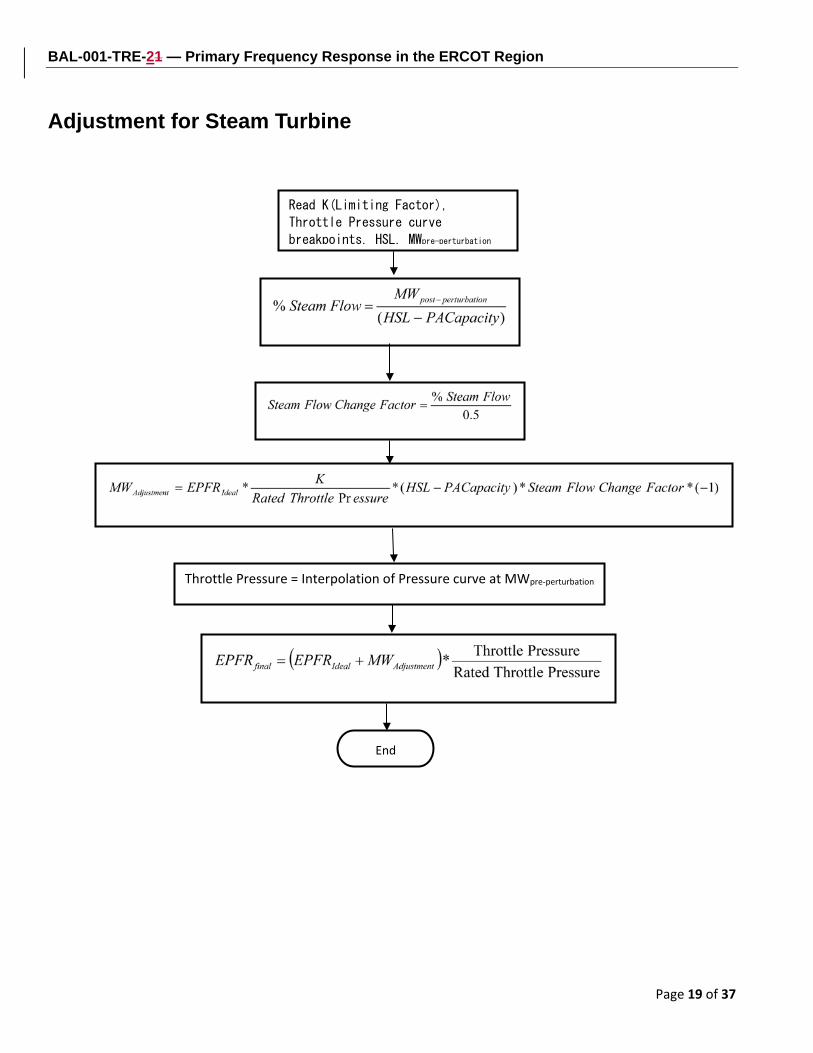
EPFRfinal for Steam Turbine
whereWhere:
BAL-001-TRE-21 — Primary Frequency Response in the ERCOT Region
Page 6 of 37
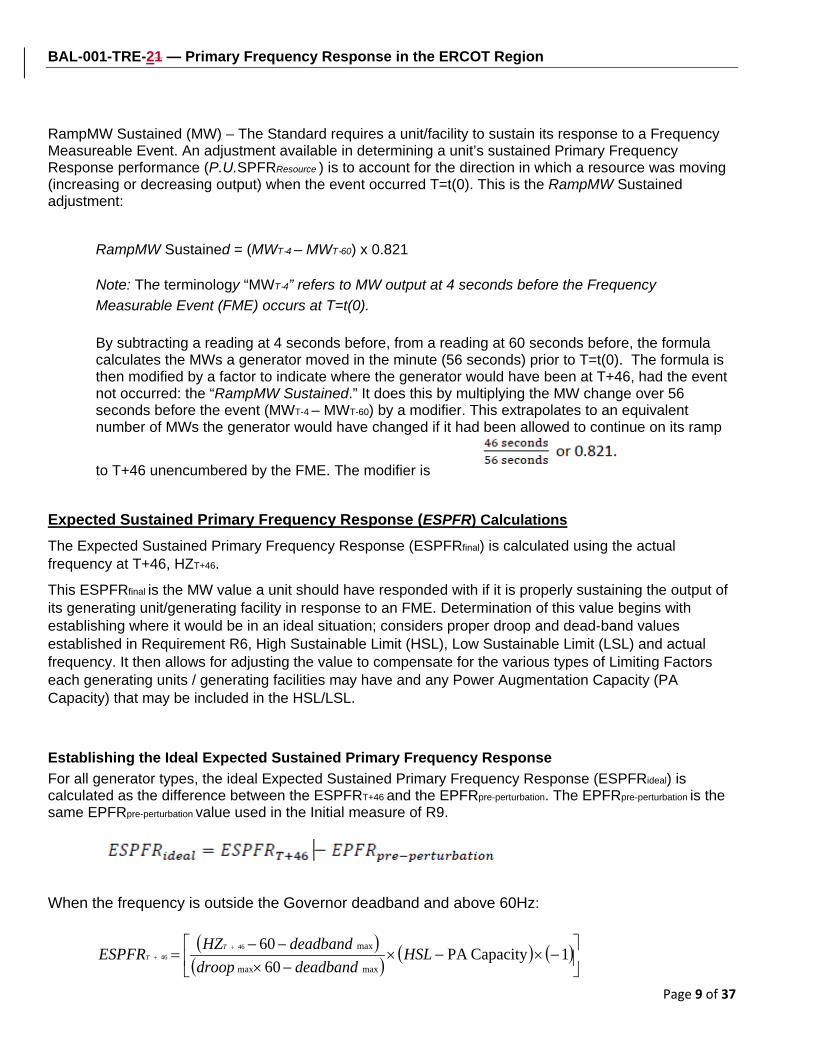
whereWhere:
Throttle Pressure = Interpolation of Pressure curve at MWpre‐perturbation
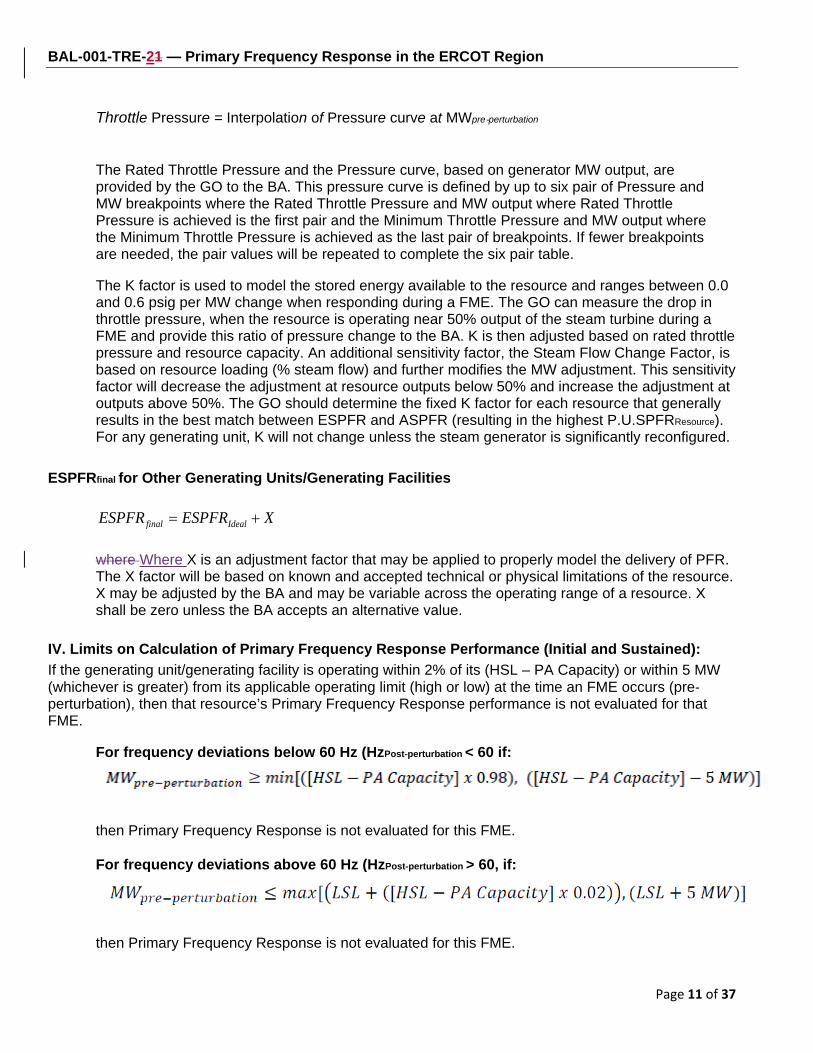
The Rated Throttle Pressure and the Pressure curve, based on generator MW output, are provided by the GO to the BA. This pressure curve is defined by up to six pair of Pressure and MW breakpoints where the Rated Throttle Pressure and MW output, where Rated Throttle Pressure is achieved, is the first pair and the Minimum Throttle Pressure and MW output, where the Minimum Throttle Pressure is achieved, as the last pair of breakpoints. If fewer breakpoints are needed, the pair values will be repeated to complete the six pair table.
The K factor is used to model the stored energy available to the resource. The value ranges between 0.0 and 0.6 psig per MW change when responding during a FME. The GO can measure the drop in throttle pressure when the resource is operating near 50% output of the steam turbine during a FME and provide this ratio of pressure change to the BA. K is then adjusted based on rated throttle pressure and resource capacity. An additional sensitivity factor, the Steam Flow Change Factor, is based on resource loading (% steam flow) and further modifies the MW adjustment. This sensitivity factor will decrease the adjustment at resource outputs below 50% and increase the adjustment at outputs above 50%. The GO should determine the fixed K factor for each resource that generally results in the best match between EPFR and APFR (resulting in the highest P.U.PFRResource). For any generating unit, K will not change unless the steam generator is significantly reconfigured.
EPFRfinal for Other Generating Units/Generating Facilities
where Where X is an adjustment factor that may be applied to properly model the delivery of PFR. The X factor will be based on known and accepted technical or physical limitations of the resource. X may be adjusted by the BA and may be variable across the operating range of a resource. X shall be zero unless the BA accepts an alternative value.

BAL-001-TRE-21 — Primary Frequency Response in the ERCOT Region
Page 7 of 37
III. Sustained Primary Frequency Response Calculations Requirement 10 R10. The Generator Owner shall meet a minimum 12‐month rolling average sustained Primary
Frequency Response performance of 0.75 on each generating unit/generating facility, based on participation in at least eight FMEs.
10.1 The sustained Primary Frequency Response performance shall be the ratio of the Actual Primary Frequency Response to the Expected Primary Frequency Response during the sustained measurement period following the FME.
10.2 If a generating unit/generating facility has not participated in a minimum of eight FMEs in a 12‐month period, performance shall be based on a rolling eight‐FME average.
10.3 A generating unit/generating facility’s sustained Primary Frequency Response performance
during an FME may be excluded by the Balancing Authority from the rolling average calculation due to a legitimate operating condition that prevented normal Primary Frequency Response performance. Examples of legitimate operating conditions that may support exclusion of FMEs include, but are not limited to,: • Operation at or near auxiliary equipment operating limits (such as boiler feed
pumps, condensate pumps, pulverizers, and forced draft fans);
• Data telemetry failure. The Balancing Authority Compliance Enforcement Authority may request raw data from the Generator Owner as a substitute.
Sustained Primary Frequency Response Performance Calculation Methodology This portion of this PFR Reference Document establishes the process used to calculate sustained Primary Frequency Response performance for each Frequency Measurable Event (FME), and then average the events over a 12- month period (or 8- event minimum) to establish whether a resource is compliant with Requirement R10. This process calculates the Per Unit Sustained Primary Frequency Response of a resource [P.U.SPFRResource] as a ratio between the maximum actual unit response at any time during the period from T+46 to T+60, adjusted for the pre‐event ramping of the unit, and the Final Expected Primary Frequency Response (EPFR) value at time T+46.3
This comparison of actual performance to a calculated target value establishes, for each type of resource, the Per Unit Sustained Primary Frequency Response [P.U.SPFRResource] for any Frequency Measurable Event (FME). Sustained Primary Frequency Response performance requirement: The standard requires an average performance over a period of 12 months (including at least 8 measured events) that is ≥ 0.75.
3 The time designations used in this section refer to relative time after an FME occurs. For example, “T+46” refers to 46 seconds after the frequency deviation occurred.

BAL-001-TRE-21 — Primary Frequency Response in the ERCOT Region
Page 8 of 37
• the average of each resource’s sustained Primary Frequency Response performances [P.U.SPFRResource] during all of the assessable Frequency Measurable Events (FMEs), for the most recent rolling 12 month period; or
• if the unit has not experienced at least 8 assessable FMEs in the most recent 12 month period, the average of the unit’s last 8 sustained Primary Frequency Response performances when the unit provided frequency response during a Frequency Measurable Event.
Sustained Primary Frequency Response Calculation (P.U.SPFR)
final
AdjP.U.PFRResponseFrequencyPrimarySustainedExpected
ResponseFrequencyPrimarySustainedActualResource =
P.U.SPFRResource is the per unit (P.U.) measure of the sustained Primary Frequency Response of a resource during identified Frequency Measurable Events. For any given event P.U.SPFRResource for each FME will be limited to values between 0.0 and 2.0. Actual Sustained Primary Frequency Response (ASPFR) Calculations
whereWhere:
Pre‐perturbation Average MW: Actual MW averaged from T‐16 to T‐2.
ScansMW
MWT
Tonperturbatipre#
2
16∑ −
−− =
andAnd: MWMaximumResponse = maximum MW value telemetered by a unit from T+46 through T+60 during low frequency events and the minimum MW value telemetered by a unit from T+46 through T+60 during a high frequency event. Actual Sustained Primary Frequency Response, Adjusted (ASPFRAdj)
BAL-001-TRE-21 — Primary Frequency Response in the ERCOT Region
Page 9 of 37
RampMW Sustained (MW) – The Standard requires a unit/facility to sustain its response to a Frequency Measureable Event. An adjustment available in determining a unit’s sustained Primary Frequency Response performance (P.U.SPFRResource ) is to account for the direction in which a resource was moving (increasing or decreasing output) when the event occurred T=t(0). This is the RampMW Sustained adjustment:
RampMW Sustained = (MWT‐4 – MWT‐60) x 0.821
Note: The terminology “MWT‐4” refers to MW output at 4 seconds before the Frequency Measurable Event (FME) occurs at T=t(0). By subtracting a reading at 4 seconds before, from a reading at 60 seconds before, the formula calculates the MWs a generator moved in the minute (56 seconds) prior to T=t(0). The formula is then modified by a factor to indicate where the generator would have been at T+46, had the event not occurred: the “RampMW Sustained.” It does this by multiplying the MW change over 56 seconds before the event (MWT‐4 – MWT‐60) by a modifier. This extrapolates to an equivalent number of MWs the generator would have changed if it had been allowed to continue on its ramp
to T+46 unencumbered by the FME. The modifier is
Expected Sustained Primary Frequency Response (ESPFR) Calculations The Expected Sustained Primary Frequency Response (ESPFRfinal) is calculated using the actual frequency at T+46, HZT+46.
This ESPFRfinal is the MW value a unit should have responded with if it is properly sustaining the output of its generating unit/generating facility in response to an FME. Determination of this value begins with establishing where it would be in an ideal situation; considers proper droop and dead‐band values established in Requirement R6, High Sustainable Limit (HSL), Low Sustainable Limit (LSL) and actual frequency. It then allows for adjusting the value to compensate for the various types of Limiting Factors each generating units / generating facilities may have and any Power Augmentation Capacity (PA Capacity) that may be included in the HSL/LSL.
Establishing the Ideal Expected Sustained Primary Frequency Response For all generator types, the ideal Expected Sustained Primary Frequency Response (ESPFRideal) is calculated as the difference between the ESPFRT+46 and the EPFRpre‐perturbation. The EPFRpre‐perturbation is the same EPFRpre-perturbation value used in the Initial measure of R9.
When the frequency is outside the Governor deadband and above 60Hz:
( )( ) ( ) ( )
−×−×
−×−−
=+
+ 1Capacity PA60
60maxmax
max4646 HSL
deadbanddroopdeadbandHZESPFR T
T
BAL-001-TRE-21 — Primary Frequency Response in the ERCOT Region
Page 10 of 37
When the frequency is outside the Governor deadband and below 60Hz:
( )( ) ( ) ( )
−×−×
−×+−
=+
+ 1CapacityPA 60
60maxmax
max4646 HSL
deadbanddroopdeadbandHZESPFR T
T
Capacity and Net Dependable Capability (NDC) are used interchangeably and the term Capacity will be used in this document. Capacity is the official reported seasonal capacity of the generating unit/generating facility. The capacity for wind‐powered generators is the real‐time HSL of the wind plant at the time the FME occurred. The deadbandmax and droopmax quantities come from Requirement R6. For Combined Cycle facilities, determination of Capacity includes subtracting Power Augmentation (PA) Capacity, if any, from the original HSL. Other generator types may also have Power Augmentation that is not frequency responsive. This could be “over‐pressure” operation of a steam turbine at valves wide open or operating with a secondary fuel in service. The GO is required to provide the BA with documentation and identify conditions when this augmentation is in service.
ESPFRfinal for Combustion Turbines and Combined Cycle Facilities
)(*00276.0*10*)60( 46 PACapacityHSLHZESPFRESPFR TIdealfinal −−+= +
Note: The 0.00276 constant is the MW/0.1 Hz change per MW of Capacity and represents the MW change in generator output due to the change in mass flow through the combustion turbine due to the speed change of the turbine at HZT+46. (This is based on empirical data from a major 2003 event as measured on multiple combustion turbines in ERCOT.)
ESPFRfinal for Steam Turbine
whereWhere:
)1()(r
−××−××= FactorChangeFlowSteamPACapacityHSLessurePThrottleRated
KESPFRMW idealAdj
wWhere:
BAL-001-TRE-21 — Primary Frequency Response in the ERCOT Region
Page 11 of 37
Throttle Pressure = Interpolation of Pressure curve at MWpre‐perturbation
The Rated Throttle Pressure and the Pressure curve, based on generator MW output, are provided by the GO to the BA. This pressure curve is defined by up to six pair of Pressure and MW breakpoints where the Rated Throttle Pressure and MW output where Rated Throttle Pressure is achieved is the first pair and the Minimum Throttle Pressure and MW output where the Minimum Throttle Pressure is achieved as the last pair of breakpoints. If fewer breakpoints are needed, the pair values will be repeated to complete the six pair table.
The K factor is used to model the stored energy available to the resource and ranges between 0.0 and 0.6 psig per MW change when responding during a FME. The GO can measure the drop in throttle pressure, when the resource is operating near 50% output of the steam turbine during a FME and provide this ratio of pressure change to the BA. K is then adjusted based on rated throttle pressure and resource capacity. An additional sensitivity factor, the Steam Flow Change Factor, is based on resource loading (% steam flow) and further modifies the MW adjustment. This sensitivity factor will decrease the adjustment at resource outputs below 50% and increase the adjustment at outputs above 50%. The GO should determine the fixed K factor for each resource that generally results in the best match between ESPFR and ASPFR (resulting in the highest P.U.SPFRResource). For any generating unit, K will not change unless the steam generator is significantly reconfigured.
ESPFRfinal for Other Generating Units/Generating Facilities
XESPFRESPFR Idealfinal +=
where Where X is an adjustment factor that may be applied to properly model the delivery of PFR. The X factor will be based on known and accepted technical or physical limitations of the resource. X may be adjusted by the BA and may be variable across the operating range of a resource. X shall be zero unless the BA accepts an alternative value.
IV. Limits on Calculation of Primary Frequency Response Performance (Initial and Sustained): If the generating unit/generating facility is operating within 2% of its (HSL – PA Capacity) or within 5 MW (whichever is greater) from its applicable operating limit (high or low) at the time an FME occurs (pre‐perturbation), then that resource’s Primary Frequency Response performance is not evaluated for that FME.
For frequency deviations below 60 Hz (HzPost‐perturbation < 60 if:
then Primary Frequency Response is not evaluated for this FME.
For frequency deviations above 60 Hz (HzPost‐perturbation > 60, if:
then Primary Frequency Response is not evaluated for this FME.

BAL-001-TRE-21 — Primary Frequency Response in the ERCOT Region
Page 12 of 37
Final Expected Primary Frequency Response (EPFRfinal) is greater than Operating Margin: Caps and limits exist for resources operating with adequate reserve margin to be evaluated (at least 2% of (HSL less PA Capacity) or 5 MW), but with Expected Primary Frequency Responsefinal greater than the actual margin available.
1. The P.U.PFRResource will be set to the greater of 0.75 or the calculated P.U.PFRResource if all of the following conditions are met:
a. The generating unit/generating facility’s pre‐perturbation operating margin (appropriate for the frequency deviation direction) is greater than 2% of its (HSL less PA Capacity) and greater than 5 MW; and
b. The Expected Primary Frequency ResponsefFinal is greater than the generating unit/generating facility’s available frequency responsive Capacity4; and
c. The generating unit/generating facility’s APFRadj response is in the correct direction.
2. When calculation of the P.U.PFRResource uses the resource’s (HSL less PA Capacity) as the maximum expected output, the calculated P.U.PFRResource will not be greater than 1.0.
3. When calculation of the P.U.PFRResource uses the resource’s LSL as the minimum expected output, the calculated P.U.PFRResource will not be greater than 1.0.
4. If the APFRAdj is in the wrong direction, then P.U.PFRResource is 0.0.
5. These caps and limits apply to both the Initial and Sustained Primary Frequency Response measures.
4 In this circumstance, when frequency is below 60 Hz, the EPFRfinal is set to operating margin based on HSL (adjusted for any augmentation capacity) AND when frequency is above 60 Hz, the EPFRfinal is set to operating margin based on LSL for the purpose of calculating PUPFRresource.
BAL-001-TRE-21 — Primary Frequency Response in the ERCOT Region
Page 13 of 37
Attachment A to Primary Frequency Response Reference Document
Initial Primary Frequency Response Methodology for BAL-001-TRE-21

BAL-001-TRE-21 — Primary Frequency Response in the ERCOT Region
Page 14 of 37
Primary Frequency Response Measurement and Rolling Average Calculation – Initial Response PA=Power Augmentation HSL=High Sustained Limit
Read Deadband, Droop, HSL, PA Capacity, Frequency and Resource
MW and Resource MW
Calculate Ramp Magnitude
Calculate Expected Primary Frequency
Response
Calculate Actual Primary Frequency
Response
Calculate P.U. Primary Frequency Response
Calculate P.U. Primary Frequency Response
Rolling Average
Is Rolling Average ≥ 0.75
Pass R9
Fail R9
Yes
No
End

BAL-001-TRE-21 — Primary Frequency Response in the ERCOT Region
Page 15 of 37
Pre/Post-Perturbation Average MW and Average Frequency Calculations
Read Actual MW &
Frequency
Calculate Pre-Perturbation average for MW and Frequency
End
Calculate Post-Perturbation average for MW and Frequency

BAL-001-TRE-21 — Primary Frequency Response in the ERCOT Region
Page 16 of 37
Ramp Magnitude Calculation
(MWT-4 – MWT-60) represents the MW ramp of the generator resource/generator facility for a full minute prior to the event. The factor 0.59 adjusts this full minute ramp to represent the ramp that should have been achieved during the post-perturbation measurement period.
Actual Primary Frequency Response (APFRAdj)
Ramp Magnitude = (MWT-4 – MWT-60)*0.59
End
APFRAdj = MWpost-perturbation – MWpre-perturbation – Ramp Magnitude
End

BAL-001-TRE-21 — Primary Frequency Response in the ERCOT Region
Page 17 of 37
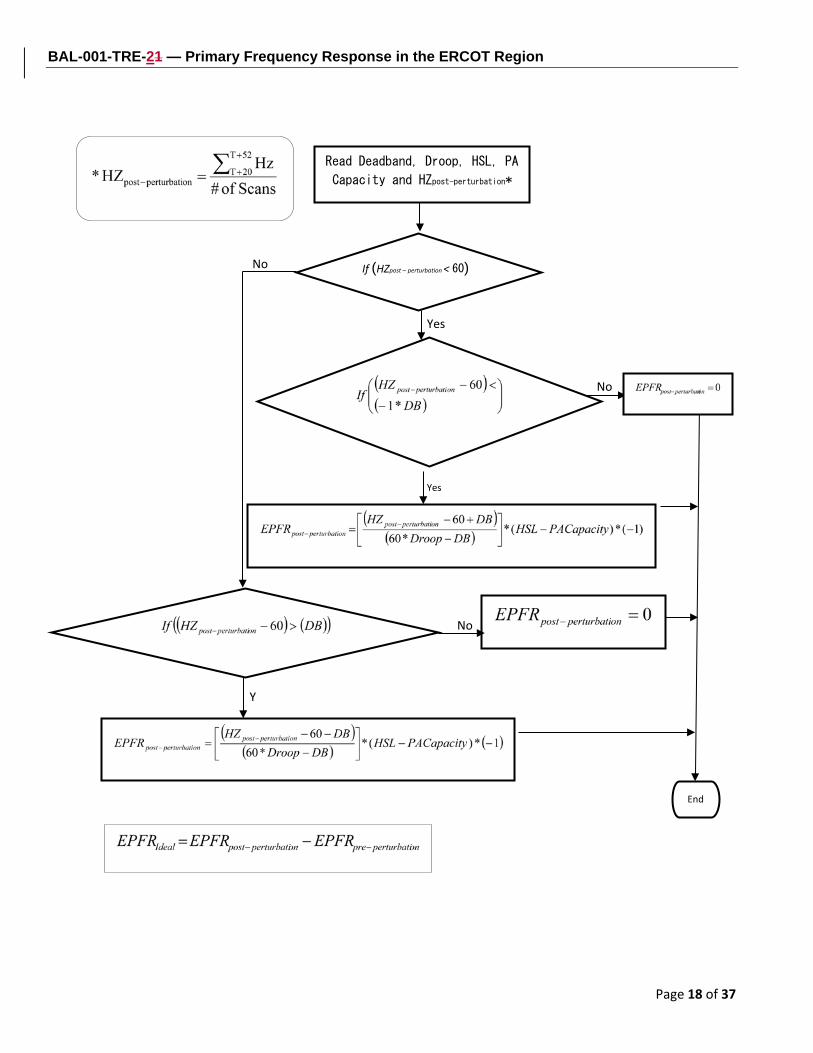
Expected Primary Frequency Response Calculation Use the maximum droop and maximum deadband as required by R6. For Combined Cycle Facility evaluation as a single resource (includes MW production of the steam turbine generator), the EPFR will use 5.78% droop in all calculations.
Read Deadband, Droop, HSL, PA
Capacity and HZpre-perturbation*
No
End
If (HZpre – perturbation < 60)
Yes
Yes
No
Yes
No
BAL-001-TRE-21 — Primary Frequency Response in the ERCOT Region
Page 18 of 37
Read Deadband, Droop, HSL, PA
Capacity and HZpost-perturbation*
No
End
If (HZpost – perturbation < 60)
Yes
Yes
No
Y
No
BAL-001-TRE-21 — Primary Frequency Response in the ERCOT Region
Page 19 of 37
Adjustment for Steam Turbine
Read K(Limiting Factor),
Throttle Pressure curve
breakpoints, HSL, MWpre-perturbation
End
Throttle Pressure = Interpolation of Pressure curve at MWpre-perturbation
BAL-001-TRE-21 — Primary Frequency Response in the ERCOT Region
Page 20 of 37
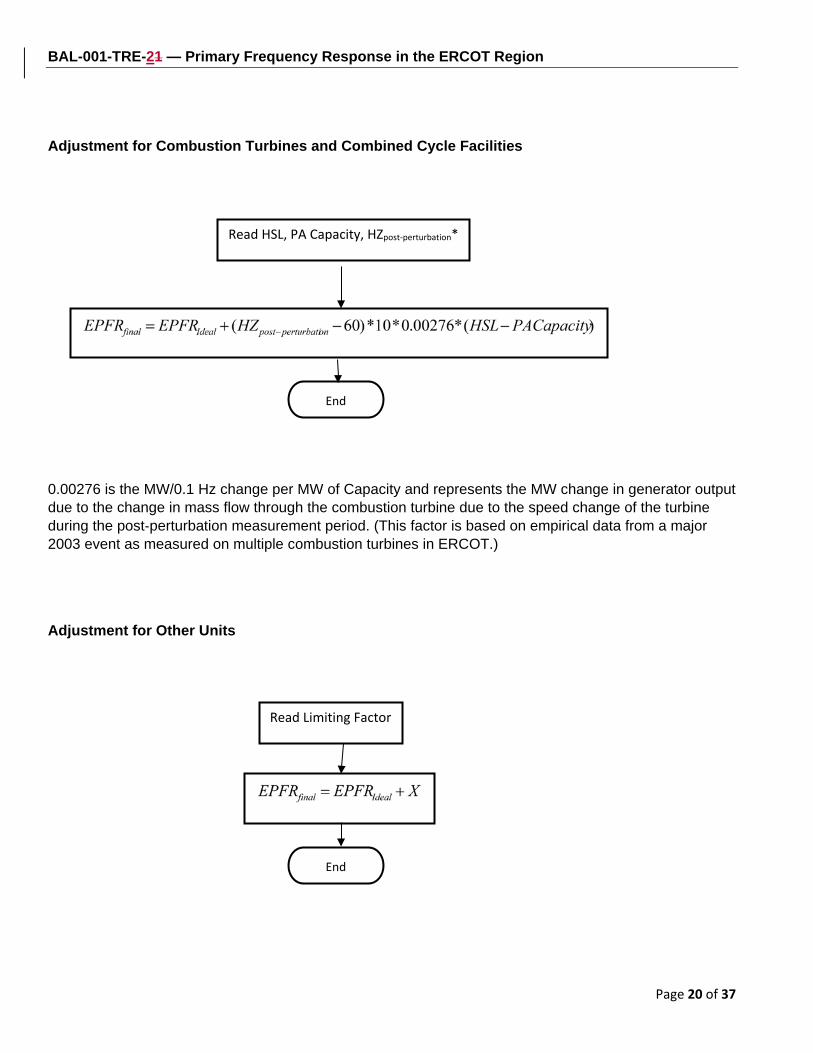
Adjustment for Combustion Turbines and Combined Cycle Facilities
0.00276 is the MW/0.1 Hz change per MW of Capacity and represents the MW change in generator output due to the change in mass flow through the combustion turbine due to the speed change of the turbine during the post‐perturbation measurement period. (This factor is based on empirical data from a major 2003 event as measured on multiple combustion turbines in ERCOT.)
Adjustment for Other Units
End
Read HSL, PA Capacity, HZpost-perturbation*
End
Read Limiting Factor

BAL-001-TRE-21 — Primary Frequency Response in the ERCOT Region
Page 21 of 37
Scansof#HZ
HZ*52T
20T Actualonperturbatipost
∑ +
+− =
This adjustment Factor X will be developed to properly model the delivery of PFR due to known and approved technical limitations of the resource. X may be adjusted by the BA and may be variable across the operating range of a resource.

BAL-001-TRE-21 — Primary Frequency Response in the ERCOT Region
Page 22 of 37
P.U. Initial Primary Frequency Response Calculation
BAL-001-TRE-21 — Primary Frequency Response in the ERCOT Region
Page 23 of 37
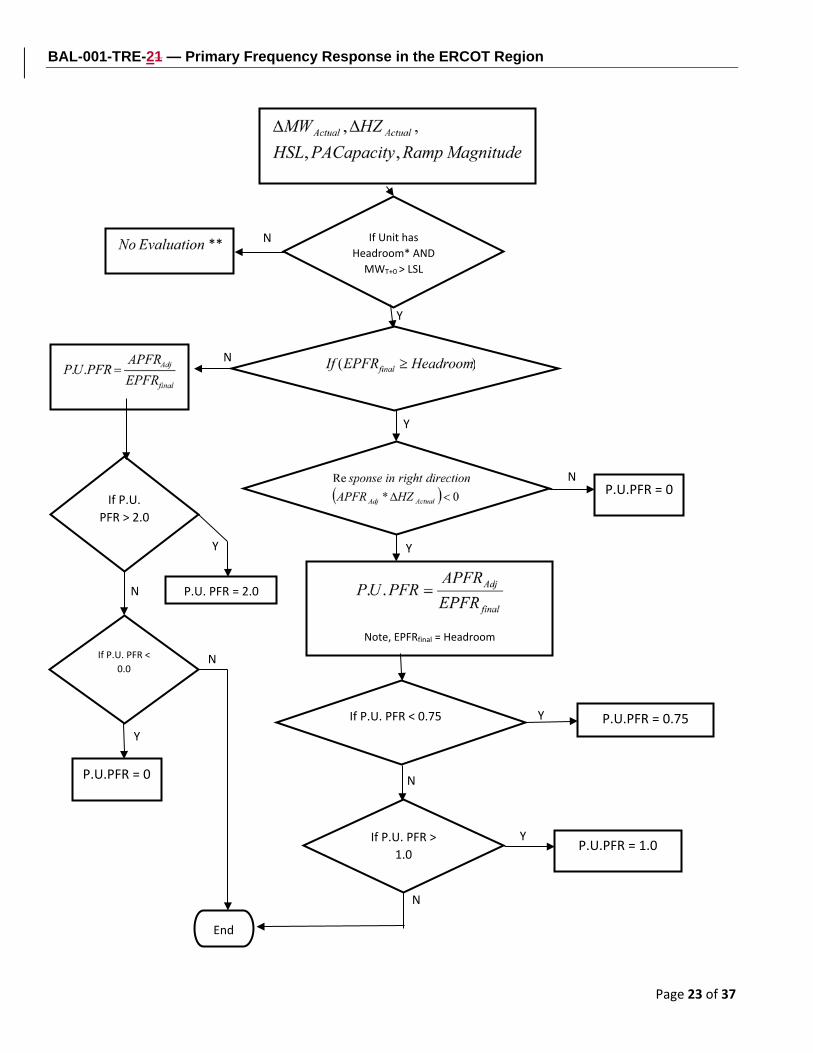
If P.U. PFR < 0.75
N
End
If Unit has Headroom* AND
MWT+0 > LSL
Y
P.U.PFR = 0
N
N
P.U. PFR = 2.0 N
If P.U. PFR > 2.0
If P.U. PFR < 0.0
Y
P.U.PFR = 0
**
Note, EPFRfinal = Headroom
Y
N
N
If P.U. PFR > 1.0
YY
Y
P.U.PFR = 0.75
P.U.PFR = 1.0
N
Y

BAL-001-TRE-21 — Primary Frequency Response in the ERCOT Region
Page 24 of 37
*Check for adequate up headroom, low frequency events. Headroom must be greater than either 5MW or 2% of (HSL less PA Capacity), whichever is larger. If a unit does not have adequate up headroom, the unit is considered operating at full capacity and will not be evaluated for low frequency events.
Check for adequate down headroom, high frequency events. Headroom must be greater than either 5MW or 2% of (HSL less PA Capacity), whichever is larger. If a unit does not have adequate down headroom, the unit is considered operating at low capacity and will not be evaluated for high frequency events.
For low frequency events:
For high frequency events:
**No further evaluation is required for Sustained Primary Frequency Response. This event will not be included in the Rolling Average calculation of either Initial or Sustained Primary Frequency Response.
T = Time in Seconds

BAL-001-TRE-21 — Primary Frequency Response in the ERCOT Region
Page 25 of 37
Attachment B to Primary Frequency Response Reference Document
Sustained Primary Frequency Response Methodology for BAL-001-TRE-21

BAL-001-TRE-21 — Primary Frequency Response in the ERCOT Region
Page 26 of 37
Primary Frequency Response Measurement and Rolling Average Calculation–Sustained Response
Read Deadband, Droop, HSL, PA Capacity, Frequency
and Resource
Calculate Ramp Magnitude
Calculate Expected Primary Frequency
Response
Calculate Actual Primary
Calculate P.U. Primary
Calculate P.U. Primary Frequency Response
Rolling Average
Is Rolling Average ≥
0.75
Pass R10
Fail R10
Yes
No
End
BAL-001-TRE-21 — Primary Frequency Response in the ERCOT Region
Page 27 of 37
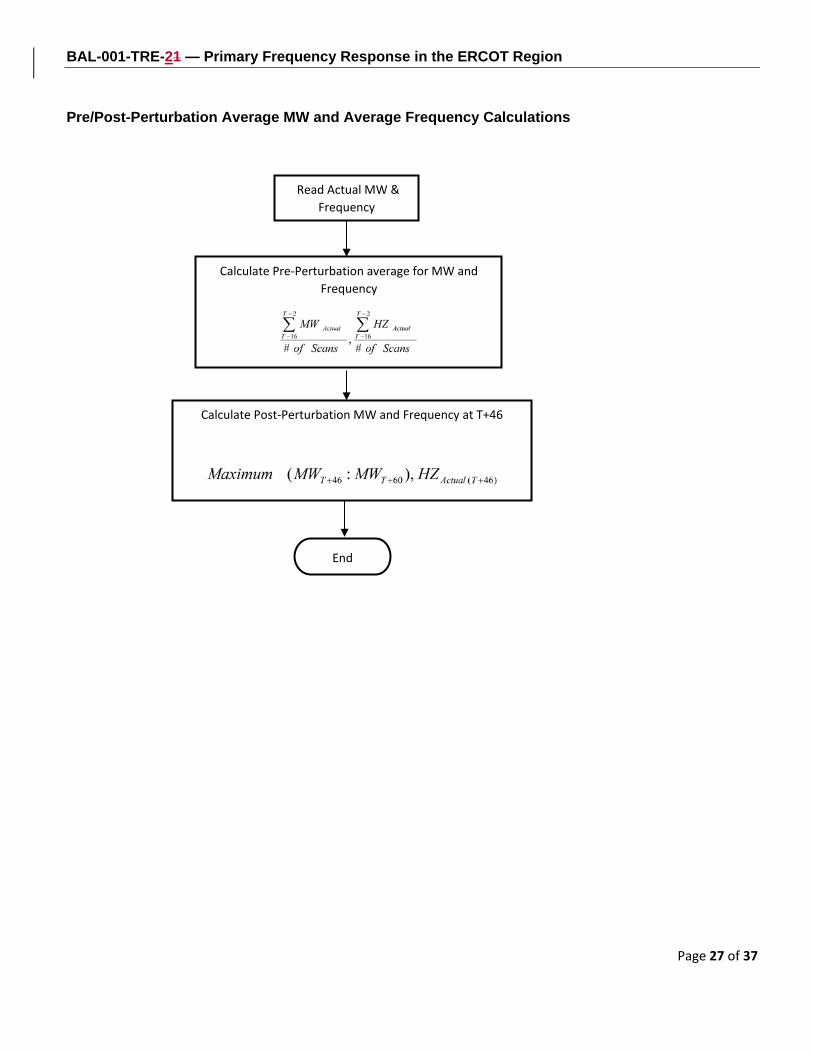
Pre/Post-Perturbation Average MW and Average Frequency Calculations
Read Actual MW & Frequency
Calculate Pre-Perturbation average for MW and Frequency
End
Calculate Post-Perturbation MW and Frequency at T+46
BAL-001-TRE-21 — Primary Frequency Response in the ERCOT Region
Page 28 of 37
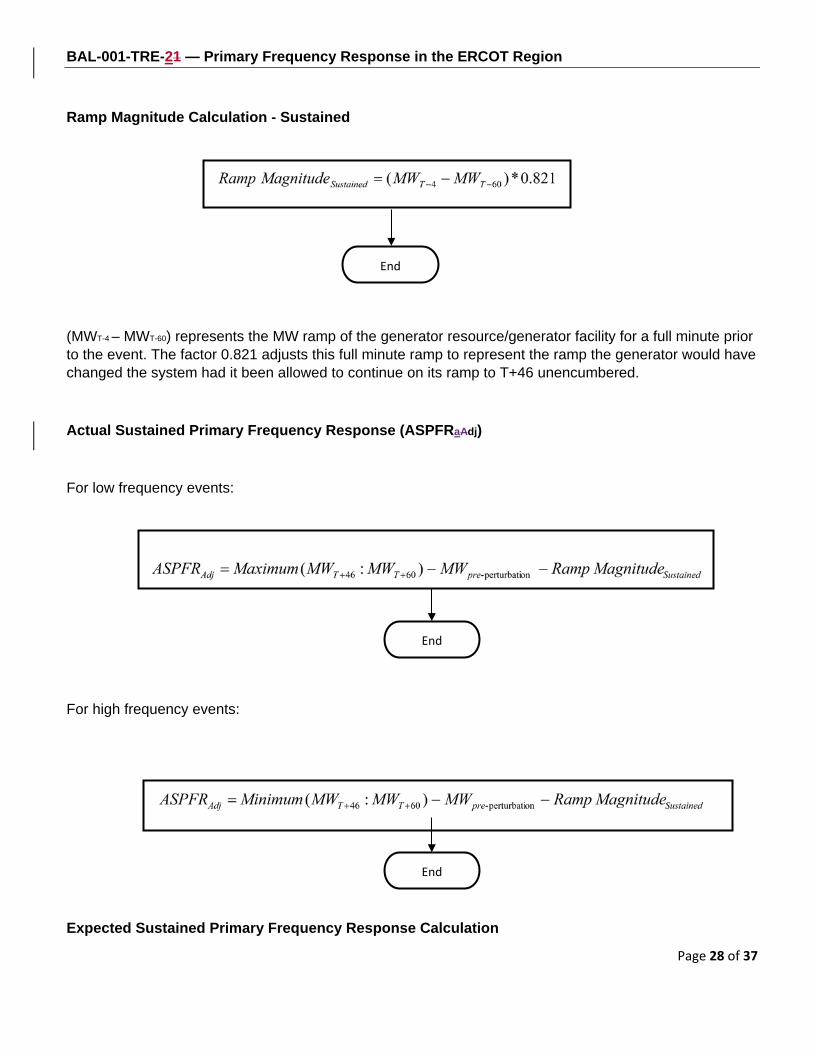
Ramp Magnitude Calculation - Sustained
(MWT-4 – MWT-60) represents the MW ramp of the generator resource/generator facility for a full minute prior to the event. The factor 0.821 adjusts this full minute ramp to represent the ramp the generator would have changed the system had it been allowed to continue on its ramp to T+46 unencumbered.
Actual Sustained Primary Frequency Response (ASPFRaAdj)
For low frequency events:
For high frequency events:
Expected Sustained Primary Frequency Response Calculation
End
End
End
BAL-001-TRE-21 — Primary Frequency Response in the ERCOT Region
Page 29 of 37
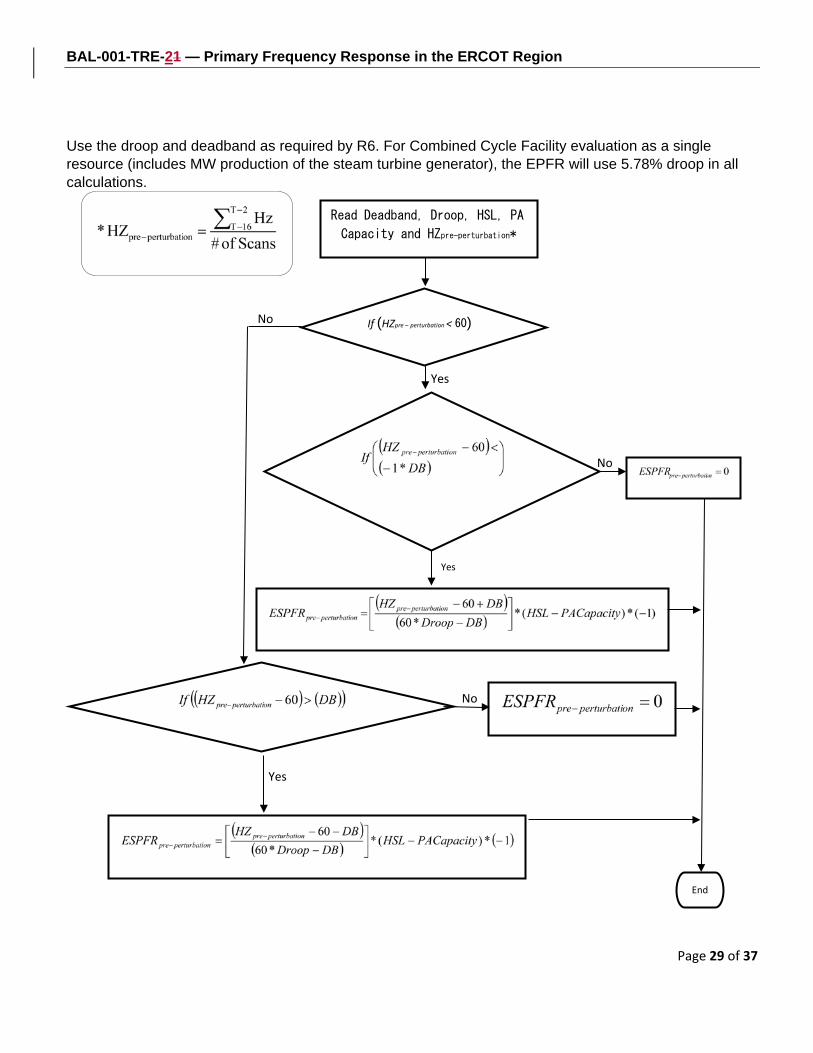
Use the droop and deadband as required by R6. For Combined Cycle Facility evaluation as a single resource (includes MW production of the steam turbine generator), the EPFR will use 5.78% droop in all calculations.
Read Deadband, Droop, HSL, PA
Capacity and HZpre-perturbation*
No
End
If (HZpre – perturbation < 60)
Yes
Yes
No
Yes
No

BAL-001-TRE-21 — Primary Frequency Response in the ERCOT Region
Page 30 of 37
Read Deadband, Droop, HSL, PA
Capacity and HZpost-perturbation*
No
End
If (HZpost – perturbation < 60)
Yes
Yes
No
Yes
No
BAL-001-TRE-21 — Primary Frequency Response in the ERCOT Region
Page 31 of 37
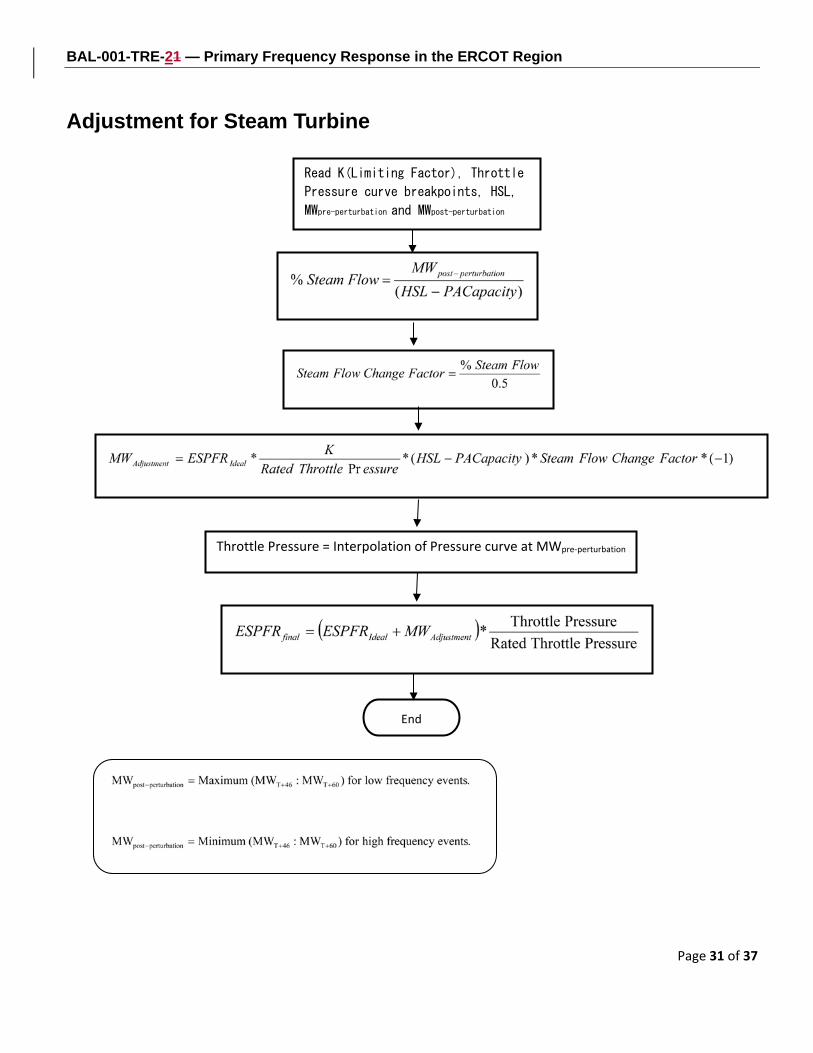
Adjustment for Steam Turbine
Read K(Limiting Factor), Throttle
Pressure curve breakpoints, HSL,
MWpre-perturbation and MWpost-perturbation
End
Throttle Pressure = Interpolation of Pressure curve at MWpre-perturbation
BAL-001-TRE-21 — Primary Frequency Response in the ERCOT Region
Page 32 of 37
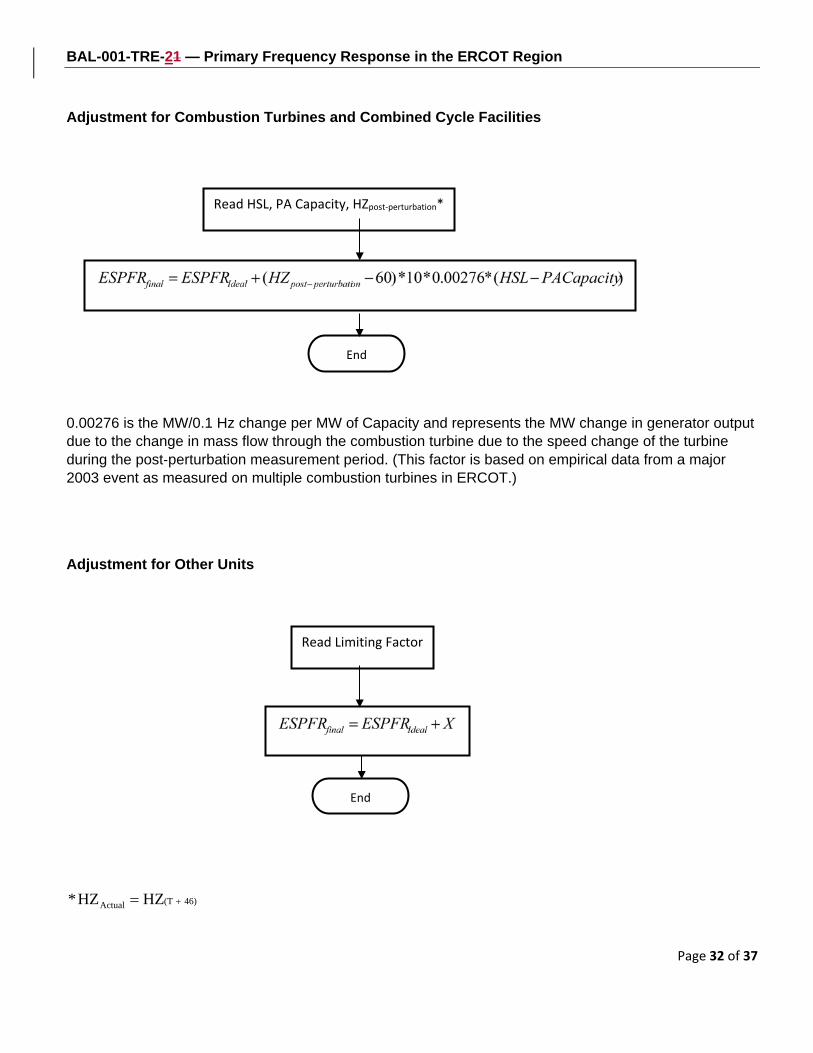
Adjustment for Combustion Turbines and Combined Cycle Facilities
0.00276 is the MW/0.1 Hz change per MW of Capacity and represents the MW change in generator output due to the change in mass flow through the combustion turbine due to the speed change of the turbine during the post‐perturbation measurement period. (This factor is based on empirical data from a major 2003 event as measured on multiple combustion turbines in ERCOT.)
Adjustment for Other Units
46)(TActual HZHZ* +=
End
Read HSL, PA Capacity, HZpost-perturbation*
End
Read Limiting Factor

BAL-001-TRE-21 — Primary Frequency Response in the ERCOT Region
Page 33 of 37
This adjustment Factor X will be developed to properly model the delivery of PFR due to known and approved technical limitations of the resource. X may be adjusted by the BA and may be variable across the operating range of a resource.
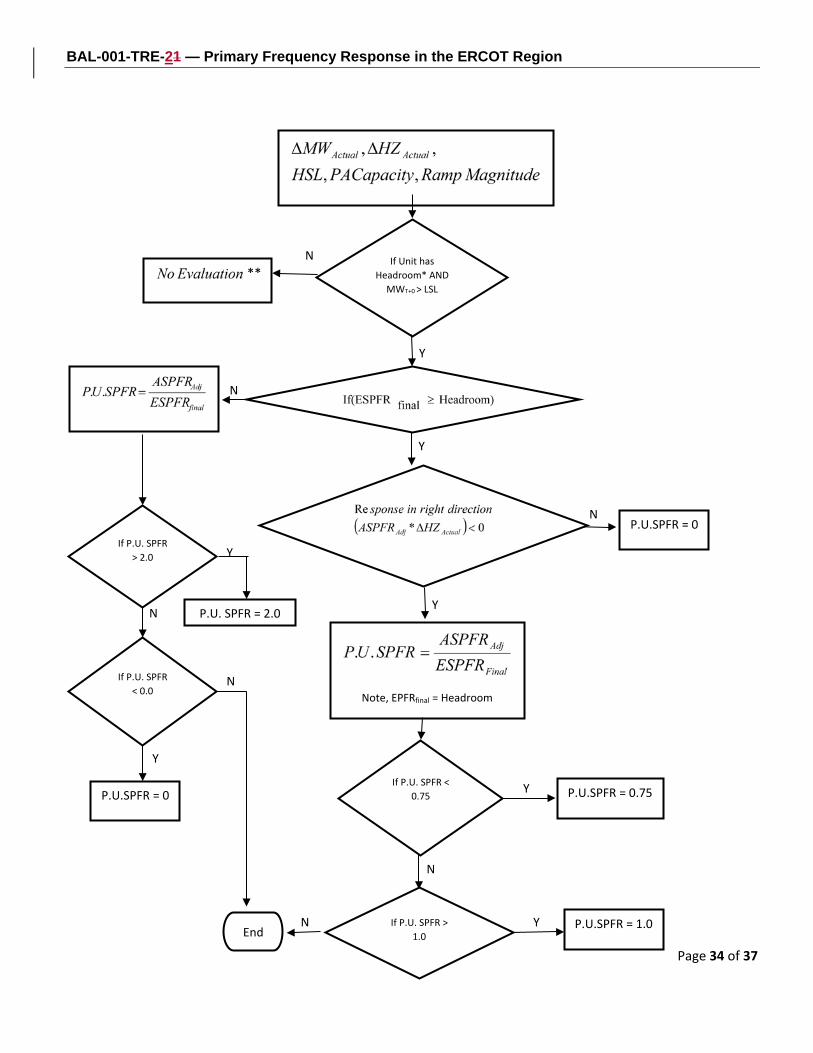
P.U. Sustained Primary Frequency Response Calculation
46)(TActual HZHZ* +=
BAL-001-TRE-21 — Primary Frequency Response in the ERCOT Region
Page 34 of 37
If P.U. SPFR < 0.75
N
End
If Unit has Headroom* AND
MWT+0 > LSL
Y
P.U.SPFR = 0
N
N
P.U. SPFR = 2.0 N
If P.U. SPFR > 2.0
If P.U. SPFR < 0.0
Y
P.U.SPFR = 0
**
Note, EPFRfinal = Headroom
Y
N
N
If P.U. SPFR > 1.0
Y
Y
Y
P.U.SPFR = 0.75
P.U.SPFR = 1.0 N
Y

BAL-001-TRE-21 — Primary Frequency Response in the ERCOT Region
Page 35 of 37
*Check for adequate up headroom, low frequency events. Headroom must be greater than either 5MW or 2% of (HSL less PA Capacity), whichever is larger. If a unit does not have adequate up headroom, the unit is considered operating at full capacity and will not be evaluated for low frequency events.
Check for adequate down headroom, high frequency events. Headroom must be greater than either 5MW or 2% of (HSL less PA Capacity), whichever is larger. If a unit does not have adequate down headroom, the unit is considered operating at low capacity and will not be evaluated for high frequency events.
For low frequency events:
For high frequency events:
**No further evaluation is required for Sustained Primary Frequency Response. This event will not be included in the Rolling Average calculation of either Initial or Sustained Primary Frequency Response.
T = Time in Seconds

BAL-001-TRE-21 — Primary Frequency Response in the ERCOT Region
Page 36 of 37
Revision History
Version Date Action Change Tracking 1 7/25/2011 Approved by SDT and submitted to
Texas RE RSC for approval to post for regional ballot
1.1 12/7/2012 Approved by SDT for submission to Texas RE RSC for approval to post for second regional ballot.
Changed sustained measure from average over event recovery period to point at 46 seconds after FME, and other changes to respond to field trial results, comments, and corrections.
1.1 3/6/2013 Texas RE RSC approves submittal to Texas RE Board
1.1 4/23/2013 Texas RE Board approves submittal to NERC and FERC
1.1 9/18/2013 NERC and Texas RE file Petition for approval to FERC
1.1 1/16/2014 Approved by FERC 1.2 5/21/2015 Texas RE Board approves
revisions to Attachment 2 Primary Frequency Response Reference Document
For clarification and consistency of the equations used in the Attachment, changes performed to:
- “T” in the equations refers to the start of the Frequency Measurable Event.
- “T-2” nomenclature utilized for clarity rather than “t(-2)” (applicable to numerous equations)
- Removed floating x in EPFRfinal for Steam Turbine equation
- Corrected sign convention for Expected Sustained Primary Frequency Response to match the calculation for expected primary frequency response. Corrected Adjusted MW for ESPFRfinal for Steam Turbine by multiplying -1 to calculate proper value.
- On Steam Flow Change Factor removed floating x and reinserted PA Capacity.
- Clarified Footnote 5 for scenario of high frequency event for setting LSL as operating margin (similar to HSL for low frequency events).
- Clarified in flowcharts for both P.U. Initial Primary & Sustained

BAL-001-TRE-21 — Primary Frequency Response in the ERCOT Region
Page 37 of 37
Frequency Response Calculations:
o Unit needs to have Headroom and be above LSL to be scored.
o Cap EPFRfinal at value of Headroom on unit
- Per RSC 5/11/2015, all references to “Final” were changed to “final”.
- Per RSC 5/11/2015, P.U.PFR and P.U.S.PFR removed italics in flowcharts.
1.3 11/14/2016 RSC approves minor changes to Attachment 2 Primary Frequency Response Reference Document
Replaced Reliability Standards Committee with Members Representative Committee to conform with changes to the Texas RE bylaws and regional standards development process.
1.3 12/07/2016 Texas RE Board approves minor changes to Attachment 2 Primary Frequency Response Reference Document.
Replaced Reliability Standards Committee with Members Representative Committee to conform with changes to the Texas RE bylaws and regional standards development process.
2.0 MM/DD/YYYY Removed the requirement for Governor droop and deadband settings for Steam turbines of combined cycle resources. Edited Requirements R9.3 and R10.3 to reflect the current process for submitting an exclusion request. Removed Attachment 1, which is the implementation plan for Regional Standard BAL-001-TRE-1. Changed numbering on Attachment 2 to Attachment 1