A hybrid model using data mining and multi-criteria ...
53
A hybrid model using data mining and multi-criteria decision-making methods for landslide risk mapping at Golestan Province, Iran Elham Raヲei Sardooi University of Jiroft Ali Azareh ( [email protected] ) University of Jiroft Tayyebeh Mesbahzadeh University of Tehran Farshad Soleimani Sardoo University of Jiroft Eric J. R. Parteli University of Duisburg Essen - Campus Duisburg: Universitat Duisburg-Essen Biswajeet Pradhan University of Technology Sydney Research Article Keywords: landslide, hazard, vulnerability, risk, GIS Posted Date: July 6th, 2021 DOI: https://doi.org/10.21203/rs.3.rs-190817/v1 License: This work is licensed under a Creative Commons Attribution 4.0 International License. Read Full License Version of Record: A version of this preprint was published at Environmental Earth Sciences on July 21st, 2021. See the published version at https://doi.org/10.1007/s12665-021-09788-z.
Transcript of A hybrid model using data mining and multi-criteria ...

A hybrid model using data mining and multi-criteriadecision-making methods for landslide riskmapping at Golestan Province, IranElham Ra�ei Sardooi
University of JiroftAli Azareh ( [email protected] )
University of JiroftTayyebeh Mesbahzadeh
University of TehranFarshad Soleimani Sardoo
University of JiroftEric J. R. Parteli
University of Duisburg Essen - Campus Duisburg: Universitat Duisburg-EssenBiswajeet Pradhan
University of Technology Sydney
Research Article
Keywords: landslide, hazard, vulnerability, risk, GIS
Posted Date: July 6th, 2021
DOI: https://doi.org/10.21203/rs.3.rs-190817/v1
License: This work is licensed under a Creative Commons Attribution 4.0 International License. Read Full License
Version of Record: A version of this preprint was published at Environmental Earth Sciences on July 21st,2021. See the published version at https://doi.org/10.1007/s12665-021-09788-z.

1
A hybrid model using data mining and multi-criteria decision-making 1
methods for landslide risk mapping at Golestan Province, Iran 2
Elham Rafiei Sardooi1*, Ali Azareh2*, Tayyebeh Mesbahzadeh3, Farshad Soleimani Sardoo4, Eric J. R. Parteli5, 3
Biswajeet Pradhan6,7 4
5
1. *Department of Ecological Engineering, Faculty of Natural Recourses, University of Jiroft, Kerman, Iran, Corresponding 6
[email protected] author: 7
2. * Department of Geography, University of Jiroft, Kerman, Iran, Corresponding author: [email protected] 8
3. Department of Reclamation of Arid and Mountain Regions, Faculty of Natural Resources, University of Tehran, Tehran, 9
Iran, [email protected] 10
4. Department of Ecological Engineering, Faculty of Natural Recourses, University of Jiroft, Kerman, Iran, 11
5. Faculty of Physics, University of Duisburg-Essen, 47057 Duisburg, Germany, [email protected]. 13
6. The Centre for Advanced Modelling and Geospatial Information Systems (CAMGIS), Faculty of Engineering & IT, 14
[email protected], University of Technology Sydney, Ultimo 2007, New South Wales, Australia 15
7. Department of Energy and Mineral Resources Engineering, Sejong University, Choongmu-gwan, 209, Neungdong-ro, 16
Gwangin-gu, Seoul 05006, Korea; [email protected] 17
Abstract 18
The accurate modelling of landslide risk is essential pre-requisite for the development of reliable landslide control 19
and mitigation strategies. However, landslide risk depends on the poorly known environmental and socio-20
economic factors for regional patterns of landslide occurrence probability and vulnerability, which constitute still 21
a matter of research. Here, a hybrid model is described that couples data mining and multi-criteria decision-making 22
methods for hazard and vulnerability mapping and presents its application to landslide risk assessment in Golestan 23
Province, Northeastern Iran. To this end, landslide probability is mapped using three state-of-the-art machine 24
learning (ML) algorithms – Maximum Entropy, Support Vector Machine and Genetic Algorithm for Rule Set 25
Production – and combine the results with Fuzzy Analytical Hierarchy Process computations of vulnerability to 26
obtain the landslide risk map. Based on obtained results, a discussion is presented on landslide probability as a 27
function of the main relevant human-environmental conditioning factors in Golestan Province. In particular, from 28
the response curves of the machine learning algorithms, it can be found that the probability 𝑝 of landslide 29
occurrence decreases nearly exponentially with the distance 𝑥 to the next road, fault or river. Specifically, the 30
results indicated that 𝑝 ≈ exp(−𝜆𝑥), where the length-scale 𝜆 is about 0.0797 km− for road, 0.108 km− for fault 31
and 0.734 km− for river. Furthermore, according to the results, 𝑝 follows, approximately, a lognormal function 32
of elevation, while the equation 𝑝 = 𝑝0 − 𝐾 ∙ (𝜃 − 𝜃0)2 fits well the dependence of landslide modeling on the 33

2
slope-angle 𝜃, with 𝑝0 ≈ 0.64, 𝜃0 ≈ 25.6° and |𝐾| ≈ 6.6 × 10⁻⁴. However, the highest predicted landslide risk 34
levels in Golestan Province are located in the south and southwest areas surrounding Gorgan City, owing to the 35
combined effect of dense local human occupation and strongly landslide-prone environmental conditions. 36
Obtained results provide insights for quantitative modelling of landslide risk, as well as for priority planning in 37
landslide risk management. 38
Keywords: landslide; hazard; vulnerability; risk; GIS 39
1 Introduction 40
Landslides constitute one of the most hazardous natural phenomena, causing live losses and devastating impact 41
on local infrastructure every year around the globe (e.g., Radbruch-Hall & Varnes 1976; Suzen and Doyuran, 42
2004a; Suzen and Doyuran, 2004b; van Westen et al. 2005; Guzzetti et al. 2012; Wang et al. 2019; Lato et al. 43
2019). The development of improved measures for landslide damage control and mitigation relies on the 44
quantitative assessment of local landslide risk, i.e., the potential degree of personal and material loss due to the 45
occurrence of damaging landslide events (Chacon et al. 2006; Glade and Crozier,2005a; Glade and Crozier,2005b; 46
Glade et al. 2005; Guzzetti, 2005; Guzzetti et al. 2012; Varnes, 1984). However, this assessment is challenging 47
due to the broad range of environmental and anthropogenic factors involved, and because the processes underlying 48
landslide initiation and dynamics are still poorly understood (de Blasio, 2011; Shanmugam & Wang, 2015; 49
Achour & Pourghasemi, 2020). 50
The first step toward a modeling framework for landslide risk assessment consists in estimating landslide-prone 51
zones based on the landslide occurrence in the area. Therefore, a landslide hazard map, which characterizes the 52
probability of landslide occurrence in a certain area under consideration of the main local and regional factors that 53
potentially trigger landslides, is required. To this end, the various potential causative factors must be statistically 54
evaluated against the background of a local inventory map, which encodes information on the areas affected by 55
damaging landslides (Brabb, 1985). 56
57
The last decade has witnessed much progress in the modelling of landslide hazard maps, in particular owing to 58
recent advances in artificial intelligence and its application to remote sensing and geoscientific research 59
(Yesilnacar & Topal 2005; Pradhan et al. 2010; Erener & Düzgün 2012; Kornejady et al. 2017; Mirzaei et al. 60
2018; Chen et al. 2017a; Pandey et al. 2020; Vakhshoori et al. 2019). For instance, GIS-based multi-criteria 61
decision-making approaches, such as Fuzzy Analytic Hierarchy Process (FAHP), have been applied to 62
identifying areas susceptible to damaging landslides (Ercanoglu & Gokceoglu 2002; Gorsevski et al. 2006; 63
Gorsevski & Jankowski 2010; Vahidnia et al. 2010; Pourghasemi et al. 2012; Feizizadeh et al. 2013; Tazik et al. 64

3
2014; Roodposhti et al. 2014; Feizizadeh et al. 2014; Zhao et al. 2017; El Bcharia et al. 2019; Roy & Saha, 65
2019). Moreover, various machine learning algorithms, including support vector machine (SVM) (Pourghasemi 66
& Kerle 2016; Youssef et al. 2016; Pandy et al. 2018), Maximum Entropy (MaxEnt) (Park, 2015; Kornejady et 67
al. 2017; Pandy et al. 2018; Mokhtari & Abedian, 2019), Genetic Algorithm Rule-Set Production (GARP) 68
(Stockwell, 1999; Rahmati et al. 2019; Adineh et al. 2018) and Random forest (RF) (Goetz et al. 2015; 69
Pourghasemi & Kerle 2016; Sevgen et al. 2019; Pourghasemi et al. 2020), and also, deep learning techniques 70
including recurrent neural network (RNN) and Convolution Neural Networks (CNN) (Xiao et al. 2018; 71
assessing have been applied to Ngo et al. 2021); Mohan et al. 2020; Bui et al. 2020et al. 2019; Ghorbanzadeh72
landslide hazard within a broad range of geographical locations and conditions of soil type, topography, land 73
use/land cover, climate and anthropogenic influences (for a recent discussion, see Achour and Pourghasemi, 74
2020). However, the performance of the different algorithms in the computation of spatial landslide probability 75
distribution is still poorly known. More precisely, as shown in previous studies, the GARP algorithm has good 76
performance in spatial modeling (Stockman et al. 2006; Sánchez-Flores, 2007; Wang et al. 2010; Adineh et al. 77
2018). However, this model has been rarely used in landslide studies. Furthermore, the SVM and MAXENT 78
models have performed very well in spatial prediction of landslides (Park, 2015; Kornejady et al. 2017; Chen et 79
al. 2017a; Kalantar et al. 2018). Therefore, it is pertinent to evaluate the applicability of these models in the 80
context of hazard and vulnerability maps. 81
82
83
Furthermore, the landslide hazard map must be combined with information on the level of damage associated with 84
a landslide of a certain type. Specifically, an additional map – the landslide vulnerability map – which describes 85
the potential landslide damage on local population, property, infrastructure, and public services, is required. This 86
vulnerability map constitutes the second step toward landslide risk assessment (Guillard-Gonçalves & Zêzere 87
2018). By suitably combining the vulnerability map with the hazard map, a landslide risk map can be obtained, 88
which provides a joint probabilistic assessment of damaging landslide occurrence and the concatenated socio-89
economic impacts (Frigerio & Amicis, 2016; Murillo-García et al. 2017; Guillard-Gonçalves & Zêzere, 2018). 90
91
However, landslide vulnerability mapping constitutes a challenging field of work given its intrinsic social, 92
environmental, and economical facets. Specifically, both physical vulnerability (i.e., the potential degree of 93

4
damage caused to physical components such as buildings, infrastructure, etc.) and social vulnerability must be 94
modeled. Indeed, the concept of social vulnerability refers, in a broad sense, to personal injuries and impact of a 95
damaging landslide on different socio-economical groups, but still lacks common definition (Guillard-Gonçalves 96
& Zêzere, 2018). Furthermore, various aspects of social vulnerability relate to potential material losses in the 97
private and public sectors as well, and it is, thus, difficult to mathematically treating social vulnerability by 98
excluding the physical aspect of vulnerability. 99
100
In the present work, a new method is presented for landslide risk assessment and its application to Golestan 101
Province in Iran (Fig. 1). This method integrates data mining and decision-making methods, which have received 102
less attention in previous studies of landslide, to estimate the regional hazard and vulnerability maps, under 103
consideration of the local landslide inventory, as well as all main relevant human-environmental factors, as 104
described next. Subsequently, the landslide risk map is obtained by combining the hazard and vulnerability maps, 105
which allows us to identify and characterize high-risk landslide areas in Golestan Province. Specifically, 106
107
2 Factors for landslide hazard and vulnerability in the study area 108
Golestan Province lies in Northeastern Iran, within latitude ranges from 36°27′48′′ N to 38°14´56´´ N, and 109
longitude ranges from 53°40´29´´ E to 56°30´44´´ E (Fig. 1). It has an area of 20347 km2, which comprises 1.3% 110
of Iran’s territory. Data on landslide positions (440 points) within Golestan Province are available from the 111
Geological Survey and Mineral Explorations of Iran (GSI). These data were processed using Google Earth images 112
and field surveys, which led to the spatial distribution of landslide events is shown in Fig. 1. Moreover, images of 113
landslides within the study area have indicated in Fig. 2. 114
We remark that one constraint in the type of spatial analysis performed in our work is that the maps associated 115
with the different input factors are available at distinct scales. This constraint is indeed common to the type of 116
study considered here, i.e., it is an inevitable constraint in environmental research and is related to limitations on 117
data availability (Mosavi et al. 2020), as discussed thoroughly in preceding work (Pourghasemi et al. 2013; Hong 118
et al. 2016; Mokhtari and Abedian, 2019; Mosavi et al. 2020). However, the solution to this constraint consists in 119
resampling the input variables to the same spatial resolution, which is what we have done in the present work. By 120
suitably rescaling the input data sets, the computation of the landslide hazard maps in developing countries can 121
provide a helpful tool in land degradation research. 122

5
123 124
125
126 127
Fig. 1. Location of the study area, Golestan Province, Iran. The dots on the elevation map (right) denote 128
landslide occurrence locations obtained from the Geological Survey and Mineral Explorations of Iran (GSI). 129
130
131
Fig. 2. Images of landslides within the study area (retrieved from Mehrnews, 2020).
Various factors compete to rendering the study area of the present work potentially prone to damaging landslide 132
events. The average annual rainfall of Golestan Province ranges from 200 mm to 1000 mm. There is a significant 133
relationship between elevation and rainfall (Dhurmea et al. 2009). Since the elevation of the study area ranges 134
from -93 meters (below the average sea level) in coastal regions to 3840 meters asl (above the average sea level) 135
in southern regions, as a result, rainfall changes in the study area are high. The local geology of the study area 136

6
consists of limestones of the Lar and Mozdoran Formation (upper Jurassic age), Quaternary sediment types (Qm 137
and Qsw), shales of the Sanganeh Formation (Early Cretaceous) and shale and sandstone of the Shemshak 138
Formation (Triassic-Jurassic). Furthermore, nonprincipled criteria for road construction and land use/land cover 139
adopted in Golestan Province are some of the human influences affecting landslide hazard in the area. 140
In particular, forest prevails in the southern and eastern regions, while agriculture and pasture represent the main 141
types of land use/land cover elsewhere. However, the relevance of the various factors for the spatial distribution 142
of landslides is poorly known. In the following subsection, the various landslide hazard factors are described based 143
on GIS and statistical data sets available for Golestan Province. Subsequently, the social-economic factors 144
controlling landslide vulnerability are specified and discussed. Figure. 3. indicates the methodological flowchart 145
of this study. 146
According to flowchart, the major steps of this study are: (1) comparing the machine learning methods of Genetic 147
Algorithm for Rule Set Production (GARP), Support Vector Machine (SVM) and Maximum Entropy (MaxEnt) 148
to predict landslide hazard maps, (2) assessing the landslide conditioning factors and the determination of the 149
most important factors, (3) creating landslide vulnerability map based on the analytic hierarchy process (AHP) 150
approach, (4) integrating the best machine learning method with MCDM approaches to create landslide risk map 151
and to characterize the high landslide risk regions. 152
153

7
154
Fig. 3. The methodological flowchart of the present study 155
2.1 Landslide hazard factors 156
To calculate the landslide hazard map for Golestan Province, we follow Ashournejad et al. (2019) and consider 157
the following main two-dimensional fields: Digital Elevation Model (DEM), soil type, slope-aspect, slope-angle, 158
geology, distance to fault, land use/land cover (LULC), distance to road, distance to the river and precipitation. 159
The characteristics of these factors in Golestan Province are described below. 160
161
We note that the maps associated with the factors considered in the study area are not available all at the same 162
scale. However, we have resampled all maps using the same cell size (30 meter) in ArcGIS, thus allowing us to 163
overlay the various maps. This scenario resembles, indeed, the situation encountered in previous work, in which 164
data sets associated with different spatial scales were considered for the computation of hazard maps associated 165
with landslide and other environmental studies (Adineh et al. 2018; Pourgahsemi & Kerle, 2016). 166

8
167
2.1.1 Slope-aspect 168
Slope-aspect affects local solar radiation and vegetation growth, and has been thus pointed out as important and 169
effective factor for landslides (Sidle & Ochiai, 2006; Kumar & Anbalagan, 2015). Golestan Province hosts a 170
mountainous terrain which leads to potentially relevant spatial variability in slope-aspect. Thus, slope-aspect 171
was considered as potential factor for landslide hazard in Golestan Province. Figure. 4a displays the 172
corresponding slope-aspect map, prepared and classified on DEM with a cell size of 30 m × 30 m in ArcGIS 173
10.2.2. 174
175
2.1.2 Slope-angle 176
Moreover, the angle between the sloping side of a granular soil and the horizontal – i.e., the slope-angle – is one 177
of the most important parameters for landslide initiation. Wherever this angle exceeds the soil’s angle of maximal 178
stability against gravitational stresses, the surface relaxes through avalanches in the direction of steepest descent, 179
thus triggering a landslide (see, e.g., Beakawi Al-Hashemi and Baghabra Al-Amoudi, 2018). However, this angle 180
of maximal stability, also called angle of repose, depends on frictional and cohesive inter-particle forces that 181
follow a still poorly known function of various factors, such as particle size distribution, degree of consolidation, 182
moisture content, particle shape and material (Parteli et al., 2014; Schmidt et al., 2020). Moreover, the modeling 183
of landslide initiation processes and the role of slope-angle must consider whether the soil is cohesive or not, and 184
whether the soil is constituted of consolidated materials or rocks. The relationship between the probability of 185
landslide occurrence and slope-angle is still uncertain (Neuhauser & Terhorst, 2007; Dymond et al. 2006; Demir 186
et al., 2013). In the present work, the slope-angle map was generated for Golestan Province based on the DEM in 187
ArcGIS 10.2.2. Figure. 4b shows that the slope-angle ranges from about 0° degrees in the north to approximately 188 71° degrees within the south and east areas of Golestan Province. 189
190
2.1.3 Precipitation 191
As shown in previous work, the local landslide occurrence probability is strongly correlated with rainfall 192
(Kawagoe et al. 2010; Althuwaynee et al. 2015). Infiltration and runoff enhance soil instability and saturation 193
levels, raindrop impacts on sloping granular surfaces constitute an important mechanism of downhill sediment 194
transport, and rainfall-induced processes may increase landslide hazard over multiple time-scales, for instance by 195

9
affecting moisture content and increasing local slope instability (Hong et al. 2006). In the present work, the 196
precipitation map of Golestan Province (Fig. 4c) has been calculated based on annual average precipitation data 197
of 33 rain gauge stations from the Iran Meteorological Organization. According to Fig. 4c, the amount of 198
precipitation ranges from 200 mm near the borders of coastal regions to 1000 mm near the central region of 199
Golestan Province (Fig. 4c). 200
It should be noted that the intensity and variation of rainfall are important aspects in the statistics, in addition to 201
the mean rainfall. However, recording rain gauge stations and hourly rainfall data would be needed to estimate 202
the intensity of rainfall. In the study area, the number of recording rain gauge stations (with hourly data) was 203
limited, so that the analysis of the present work relies on the average rainfall data based on the statistics of rain 204
gauge stations. Therefore, the present study can be compared to previous work, in which the conditioning factor 205
associated with rainfall was based on average precipitation data (Aghdam et al., 2017). 206
207
2.1.4 Distance to river 208
There are three main and consistent rivers in Golestan Province, namely Gorgan River, Qarasu and Atrak rivers 209
(they are not valleys or streams). Distance to the river may affect landslide hazard, as groundwater flow toward 210
rivers and water rivers provides an effective mechanism for soil undercutting (Korup et al. 2007; Tang et al. 2011; 211
Zaruba and Mencl 2014). Previous work has shown that landslides occur often along river sides, and that the 212
proximity to rivers underwashes hillside slope foot by flood, thus further enhancing landslide hazard (Dai et al., 213
2001). Figure 4d shows the spatial distribution of distance to the river for Golestan Province, obtained with 214
ArcGIS 10.2.2. 215
216
2.1.5 Land use/Land cover 217
Land use/land cover has an impact on soil properties, geology and land cover dynamics, and represents one major 218
factor for enhancing rainfall-driven landslide occurrence. Human activities of various types are well-known cause 219
of vegetation cover reduction and increased soil instability, and favor gully and runoff erosion (Fell et al. 2008; 220
Karsli et al. 2009). Moreover, forest, orchard, rangeland and agricultural lands stand for the land use/land cover 221
practices with highest impact on landslide occurrence (Ercanoglu & Gokceoglu, 2004). For instance, agricultural 222
and orchard land use/land cover affect soil mechanics through irrigation processes and alterations in natural 223
vegetation cover, while forest practices further increase landslide hazard wherever land use/land cover is 224

10
inappropriate, especially near roads (see below). Landsat Operational Land Imager (OLI) images (Landsat 8) was 225
used to extract the 2019 land use/land cover map for Golestan Province. The supervised classification method of 226
Maximum Likelihood (ML) was used in ENVI 5.1 software to provide the land use/land cover maps. Finally, land 227
use/land cover map of the study area was classified into six classes including: urban, bare land, rangeland, forest, 228
orchard and agriculture (Fig. 4e). 229
2.1.6 Elevation 230
Elevation is another important factor for landslide occurrence, since at higher altitudes various phenomena 231
compete to favor soil instability processes, such as snowmelt, sparse vegetation, enhanced rock weathering and 232
rainfall (Pachauri, 1998; Dai & Lee, 2002; Catani et al., 2013). Figure. 4f shows the Digital Elevation Model 233
(DEM 30 meter) of Golestan Province, which has been obtained from topographic maps in 1:25000 scale prepared 234
by Department of Water Resources Management of Iran (DWRMI). The preparation of DEM map based on topography 235
map was done in ArcGIS 10.2.2 using "Topo to raster" command. According to Fig. 4f, the elevation of the study 236
area ranges from -93 meters (below the average sea level) in coastal regions to 3840 meters asl (above the average 237
sea level) in southern regions. Specifically, negative values of elevation (Z) mean that the Z is below a reference 238
value (Z= 0) associated with sea level. Persian Gulf is the base level for measuring elevation in Iran. Elevation in 239
coastal region was -93 meters below the average sea level. 240
2.1.7 Distance to fault 241
Fault dynamics cause rock displacement, avalanches, seams and cracks on the soil, thus constituting one major 242
cause for slope instability (Pham et al. 2018). Landslide occurrence in areas affected by tectonic processes and 243
seismic activity tends, thus, to increase with proximity to fault. By means of field investigation and remote sensing, 244
a negative exponential scaling was proposed to quantitatively predict the number of earthquake-triggered 245
landslides per unit area as a function of the distance to the causative fault (Zhuang et al., 2010). However, this 246
quantification is difficult because landslide hazard depends on the interplay between prevailing seismic modes, 247
perturbation magnitude, fore- and aftershock dynamics and the other local environmental factors causative of 248
landslides. 249
The study area is placed in Northeast Iran, north of the Eastern Alborz Mountains and east of the South Caspian 250
block and its lithology consists of limestone, Quaternary sediment types, shales and sandstones. The Khazar and 251
North Alborz fault zones are the most important faults of the study area. One of the important active fault zones 252
located in the Golestan province is the Khazar fault zone, including Minoodasht, Behshahr, Sari, and Amol faults 253

11
(Tourani et al. 2021). According to previous studies, the thrusting of the Alborz Mountains towards the south of 254
the Southern Caspian block occurs along the Khazar fault zone (Axen et al. 2001 and Allen et al. 2003). The active 255
Khazar fault zone indicates reverse/thrust fault properties and has created many significant earthquakes during 256
the instrumental period (Tourani et al. 2021). 257
Figure. 4g shows the two-dimensional field associated with local distance to the next fault within Golestan 258
Province, which it has been obtained using ArcGIS 10.2.2. 259
2.1.8 Lithology 260
Lithology, i.e., the type of rock constituting the soil, affects landslide hazard because some types of rock are more 261
affected by degradation resulting from water infiltration than others. However, the relationship between lithology, 262
rock degradation and soil instability is poorly understood. Different geological formations in the Golestan 263
Province, such as limestone, gypsum, shale and sandstone, which are particularly prone to infiltration-induced 264
degradation, occur in areas of high density of landslides (Fig. 4h). Furthermore, there are Quaternary sediments 265
including Qm and Qsw, along the margins of the Caspian Sea. Swamp deposits (Qsw) include gray to brown, 266
silty, clayey, gravelly sand covered by organic rich, fine to coarse sand and silt. Swamp deposits are found in the 267
upper reaches of the modern stream valleys, along the margins of the Caspian Sea, and in poorly-drained areas on 268
the uplands. Along the margins of the Caspian Sea, swamp deposits are up to 15 ft thick and have several feet of 269
organic silt near the land surface. March deposits (Qm) include light-gray to brown, organic-rich, clayey silt. 270
These deposits are located along the margins of the Caspian Sea. In general, the thickness of marsh deposits is 271
less than 10 ft. Table 1 lists the main classes of lithology in Golestan Province. 272
273
274
Table 1. Lithology classes in the study area. 275
Code Lithology Formation Geological age
Qm Marsh deposits - Quaternary
Ksn Grey to block shale and thin layers of siltstone and sandstone Sanganeh Early Cretaceous
Qsw Swamp deposits - Quaternary
DCkh Limestone, locally including gypsum Lar & Mozdoran Jurassic
TRJs Dark grey shale and sandstone Shemshak Triassic-Jurassic 276
2.1.9 Soil type 277

12
Soil type constitutes one main property for hillslope instability. Fine-grained soils, in particular, are less permeable 278
and more prone to landslides than coarse-grain soils (Lepore et al. 2012; Alkhasawneh et al. 2014), while material 279
properties and particle chemistry further affect inter-particle frictional forces and soil flowability. Following 280
USDA soil taxonomy, soil types in Golestan Province can be classified into the following categories: 281
▪ alfisol – rich in iron, aluminum, moisture and clay 282
▪ aridisol – dry, poor in organic matter, characterized by slow formation rates 283
▪ entisol – unconsolidated sediments, in particular sand, clay or volcanic ash 284
▪ inceptisol – young soils with poorly developed vertical profile 285
▪ mollisol – deep, fertile soils of soft texture characterizing grasslands 286
The spatial distribution of the prevailing soil type in Golestan Province is shown in Fig. 4i. It should be noted that 287
soil type and lithology constitute distinct environmental factors, and there is a significant relationship between 288
these factors with landslide hazard based on Jackknif test, as shown later in this manuscript. There, it is necessary 289
to use both factors. We refer to previous work (Van Den Eeckhaut et al. 2012 and Mohammady et al. 2012) which 290
has used both factors for modeling landslide hazard, such as in the present study. 291
292
2.1.10 Distance to road 293
Regions within higher proximity to roads are more prone to landslide occurrence due to undercutting- and 294
overloading-driven processes of mechanical hillslope destabilization (Duman et al. 2006, Lee, 2007, Yalcin, 295
2008). The effect of roads on landslide hazard is tendentially stronger in developing countries owing to inadequate 296
drainage system, which further contributes to enhance soil instability. As shown in previous work (Brenning et 297
al., 2015), landslide hazard near highways may be increased by one order of magnitude, both owing to mechanical 298
stresses on the base of hillslopes and to the contribution of further types of human interference in nearby areas, 299
such as grazing. Moreover, roads cause vertical cuts that increase the pressure on their lower part, thus further 300
enhancing landslide hazard. Figure. 4j shows the spatial distribution of distance to the road in Golestan Province. 301

13
302
Fig. 4. Spatial distribution of the main landslide hazard factors in Golestan Province: a) slope-aspect, b) slope-303
angle, c) precipitation, d) distance to river, e) land use/ land cover, f) elevation g) distance to fault, h) distance to 304
road, i) soil type, and j) lithology. 305
306
307
2.2 Landslide vulnerability factors 308
Vulnerability refers to the potential level of devastation caused by a natural hazard of a certain type to society, 309
infrastructure and properties (Tobin & Montz, 1997). However, vulnerability has no standard definition and must 310
be characterized under consideration of the type of natural hazard and the various aspects associated with the 311
human-environmental setting that are relevant for damage characterization. Following considerations of previous 312

14
work (Murillo-García et al. 2017; Guillard-Gonçalves & Zêzere, 2018), finally, the following landslide 313
vulnerability factors within Golestan Province were identified: urban population density, urban building density 314
and distance from urban areas to landslide locations (discussed below). 315
Indeed, the maps associated with the landslide vulnerability factors in the study region are not available all at the 316
same scale. We share, thus, the challenge met by different authors in previous work dealing with diverse maps, 317
each with a distinct spatial resolution (Adineh et al. 2018; Pourgahsemi & Kerle, 2016). In the present work, we 318
have resampled all maps based on the same cell size (30 meter) in ArcGIS, so that the analysis has been performed 319
using this spatial resolution. 320
2.2.1 Urban population density 321
Urban population density is defined as the number of individuals per unit area residing in an urban region. The 322
larger the population density, the larger the number of individuals subjected to a local damaging landslide, and 323
the higher, thus, the social vulnerability (Cutter et al. 2003; Uzielli et al. 2008; Kjekstad & Highland; 2009, 324
Murillo-García et al. 2015). We noted that additional social aspects, such as population distribution and social-325
economic development, may further affect, to some extent, local landslide vulnerability. However, given that 326
political and cultural influences do not vary much within Golestan Province, it is reasonable to regard population 327
density as the main causative factor for social vulnerability in the study area. Population density in Golestan 328
Province was classified as specified in Fig. 5a and table 2 (data from Iran Statistical Center Organization, 2016). 329
Table2. Population density in different cities of Golestan Province 330
City Population Area(km2) Urban population
density (person/km2) Gorgan 480541 1578 305
Gonbad-e Qavus 348744 4996 70
Aliabad-e Katul 140709 1100 128
Aqqala 132733 1842 72
Kalaleh 117319 1863 63
Azadshahr 96803 848 114
Ramian 86210 827 104
Bandar-e Torkaman 79978 283 283
Minudasht 75483 663 114
Kordkuy 71270 856 83
Gomishan 68773 1281 54
Galikash 63173 868 73
Maraveh Tappeh 60953 3097 20
Bandar-e Gaz 46130 246 187
Total 1868819 20347 92 331

15
2.2.2 Urban building density 332
Urban building density – the number of buildings per unit area within an urban region – is one major factor for 333
physical vulnerability. We noted that this vulnerability incorporates potential damage to any physical component 334
of the private and public sectors, including building distribution. However, if we assume that public-infra structure 335
and private property represent potential development indicators in Golestan Province, and that these indicators 336
are correlated with each other to some extent, then it is plausible to adopt urban building density as one quantitative 337
measure for socio-economic development – and vulnerability. Figure. 5b shows the building density map for the 338
study area (data available from Iran Statistical Center Organization, 2016). 339
340
2.2.3 Distance from urban area to next landslide location 341
Because frictional forces cause energy dissipation thus counteracting the sediment transport processes, landslide 342
vulnerability tends to decrease with distance to landslide areas. By contrast, the closer an urban area is to a 343
landslide location, the higher the potential level of damage associated with an event of a certain type. Figure. 5c 344
shows the two-dimensional field corresponding to the distance between the urban regions and landslide locations, 345
obtained from the Digital Elevation Model of Golestan Province. We noted interurban infra-structure such as 346
roads and railway could be also incorporated into Fig. 5c, but have not been included in this map given that they 347
depend on the spatial distribution of urban areas and further reflect regional levels of socio-economic development 348
that have been already considered in Sections 2.2.1. Therefore, vulnerability factors considered above incorporate 349
all main aspects controlling potential socio-economic damage of landslides and are, thus, applied for landslide 350
risk mapping as described next. 351

16
352
353
Fig. 5. Spatial distribution of the main landslide vulnerability factors: a) urban population density, b) urban 354
landslide density, and c) distance from urban area to landslide location. 355
356
3 Calculation of the landslide hazard, vulnerability and risk maps 357
Machine learning algorithms were applied to calculate hazard, vulnerability and risk maps based on the data sets 358
described in the previous section, as well as the landslide inventory map shown in Fig. 1. To this end, the positions 359
in the inventory map associated with the 440 landslide events were divided into two groups: Training data, 360
corresponding to randomly chosen 70% of the landslide positions, and test data, comprising 30% of the 361
corresponding data set (Pourghasemi et al. 2013; Adineh et al. 2018). Specifically, the first group was employed 362
in the search for correlation patterns between spatial distributions of landslide events, hazard factors and 363
vulnerability factors, while the second group was used for testing the obtained relationships in the framework of 364

17
machine learning (Hastie et al., 2017). Based on these relationships, the maps for landslide hazard and 365
vulnerability were computed, whereupon a landslide risk map for Golestan Province was obtained as described in 366
the following subsections. 367
368
369
3.1 Landslide hazard map using Support Vector Machine, Maximum Entropy and Genetic 370
Algorithm for Rule Set Production 371
To obtain the hazard map, we employed and compared the performance of three different machine learning 372
algorithms for modelling landslide occurrence probability as a function of the conditioning factors specified in 373
Section 2.1. These methods are described in Sections 3.1.1 – 3.1.3. 374
375
3.1.1 Support Vector Machine (SVM) 376
Support Vector Machine (SVM) stands for a learning-based data classification method (Vapnik, 1999; Yao et al., 377
2008; Peng et al., 2014). In the present work, SVM was applied for the first time to compute the hazard map for 378
the entire Golestan province area. The goal is to divide the study area in classes of landslide hazard (from low to 379
very high) based on the landslide inventory map and conditioning variables. More precisely, SVM assigns to each 380
observed landslide location within the training data set one vector in the two-dimensional space, which is then 381
classified according to a local hazard level, which is determined by the values of all hazard factors at the 382
corresponding landslide location. Subsequently, the hazard map is computed by subdividing the study area into 383
classes (clusters) of landslide hazard, each indicating a specific hazard level on the map. The border lines that 384
separate neighboring classes on the map, which are called hyperplanes. The optimal hyper-plane maximizes the 385
margin to divide the two categories, e.g., landslide and non-landslide. SVM has this name because each hyperplane 386
is modeled using linear fitting functions determined from the vectors that lie nearest to it – these vectors are known 387
as support vectors in the algorithm (e.g., Vapnik, 1999). The optimal hyper-plane can be determined based on the 388
solution of optimization problem as follows (Samui, 2008): 389
390
1 1 1
1
1( )
2
0 0
n n n
i i j i j i ji i j
n
i j ii
Minimize y y x x
if y and C
= = =
=
−
=
(1) 391

18
where x is a vector of input space which includes selected conditioning factors, y is a training vector, C and αi 392
are the penalty factor and lagrange multipliers, respectively. 393
The training vectors consist of two categories (landslide and non-landslide pixels) are specified by two classes -1 394
and +1, respectively. The SVM method searches for an optimal hyper-plane which can recognize these two 395
categories from these training vectors (Samui, 2008). 396
However, due to non-linearity effects inherent to natural systems, prior to applying classification the domain is 397
often linearized by means of (kernel) functions. Specifically, the training vectors are mapped into a higher-398
dimensional space, in which computations can be performed using linear hyperplanes (Kecman, 2005; Hofmann 399
et al. 2008; Marjanović et al. 2011; Ballabio & Sterlacchini, 2012; Chen et al. 2017a). 400
In this case, to classify the new dataset based on the SVM approach, the following decision function can be applied 401
(Samui, 2008): 402
1( ) ( ( ) )
n
i i i jig x sign y K x x b
== + (2) 403
where g(x) is decision function, b is a scalar base, K(xixj) is the kernel function, 404
Following previous work (Pourghasemi et al., 2013; Lee et al. 2017), we chose a Gaussian (bell-shaped) kernel 405
function, which is also called Radial basis function (RBF) and has proven to deliver the best classification results 406
in landslide hazard problems. This kernel function was determined using following equation (Vapnik, 1995): 407
2( )( ) , 0i jx x
i jK x x e
− −= (3) 408
where γ is kernel width. The SVM model with RBF kernel available was run in openModeller Desktop 1.3.0 (de 409
Souza Muñoz et al. 2011). 410
411
3.1.2 MaxEnt (Maximum Entropy) 412
MaxEnt is a data mining method to predict the occurrence of one event based on maximum entropy (Elith et al, 413
2011) that approximates the probability distribution of presence data based on environmental limitations (Phillips 414
et al., 2006). In this model, the occurrence points (X1 to Xm) are used to obtain an unknown probability distribution 415
( ) (Phillips et al. 2004; Phillips and Dudík, 2008; Kumar & Stohlgren, 2009) and the suitability of each pixel 416
in the environment is expressed as a function of environmental variables. The maximum entropy model chooses 417
a probability distribution that is near to reality and has entropy maximization (Phillips et al. 2006; Phillips et al. 418
2009; Felicísimo et al. 2013). 419

19
In this study, ME model was selected to predict landslide hazard. This model determines landslide occurrence 420
probability distribution (π) in the set of positions X. The MaxEnt method has shown acceptable accuracy in the 421
spatial modeling (Convertino et al. 2013; Chen et al. 2017b; Azareh et al. 2019). The objective occurrence 422
probability at position x is expressed as (Phillips, 2008): 423
( 1) ( 1) ( 1) ( )( 1 ) (4)
1( )P y P x y P y x
P y xP x
x
= = = = = = 424
where the probability of landslide occurrence is P(y = 1), while |x| is the number of pixels over the study area. 425
Implementation was accomplished using the software MaxEnt 3.3.3 (Phillips et al., 2006). 426
427
3.1.3 Genetic Algorithm for Rule Set Production (GARP) 428
GARP is a data mining method based on a genetic algorithm designed to perform ecological modeling (Stockwell 429
& Noble, 1992; Stockwell, 1999; Townsend Peterson et al. 2007; Adineh et al. 2018; Darabi et al. 2019). The 430
algorithm was employed in previous spatial modelling (Stockman et al. 2006; Sánchez-Flores, 2007; Wang et al. 431
2010; Adineh et al. 2018), but its performance in regional landslide probability modelling is still uncertain. 432
433
A genetic algorithm starts with a large set of randomly generated competing solutions to a certain problem, which 434
are refined over time to converge toward an optimal solution. Indeed, each solution can be regarded as a set 435
(“chromosome”) of models or parameter values (“genes”), which are iteratively refined by producing new sets of 436
solutions. Moreover, in the framework of GARP, the solutions represent sets of environmental conditions, such 437
as rainfall, elevation, climatic conditions, etc., which must be iteratively improved with regard to habitability by 438
a given species on the basis of an inventory map for species occurrence (Stockwell, 1999; Townsend Peterson et 439
al. 2007; Zhu et al. 2007; Wang et al. 2010; Boeckmann and Joyner, 2014; Adineh et al. 2018; Darabi et al. 2019). 440
441
In the problem of landslides investigated here, the landslide events stand for the species of the GARP algorithm, 442
while the landslide inventory map constitutes the set of local observations that are needed to initialize the 443
computations. The GARP model was run in openModeller Desktop 1.3.0 (de Souza Muñoz et al. 2011) to estimate 444
the relationship (optimal solution) between spatial distribution of landslide occurrence and hazard factors, thus 445
leading to the landslide hazard map. 446
447
20
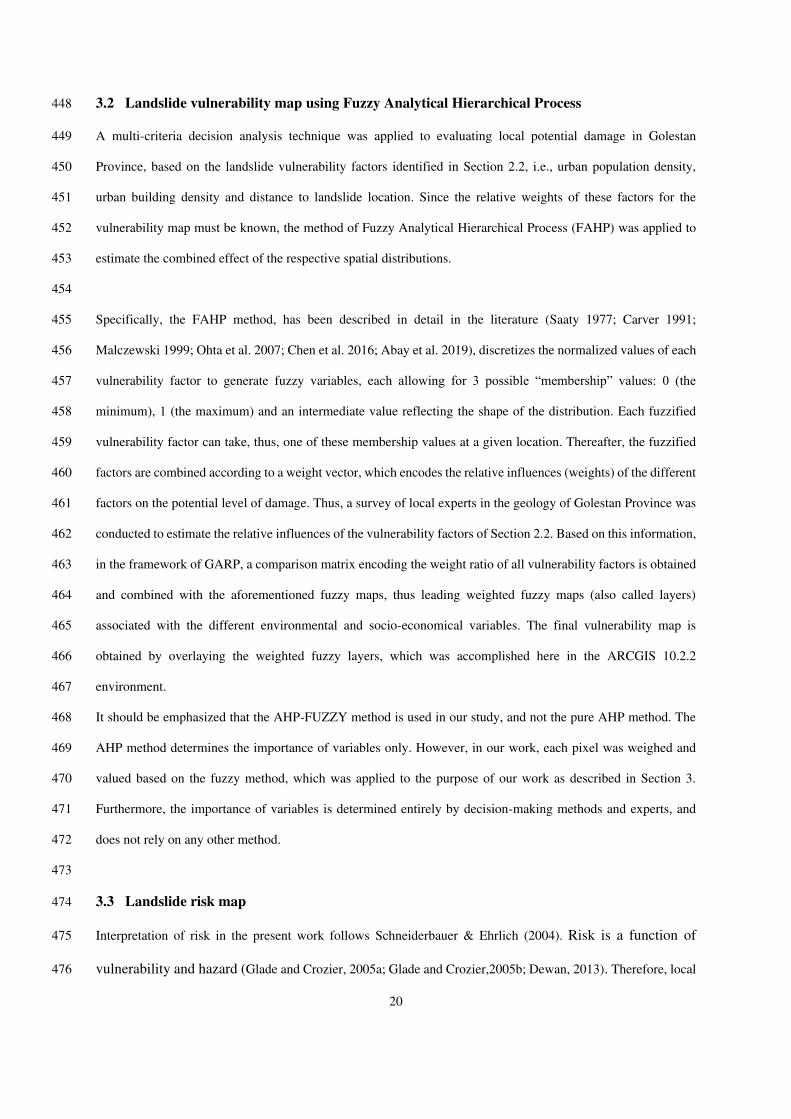
3.2 Landslide vulnerability map using Fuzzy Analytical Hierarchical Process 448
A multi-criteria decision analysis technique was applied to evaluating local potential damage in Golestan 449
Province, based on the landslide vulnerability factors identified in Section 2.2, i.e., urban population density, 450
urban building density and distance to landslide location. Since the relative weights of these factors for the 451
vulnerability map must be known, the method of Fuzzy Analytical Hierarchical Process (FAHP) was applied to 452
estimate the combined effect of the respective spatial distributions. 453
454
Specifically, the FAHP method, has been described in detail in the literature (Saaty 1977; Carver 1991; 455
Malczewski 1999; Ohta et al. 2007; Chen et al. 2016; Abay et al. 2019), discretizes the normalized values of each 456
vulnerability factor to generate fuzzy variables, each allowing for 3 possible “membership” values: 0 (the 457
minimum), 1 (the maximum) and an intermediate value reflecting the shape of the distribution. Each fuzzified 458
vulnerability factor can take, thus, one of these membership values at a given location. Thereafter, the fuzzified 459
factors are combined according to a weight vector, which encodes the relative influences (weights) of the different 460
factors on the potential level of damage. Thus, a survey of local experts in the geology of Golestan Province was 461
conducted to estimate the relative influences of the vulnerability factors of Section 2.2. Based on this information, 462
in the framework of GARP, a comparison matrix encoding the weight ratio of all vulnerability factors is obtained 463
and combined with the aforementioned fuzzy maps, thus leading weighted fuzzy maps (also called layers) 464
associated with the different environmental and socio-economical variables. The final vulnerability map is 465
obtained by overlaying the weighted fuzzy layers, which was accomplished here in the ARCGIS 10.2.2 466
environment. 467
It should be emphasized that the AHP-FUZZY method is used in our study, and not the pure AHP method. The 468
AHP method determines the importance of variables only. However, in our work, each pixel was weighed and 469
valued based on the fuzzy method, which was applied to the purpose of our work as described in Section 3. 470
Furthermore, the importance of variables is determined entirely by decision-making methods and experts, and 471
does not rely on any other method. 472
473
3.3 Landslide risk map 474
Interpretation of risk in the present work follows Schneiderbauer & Ehrlich (2004). Risk is a function of 475
vulnerability and hazard (Glade and Crozier, 2005a; Glade and Crozier,2005b; Dewan, 2013). Therefore, local 476

21
landslide risk is obtained here by combining the probability that a landslide occurs at a given location, under 477
consideration of the conditioning factors (hazard), with the probability associated with a certain level of 478
devastation caused by a damaging landslide (vulnerability). The landslide risk probability map for Golestan 479
Province is obtained from the product of the landslide hazard and vulnerability maps, i.e., for every location, the 480
local hazard is multiplied by the local vulnerability, which gives the local risk (Eq. 5) (Zezere et al. 2008; 481
Remondo et al. 2008; Dewan, 2013). 482 𝑅𝑖𝑠𝑘 = 𝐻𝑎𝑧𝑎𝑟𝑑 × 𝑉𝑢𝑙𝑛𝑒𝑟𝑎𝑏𝑖𝑙𝑖𝑡𝑦 (5) 483 The obtained landslide risk map is a quantitative and probability map (Hervas & Bobrowsky, 2009 and Corominas 484
et al., 2014). 485
Therefore, the purpose of this study is to model landslide risk in Golestan Province. Risk encodes the 486 information on both hazard and vulnerability. Hazard is more related to environmental factors (slope, aspect, 487 elevation, etc.), while vulnerability is related to socio-economic factors, such as building density and population 488 density. A region may have high landslide hazard while being not socio-economically vulnerable, or vice versa. 489 Therefore, both vulnerability and hazard should be considered together for risk analysis. Therefore, the machine 490 learning tools and environmental factors are used to prepare the landslide hazard map, but socio-economic 491 factors and the decision-making method (FAHP) were applied to prepare a vulnerability map. Finally, our 492 analysis leads to a hazard and vulnerability map, as discussed next. After predicting the Hazard map and 493 preparing the Vulnerability map, the Risk map is calculated through the raster calculator tools in the ArcGIS 494 environment based on Eq. (5) 495 3.4 Model performance evaluation 496
In this study three metrics, comprising: threshold-independent area under curve (AUC) of the receiver–operator 497
characteristic curve (ROC), True Skill Statistic (TSS), and Accuracy (or efficiency), were used to evaluate the 498
performance of landslide hazard models (Pontius & Schneider, 2001; Lee and Park, 2013; Shabani et al.2018; 499
Rahmati et al. 2019; Dodangeh et al. 2020). These metrics have been broadly applied for the evaluation of machine 500
learning models (Allouche et al., 2006; Wang, 2007; Rahmati et al. 2019). 501
502
Accuracy shows how well a test accurately identifies or excludes a condition and it is obtained by Eq. (6), where, 503
FP is false positive, FN is false negative, TP is true positive, and TN is true negative. TP and TN are the number 504
of pixels that are accurately classified while FP and FN are the numbers of pixels incorrectly classified (Beguería, 505
2006; Manfreda et al., 2014; Bui et al., 2016). 506
The True Skill Statistic (TSS) was calculated by Eq. (7) based on the sum of sensitivity (Eq. 8) and specificity 507
minus 1 (Eq. 9). (Allouche et al., 2006 Shabani et al.2018; Dodangeh et al. 2020). TSS value varies from −1 to 508
+1, where -1 demonstrates predictive capabilities of not better than a random model, 0 demonstrates an 509
indiscriminate model and +1 a perfect model (Allouche et al., 2006). 510

22
The area under the receiver–operator characteristic curve (AUROC) provides a measure of model accuracy in 511
predicting landslide occurrence (Gorsevski, 2006). The range of possible AUC values lies in the interval [0, 1], 512
where values of AUC close to 1 indicate high model performance (Yesilnacar, 2005; Pearce & Ferrier, 2000; 513
Fielding & Bell, 1997; Philips, 2004; Wang, 2007; Frattini et al. 2010). 514
515 TP TN
AccuracyTP TN FP FN
+=
+ + + (6) 516
1TSS Sensitivity Specificity= + − (7) 517
TPSensitivity
TP FN=
+ (8) 518
1FP
SpecificityTN FP
− =+
(9) 519
4 Results 520
4.1 Landslide hazard map 521
Figure. 6 shows the landslide hazard maps obtained with the algorithms discussed in Section 3.1, i.e, MaxEnt, 522
SVM and GARP, by classifying hazard levels as low, moderate, high and very high. Moreover, Figure. 7 displays 523
the results from AUC ROC statistics (see Section 3.4) on the accuracy of the different algorithms. As can be seen 524
from Fig. 7 and table 3, the MaxEnt model delivered the best performance (AUC = 92%, TSS=82.3%, 525
Accuracy=87.5%), followed by SVM (AUC = 81%, TSS=73.6%, Accuracy=78.3%) and GARP (AUC = 74%, 526
TSS=66.8%, Accuracy=71.6%). Therefore, the results of MaxEnt were used to prepare landslide risk. 527
528 Table 3. Predictive performance of models using three evaluation statistics 529
530
GARP SVM MaxEnt Statistics 74 81 92 AUCROC (%)
71.6 78.3 87.5 Accuracy (%)
66.8 73.6 82.3 TSS (%) 531
It is interesting to note that previous work also revealed slightly superior performance of MaxEnt for different 532
applications, compared to other models (Phillips et al., 2006; Hong et al., 2016; Park, 2015; Kornejady et al., 533
2017). Various reasons for this behavior have been suggested, in particular the fact that MaxEnt incorporates an 534
explicit regularization mechanism to avoid overfitting while modeling the spatial distribution of event occurrence 535
directly, without relying on assumption of absence locations (Phillips and Dudík, 2008). However, as can be seen 536

23
from the hazard maps in Fig. 6, despite the differences in model accuracy, all 3 algorithms (MaxEnt, SVM and 537
GARP) associate the mountainous east, south and southwest areas of Golestan Province with the highest levels of 538
landslide probability. This result is interesting, considering that these areas are characterized by complex 539
topography, steep slopes and relatively high rainfall, and given the potential impact of local human interferences 540
in the area (see Section 5.1). 541
542
Fig. 6. Landslide hazard maps obtained for Golestan Province with the different machine learning algorithms 543
considered in the present study: (a) Maximum Entropy (MaxEnt), (b) Support Vector Machine (SVM) and 544
Genetic Algorithm for Rule Set Production (GARP). 545
546

24
547
548
Fig. 7. Receiver operating characteristic (ROC) curves of MaxEnt, SVM and GARP algorithms in the landslide 549
hazard mapping for Golestan Province. 550
551
552
4.2 Landslide vulnerability map 553
The results showed that the factor urban population density is the most significant vulnerability factor for Golestan 554
Province, followed by urban building density and distance to landslide location. The normalized weights of the 555
different factors in the framework of FAHP are shown in Fig. 8. Moreover, the consistency of the comparison 556
matrix associated with these weights is assessed by a FAHP index called consistency ratio (CR). The smallest the 557
value of CR, the higher the consistency of the comparison matrix (Leung and Cao, 2000). As can be seen in Fig. 558
8, the value of CR obtained here is significantly smaller than 10%, thus indicating acceptable consistency of the 559
decision-making process applied. 560
561
Fig. 8. Normalized weights of the vulnerability factors obtained in the framework of the FAHP computations. 562
25
563
564
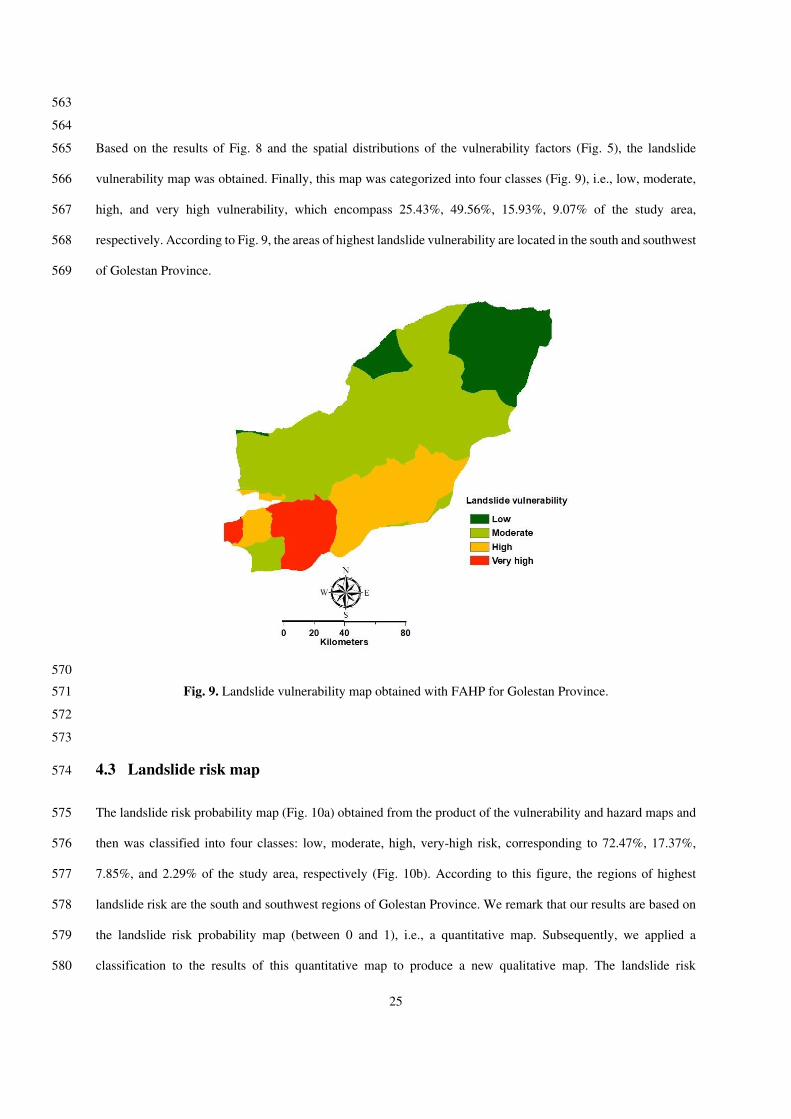
Based on the results of Fig. 8 and the spatial distributions of the vulnerability factors (Fig. 5), the landslide 565
vulnerability map was obtained. Finally, this map was categorized into four classes (Fig. 9), i.e., low, moderate, 566
high, and very high vulnerability, which encompass 25.43%, 49.56%, 15.93%, 9.07% of the study area, 567
respectively. According to Fig. 9, the areas of highest landslide vulnerability are located in the south and southwest 568
of Golestan Province. 569
570
Fig. 9. Landslide vulnerability map obtained with FAHP for Golestan Province. 571
572
573
4.3 Landslide risk map 574
The landslide risk probability map (Fig. 10a) obtained from the product of the vulnerability and hazard maps and 575
then was classified into four classes: low, moderate, high, very-high risk, corresponding to 72.47%, 17.37%, 576
7.85%, and 2.29% of the study area, respectively (Fig. 10b). According to this figure, the regions of highest 577
landslide risk are the south and southwest regions of Golestan Province. We remark that our results are based on 578
the landslide risk probability map (between 0 and 1), i.e., a quantitative map. Subsequently, we applied a 579
classification to the results of this quantitative map to produce a new qualitative map. The landslide risk 580

26
probability map is shown in Fig 10a. We further note that the output of GARP model had the highest correlation 581
with soil map compared to other two models. Based on GARP model, the most hazardous areas in terms of 582
landslide were located in all soil types except aridisols. Therefore, the output of GARP model is more accordance 583
with soil map. Moreover, the MaxEnt model had the best performance and therefore the results of ME were used 584
to prepare landslide risk (risk=hazard *vulnerability). The respective roles of the various environmental factors 585
are discussed in the next section in the light of our results. 586
587
588

27
589
Fig. 10. Predicted landslide risk map of Golestan Province. 590
591
5 Discussion 592
The goal of this study is to construct a landslide risk map for Golestan Province, which can be used by the local 593
government to identify the regions of highest landslide risk. Since a region may have high landslide hazard but 594
little vulnerability to landslide damage (and vice-versa), the risk map produced here incorporates both hazard and 595
vulnerability maps (Schneiderbauer & Ehrlich, 2004; Dewan, 2013; Zezere et al. 2008; Remondo et al. 2008). In 596
the following paragraphs Fig. 10 was analyzed by discussing the role of the various human-environmental factors 597
on landslide hazard and vulnerability in Golestan Province. 598
5.1 Relative influences of the landslide hazard factors in Golestan Province 599
To shed light into the relative influences of the different hazard factors, it can be referred to the Jackknife test 600
results from the MaxEnt model, which are displayed in Fig. 11. In the framework of this test, the model is run 601
with only one hazard factor at a time (under exclusion of all other factors), thus leading to the ROC AUC values 602
denoted by the blue bars in Fig. 11. Moreover, the green bars in Fig. 11 correspond to the ROC AUC values from 603
the complementary model, i.e., in which one of the factors at a time has been excluded from the model. 604
605

28
According to Fig. 11, MaxEnt identified the factors elevation, precipitation, soil type, lithology, land use/land 606
cover and distance to river as the most relevant ones for landslide hazard in Golestan Province – all these factors 607
have been associated with AUC > 0.7, close to the total AUC = 0.89 (red bar in Fig. 11). Moreover, according to 608
Fig. 11, the factor slope-aspect is closest to the worst possible AUC (0.52) and has, thus, the lowest relevance, 609
while the factors slope-angle, distance to road and distance to fault have comparable, intermediate impact on 610
landslide hazard in the study area. 611
612
Furthermore, to better understand the functional dependence of landslide hazard on the conditional variables, it 613
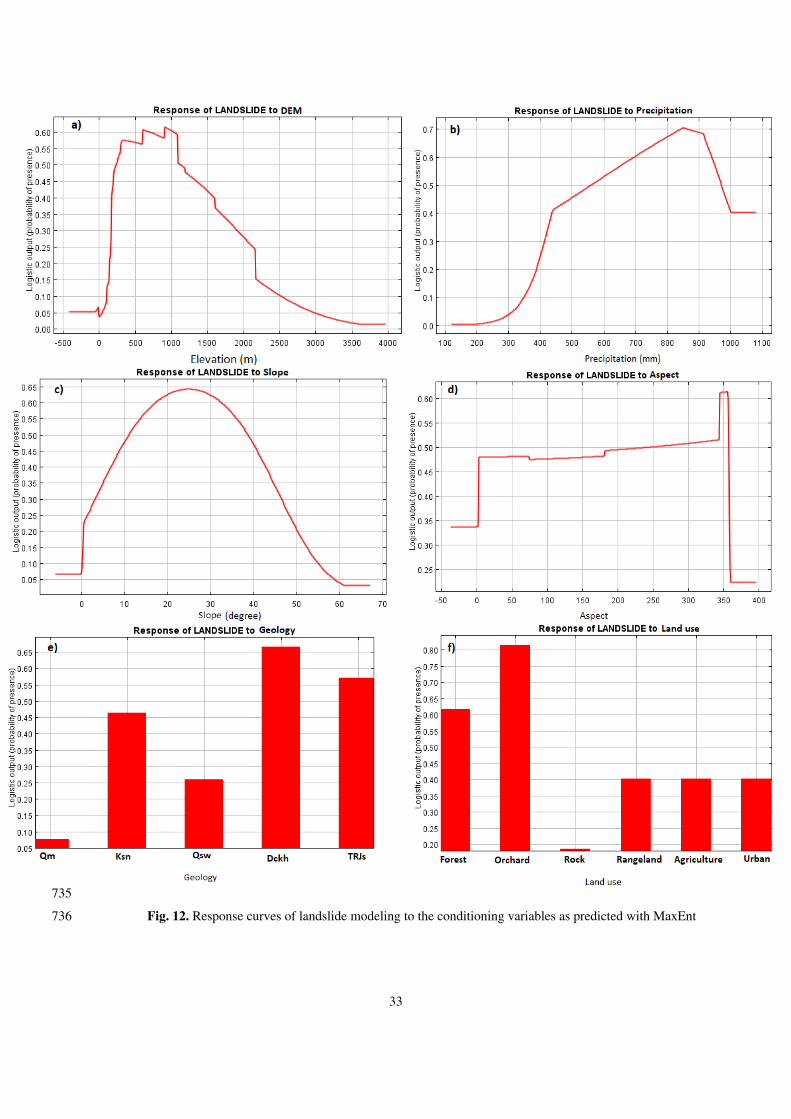
can be referred to the respective response curves displayed in Fig. 12. Each subplot in Fig. 12 shows the variations 614
in the logistic prediction of landslide hazard as a function of the selected variable, under the constraint that the 615
values of all other factors are considered constant and equal to their average. The response curves are briefly 616
discussed in the next subsections. 617
618
5.1.1 Elevation 619
As shown in Fig. 12a, the response of landslide modeling to elevation displays two regimes, which are separated 620
by an intermediate range of relatively constant susceptibility between 200 m and 1000 m. In regime I (𝐻 ≲ 200 621
m), predicted landslide occurrence probability 𝑝 increases with elevation 𝐻, but in regime II (𝐻 ≳ 1000 m), a 622
negative correlation is observed. 623
624
We propose that decreased human presence and interferences at high altitudes contribute to the behavior observed 625
in Fig. 12a. In particular, the sparse vegetation cover and the concatenated changes in land use/ land cover practice 626
may contribute to reducing landslide probability at high altitudes. Furthermore, the lower infiltration rates 627
associated with high elevation levels are associated with lower soil saturation (Salarian et al. 2014), thus 628
contributing to decreasing landslide hazard. Moreover, snow precipitation may provide one further slope 629
stabilizing agent at high elevations, although this process is still poorly understood. 630
631
We find that a logarithmic function, i.e., 632
𝑝 = 𝑎𝐻 ∙ exp {− 12 ∙ [ln(𝐻) − 𝑏𝑐 ]2} , (10) 633

29
describes reasonably well the response curve of landslide occurrence probability 𝑝 as a function of elevation 𝐻 634
Golestan Province (see Fig. 13a). The best fit to the data using Eq. (10), with 𝐻 in km, yields 𝑎 ≈ 0.58 km, 𝑏 ≈635 0.18 and 𝑐 ≈ 0.83, with correlation coefficient 𝑅2 ≈ 0.96. We note that this logarithmic function describes well 636
the rapid increase of the susceptibility 𝑝 with elevation in regime I, and the much slower decrease in regime II. 637
Moreover, the value of 𝑎 ≈ 0.58 km is well within the intermediate range (200 ≲ 𝑥 ≲ 1000) separating both 638
regimes as estimated above. Future research is thus necessary to shed light on the values of 𝑎, 𝑏 and 𝑐 as a function 639
of regional conditions. 640
5.1.2 Precipitation 641
Figure. 12b shows that landslide probability increases with increasing precipitation up to 850 mm, which suggests 642
prevailing influence of streamflow-induced, downhill sediment transport processes in this regime. However, 643
according to Fig. 12b that landslide probability decreases for precipitation levels higher than 850 mm. We interpret 644
this behavior as result of increased saturation associated with such high precipitation levels, thus enhancing 645
resistance of local lithology to water erosion and increasing soil stability in the corresponding areas. 646
5.1.3 Slope 647
Moreover, our results indicate the existence of an optimal slope of about 25° for landslide occurrence (Fig. 12c). 648
Under high enough levels of gravitational stresses, the soil surface relaxes through landslides in the direction of 649
steepest descent (Neuhauser & Terhorst, 2007; Dymond et al. 2006). As shown in Fig. 12c, this behavior dictates 650
landslide probability trend in the regime of small slopes below the threshold of approximately 25° (denoted here 651
regime I). However, the opposite trend is observed for larger slopes (regime II). We find that the dependence of 652
response curve on slope-angle can be approximately described by the following equation: 653
654 𝑝 = 𝑝0 − 𝐾 ∙ (𝜃 − 𝜃0)2, (11) 655
656
where 𝑝 denotes the predicted probability of landslide occurrence, 𝜃 is the slope-angle in degrees, 𝑝0 is the value 657
of 𝑝 at 𝜃 = 𝜃0, which separates regimes I and II above, and 𝐾 is constant that has units of degrees−. The best fit 658
to the data using Eq. (10) gives 𝑝0 ≈ 0.64, 𝜃0 ≈ 25.6° and |𝐾| ≈ 6.6 × 10⁻⁴, with correlation coefficient 𝑅2 ≈659 0.96 (see Fig. 13b). 660
661

30
It is interesting to note that Demir et al. (2013) also found a peak in the landslide hazard for a slope-angle 𝜃0 of 662
approximately 25° at North Anatolian Fault Zone at Kelkit Valley, Turkey. As discussed by Abedini et al. (2014), 663
geological formations on higher slopes are often associated with harder materials, which are less permeable and 664
more resistant to gravitational stresses. Moreover, we note that, since various types of loose sediment have angle 665
of repose in range 20° – 35°, terrain slopes exceeding this range provide rather unfavorable conditions for long-666
term deposition of deep granular layers, thus potentially contributing to decreasing levels of gravitational stress 667
accumulation and landslide probability on slopes much steeper than 25°. 668
669
5.1.4 Aspect 670
The relationship between the slope-aspect and predicted landslide occurrence probability is shown in Fig. 12d. As 671
can be seen from this figure, landslide hazard is highest in the north aspect (350°), which can be understood by 672
increased heat absorption and higher humidity levels associated with this aspect (Fig. 12d). Enhanced landslide 673
hazard for slopes facing north and northeast was also found by Demir et al (2013) in the North Anatolian Fault 674
Zone at Kelkit Valley, Turkey. Indeed, soil response to atmospheric events depends on slope facing direction, 675
which influences local precipitation, solar radiation and freeze-thaw processes and is thus an important component 676
in the landslide hazard map (Demir et al. 2013). However, our results indicate that aspect has the smallest influence 677
on landslide hazard in Golestan Province (see Fig. 11). 678
679
5.1.5 Lithology 680
As shown in Fig. 12e, the lowest values of landslide hazard as a function of lithology are associated with Qm 681
(swamp and marsh) and Qsw (swamp) types, i.e., wetlands corresponding to saturated areas and relatively stable 682
soil conditions with respect to landslide. Moreover, our results are consistent with previous observations that 683
DCkh (limestone, locally including gypsum) and TRJs (dark grey shale and sandstone) formations are more prone 684
to landslide occurrence (Ohlmacher, 2000), which is reflected in the high values of landslide hazard obtained from 685
the model (Fig 12e). 686
687
5.1.6 Land use/Land cover 688
The results from the MaxEnt Jackknife test (Fig. 11) suggest land use/land cover as the main anthropogenic factor 689
for landslide hazard in Golestan Province. Moreover, Fig. 12f shows that orchard and forest are the types of land 690

31
with highest influence on landslide hazard. We expect orchard to substantially affect soil conditions and stability 691
through multiple human interferences, such as irrigation. Furthermore, from Fig. 4e and Fig. 6, we see that forest 692
areas occur within the regions associated with the highest landslide hazard levels. Indeed, forest areas are 693
associated with high infiltration levels and have been largely affected by unprincipled road construction, which 694
further contributes to increasing soil instability (Reichenbach et al. 2014; Leventhal & Kotze, 2008). Figure. 12f 695
shows that land use/land cover types agriculture, urban and rangeland lead to similar values of landslide 696
probability, which are nearly twice as large as on rock areas. These results clearly indicate the substantial effect 697
of land use/land cover on landslide hazard and provide a basis for future considerations on land use/land cover 698
practices in Golestan Province with regard to landslide control and mitigation. 699
700
5.1.7 Soil type 701
As expected, Fig. 12g shows that aridisols, consisting of stony clays and silts of slow formation rates and low 702
degree of erodibility, lead to the lowest values of landslide hazard. By contrast, alfisols, mollisols and inceptisols 703
are associated with higher landslide hazard (Fig. 12g), owing to their fine texture and high permeability levels, 704
and given their suitability for land use/land cover. 705
706
5.1.8 Distance to the fault, distance to the river, distance to the road 707
As can be seen from Figs. 12h, 12i and 12j, landslide hazard tends to be consistently smaller the larger the distance 708
to the next fault, river or road. Indeed, it is well known that the amplitude of a given seismic event decreases non-709
linearly with distance from the origin – this behavior is reflected by the dependence of landslide modeling on 710
distance to fault in Golestan Province (Fig. 12h). Zhuang et al. (2010) found that the occurrence rate of earthquake-711
triggered landslides in Beichuan County, China, decreases exponentially with distance to fault. From the data of 712
Fig. 12h, we find that the exponential decay describes approximately the response curve of landslide modeling 713
with distance to fault, as shown in Fig. 13c. Moreover, this figure further shows that the exponential law adjusts 714
reasonably well predicted hazard as a function of distance to river and distance to road. Specifically, the equation 715
used to fit the data in Fig. 13c reads, 716
717 𝑝 = exp(−𝜆𝑥), (12) 718
719

32
where 1/𝜆 denotes a characteristic length that dictates how fast the hazard decreases with distance 𝑥 from the 720
road, river or fault. The best fits to the data in Fig. 13c using Eq. (12) yield 𝜆road ≈ 0.0797 km− for road (𝑅2 ≈721 0.83), 𝜆fault ≈ 0.108 km− for fault (𝑅2 ≈ 0.94) and 𝜆river ≈ 0.734 km− for river (𝑅2 ≈ 0.95). The 722
characteristic decay lengths read, thus, 1 𝜆road⁄ ≈ 12.5 km, 1 𝜆fault⁄ ≈ 9.3 km and 1 𝜆river⁄ ≈ 1.4 km, 723
respectively. Therefore, our results suggest that landslide hazard decreases the slowest with distance to the next 724
road, compared to distance to the next river or fault. 725
726
727
Fig. 11. Results of Jackknife test to estimate the relative influence of the various hazard factors in MaxEnt. Blue 728
bars denote the AUC-ROC obtained with only one factor at a time (under exclusion of all other factors), the 729
green bars give the complementary information and the red bars indicate the total AUC-ROC for MaxEnt. 730
731
732
733
734
33
735
Fig. 12. Response curves of landslide modeling to the conditioning variables as predicted with MaxEnt 736

34
737
738
Fig. 12. continued 739
740
741
742
743
744
745
746
747
748
749

35
750
751
752
753
754
755
756
757
758
759
760
761
762
763
764
765
766
767
768
769
770
771
Fig. 13. Predicted landslide hazard 𝑝 as a function of (a) elevation, (b) slope-angle, and (c) distance to roads, 772
faults and rivers. Dashed and dotted lines denote data from the hazard map, while continuous lines denote best 773
fits using Eqs. (10), (11) and (12) for subplots (a), (b) and (c), respectively. The values of the parameters obtained 774
from these fits read: (a) 𝑎 ≈ 0.58 km, 𝑏 ≈ 0.18 and 𝑐 ≈ 0.83 (𝑅2 ≈ 0.96); (b) 𝜃0 ≈ 25.6°, 𝑝0 ≈ 0.64 and |𝐾| ≈775 6.6 × 10⁻⁴ (𝑅2 ≈ 0.96), and (c) 𝜆road ≈ 0.0797 km-1 (𝑅2 ≈ 0.83), 𝜆fault ≈ 0.108 km-1 (𝑅2 ≈ 0.94) and 776 𝜆river ≈ 0.734 km-1 (𝑅2 ≈ 0.95). 777
778
779
780
781
782
783

36
5.2 Vulnerability and risk: implications for landslide control and mitigation strategies 784
The results discussed in the previous section yield new insights about landslide hazard as a function of the 785
anthropogenic and environmental conditioning variables. For instance, from the considerations above, 786
recommendations can be derived for road construction with regard of the distance to populated areas, while 787
optimization strategies for land use/land cover changes can be developed to decreasing the impact of 788
anthropogenic influences on landslide initiation. 789
790
However, because risk encodes both landslide probability and the associated level of damage, knowledge of the 791
spatial distribution of vulnerability is required to improving risk management. By combining the hazard map (Fig. 792
6) with the vulnerability map (Fig. 9), as described in Section 3.3, it is found that the south and southwest areas 793
of Golestan Province are associated with the highest landslide risk levels. These regions encompass Gorgan city, 794
the center of Golestan Province, and have, correspondingly, particularly high urban population and building 795
density. Risk in Golestan Province has been assessed high throughout the entire region of very high landslide 796
hazard, i.e., from southwest to the east (compare Figs. 6 and 10), but the area of highest risk level is located in the 797
southwest – the location of Gorgan city. The risk level distribution in Fig. 10 provides governmental agencies and 798
stakeholders, thus, with more appropriate information to guide priority plans for landslide mitigation in Golestan 799
Province. 800
5.3 Final remarks and outlook 801
Summarizing, risk is function of vulnerability and hazard. Vulnerability is related to socio-economic factors, while 802
hazard is related to environmental factors. In previous work (Mokhtari et al. 2020), risk was modeled by 803
considering hazard only, thereby incorporating environmental factors, but ignoring vulnerability factors. By 804
contrast, here we considered both vulnerability and hazard to compute the landslide risk map for Golestan 805
Province. Firstly, we obtained the landslide hazard map based on the environmental factors (slope, elevation, etc.) 806
and landslide occurrence observation points. Subsequently, we calculated the landslide vulnerability map based 807
on socio-economic factors (population density, etc.), and obtained the landslide risk map from the combination of 808
both landslide hazard and landslide vulnerability maps. 809
810
It should be noted that including landslide size and duration in our statistics would greatly improve the assessment 811
of landslide distribution. However, unfortunately, in the study area considered in our work, the statistics of the 812

37
extent of sliding and the time of the occurrence of the landslides is not available. Furthermore, our goal in this 813
manuscript is to provide an estimate of landslide occurrence distribution without regard of the time of the duration 814
and size of the individual landslide events. Therefore, the methods employed in our work employ the information 815
on landslide locations to produce the landslide hazard maps. We further refer to previous work in which landslide 816
hazard has been evaluated based solely on landslide occurrence points (Pourghasemi et al., 2013; Aghdam et al., 817
2017; Adineh et al., 2018). 818
819
We further note that we could not monitor the whole area of Golestan Province because it was not possible to 820
access all parts of the map. In the machine learning modeling employed, the distribution of the samples does not 821
affect the modeling process because the geographic locations are not used as input. Rather, the similarity of 822
characteristics in each pixel with trained pixels affects the model output. We nevertheless believe that our analysis 823
is providing a valuable contribution as it is paving the way toward a future quantitative modeling of hazard and 824
vulnerability in Golestan Province, and because our discussion section is including yet unreported mathematical 825
expressions relating landslide hazard and causative factors. These mathematical expressions are physically based 826
and grounded on the dynamics of landslide occurrence that have been discussed extensively in previous work. 827
Therefore, it is noticeable that our statistics, which unfortunately misses the information of duration and 828
magnitude of the individual landslides (not available for Golestan Province), allows us to develop a mathematical 829
model based on the machine learning computations and the observation map. We believe that this first step will 830
motivate future modelers to go beyond the mere computation of a risk map, i.e., that future modelers will follow 831
our work to elaborating mathematical expressions thus increasing both the predictive power and the physical 832
understanding of their Machine Learning results – however by including event duration and magnitude. 833
834
6 Conclusion 835
In conclusion, the landslide risk map was computed for Golestan Province, Iran, from an explicit consideration of 836
all main relevant local human-environmental landslide hazard and vulnerability factors. To this end, the spatial 837
distributions of landslide location occurrences and conditioning variables have been combined using machine 838
learning algorithms – specifically, GARP, SVM and MaxEnt – to obtain a regional landslide hazard model for 839
Golestan Province. This model was then coupled with the information of local landslide vulnerability, by taking 840
the local urban population and building densities, as well as the distance to landslide locations into account. 841

38
Moreover, to generate the landslide vulnerability map, the Fuzzy Analytical Hierarchical Process (FAHP) method 842
was applied. FAHP has been developed for multi-criteria decision-making problems involving many variables 843
and has proven here potentially useful to improving priority landslide control plans. 844
845
Based on our results, empirical expressions were obtained for predicting landslide occurrence probability as a 846
function of elevation, slope-angle, and distance to roads, faults and rivers. It would be interesting to verify the 847
applicability of these equations to other regional settings, based on observations of landslide hazard, to shed light 848
on the physical mechanisms underlying the values of the parameters associated. 849
850
Our results show that, to accurately assessing landslide risk, event occurrence probability must be considered 851
against the background of its potential damage level. Although a strongly landslide-prone region extending from 852
southwest to east of Golestan Province is clearly visible in the hazard map, a subset of this area, which surrounds 853
Gorgan City, is associated with the highest landslide risk level in the risk map. This result is explained by 854
integration of the vulnerability map into the hazard evaluation. More precisely, Gorgan City represents the area 855
of highest urban population density and is located within the regions associated with very high hazard. Moreover, 856
we have found that landslide hazard decreases approximately exponentially with distance to faults, roads and 857
rivers, and that there is an optimal slope for landslide hazard. 858
859
We emphasize that the computation of risk performed here relies on knowledge about the distribution of the main 860
conditioning variables, and that changes in the specific choice and relative weights of the vulnerability factors 861
may lead to slight differences in the final risk map. Therefore, these weights must be estimated a priori, from 862
reliable and comprehensive data on local socio-economic and environmental conditions. As shown here, FAHP 863
indicated consistent estimates of the different vulnerability factor weights. Moreover, we have found similar 864
results for landside hazard distribution without regard of the machine learning method considered – 865
notwithstanding the observed differences in model accuracy – thus allowing us to discuss on the functional 866
relationship between hazard and the different conditioning variables. Our findings provide insights for the 867
assessment of landslide hazard, anthropogenic influences and risk, and are relevant to local governmental agencies 868
and stakeholders with regard to optimizing regional landslide control, mitigation and management. 869
870

39
Acknowledgments 871
The authors wish to thank the Geological Survey and Mineral Explorations of Iran (GSI) for preparing maps, data 872
and reports. EJRP thanks the German Research Foundation for funding through the Heisenberg Programme 873
(project number 434377576). 874
Compliance with ethical standards 875
Conflicts of interest Authors declare they have no conflict of interest 876
References 877
Abay, A., Barbieri, G., & Woldearegay, K. (2019). GIS-based Landslide Susceptibility Evaluation Using 878
Analytical Hierarchy Process (AHP) Approach: The Case of Tarmaber District, Ethiopia. Momona 879
Ethiopian Journal of Science, 11(1): 14-36. 880
Abdulwahid, W. M., & Pradhan, B. (2017). Landslide vulnerability and risk assessment for multi-hazard scenarios 881
using airborne laser scanning data (LiDAR). Landslides, 14(3): 1057-1076. 882
Abedini, M., Ghasemian, B. & Shirzadi, A. (2014). Modeling landslide hazard using statistical model of logistic 883
regression (case study: Kurdistan province, Bijar city). Geography and Development 37: 85-102. (In 884
Persian) 885
Achour, Y. & Pourghasemi, H. R. (2020). How do machine learning techniques help in increasing accuracy of 886
landslide susceptibility maps? Geoscientific Frontiers 11(3): 871-883. 887
Adineh, F., Motamedvaziri, B., Ahmadi, H., & Moeini, A. (2018). Landslide susceptibility mapping using Genetic 888
Algorithm for the Rule Set Production (GARP) model. Journal of Mountain Science, 15(9): 2013-2026. 889
Alkhasawneh, M. S., Ngah, U. K., Tay, L. T., & Isa, N. A. M. (2014). Determination of importance for 890
comprehensive topographic factors on landslide hazard mapping using artificial neural 891
network. Environmental earth sciences, 72(3): 787-799. 892
Allen, M. B., Ghassemi, M. R., Shahrabi, M., & Qorashi, M. (2003). Accommodation of late Cenozoic oblique 893
shortening in the Alborz range, northern Iran. Journal of structural geology, 25(5): 659-672. 894
Alonso, J. A. & Lamata, M. T. (2006). Consistency in the analytic hierarchy process: a new approach. 895
International Journal of Uncertainty, Fuzziness and Knowledge-Based Systems, 14(4): 445-459. 896

40
Althuwaynee, O. F., Pradhan, B., & Ahmad, N. (2015). Estimation of rainfall threshold and its use in landslide 897
hazard mapping of Kuala Lumpur metropolitan and surrounding areas. Landslides, 12(5): 861-875. 898
Armaş, I. (2011). An analytic multicriteria hierarchical approach to assess landslide vulnerability. Case study: 899
Cornu village, Subcarpathian Prahova Valley/Romania. Zeitschrift für Geomorphologie, 55(2): 209-229. 900
Ashournejad, Q., Hosseini, A., Pradhan, B., & Hosseini, S. J. (2019). Hazard zoning for spatial planning using 901
GIS-based landslide susceptibility assessment: a new hybrid integrated data-driven and knowledge-based 902
model. Arabian Journal of Geosciences, 12(4): 126. 903
Axen, G. J., Lam, P. S., Grove, M., Stockli, D. F., & Hassanzadeh, J. (2001). Exhumation of the west-central 904
Alborz Mountains, Iran, Caspian subsidence, and collision-related tectonics. Geology, 29(6): 559-562. 905
Azareh, A., Rahmati, O., Rafiei-Sardooi, E., Sankey, J. B., Lee, S., Shahabi, H., & Ahmad, B. B. (2019). 906
Modelling gully-erosion susceptibility in a semi-arid region, Iran: Investigation of applicability of 907
certainty factor and maximum entropy models. Science of the Total Environment, 655: 684-696. 908
Ballabio, C., & Sterlacchini, S. (2012). Support vector machines for landslide susceptibility mapping: the Staffora 909
River Basin case study, Italy. Mathematical geosciences, 44(1): 47-70. 910
Beakawi Al-Hashemi, H. M. & Baghabra Al-Amoudi, O. (2018). A review on the angle of repose of granular 911
materials. Powder Technology. 330: 397-417. 912
Bhushan, N., & Rai, K. (2007). Strategic decision making: applying the analytic hierarchy process. Springer 913
Science & Business Media.1-171. 914
Boeckmann, M., & Joyner, T. A. (2014). Old health risks in new places? An ecological niche model for I. ricinus 915
tick distribution in Europe under a changing climate. Health & Place, 30: 70-77. 916
Brabb, E. E. (1985). Innovative approaches to landslide hazard and risk mapping. In International Landslide 917
Symposium Proceedings, Toronto, Canada.1: 17-22. 918
Brenning, A., Schwinn, M., Ruiz-Páez, A. P. & Muenchow, J. (2015). Landslide susceptibility near highways is 919
increased by 1 order of magnitude in the Andes of southern Ecuador, Loja province, Natural Hazards 920
and Earth System Science, 15: 45–57. 921
Bui, D. T., Tsangaratos, P., Nguyen, V. T., Van Liem, N., & Trinh, P. T. (2020). Comparing the prediction 922
performance of a Deep Learning Neural Network model with conventional machine learning models in 923
landslide susceptibility assessment. Catena, 188, 104426. 924
Carver, S. J. (1991). Integrating multi-criteria evaluation with geographical information systems. International 925
Journal of Geographical Information System, 5(3): 321-339. 926

41
Catani, F., Lagomarsino, D., Segoni, S. & Tofani, V. (2013). Landslide susceptibility estimation by random forests 927
technique: sensitivity and scaling issues, Natural Hazards and Earth System Sciences 13: 2815–2831. 928
Chacon, J., Irigaray, C., Fernandez, T. E. l., Hamdouni, R., (2006). Engineering geology maps: landslides and 929
geographical information systems. Bulletin of Engineering Geology and the Environment 65: 341-411 . 930
Chen, W., Li, W., Chai, H., Hou, E., Li, X., & Ding, X. (2016). GIS-based landslide susceptibility mapping using 931
analytical hierarchy process (AHP) and certainty factor (CF) models for the Baozhong region of Baoji 932
City, China. Environmental Earth Sciences, 75(1): 63. 933
Chen, W., Pourghasemi, H. R., Kornejady, A., & Zhang, N. (2017a). Landslide spatial modeling: Introducing new 934
ensembles of ANN, MaxEnt, and SVM machine learning techniques. Geoderma, 305: 314-327. 935
Chen, W., Pourghasemi, H. R., Panahi, M., Kornejady, A., Wang, J., Xie, X., & Cao, S. (2017b). Spatial prediction 936
of landslide susceptibility using an adaptive neuro-fuzzy inference system combined with frequency 937
ratio, generalized additive model, and support vector machine techniques. Geomorphology, 297: 69-85. 938
Convertino, M., Troccoli, A., & Catani, F. (2013). Detecting fingerprints of landslide drivers: a MaxEnt 939
model. Journal of Geophysical Research: Earth Surface, 118(3): 1367-1386. 940
Corominas J., van Westen C., Frattini P., Cascini L., Malet J. P., Fotopoulou S., Catani F., Van Den Eeckhaut 941
M., Mavrouli O., Agliardi F., Pitilakis K., Winter M. G., Pastor M., Ferlisi S., Tofani V., Hervás J. & 942
Smith J. T., (2014). Recommendations for the quantitative analysis of landslide risk. Bulletin of 943
Engineering Geology and the Environment 73:209-263. 944
Cutter, S. L., Boruff, B. J., & Shirley, W. L. (2003). Social vulnerability to environmental hazards. Social Science 945
Quarterly, 84(2): 242-261. 946
Dai, F. C., & Lee, C. F. (2002). Landslide characteristics and slope instability modeling using GIS, Lantau Island, 947
Hong Kong. Geomorphology, 42(3-4): 213-228. 948
Dai, F. C., Lee, C. F., & Ngai, Y. Y. (2002). Landslide risk assessment and management: an 949
overview. Engineering Geology, 64(1): 65-87. 950
Dai, F. C., Lee, C. F., Li, J. X. Z. W., & Xu, Z. W. (2001). Assessment of landslide susceptibility on the natural 951
terrain of Lantau Island, Hong Kong. Environmental Geology, 40(3): 381-391. 952
Darabi, H., Choubin, B., Rahmati, O., Haghighi, A. T., Pradhan, B., & Kløve, B. (2019). Urban flood risk mapping 953
using the GARP and QUEST models: A comparative study of machine learning techniques. Journal of 954
Hydrology, 569: 142-154. 955

42
de Blasio, F. V. (2011). Introduction to the Physics of Landslides: Lecture Notes on the Dynamics of Mass 956
Wasting. Springer Science & Business Media, 408 pp. 957
de Souza Muñoz, M. E., De Giovanni, R., de Siqueira, M. F., Sutton, T., Brewer, P., Pereira, R. S., ... & Canhos, 958
V. P. (2011). openModeller: a generic approach to species’ potential distribution 959
modelling. GeoInformatica, 15(1): 111-135. 960
Demir, G., Aytekin, M., Akgün, A., Ikizler, S. B., & Tatar, O. (2013). A comparison of landslide susceptibility 961
mapping of the eastern part of the North Anatolian Fault Zone (Turkey) by likelihood-frequency ratio 962
and analytic hierarchy process methods. Natural Hazards, 65(3): 1481-1506. 963
Dewan, A. (2013). Floods in a megacity: geospatial techniques in assessing hazards, risk and vulnerability. 964
Dordrecht: Springer. 119-156. 965
Dhurmea, K. R., Boojhawon, R., & Rughooputh, S. D. D. V. (2009). Geostatistical approaches for estimating 966
rainfall over Mauritius. 3rd Research Week, 2010. 967
Duman, T. Y., Can, T., Gokceoglu, C., Nefeslioglu, H. A., & Sonmez, H. (2006). Application of logistic regression 968
for landslide susceptibility zoning of Cekmece Area, Istanbul, Turkey. Environmental Geology, 51(2): 969
241-256. 970
Dymond, J. R., Ausseil, A. G., Shepherd, J. D., & Buettner, L. (2006). Validation of a region-wide model of 971
landslide susceptibility in the Manawatu–Wanganui region of New Zealand. Geomorphology, 74(1-4): 972
70-79. 973
El Bcharia, F., Theilen-Willigeb, B., & Malek, H. A. (2019, July). Landslide hazard zonation assessment using 974
GIS analysis at the coastal area of Safi (Morocco). In Proceedings of the ICA (Vol. 2). 975
Elith, J., Phillips, S. J., Hastie, T., Dudík, M., Chee, Y. E., & Yates, C. J. (2011). A statistical explanation of 976
MaxEnt for ecologists. Diversity and distributions, 17(1): 43-57. 977
Ercanoglu, M., & Gokceoglu, C. (2002). Assessment of landslide susceptibility for a landslide-prone area (north 978
of Yenice, NW Turkey) by fuzzy approach. Environmental Geology, 41(6): 720-730. 979
Ercanoglu, M., & Gokceoglu, C. (2004). Use of fuzzy relations to produce landslide susceptibility map of a 980
landslide prone area (West Black Sea Region, Turkey). Engineering Geology, 75(3-4): 229-250. 981
Erener, A., & Düzgün, H. S. B. (2012). Landslide susceptibility assessment: what are the effects of mapping unit 982
and mapping method? Environmental Earth Sciences, 66(3): 859-877. 983

43
Feizizadeh, B., Blaschke, T., Nazmfar, H., & Rezaei Moghaddam, M. H. (2013). Landslide susceptibility mapping 984
for the Urmia Lake basin, Iran: a multi-criteria evaluation approach using GIS. International Journal of 985
Environmental Research, 7(2): 319-336. 986
Feizizadeh, B., Jankowski, P., & Blaschke, T. (2014). A GIS based spatially-explicit sensitivity and uncertainty 987
analysis approach for multi-criteria decision analysis. Computers & Geosciences, 64: 81-95. 988
Felicísimo, Á. M., Cuartero, A., Remondo, J., & Quirós, E. (2013). Mapping landslide susceptibility with logistic 989
regression, multiple adaptive regression splines, classification and regression trees, and maximum 990
entropy methods: a comparative study. Landslides, 10(2): 175-189. 991
Fell, R., Corominas, J., Bonnard, C., Cascini, L., Leroi, E., & Savage, W. Z. (2008). Guidelines for landslide 992
susceptibility, hazard and risk zoning for land-use planning. Engineering Geology, 102(3-4), 99-111. 993
Fielding, A. H., & Bell, J. F. (1997). A review of methods for the assessment of prediction errors in conservation 994
presence/absence models. Environmental Conservation, 24(1): 38-49. 995
Frigerio, I., & De Amicis, M. (2016). Mapping social vulnerability to natural hazards in Italy: A suitable tool for 996
risk mitigation strategies. Environmental Science & Policy, 63: 187-196. 997
Galli, M & Guzzetti, F (2007). Landslide vulnerability criteria: A case study from Umbria, central Italy. 998
Environmental Management, 40: 649-664. 999
Ghorbanzadeh, O., Blaschke, T., Gholamnia, K., Meena, S. R., Tiede, D., & Aryal, J. (2019). Evaluation of 1000
different machine learning methods and deep-learning convolutional neural networks for landslide 1001
detection. Remote Sensing, 11(2): 196. 1002
Glade, T. and Crozier, M.J., (2005a). The nature of landslide hazard impact. In: Glade, T., Anderson, M.G. and 1003
Crozier, M.J. (eds.) Landslide risk assessment. John Wiley, 43-74 . 1004
Glade, T. and Crozier, M.J., (2005b). A review of scale dependency in landslide hazard and risk analysis. In: 1005
Glade, T., Anderson, M.G. and Crozier, M.J. (eds.) Landslide hazard and risk, John Wiley, 75-138 . 1006
Glade, T., Anderson, M. G. and Crozier, M. J. (eds.), (2005c). Landslide risk assessment, John Wiley, 832 p . 1007
Goetz, J. N., Brenning, A., Petschko, H., & Leopold, P. (2015). Evaluating machine learning and statistical 1008
prediction techniques for landslide susceptibility modeling. Computers & Geosciences, 81: 1-11. 1009
Gorsevski, P. V., & Jankowski, P. (2010). An optimized solution of multi-criteria evaluation analysis of landslide 1010
susceptibility using fuzzy sets and Kalman filter. Computers & Geosciences, 36(8): 1005-1020. 1011

44
Gorsevski, P. V., Gessler, P. E., Boll, J., Elliot, W. J., & Foltz, R. B. (2006). Spatially and temporally distributed 1012
modeling of landslide susceptibility. Geomorphology, 80(3-4): 178-198. 1013
Guillard-Gonçalves, C., & Zêzere, J. (2018). Combining Social Vulnerability and Physical Vulnerability to 1014
Analyse Landslide Risk at the Municipal Scale. Geosciences, 8(8): 294. 1015
Guzzetti, F., (2005), Landslide Hazard and Risk Assessment. PhD dissertation, Rheinischen Friedrich-1016
Wilhelms-Univestitat Bonn, Germany, p. 373 . 1017
Guzzetti, F., Mondini, A. C., Cardinali, M., Fiorucci, F., Santangelo, M., Chang, k.T., (2012). Landslide 1018
inventory maps: New tools for an old problem. Earth-Science Reviews, 112:42-66 . 1019
Guzzetti, F., Mondini, A. C., Cardinali, M., Fiorucci, F., Santangelo, M., Chang, k.T., (2012). Landslide 1020
inventory maps: New tools for an old problem. Earth-Science Reviews, 112:42-66. 1021
Hastie, T., Tibshirani, R., & Friedman, J. (2017). The Elements of Statistical Learning: Data Mining, Inference, 1022
and Prediction. Springer, New York, 745 pp. 1023
Hervas, J., Bobrowsky, P., 2009. Mapping: Inventories, Susceptibility, Hazard and Risk: in book on Landslides 1024
- Disaster Risk Reduction, Springer-Verlag Berlin Heidelberg, ISBN: 978-3-540-69966-8, pp. 1025
Hofmann, T., Schölkopf, B., & Smola, A. J. (2008). Kernel methods in machine learning. The Annals of Statistics, 1026
1171-1220. 1027
Hong, H., Naghibi, S.A., Pourghasemi, H.R. & Pradhan, B. (2016). GIS-based landslide spatial modeling in 1028
Ganzhou City, China. Arab. J. Geosci. 9 (2): 1–26. 1029
Hong, Y., Adler, R., & Huffman, G. (2006). Evaluation of the potential of NASA multi‐satellite precipitation 1030
analysis in global landslide hazard assessment. Geophysical Research Letters, 33(22). 1031
Kalantar, B., Pradhan, B., Naghibi, S. A., Motevalli, A., & Mansor, S. (2018). Assessment of the effects of training 1032
data selection on the landslide susceptibility mapping: a comparison between support vector machine 1033
(SVM), logistic regression (LR) and artificial neural networks (ANN). Geomatics, Natural Hazards and 1034
Risk, 9(1): 49-69. 1035
Karsli, F., Atasoy, M., Yalcin, A., Reis, S., Demir, O. & Gokceoglu, C. (2009). Effects of land-use changes on 1036
landslides in a landslide-prone area (Ardesen, Rize, NE Turkey). Environmental Monitoring and 1037
Assessment 156: 241-255. 1038
Kawagoe, S., Kazama, S., & Sarukkalige, P. R. (2010). Probabilistic modelling of rainfall induced landslide 1039
hazard assessment. Hydrology and Earth System Sciences, 14(6): 1047-1061. 1040

45
Kecman, V. (2005). Support vector machines–an introduction. In Support vector machines: theory and 1041
applications.Springer, Berlin, Heidelberg. 1-47. 1042
Kjekstad, O., & Highland, L. (2009). Economic and social impacts of landslides. In Landslides–disaster risk 1043
reduction. Springer, Berlin, Heidelberg. 573-587. 1044
Kornejady, A., Ownegh, M., & Bahremand, A. (2017). Landslide susceptibility assessment using maximum 1045
entropy model with two different data sampling methods. Catena, 152: 144-162. 1046
Kumar, R., & Anbalagan, R. (2015). Landslide susceptibility zonation in part of Tehri reservoir region using 1047
frequency ratio, fuzzy logic and GIS. Journal of Earth System Science, 124(2): 431-448. 1048
Kumar, S., & Stohlgren, T. J. (2009). Maxent modeling for predicting suitable habitat for threatened and 1049
endangered tree Canacomyrica monticola in New Caledonia. Journal of Ecology and the Natural 1050
Environment, 1(4): 094-098. 1051
Lato, M. J., Anderson, S., & Porter, M. J. (2019). Reducing Landslide Risk Using Airborne Lidar Scanning 1052
Data. Journal of Geotechnical and Geoenvironmental Engineering, 145(9): 06019004. 1053
Lee, S. (2007). Application and verification of fuzzy algebraic operators to landslide susceptibility 1054
mapping. Environmental Geology, 52(4): 615-623. 1055
Lee, S., Hong, S. M., & Jung, H. S. (2017). A support vector machine for landslide susceptibility mapping in 1056
Gangwon Province, Korea. Sustainability, 9(1): 48. 1057
Lepore, C., Kamal, S. A., Shanahan, P., & Bras, R. L. (2012). Rainfall-induced landslide susceptibility zonation 1058
of Puerto Rico. Environmental Earth Sciences, 66(6): 1667-1681. 1059
Leung, L. C., & Cao, D. (2000). On consistency and ranking of alternatives in fuzzy AHP. European journal of 1060
operational research, 124(1):102-113. 1061
Leventhal, A. R., & Kotze, G. P. (2008). Landslide susceptibility and hazard mapping in Australia for land-use 1062
planning—with reference to challenges in metropolitan suburbia. Engineering Geology, 102(3-4): 238-1063
250. 1064
Malczewski, J. (1999). GIS and multicriteria decision analysis. John Wiley & Sons. 1-134. 1065
Marjanović, M., Kovačević, M., Bajat, B., & Voženílek, V. (2011). Landslide susceptibility assessment using 1066
SVM machine learning algorithm. Engineering Geology, 123(3): 225-234. 1067
Mehrnews (2020, May 5). Retrieved from https://www.mehrnews.com/news/4917132 1068

46
Michael, E. A., & Samanta, S. (2016). Landslide vulnerability mapping (LVM) using weighted linear combination 1069
(WLC) model through remote sensing and GIS techniques. Modeling Earth Systems and 1070
Environment, 2(2): 88. 1071
Mirzaei, G., Soltani, A., Soltani, M., & Darabi, M. (2018). An integrated data-mining and multi-criteria decision-1072
making approach for hazard-based object ranking with a focus on landslides and floods. Environmental 1073
Earth Sciences, 77(16): 581. 1074
Mohammady, M., Pourghasemi, H. R., & Pradhan, B. (2012). Landslide susceptibility mapping at Golestan 1075
Province, Iran: a comparison between frequency ratio, Dempster–Shafer, and weights-of-evidence 1076
models. Journal of Asian Earth Sciences, 61: 221-236. 1077
Mohan, A., Singh, A. K., Kumar, B., & Dwivedi, R. (2020). Review on remote sensing methods for landslide 1078
detection using machine and deep learning. Transactions on Emerging Telecommunications 1079
Technologies, e3998. 1080
Mokhtari, M., & Abedian, S. (2019). Spatial prediction of landslide susceptibility in Taleghan basin, 1081
Iran. Stochastic Environmental Research and Risk Assessment, 33(7): 1297-1325. 1082
Mokhtari, M., Hoseinzade, Z., & Shirani, K. (2020). A comparison study on landslide prediction through FAHP 1083
and Dempster–Shafer methods and their evaluation by P–A plots. Environmental Earth Sciences, 79(3): 1084
1-13. 1085
Mosavi, A., Sajedi-Hosseini, F., Choubin, B., Taromideh, F., Rahi, G., & Dineva, A. A. (2020). Susceptibility 1086
mapping of soil water erosion using machine learning models. Water, 12(7): 1995. 1087
Murillo-García, F. G., Rossi, M., Ardizzone, F., Fiorucci, F., & Alcántara-Ayala, I. (2017). Hazard and population 1088
vulnerability analysis: a step towards landslide risk assessment. Journal of Mountain Science, 14(7): 1089
1241-1261. 1090
Murillo-García, F., Rossi, M., Fiorucci, F., & Alcántara-Ayala, I. (2015). Population Landslide vulnerability 1091
evaluation: The case of the indigenous population of Pahuatlán-Puebla, Mexico. In Engineering Geology 1092
for Society and Territory, Springer, Cham. 2: 793-1797. 1093
Neuhäuser, B., & Terhorst, B. (2007). Landslide susceptibility assessment using “weights-of-evidence” applied 1094
to a study area at the Jurassic escarpment (SW-Germany). Geomorphology, 86(1-2): 12-24. 1095
Ngo, P. T. T., Panahi, M., Khosravi, K., Ghorbanzadeh, O., Kariminejad, N., Cerda, A., & Lee, S. (2021). 1096
Evaluation of deep learning algorithms for national scale landslide susceptibility mapping of 1097
Iran. Geoscience Frontiers, 12(2): 505-519. 1098

47
Ohlmacher, G. C. (2000). The Relationship between geology and landslide hazards of Atchison, Kansas, and 1099
vicinity. Midcontinent Geoscience, 1-16. 1100
Ohta, K., Kobashi, G., Takano, S., Kagaya, S., Yamada, H., Minakami, H., & Yamamura, E. (2007). Analysis of 1101
the geographical accessibility of neurosurgical emergency hospitals in Sapporo city using GIS and 1102
AHP. International Journal of Geographical Information Science, 21(6): 687-698. 1103
Pachauri, A. K., Gupta, P. V., & Chander, R. (1998). Landslide zoning in a part of the Garhwal 1104
Himalayas. Environmental Geology, 36(3-4): 325-334. 1105
Pandey, V. K., Pourghasemi, H. R., & Sharma, M. C. (2020). Landslide susceptibility mapping using maximum 1106
entropy and support vector machine models along the Highway Corridor, Garhwal Himalaya. Geocarto 1107
International, 35(2): 168-187. 1108
Park, N. W. (2015). Using maximum entropy modeling for landslide susceptibility mapping with multiple 1109
geoenvironmental data sets. Environmental Earth Sciences, 73(3): 937-949. 1110
Parteli, E. J. R., Schmidt, J., Blümel, C., Wirth, K.-E., Peukert, W. & Pöschel, T. (2014). Attractive particle 1111
interaction forces and packing density of fine glass powders. Scientific Reports, 4(1): 1-7. 1112
Pearce, J. & Ferrier, S. (2000) Evaluating the predictive performance of habitat models developed using logistic 1113
regression. Ecological Modelling, 133: 225 –245. 1114
Peng, L., Niu, R., Huang, B., Wu, X., Zhao, Y., & Ye, R. (2014). Landslide susceptibility mapping based on rough 1115
set theory and support vector machines: A case of the Three Gorges area, China. Geomorphology, 204: 1116
287-301. 1117
Peterson, A.T., Ball, L.G. & Cohoon, K.P., (2002a). Predicting distributions of Mexican birds using ecological 1118
niche modelling methods. Ibis, 144(1): 27-32. 1119
Pham, B. T., Bui, D. T., & Prakash, I. (2018). Bagging based Support Vector Machines for spatial prediction of 1120
landslides. Environmental Earth Sciences, 77(4): 146. 1121
Phillips, S. J., Anderson, R. P., & Schapire, R. E. (2006). Maximum entropy modeling of species geographic 1122
distributions. Ecological Modelling, 190(3-4): 231-259. 1123
Phillips, S. J., Dudík, M., & Schapire, R. E. (2004, July). A maximum entropy approach to species distribution 1124
modeling. In Proceedings of the twenty-first international conference on Machine learning (p. 83). ACM. 1125
Phillips, S.J. & Dudı´k, M. (2008) Modeling of species distributions with Maxent: new extensions and a 1126
comprehensive evaluation. Ecography, 31: 161–175. 1127

48
Phillips, S.J., Dudı´k, M., Elith, J., Graham, C.H., Lehmann, A., Leathwick, J. & Ferrier, S. (2009) Sample 1128
selection bias and presence-only distribution models: implications for background and pseudo-absence 1129
data. Ecological Applications, 19: 181–197. 1130
Pontius Jr, R. G., & Schneider, L. C. 2001. Land-cover change model validation by a ROC method for the Ipswich 1131
watershed, Massachusetts, USA. Agriculture, Ecosystems & Environment, 85(1-3): 239-248. 1132
Pourghasemi, H. R., & Kerle, N. (2016). Random forests and evidential belief function-based landslide 1133
susceptibility assessment in Western Mazandaran Province, Iran. Environmental Earth 1134
Sciences, 75(3):185. 1135
Pourghasemi, H. R., Jirandeh, A. G., Pradhan, B., Xu, C. & Gokceogluet, C. (2013). Landslide susceptibility 1136
mapping using support vector machine and GIS at the Golestan Province, Iran. Journal of Earth System 1137
Sciences 122:349–369. 1138
Pourghasemi, H. R., Kariminejad, N., Amiri, M., Edalat, M., Zarafshar, M., Blaschke, T. & Cerda, A. (2020). 1139
Assessing and mapping multi-hazard risk susceptibility using a machine learning technique. Scientific 1140
Reports,10: 3203. 1141
Pourghasemi, H. R., Pradhan, B., & Gokceoglu, C. (2012). Application of fuzzy logic and analytical hierarchy 1142
process (AHP) to landslide susceptibility mapping at Haraz watershed, Iran. Natural Hazards, 63(2): 965-1143
996. 1144
Pradhan, B., Sezer, E. A., Gokceoglu, C., & Buchroithner, M. F. (2010). Landslide susceptibility mapping by 1145
neuro-fuzzy approach in a landslide-prone area (Cameron Highlands, Malaysia). IEEE Transactions on 1146
Geoscience and Remote Sensing, 48(12): 4164-4177. 1147
Radbruch-Hall, D. H., & Varnes, D. J. (1976). Landslides—cause and effect. Bulletin of the International 1148
Association of Engineering Geology-Bulletin de l'Association Internationale de Géologie de 1149
l'Ingénieur, 13(1): 205-216. 1150
Rahmati, O., Golkarian, A., Biggs, T., Keesstra, S., Mohammadi, F., & Daliakopoulos, I. N. (2019). Land 1151
subsidence hazard modeling: Machine learning to identify predictors and the role of human 1152
activities. Journal of Environmental Management, 236: 466-480. 1153
Reichenbach, P, Mondini, A. & Rossi, M. (2014). The influence of land use change on landslide susceptibility 1154
zonation: the Briga catchment test site (Messina, Italy). Environmental Management, 54(6): 1372-1384. 1155
49
Remondo, J., Bonachea, J., & Cendrero, A. (2008). Quantitative landslide risk assessment and mapping on the 1156
basis of recent occurrences. Geomorphology, 94(3-4): 496-507. 1157
Roodposhti, M. S., Rahimi, S., & Beglou, M. J. (2014). PROMETHEE II and fuzzy AHP: an enhanced GIS-based 1158
landslide susceptibility mapping. Natural Hazards, 73(1): 77-95. 1159
Roy, J., & Saha, S. (2019). Landslide susceptibility mapping using knowledge driven statistical models in 1160
Darjeeling District, West Bengal, India. Geoenvironmental Disasters, 6(1): 11. 1161
Saaty, T. L. (1977). A scaling method for priorities in hierarchical structures. Journal of Mathematical 1162
Psychology, 15(3): 234-281. 1163
Salarian, T., Zare, M., Jouri, M. H., Miarrostami, S., & Mahmoudi, M. (2014). Evaluation of shallow landslides 1164
hazard using artificial neural network of Multi-Layer Perceptron method in Subalpine Grassland (Case 1165
study: Glandrood watershed-Mazandaran). International Journal of Agriculture and Crop 1166
Sciences, 7(11): 795. 1167
Sánchez-Flores, E. (2007). GARP modeling of natural and human factors affecting the potential distribution of 1168
the invasives Schismus arabicus and Brassica tournefortii in ‘El Pinacate y Gran Desierto de 1169
Altar’Biosphere Reserve. Ecological Modelling, 204(3-4): 457-474. 1170
Schmidt, J., Parteli, E. J. R., Uhlmann, N., Wörlein, N., Wirth, K.-E., Pöschel, T. & Peukert, W. (2020). Packings 1171
of micron-sized spherical particles - insights from bulk density determination, X-ray microtomography 1172
and discrete element simulations. Advanced Powder Technology 31: 2293-2304. 1173
Schneiderbauer, S., & Ehrlich, D. (2004). Risk, hazard and people’s vulnerability to natural hazards. A review of 1174
definitions, concepts and data. European Commission Joint Research Centre. EUR, 21410: 40. 1175
Sevgen, E., Kocaman, S., Nefeslioglu, H. A., & Gokceoglu, C. (2019). A novel performance assessment approach 1176
using photogrammetric techniques for landslide susceptibility mapping with logistic regression, ANN 1177
and random forest. Sensors, 19(18): 3940. 1178
Shanmugam, G. & Wang, Y. (2015). The landslide problem. Journal of Palaeogeography. 4(2): 109-166. 1179
Sharma, L. P., Patel, N., Ghose, M. K., & Debnath, P. (2013). Synergistic application of fuzzy logic and geo-1180
informatics for landslide vulnerability zonation—a case study in Sikkim Himalayas, India. Applied 1181
Geomatics, 5(4): 271-284. 1182
Sidle, R., & Ochiai, H. (2006). Processes, prediction, and land use. Water resources monograph. American 1183
Geophysical Union, Washington. 1-307. 1184

50
Stockman, A. K., Beamer, D. A., & Bond, J. E. (2006). An evaluation of a GARP model as an approach to 1185
predicting the spatial distribution of non‐vagile invertebrate species. Diversity and Distributions, 12(1): 1186
81-89. 1187
Stockwell, D. (1999). The GARP modelling system: problems and solutions to automated spatial 1188
prediction. International Journal of Geographical Information Science, 13(2): 143-158. 1189
Stockwell, D. R., & Noble, I. R. (1992). Induction of sets of rules from animal distribution data: a robust and 1190
informative method of data analysis. Mathematics and Computers in Simulation, 33(5-6): 385-390. 1191
Suzen, M. L., Doyuran, V., (2004a). A comparison of the GIS based landslide susceptibility assessment methods: 1192
multivariate versus bivariate. Environ Geol, 45:665-679. 1193
Suzen, M. L., Doyuran, V., (2004b). Data driven bivariate landslide susceptibility assessment using 1194
geographical information systems: a method and application to Asarsuyu catchment, Turkey, Eng. 1195
Geol., 71:303-352. 1196
Taxonomy, S. (2003). Soil survey staff. Keys to Soil Taxonomy. USDA, Ninth Edition, 332p. 1197
Tazik, E., Jahantab, Z., Bakhtiari, M., Rezaei, A., & Alavipanah, S. K. (2014). Landslide susceptibility mapping 1198
by combining the three methods fuzzy logic, frequency ratio and analytical hierarchy process in Dozain 1199
basin. The International Archives of Photogrammetry, Remote Sensing and Spatial Information 1200
Sciences, 40(2): 267. 1201
Tobin, G.A. & Montz, B.E., (1997). Natural Hazards: Explanation and Integration. The Guilford Press, New York, 1202
388p. 1203
Tourani, M., Caglayan, A., Saber, R., Isik, V. (2021). Determination of Land Subsidence in Gorgan Plain with 1204
Insar Method (Golestan, NE Iran). In book: Geoscience for Society, Education and Environment. 1205
Chapter: 3.11. Publisher: Romanian Society of Applied Geophysics (SGAR). 1206
Townsend Peterson, A., Papeş, M., & Eaton, M. (2007). Transferability and model evaluation in ecological niche 1207
modeling: a comparison of GARP and Maxent. Ecography, 30(4): 550-560. 1208
Uzielli, M., Nadim, F., Lacasse, S., & Kaynia, A. M. (2008). A conceptual framework for quantitative estimation 1209
of physical vulnerability to landslides. Engineering Geology, 102(3-4): 251-256. 1210
Vahidnia, M. H., Alesheikh, A. A., Alimohammadi, A., & Hosseinali, F. (2010). A GIS-based neuro-fuzzy 1211
procedure for integrating knowledge and data in landslide susceptibility mapping. Computers & 1212
Geosciences, 36(9): 1101-1114. 1213

51
Vakhshoori, V., Pourghasemi, H. R., Zare, M., & Blaschke, T. (2019). Landslide Susceptibility Mapping Using 1214
GIS-Based Data Mining Algorithms. Water, 11(11): 2292. 1215
Van Den Eeckhaut, M., Hervás, J., Jaedicke, C., Malet, J. P., Montanarella, L., & Nadim, F. (2012). Statistical 1216
modelling of Europe-wide landslide susceptibility using limited landslide inventory 1217
data. Landslides, 9(3): 357-369. 1218
van Westen, C. J., Van Asch, T.W.J., Soeters, R., (2005). Landslide hazard and risk zonation; why is it still so 1219
difficult? Bulletin of Engineering geology and the Environment 65 (2): 167-184. 1220
Vapnik, V.N., (1999). The Nature of Statistical Learning Theory. Second Edition, Springer Verlag, New York, 1221
314p. 1222
Varnes, D. J., (1984). Landslide hazard zonation: a review of principles and practice. The UNESCO Press, 1223
Paris, No 3, 63 pp. 1224
Wang, H., Zhang, J., & Lin, H. (2019). Satellite-based analysis of landfill landslide: the case of the 2015 Shenzhen 1225
landslide. International Journal of Geotechnical Engineering, 1-8. 1226
Wang, S., Xu, Q., & Luo, B. (2017). Vulnerability analysis and susceptibility evaluation of landslides based on 1227
fractal theory in Nanjiang County. Hydrogeol Eng Geol, 44(3): 119-126. 1228
Wang, X. Y., Huang, X. L., Jiang, L. Y., & Qiao, G. X. (2010). Predicting potential distribution of chestnut 1229
phylloxerid (Hemiptera: Phylloxeridae) based on GARP and Maxent ecological niche models. Journal 1230
of Applied Entomology, 134(1): 45-54. 1231
Wang, Y., Xie, B., Wan, F., & Xiao, Q. (2007). Application of ROC curve analysis in evaluating the performance 1232
of alien species' potential distribution models. Biodiversity Science, 15(4): 365-372. 1233
Xiao, L., Zhang, Y., & Peng, G. (2018). Landslide susceptibility assessment using integrated deep learning 1234
algorithm along the China-Nepal highway. Sensors, 18(12):4436. 1235
Yalcin, A. (2008). GIS-based landslide susceptibility mapping using analytical hierarchy process and bivariate 1236
statistics in Ardesen (Turkey): comparisons of results and confirmations. Catena, 72(1): 1-12. 1237
Yao, X., Tham, L. G., & Dai, F. C. (2008). Landslide susceptibility mapping based on support vector machine: a 1238
case study on natural slopes of Hong Kong, China. Geomorphology, 101(4): 572-582. 1239
Yesilnacar, E., & Topal, T. (2005). Landslide susceptibility mapping: a comparison of logistic regression and 1240
neural networks methods in a medium scale study, Hendek region (Turkey). Engineering Geology, 79(3-1241
4): 251-266. 1242

52
Yesilnacar, E.K. (2005). The application of computational intelligence to landslide susceptibility mapping in 1243
Turkey. University of Melbourne, Department, 200. 1244
Youssef, A. M., Pourghasemi, H. R., Pourtaghi, Z. S., & Al-Katheeri, M. M. (2016). Landslide susceptibility 1245
mapping using random forest, boosted regression tree, classification and regression tree, and general 1246
linear models and comparison of their performance at Wadi Tayyah Basin, Asir Region, Saudi 1247
Arabia. Landslides, 13(5): 839-856. 1248
Zêzere, J. L., Garcia, R. A. C., Oliveira, S. C., & Reis, E. (2008). Probabilistic landslide risk analysis considering 1249
direct costs in the area north of Lisbon (Portugal). Geomorphology, 94(3-4): 467-495. 1250
Zhao, T., Dai, F., & Xu, N. W. (2017). Coupled DEM-CFD investigation on the formation of landslide dams in 1251
narrow rivers. Landslides, 14(1): 189-201. 1252
Zhu, L., Sun, O. J., Sang, W., Li, Z., & Ma, K. (2007). Predicting the spatial distribution of an invasive plant 1253
species (Eupatorium adenophorum) in China. Landscape Ecology, 22(8): 1143-1154. 1254
Zhuang, J., Cui, P., Hu, K., Chen, X. & Yonggang, G. E. (2010). Characteristics of earthquake-triggered landslides 1255
and post-earthquake debris flows in Beichuan County. Journal of Mountain Science.7: 246–254. 1256
1257