A Criterion for the Fuzzy Set Estimation of the Regression ...

-151-
Inzinerine Ekonomika-Engineering Economics, 2019, 30(2), 151–162
A Hybrid Fuzzy Regression - SSA Approach for Electricity Consumption Optimisation
Hannan Amoozad Mahdiraji1, Moein Beheshti2, Seyed Hossein Razavi Hajiagha3, Zenonas
Turskis4
1University of Tehran
16th Azar St., Enghelab Sq., Tehran, Iran
E-mail. [email protected]
2University of Tehran Kish International Campus
Niyayesh St., Mirmohanna Blvd., Kish Island, Iran
E-mail. [email protected]
3Khatam University
No.30, Hakim Azam St., North Shiraz St., Mollasadra Ave., Tehran, Iran
E-mail. [email protected]
4Vilnius Gediminas Technical University
Sauletekio av. 11, 10223 Vilnius, Lithuania
E-mail. [email protected]
http://dx.doi.org/10.5755/j01.ee.30.2.21001
The critical impact of electricity on the quality of human life and the use of all electrical appliances and equipment is in
principle self-evident. Nevertheless, governments cannot afford even productivity to consumption. The countries developed
many structures to operate and improve the city and industrial electricity consumption and to manage power generation
efficiency. Increase in population and the culture of consumption force the governments to raise the price. However, it is
difficult to find ways and means to effectively manage trends in public behaviour and to control the harmful action of the
population. This process requires knowing the need and consumption of electricity. The article discusses the primary
criterion that influences electricity consumption and uses the singular spectrum analysis based on these factors to predict
use. Besides, a fuzzy regression model is represented to optimise function. Results of optimisation show a considerable
reduction in comparison with SSA forecasting method, indicating the efficiency of the offered method. Eventually results
considerably assume that attention to a way of construction and improvements of the culture of use is a priority of the
persons making decisions to reduce radical electric consumption in Iran and to become more optimistic concerning
management of an electrical network.
Keywords: Singular Spectrum Analysis; Electrical Demand; Electrical Energy Consumption; Fuzzy Regression; Prediction.
Introduction
Electrical power is an inevitable part of the sustainable
development of countries. Measuring business cycles
provides a reference point for assessing macroeconomic
theory and policy (Skare & Stjepanovic, 2016). Economic
expansions and slowdowns are inherent in modern financial
systems and impact energy and resources consumptions.
The problems involve a multitude of requirements and
uncertain conditions that have to be taken into consideration
simultaneously (Hashemkhani Zolfani et al., 2013).
Economic, social and ecological components of development
have both direct and reverse impacts (Ginevicius et al. 2018).
An appropriate choice at an early stage of a project is crucial
regarding adding value over scope, time and total investment
strategic decisions (Saparauskas et al., 2011). Analysis helps
to rate the electricity generation technologies and
consumption considering their economic, technological,
environmental social and political aspects (Medineckiene et
al., 2015; Streimikiene et al., 2016). Researchers proposed
dozens of different utility aggregation functions for the
resolution of similar problems by employing multi-criteria
as an aid (Zavadskas et al., 2015c; Bagocius et al., 2014;
Zavadskas et al., 2015a; 2015b; 2015c).
Consumption and production are two dynamically
changing life-changing sides and depends on dozens of
factors (Zavadskas et al., 2009). Consumption as a mean to
satisfy ones’ needs has been investigated mainly by using
economic and psychological approaches (Taujanskaite et
al., 2015). The amount of effective used electricity amount
indicates the economic prosperity of nations (Tunc et al.,
2006). Shiu & Lam (2004) investigated the relationship
between electricity consumption and economic growth and
found out that the electricity usage increases the amount of
GDP. Due to the increase of urbanisation besides the
industries EC needs to be monitored and reduced (Pampuri
et al., 2016).
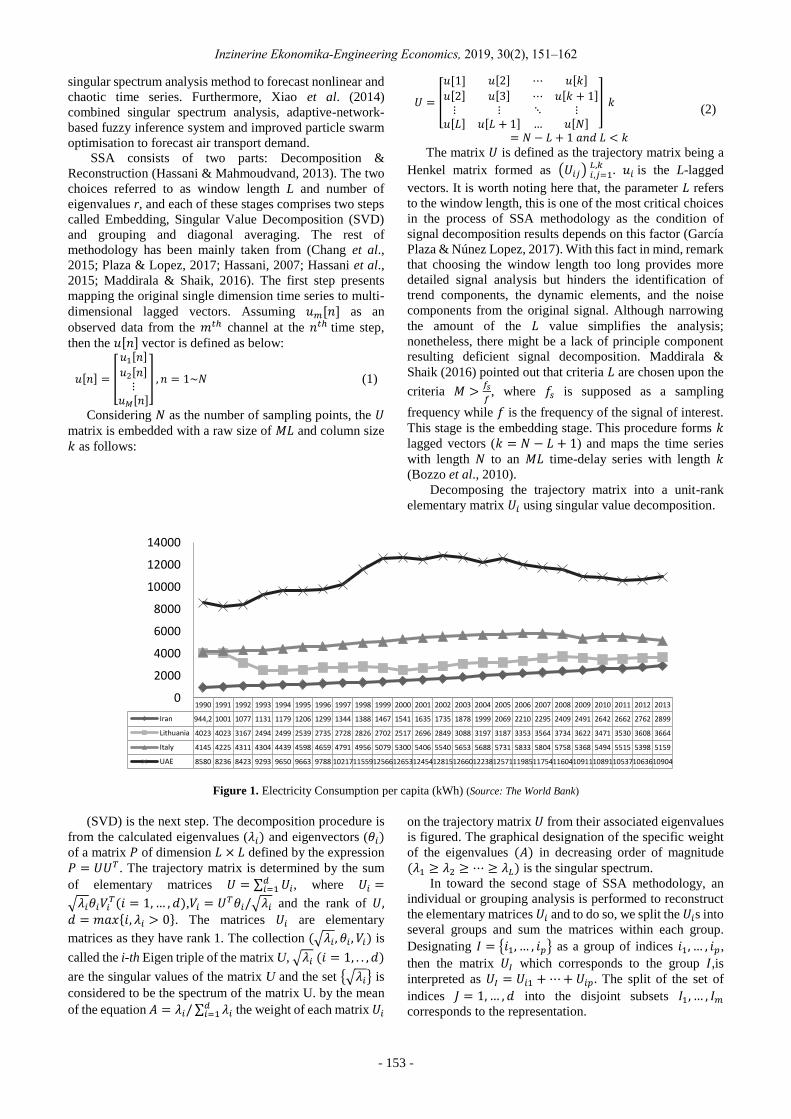
Figure 1 shows the rate of electricity consumption (EC)
comparison between countries in kWh from 1990 to 2012.
Arab countries in the Middle East, like UAE, are consuming
electrical power more than Iran. Nonetheless, the pestilent
point is that all four considered countries are emphasising to

Hannan Amoozad Mahdiraji, Moein Beheshti, Seyed Hossein Razavi Hajiagha, Zenonas Turskis. A Hybrid Fuzzy…
- 152 -
reduce the consumption rate and conspicuously is evident
that a declination path in these countries policies is in
progress. Iran’s strategy is to subsidise electricity for
consumers, to buy the produced power from the private
sector and provide it to the final consumer as a support act
(BEEP, 2011). Besides the industrial usage, the residential
sector and buildings are responsible for 33.2 % of Iran’s EC.
Considering a 41 % growth of this section usage since 1989
and a 7.9 % growth rate of total per capita EC besides of 3.3
% of global concerns us to control and predict Iran’s EC,
otherwise, by the next decade Iran may face a devastating
situation of EC by two times (Pourazarm & Cooray, 2013).
A growing trend highlights the need to integrate
environmental sustainability into efforts related to new
product development, energy consumption, and resources
use. It is even operating in different countries and sectors,
an essential driver for the proper choice (Jugend et al.,
2017). However, their short-run economic performance
does not correspond to the observed business cycles of other
global emerging markets. The business cycles of these
countries are longer and more pronounced their recessions.
Economic activity in the studied countries is relatively low
and volatile, and the trade balance and government
purchases have a relatively significant countercyclical
character (Szomolanyi et al., 2017). To manage the
development of regions and thus reduce the social tensions
in the country, we need to be able to assess the state of the
main components of sustainable development (economic,
social and ecological development) at a certain period in
time, as well as to determine their interrelationships.
The use of quantitative criteria limits the influence of
subjective, non-economic factors on consumption-related
resource management and can positively affect its efficiency.
Processes and phenomena vary significantly according to the
nature of many qualities – physical, chemical, social, and
others. The need for the development of socioeconomic
systems also arises since they are open; thus, they exposed
continuously to the changing environment (Ginevicius et al.,
2018). Selection of the appropriate management options for a
definite machining requirement observed as multi-criteria
decision-making (MCDM) problem with different criteria.
Chatterjee et al. (2017) proposed a novel hybrid method
encompassing factor relationship (FARE) (Ginevicius, 2011)
and multi-attributive border approximation area comparison
(MABAC) methods to select and evaluate feasible
alternatives (Pamucar et al., 2015).
Typically, the study of market behaviour under the
demand and supply law graphically represented by the
traditional demand and supply curves embodied in two-
dimensional graphs. Meanwhile, multidimensional real-
time dynamic economic behaviour (including consumption)
is a problem that affects market behaviour. The 2-
dimensional and 3-dimensional spaces not able to capture
the action of the real industrial world as a whole. It is clear
that the real world is continually changing and inside the
Mega-Space or Universe, the number of General-Spaces,
Sub-Spaces, Micro-Spaces, Nano-Spaces and JI-Spaces. All
these spaces move differently and across time. Besides,
Ruiz Estrada et al. (2016) mentioned the roles of Euclidian
geometry and Minkowski's n-dimensional spaces (Einstein,
1961) supporting this proposition. One of the common
challenges that exist throughout the World is to compiling,
distribution, and sharing of knowledge ready for practice as
a critical element for socio-economic development and
progress acceleration (Ziemianczyk et al., 2017).
Scholars have presented both linear and non-linear
approaches to overcome EC crisis. Kermanshahi (1998)
forecasted a long term load of the total power demand
amount, Abdel-Aal (2006) investigated electric daily peak
loads using abductive networks. Kermanshahi & Iwamiya
(2002) used two different artificial neural networks for long-
term load forecasting. Buhari & Adamu (2012) forecasted a
short term load using an artificial neural network. Scholars
have furthermore implemented the important heuristic
approaches like a genetic algorithm. Ozturk et al. (2004)
suggested a generic algorithm notion of estimating EC of
residential-commercial sectors, while Canyurt et al. (2007)
modelled and applied Genetic Algorithm approach to predict
the future total energy input values.
Engineers, based upon their ability and experience to
design, analyse, and synthesise (Arabzad et al., 2015), play
a vital role in capital investment decisions (Karaulova &
Bashkite, 2016). The proposed model y determines and
forecasts electricity consumption in Iran by employing a
hybrid approach consisting of Singular Spectrum Analysis
(SSA) in conjunction with fuzzy regression methodology to
optimise the fitness function. This model enables them to
design suitable policies to prevent any possible disaster or
ascending trend in power usage. The remainder of the
research is organised as follow. Initially SSA methodology
and related steps and formulas have been considered;
afterwards, the methodology’s preliminaries compromising
fuzzy concepts are finalised. Consequently, fuzzy
regression and its essential foundations are introduced;
furthermore, by proposing the optimisation model, the
electricity consumption will be controllable. The proposed
approach is applied to Iran electricity consumption, and the
related objective function is emanated, and by employing a
fuzzy optimisation approach, the desired decision variables
to achieve minimum electricity consumption are obtained.
Singular Spectrum Analysis (SSA)
The first principles of SSA emerged in the scene of
forecasting methods by Broomhead & King (1986) and Pike
et al. (1984) works, and since then the non-parametric
method is proved to be an accurate method. Hassani (2007)
investigated this model and compared it with Box-Jenkins
SARIMA models, the ARAR and the Holt-Winter
algorithm. One of the critical features of this technique is
that the prediction is deployed without prior knowledge of
the underlying structure (Ghanati 2016; Zhigljavsky 2011;
Chu et al., 2014). Many scholars have accepted the
uppermost prediction technique. Carniel et al. (2006)
performed SSA to improve Nakamura spectral ratios.
Ghaderi et al. (2011) applied SSA to Localize heart sounds
in respiratory. As a case in point, an investigation on UK
tourism income concluded SSA is outperforming. SARIMA
is another proof of this methods validity (Beneki et al.,
2012). Golyandina & Korobeynikov (2014) described the
availing R package for SSA. There is a finite number of
SSA-fuzzy researches. Abdollahzade et al. (2015)
investigated a local linear neuro-fuzzy model and optimised
Inzinerine Ekonomika-Engineering Economics, 2019, 30(2), 151–162
- 153 -
singular spectrum analysis method to forecast nonlinear and
chaotic time series. Furthermore, Xiao et al. (2014)
combined singular spectrum analysis, adaptive-network-
based fuzzy inference system and improved particle swarm
optimisation to forecast air transport demand.
SSA consists of two parts: Decomposition &
Reconstruction (Hassani & Mahmoudvand, 2013). The two
choices referred to as window length L and number of
eigenvalues r, and each of these stages comprises two steps
called Embedding, Singular Value Decomposition (SVD)
and grouping and diagonal averaging. The rest of
methodology has been mainly taken from (Chang et al.,
2015; Plaza & Lopez, 2017; Hassani, 2007; Hassani et al.,
2015; Maddirala & Shaik, 2016). The first step presents
mapping the original single dimension time series to multi-
dimensional lagged vectors. Assuming 𝑢𝑚[𝑛] as an
observed data from the 𝑚𝑡ℎ channel at the 𝑛𝑡ℎ time step,
then the 𝑢[𝑛] vector is defined as below:
𝑢[𝑛] = [
𝑢1[𝑛]
𝑢2[𝑛]⋮
𝑢𝑀[𝑛]
] , 𝑛 = 1~𝑁 (1)
Considering 𝑁 as the number of sampling points, the 𝑈
matrix is embedded with a raw size of 𝑀𝐿 and column size
𝑘 as follows:
𝑈 = [
𝑢[1] 𝑢[2] ⋯ 𝑢[𝑘]
𝑢[2] 𝑢[3] ⋯ 𝑢[𝑘 + 1]⋮ ⋮ ⋱ ⋮
𝑢[𝐿] 𝑢[𝐿 + 1] … 𝑢[𝑁]
] 𝑘
= 𝑁 − 𝐿 + 1 𝑎𝑛𝑑 𝐿 < 𝑘
(2)
The matrix 𝑈 is defined as the trajectory matrix being a
Henkel matrix formed as (𝑈𝑖𝑗) 𝑖,𝑗=1𝐿,𝑘 . 𝑢𝑖 is the L-lagged
vectors. It is worth noting here that, the parameter 𝐿 refers
to the window length, this is one of the most critical choices
in the process of SSA methodology as the condition of
signal decomposition results depends on this factor (García
Plaza & Núnez Lopez, 2017). With this fact in mind, remark
that choosing the window length too long provides more
detailed signal analysis but hinders the identification of
trend components, the dynamic elements, and the noise
components from the original signal. Although narrowing
the amount of the 𝐿 value simplifies the analysis;
nonetheless, there might be a lack of principle component
resulting deficient signal decomposition. Maddirala &
Shaik (2016) pointed out that criteria 𝐿 are chosen upon the
criteria 𝑀 >𝑓𝑠
𝑓, where 𝑓𝑠 is supposed as a sampling
frequency while 𝑓 is the frequency of the signal of interest.
This stage is the embedding stage. This procedure forms 𝑘
lagged vectors (𝑘 = 𝑁 − 𝐿 + 1) and maps the time series
with length 𝑁 to an 𝑀𝐿 time-delay series with length 𝑘
(Bozzo et al., 2010).
Decomposing the trajectory matrix into a unit-rank
elementary matrix 𝑈𝑖 using singular value decomposition.
Figure 1. Electricity Consumption per capita (kWh) (Source: The World Bank)
(SVD) is the next step. The decomposition procedure is
from the calculated eigenvalues (𝜆𝑖) and eigenvectors (𝜃𝑖) of a matrix 𝑃 of dimension 𝐿 × 𝐿 defined by the expression
𝑃 = 𝑈𝑈𝑇 . The trajectory matrix is determined by the sum
of elementary matrices 𝑈 = ∑ 𝑈𝑖𝑑𝑖=1 , where 𝑈𝑖 =
√𝜆𝑖𝜃𝑖𝑉𝑖𝑇(𝑖 = 1,… , 𝑑),𝑉𝑖 = 𝑈
𝑇𝜃𝑖/√𝜆𝑖 and the rank of 𝑈,
𝑑 = 𝑚𝑎𝑥{𝑖, 𝜆𝑖 > 0}. The matrices 𝑈𝑖 are elementary
matrices as they have rank 1. The collection (√𝜆𝑖 , 𝜃𝑖 , 𝑉𝑖) is
called the i-th Eigen triple of the matrix U, √𝜆𝑖 (𝑖 = 1, . . , 𝑑)
are the singular values of the matrix U and the set {√𝜆𝑖} is
considered to be the spectrum of the matrix U. by the mean
of the equation 𝐴 = 𝜆𝑖/∑ 𝜆𝑖𝑑𝑖=1 the weight of each matrix 𝑈𝑖
on the trajectory matrix 𝑈 from their associated eigenvalues
is figured. The graphical designation of the specific weight
of the eigenvalues (𝐴) in decreasing order of magnitude
(𝜆1 ≥ 𝜆2 ≥ ⋯ ≥ 𝜆𝐿) is the singular spectrum.
In toward the second stage of SSA methodology, an
individual or grouping analysis is performed to reconstruct
the elementary matrices 𝑈𝑖 and to do so, we split the 𝑈𝑖s into
several groups and sum the matrices within each group.
Designating 𝐼 = {𝑖1, … , 𝑖𝑝} as a group of indices 𝑖1, … , 𝑖𝑝,
then the matrix 𝑈𝐼 which corresponds to the group 𝐼,is
interpreted as 𝑈𝐼 = 𝑈𝑖1 +⋯+𝑈𝑖𝑝 . The split of the set of
indices 𝐽 = 1,… , 𝑑 into the disjoint subsets 𝐼1, … , 𝐼𝑚
corresponds to the representation.
1990 1991 1992 1993 1994 1995 1996 1997 1998 1999 2000 2001 2002 2003 2004 2005 2006 2007 2008 2009 2010 2011 2012 2013
Iran 944,2 1001 1077 1131 1179 1206 1299 1344 1388 1467 1541 1635 1735 1878 1999 2069 2210 2295 2409 2491 2642 2662 2762 2899
Lithuania 4023 4023 3167 2494 2499 2539 2735 2728 2826 2702 2517 2696 2849 3088 3197 3187 3353 3564 3734 3622 3471 3530 3608 3664
Italy 4145 4225 4311 4304 4439 4598 4659 4791 4956 5079 5300 5406 5540 5653 5688 5731 5833 5804 5758 5368 5494 5515 5398 5159
UAE 8580 8236 8423 9293 9650 9663 9788 1021711559125661265312454128151266012238125711198511754116041091110891105371063610904
0
2000
4000
6000
8000
10000
12000
14000

Hannan Amoozad Mahdiraji, Moein Beheshti, Seyed Hossein Razavi Hajiagha, Zenonas Turskis. A Hybrid Fuzzy…
- 154 -
𝑈 = 𝑈𝐼1 +⋯+ 𝑈𝐼𝑚. (3)
One of the decisive points in the SSA approach is the
selection of the indices 𝐼𝑚. García Plaza & Núnez Lopez
(2017) point, that the incorrect choice of indices leads to
principal components that do not contain prominent
processing data of providing redundant data. The
nominating procedure of sets 𝐼1 , … , 𝐼𝑚 is denominated as the
Eigen triple grouping. The share of the equal eigenvalues
∑ 𝜆𝑖/∑ 𝜆𝑖𝑑𝑖=1𝑖∈𝐼 measures the benefaction of the component
𝑈𝐼 for a given group 𝐼. The reconstruction stage maps the estimated trajectory
matrix of the signal of interest into a single channel signal.
Presume �̂�𝑘𝑗 as an element positioned in the 𝑘th row and the
𝑗th column of the trajectory matrix, then for a single channel
motion artefact signal like �̂�(𝑛) the mathematical
expressions are defined by 𝑓𝑘 = (𝑓𝑘1, 𝑓𝑘
2, 𝑓𝑘3), where we
calculate elements of the series for 1 ≥ 𝑛 < 𝐿 by 𝑓𝑘1 and for
𝐿 ≥ 𝑛 ≤ 𝑘 we implement 𝑓𝑘2. Finally, we use 𝑓𝑘
3 for 𝑘 <𝑛 ≤ 𝑁 (Eq.4).
�̂�(𝑛) =
{
𝑓𝑘
1 =1
𝑛∑ �̂�𝑘,𝑛−𝑘+1
𝑛
𝑘=1
𝑓𝑘2 =
1
𝐿∑ �̂�𝑘,𝑛−𝑘+1
𝐿
𝑘=1
𝑓𝑘3 =
1
𝑁 − 𝑛 − 1∑ �̂�𝑘,𝑛−𝑘+1
𝑁−𝑘+1
𝑘=𝑛−𝑘+1
(4)
Fuzzy Set Theory Preliminaries
Fuzzy sets introduced by (Zadeh, 1965) is an efficient
and accurate tool in uncertain circumstances (Zimmermann,
1978). Scholars have employed it in many cases (Mahdiraji
et al., 2016; Razavi et al., 2015; Razavi et al., 2013). A
complete review of Fuzzy sets and its applications can be
found in (Buckley & Eslami, 2002; Masulli et al., 2007;
Wang, 1983); however, a review of basic sets is briefed in
the rest of this section.
A presumed fuzzy number like 𝐷 can be delineated as
an interval[𝑞𝑙 , 𝑞𝑢]. The apparent fact is that 𝑞𝑙 is the lower
boundary of 𝐷 and 𝑞𝑢, the upper. Respectively �̅�𝛼𝐿 and �̅�𝛼
𝑈
are outlined as (Wang 2015): �̅�𝛼𝐿 = inf(𝑧)𝜇�̅�(𝑧)≥𝛼 (5)
�̅�𝛼𝑈 = sup(𝑧)𝜇�̅�(𝑧)≥𝛼 (6)
Here for any 𝑞 ∈ (0,1], 𝐹(ℝ) is the set of fuzzy
numbers and [ �̅�𝛼𝐿(0), �̅�𝛼
𝑈(0)] = 𝑞0.
For any fuzzy number like �̅�, (Heilpern 1992) defines
the expected interval 𝐸𝐼(�̅�) and expected value 𝐸𝑉(�̅�) as
below:
𝐸𝐼(�̅�) = [𝐸∗(�̅�), 𝐸∗(�̅�)] = [∫ �̅�𝛼
𝐿(𝛽)𝑑𝛽,
1
0
∫ 𝑞𝛼𝑈(𝛽)𝑑𝛽
1
0
] (7)
𝐸𝑉(�̅�) =1
2(𝐸∗(�̅�) + 𝐸
∗(�̅�)) (8)
ambiguity 𝐴𝑚𝑏(�̅�), value 𝑉𝑎𝑙(�̅�), width 𝑤(�̅�), left-hand
ambiguity 𝐴𝑚𝑏𝐿(�̅�), right-hand ambiguity 𝐴𝑚𝑏𝑈(�̅�) were
investigated by (Delgado et al., 1998; Grzegorzewski 1998).
Grzegorzewski (1998) defined one of the eminent matrices
in fuzzy sets, the Euclidean distance as:
𝑑2(�̅�, �̅�) = ∫( �̅�𝛼𝐿(𝛽) − �̅�𝛼
𝐿(𝛽))2𝑑𝛽
1
0
+∫( �̅�𝛼𝑈(𝛽) − �̅�𝛼
𝑈(𝛽))2𝑑𝛽
1
0
(9)
Literature review suggests that scholars implement
triangular and trapezoidal sets to investigate fuzzy numbers,
wherein this research considers trapezoidal numbers;
therefore, by reviewing trapezoidal fuzzy numbers
(henceforth TrFN), main operations and illustrating its
schematic view in Figure 2, the section is finalised.
Figure 2. Schematic View of Triangular and Trapezoidal
Source: Own
Chen & Chen (2007) and Kumar & Gupta (2011)
designate the arithmetic operations on two TrFN �̅� =(𝑞𝑙 , 𝑞ℎ, 𝑞𝑚 , 𝑞𝑢) and �̅� = (𝑝𝑙 , 𝑝ℎ , 𝑝𝑚, 𝑝𝑢) as follow: 𝜆 ≥ 0, 𝜆�̅� = (𝜆𝑞𝑙 , 𝜆𝑞ℎ, 𝜆𝑞𝑚, 𝜆𝑞𝑢) (10)
𝜆 ≤ 0, 𝜆�̅� = (𝜆𝑞𝑢, 𝜆𝑞𝑚, 𝜆𝑞ℎ, 𝜆𝑞𝑙) (11)
�̅� + �̅� = (𝑞𝑙 + 𝑝𝑙 , 𝑞ℎ + 𝑝ℎ, 𝑞𝑚 + 𝑝𝑚, 𝑞𝑢 + 𝑝𝑢) (12)
�̅� − �̅� = (𝑞𝑙 − 𝑝𝑢, 𝑞ℎ − 𝑝𝑚, 𝑞𝑚 − 𝑝ℎ , 𝑞𝑢 − 𝑝𝑙) (13)
Fuzzy Linear Regression
Regression analysis is applied to study the relation
among an affected variable, called the dependent variable,
with a set of affecting variables, called independent
variables. The linear regression model can be displayed as: 𝑌𝑖 = 𝛽0 + 𝛽1𝑋𝑖1 + 𝛽2𝑋𝑖2 +⋯+ 𝛽𝑘𝑋𝑖,𝑘 + 𝜀𝑖 (14)
For 𝑖 = 1,2, … , 𝑛, where 𝑌 = [𝑌1, 𝑌2, … , 𝑌𝑛]𝑡 is the
vector of dependent variables and 𝑋 = [𝑋1, 𝑋2, … , 𝑋𝑛] is the
matrix of independent variables with 𝑋𝑗 =
[𝑋1𝑗, 𝑋2𝑗 , … , 𝑋𝑛𝑗]𝑡, 𝑗 = 1,2, … , 𝑘 as the vector of jth
independent variable. Also, 𝜀𝑖 are independent normal
variables with 𝐸(𝜀𝑖) = 0 and 𝑉𝑎𝑟(𝜀𝑖) = 𝜎2. The least
square estimation of coefficients vector 𝛽 =[𝛽0, 𝛽1, 𝛽2, … , 𝛽𝑘]
𝑡 is obtained as
𝛽 = (𝑋𝑡𝑋)−1𝑋𝑡𝑌 (15)
where
𝑋 = [
11
𝑥11𝑥21
⋯⋯𝑥1𝑘𝑥2𝑘
⋮1
⋮𝑥𝑛1
⋱⋯
⋮𝑥𝑛𝑘
]
In ordinal regression, both dependent and independent
variables are crisp. However, in a world of uncertain events,
usually, the information is unknown and are determined
vaguely. Therefore, fuzzy regression analysis is proposed to
examine the problem of the relationship among several
variables in a fuzzy environment. Tanaka et al. (1982)
initiated the topic of fuzzy linear regression. The issue is
later extended and studied by scholars. Based on Ubale &
Sananse (2015) investigation on fuzzy regression
application and literature review, Chen et al. (2004)
ql
qh qm
uql
qm
qu0
Triangular Trapezoidal

Inzinerine Ekonomika-Engineering Economics, 2019, 30(2), 151–162
- 155 -
Arulchinnappan & Rajendran (2011), Abdullah & Zamri
(2012), Pushpa & Vasuki (2013), Shafi & Rusiman (2015),
Muzzioli et al. (2015), and Chen et al. (2016), are among
the most illustrious recent jobs on this topic.
The problem considered in this paper is to estimate a
function of electricity consumption with fuzzy regression;
therefore, the Wu (2003) proposed method is applied to
determine the corresponding function. In this method, an α-
level set (�̂̃�𝑗)𝛼
is computed for each regression coefficient
as follow:
(�̃̂�𝑗)𝛼= [(�̃̂�𝑗)
𝛼
𝐿, (�̃̂�𝑗)
𝛼
𝑈] (16)
To this end, Wu (2003) proposed that first, the α-level
sets of dependent and independent variables are computed.
Supposing these sets as [(�̃�)𝛼
𝐿, (�̃�)
𝛼
𝑈] and [(�̃�)
𝛼
𝐿, (�̃�)
𝛼
𝑈], two
regression functions are fitted on [(�̃�)𝛼
𝐿, (�̃�)
𝛼
𝐿] with 𝐵1
coefficients vector and [(�̃�)𝛼
𝑈, (�̃�)
𝛼
𝑈] with 𝐵2 coefficients
vector. Afterwards, the interval regression coefficient at
confidence level α is defined as:
(�̃̂�𝑗)𝛼= [(�̃̂�𝑗)
𝛼
𝐿, (�̃̂�𝑗)
𝛼
𝑈]
= [𝑚𝑖𝑛(𝐵1, 𝐵2),𝑚𝑎𝑥(𝐵1, 𝐵2)] (17)
Proposed Structure
The proposed model is hinged on an SSA/Fuzzy-
regression approach to discuss and optimise the electric
power consumption in Iran. At the first phase experts
suggested primary criterions as the main concern to be
addressed in our research, and by the further interviews with
economic and energy experts, besides analysing
demographics of Iran, mentioned criterions were reduced to
principal objects to be examined. Relative and discord data
of those criterions in the second phase were gathered and
applied by the SSA approach to reduce noise and forecast
the next 15 years’ behaviour. Consequently, Fuzzy-
regression method was scheduled to determine the power
consumption function based on independent variables.
Eventually, the objective function subjected to
governmental policies is optimised. Figure 3 demonstrates
the main steps of our proposed approach.
Iran’s Electricity Consumption Evaluation
Phase 1: Preparation. The expert's suggestions
gathered the critical criterions in Power consumption. Table
1 illustrates the primal data list, comprising criteria's
description (input variables), quantitative or qualitative type
of variables and positive or negative influence of each input
variable on electricity consumption. Further interviews with
economic and energy experts in conjunction with analysing
demographics of Iran in brainstorming sessions, lead us to a
narrower chose of criterions and five targets were picked from
Table 1. Table 2 demonstrates the final criteria (input
variables) choice. The discord data in the above table and
related data of electrical consumption in Iran present the main
objects to implement in Fuzzy-regression optimisation
approach.
Table 1
Initial Criteria (Initial Input Variables)
No. Criteria description Type Effect
1 Home appliance technology level Quantitative + 2 Population growth rate Quantitative -
3 Industrial development state Quantitative -
4 Urbanization growth rate Quant./
Qual. -
5 Alternative energy sources
substitution option
Qualitative +
6 Power consumption price Quantitative +
7 Electricity price share from the
household expense
Quantitative +
8 Iran’s population structure Qualitative +
9 Modern construction
implementation
Qualitative +
10 Energy Productivity in Iran Quantitative +
11 Proper timing and supplement
usage
Qualitative +
(Source: Own)
Thus, related data were gathered from official databases
encompassing Statistical Centre of Iran, Iran Ministry of
energy, National Iranian Productivity Organization and
Central Bank of Iran, uncovering electrical consumption
rate in the last 20 years (presented in Table 3). Table 2
Final Criteria Selection
No. Criteria description Type Effect
1 Power consumption price Quantitative +
2 Population growth rate Quantitative - 3 Modern construction
implementation
Qualitative +
4 Energy Productivity in Iran Quantitative + 5 Proper timing and supplement
usage
Qualitative +
(Source: Own)
Table 3
Iranian Electrical Consumption in the Last 20 Years
Year Consumption/Million
KWh Year
Consumption/Million
KWh
1996 65854 2006 132897
1997 69671 2007 144598 1998 73358 2008 152330
1999 77646 2009 161445
2000 84656 2010 168438 2001 90336 2011 184182
2002 97171 2012 183905
2003 105076 2013 194148 2004 114625 2014 203088
2005 124466 2015 219653
(Source: Mentioned Databases)
The population growth rate, energy productivity criteria
and power costs are denoted in Table 4. Data for 2016 and
2017 are not yet prepared at the time of developing the
research. These two years were forecasted; however,
considering the publication time, results for 2016 and 2017
were deleted by the authors.

Hannan Amoozad Mahdiraji, Moein Beheshti, Seyed Hossein Razavi Hajiagha, Zenonas Turskis. A Hybrid Fuzzy…
- 156 -
Table 4
Total Population, Energy Productivity, Cost
Year
Population
Growth rate
( Million) 1
Power cost
(IRR/KWh) 2
Energy Productivity
criteria (in billions of
euros of GDP per
exajoule on energy
consumed) 3
1996 61306632 6 118
1997 62426086 6 128
1998 63616065 8 106 1999 64780362 8 113
2000 65850062 9 109
2001 66812736 10 108 2002 67696677 10 88
2003 68522074 10 75
2004 69321953 12 123 2005 70122115 14 75
2006 70923164 14 93
2007 71720859 16 111 2008 72530693 18 117
2009 73370982 18 116
2010 74253373 36 91 2011 75184322 36 100
2012 76156975 36 129
2013 77152445 49 96 2014 78143644 50 103
2015 79109272 53 117
(Source 1: World Bank, Source 2: Ministry of Energy, Source 3:
National Iranian Productivity Organization)
Phase 2: SSA Implementation. The window length of
time series is set as 𝐿 = 10, and the variables were grouped
based on their dispersion and eigenvalues. Afterwards, the
time series was reconstructed and employed to forecast the
next 15 years. Table 5 demonstrates the reconstructed time
series. Moreover, Table 6 illuminates the forecast of
electricity consumption criterions between 2016 and 2030.
It is worth noting here that SSA implementation,
reconstruction of time series, noise reduction of time series
and SSA forecasts of the response variable and all input
variables were calculated by Caterpillar SSA software.
Phase 3: Estimation. The fuzzy regression method of
Wu (2003) is applied to estimate the amount of energy
consumption. The below function is calculated from the
observed data using this method, and the results presented
in Table 7.
Figure 3. Proposed Approach
(Source: Own)
[𝐶𝑡, 𝐶𝑡] = [−398718,−398235] + 771𝑃𝑟𝑡+ 198𝑃𝑟𝑜𝑡 + 0.00708𝑃𝑜𝑡− 142𝐶𝑀𝑡 − 2272𝑈𝐶𝑡
(18)
Response variable prediction, input variables prediction
and qualitative variables are required to estimate electricity
consumption, r. Furthermore, to consider uncertain
information and fuzzy logic, based on qualitative
forecasting method (specifically Delphi method) the future
behaviour of construction and usage culture of electricity
power in Iran were emanated. The results are presented
upon linguistic terms, observable in Table 7.
Phase 4: Optimisation. The fitted model is an
approximation of electricity consumption in Iran. This
model can be used to predict consumption as a function of
independent variables. However, to propose an optimisation
model of whether to improve the consumption of Iran, an
optimisation model is formulated in this section. The
proposed optimisation model seeks to find the way of
decreasing yearly 5 % of electricity consumption in Iran in
a period between 2017 to 2020.
In fact, [𝐶𝑡+1∗ , 𝐶𝑡+1
∗] ∈ 0.95[𝐶𝑡 , 𝐶𝑡]. Ishibuichi & Tanaka
(1990) suggest that [𝐴, 𝐴] ≤ [𝐵, 𝐵] if 𝐴 ≤ 𝐵 and (𝐴 + 𝐴) ≤
(𝐵 + 𝐵). Following Ishibuichi & Tanaka (1990), the
inequality is transformed into two equivalent inequalities:
Table 5
The Reconstructed Time Series
Year Price Productivity Consumption Population
2005 13.6 99.05 121996.81 69975504
2006 14.76 97.83 130169.63 70855181.3
2007 18.05 103.14 139295.83 71758274.2
2008 20.01 103.44 148794.35 72651258.2
2009 22.39 105.31 158665.69 73537926.9
2010 30.5 97.49 168843.49 74424126.6
2011 34.2 105.20 179414.61 75316196.9
2012 36.97 115.77 189851.74 76219381.3
2013 47.91 100.97 200700.45 77137065.5
2014 51.8 107.25 211941.98 78070467.7
2015 50.6 121.24 224175.53 79018774.3
(Source: Own; Software Caterpillar SSA)

Inzinerine Ekonomika-Engineering Economics, 2019, 30(2), 151–162
- 157 -
Table 6
Forecasted Criterions in the Period of 2016-2030
Year Price Productivity Consumption Population
2018 83.03 115.7 270756.46 81996472.8
2019 104.12 115.34 287392.10 82995083.4
2020 130.27 115.87 305010.31 84006902.4
2021 136.11 114.32 323687.35 85032749.9
2022 158.16 120.64 343565.60 86072956.1
2023 197.10 120.02 364746.89 87127512.6
2024 211.62 115.92 387347.57 88196275
2025 238.3 123.1 411437.13 89279173.6
2026 299.38 122.53 436820.72 90370511.1
2027 336.26 121.17 463762.90 91475363.1
2028 373.12 124.41 492367.12 92594126
2029 461.27 124.96 522742.56 93727040.5
2030 531.48 126.40 555003.34 94874219.8
(Source: Own; Software Caterpillar SSA)
Table 7
Energy Consumption Estimation and Qualitative Input
Variables Estimation
Year Consumption Construction
Methods Usage Culture
2018 [269658.4, 271959.5] L L
2019 [289776.6, 292129.8] L L
2020 [310919.7, 313337.3] M L
2021 [321969, 324470.5] M M
2022 [343028.3, 345585.3] NH M
2023 [373535.7, 376181.2] NH M
2024 [388949.4, 391635.6] H M
2025 [413816.2, 416597.6] H NH
2026 [456995.6, 459910.1] H NH
2027 [485630.2, 488630.5] VH NH
2028 [515822.2, 518938.3] VH H
2029 [574657.6, 577961.4] VH H
2030 [622703.6, 626160.3] VVH H
−398235 + 771𝑃𝑟𝑡+1 + 198𝑃𝑟𝑜𝑡+1+ 0.00708𝑃𝑜𝑡+1 − 142𝐶𝑀𝑡+1
− 2272𝑈𝐶𝑡+1≤ −378323.25 + 732.45𝑃𝑟𝑡+ 188.1𝑃𝑟𝑜𝑡 + 0.006726𝑃𝑜𝑡− 134.9𝐶𝑀𝑡 − 2158.4𝑈𝐶𝑡
−398477 + 771𝑃𝑟𝑡+1 + 162𝑃𝑟𝑜𝑡+1+ 0.00708𝑃𝑜𝑡+1 − 142𝐶𝑀𝑡+1
− 2272𝑈𝐶𝑡+1≤ −378553 + 732.45𝑃𝑟𝑡+ 188.1𝑃𝑟𝑜𝑡 + 0.006726𝑃𝑜𝑡− 134.9𝐶𝑀𝑡 − 2158.4𝑈𝐶𝑡
(19)
Defining the deviation variables 𝑑1−, 𝑑1
+, 𝑑2−, 𝑑2
+; the
goal programming based consumption optimisation model
is formulated: 𝑀𝑖𝑛 𝑑1
+ + 𝑑2+ S.T.
−398235 + 771𝑃𝑟𝑡+1 + 198𝑃𝑟𝑜𝑡+1 + 0.00708𝑃𝑜𝑡+1− 142𝐶𝑀𝑡+1 − 2272𝑈𝐶𝑡+1 + 𝑑1
−
− 𝑑1+
= −378323.25 + 732.45𝑃𝑟𝑡+ 188.1𝑃𝑟𝑜𝑡 + 0.006726𝑃𝑜𝑡− 134.9𝐶𝑀𝑡 − 2158.4𝑈𝐶𝑡
−398477 + 771𝑃𝑟𝑡+1 + 162𝑃𝑟𝑜𝑡+1 + 0.00708𝑃𝑜𝑡+1− 142𝐶𝑀𝑡+1 − 2272𝑈𝐶𝑡+1 + 𝑑2
−
− 𝑑2+
= −378553 + 732.45𝑃𝑟𝑡+ 188.1𝑃𝑟𝑜𝑡 + 0.006726𝑃𝑜𝑡− 134.9𝐶𝑀𝑡 − 2158.4𝑈𝐶𝑡
(20)
(i) 𝐶𝑀 ∈ {𝑉𝐿, 𝐿,𝑀𝐿,𝑀,𝑀𝐻,𝐻, 𝑉𝐻} (ii) 𝑈𝐶 ∈ {𝑉𝐿, 𝐿,𝑀𝐿,𝑀,𝑀𝐻,𝐻, 𝑉𝐻} (iii) 𝑃𝑜𝑡+1 ≥ (1 + 𝑔𝑟)𝑃𝑜𝑡 (iv) 𝑃𝑟𝑡+1 ≥ (1 + 𝑖𝑡)𝑃𝑟𝑡, 𝑃𝑟𝑜𝑡+1 ≥ 𝑃𝑟𝑜𝑡+1
The objective function of Eq. (20) seeks to minimise
undesirable deviations from the considered goals of
decreasing the amount of consumption to a value between
75 % - 95 % of the current consumption. Constraints (i) and
(ii) expressed the possible variation in two qualitative
variables of construction method and usage culture.
Eventually, constraint (iii) illustrated that the population of
period 𝑡 + 1 could not be lower than the population at
period t when 𝑔𝑟 is the growth rate of population from 1996
to 2015. Constraint (iv) illustrated that price at year 𝑡 + 1 is
at least as large as the price at a period t plus the expected
inflation rate of the year that is illustrated by 𝑖𝑡. To solve the
above model, first, two variables of CM and UC are
substituted with the following equivalents: 𝐶𝑀 = 𝑦1 + 2𝑦2 + 3𝑦3 + 4𝑦4 + 5𝑦5 + 6𝑦6 + 7𝑦7
𝑈𝐶 = 𝑦8 + 2𝑦9 + 3𝑦10 + 4𝑦11 + 5𝑦12 + 6𝑦13 + 7𝑦14
Where, 𝑦1, 𝑦8 ≈ 𝑉𝐿, 𝑦2, 𝑦9 ≈ 𝐿, 𝑦3, 𝑦10 ≈ 𝑀𝐿, 𝑦4, 𝑦11 ≈ 𝑀,
𝑦5, 𝑦12 ≈ 𝑀𝐻, 𝑦6, 𝑦13 ≈ 𝐻, 𝑦7, 𝑦14 ≈ 𝑉𝐻. Substituting above equivalents into the model (20), the
following integer goal programming model is obtained:
𝑀𝑖𝑛 𝑑1+ + 𝑑2
+ S.T. −398235 + 771𝑃𝑟𝑡+1 + 198𝑃𝑟𝑜𝑡+1 +
0.00708𝑃𝑜𝑡+1 − 142(𝑦1,𝑡+1 + 2𝑦2,𝑡+1 +
3𝑦3,𝑡+1 + 4𝑦4,𝑡+1 + 5𝑦5,𝑡+1 + 6𝑦6,𝑡+1 +
7𝑦7,𝑡+1) − 2272(𝑦8,𝑡+1 + 2𝑦9,𝑡+1 + 3𝑦10,𝑡+1 +
4𝑦11,𝑡+1 + 5𝑦12,𝑡+1 + 6𝑦13,𝑡+1 + 7𝑦14,𝑡+1) + 𝑑1− −
𝑑1+ = −378323.25 + 732.45𝑃𝑟𝑡 + 188.1𝑃𝑟𝑜𝑡 +
0.006726𝑃𝑜𝑡 − 134.9(𝑦1,𝑡 + 2𝑦2,𝑡 + 3𝑦3,𝑡 +
4𝑦4,𝑡 + 5𝑦5,𝑡 + 6𝑦6,𝑡 + 7𝑦7,𝑡) − 2158.4(𝑦8,𝑡 +
2𝑦9,𝑡 + 3𝑦10,𝑡 + 4𝑦11,𝑡 + 5𝑦12,𝑡 + 6𝑦13,𝑡 + 7𝑦14,𝑡)
−398477 + 771𝑃𝑟𝑡+1 + 162𝑃𝑟𝑜𝑡+1+ 0.00708𝑃𝑜𝑡+1− 142(𝑦1,𝑡+1 + 2𝑦2,𝑡+1+ 3𝑦3,𝑡+1 + 4𝑦4,𝑡+1 + 5𝑦5,𝑡+1+ 6𝑦6,𝑡+1 + 7𝑦7,𝑡+1)
− 2272(𝑦8,𝑡+1 + 2𝑦9,𝑡+1+ 3𝑦10,𝑡+1 + 4𝑦11,𝑡+1+ 5𝑦12,𝑡+1 + 6𝑦13,𝑡+1+ 7𝑦14,𝑡+1) + 𝑑2
− − 𝑑2+
= −378553 + 732.45𝑃𝑟𝑡+ 188.1𝑃𝑟𝑜𝑡 + 0.006726𝑃𝑜𝑡− 134.9(𝑦1,𝑡 + 2𝑦2,𝑡 + 3𝑦3,𝑡+ 4𝑦4,𝑡 + 5𝑦5,𝑡 + 6𝑦6,𝑡+ 7𝑦7,𝑡)
− 2158.4(𝑦8,𝑡 + 2𝑦9,𝑡 + 3𝑦10,𝑡+ 4𝑦11,𝑡 + 5𝑦12,𝑡 + 6𝑦13,𝑡+ 7𝑦14,𝑡)
𝐶𝑀𝑡 ≤ 𝐶𝑀𝑡+1 ≤ 𝐶𝑀𝑡 + 1
𝑈𝐶𝑡 ≤ 𝑈𝐶𝑡+1 ≤ 𝑈𝐶𝑡 + 1
𝑃𝑜𝑡+1 ≥ (1 + 𝑔𝑟)𝑃𝑜𝑡 𝑃𝑟𝑡+1 ≥ (1 + 𝑖𝑡)𝑃𝑟𝑡, 𝑃𝑟𝑜𝑡+1 ≥ 𝑃𝑟𝑜𝑡+1
(21)
Solving the above model using Lingo package, the
optimal solution can be obtained. Now, consider the case
when 𝑡 = 2016. At this year, it is aimed that the
consumption of 2016 is about 95 % of the use of 2015, i.e.
0.95 × 555003.34 = 527253.2. Furthermore, 𝐶𝑀2015 =

Hannan Amoozad Mahdiraji, Moein Beheshti, Seyed Hossein Razavi Hajiagha, Zenonas Turskis. A Hybrid Fuzzy…
- 158 -
6, 𝑈𝐶2015 = 4, 𝑃𝑟2016 is predicted to be nearly 66.74,
𝑃𝑜2016 is predicted to be at least 80032947.1. Solving the
above model, the optimal consumption of the year 2016
eventuates as 𝑦2,2016∗ = 𝑦9,2016
∗ = 1, i.e. constructions
method should be kept at high-level, while the usage culture
should be improved to a very high level. Regarding other
factors, the population is proposed to keep at 80032950, the
price at 66.74, and productivity improved to 121.24. With this
case in mind, the consumption is estimated at the interval
[526770.1, 527495.1]. The model is constructed and solved
for years from 2017 to 2020 employing a similar manner. The
results are presented in Table 8. The acquired data by
optimisation are compared to the estimation methodology
(34), the results are briefed in Table 9. Table 8
Optimising the Consumption of Electricity in Iran
from 2016 to 2020
Year Price Produc
tivity Population
Constru
ction
methods
Usage
culture
Consumpt
ion
2016 66.7 121.2 80032950 Low Low [526770.1, 527495.1]
2017 80.5 121.2 81009700 Moderately low
Moderately low
[500637.3, 501017.9]
2018 83.0 121.2 81996473 Medium Medium [475545.2,
475967] 2019 104.1 121.2 82995080 Moderate
ly high
Moderat
ely high
[451685.7,
452210.3]
2020 130.3 1875.7 84006900 High High [429116.8, 429592.6]
Table 9
Comparing Methods for Consumption of Electricity in Iran
from 2016 to 2020
Year Estimation Optimisation
2016 [575149, 602896] [526770.1, 527495.1]
2017 [590236.2, 622527.2] [500637.3, 501017.9]
2018 [596824.3, 633759.3] [475545.2, 475967]
2019 [620254.8, 657089.8] [451685.7, 452210.3]
2020 [648559.1, 685394.1] [429116.8, 429592.6]
As it can be seen from Table 8, if decision makers try to
improve construction method and usage culture in a
stepwise manner, i.e. construction method is developed
from very low in 2015 to 𝑙𝑜𝑤 → 𝑚𝑜𝑑𝑒𝑟𝑎𝑡𝑒𝑙𝑦 𝑙𝑜𝑤 →𝑚𝑒𝑑𝑖𝑢𝑚 → 𝑚𝑜𝑑𝑒𝑟𝑎𝑡𝑒𝑙𝑦 ℎ𝑖𝑔ℎ → ℎ𝑖𝑔ℎ in next years,
respectively, and usage culture is enhanced from very low
similar to construction method, and the growth in price,
population, and productivity is controlled on the basis of the
predicted values; thus, the consumption will be diminished
from its forecasted values. If the estimated value at time
period t is shown by 𝐸𝑠𝑡 and the optimised method by 𝑂𝑝𝑡 , then the grey possibility degree (Li et al., 2007), that shows
the degree of dominance of a grey number to another one,
then it can be concluded that the optimised values are lower
than estimated values with a 100 % possibility.
Figure 4 indicates the interval plot of estimated
(reported by 𝐸2016 − 𝐸2020) against optimised (indicated
by 𝑂2016 − 𝑂2020) values of consumption. It is clear that
the mean and range of usage is decreased based on the
optimised scenario.
Conclusion
Scheduling a specific approach to optimise the
electricity consumption rate due to the scarce resources are
considered in this research. In conjunction with the
limitations of data gathering, the scarce annual datasheets
and the native character of forecasting procedures causing
an error, a novel SSA-fuzzy regression model was designed
to minimise the possible negligence. Furthermore, a goal
programming approach was developed and employed to
solve the fuzzy-based mathematical model. Applying
singular spectrum analysis for reconstructing time series,
proposing a fuzzy regression approach for energy
consumption estimation and designing a goal programming
interval based model to optimise EC are the main highlights
of this research. Based on this novel approach, policy-
making in many infrastructural areas was proposed to
organise power consumption in Iran. The case of Iran was
chosen due to the lack of a monitoring framework and the
large electrical consumption rate in recent years.
Figure 4. Interval Plot of Estimated Against Optimised
Consumption
By investigating the relevant data to EC in the last two
decades to forecast the EC for the next five years, an
incremental pattern has resulted. A useful optimising model
using fuzzy regression is presented to control the
consumption.
Improvements in construction method and usage
culture in a stepwise manner are found to be the solution for
the next five years. Researchers can investigate cases from
other countries or use a fuzzy singular spectrum analysis to
forecast these factors in an uncertain situation. Moreover,
researchers can implement the proper and rarely used SSA-
fuzzy regression framework to optimise other controversial
variables. The results of this research are beneficial for
governmental authorities in policymaking. Based on the
findings emanated from the proposed optimisation method,
the optimal amount of each dependent criteria to decrease
nearly 30 % of consumption rate are estimated; hence,
policymaking is significantly facilitated.
References
Abdel-Aal, R. E. (2006). Modeling and forecasting electric daily peak loads using abductive networks. International
Journal of Electrical Power and Energy Systems, 28(2), 133–141. https://doi.org/10.1016/j.ijepes.2005.11.006

Inzinerine Ekonomika-Engineering Economics, 2019, 30(2), 151–162
- 159 -
Abdollahzade, M., Miranian, A., Hassani, H., & Iranmanesh, H. (2015). A new hybrid enhanced local linear neuro-fuzzy
model based on the optimized singular spectrum analysis and its application for nonlinear and chaotic time series
forecasting. Information Sciences, 295, 107–125. http://dx.doi.org/10.1016/j.ins.2014.09.002
Abdullah, L., & Zamri, N. (2012). Road accident models with two threshold levels of fuzzy linear regression. Journal of
Emerging Trends in Computing and Information Sciences, 3(2), 225–230.
Arabzad, S. M., Ghorbani, M., & Hashemkhani Zolfani, S. (2015). A multi-objective robust optimization model for a
facility location-allocation problem in a supply chain under uncertainty. Inzinerine Ekonomika-Engineering
Economics, 26(3), 227–238. http://dx.doi.org/10.5755/j01.ee.26.3.4287
Arulchinnappan, S., & Rajendran, G. (2011). A study on reverse osmosis permeating treatment for yarn dyeing effluent
using fuzzy linear regression model. African Journal of Biotechnology, 17969–17972.
Bagocius, V., Zavadskas, E. K., & Turskis, Z. (2014). Multi-person selection of the best wind turbine based on the multi-
criteria integrated additive-multiplicative utility function. Journal of Civil Engineering and Management, 20(4), 590–
599. https://doi.org/10.3846/13923730.2014.932836
Beneki, C., Eeckels, B., & Leon, C. (2012). Signal extraction and forecasting of the UK tourism income time series: A
singular spectrum analysis approach. Journal of Forecasting, 31(5), 391–400. https://doi.org/10.1002/for.1220
Bozzo, E., Carniel, R., & Fasino, D. (2010). Relationship between Singular Spectrum Analysis and Fourier analysis: Theory
and application to the monitoring of volcanic activity. Computers & Mathematics with Applications, 60(3), 812–820.
https://doi.org/10.1016/j.camwa.2010.05.028
Broomhead, D. S., & King, G. P. (1986). Extracting qualitative dynamics from experimental data. Physica D: Nonlinear
Phenomena, 20(2-3), 217–236. https://doi.org/10.1016/0167-2789(86)90031-X
Buckley, J. J., & Eslami, E. (2002). An Introduction to Fuzzy Logic and Fuzzy Sets. Physica-Verlag, Heidelberg, Germany.
doi:10.1007/978-3-7908-1799-7
Buhari, M., & Adamu, S. S. (2012). Short-term load forecasting using Artificial Neural Network. In Proceedings of the
International Multi-Conference of Engineers and Computer Scientists, Vol 1.
Canyurt, O. E., Ozturk, H. K., Hepbasli, A., & Utlu, Z. (2007). Modeling and application of genetic algorithm (GA)
approach to estimating the future total energy input values. Energy Sources, Part A, 29(10), 861–871.
https://doi.org/10.1080/15567240500400929
Carniel, R., Barazza, F., & Pascolo, P. (2006). Improvement of Nakamura technique by singular spectrum analysis. Soil
Dynamics and Earthquake Engineering, 26(1), 55–63. https://doi.org/10.1016/j.soildyn.2005.08.005
Chang, Y.-W., Van Bang, P., & Loh, C.-H. (2015). Identification of Basin Topography Characteristic Using Multivariate
Singular Spectrum Analysis: Case Study of the Taipei Basin. Engineering Geology, 197, 240–252.
https://doi.org/10.1016/j.enggeo.2015.08.027
Chatterjee, P., Mondal, S., Boral, S., Banerjee, A., & Chakraborty, S. (2017). A novel hybrid method for non-traditional
machining process selection using factor relationship and Multi-Attributive Border Approximation Method. Facta
Universitatis, Series: Mechanical Engineering, 15(3), 439–456. https://doi.org/10.22190/FUME170508024C
Chen, F., Chen, Y., Zhou, J., & Liu, Y. (2016). Optimizing h value for fuzzy linear regression with asymmetric triangular
fuzzy coefficients. Engineering Applications of Artificial Intelligence, 47, 16–24. https://doi.org/10.1016/j.enga
ppai.2015.02.011
Chen, S. J., & Chen, S. M. (2007). Fuzzy risk analysis based on the ranking of generalized trapezoidal fuzzy numbers.
Applied Intelligence, 26(1), 1–11. https://doi.org/10.1007/s10489-006-0003-5
Chen, Y., Tang, J., Fung, R. Y. K., & Ren, Z. (2004). Fuzzy regression-based mathematical programming model for quality
function deployment. International Journal of Production Research, 42(5), 1009–1027. https://doi.org/10.1080/0020
7540310001619623
Chu, M. T., Lin, M. M., & Wang, L. (2014). A study of singular spectrum analysis with global optimization techniques.
Journal of Global Optimization, 60(3), 551–574. https://doi.org/10.1007/s10898-013-0117-3
Delgado, M., Vila, M. A., & Voxman, W. (1998). On a canonical representation of fuzzy numbers. Fuzzy Sets and Systems,
93(1), 125–135. https://doi.org/10.1016/S0165-0114(96)00144-3
Einstein, A. (1961). Relativity: The Special and the General Theory (3rd ed.). New York, NY: Three Rivers Press.
García Plaza, E., & Núnez Lopez, P. J. (2017). Surface roughness monitoring by singular spectrum analysis of vibration
signals. Mechanical Systems and Signal Processing, 84, 516–530. https://doi.org/10.1016/j.ymssp.2016.06.039
Ghaderi, F., Mohseni, H. R., & Sanei, S. (2011). Localizing heart sounds in respiratory signals using singular spectrum
analysis. IEEE Transactions on Biomedical Engineering, 58(12), 3360–3367. https://doi.org/10.1109/TBM
E.2011.2162728

Hannan Amoozad Mahdiraji, Moein Beheshti, Seyed Hossein Razavi Hajiagha, Zenonas Turskis. A Hybrid Fuzzy…
- 160 -
Ghanati, R., Hafizi, M. K., Mahmoudvand, R., & Fallahsafari, M. (2016). Filtering and parameter estimation of surface-
NMR data using singular spectrum analysis. Journal of Applied Geophysics, 130, 118–130. https://doi.org/10.10
16/j.jappgeo.2016.04.005
Ginevicius, R. (2011). A new determining method for the criteria weights in multicriteria evaluation. International Journal
of Information Technology & Decision Making, 10(6), 1067–1095. https://doi.org/10.1142/S0219622011004713
Ginevicius, R., Gedvilaite, D., & Stasiukynas, A. (2018). Impact of economic development on the ecology in the regions
of Lithuania. Economics and Management, 21(2), 21–37. https://doi.org/10.15240/tul/001/2018-2-002
Ginevicius, R., Gedvilaite, D., Stasiukynas, A., & Sliogeriene, J. (2018). Quantitative assessment of the dynamics of the
economic development of socioeconomic systems based on the MDD method. Inzinerine Ekonomika-Engineering
Economics, 29(3), 264–271. https://doi.org/10.5755/j01.ee.29.3.20444.
Golyandina, N., & Korobeynikov, A. (2014). Basic Singular Spectrum Analysis and forecasting with R. Computational
Statistics & Data Analysis, 71, 934–954. https://doi.org/10.1016/j.csda.2013.04.009
Grzegorzewski, P. (1998). Metrics and orders in space of fuzzy numbers. Fuzzy Sets and Systems, 97(1), 83–94.
https://doi.org/10.1016/S0165-0114(96)00322-3
Hassani, H. (2007). Singular Spectrum Analysis: Methodology and Comparison. Journal of Data Science, 5, 239–257.
https://doi.org/10.3189/172756506781828863
Hassani, H., & Mahmoudvand, R. (2013). Multivariate singular spectrum analysis: a general view and new vector
forecasting approach. International Journal of Energy and Statistics, 1(01), 55–83. https://doi.org/10.114
2/S2335680413500051
Hashemkhani Zolfani, S., Zavadskas, E. K., & Turskis, Z. (2013). Design of products with both International and Local
perspectives based on Yin-Yang balance theory and SWARA method. Economic Research-Ekonomska Istraživanja,
26(2), 153-166. https://doi.org/10.1080/1331677X.2013.11517613
Heilpern, S. (1992). The expected value of a fuzzy number. Fuzzy Sets and Systems, 47(1), 81–86.
https://doi.org/10.1016/0165-0114(92)90062-9
Jugend, D., Figueiredo, J., & Pinheiro, M. A. P. (2017). Environmental sustainability and product portfolio management
in biodiversity firms: A comparative analysis between Portugal and Brazil. Contemporary Economics, 11(4), 431–
442. https://doi.org/10.5709/ce.1897-9254.254.
Karaulova, T., & Bashkite, V. (2016). Decision-making framework for used industrial equipment. Inzinerine Ekonomika-
Engineering Economics, 27(1), 23-31. https://doi.org/10.5755/j01.ee.27.1.8618
Kermanshahi, B. (1998). Recurrent neural network for forecasting next 10 years loads of nine Japanese utilities.
Neurocomputing, 23(1/3), 125–133. https://doi.org/10.1016/S0925-2312(98)00073-3
Kermanshahi, B., & Iwamiya, H. (2002). Up to year 2020 load forecasting using neural nets. International Journal of
Electrical Power & Energy Systems, 24(9), 789–797. https://doi.org/10.1016/S0142-0615(01)00086-2
Kumar, A., & Gupta, A. (2011). Methods for solving fuzzy assignment problems and fuzzy travelling salesman problems
with different membership functions. Fuzzy Information and Engineering, 3(1), 3–21. https://doi.org/10.1007/s12543-
011-0062-0
Maddirala, A. K., & Shaik, R. A. (2016). Motion artifact removal from single channel electroencephalogram signals using
singular spectrum analysis. Biomedical Signal Processing and Control, 30, 79–85. https://doi.org/10.101
6/j.bspc.2016.06.017
Mahdiraji, H. A., Hajiagha, S. H., Hashemi, S. S., & Zavadskas, E. K. (2016). A grey multi-objective linear model to find
critical path of a project by using time, cost, quality and risk parameters. E+M Ekonomie a Management, 19(1), 49–
61. https://doi.org/10.15240/tul/001/2016-1-004
Masulli, F., Mitra, S., & Pasi, G. (Eds.). (2007). Applications of Fuzzy Sets Theory: 7th International Workshop on Fuzzy
Logic and Applications, WILF 2007, Camogli, Italy, July 7–10, 2007, Proceedings (Vol. 4578). Springer Science &
Business Media.
Medineckiene, M., Zavadskas, E. K., Björk, F., & Turskis, Z. (2015). Multi-criteria decision-making system for sustainable
building assessment/certification. Archives of Civil and Mechanical Engineering, 15(1), 11–18. https://doi.org/10.10
16/j.acme.2014.09.001
Muzzioli, S., Ruggier, A., & Debaets, B. (2015). A comparison of fuzzy regression methods for the estimation of the
implied volatility smile function. Fuzzy Sets and Systems, 266, 131–143. https://doi.org/10.1016/j.fss.2014.11.015
Ozturk, H. K., Canyurt, O. E., Hepbasli, A., & Utlu, Z. (2004). Residential-commercial energy input estimation based on
genetic algorithm (GA) approaches: An application of Turkey. Energy and Buildings, 36(2), 175–183.
https://doi.org/10.1016/j.enbuild.2003.11.001

Inzinerine Ekonomika-Engineering Economics, 2019, 30(2), 151–162
- 161 -
Pampuri, L., Cereghetti, N., Strepparava, D., & Caputo, P. (2016). Analysis of the electricity consumptions: A first step to
develop a district cooling system. Sustainable Cities and Society, 23, 23–36. https://doi.org/10.1016/j.scs.2016.02.015
Pike, E. R., McWhirter, J. G., Bertero, M., & de Mol, C. (1984). Generalised information theory for inverse problems in
signal processing. IEE Proceedings F Communications, Radar and Signal Processing, 131(6), 660–667.
https://doi.org/10.1049/ip-f-1.1984.0100
Pamucar, D., & Cirovic, G. (2015). The selection of transport and handling resources in logistics centers using Multi-
Attributive Border Approximation Area Comparison (MABAC). Expert Systems with Applications, 42(6), 3016–
3028. https://doi.org/10.1016/j.eswa.2014.11.057
Planning, B. O. (2011). Iran Energy Balance. Tehran: Ministry of Energy.
Pourazarm, E., & Cooray, A. (2013). Estimating and forecasting residential electricity demand in Iran. Economic
Modelling, 35, 546–558. https://doi.org/10.1016/j.econmod.2013.08.006
Pushpa B., & Vasuki, R. (2013). A least absolute approach to multiple fuzzy regression using TW-norm based operations.
International Journal of Fuzzy Logic Systems, 3(2), 73–84. https://doi.org/10.5121/ijfls.2013.3206
Razavi Hajiagha, S. H., Mahdiraji, H. A., Hashemi, S. S., & Turskis, Z. (2015). Determining weights of fuzzy attributes
for multi-attribute decision-making problems based on consensus of expert opinions. Technological and Economic
Development of Economy, 21(5), 738–755. https://doi.org/10.3846/20294913.2015.1058301
Razavi, S. H., Amoozad, H., Zavadskas, E. K., & Hashemi, S. S. (2013). A Fuzzy Data Envelopment Analysis approach
based on parametric programming. International Journal of Computers Communications & Control, 8(4), 594–607.
https://doi.org/10.15837/ijccc.2013.4.580
Ruiz Estrada, M. A., Chandran, V., & Tahir, M. (2016). An introduction to the multidimensional real-time economic
modeling. Contemporary Economics, 10(1) 55–70. https://doi.org/10.5709/ce.1897-9254.198
Saparauskas, J., Zavadskas, E. K., & Turskis, Z. (2011). Selection of facade's alternatives of commercial and public
buildings based on multiple criteria. International Journal of Strategic Property Management, 15(2), 189–203.
https://doi.org/10.3846/1648715X.2011.586532
Shafi, A. M., & Rusiman, M. S. (2015). The use of fuzzy linear regression models for tumor size in colorectal cancer in
hospital of Malaysia. Applied Mathematical Sciences, 9(56), 2749–2759. https://doi.org/10.12988/ams.2015.5175
Shiu, A., & Lam, P.-L. (2004). Electricity consumption and economic growth in China. Energy Policy, 32(1), 47-54.
https://doi.org/10.1016/S0301-4215(02)00250-1
Szomolanyi, K., Lukacik, M., & Lukacikova, A. (2017). Business cycles in European post-communist countries.
Contemporary Economics, 11(2), 171–186. https://doi.org/10.5709/ce.1897-9254.235.
Skare, M., & Stjepanovic, S. (2016). Measuring Business Cycles: A Review. Contemporary Economics, 10(1), 83–94.
https://doi.org/10.5709/ce.1897-9254.200
Streimikiene, D., Sliogeriene, J., & Turskis, Z. (2016). Multi-criteria analysis of electricity generation technologies in
Lithuania. Renewable Energy, 85, 148–156. https://doi.org/10.1016/j.renene.2015.06.032
Tanaka, H., Uejima, S., & Asai, K. (1982). Linear regression analysis with fuzzy model. IEEE Transactions on Systems,
12(6), 903–907. https://doi.org/10.1109/TSMC.1982.4308925
Taujanskaite, K., Milcius, E., & Rutkauskas, A. V. (2015). Integrated cross disciplinary approach to household expenditure
management. Inzinerine Ekonomika-Engineering Economics, 26(5), 489–499. https://doi.org/10.5755/j01.ee.26
.5.13066
Tunc, M., Camdali, U., Liman, T., & Deger, A. (2006). Electrical energy consumption and production of Turkey versus
world. Energy Policy, 34(17), 3284–3292. https://doi.org/10.1016/j.enpol.2005.06.023
Ubale, A. B., & Sananse, S. L. (2015). Fuzzy Regression Model and Its Application: A Review. International Journal of
Innovative Research in Science, Engineering and Technology, 4(11), 10853–10860. https://doi.org/10.15680/IJIR
SET.2015.0411086.
Wang, P. P. (Ed.) (1983). Advances in Fuzzy Sets, Possibility Theory, and Applications. Plenum Press, New York.
doi:10.1007/978-1-4613-3754-6.
Wu, H. C. (2003). Fuzzy estimates of regression parameters in linear regression models for imprecise input and output
data. Computational Statistics & Data Analysis, 42(1), 203–217. https://doi.org/10.1016/S0167-9473(02)00116-0.
Xiao, Y., Liu, J. J., Hu, Y., Wang, Y., Lai, K. K., & Wang, S. (2014). A neuro-fuzzy combination model based on singular
spectrum analysis for air transport demand forecasting. Journal of Air Transport Management, 39, 1–11.
https://doi.org/10.1016/j.jairtraman.2014.03.004

Hannan Amoozad Mahdiraji, Moein Beheshti, Seyed Hossein Razavi Hajiagha, Zenonas Turskis. A Hybrid Fuzzy…
- 162 -
Zadeh, L. (1965). Fuzzy sets. Information and Control, 8(3), 338–353. https://doi.org/10.1016/S0019-9958(65)90241-X
Zavadskas, E. K., Kaklauskas, A., Turskis, Z., & Kalibatas, D. (2009). An approach to multi-attribute assessment of indoor
environment before and after refurbishment of dwellings. Journal of Environmental Engineering and Landscape
Management, 17(1), 5–11. https://doi.org/10.3846/1648-6897.2009.17.5-11
Zavadskas, E. K., Turskis, Z., & Antucheviciene, J. (2015a). Selecting a contractor by using a novel method for multiple
attribute analysis: Weighted Aggregated Sum Product Assessment with grey values (WASPAS-G). Studies in
Informatics and Control, 24(2), 141–150. https://doi.org/10.24846/v24i2y201502
Zavadskas, E. K., Turskis, Z., & Antucheviciene, J. (2015b). Selecting a contractor by using a novel method for multiple
attribute analysis: Weighted Aggregated Sum Product Assessment with grey values (WASPAS-G). Studies in
Informatics and Control, 24(2), 141–150. https://doi.org/10.24846/v24i2y201502
Zavadskas, E. K., Turskis, Z., & Bagocius, V. (2015c). Multi-criteria selection of a deep-water port in the Eastern Baltic
Sea. Applied Soft Computing, 26, 180-192. https://doi.org/10.1016/j.asoc.2014.09.019
Ziemianczyk, U., Krakowiak-Bal, A., & Peszek, A. (2017). Sharing of knowledge as a condition of rural area development-
Fuzzy-set qualitative comparative analysis approach. Contemporary Economics, 11(4), 471–478, https://doi.org/10.5
709/ ce.1897-9254.257
Zhigljavsky, A. (2011). Singular spectrum analysis for time series. In International Encyclopedia of Statistical Science,
1335–1337. Springer Berlin Heidelberg. https://doi.org/10.1007/978-3-642-04898-2_521
Zimmermann, H. -J. (1978). Fuzzy programming and linear programming with several objective functions. Fuzzy Sets and
Systems, 1(1), 45–55. https://doi.org/10.1016/0165-0114(78)90031-3
The article has been reviewed.
Received in June 2018; accepted in April 2019.