A Housing Market with a Rent Ceiling - SFU.ca - Simon ...friesen/ECON103_lecture7.pdfrate, the...
75
© 2010 Pearson Education Canada A price ceiling or price cap is a regulation that makes it illegal to charge a price higher than a specified level. When a price ceiling is applied to a housing market it is called a rent ceiling. If the rent ceiling is set above the equilibrium rent, it has no effect. The market works as if there were no ceiling. But if the rent ceiling is set below the equilibrium rent, it has powerful effects. A Housing Market with a Rent Ceiling
Transcript of A Housing Market with a Rent Ceiling - SFU.ca - Simon ...friesen/ECON103_lecture7.pdfrate, the...

© 2010 Pearson Education Canada
A price ceiling or price cap is a regulation that makes it
illegal to charge a price higher than a specified level.
When a price ceiling is applied to a housing market it is
called a rent ceiling.
If the rent ceiling is set above the equilibrium rent, it has
no effect. The market works as if there were no ceiling.
But if the rent ceiling is set below the equilibrium rent, it
has powerful effects.
A Housing Market with a Rent Ceiling

© 2010 Pearson Education Canada
Housing Shortage
Figure 6.1 shows the
effects of a rent ceiling
that is set below the
equilibrium rent.
The equilibrium rent is
$1,000 a month.
A rent ceiling is set at
$800 a month.
So the equilibrium rent is
in the illegal region.
A Housing Market with a Rent Ceiling

© 2010 Pearson Education Canada
At the rent ceiling,
the quantity of
housing demanded
exceeds the quantity
supplied.
There is a shortage
of housing.
A Housing Market with a Rent Ceiling

© 2010 Pearson Education Canada
Because the legal price
cannot eliminate the
shortage, other
mechanisms operate:
Search activity
Black markets
With a housing
shortage, people are
willing to pay up to
$1,200 a month.
A Housing Market with a Rent Ceiling

© 2010 Pearson Education Canada
Search Activity
The time spent looking for someone with whom to do
business is called search activity.
When a price is regulated and there is a shortage, search
activity increases.
Search activity is costly and the opportunity cost of
housing equals its rent (regulated) plus the opportunity
cost of the search activity (unregulated).
Because the quantity of housing is less than the quantity
in an unregulated market, the opportunity cost of housing
exceeds the unregulated rent.
A Housing Market with a Rent Ceiling

© 2010 Pearson Education Canada
Black Markets
A black market is an illegal market that operates
alongside a legal market in which a price ceiling or other
restriction has been imposed.
A shortage of housing creates a black market in housing.
Illegal arrangements are made between renters and
landlords at rents above the rent ceiling—and generally
above what the rent would have been in an unregulated
market.
A Housing Market with a Rent Ceiling
© 2010 Pearson Education Canada
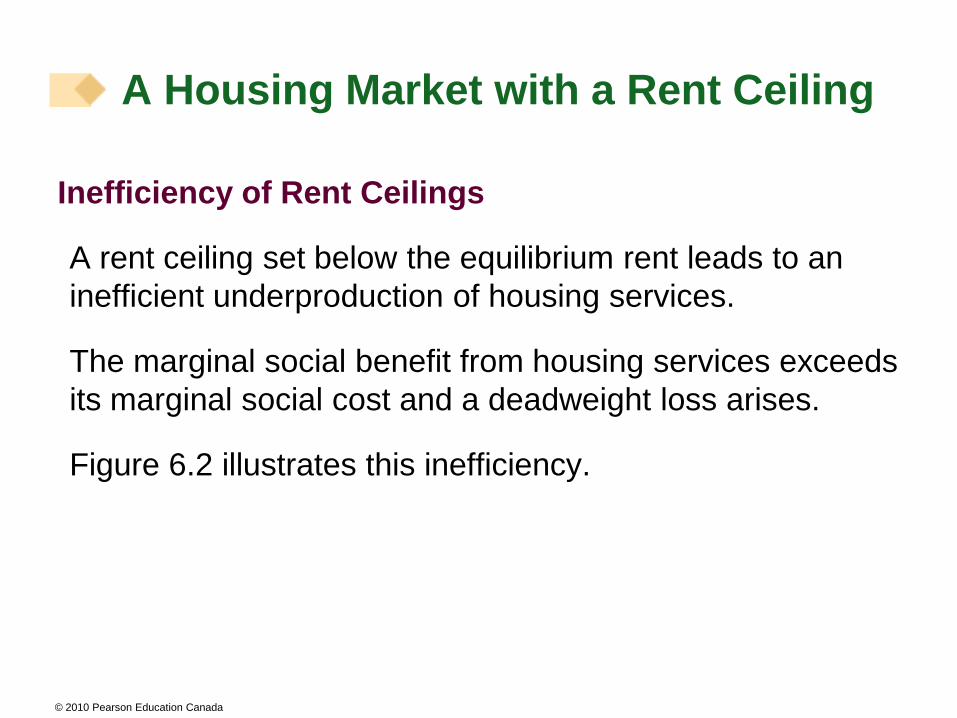
Inefficiency of Rent Ceilings
A rent ceiling set below the equilibrium rent leads to an
inefficient underproduction of housing services.
The marginal social benefit from housing services exceeds
its marginal social cost and a deadweight loss arises.
Figure 6.2 illustrates this inefficiency.
A Housing Market with a Rent Ceiling
© 2010 Pearson Education Canada
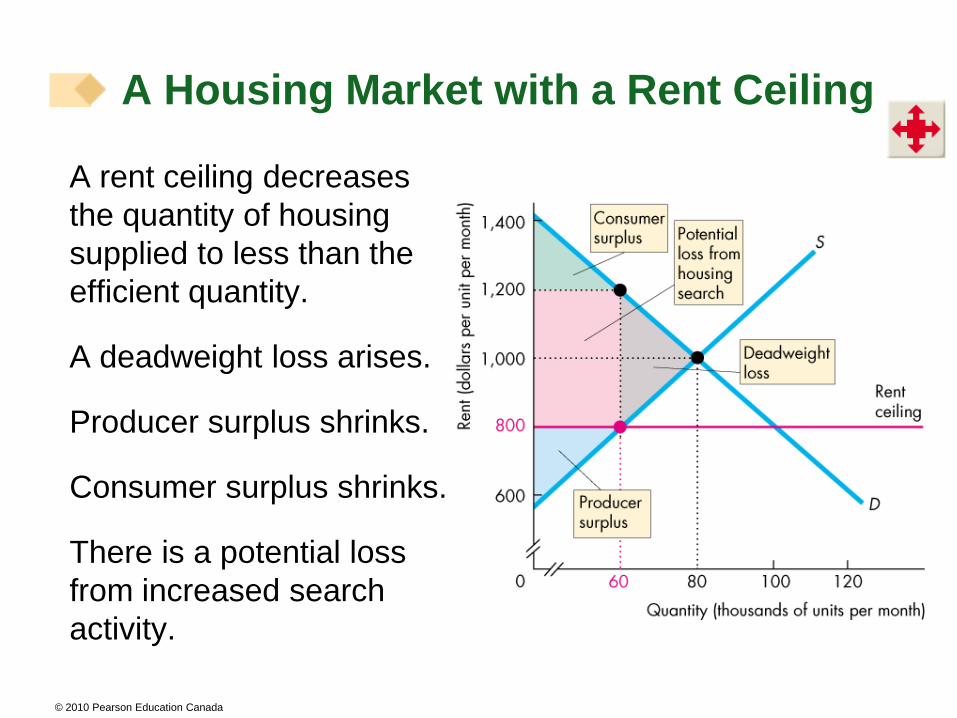
A rent ceiling decreases
the quantity of housing
supplied to less than the
efficient quantity.
A deadweight loss arises.
Producer surplus shrinks.
Consumer surplus shrinks.
There is a potential loss
from increased search
activity.
A Housing Market with a Rent Ceiling
© 2010 Pearson Education Canada
Are Rent Ceilings Fair?
According to the fair rules view, a rent ceiling is unfair
because it blocks voluntary exchange.
According to the fair results view, a rent ceiling is unfair
because it does not generally benefit the poor.
A rent ceiling decreases the quantity of housing and the
scarce housing is allocated by
Lottery
First-come, first-served
Discrimination
A Housing Market with a Rent Ceiling

© 2010 Pearson Education Canada
A lottery gives scarce housing to the lucky.
A first-come, first served gives scarce housing to those
who have the greatest foresight and get their names on
the list first.
Discrimination gives scarce housing to friends, family
members, or those of the selected sex, or those without a
dog.
None of these methods leads to a fair outcome.
A Housing Market with a Rent Ceiling

© 2010 Pearson Education Canada
A price floor is a regulation that makes it illegal to trade at
a price lower than a specified level.
When a price floor is applied to labour markets, it is called
a minimum wage.
If the minimum wage is set below the equilibrium wage
rate, it has no effect. The market works as if there were no
minimum wage.
If the minimum wage is set above the equilibrium wage
rate, it has powerful effects.
A Labour Market with a Minimum Wage

© 2010 Pearson Education Canada
If the minimum wage is set above the equilibrium wage
rate, the quantity of labour supplied by workers exceeds
the quantity demanded by employers.
There is a surplus of labour.
The quantity of labour hired at the minimum wage is less
than the quantity that would be hired in an unregulated
labour market.
Because the legal wage rate cannot eliminate the surplus,
the minimum wage creates unemployment.
Figure 6.3 on the next slide illustrates these effects.
A Labour Market with a Minimum Wage

© 2010 Pearson Education Canada
The equilibrium wage rate
is $6 an hour.
The minimum wage rate is
set at $7 an hour.
So the equilibrium wage
rate is in the illegal region.
The quantity of labour
employed is the quantity
demanded.
A Labour Market with a Minimum Wage
© 2010 Pearson Education Canada
A Labour Market with a Minimum Wage
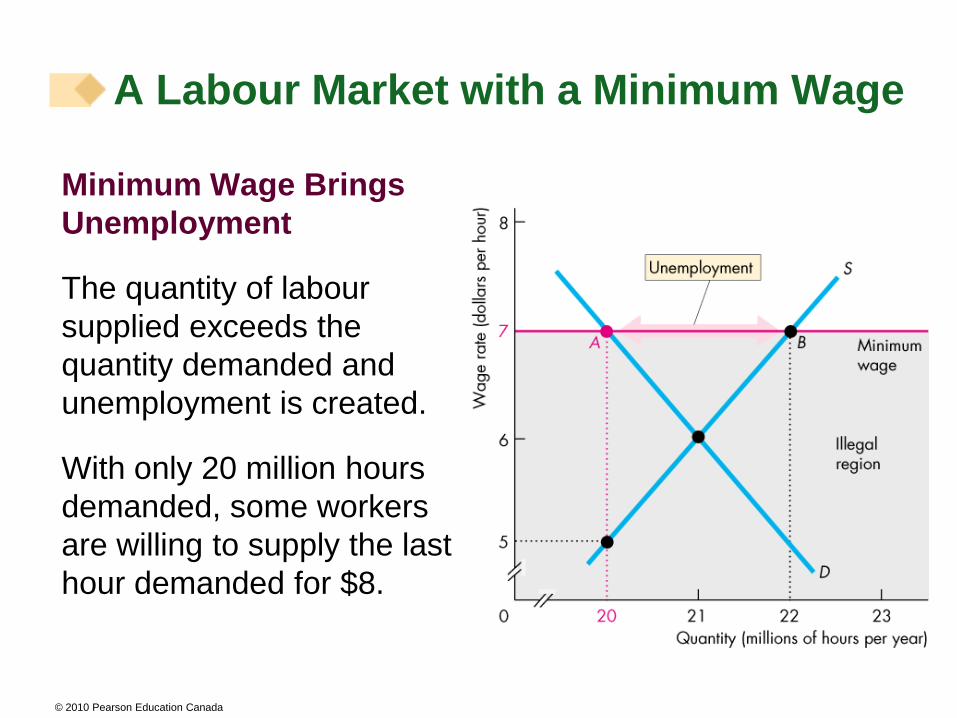
Minimum Wage Brings
Unemployment
The quantity of labour
supplied exceeds the
quantity demanded and
unemployment is created.
With only 20 million hours
demanded, some workers
are willing to supply the last
hour demanded for $8.

© 2010 Pearson Education Canada
Inefficiency of a Minimum Wage
A minimum wage leads to an inefficient outcome.
The quantity of labour employed is less than the efficient
quantity.
The supply of labour measures the marginal social cost
of labour to workers (leisure forgone).
The demand for labour measures the marginal social
benefit from labour (value of goods produced).
Figure 6.4 illustrates this inefficient outcome.
A Labour Market with a Minimum Wage

© 2010 Pearson Education Canada
A minimum wage set above the equilibrium wage decreases the quantity of labour employed.
A deadweight loss arises.
The potential loss from increased job search decreases both workers’ surplus and firms’ surplus.
The full loss is the sum of the red and grey areas.
A Labour Market with a Minimum Wage
© 2010 Pearson Education Canada
Is the Minimum Wage Fair?
A minimum wage rate in Canada is set by the provincial
governments.
In 2009, the minimum wage rate ranged from a low of
$7.50 an hour in New Brunswick to a high of $10.00 an
hour in Nunavut.
Most economists believe that minimum wage laws
increase the unemployment rate of low-skilled younger
workers.
A Labour Market with a Minimum
Wage
© 2010 Pearson Education Canada
Taxes
Everything you earn and most things you buy are taxed.
Who really pays these taxes?
Income tax and the social insurance taxes are deducted
from your pay, and provincial sales tax and GST are
added to the price of the most of the things you buy, so
isn’t it obvious that you pay these taxes?
Isn’t it equally obvious that your employer pays the
employer’s contribution to the social insurance tax?
You’re going to discover that it isn’t obvious who pays a
tax and that lawmakers don’t decide who will pay!
© 2010 Pearson Education Canada
Tax Incidence
Tax incidence is the division of the burden of a tax between buyers and sellers.
When an item is taxed, its price might rise by the full amount of the tax, by a lesser amount, or not at all.
If the price rises by the full amount of the tax, buyers pay the tax.
If the price rise by a lesser amount than the tax, buyers and sellers share the burden of the tax.
If the price doesn’t rise at all, sellers pay the tax.
Taxes

© 2010 Pearson Education Canada
Tax incidence doesn’t depend on tax law!
The law might impose a tax on buyers or sellers, but the
outcome will be the same.
To see why, we look at the tax on cigarettes in Ontario.
On February 1, 2006, Ontario raised the tax on the sales
of cigarettes to $3.90 a pack of 25 cigarettes.
What are the effects of this tax?
Taxes
© 2010 Pearson Education Canada
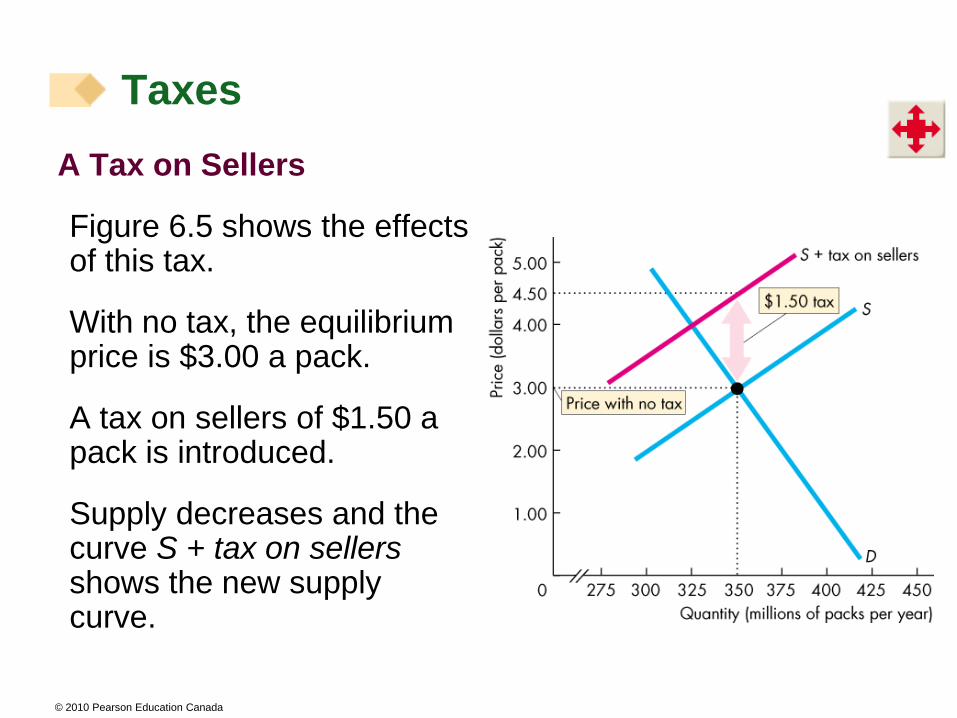
A Tax on Sellers
Figure 6.5 shows the effects of this tax.
With no tax, the equilibrium price is $3.00 a pack.
A tax on sellers of $1.50 a pack is introduced.
Supply decreases and the curve S + tax on sellers shows the new supply curve.
Taxes

© 2010 Pearson Education Canada
The market price paid by
buyers rises to $4.00 a
pack and the quantity
bought decreases.
The price received by the
sellers falls to $2.50 a
pack.
So with the tax of $1.50 a
pack, buyers pay $1.00 a
pack more and sellers
receive 50¢ a pack less.
Taxes

© 2010 Pearson Education Canada
A Tax on Buyers
Again, with no tax, the
equilibrium price is $3.00 a
pack.
A tax on buyers of $1.50 a
pack is introduced.
Demand decreases and
the curve D tax on
buyers shows the new
demand curve.
Taxes

© 2010 Pearson Education Canada
The price received by
sellers falls to $2.50 a
pack and the quantity
decreases.
So with the tax of $1.50 a pack, buyers pay $1.00 a pack more and sellers receive 50¢ a pack less.
The price paid by buyers rises to $4.00 a pack.
Taxes

© 2010 Pearson Education Canada
So, exactly as before when sellers were taxed:
Buyers pay $1.00 of the tax.
Sellers pay the other 50¢ of the tax.
Tax incidence is the same regardless of whether the law says sellers pay or buyers pay.
Taxes
© 2010 Pearson Education Canada
Tax Division and Elasticity of Demand
The division of the tax between buyers and sellers depends
on the elasticities of demand and supply.
To see how, we look at two extreme cases.
Perfectly inelastic demand: Buyer pay the entire tax.
Perfectly elastic demand: Sellers pay the entire tax.
The more inelastic the demand, the larger is the buyers’
share of the tax.
Taxes

© 2010 Pearson Education Canada
Demand for this good is
perfectly inelastic—the
demand curve is
vertical.
When a tax is imposed
on this good, buyers
pay the entire tax.
Taxes

© 2010 Pearson Education Canada
The demand for this
good is perfectly
elastic—the demand
curve is horizontal.
When a tax is imposed
on this good, sellers
pay the entire tax.
Taxes

© 2010 Pearson Education Canada
Tax Division and Elasticity of Supply
To see the effect of the elasticity of supply on the division
of the tax payment, we again look at two extreme cases.
Perfectly inelastic supply: Sellers pay the entire tax.
Perfectly elastic supply: Buyers pay the entire tax.
The more elastic the supply, the larger is the buyers’ share
of the tax.
Taxes
© 2010 Pearson Education Canada
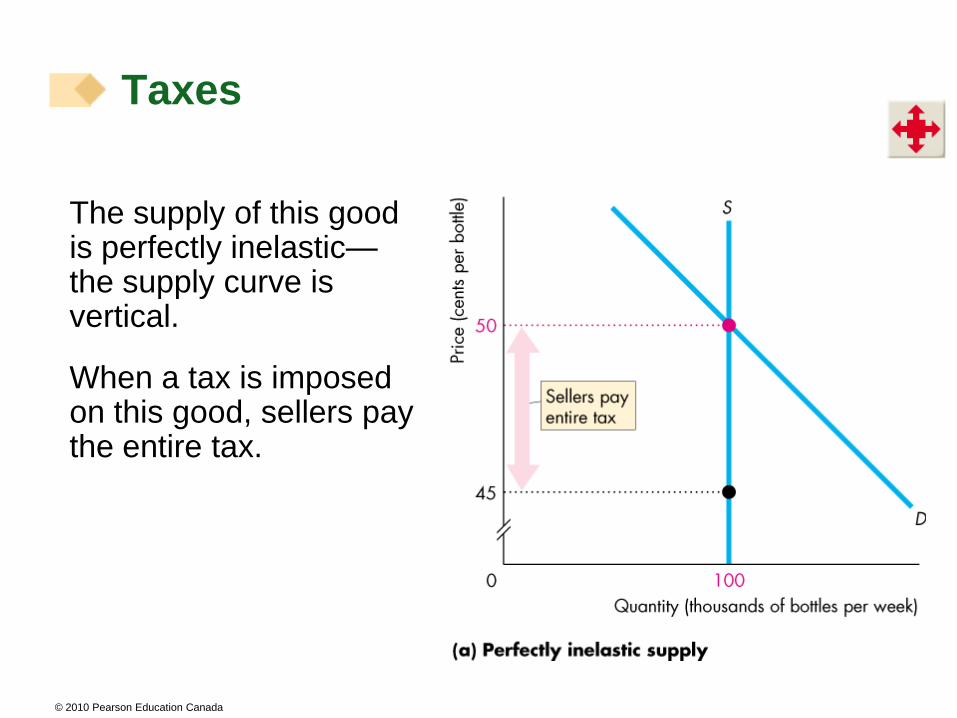
The supply of this good is perfectly inelastic—the supply curve is vertical.
When a tax is imposed on this good, sellers pay the entire tax.
Taxes

© 2010 Pearson Education Canada
The supply of this good
is perfectly elastic—the
supply curve is
horizontal.
When a tax is imposed
on this good, buyers
pay the entire tax.
Taxes

© 2010 Pearson Education Canada
Taxes in Practice
Taxes usually are levied on goods and services with an
inelastic demand or an inelastic supply.
Alcohol, tobacco, and gasoline have inelastic demand, so
the buyers of these items pay most the tax on them.
Labour has a low elasticity of supply, so the seller—the
worker—pays most of the income tax and most of the
Social Security tax.
Taxes

© 2010 Pearson Education Canada
Taxes and Efficiency
Except in the extreme cases of perfectly inelastic demand
or perfectly inelastic supply when the quantity remains the
same, imposing a tax creates inefficiency.
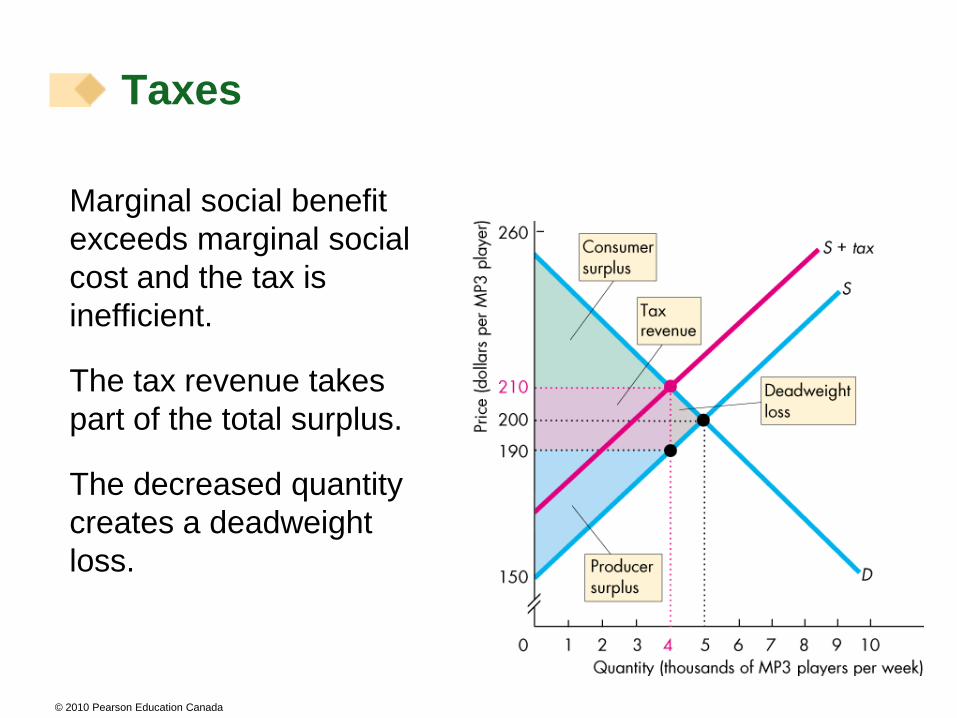
Figure 6.10 shows the inefficiency created by a $20 tax on
MP3 players.
Taxes

© 2010 Pearson Education Canada
With no tax, marginal
social benefit equals
marginal social cost and
the market is efficient.
Total surplus (the sum of
consumer surplus and
producer surplus) is
maximized.
The tax decreases the
quantity, raises the buyers’
price, and lowers the
sellers’ price.
Taxes
© 2010 Pearson Education Canada
Marginal social benefit
exceeds marginal social
cost and the tax is
inefficient.
The tax revenue takes
part of the total surplus.
The decreased quantity
creates a deadweight
loss.
Taxes

© 2010 Pearson Education Canada
Intervention in markets for farm products takes two main
forms:
Production quotas
Subsidies
A production quota is an upper limit to the quantity of a
good that may be produced during a specified period.
A subsidy is a payment made by the government to a
producer.
Production Subsidies and Quotas

© 2010 Pearson Education Canada
Production Quotas
With no quota, the price is
$3 a tonne and 16 million
tonnes a year are
produced.
With the production quota
of 14 million tonnes a year,
quantity decreases to 14
million tonnes a year.
The market price rises to
$5 a tonne and marginal
cost falls to $2 a tonne.
Production Subsidies and Quotas

© 2010 Pearson Education Canada
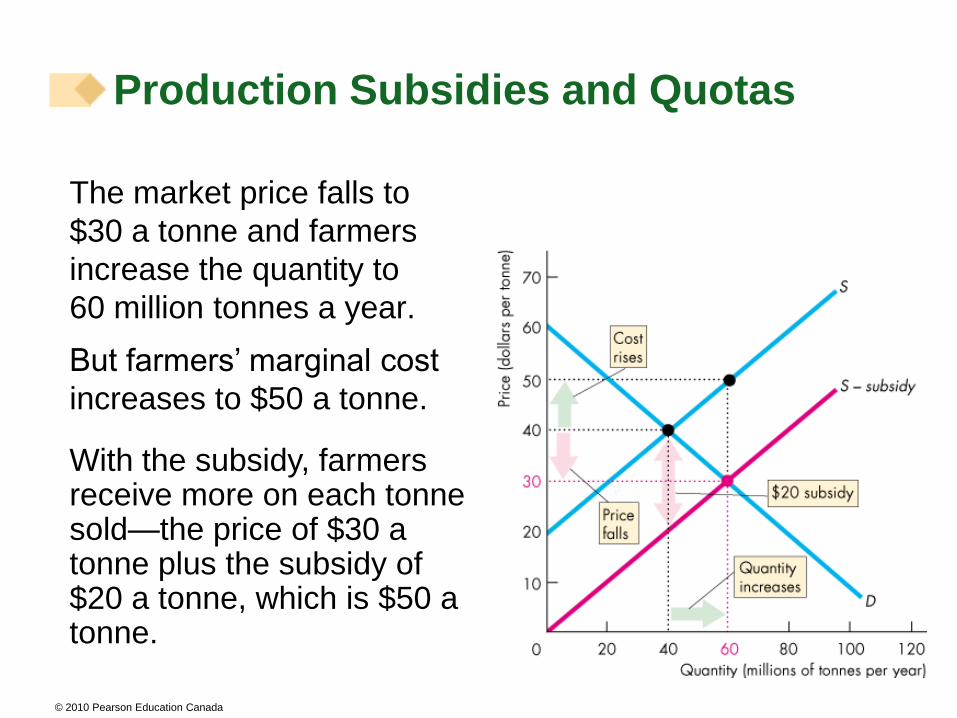
Subsidies
With no subsidy, the price
is $40 a tonne and 40
million tonnes a year are
produced.
With a subsidy of $20 a
tonne, marginal cost minus
subsidy falls by $20 a
tonne and the new supply
curve is S – subsidy.
Production Subsidies and Quotas
© 2010 Pearson Education Canada
The market price falls to
$30 a tonne and farmers
increase the quantity to
60 million tonnes a year.
With the subsidy, farmers receive more on each tonne sold—the price of $30 a tonne plus the subsidy of $20 a tonne, which is $50 a tonne.
But farmers’ marginal cost
increases to $50 a tonne.
Production Subsidies and Quotas

© 2010 Pearson Education Canada
Markets for Illegal Goods
The Canadian government prohibits trade of some goods,
such as illegal drugs.
Yet, markets exist for illegal goods and services.
How does the market for an illegal good work?
To see how the market for an illegal good works, we begin
by looking at a free market and see the changes that occur
when the good is made illegal.
© 2010 Pearson Education Canada
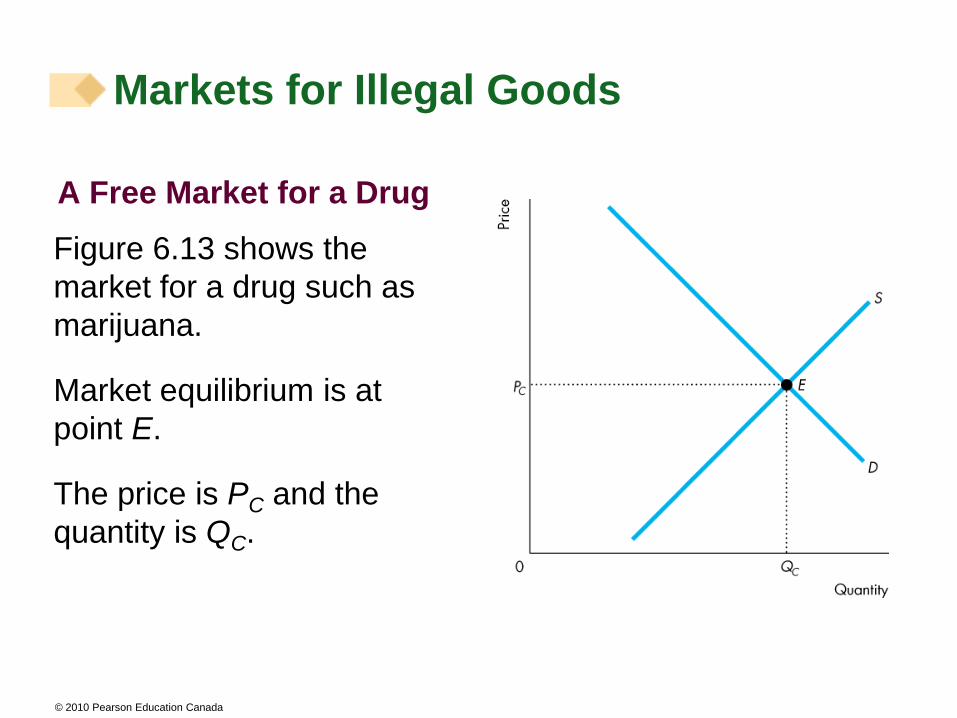
A Free Market for a Drug
Figure 6.13 shows the
market for a drug such as
marijuana.
Market equilibrium is at
point E.
The price is PC and the
quantity is QC.
Markets for Illegal Goods

© 2010 Pearson Education Canada
Penalties on Sellers
If the penalty on the seller
is the amount HK, then the
quantity supplied at a
market price of PC is QP.
Supply of the drug
decreases to S + CBL.
The new equilibrium is at
point F. The price rises and
the quantity decreases.
Markets for Illegal Goods

© 2010 Pearson Education Canada
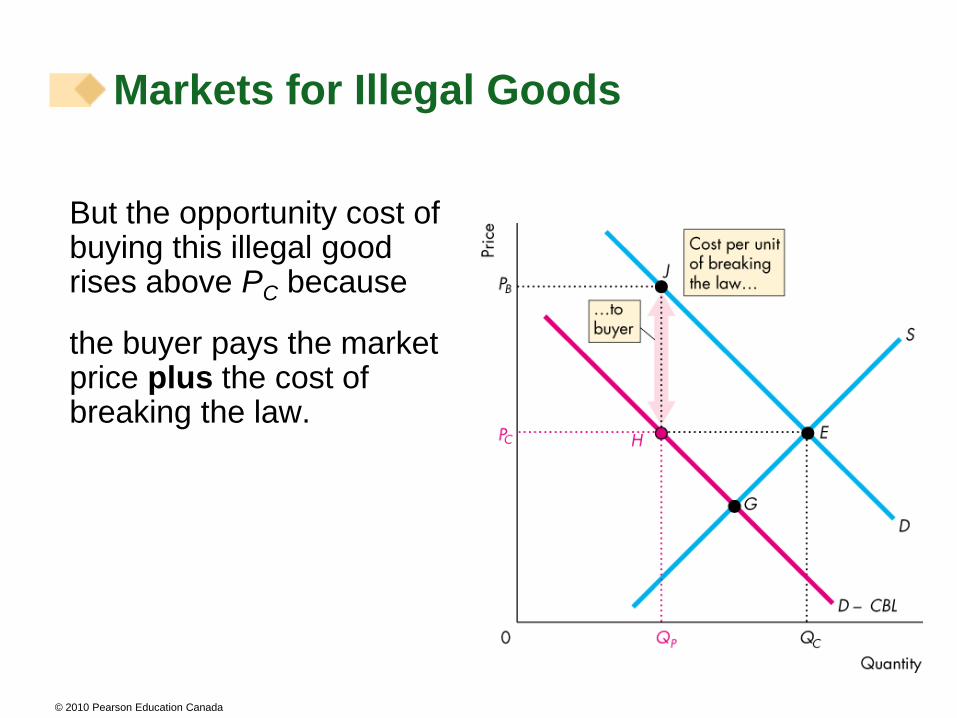
Penalties on Buyers
If the penalty on the buyer
is the amount JH, the
quantity demanded at a
market price of PC is QP.
Demand for the drug
decreases to D – CBL.
The new equilibrium is at
point G. The market price
falls and the quantity
decreases.
Markets for Illegal Goods
© 2010 Pearson Education Canada
But the opportunity cost of buying this illegal good rises above PC because
the buyer pays the market price plus the cost of breaking the law.
Markets for Illegal Goods
© 2010 Pearson Education Canada
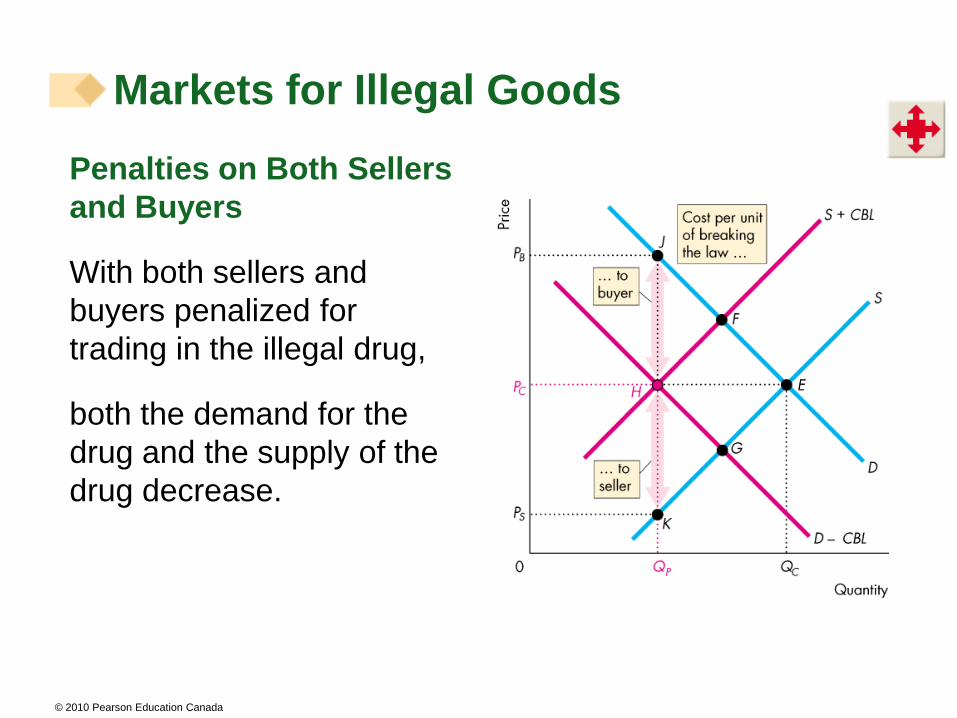
Penalties on Both Sellers
and Buyers
With both sellers and
buyers penalized for
trading in the illegal drug,
both the demand for the
drug and the supply of the
drug decrease.
Markets for Illegal Goods

© 2010 Pearson Education Canada
The new equilibrium is at
point H.
The quantity decreases to
QP.
The market price is PC.
The buyer pays PB and the
seller receives PS.
Markets for Illegal Goods

© 2010 Pearson Education Canada
Legalizing and Taxing Drugs
An illegal good can be legalized and taxed.
A high enough tax rate would decrease consumption to
the level that occurs when trade is illegal.
Arguments that extend beyond economics surround this
choice.
Markets for Illegal Goods

© 2010 Pearson Education Canada
iPods, Wii games, and Roots sweaters are just three of the
items you might buy that are not produced in Canada.
In fact, most of the goods that you buy are produced abroad
and transported here in container ships or cargo jets.
And it’s not only goods produced abroad that you buy—it is
services too.
All these activities are part of the globalization process that
is having a profound effect on our lives.
Why do we go to such lengths to trade and communicate
with others in faraway places?
Global Markets in Action
© 2010 Pearson Education Canada
Because we trade with people in other countries, the
goods and services that we can buy and consume are
not limited by what we can produce.
Imports are the good and services that we buy from
people in other countries.
Exports are the goods and services we sell to people
in other countries.
How Global Markets Work

© 2010 Pearson Education Canada
International Trade Today
Global trade today is enormous.
In 2008, global exports and imports were $35 trillion,
which is more than half the value of global production.
In 2008, total Canadian exports were $535 billion, which is
about 34 percent of the value of Canadian production.
In 2008, total Canadian imports were $503 billion, which is
about 32 percent of the value of Canadian production.
Services are 13 percent of total Canadian exports and 18
percent of total Canadian imports.
How Global Markets Work

© 2010 Pearson Education Canada
What Drives International Trade?
The fundamental force that generates trade between
nations is comparative advantage.
The basis for comparative trade is divergent opportunity
costs between countries.
National comparative advantage as the ability of a nation
to perform an activity or produce a good or service at a
lower opportunity cost than any other nation.
How Global Markets Work
© 2010 Pearson Education Canada
The opportunity cost of producing a T-shirt is lower in China than in Canada, so China has a comparative advantage in producing T-shirts.
The opportunity cost of producing a regional jet is lower in Canada than in China, so Canada has a comparative advantage in producing regional jets.
Both countries can reap gains from trade by specializing in the production of the good at which they have a comparative advantage and then trading.
Both countries are better off.
How Global Markets Work
© 2010 Pearson Education Canada
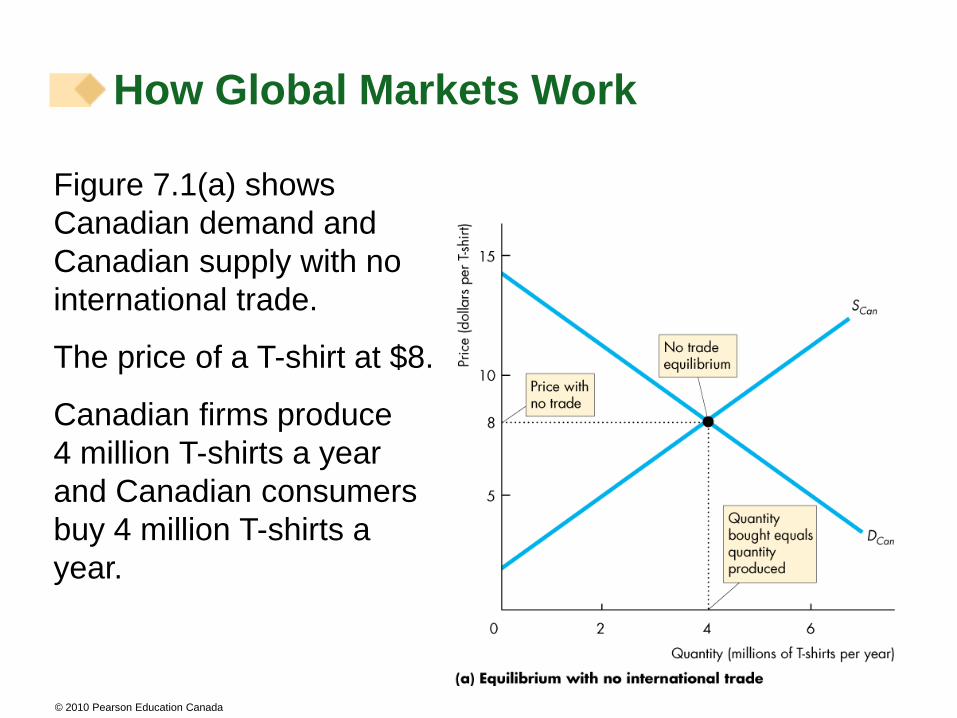
How Global Markets Work
Figure 7.1(a) shows
Canadian demand and
Canadian supply with no
international trade.
The price of a T-shirt at $8.
Canadian firms produce
4 million T-shirts a year
and Canadian consumers
buy 4 million T-shirts a
year.
© 2010 Pearson Education Canada
How Global Markets Work
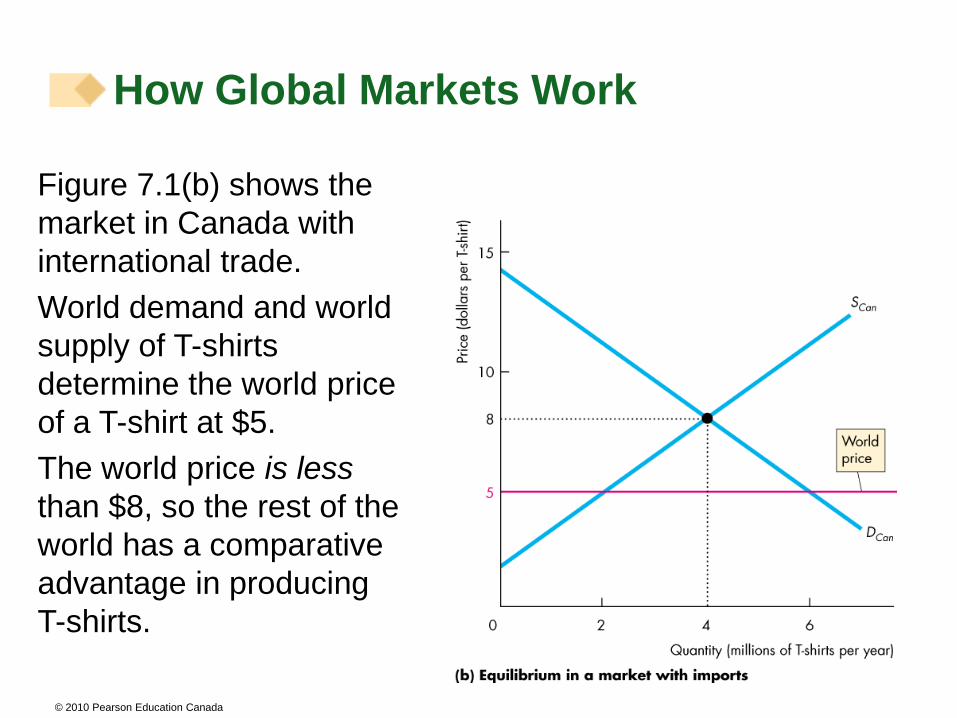
Figure 7.1(b) shows the
market in Canada with
international trade.
World demand and world
supply of T-shirts
determine the world price
of a T-shirt at $5.
The world price is less
than $8, so the rest of the
world has a comparative
advantage in producing
T-shirts.

© 2010 Pearson Education Canada
How Global Markets Work
With international trade,
the price of a T-shirt in
Canada falls to $5.
At $5 a T-shirt, Canadian
garment makers produce
2 million T-shirts a year.
At $5 a T-shirt,
Canadians buy 6 million
T-shirts a year.
Canada imports 4 million
T-shirts a year.
© 2010 Pearson Education Canada
How Global Markets Work
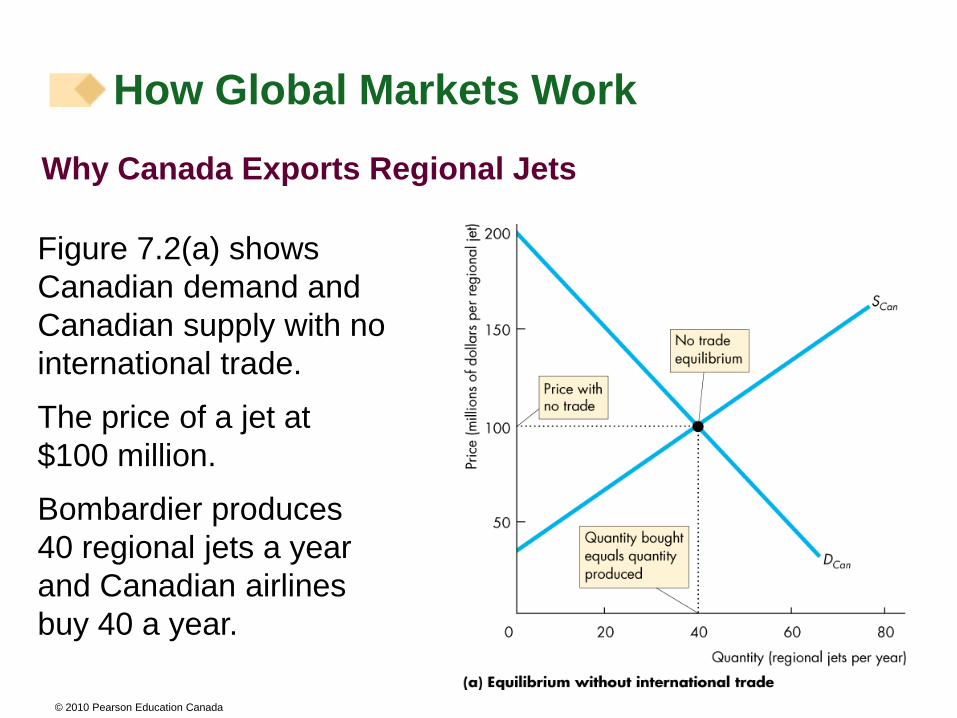
Why Canada Exports Regional Jets
Figure 7.2(a) shows
Canadian demand and
Canadian supply with no
international trade.
The price of a jet at
$100 million.
Bombardier produces
40 regional jets a year
and Canadian airlines
buy 40 a year.

© 2010 Pearson Education Canada
How Global Markets Work
Figure 7.2(b) shows the
market in Canada with
international trade.
World demand and world
supply of jets determine the
world price of a regional jet
at $150 million.
The world price exceeds
$100 million, so Canada
has a comparative
advantage in producing
regional jets.

© 2010 Pearson Education Canada
How Global Markets Work
With international trade,
the price of a jet in Canada
rises to $150 million.
At $150 million, Canadian
airlines buy 20 jets a year.
At $150 million,
Bombardier produces 70
regional jets a year.
Canada exports 50
regional jets a year.

© 2010 Pearson Education Canada
International trade lowers the price of an imported good and raises the price of an exported good.
Buyers of imported goods benefit from lower prices and sellers of exported goods benefit from higher prices.
But some people complain about international competition: not everyone gains.
Who wins and who loses from free international trade?
Winners, Losers, and the Net
Gain from Trade
© 2010 Pearson Education Canada
Winners, Losers, and the Net
Gain from Trade
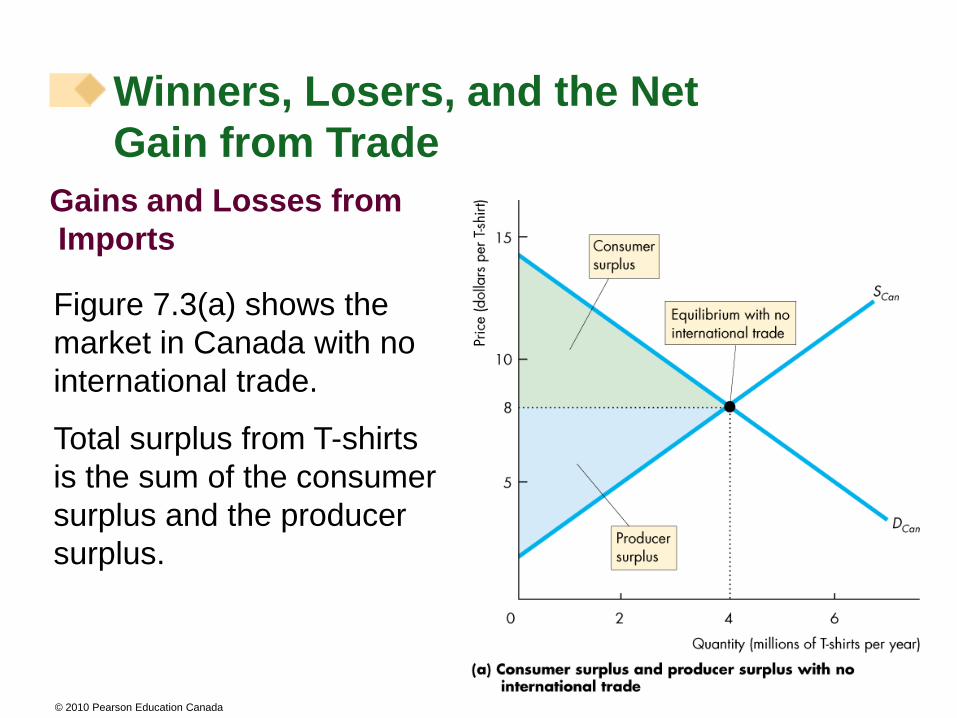
Gains and Losses from
Imports
Figure 7.3(a) shows the
market in Canada with no
international trade.
Total surplus from T-shirts
is the sum of the consumer
surplus and the producer
surplus.

© 2010 Pearson Education Canada
Figure 7.3(b) shows the
market in Canada with
international trade.
The world price is $5 a
T-shirt.
Consumer surplus
expands from area A to
the area A + B + D.
Producer surplus shrinks
to the area C.
Winners, Losers, and the Net
Gain from Trade

© 2010 Pearson Education Canada
Winners, Losers, and the Net
Gain from Trade
The area B is transferred
from producers to
consumers.
Area D is an increase in
total surplus.
Area D is the net gain
from imports.

© 2010 Pearson Education Canada
Winners, Losers, and the Net
Gain from Trade
Gains and Losses from
Exports
Figure 7.4(a) shows the
market in Canada with no
international trade.
Total surplus from regional
jets is the sum of the
consumer surplus and the
producer surplus.
© 2010 Pearson Education Canada
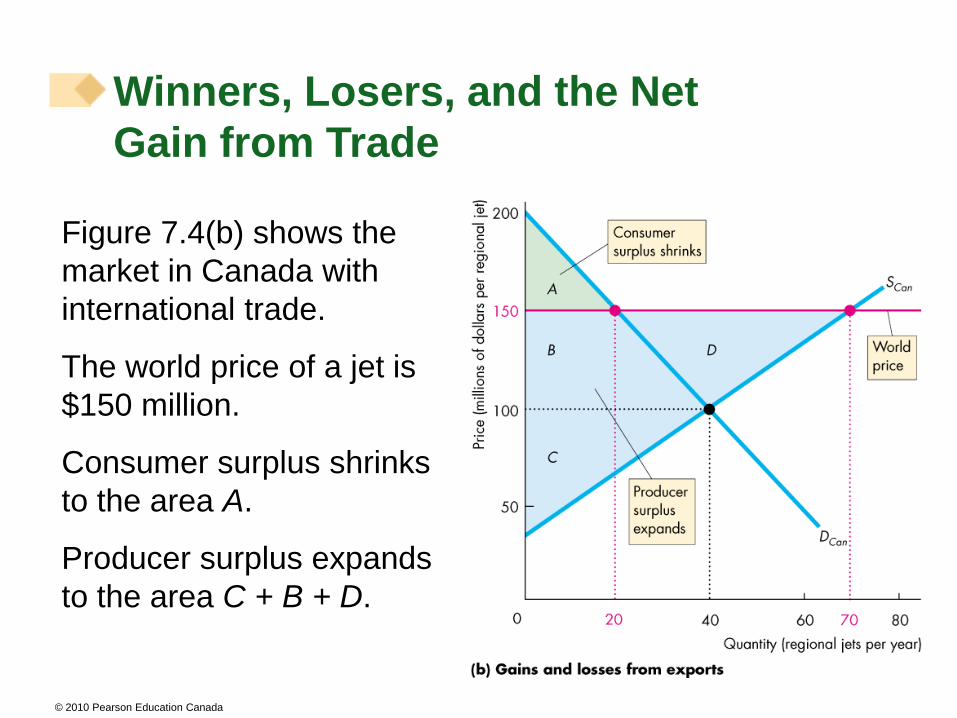
Figure 7.4(b) shows the
market in Canada with
international trade.
The world price of a jet is
$150 million.
Consumer surplus shrinks
to the area A.
Producer surplus expands
to the area C + B + D.
Winners, Losers, and the Net
Gain from Trade

© 2010 Pearson Education Canada
Winners, Losers, and the Net
Gain from Trade
The area B is
transferred from
consumers to producers.
Area D is an increase in
total surplus.
Area D is the net gain
from exports.

© 2010 Pearson Education Canada
Governments restrict international trade to protect domestic producers from competition.
Governments use four sets of tools:
Tariffs
Import quotas
Other import barriers
Export subsidies
International Trade Restrictions

© 2010 Pearson Education Canada
Tariffs
A tariff is a tax on a good that is imposed by the importing
country when an imported good crosses its international
boundary.
For example, the government of India imposes a 100
percent tariff on wine imported from Canada.
So when an Indian wine merchant imports a $10 bottle of
Ontario wine, he pays the Indian government $10 import
duty.
International Trade Restrictions

© 2010 Pearson Education Canada
The Effects of a Tariff
With free international trade, the world price of a T-shirt is $5 and Canada imports 4 million T-shirts a year.
Imagine that Canada imposes a tariff of $2 on each T-shirt
imported.
The price of a T-shirt in Canada rises by $2.
Figure 7.5 shows the effect of the tariff on the market for T-shirts in Canada.
International Trade Restrictions

© 2010 Pearson Education Canada
International Trade Restrictions
Figure 7.5(a) shows the
market before the
government imposes the
tariff.
The world price of a T-shirt is $5.
With free international trade, Canada imports4 million T-shirts a year.
© 2010 Pearson Education Canada
International Trade Restrictions
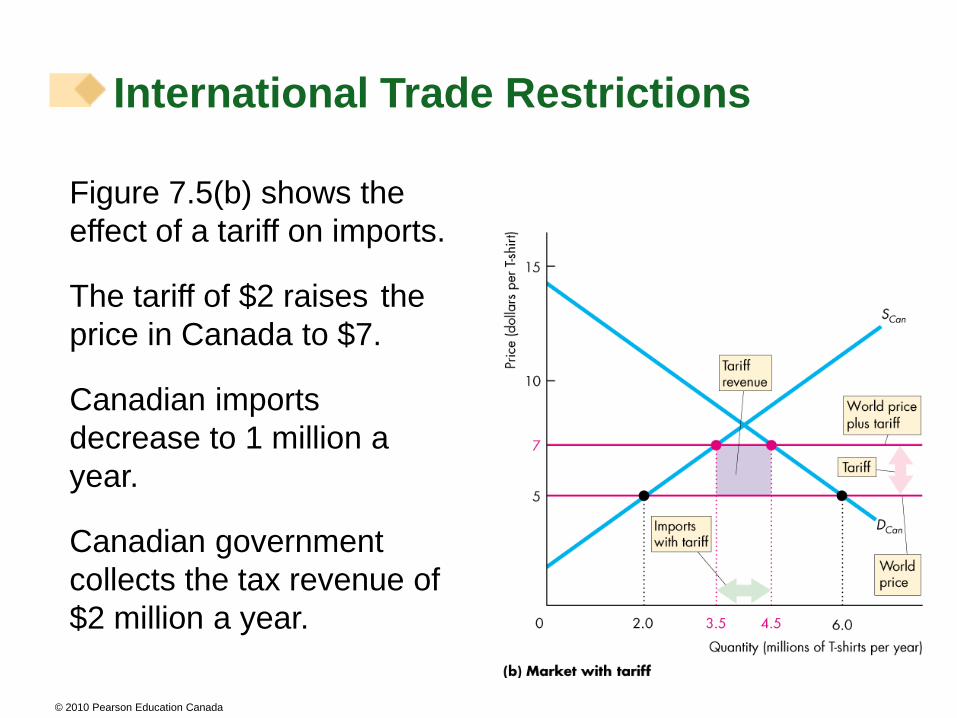
Figure 7.5(b) shows the
effect of a tariff on imports.
The tariff of $2 raises the
price in Canada to $7.
Canadian imports
decrease to 1 million a
year.
Canadian government
collects the tax revenue of
$2 million a year.

© 2010 Pearson Education Canada
Winners, Losers, and Social Loss from a Tariff
When the Canadian government imposes a tariff on
imported T-shirts:
Canadian consumers of T-shirts lose.
Canadian producers of T-shirts gain.
Canadian consumers lose more than Canadian producers gain.
Society loses: a deadweight loss arises.
International Trade Restrictions
© 2010 Pearson Education Canada
Canadian Consumers of T-shirts Lose
Canadian buyers of T-shirts now pay a higher price (the world price
plus the tariff), so they buy fewer T-shirts.
The combination of a higher price and a smaller quantity bought
decreases consumer surplus.
The loss of consumer surplus is the loss to Canadian consumers
from the tariff.
International Trade Restrictions

© 2010 Pearson Education Canada
Canadian Producers of T-shirts Gain
Canadian garment makers can now sell T-shirts for a higher price
(the world price plus the tariff), so they produce more T-shirts.
But the marginal cost of producing a T-shirt is less than the higher
price, so the producer surplus increases.
The increased producer surplus is the gain to Canadian garment
makers from the tariff.
International Trade Restrictions
© 2010 Pearson Education Canada
Canadian Consumers Lose More than Canadian Producers Gain
Consumer surplus decreases and producer surplus increases.
Which changes by more?
Figure 7.6 illustrates the change in total surplus.
International Trade Restrictions
© 2010 Pearson Education Canada
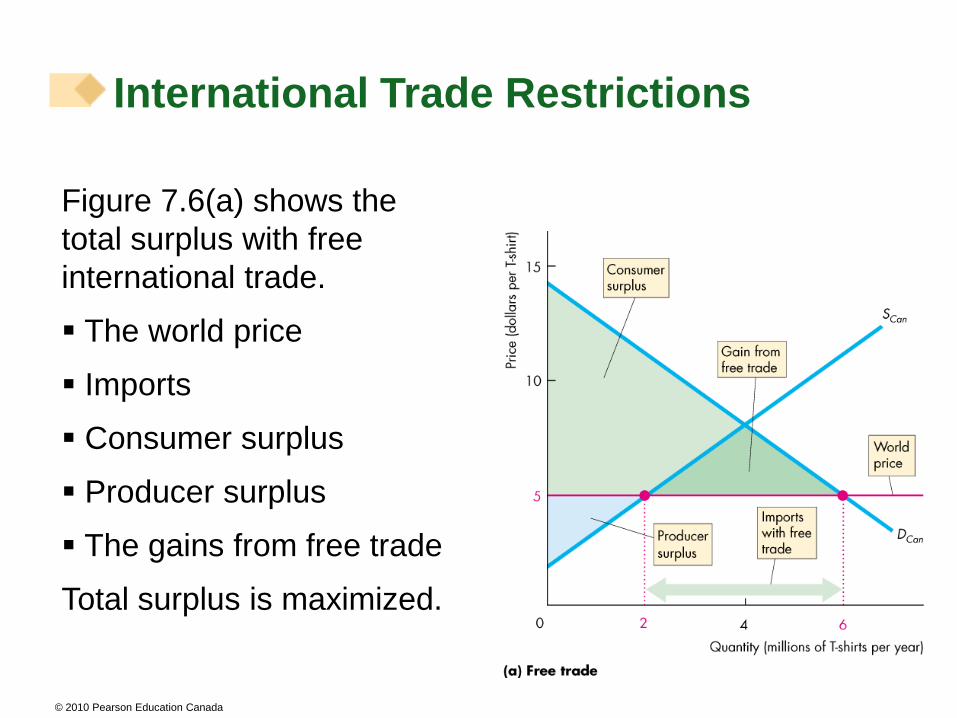
International Trade Restrictions
Figure 7.6(a) shows the
total surplus with free
international trade.
The world price
Imports
Consumer surplus
Producer surplus
The gains from free trade
Total surplus is maximized.