A HIGH-SPEED SENSOR FOR MEASURING CHEST DEFLECTION IN ...
29
A HIGH-SPEED SENSOR FOR MEASURING CHEST DEFLECTION IN CRASH TEST DUMMIES Stephen W. Rouhana Safety Research Department General Motors Global Research and Development Operations Ali M. Elhagediab Jeffrey J. Chapp Aerotek Lab Support United States Paper Number 9%S9-O- 15 ABSTRACT 208) and the viscous response (deflection times velocity of the deflection). Chest deflection measurement is critical for the assessment of thoracic injury since the two most widely accepted criteria for chest injury (chest deflection and the viscous response) are based on deflection. One major issue with the measurement of chest deflection in crash test dummies has been the inability to accurately track motion of the chest at very high deflection speeds (above 10 m/s under certain circumstances). This limitation has increased the difficulty in evaluating some deployable safety devices, most notably airbags. When there is no interaction with the dummy, airbags deploy at velocities of 50 to 150 m/s. When there is interaction with the dummy, such as occurs in out-of-position tests with the chest in contact with the airbag module, airbags can deform the chest at deflection rates of 10 to 18 m/s. Each of these sensors for measurement of deflection has had limitations, which have prevented their use in some crash test evaluations using ATDs. One major issue has been the inability to accurately track motion of the chest at very high deflection speeds (above 10 m/s under certain circumstances). This limitation has increased the difficulty in evaluating some deployable safety devices, most notably airbags. When there is no interaction with the dummy airbags deploy at velocities of 50 to 150 m/s. When there is interaction with the dummy, such as occurs in out-of-position tests with the chest in contact with the airbag module, airbags can deform the chest at deflection rates of 10 to 18 m/s. Our main research goal was to develop a new sensor to measure chest deflection at all speeds of interest in the automotive environment (quasi-static to 18 m/s). The device developed, called the I/R-TRACC system (InfraRed - Telescoping Rod for Assessment of Chest Compression), uses two infrared LEDs inside of a telescoping rod. One LED is used as the emitter and the other is used as the receiver of the infrared light. The output of this device is a linear function of chest compression. The data presented in this paper shows that the IR-TRACC system appears to have met the design requirements set forth at the beginning of the project and should be suitable for any crash test dummy designed to measure chest deflection, including frontal and side impact dummies. Another issue relative to chest deflection measurement has been electrical or mechanical noise associated with the measuring instrumentation or sensor. Noise in the deflection time history can prevent assessment of the viscous response because of the differentiation needed in the calculation. Differentiation of a noisy signal typically leads to an unusable result. Filtering may be helpful to some extent; however, experience has shown that the degree of filtering typically necessary to smooth a noisy signal for the viscous response calculation is unacceptable because of the significant loss of data that results. INTRODUCTION Our main research goal was to develop a new sensor to measure chest deflection at all speeds of interest in the automotive environment (quasi-static to 18 m/s). A secondary goal included addressing other problem areas of previous devices (e.g., Hybrid III ball/slider disconnect in severe belt loading) with the new sensor to be developed. Over the years since anthropomorphic test devices (ATDs) or crash test dummies first became available, many different devices have been developed or adapted to them for the measurement of chest deflection. Measurement of chest deflection is critical for the assessment of thoracic injury since the two most widely accepted criteria for injury are based on deflection. Those criteria are deflection itself (which is evaluated in FMVSS The device we developed, called the I/R -TRACC system (LnfraRed - Telescoping Rod for Assessment of Chest Compression), has several different modes of operation using various combinations of infrared LEDs and phototransistors inside of a telescoping rod. As will be shown for the LED-to-LED Mode, this system appears to have met the design requirements set forth at the beginning of the project. Although the original intent of this program was to develop a transducer to replace the 2017
Transcript of A HIGH-SPEED SENSOR FOR MEASURING CHEST DEFLECTION IN ...

A HIGH-SPEED SENSOR FOR MEASURING CHEST DEFLECTION IN CRASH TEST DUMMIES
Stephen W. Rouhana Safety Research Department General Motors Global Research and Development Operations Ali M. Elhagediab Jeffrey J. Chapp Aerotek Lab Support United States Paper Number 9%S9-O- 15
ABSTRACT 208) and the viscous response (deflection times velocity of the deflection).
Chest deflection measurement is critical for the assessment of thoracic injury since the two most widely accepted criteria for chest injury (chest deflection and the viscous response) are based on deflection. One major issue with the measurement of chest deflection in crash test dummies has been the inability to accurately track motion of the chest at very high deflection speeds (above 10 m/s under certain circumstances). This limitation has increased the difficulty in evaluating some deployable safety devices, most notably airbags. When there is no interaction with the dummy, airbags deploy at velocities of 50 to 150 m/s. When there is interaction with the dummy, such as occurs in out-of-position tests with the chest in contact with the airbag module, airbags can deform the chest at deflection rates of 10 to 18 m/s.
Each of these sensors for measurement of deflection has had limitations, which have prevented their use in some crash test evaluations using ATDs. One major issue has been the inability to accurately track motion of the chest at very high deflection speeds (above 10 m/s under certain circumstances). This limitation has increased the difficulty in evaluating some deployable safety devices, most notably airbags. When there is no interaction with the dummy airbags deploy at velocities of 50 to 150 m/s. When there is interaction with the dummy, such as occurs in out-of-position tests with the chest in contact with the airbag module, airbags can deform the chest at deflection rates of 10 to 18 m/s.
Our main research goal was to develop a new sensor to measure chest deflection at all speeds of interest in the automotive environment (quasi-static to 18 m/s). The device developed, called the I/R-TRACC system (InfraRed - Telescoping Rod for Assessment of Chest Compression), uses two infrared LEDs inside of a telescoping rod. One LED is used as the emitter and the other is used as the receiver of the infrared light. The output of this device is a linear function of chest compression. The data presented in this paper shows that the IR-TRACC system appears to have met the design requirements set forth at the beginning of the project and should be suitable for any crash test dummy designed to measure chest deflection, including frontal and side impact dummies.
Another issue relative to chest deflection measurement has been electrical or mechanical noise associated with the measuring instrumentation or sensor. Noise in the deflection time history can prevent assessment of the viscous response because of the differentiation needed in the calculation. Differentiation of a noisy signal typically leads to an unusable result. Filtering may be helpful to some extent; however, experience has shown that the degree of filtering typically necessary to smooth a noisy signal for the viscous response calculation is unacceptable because of the significant loss of data that results.
INTRODUCTION
Our main research goal was to develop a new sensor to measure chest deflection at all speeds of interest in the automotive environment (quasi-static to 18 m/s). A secondary goal included addressing other problem areas of previous devices (e.g., Hybrid III ball/slider disconnect in severe belt loading) with the new sensor to be developed.
Over the years since anthropomorphic test devices (ATDs) or crash test dummies first became available, many different devices have been developed or adapted to them for the measurement of chest deflection. Measurement of chest deflection is critical for the assessment of thoracic injury since the two most widely accepted criteria for injury are based on deflection. Those criteria are deflection itself (which is evaluated in FMVSS
The device we developed, called the I/R -TRACC system (LnfraRed - Telescoping Rod for Assessment of Chest Compression), has several different modes of operation using various combinations of infrared LEDs and phototransistors inside of a telescoping rod. As will be shown for the LED-to-LED Mode, this system appears to have met the design requirements set forth at the beginning of the project. Although the original intent of this program was to develop a transducer to replace the
2017
sensor in the Hybrid III frontal impact dummy, the I/R TRACC system should be suitable for any crash test dummy designed to measure chest deflection, including frontal and side impact dummies.
Previously Developed Chest Deflection Instrumentation
Since two of the accepted injury criteria for assessing chest injury rely on measurement of chest deflection (chest compression and viscous response), many attempts have been made to develop deflection- measuring systems. Examples of some of the published work follow. More detail will be provided relative to the Hybrid III chest deflection transducer because that is a regulated dummy and was the initial focus of our work. In addition, we will provide more detail on the method used in the NHTSA’s Advanced ATD because our method builds on that work as originally conceived and first implemented by Schneider et al. [l] ‘.
In the 1973 design of the dummy called “Repeatable Pete”, McElhaney, et al. [2] used a space linkage, which was movable in three dimensions and had rotary potentiometers attached at the pivots. The output of the potentiometers was added differentially to make the output “proportional to the horizontal motion of the chest attachment point and independent of the other components of [the] motion”.
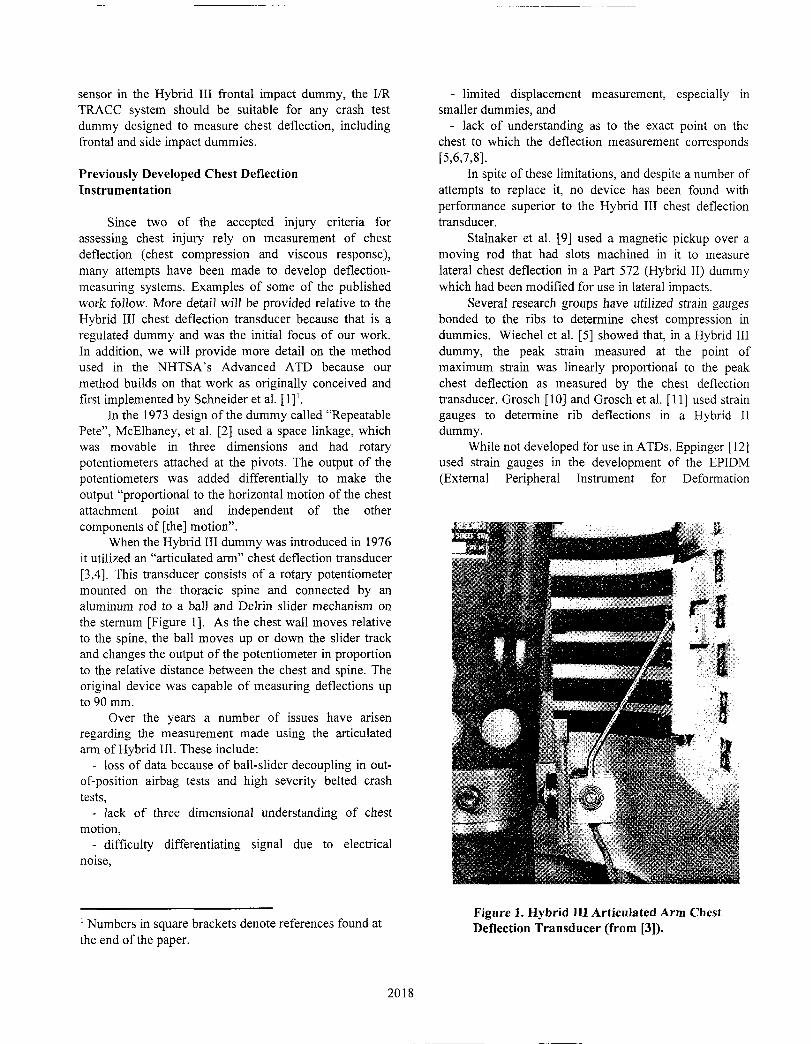
When the Hybrid III dummy was introduced in 1976 it utilized an “articulated arm” chest deflection transducer [3,4]. This transducer consists of a rotary potentiometer mounted on the thoracic spine and connected by an aluminum rod to a ball and Delrin slider mechanism on the sternum [Figure 11. As the chest wall moves relative to the spine, the ball moves up or down the slider track and changes the output of the potentiometer in proportion to the relative distance between the chest and spine. The original device was capable of measuring deflections up to 90 mm.
Over the years a number of issues have arisen regarding the measurement made using the articulated arm of Hybrid III. These include:
- loss of data because of ball-slider decoupling in out- of-position airbag tests and high severity belted crash tests,
- lack of three dimensional understanding of chest motion,
- difficulty differentiating signal due to electrical noise,
’ Numbers in square brackets denote references found at the end of the paper.
- limited displacement measurement, especially in smaller dummies, and
- lack of understanding as to the exact point on the chest to which the deflection measurement corresponds W,7,81.
In spite of these limitations, and despite a number of attempts to replace it, no device has been found with performance superior to the Hybrid III chest deflection transducer.
Stalnaker et al. [9] used a magnetic pickup over a moving rod that had slots machined in it to measure lateral chest deflection in a Part 572 (Hybrid II) dummy which had been modified for use in lateral impacts.
Several research groups have utilized strain gauges bonded to the ribs to determine chest compression in dummies. Wiechel et al. [5] showed that, in a Hybrid III dummy, the peak strain measured at the point of maximum strain was linearly proportional to the peak chest deflection as measured by the chest deflection transducer. Grosch [lo] and Grosch et al. [ 1 l] used strain gauges to determine rib deflections in a Hybrid II dummy.
While not developed for use in ATDs, Eppinger [ 121 used strain gauges in the development of the EPIDM (External Peripheral Instrument for Deformation
Figure 1. Hybrid III Articulated Arm Chest Deflection Transducer (from [3]).
2018
Measurement), commonly called the “Chest Band”. This device measures contours of the complete periphery of an object as it deforms in time. It consists of a 0.015” thick steel band that is 0.5” wide and 46” long. Strain gauges, forming four active arm bridges, are affixed at precise locations along the band. The larger the number of gauges, the better the resolution of the contour.
An optical transducer was used by Fayon et al. [13] in the development of the APROD dummy thorax and subsequently in the EuroSID dummy [ 141. This method consisted of a reflecting graticule attached to the piston within the chest and a photo-optical sensor that counts each time a graticule mark passes.
Lau et al. [ 151 chose a linear position transducer (LVDT) in a modified EuroSID thorax in the work leading to the development of the BioSID. Subsequently, the SAE Side Impact Task Group chose high tension string potentiometers for measurement of deflection in the BioSID [16]. String potentiometers are made by winding a cable around a spool, which is connected, to a spring that continually exerts tension on the cable to reel it in. The spool is connected to a rotary potentiometer which changes resistance, and hence voltage output, as a function of its rotation.
High-tension string potentiometers have also been considered for frontal impact dummies. The main drawback to a string potentiometer, however, can be observed in very high speed loading situations, such as when the dummy chest is in direct contact with an airbag module. As deployment begins, the string potentiometer cannot follow the rapid chest motion and lags behind. While it may provide an accurate assessment of peak deflection, in this situation the string potentiometer does not give an accurate time-history and is therefore unsuitable for determining the viscous response.
Another optical position sensing system was developed by Ogata et al. [7] for the Hybrid III mid-sized male dummy. This system performs binocular triangulation using two pairs of position sensing detector cameras and two pairs of flashing LEDs.
In the development of the Advanced ATD under contract from the NHTSA, Schneider et al. [I] developed a double-gimballed string potentiometer (DGSP) in a telescoping joystick. A Chest Deflection Task Force of the SAE Human Biomechanics and Simulation Standards Committee working with the UMTRI group first considered a triangulation method using three string potentiometers attached to each point at which deflection measurement was desired. After eliminating that method, the DGSP was chosen by UMTRI. The double-gimballing allowed the DGSP transducers to track up/down and lateral motion using rotary potentiometers attached to the pivots. The string potentiometer down the center of the
telescoping joystick allowed tracking the in/out motion of the anterior chest wall relative to the spine.
As described earlier, the main drawback to the string potentiometer is its lack of response in ultra-high speed loading situations such as those that occur with ATDs out-of-position and in contact with airbags as deployment begins.
Finally, several attempts have been made to determine chest deflection by taking the difference between a twice-integrated output of accelerometers on the sternum and spine of an ATD [8,17]. This method has not met with success principally because of two factors. First, integration techniques introduce constants into the resulting output, which are difficult to remove. Second, motion of the ribcage is not typically constrained to rectilinear motion. The ribs and sternum often bend causing rotation of the accelerometers in addition to any rectilinear motion. This makes interpretation of the data very difficult.
The I/R -TRACC System (InfraRed Telescoping Rod for Assessment of Compression)
The I/R-TRACC system, as proposed, consists of two infrared light emitting diodes (LEDs) “facing” each other from the two ends of a stainless steel, double- gimballed telescoping rod as described below [Figures 2a and 2b]. We arrived at this configuration after a development program that examined a number of different configurations. These configurations consist of various combinations of light emitting diodes and an infrared phototransistor sensor mounted within the telescoping rod. This paper reports data from the four most promising implementations of the I/R-TRACC system. Each configuration has strengths and weaknesses as will be outlined in the paper. While we propose using only the LED-to-LED Mode, under some circumstances one of the other implementations might also be satisfactory as will be discussed. Therefore, with some exceptions only the results from the LED-to-LED Mode system will be presented in the main paper. The results for the other systems will be presented in Appendix III. Those results are useful in understanding the limitations and design philosophy of the device. The exceptions will be for some data from the other implementations which will be presented as exemplars for discussion purposes.
The different implementations of the IR-TRACC system are:
1. Transmission Mode - an infrared LED at the base or larger diameter end of the telescoping rod transmits light to a phototransistor at the smaller diameter end of the rod (Figure 3).
2. Reflection Mode - an infrared LED transmits light through half the fibers in a bifurcated fiberoptic
2019

Figure 2a. IR-TRACC System for a Hybrid III - 6 Year Old Child dummy, fully extended.
Figure 2b. IR-TRACC System for a Hybrid III - 6 Year Old Child dummy, fully compressed.
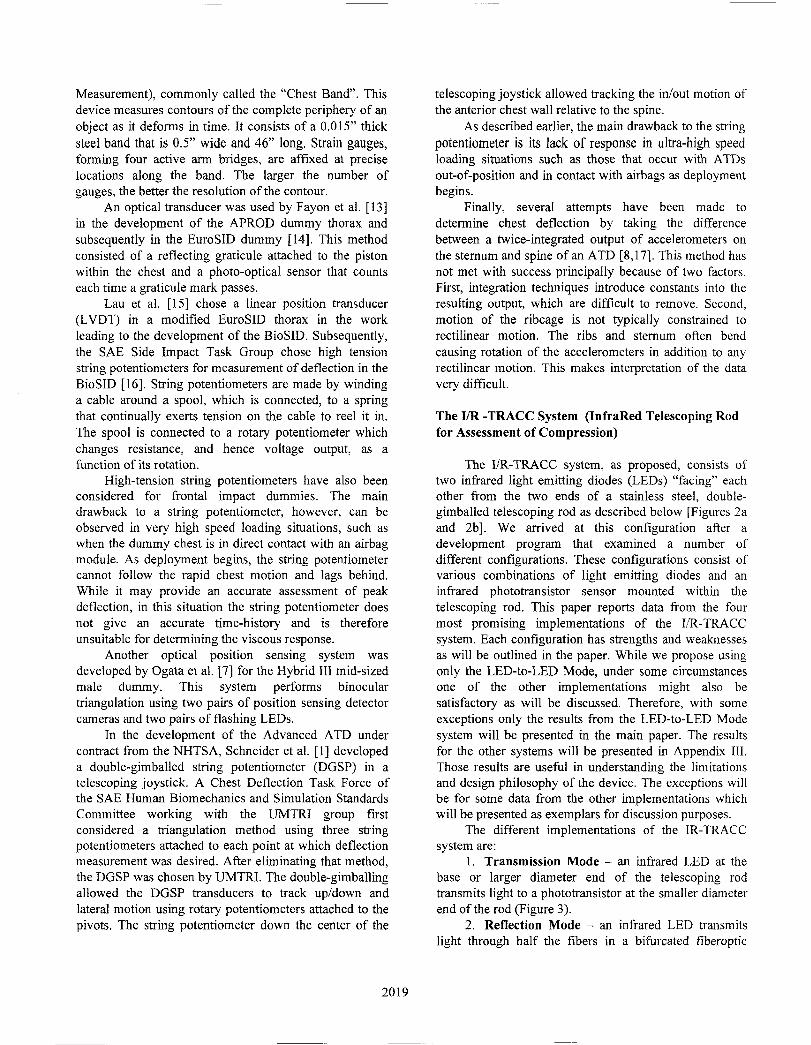
cable at the small end of the rod. Upon exiting the aperture of the fiber optic cable inside the rod, the light travels down the rod and impinges on retro-reflective tape bonded to the base. The light is reflected from the base in a perpendicular direction and travels back to the aperture of the fiberoptic cable. There the light enters the cable and travels via the other half of the fibers to a phototransistor where it is detected. The fiberoptic cable, LED and phototransistor assembly is bonded with epoxy to the inside of the smallest diameter segment of the telescoping rod (Figure 4).
3. Ruggedized Transmission Mode - similar to Transmission Mode, except that the lens of the phototransistor is removed and the case is filled with a clear epoxy to prevent the active element from dislodging during the large accelerations of the impact tests.
4. LED-to-LED Mode - two infrared LEDs are located at opposite ends of the rod. One LED is used as the emitter and the other is used as the receiver of the infrared light.
In I/R-TRACC modes I,2 and 3 only one leg of the phototransistor is actually used so that, in practice, the
phototransistor is used as a photodiode. The output from this photodiode is input to an operational amplifier (Op Amp) which has a gain of about 22 and is part of a circuit to be described later. This amplified output voltage is then monitored as a function of time. The pertinent specifications for the components used in the Transmission, Reflection and LED-to-LED Mode systems are given in Tables 1, 2 and 3, respectively.
Principle of Operation of the Transmission and Reflection Modes
A simple summary of the principle of operation is presented here, with a more thorough discussion in Appendix I. Figure 5 illustrates schematically how the system operates. The principle of operation of the system is photo-optical. The LED emits light in the infrared region of the spectrum which exits through a plastic lens that is part of the housing. The rays of light from the LED diverge in a conical pattern with a beam divergence angle of f 10” as they leave the source. The irradiance of the light as shown in the manufacturer’s product data sheet obeys an inverse square law [ 181. That is, the irradiance at a plane through which the beam passes is proportional to the inverse of the square of the distance from that plane to the LED. Therefore, as the LED is moved closer to the photodiode the h-radiance increases as in Equation 1.
Figure 3. Transmission Mode system with telescoping rod collapsed and opened up to show the internal sensor and LED.
2020
Figure 4. Reflection Mode system with telescoping rod collapsed and opened up to show the aperture of the bifurcated fiber optic cable and the retro- reflective tape. The inset shows the bifurcation of the fiber optic cable. The LED is connected to one of the apertures on the right and the phototransistor sensor is connected to the other aperture.
where, E, = irradiance (W/m”) and d = the distance between the LED and
phototransistor. As shown in the appendix, the output voltage
measured after the signal is amplified is given by:
Since the irradiance is proportional to the inverse square of the distance between the LED and phototransistor, then, the voltage is also proportional to the inverse of the distance squared.
v l out K 2 d
Thus, the distance between the phototransistor and LED is obtained by taking the inverse square root of the phototransistor output voltage as shown in Equation 4.
For comparison, it is helpful to note that the output voltage that the circuit measures in Transmission and Reflection Modes is a function of the current across the photodiode section of the phototransistor. This photocurrent is governed by the amount of light reaching the phototransistor.
Table 1. Transmission & Ruggedized Transmission Mode Components
LED II Phototransistor
Table 2. Reflection Mode Components
LED Phototransistor Manufacturer Honeywell Model HFE-4000-0 14 Wavelength 850 IL 50 nm Beam Angle Collimated Fiber Coupled Power 25 pw
2021

Figure 5. Schematic of Transmission (left) and Figure 6. IR-TRACC printed circuit board for Reflection (right) Modes of operation. Transmission and Reflection Modes.
Linearization of Output from the Transmission and Reflection Mode IR-TRACC Systems
The theoretical discussion in Appendix I serves as the basis for making the output of the photodiode section of the phototransistor a linear function of the distance between the phototransistor and IR LED. This “linearization” of the output, requires either post- processing sofhvare or a hardware circuit. The Transmission and Reflection Mode I/R-TRACC systems send the output through two circuit stages which invert the output and take its square root to convert the voltage to a linear function of the distance between the LED and photodiode. Figure 6 shows the circuit board developed for this linearizing circuit. The 2 inch by 3 inch PC board houses all of the components necessary to make the output voltage a linear function of the deflection. Since the board is small and is rugged (it contains only solid state components) it should be suitable for mounting inside the dummy.
Principle of Operation of the LED-to-LED Mode
Again, a simple summary of the principle of operation is presented here, with a more thorough discussion in Appendix II. Due to the photoelectric effect, any semiconductor material will generate a photocurrent on absorption of incident radiation [19]. In an LED, a semiconductor element is used to generate light and therefore, can also absorb light (in principle acting like a photodiode). As shown in Appendix II, the photocurrent in a photodiode is proportional to the
exponential of the voltage across the diode [20]. Then, it follows, that the voltage across the diode is proportional to the natural log of the photocurrent. The photocurrent is also proportional to the irradiance of the light impinging upon it. Then, the voltage across the photodiode is also proportional to the natural log of the irradiance as shown in Equation 5.
But, the irradiance is proportional to the inverse distance squared between the two LEDs. So, the voltage across the photodiode is proportional to the natural log of the inverse square of the distance between the LEDs as in Equation 6.
(6.1
Then, the output voltage across the sensor LED should be proportional to the natural log of the reciprocal
Table 3. LED-to-LED Mode Components
LED
2022
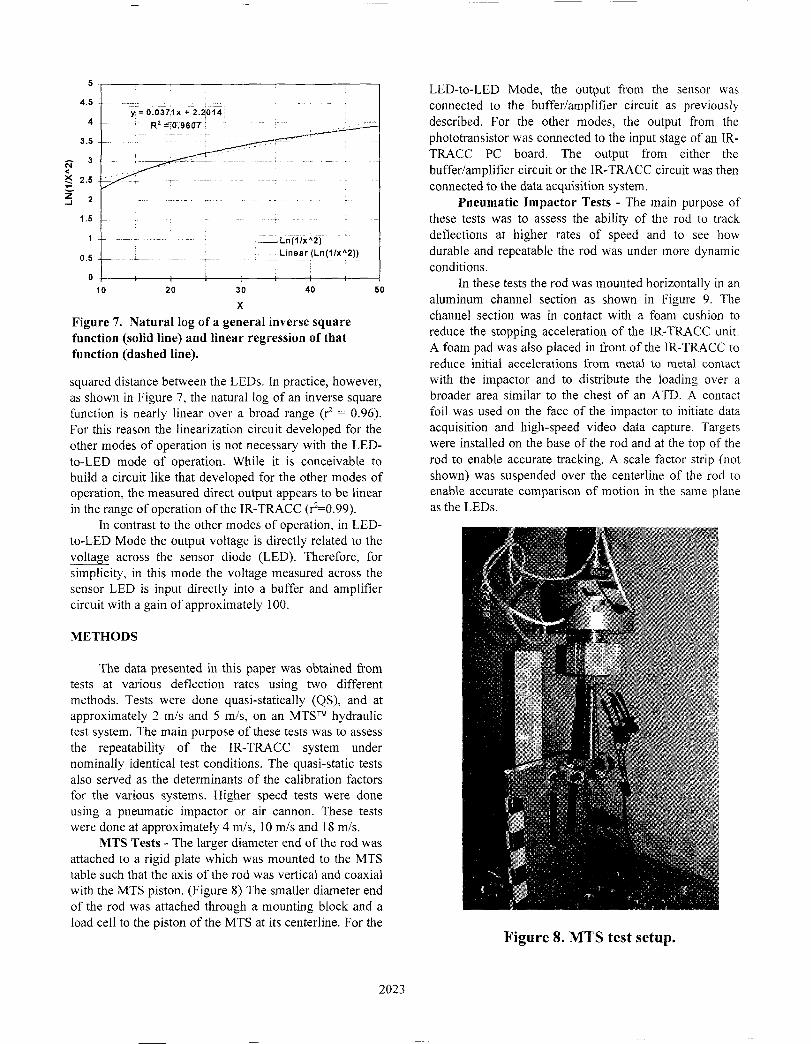
OJ J IO 20 30 40 50
X
Figure 7. Natural log of a general inverse square function (solid line) and linear regression of that function (dashed line).
squared distance between the LEDs. In practice, however, as shown in Figure 7, the natural log of an inverse square function is nearly linear over a broad range (r* = 0.96). For this reason the linearization circuit developed for the other modes of operation is not necessary with the LED- to-LED mode of operation. While it is conceivable to build a circuit like that developed for the other modes of operation, the measured direct output appears to be linear in the range of operation of the IR-TRACC (r*=0.99).
In contrast to the other modes of operation. in LED- to-LED Mode the output voltage is directly related to the voltage across the sensor diode (LED). Therefore, for simplicity, in this mode the voltage measured across the sensor LED is input directly into a buffer and amplifier circuit with a gain of approximately 100.
METHODS
The data presented in this paper was obtained from tests at various deflection rates using two different methods. Tests were done quasi-statically (QS), and at approximately 2 m/s and 5 m/s, on an MTSTM hydraulic test system. The main purpose of these tests was to assess the repeatability of the IR-TRACC system under nominally identical test conditions. The quasi-static tests also served as the determinants of the calibration factors for the various systems. Higher speed tests were done using a pneumatic impactor or air cannon. These tests were done at approximately 4 m/s, 10 m/s and 18 m/s.
MTS Tests - The larger diameter end of the rod was attached to a rigid plate which was mounted to the MTS table such that the axis of the rod was vertical and coaxial with the MTS piston. (Figure 8) The smaller diameter end of the rod was attached through a mounting block and a load cell to the piston of the MTS at its centerline. For the
LED-to-LED Mode, the output from the sensor was connected to the buffer/amplifier circuit as previously described. For the other modes, the output from the phototransistor was connected to the input stage of an IR- TRACC PC board. The output from either the buffer/amplifier circuit or the IR-TRACC circuit was then connected to the data acquisition system.
Pneumatic Jmpactor Tests - The main purpose of these tests was to assess the ability of the rod to track deflections at higher rates of speed and to see how durable and repeatable the rod was under more dynamic conditions.
In these tests the rod was mounted horizontally in an aluminum channel section as shown in Figure 9. The channel section was in contact with a foam cushion to reduce the stopping acceleration of the IR-TRACC unit. A foam pad was also placed in front of the IR-TRACC to reduce initial accelerations from metal to metal contact with the impactor and to distribute the loading over a broader area similar to the chest of an ATD. A contact foil was used on the face of the impactor to initiate data acquisition and high-speed video data capture. Targets were installed on the base of the rod and at the top of the rod to enable accurate tracking. A scale factor strip (not shown) was suspended over the centerline of the rod to enable accurate comparison of motion in the same plane as the LEDs.
Figure 8. MTS test setup.
2023

Figure 9. Pneumatic impactor test setup.
General Conditions
The Transmission, Ruggedized Transmission and Reflection Mode quasi-static deflection data were sampled at 500 samples/second. The 2.7 m/s and 5.5 m/s deflection data were sampled at 10000 samples/second, then anti-alias filtered at 2 kHz and digitally filtered using an SAE Channel Class 600 filter. All data for LED-to- LED Mode were sampled at 10000 samples/second and digitally filtered using an SAE Channel Class 600 filter.
Measurement Standards
- Deflection of the IR-TRACC in the MTS tests was compared to the displacement given by the standard MTS controller LVDT. The IR-TRACC sensor was calibrated to obtain a known voltage-displacement relationship immediately prior to each test. The data was scaled using that calibration factor.
- Deflection of the IR-TRACC in the air cannon tests was compared to motion data obtained from high- speed video taken at 9000 frames/second using a Kodak EktaproTM HS Model 4540 with a 28-105 mm macro zoom lens and tracked by a Kodak Image ExpressTM system.
RESULTS
When this project began, the focus was on developing a rod for use with the mid-sized male Hybrid III. During the course of the work it became apparent that the need was even more acute for the smaller members of the Hybrid III family and so the focus of the project was shifted to the 6 year old Hybrid III. The data presented in this paper is for a rod with an overall length of 100 mm
(3.94 inches), a size that is appropriate for use in the 6 year old. The maximum distance that this rod can collapse is 57.7 mm (2.27 inches), but the maximum calibrated displacement for this rod is approximately 42 mm (1.65 inches).
We experimented with rods of different lengths and under certain circumstances were able to make this system work for rods up to 200 mm (8 inches) in iength with displacements of up to 150 mm (6 inches).
As shown in Table 4, for LED-to-LED mode of the IR-TRACC system, five tests were performed at each speed on the MTS. On the pneumatic impactor, we ran five tests at 4 m/s, and inadvertently ran six tests at 10 m/s and four tests at 18 m/s.
As will be explained below, the LED-to-LED Mode is the recommended system for the IR-TRACC. Therefore, all graphs for Transmission, Reflection and Ruggedized Transmission Mode tests are given in Appendix III. Only representative tests will be shown in the main text to illustrate the technical issues the tests uncovered.
Device & Speed
MTS
Table 4. Test Matrix
Tram Rug Tran Refl LED/LED / Mode Mode Mode , Mode I
I I I
I / 1
QS / 4 I 3 j 5 / 5 / 2.5 m/s / 4 3 I 5 I 5 i 5.5 m/s / 4 3 5 5
I
MTS Test Results
Deflection-time histories from all LED-to-LED Mode MTS tests are shown in Figure 10. Deflections measured using the IR-TRACC sensor are overlaid on the displacements measured by the MTS LVDT. This figure provides a qualitative look at the accuracy of the IR- TRACC system. The generally good agreement of the deflection-time histories is obvious.
To obtain a quantitative view of the accuracy of the IR-TRACC system, the maximum difference and the standard deviation of the IR-TRACC deflection data with respect to the LVDT data was calculated for each MTS test, With the LVDT displacement data as the comparison the maximum differences were 1.80 mm, 2.3 1 mm, and 3.35 mm for the quasistatic, 2 m/s and 4 m/s tests, respectively. The standard deviations ranged from + 0.6 to ri: 0.9 mm.
2024

To determine scale factors and to obtain a quantitative view of the linearity of the IR-TRACC system, the IR-TRACC output voltage was cross-plotted against the MTS displacements for each test at each speed as shown in Figure Il. A linear regression was fit through the cross-plot with the equation and correlation coefficient (r2 value) shown on each graph. For clarity, the actual trend line is only shown on one graph. This figure shows the excellent linearity between the IR- TRACC system and the MTS. Note that all r2 values exceed 0.99.
Quasi-static
Dynamic Pneumatic Impactor Test Results
In Figures 12a, 12b and 12c the time-history of each LED-to-LED Mode IR-TRACC deflection is overlaid onto the corresponding high-speed video tracked displacement for each pneumatic impactor test, at each speed. This figure provides a qualitative look at the accuracy of the IR-TRACC system at high-speed.
It was difficult to synchronize the video and IR- TRACC data because of the different data sampling rates for the two devices and because of different triggering schemes for the video and our data acquisition system. Therefore, the time scales were shifted manually to match
2117/s
0 30 60 90 120 150
Time (ms)
5rnk
Figure 10. Deflection-time histories for LED-to-LED Mode IR-TRACC sensor (solid line) overlaid on deflections from LVDT on MTS (dashed line).
2025

the initial rise from the baseline. A more quantitative view of the system was
obtained by calculating the difference between the peak deflection measured by the IR-TRACC and that calculated from the video data for each test. The average maximum difference between the IR-TRACC and the video data was 0.59 mm, 1.57 mm and 1.06 mm for the 4 m/s, 10 m/s and 20 m/s tests, respectively. It is important to note that these numbers simply reflect the difference between the measurements taken from the video and those of the IR-TRACC system. They do not represent the error because the video is not an absolute standard. In fact, they may be more representative of the error inherent in 2-D video tracking and not the error in the IR- TRACC system. The origins of these differences in the
Quasi-static
data will be discussed later.
Differentiation
One of the primary reasons that a new method of chest deflection has been sought is so that the deflection- time histories could be differentiated to obtain velocity- time and the viscous response as a function of time. Therefore, each IR-TRACC deflection time-history was filtered at SAE channel class 600 and then digitally differentiated. The velocity-time histories for each of the MTS tests with the LED-to-LED Mode sensor are shown in Figure 13. These curves show that the differentiated data appears to be well behaved enough for typical automotive use.
2mk
0 lo 20 30 40 50
Displacement (mm)
5t-h
Figure 11. Cross-plots of the amplified IR-TRACC output voltage and MTS displacement from the LVDT to obtain scale factor for the sensor in LED-to-LED Mode tests.
2026

The time scales on one representative graph from Figures 12a and 12b and all of the graphs from Figure 12c (the 18 m/s tests) have been expanded in Figures 14, 15 and 16a-d, respectively. This expansion was done to allow a closer examination and comparison of the deflections, velocities and viscous responses.
calculation of (V*C)max would yield zero, but Vmax*Cmax (a form of the viscous response which is calculated using the peaks instead of the time-varying functions) would be misleading. We believe that these spikes were most likely caused by contact slap. The wires connecting the LEDs to the instrumentation were spring clamped and taped together, not soldered. As a result the rapid cable deceleration on contact with the MTS worktable could have caused the spikes. Obviously, in the final design for in-dummy use, all cables and attachments will be ruggedized.
As a more quantitative look at the viscous response data, we compared the peak viscous response calculated from the IR-TRACC data with that calculated from the video data. The average percent difference between the IR-TRACC and the video data was 10.4%, 14.2% and 12.5% for the 4 m/s, 10 m/s and 20 m/s tests, respectively. As mentioned previously, it is important to note that these numbers only reflect the difference between the measurements taken from the video and those of the IR-TRACC system. They do not represent percent error because the video is not an absolute standard. Again, they may be more representative of the error inherent in 2-D video tracking and not the error in the IR-TRACC system. The origins of these differences in the data will be discussed later.
All of the signals are clearly differentiable. The large velocity swings have mechanical reasons, which will be discussed below. The agreement between the IR- TRACC and the high-speed video appears to be acceptable even up to 20 m/s.
V*C Calculation
As a further check on the data, the viscous response (V*C) was calculated for the IR-TRACC data. Representative curves are shown in Figure 17 for MTS tests at the three different speeds. The data is clearly well behaved. We also calculated the viscous response for the pneumatic impactor tests as shown in Figure 14, 15 and 16.
The reader will note that there was some very small jitter (less than 2% of the peak deflection) after the impact on two MTS tests (see Figures 10 and 13, runs 7 and 10). When differentiated this small jitter was amplified so that the resulting apparent velocity was greater than the MTS velocity. This highlights the need for a clean signal for V*C calculations. Obviously in this case, since there is no deflection occurring at the time of that spike, the
PNI I-4 PNI2-4 PNI 3-4 PNI4-4 PNI5-4
0 5 10152025 0 5 10152025
Time (ms)
0 5 10152025 0 5 10152025
Figure 12a. IR-TRACC deflection-time histories from 4 m/s pneumatic impactor tests overlaid on displacement-time histories from high-speed video images tracked at 9000 frames/second.
2027

PNI I-10 PNI 2-10 PNI 4-10 PNI 5-10 PNI 3-10
: : : : : :
: : : :
, : 1 : : : : :
0 5 IO 15
PNI 6-10
- 7
’ :
: : : : : : : :
5 10 15
Time (ms)
Figure 12b. IR-TRACC deflection-time histories from 10 m/s pneumatic impactor tests overlaid on displacement-time histories from high-speed video images tracked at 9000 frames/second.
PNI I-18 PNI 2-l 8 PNI 3-18 PNI 4-18
30 28 26 24 22 20
E 18
s 16 .- c 14 $ z 12
10 8 6 4 2
f - IR-TRACC - - Video
: : : :
: : : :
:
y+$
4 0
Time (ms)
Figure 12~. IR-TRACC deflection-time histories from 18 m/s pneumatic impactor tests overlaid on displacement-time histories from high-speed video images tracked at 9000 frames/second.
2028

LVDT I R-TRACC LVDT I R-TRACC LVDT I R-TRACC
- -101 - -101
- -101
I : 1 -101 I I .101 RU”l4 H - -lOL----J - -101 1 010-
0 10 m m 5 005 : 0 405 a10 q 0 1mm3W04C00 0 xl 60 93 120150 - -101 0 1m2~m4ax) 0 30 60 xl 120150
Figure 13. MTS/LVDT and IR-TRACC velocities from differentiated displacement-time histories for each test at each speed on the MTS. Both displacement-time histories were filtered at SAE Channel Class 600. The first, third and fifth columns are MTWLVDT data. The second, fourth and sixth are IR-TRACC sensor data.
PNI 24
0 5 IO 15 20 25
-5.0 ’ 0 5 10 15 20 25
-0.04 0 5 10 15 20 25
Time (Ins) Figure 14. Expanded displacement-time history for IR-TRACC in approximately 4 m/s pneumatic impactor test overlaid on displacement-time history from high-speed video tracking at 9000 frames/second.
2029

PNI 310
25, I
-5 ’ I 0 10 20 30 40
20 , I
-10 ' I 0 10 20 30 40
0 10 20 30 40
Tim? (ms) Figure 15. Expanded displacement-time history for IR-TRACC in approximately 10 m/s pneumatic impactor test overlaid on displacement-time history from high-speed video tracking at 9000 frames/second.
FNM-18 -
-10 ' 1 0 5 IO 15 20
301 1
-20 ' I 0 5 10 15 20
0.50 , I
-0.50 ' I 0 5 IO 15 20
Time (Ins) Figure 16a. Expanded displacement-time history for IR-TRACC in approximately 18 m/s pneumatic impactor test overlaid on displacement-time history from high-speed video tracking at 9000 frames/second.
2030

PNI2-18
0 5 IO 15 20
-0.4 1 0 5 IO 15 20
Time (IT-S)
Figure 16b. Expanded displacement-time history for IR-TRACC in approximately 18 m/s pneumatic impactor test overlaid on displacement-time history from high-speed video tracking at 9000 frames/second.
PNI3-18
0 5 IO 15 M
0 5 IO 15 20
0 5 IO 15 20
Time (ms)
Figure 16~. Expanded displacement-time history for IR-TRACC in approximately 18 m/s pneumatic impactor test overlaid on displacement-time history from high-speed video tracking at 9000 frames/second.
2031
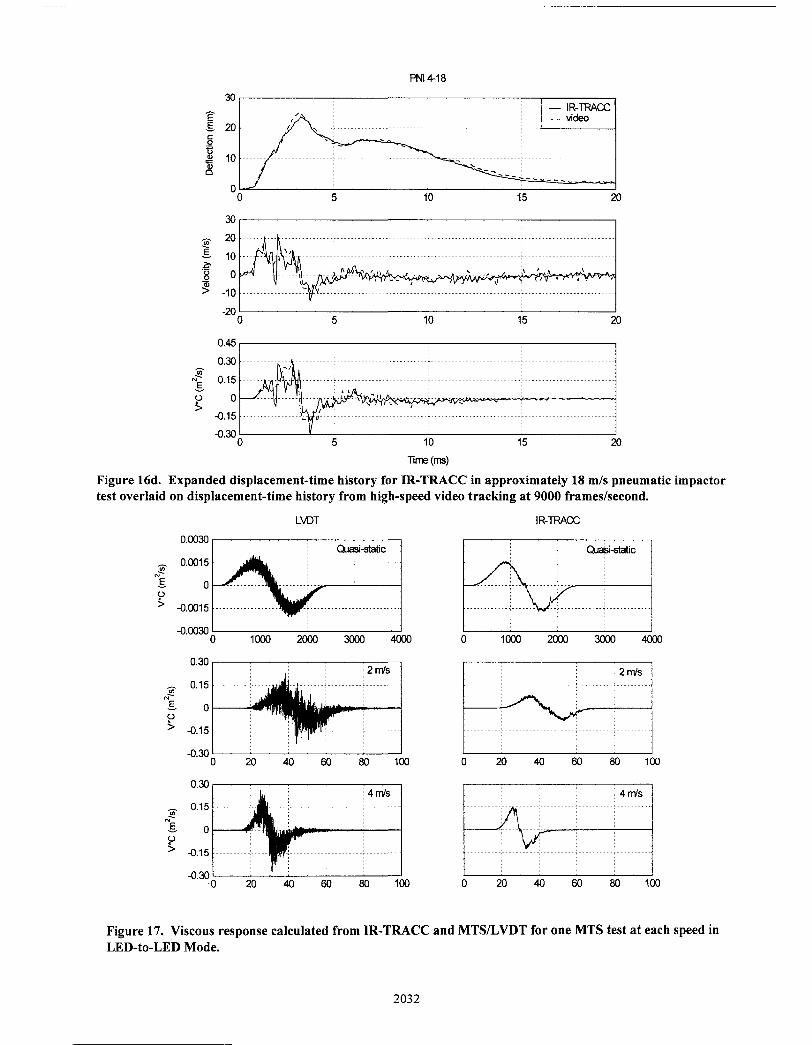
F'N14-18
0.30 ’ Y : I 0 5 IO 15 20
linie (ITS)
Figure 16d. Expanded displacement-time history for IR-TRACC in approximately 18 m/s pneumatic impactor test overlaid on displacement-time history from high-speed video tracking at 9000 frames/second.
LVDT IR-TRACC
Figure 17. Viscous response calculated from IR-TRACC and MTS/LVDT for one MTS test at each speed in LED-to-LED Mode.
2032

DISCUSSION
A major advantage of this system over those previously attempted is its ability to track motion under very rigorous conditions (pneumatic impactor at speeds in excess of 18 m/s). In addition, its output is linear with displacement allowing for easy calibration. And, the output can be coupled with the output from the gimballed rotary potentiometers to give a complete 3-dimensional motion description for the point on the chest to which it is attached. Nevertheless, testing of these prototype parts led to observation of some issues which must be addressed by whatever company decides to manufacture the IR- TRACC system. Some of the strengths and weaknesses of the system are discussed below.
Linearity of the System
The linearity of the LED-to-LED Mode IR-TRACC system is shown for a typical test in Figure 11. The indicated versus actual displacement for the current articulated arm chest deflection transducer in the Hybrid III dummy is shown in Figure 18 (data scaled from [3]). The IR-TRACC is clearly as good as the current chest potentiometer in linearity. The error associated with the articulated arm chest deflection transducer was stated as a 1.53% “mechanical error”.
There is a physical limitation of all IR-TRACC systems at small separations. The inverse square law begins to break down when the sensor and LED move too close together. The reason for this change is that as the source LED approaches the sensor LED or phototransistor, the source LED no longer resembles a point source. That is, the LED emission semiconductor has a finite area that becomes more and more apparent to the sensor as their separation distance decreases. The point source then becomes a distributed source with a divergence that is not as well-characterized using the inverse square law.
To reduce the chance for errors due to non-linearity, several design factors should be considered. First, the LEDs can be recessed to the extent possible to prevent them from ever getting too close. Second, the length of the rod for a given dummy should exceed the distance for which a deflection measurement is desired. This may be a packaging challenge for the child dummies, but for the larger dummies such as the small female through large male, it should not be an issue.
Sensitivity
While under normal conditions sensitivity in a test instrument is good, results from an instrument which is
! Articulated Arm Deflection Transducer
I i 3 / 2.5
0 0.5 1 1.5 2 2.5 3
Actual (inches)
Figure 18. Hybrid III articulated arm calibration curve
more sensitive than its predecessors can cause some confusion until the users gain experience with it. This is evidenced in the IR-TRACC system as seen in Figures 16a-d. In the early phase of loading under the pneumatic impacts, there appears to be a small unloading of the sensor such that the displacement actually decreases by around 1 mm before increasing again. This motion was especially clear in the velocity-time history (middle graphs). It is only slightly apparent in the video data as a change in slope.
Given the unexpected result, we attempted to understand whether that rearward motion was real. To do this we reviewed the high-speed video motion at the time of the supposed rearward motion of the sensor. We concluded that the motion was real for one of two reasons, and possibly for both reasons.
The first hypothesis is that the nature of the loading caused the rearward motion. As shown in Figure 9, the pneumatic impactor did not strike the loading plate at its center of mass. As a result, what we observed in the high- speed video was that the top of the loading plate tilted away from the impactor before the entire plate started to move. Then, when the top of the loading plate struck the channel piece to which the base of the sensor was attached, some rearward rotation relative to the bottom of the plate appears to have begun. This contact occurred at exactly the time of the rearward motion in the displacement-time curves. Then, the realigning of the loading plate appears to have allowed rearward motion of the sensor.
The second hypothesis is that the small amount of play in the linkage of the rod noted earlier might have allowed for a vibration upon impact of the loading plate which could have been on the same order of magnitude as that observed.
The video system did not track this motion as precisely as the IR-TRACC for two main reasons which we believe were cumulative. First, the video data was
2033

sampled less frequently (9,000 frames/second vs. 10,000 samples/second for IR-TRACC). Second, the Image Express analysis resolution in our setup was approximately 0.25 mm.
Therefore, we believe that what the IR-TRACC recorded was a real mechanical event (not electrical noise).
If that is the case it highlights a difficulty with calculating the viscous response with a more accurate instrument than before. While we don’t expect this type of motion in a dummy chest, this system will track motion that previously may have been unnoticed. Yet, the velocity associated with such small displacement changes is probably not important for assessment of injury risk unless the velocity approaches the blast regime. Therefore, at a minimum, the viscous response determined in crash tests with this instrument should be examined in the context of the displacement-time history recorded. If there are large velocities caused by small displacement changes, the viscous response information should be examined carefully.
Durability of Rods
All of the Transmission, Ruggedized and LED-to- LED Mode tests described in this paper were run with a single telescoping rod (Reflection Mode tests were performed with a different rod). This single rod was subjected to more than 150 tests including MTS, calibration pendulum and pneumatic impactor. For each series of tests using a new configuration, the photoelectric components of the rod were removed and replaced with the new sensors within the same mechanical system. Even with the gimballing on both ends of the rod, the higher speed MTS tests and the pneumatic impactor tests were especially severe. The 20 m/s pneumatic impactor tests were more severe than any tests ever expected in a dummy chest.
Given this environment, it is not surprising that two durability issues surfaced during the testing. The fist issue was the durability of the gimbals used at the small end of the rod. The initial design used a welded ball configuration (Figure 19) which gave excellent range of motion to this joint at lower speeds. However, it could not withstand the harsh acceleration environment of the pneumatic impactor. After several tests on the pneumatic impactor the welds broke and the connection failed. This gimbal was modified to a ball joint which proved to be very durable for the remainder of the tests (Figure 20).
A second durability issue was with the rod itself. The rod performed flawlessly for more than 120 tests. After those, during one MTS test series, the linkages at the end of the rod were locked to reduce mechanical play. We noted that the rod started to bind after these tests,
Figure 19. Welded ball gimbal1 used in Transmission Mode tests.
Figure 20. Ball joint gimbal1 used in LED-to-LED Mode tests.
probably because we had reduced the degrees of freedom of the rod during the MTS stroke which may have caused the rod to bend under the large forces of the MTS piston. Despite the binding of the rod, we were able to conduct an additional 30 tests on the MTS in the LED-to-LED Mode.
The ball joint linkage at the smaller end of the rod had a small amount of axial play in it when loaded. Because of this play in the rod, during the last 30 LED-to- LED tests when the rod would bind, the linkage would be loaded more heavily and would “give” slightly. The combination of these two factors (binding and “give”) led to small differences (I 1 mm) between the maximum deflections recorded by the IR-TRACC system when compared to the MTS and high-speed video (see 5 m/s
2034
tests in Figure 10). These differences were more apparent at the higher test speeds. In a production system, more precise machining should eliminate the free axial play in the rod linkage. In addition, since this test environment was more rigorous than any expected in the dummy chest, the binding of the rod should not be an issue.
While the mechanical rod components did have some durability issues, the solid state LEDs proved to be quite rugged. In fact, in all of the bench testing, both on the MTS and with the pneumatic impactor, the LEDs never failed, even under severe impacts that caused the steel rod to fail. The reason for this can be seen in the construction of the LEDs. In a typical LED the photodiode is covered by a firm silicone gel and then completely encapsulated in a rigid plastic molding that also serves as a lens. The plastic also encapsulates the small wires inside the LED which prevents them from breaking or being exposed to any differential motion during large accelerations.
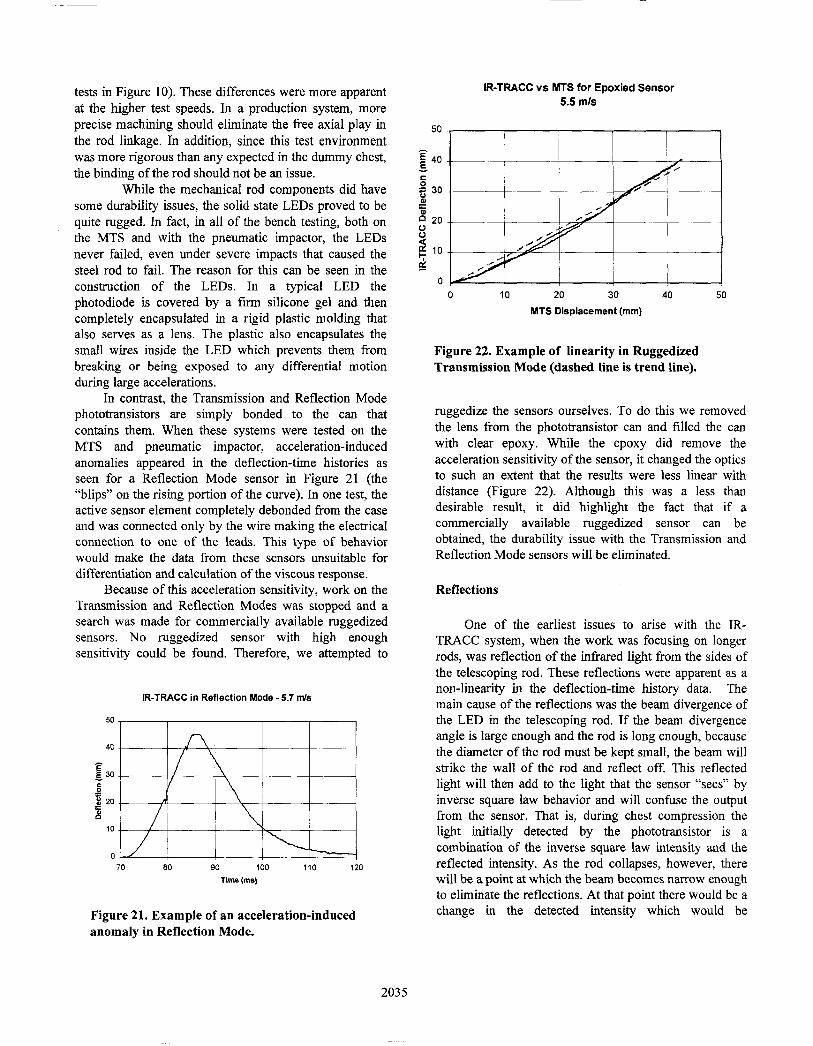
In contrast, the Transmission and Reflection Mode phototransistors are simply bonded to the can that contains them. When these systems were tested on the MTS and pneumatic impactor, acceleration-induced anomalies appeared in the deflection-time histories as seen for a Reflection Mode sensor in Figure 21 (the “blips” on the rising portion of the curve). In one test, the active sensor element completely debonded from the case and was connected only by the wire making the electrical connection to one of the leads. This type of behavior would make the data from these sensors unsuitable for differentiation and calculation of the viscous response.
Because of this acceleration sensitivity, work on the Transmission and Reflection Modes was stopped and a search was made for commercially available ruggedized sensors. No ruggedized sensor with high enough sensitivity could be found. Therefore, we attempted to
IR-TRACC in Reflection Mode - 5.7 mk
50 I I I I 1
40
P g 30
! 20
E 10
70 80 90 100 110 120 Time (ms)
Figure 21. Example of an acceleration-induced anomaly in Reflection Mode.
IR-TRACC vs MTS for Epoxied Sensor 5.5 m/s
20 30 MTS Displacement (mm)
Figure 22. Example of linearity in Ruggedized Transmission Mode (dashed line is trend line).
ruggedize the sensors ourselves. To do this we removed the lens from the phototransistor can and filled the can with clear epoxy. While the epoxy did remove the acceleration sensitivity of the sensor, it changed the optics to such an extent that the results were less linear with distance (Figure 22). Although this was a less than desirable result, it did highlight the fact that if a commercially available ruggedized sensor can be obtained, the durability issue with the Transmission and Reflection Mode sensors will be eliminated.
Reflections
One of the earliest issues to arise with the IR- TRACC system, when the work was focusing on longer rods, was reflection of the infrared light from the sides of the telescoping rod. These reflections were apparent as a non-linearity in the deflection-time history data. The main cause of the reflections was the beam divergence of the LED in the telescoping rod. If the beam divergence angle is large enough and the rod is long enough, because the diameter of the rod must be kept small, the beam will strike the wall of the rod and reflect off. This reflected light will then add to the light that the sensor “sees” by inverse square law behavior and will confuse the output from the sensor. That is, during chest compression the light initially detected by the phototransistor is a combination of the inverse square law intensity and the reflected intensity. As the rod collapses, however, there will be a point at which the beam becomes narrow enough to eliminate the reflections. At that point there would be a change in the detected intensity which would be
2035

evidenced as an anomaly in the time-history data. For a short enough rod, there should be no reflections.
In Transmission Mode, the reflection problem was greatly reduced by interchanging the locations of the LED and phototransistor. The reason this worked is believed to be because when the LED is at the wider end of the rod, the light travels toward a diameter which decreases as discrete step functions as it passes through the different segments of the rod. The reflected light is most likely at too large an angle to be reflected into the continually narrowing segments of the rod and the light that strikes the ends of the segments is reflected back away from the sensor.
This information about intra-rod reflections highlights one of the design criteria for the IR-TRACC system. The LED beam divergence angle with respect to the length of the rod should be optimized to the size of the sensor. The sensor may not work as well if the beam is too narrow or too wide.
The reflection problem was also nearly eliminated using the Reflection Mode. The main reason is probably due to the collimating effect of the custom-designed fiber optic cable. This effect tends to reduce the beam divergence at the aperture of the cable relative to the divergence at the LED. Then, the light that exits towards the retro-reflective tape is more focused than without the
fiber optic cable. There was no sign of reflection-induced anomalies
in the data for the LED-to-LED Mode IR-TRACC system.
Effect of Lateral Play in the Rod (“Wiggle”)
Another issue, which was apparent in the early designs of the IR-TRACC, is what has been called lateral play or “wiggle”. Wiggle is a phenomenon that occurs when the rod is moved side-to-side rather than in a telescoping fashion. That is, if one were to hold onto the base of the rod and the tip of the rod and move them laterally in opposite directions, ideally there should be no output from the sensor. In the Transmission Mode sensor design, however, there was some output due to wiggle. The wiggle was greatly reduced in the Reflection and in the LED-to-LED Modes relative to the Transmission Mode. Figure 23 shows the deflection output caused solely by lateral motion of the 6 year old size rod without any telescoping for the Transmission, Reflection and LED-to-LED Modes, respectively. As seen in the figure, the maximum error introduced by wiggle is approximately fl .O mm in Transmission Mode, kO.2 mm in Reflection Mode, and +0.3 mm in LED-to-LED Mode.
The causes of the wiggle problem appear to be: first,
Figure 23. “Wiggle” test of IR-TRACC telescoping rod for: Transmission Mode (top graph), Reflection Mode (middle graph) and LED-to-LED Mode (bottom graph). Note that for the LED-to- LED Mode, the magnitude of the sensitivity to “wiggle” is less than approximately f 0.3 mm.
2036

the need for clearance between the sections of the telescoping rod in order to facilitate motion; and second, the lack of uniformity in the beam intensity in some LEDs. The clearance between segments of the rod is a necessity. The original design, however, used more small segments and fewer large segments. The resulting overlap between segments was very small and the rod was very susceptible to wiggling. The current LEDs being utilized appear to have sufficient intensity uniformity to reduce the concern over wiggle-induced output.
sled lights one meter away with 4 kW of lights turned on. The results of these tests are shown in Figure 24. Two conclusions were drawn from these experiments. First, when the lights are off (no added heat) the IR-TRACC is very stable. Second, when the rod is exposed to the lights, the sensitivity changes, but the sensitivity remains a linear function of distance as can be seen by the virtually identical slopes, but increasingly negative y-intercepts.
Thermal Changes in LEDs
Light Emitting Diodes are known to be sensitive to thermal changes. We attempted to see if this would affect the LED-to-LED Mode of the IR-TRACC by running two sets of experiments. In the first experiments, we ran three tests sequentially in which the ambient temperature was held constant and we recorded the output of the IR- TRACC system. Then we repeated the tests with a rack of
The second set of experiments was done to assess the effectiveness of the dummy chest skin in thermally shielding the IR-TRACC system. This was done by again exposing the rod to 4 kW of sled lights at a distance of one meter. Again we ran a test of no heat added to examine baseline stability, which again was excellent (Figure 25, top graph). Then with no chest skin on the dummy, the lights were turned on for 40 seconds and temperature and output monitored. As seen in the middle graph of Figure 25, the IR-TRACC output did increase with temperature, but in a linear fashion and with a slope of approximately 0.06 mm/second.
Not-kat-Run1 HeatAdded-Run 1
Deflection (mm)
Figure 24. Cross-plots of output voltage from IR-TRACC in LED-to-LED Mode during quasi-static tests on the MTS with application of heating by 4 kW of sled lights (right column of graphs) and without any heat added (left column of graphs). Tests were done sequentially, 3 with no heat first, followed by 3 with heat. Note that the y- intercept changes with the addition of heat, but the slope of the line (i.e., the sensitivity of the transducer) does not.
2037
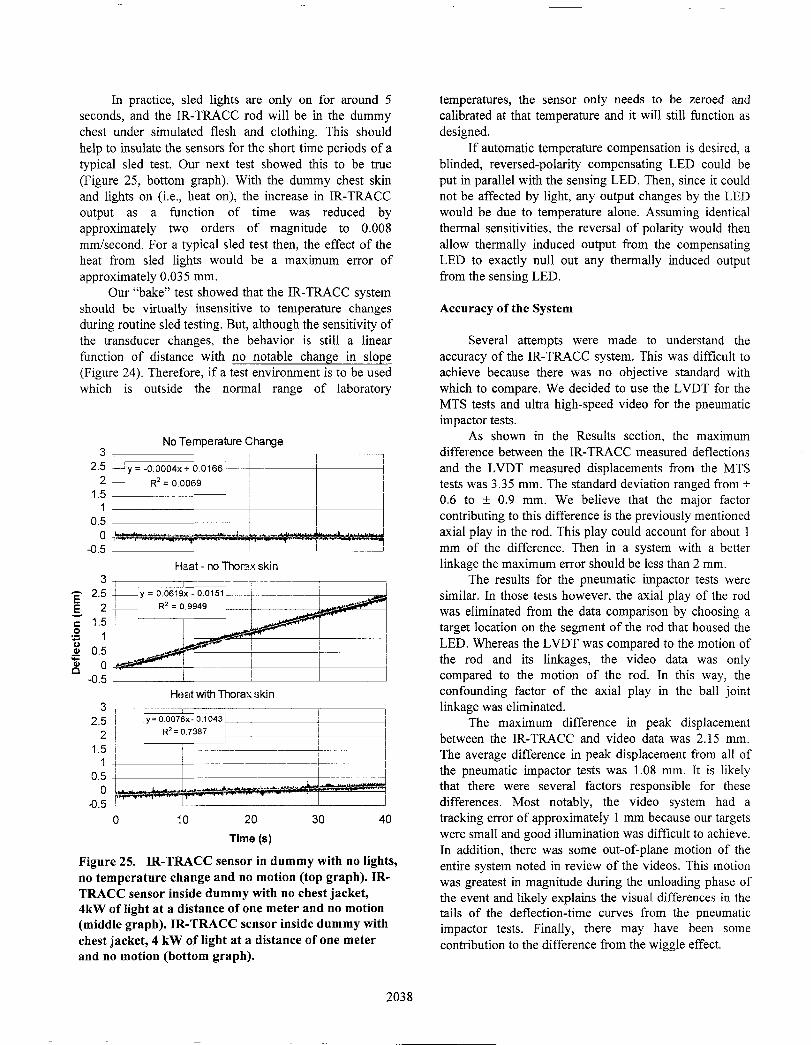
In practice, sled lights are only on for around 5 seconds, and the IR-TRACC rod will be in the dummy chest under simulated flesh and clothing. This should help to insulate the sensors for the short time periods of a typical sled test. Our next test showed this to be true (Figure 25, bottom graph). With the dummy chest skin and lights on (i.e., heat on), the increase in IR-TRACC output as a function of time was reduced by approximately two orders of magnitude to 0.008 mm/second. For a typical sled test then, the effect of the heat from sled lights would be a maximum error of approximately 0.035 mm.
Our “bake” test showed that the IR-TRACC system should be virtually insensitive to temperature changes during routine sled testing. But, although the sensitivity of the transducer changes, the behavior is still a linear function of distance with no notable change in slope (Figure 24). Therefore, if a test environment is to be used which is outside the normal range of laboratory
3 No Temperature Change
2.5 ~y=-o.ooo4x+o.0166~ 2L
1.5 R'=0.0069 i /
/
1 I
0.5 4 ,
O 1-w .-%-&%4d,,...L.*-*,
-0.5 1 tizat - no Thaw. skin
3 g 2.5
g 2
5 1.5
‘Z 1 g 0.5 0, 0 n -0.5
Ht?at with Thorax skin
I
0 10 20 30 40
Time (s)
Figure 25. IR-TRACC sensor in dummy with no lights, no temperature change and no motion (top graph). IR- TRACC sensor inside dummy with no chest jacket, 4kW of light at a distance of one meter and no motion (middle graph). IR-TRACC sensor inside dummy with chest jacket, 4 kW of light at a distance of one meter and no motion (bottom graph).
2038
temperatures, the sensor only needs to be zeroed and calibrated at that temperature and it will still function as designed.
If automatic temperature compensation is desired, a blinded, reversed-polarity compensating LED could be put in parallel with the sensing LED. Then, since it could not be affected by light, any output changes by the LED would be due to temperature alone. Assuming identical thermal sensitivities, the reversal of polarity would then allow thermally induced output from the compensating LED to exactly null out any thermally induced output from the sensing LED.
Accuracy of the System
Several attempts were made to understand the accuracy of the IR-TRACC system. This was difficult to achieve because there was no objective standard with which to compare. We decided to use the LVDT for the MTS tests and ultra high-speed video for the pneumatic impactor tests.
As shown in the Results section, the maximum difference between the IR-TRACC measured deflections and the LVDT measured displacements from the MTS tests was 3.35 mm. The standard deviation ranged from f 0.6 to & 0.9 mm. We believe that the major factor contributing to this difference is the previously mentioned axial play in the rod. This play could account for about 1 mm of the difference. Then in a system with a better linkage the maximum error should be less than 2 mm.
The results for the pneumatic impactor tests were similar. In those tests however, the axial play of the rod was eliminated from the data comparison by choosing a target location on the segment of the rod that housed the LED. Whereas the LVDT was compared to the motion of the rod and its linkages, the video data was only compared to the motion of the rod. In this way, the confounding factor of the axial play in the ball joint linkage was eliminated.
The maximum difference in peak displacement between the IR-TRACC and video data was 2.15 mm. The average difference in peak displacement from all of the pneumatic impactor tests was 1.08 mm. It is likely that there were several factors responsible for these differences. Most notably, the video system had a tracking error of approximately 1 mm because our targets were small and good illumination was difficult to achieve. In addition, there was some out-of-plane motion of the entire system noted in review of the videos. This motion was greatest in magnitude during the unloading phase of the event and likely explains the visual differences in the tails of the deflection-time curves from the pneumatic impactor tests. Finally, there may have been some contribution to the difference from the wiggle effect.

In summary, the maximum error attributable to the IR-TRACC device itself appears to be on the order of 1-2 mm. With a maximum chest deflection in a Hybrid III six year old dummy of approximately 42 mm, this represents a maximum error of between 2.4 % to 4.8%
Dummy Modifications to Accommodate the IR- TRACC System
Figure 26 shows the modifications made to the spine of a Hybrid III six-year old child dummy by First Technology Safety Systems to accommodate the IR- TRACC system. Clearly, the bracket for the articulated arm chest deflection transducer is no longer necessary. Installation of the IR-TRACC in the thoracic spine box requires removal of a section of the spine box. The double-gimballing of the rod allows mounting to be accomplished through a simple pin joint.
Applicability
While this work began with frontal impact dummies in mind, the utility of the device we developed does not appear to be restricted to frontal impact. Therefore, it may have broad applicability in side impact dummies and other dummies which will inevitably be created as technology improves.
FUTURE WORK
Implementation in an ATD
Development to-date has consisted of obtaining
Figure 26. Modified spine box of Hybrid III six year old child dummy.
reasonable output from the system within the telescoping rod. Plans for the future are to incorporate this device into Hybrid III dummies of various sizes for continued testing and into the second generation advanced dummy from the NHTSA (THOR). Since the string potentiometer in the DGSP is much bulkier than the LEDs used here, the fit and range of motion in the Hybrid III and THOR should be improved over that in the original Advanced dummy.
Multiple Units in a Single Chest
Backaitis and St.-Laurent [6] performed a series of experiments aimed at elucidating the relationship between Hybrid III dummy-measured chest deflection and actual human volunteer chest deflection in similar loading situations. They pointed out that the Hybrid III chest deflection gauge underestimated the amount of deflection when the loading surface was angled and not acting in the sagittal plane of the dummy and when the surface area of the impact probe was small. An approach similar to that taken by Schneider et al. [l] which used multiple measurement locations would eliminate this issue. While the current articulated arm deflection transducer would not be easy to adapt to such a scenario, the IR-TRACC should be easily adapted to measure deflection at multiple locations.
Therefore, after testing with a single IRTRACC in the Hybrid III mid-sized male dummy’s chest, installation of multiple units will be attempted.
SUMMARY AND CONCLUSIONS
This research has led to the development of a new method for measuring chest deflection in automotive crash test dummies. Data presented in this paper shows that the IR-TRACC system allows measurement of chest deflection at speeds in excess of 18 m/s. Data obtained with this system also meets the design goal of providing a differentiable signal for viscous response calculations. The maximum error in the system is on the order of 1 to 2 mm, or 2.4% to 4.8% of full scale for a Hybrid III six year old child dummy chest.
The system is easy to use and calibrate and requires no special data acquisition. The concept development is essentially complete and has been applied to a Hybrid III 6-year old child dummy. A round robin test series will be initiated as soon as practical, through the SAE Chest Deflection Task Force of the Human Biomechanics and Simulation Standards Committee. Then utilizing the experience gained in that series, work will begin to scale the device for use in other size dummies to allow all families of frontal and side impact dummies to benefit from this improved method of measuring chest deflection.
2039

REFERENCES
1. Schneider, L.W., Haffner, M.P., Eppinger, R.H., Salloum, M.J., Beebe, M.S., Rouhana, SW, King, A.I., Hardy, W.N., and Neathery, R.F.: “Development of an Advanced ATD Thorax System for Improved Injury Assessment in Frontal Crash Environments”, Proceedings of the 36’h Stapp Car Crash Conference, SAE Technical Paper Number 922520, 1992. pp. 129-156.
2. McElhaney, J.H., Mate, PI., and Roberts, V.L.: “A New Crash Test Device - Repeatable Pete”, Proceedings of the 17” Stapp Car Crash Conference, SAE Technical Paper Number 730983, 1973. pp. 467-507.
3. Woley, P.F.: “Development of an Articulated Arm Chest Deflection Transducer”, GM Environmental Activities Staff Publication Number A-3340, 1976.
4. Foster, J.K., Kortge, J.O., and Wolanin, M.J.: “Hybrid III - A Biomechanically-Based Crash Test Dummy”, Proceedings of the 2 1”’ Stapp Car Crash Conference, SAE Technical Paper Number 77093 8, 1977. pp. 975- 10 14.
5. Wiechel, J.F., Bell, S., Pritz, H., Guenther, D.: “Enhancement of the Hybrid III Dummy Thorax”, Proceedings of the 29’h Stapp Car Crash Conference, SAE Technical Paper Number 851732, 1985. pp. 147-158.
6. Backaitis, S.H., and St-Laurent, A.: “Chest Deflection Characteristics of Volunteers and Hybrid III Dummies”, Proceedings of the 30h Stapp Car Crash Conference, SAE Technical Paper Number 861884, 1986. pp. 157-166.
7. Ogata, K., Chiba, M., Kawai, H., Asakura, F.: “Development of a Sternum Displacement Sensing System for Hybrid III Dummy”, Proceedings of the Thirteenth International Technical Conference on Experimental Safety Vehicles, SAE Technical Paper Number 916124, 1991. pp. 947-956.
8. Minutes of the SAE Chest Deflection Task Force of the Human Biomechanics and Simulation Standards Committee. 1995- 1996.
9. Stalnaker, R.L., Tarriere, C., Fayon, A., Walfisch, G., Balthazard, M., Masset, J., Got, C., and Patel, A.: “Modification of Part 572 Dummy for Lateral Impact According to Biomechanical Data”, Proceedings of the 23’d Stapp Car Crash Conference, SAE Technical Paper Number 791031, 1979. pp. 843-872.
10. Grosch, L.: “Chest injury Criteria for Combined Restraint Systems”, 1985 Government/Industry Meeting, SAE Technical Paper Number 851247, 1985.
11. Grosch, L., Katz, E., Kassing, L., Marwitz, H., and Zeidler, F.: “New Measurement Methods to Assess the Improved Protection Potential of Airbag Systems”, in SAE Publication SP-690: Restraint Technologies - Front Seat Occupant Protection, SAE Technical Paper Number 870333, 1987. pp 161-166.
12. Eppinger, R.H.: “On the Development of a Deformation Measurement System and Its Application Toward Developing Mechanically Based Injury Indices”, Proceedings of the 331d Stapp Car Crash Conference, SAE Technical Paper Number 892426, 1989. pp. 21-28.
13. Fayon, A., Tarribre, C., Walfisch, G., Duprey, M., and Balthazard, H.: “Development and Performance of the APR Dummy (APROD)“, Proceedings of the Eighth International Technical Conference on Experimental Safety Vehicles, Wolfsburg, SAE Technical Paper Number 806041, 1980. pp. 451-462.
14. Nielson, L., Lowne, R., Tarriere, C., Bendjellal, F., Gillet, D., Maltha, J., Cesari, D., Bouquet, R.: “The EUROSID Side Impact Dummy”, Proceedings of the Tenth International Technical Conference on Experimental Safety Vehicles, Oxford, SAE Technical PaperNumber 856029, 1985. pp. 153-165.
15. Lau, I.V., Viano, D.C., Culver, C.C., and Jedrzejczak, E.A.: “Design of a Modified Chest for EUROSID Providing Biofidelity for Injury Assessment”, in Side Impact: Injury Causation and Occupant Protection, SP- 769, SAE Technical Paper Number 890991, 1989. pp. 163-171.
16. Beebe, M.S.: “What is Biosid?“, SAE Technical Paper Number 900377, 1990.
17. ISO/TC22/SC12/WG3: “Measurement of Deflection with Integration of Accelerations”, Document N3 03, 1994.
18. Chappell, A. (ed.): “Optoelectronics - Theory and Practice”, McGraw-Hill Book Company, New York, 1978.
19. Nunley, W. and Bechtel, J.S.: “Infrared Optoelectronics - Devices and Applications”, Marcel Dekker, Inc., New York, 1987.
2040

20. Schilling, D.L., Belove, C., Apelewicz, T., Saccardi, R.J.: “Electronic Circuits - Discrete and Integrated”, McGraw-Hill Book Company, New York, 1989.
proportional to the incident radiant power as in Equation 2 [18].
I, = s(h) * CD, (1.2.) ACKNOWLEDGEMENTS
This report was prepared by General Motors pursuant to an agreement between GM and the U.S. Department of Transportation.
Many people helped out in the performance of this work. We would like to acknowledge the technical contributions of: Joseph McCleary of the GM R&D Safety Research Department, Anthony Walbridge of Aerotek Lab Support on contract at the GM R&D Safety Research Department, Michael Salloum of First Technology Safety Systems, Larry Oberdier and Michel Sultan of the GM R&D Electrical and Electronics Department, David Roessler of the GM R&D Physics and Physical Chemistry Department and WKM Associates.
APPENDIX I
- Principle of Operation in Transmission Mode
The following discussion is meant to give a more detailed description than the main text, but a still simplified understanding of the principles of operation. The details are considerably.more complex than what is presented and are beyond the scope of this work. The reader may review the references cited for additional detail.
Figure 5 illustrates schematically how the system operates. The principle of operation of the system is photo-optical. The LED emits light in the infrared region of the spectrum which exits through a plastic lens that is part of the housing. The rays of light from the LED diverge in a conical pattern with a beam divergence angle of f 10” as they leave the source. The irradiance of the light as shown in the manufacturer’s product data sheet obeys an inverse square law [ 181. That is, the ii-radiance at a plane through which the beam passes is proportional to the inverse of the square of the distance from that plane to the LED. So as the LED is moved closer to the photodiode, or as the distance, d, between them decreases, the irradiance, E,, increases as in Equation I. 1.
E, 0~ l/d2 (1.1.)
Phototransistors obtain their base current from the photocurrent generated in their collector-base photodiode section. The photocurrent of a non-amplifying junction photocell (the photodiode section of a phototransistor) is
where, In = the photocurrent (in amperes) through the
transistor (also across the diode) Q,, = the incident radiant power (in watts) s(h) = absolute spectral photosensitivity for
wavelength h which is a constant for monochromatic light.
But,
Qe=E,*AE (1.3.)
where, E, = irradiance (W/m*) and A, = receiver area (m*) which is also a constant for a
given phototransistor. Combining equations 1.2 and I.3 yields:
I, = s(h) * A, * E, (1.4.)
The spectral emission as a function of wavelength for the infrared LEDs used was a relatively sharp distribution. Then, to a first order of approximation the light can be considered monochromatic. Therefore,
I, cx constant * E, (1.5.)
Thus, the photocurrent is linearly related to the irradiance on the phototransistor.
A diagram showing the amplification circuit for the phototransistor is shown in Figure AI.1. Analysis of the circuit can be performed assuming that the phototransistor behaves like a variable resistor (R,). Then, the current through the photodiode is related by Ohm’s Law to the voltage across it and its resistance.
V,=I,*R, (1.6.)
so, R,=V, /I,, (1.7.)
The output voltage measured after the signal is amplified is given by:
Vout = -(R, / RI) * VD (1.8.)
Thus combining equations 1.6, I.7 and I.8 yields:
2041

Vout = (R, * VD) / WD / ID) (1.9.)
V,,, = R, * ID (1.10.)
m = an empirical constant between 1 and 2 k = Boltzmann’s constant (1.3 8 x 1 Oez3 J/K) T = absolute temperature (K).
But, to a first order of approximation this reduces to: Butting Equations I.5 and I. 10 together yields:
ID sz a ebVD (11.2.)
Since the irradiance decreases as the inverse square of the distance between the LED and phototransistor, and all other parameters in Equations I. 10 and I.1 1 are constant, then the output voltage is proportional to the inverse of the distance squared.
I R2
I
Figure AI.l. Phototransistor amplification circuit.
V,,, ~1 U/d’) (1.12.)
Then, the distance between the phototransistor and LED is obtained by taking the inverse square root of the output voltage as measured from the amplifier stage of the circuit as shown in Equation I. 13.
(1.13.)
APPENDIX II
- Principle of Operation in LED-to-LED Mode
The photocurrent from the photodiode is related to the voltage output by [20]:
where, ID = I,(ew”kT - 1) (11.1.)
I, = reverse saturation current (A) q = electron charge (1.6 x 1 O-l9 C) V, = voltage across the diode (V)
a,b = constants
This implies that:
vD K In (ID) (11.3.
As in Appendix I, the photocurrent, I,, is directly proportional to the irradiance, E,. This means that
V, oc In (Ek) (11.4.)
But, from Equation I. 1,
E, 0~ l/d2 (11.5.)
Therefore,
V, CC In (l/d*) (11.6.)
So, the output voltage of the LED-to-LED Mode system is directly proportional to the natural logarithm of the inverse squared distance between the LEDs. This is mathematically approximated as a linear function of distance as shown in Figure 7 in the text. Therefore, the output from the sensor LED is simply amplified as in the circuit shown in Figure AII. 1.
R2
RI I 1
I
Figure AII.l. LED-to-LED Mode buffer amplifier circuit.
2042
APPENDIX III
- Data For Transmission, Ruggedized Transmission and Reflection Modes
Graphs of all IR-TRACC deflections, for LED-to- LED Mode tests at each speed are shown in the main text
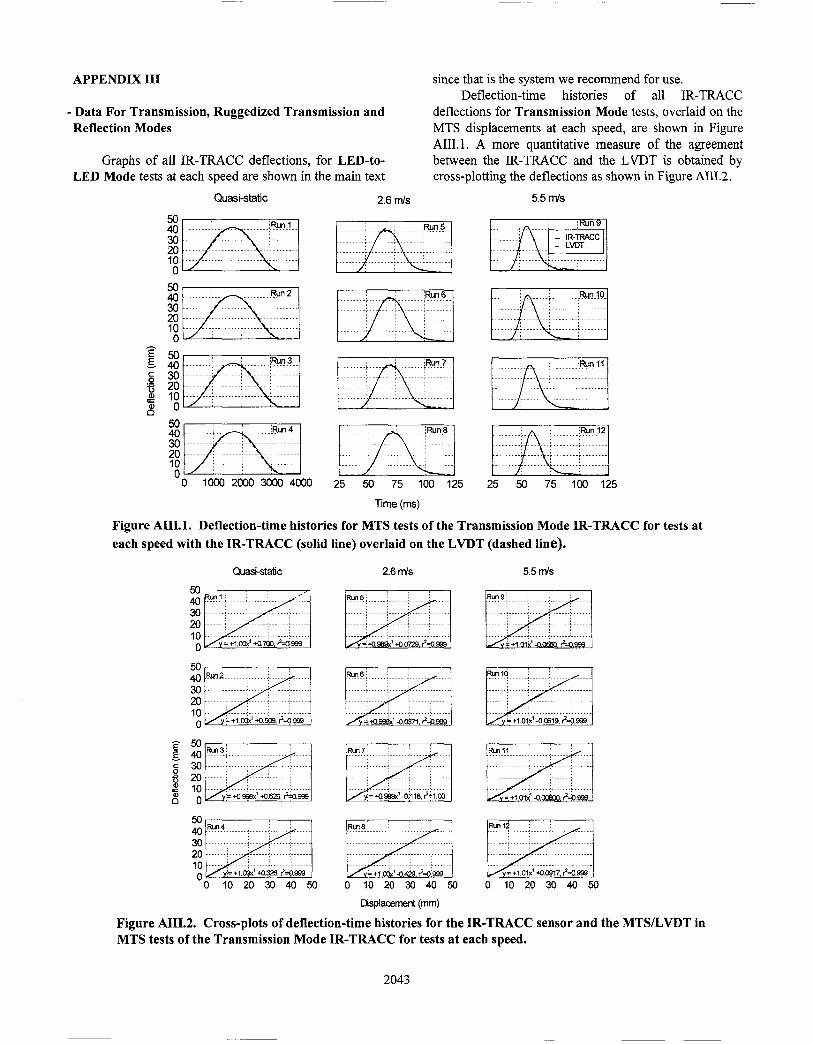
since that is the system we recommend for use. Deflection-time histories of all IR-TRACC
deflections for Transmission Mode tests, overlaid on the MTS displacements at each speed, are shown in Figure AIII.l. A more quantitative measure of the agreement between the IR-TRACC and the LVDT is obtained by cross-plotting the deflections as shown in Figure AIII.2.
Quasi-static
~1
0 1ooO2GOO30004000
2.6 mk
25 50 75 100 125
Time (ms)
25 50 75 loo 125
Figure AIII.l. Deflection-time histories for MTS tests of the Transmission Mode IR-TRACC for tests at each speed with the IR-TRACC (solid line) overlaid on the LVDT (dashed line).
2.6 ds
0 IO 20 30 40 50
Displacement (mm)
Figure AIII.2. Cross-plots of deflection-time histories for the IR-TRACC sensor and the MTS/LVDT in MTS tests of the Transmission Mode IR-TRACC for tests at each speed.
2043

Deflection-time histories of all IR-TRACC deflections for Reflection Mode tests, overlaid on the MT’S displacements at each speed, are shown in Figure
agreement between the IR-TRACC and the LVDT is obtained by cross-plotting the deflections as shown in Figure AIII.4.
AIII.3. Again, a more quantitative measure of the
5.7 Iris GUSSi-static
0 1CUiI20003OCO4000
Figure AIII.3. Deflection-time histories for MTS tests of the Reflection Mode IR-TRACC for tests at each speed with the IR-TRACC (solid line) overlaid on the LVDT (dashed line).
Dsplarzmnt (mm)
Figure AIII.4. Cross-plots of deflection-time histories for the IR-TRACC sensor and the MTWLVDT in MTS tests of Reflection Mode IR-TRACC for tests at each speed.
2044
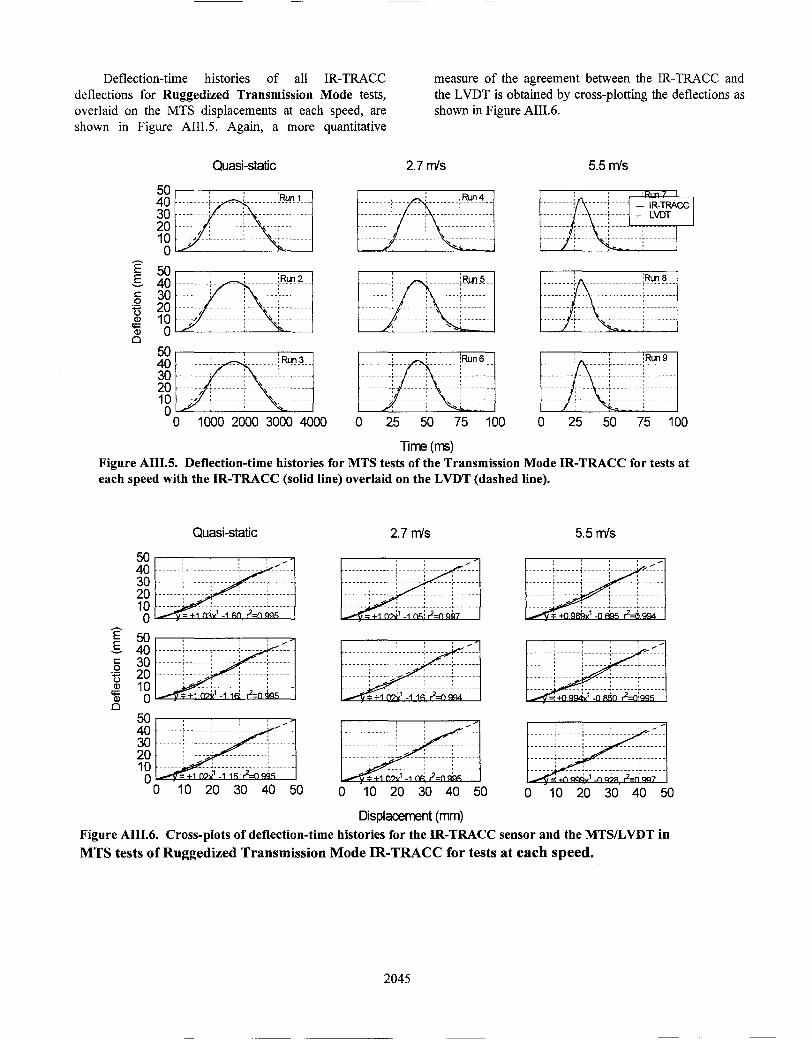
Deflection-time histories of all IR-TRACC deflections for Ruggedized Transmission Mode tests, overlaid on the MTS displacements at each speed, are shown in Figure AIII.5. Again, a more quantitative
measure of the agreement between the IR-TRACC and the LVDT is obtained by cross-plotting the deflections as shown in Figure AIII.6.
Quasi-static 2.7 m’s 5.5 n-is
yj. g
0”
2: 30 20 ‘00
0 1000 2000 3000 4000
:~
0 25 50 75 100
-ha (n-s) Figure AIII.5. Deflection-time histories for MTS tests of the Transmission Mode IR-TRACC for tests at each speed with the IR-TRACC (solid line) overlaid on the LVDT (dashed line).
Quasi-static 2.7 m’s 5.5 n-is
Displacement (mm) Figure AIII.6. Cross-plots of deflection-time histories for the IR-TRACC sensor and the MTWLVDT in MTS tests of Ruggedized Transmission Mode JR-TRACC for tests at each speed.
2045