
A High Ambition Coal Phaseout in China - CGS
44
A High Ambition Coal Phaseout in China: Feasible Strategies through a Comprehensive Plant-by-Plant Assessment
Transcript of A High Ambition Coal Phaseout in China - CGS
A High Ambition Coal Phaseout in China: Feasible Strategies through a Comprehensive Plant-by-Plant Assessment

Suggested Citation
Cui, R., N. Hultman, K. Jiang, H. McJeon, S. Yu, D. Cui, M. Edwards, A. Sen, K. Song, C. Bowman, L. Clarke, J. Kang, F. Yang, J. Yuan, W. Zhang, “A High Ambition Coal Phaseout in China: Feasible Strategies through a Comprehensive Plant-by-Plant Assessment.” Center for Global Sustainability: College Park, Maryland. 37 pp.
Acknowledgments. The authors would like to thank Teng Fei, Alvin Lin, Li Jingjing, Maria Candelaria Bergero, John O’Neill, Kelly Peaks, and the 12th IAMC participants for helpful comments, and the Global Energy Monitor for their inputs on data. Support for this project was provided by Bloomberg Philanthropies.

A High Ambition Coal Phaseout in China: Feasible Strategies through a Comprehensive Plant-by-Plant Assessment
Center for Global Sustainability, University of Maryland Energy Research Institute
byRyna Cui,1 Nathan Hultman,1 Kejun Jiang,2 Haewon McJeon,1 Sha Yu,1 Diyang Cui,1 Morgan Edwards,1 Arijit Sen,1 Kaihui Song,1 Christina Bowman,1 Leon Clarke,1 Junjie Kang, Fuqiang Yang, Jiahai Yuan,3 Weirong Zhang3
January 2020
1 Center for Global Sustainability, School of Public Policy, University of Maryland, College Park MD USA 207422 Energy Research Institute, National Development and Reform Commission 3 North China Electric Power University

Table of contents
1. Introduction 1
2. Five-Dimensional Evaluation Framework 4
3. Plant-by-Plant Retirement Algorithm 73.1 Technical attributes 9
3.2 Profitability 11
3.3 Environmental impacts 13
3.4 The combined metric 15
4. Alternative Retirement Pathways 184.1 Power generation under the Paris goals 19
4.2 Retirement pathway 1: constant utilization of coal plants 20
4.3 Retirement pathway 2: guaranteed lifetime of coal plants 22
5. Potential Impacts 255.1 Grid management for stability 26
5.2 Equity: economic and social impacts 27
6. Policy Discussion 31
i A HIGH AMBITION COAL PHASEOUT IN CHINA

Figure 1. Research questions and analytical structure of this report. 3
Figure 2. Five-dimensional evaluation framework for accelerated coal phaseout in China. 5
Figure 3. Multiple metrics are used to quantify each of the five dimensions. 6
Figure 4. Methodology of calculating the combined plant-by-plant retirement algorithm. 8
Figure 5. National and provincial distribution of technical attributes of existing coal plants. 10
Figure 6. Profitability of existing coal plants and the breakeven frontier. 12
Figure 7. Environmental impacts of existing coal plants. 15
Figure 8. Combined retirement rank score of existing coal plants. 17
Figure 9. National and provincial coal capacity pathways under constant utilization. 21
Figure 10. Unit Lifetimes under “Constant Utilization” (Left) and “Guaranteed Lifetime” (Right) scenarios, for both 2°C (top) and 1.5°C (bottom) pathways. 23
Figure 11. National and provincial phaseout pathways and gradually reduced operating hours under a guaranteed lifetime scenario. 24
Figure 12. National and provincial direct economic impacts of coal plants phaseout. 28
Figure 13. Total employment of coal power plants, by province. 29
Figure 14. Coal plants’ retirement speed by the top-five largest power companies. 30
List of Tables and Figures
Table 1. Number of units and installed capacity of low-hanging fruit, by province. 16
Table 2. Percentage of 2050 power generation by different technologies under the 1.5°C and 2°C goals. 20
Table 3. Percentage of intermittent wind and solar power generation (without storage), by regional grid. 26
iiA HIGH AMBITION COAL PHASEOUT IN CHINA

1. INTRODUCTION
1 A HIGH AMBITION COAL PHASEOUT IN CHINA

2A HIGH AMBITION COAL PHASEOUT IN CHINA
1 INTRODUCTION
When managing today’s energy, environment, and climate issues, China faces two critical challenges—and if approached creatively, the solutions to these challenges will benefit billions of people both within China and the world. The first challenge is to ensure that decades of progress in improving peoples’ lives will continue with rapid and vigorous actions to restore better air quality within China. The second challenge is to utilize China’s important role in combating global climate change to ensure that climate and energy actions around the world will allow us to succeed in reaching the ambitious and essential goals embedded in the Paris Agreement.
Because of our rapidly evolving understanding of the importance of global pathways to keep warming under 1.5 degrees C, solving these challenges implies that the next decade will require concentrated action at a rate that may not have been anticipated even a few years ago. But new opportunities allow us now to seriously re-evaluate both the possibilities for action and the policy pathways to realize them.
Perhaps the single most important near-term strategy across the world to address climate change is a rapid shift away from conventional coal-fired power in the global energy system and a corresponding shift toward non-emitting sources like renewables. 1 This requires that new projects in the planning phase not be built, including those already under construction, while simultaneously retiring existing coal power plants at a faster pace.2
China, as the world’s largest coal user by a wide margin, has a critical role in a successful global transition toward our shared sustainable future. China’s coal power capacity, estimated at 1,100 GW by 2020, is larger than all other countries' combined. The majority of Chinese coal plants have been installed in recent years and therefore have longer remaining lifetimes when compared with the older infrastructure in places like the United States or European Union. 3 Although in the past, inefficient coal plants would operate for decades,4 the world today cannot reach its shared climate goals without a broad and rapid global phaseout of coal—which includes a rapid phaseout in China.
At the same time, a successful energy transition in China would also contribute fundamentally and significantly to China’s own development priorities. A transformed
economy in China is possible already today—and an economy that is no longer dependent on coal is cleaner, healthier, more sustainable, and most importantly, has a larger technological, educational and economic potential.
And progress in China is accelerating. Rising awareness of air pollution related to public health and reducing coal power overcapacity have been the main drivers in the Chinese central government's decision to cap total coal consumption and curb future coal power development. Through successful implementation of the 12th and 13th five-year plan, China has already reversed growing coal consumption, cancelled and suspended a large number of new coal power projects, and made significant progress towards reducing local air pollution from existing coal power plants, by implementing ultra-low emission policy targets.5 Meanwhile, renewable energy has been growing rapidly, and coal is becoming less competitive than lower-cost alternatives.
While these steps demonstrate the effectiveness of current policies and the economic and public health benefits that come from continued coal phaseout, the pace of China’s coal transition remains insufficient to meet global climate and sustainability goals. A number of entrenched or hidden protections have shielded Chinese coal plants from unfavorable market conditions and policy signals that would otherwise would have shut them down. These include coal’s dominant role in the existing power mix; the powerful central state-owned companies in coal and power industries; the perpetual “push-and-pull” between environmental goals and other development priorities; the geographically unbalanced electricity demand and renewable resource potential; challenges in incorporating a large amount of variable renewable energy into its traditional grid system; and the potential social and economic impacts in coal-dependent regions.
Entering the 14th five-year plan period (2021-2025), China’s climate and energy strategy becomes one of the most critical questions for the prosperity of the country. China is serious about climate action. President Xi recently reaffirmed China’s commitment to meeting the targets pledged in its Nationally Determined Contribution (NDC), which identifies the roadmap to lower emissions through 2030. China together with France recently announced the potential updates to their contributions to reflect “their highest possible ambition.”6 China is now

3 A HIGH AMBITION COAL PHASEOUT IN CHINA
1 INTRODUCTION
facing a critical moment and opportunity to introduce more ambitious near-term goals in line with new science, enhance its climate ambition post-2030, and develop an actionable mid-century strategy for climate change mitigation and its energy system transition.
As China ramps up efforts to combat climate change, there has never been a closer connection between its climate and energy strategy and its development strategy. China is now considering some pressing questions, including how fast it can meet its commitment to the Paris goals and increase its near- and long-term climate ambition, while also meeting its energy and development goals. China's successful economic and clean energy transition will be an important part of our shared climate future, keeping warming under 1.5° to 2°C. The key component of this is how China can achieve deep decarbonization and carbon neutrality in power generation by phasing out coal by 2050 or earlier to support the Paris goals. Achieving that goal within the next 30 years will be an unprecedented challenge, highlighting the importance of assessing whether such a high-ambition pathway is truly feasible.
This report details how such a pathway can be achieved feasibly, balancing multiple important needs. In doing this, it demonstrates a pathway that allows for an
appropriately paced retirement strategy for individual plants and simultaneously maintains power stability and economic security. This report uses a comprehensive and systematic approach to guide a sustainable coal phaseout in China and lays out a roadmap for policymakers and stakeholders. We first establish a five-dimensional framework for prioritizing the retirement of individual Chinese coal-fired power plants, based on technical attributes, profitability, environmental impacts, grid stability, and equity (Chapter 2). We then apply this evaluation framework to more than 1,000 operating coal plants, 3,000 units in China, identifying a small fraction of plants that can easily retire first—the “low-hanging fruit” plants (Chapter 3). Next, using the Global Change Assessment Model (GCAM-China) and the Integrated Policy Assessment Model of China (IPAC), we identify long-term emission scenarios consistent with global 1.5°C and 2°C goals for China and the corresponding coal power generation pathways. We then explore alternative coal retirement pathways based on different phaseout priorities and policy designs (Chapter 4). Finally, we evaluate the potential impacts on grid stability, stranded assets, and other equity issues to identify the main challenges and potential policy solutions (Chapter 5). This allows us to build out a proposed phaseout strategy that addresses the balance of demands at national, regional, and local levels.
What are the critical elements to consider?Develop the evaluation framework (Chapter 2)
Which plants to retire first?Develop the plant-by-plant retirement algorithm (Chapter 3)
What are the phase-out pathways?Assess alternative phase-out pathways (Chapter 4)
What are the potential challenges?Evaluate the phase-out impacts (Chapter 5)
FIGURE 1. Research questions and analytical structure of this report.
2. FIVE-DIMENSIONAL EVALUATION
FRAMEWORK

2. FIVE-DIMENSIONAL EVALUATION
FRAMEWORK
4A HIGH AMBITION COAL PHASEOUT IN CHINA

5 A HIGH AMBITION COAL PHASEOUT IN CHINA
2 FIVE-DIMENSIONAL EVALUATION FRAMEWORK
To develop a good phaseout plan, a necessary first step is to set forth a framework that can evaluate the distinctions among all the coal plants in a comprehensive and systematic way. Specif ical ly, we develop a framework with five dimensions: technical attributes, profitability, environmental impacts, grid stability, and equity (Figure 2). These are the most discussed issues in the Chinese context and have been examined
separately in the literature. Several studies conduct analyses at the plant level with respect to the super emitters of air pollutants,7, profitability of individual plants,8,9 and stranded assets under alternative phaseout pathways.10 Building on prior research, this report integrates a broader range of issues into a single analytical framework.
FIGURE 2. Five-dimensional evaluation framework for accelerated coal phaseout in China.
The five dimensions are technical attributes, profitability, environmental impacts, grid stability, and equity.
Technical attributes
Profitability
Environmental impactsGrid stability
Equity
Some of the dimensions, like technical attributes, can be easily measured; others, such as equity, are more complicated issues. We use a number of simplified metrics to assess each dimension (Figure 3). First, technical attributes refer to individual plants’ engineering features and are described with four metrics: age, size, combustion technology and application. Second, the profitability of a plant is assessed through an estimate for gross profit, calculated as the difference between annual revenue and annual cost in the current year. The level of operating hours and coal price that pushes
the gross profit to zero is also calculated. Third, an environmental impact estimate is drawn from three areas: global climate change impact evaluated with a plant’s CO2 emission rate, local air pollution and human health impact assessed with the population-weighted PM2.5 concentration level of a plant’s location, and water impact estimated with the water risk level of a plant’s location. These three dimensions (technical attributes, profitability, and environmental impacts) are used to develop a quantitative plant-by-plant retirement algorithm (Chapter 3).

6A HIGH AMBITION COAL PHASEOUT IN CHINA
2 FIVE-DIMENSIONAL EVALUATION FRAMEWORK
The other two dimensions, grid stability and equity, are complex issues to quantify at the plant level, but are nevertheless important. As such these are evaluated at a more aggregate level in order to explore potential impacts (Chapter 5). For example, grid stability is evaluated through the fuel mix of power system and
FIGURE 3. Multiple metrics are used to quantify each of the five dimensions.
Technical attributes, profitability, and environmental impacts are used to develop the plant-by-plant retirement algorithm; while grid stability and equity, are complex issues and are evaluated at the more aggregate levels to explore potential impacts. Each dimension is assessed through a number of metrics.
Technical attributes
Age
Size
Technology
Application
Profitability
Annual gross profit
Breakeven operating
hours
Breakeven coal price
Environmental impacts
CO2emission
Local air pollution
Water impact
Grid stability
Fuel mix
RE integration
Equity
Retirement speed
Stranded assets
Employment
Plant-by-plant retirement algorithm
Provincial/grid level impacts
through the share of intermittent technologies. Our assessment of equity covers a variety of issues, including the magnitude and distribution of economic impacts including stranded assets, social impact with respect to employment, as well as the retirement speed compared across different power companies.

3. PLANT-BY-PLANT RETIREMENT ALGORITHM
7 A HIGH AMBITION COAL PHASEOUT IN CHINA

8A HIGH AMBITION COAL PHASEOUT IN CHINA
3 PLANT-BY-PLANT RETIREMENT ALGORITHM
Up to May 2019, our data show there were nearly 3,000 coal power generators operating in China, with a total capacity of 980 GW. As policy makers consider how to best serve China’s goals, a key question focuses on how to decide on a strategy for each of these plants. For example, among all the plants, which one should ret i re f i rst? Decision-making about coal plants’ shutdown is complex in reality, and it may often require a judgement made case by case. To effectively inform policy-making, the proposed rules need to be actionable, and they
need to take into account multiple dimensions from this evaluation framework.
In this chapter, we address this issue by developing a three-step retirement algorithm based on multiple technical, financial and environmental criteria and a set of simplified but transparent rules—seeking to strike a good balance between sophistication and clarity. S p e c i f i c a l l y, w e s t a r t w i t h assigning each plant a normalized score ranging between zero and one for each individual metric. A score close to zero indicates the
plants are the first to retire; a score close to one indicates they are the last to retire. We then calculate each dimension score as the weighted average of individual metr ics. Last ly, we take the weighted average of the three dimension scores to the combined metric (Figure 4). The retirement order of a l l p lants is ranked according to the combined score. A lower score indicates a plant is ranked lower by the retirement order and should retire first. (see Retirement Algorithm in Technical Appendix).
FIGURE 4. Methodology of calculating the combined plant-by-plant retirement algorithm.
The retirement algorithm is based on technical attributes, profitability, and environmental impacts. For each individual metric, a normalized score ranging between zero and one is assigned to a specific power plant. These scores are then aggregated up to each of the three dimensions. A weighted average score of all three dimensions is then calculated to yield the final combined score for each plant.
Technical attributes
Age
Size
Technology
Application
Profitability
Annual gross profit
Breakeven operating
hours
Breakeven coal price
Environmental impacts
CO2 emission
rate
Local air pollution
Water impact
Calculate the weighted average score of all
three dimensions to the final combined score
for each plant
Aggregate the individual metric scores
to each of the three dimensions for each
plant
For each metric, a normalized score [0, 1]
is assigned to a specific coal plant
The combined retirement score
3 PLANT-BY-PLANT RETIREMENT ALGORITHM

9 A HIGH AMBITION COAL PHASEOUT IN CHINA
3 PLANT-BY-PLANT RETIREMENT ALGORITHM
We also created a unit-level dataset of coal power plants that are operating in China by May 2019, by combining several existing datasets11,12 with independent modification and updates based on primary research. The dataset covers nearly 3,000 coal power generators, and a total of 980 GW. According to China Electricity Council (CEC), the total capacity of coal units is estimated to be 1,008 GW by the end of 201813 and to be around 1,100 GW by 2020. Our data covers more
than 90% of the total capacity list by CEC. A number of variables, either collected or estimated at the unit level, are used in the calculation of metrics, including location, capacity, vintage year, combustion technology, application, heat rate, coal type, and project developer (see Data in Technical Appendix for more details).
3.1 TECHNICAL ATTRIBUTES
Technical attributes of individual plants are described using four metrics: age (vintage year), size (capacity), combustion technology and application. The majority of China’s existing coal fleets were implemented after 2005 (Figure 5a). The older fleets built before 2005 are mainly 300 MW or smaller units with subcritical technology. The more recent units are featured as 1000 MW or 600 MW ultra-supercritical power plants or large combined heat and power (CHP) plants.
Specifically, for the two numeric variables, older and smaller plants receive lower scores, indicating they are the first to retire. To be noticed, there are several more commonly adopted combustor sizes, including 1000 MW, 600 MW (660 MW), 300 MW (330 MW and 350 MW), and a variety of smaller units below 300 MW. Combustion technologies are categorized into ultra-supercritical, supercritical, subcritical, and other, ranking from the most to the least efficient with a decreasing score. Application is categorized into power only, combined heat and power (CHP), and industrial self-use (captive plants), where power only and CHP plants receive the same score, while self-use plants get the lowest.
Our method is flexible to be able to accomplish different priorities and policy designs in local contexts. For example, certain CHP plants, especially those that provide residential heating services, are in fact very critical and not easy to replace in the short term. Meanwhile, some other CHP plants are inefficient options for heating services (for example, for industrial processes) and have already been targeted by policy for early phaseout.14 To further differentiate CHP plants, we thus test another scoring method that assigns a higher score to those in the northern provinces, potentially used for residential heating. We note, however, that accounting for this has little impact on the overall provincial phaseout pathways (see Sensitivity in Technical Appendix).
There are regional variations in retirement pathways resulting from this systematic assessment. Overall, coal plants located in the northern grids receive lower scores than those in central, east, and south China (Figure 5b). This is mainly because these plants tend to be older, smaller, and less efficient, especially those in Heilongjiang, Jilin and Liaoning. Another reason is that a large number of self-use plants are located in Shandong and Xinjiang. Moreover, within-province variation is larger in Jiangsu, Shandong, and Guangdong.

10A HIGH AMBITION COAL PHASEOUT IN CHINA
3 PLANT-BY-PLANT RETIREMENT ALGORITHM
a
b
FIGURE 5. National and provincial distribution of technical attributes of existing coal plants.
(a) The majority of China’s existing coal fleets came online after 2005. While old coal plants built before 2005 are mostly small units with subcritical technology, most recent units are large ultra-supercritical power plants or large combined heat and power (CHP) plants. (b) Based on the provincial distribution of technical scores, plants located in the northern grids receive lower scores than those in central, east, and south China; and within-province variation is larger in Jiangsu, Shandong, and Guangdong.
0
10
20
30
40
50
60
70
80
1970 1980 1990 2000 2010 2020Vintage Year
GW
Technology group
>=1000MW Ultra−super Power
>=600MW Ultra−super Power
>=600MW Supercritical Power
>=600MW Subcritical Power
>=600MW Other Power
>=300MW Ultra−super Power
>=300MW Supercritical Power
>=300MW Subcritical Power
>=300MW Other Power
<300MW Power
>=300MW CHP
<300MW CHP
SelfUse
●●●●●
●●●●●●
●●●●●●●●●●
●●
●●●●●●
●●
●●●●
●●
●
0.00
0.25
0.50
0.75
1.00
Nin
gxia
Sha
anxi
Qin
ghai
Xin
jiang
Gan
suTi
anjin
Sha
nxi
Sha
ndon
gH
ebei
Inne
r Mon
golia
Liao
ning Jilin
Hei
long
jiang
Hai
nan
Gui
zhou
Gua
ngdo
ngYu
nnan
Gua
ngxi
Jian
gxi
Hun
anH
ubei
Hen
anC
hong
qing
Sic
huan
Fujia
nA
nhui
Zhej
iang
Jian
gsu
Sha
ngha
i
Province
Sco
re
GridNorthwest China Grid
China Southern Power Grid
North China Grid
Central China Grid
Northeast China Grid
East China Grid

11 A HIGH AMBITION COAL PHASEOUT IN CHINA
3 PLANT-BY-PLANT RETIREMENT ALGORITHM
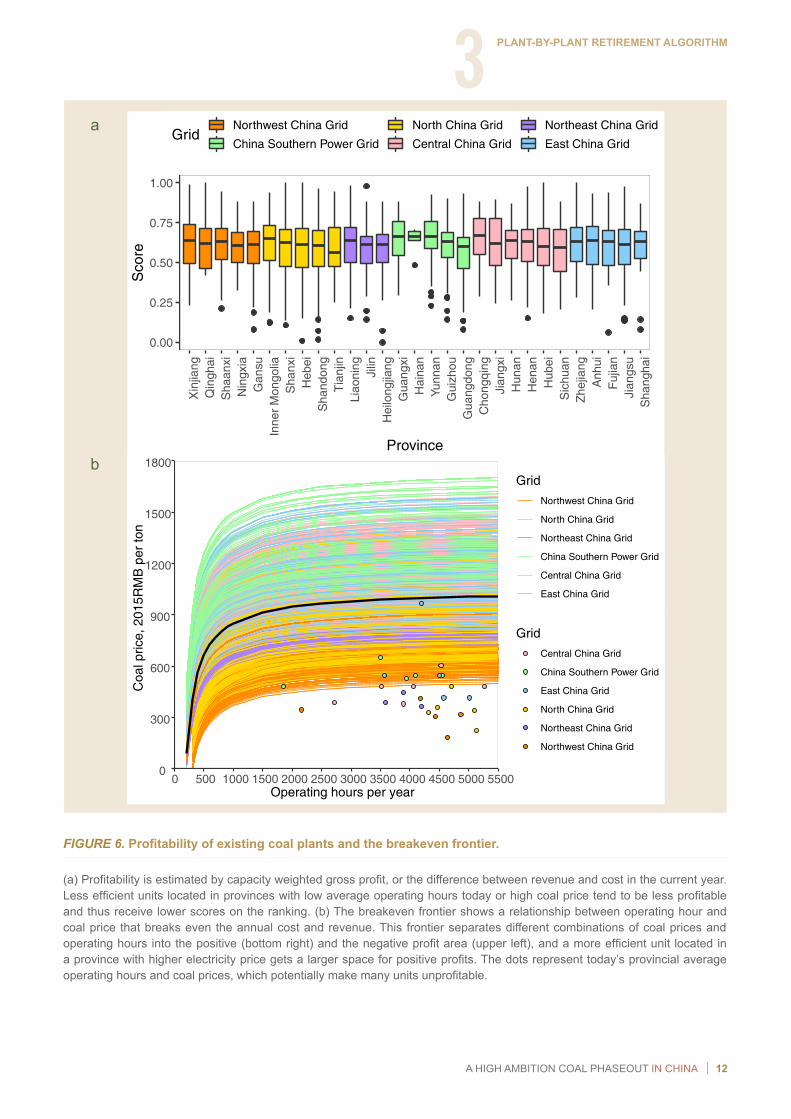
3.2 PROFITABILITYThe profitability of a plant is approximated through its current annual gross profit, weighted by capacity. Gross profit is estimated by the difference between revenue and cost in the current year. In general, the estimated gross profit depends on efficiency—how much coal consumed per electricity generation, operating hour, electricity price, and coal price. Efficiency, or heat rate, is highly associated with the plant’s technical attributes, while operating hours, electricity and coal prices vary at the provincial level (see Metrics in the Technical Appendix for more details). Overall, less efficient plants located in provinces with low average operating hours today (i.e. Sichuan and Gansu) or high coal price (i.e. Guangdong) tend to be less profitable and thus receive lower scores on the ranking (Figure 6a).
We use a simplified metric to approximate the relative profitability across plants. Other methods, such as the net present value (NPV) or rate of return (RoR), may produce more accurate estimates of the absolute profitability of individual plants. However, these metrics require more input data, such as the initial investment, financial costs, taxes, pollution control costs, and so forth. Since our analysis focuses on the ranking of plants, this simplified metric provides a reasonable approximation suitable for ranking, while acknowledging that it may not represent the absolute profitability of each plant. Because profitability has been the most critical factor in coal plants’ shutdown decision-making in the United States,15 future research could analyze profitability to refine the recommendations for individual Chinese coal plants.
Next, we explore how changes in coal price and operating hours may change a plant’s profitability in the future. Specifically, we develop a relationship between coal price and operating hours that brings the annual gross profit of each plant to the breakeven point, holding other variables constant at today’s level. This frontier (Figure 6b) separates different combinations of coal prices and operating hours into the positive (bottom right) and the negative profit area (upper left). Variation of the frontier is large across plants, and clearly, some regional patterns are observed. For example, under equal operating hours, plants in the south and central grids are able to break even (gross profit) at a much higher coal price than those in northern grids. This is because the shape and location of the frontier mainly depend on the regional electricity price as well as the plant’s efficiency. That is, a more efficient plant located in a province with a higher electricity price can make a positive gross profit under a wider range of coal prices and operating hours.
For each plant along its own frontier, when running at a very low level—under about 3000 hours per year, increasing coal price requires longer operating hours to break even the annual cost and revenue. However, when running at a higher capacity, coal price is what primarily determines the breakeven of gross profit. If coal price increases to above 900 yuan per ton, as the same level in Zhejiang province today, about half of all plants would already be running at negative gross profits (Figure 6b).
12A HIGH AMBITION COAL PHASEOUT IN CHINA
3 PLANT-BY-PLANT RETIREMENT ALGORITHM
a
FIGURE 6. Profitability of existing coal plants and the breakeven frontier.
(a) Profitability is estimated by capacity weighted gross profit, or the difference between revenue and cost in the current year. Less efficient units located in provinces with low average operating hours today or high coal price tend to be less profitable and thus receive lower scores on the ranking. (b) The breakeven frontier shows a relationship between operating hour and coal price that breaks even the annual cost and revenue. This frontier separates different combinations of coal prices and operating hours into the positive (bottom right) and the negative profit area (upper left), and a more efficient unit located in a province with higher electricity price gets a larger space for positive profits. The dots represent today’s provincial average operating hours and coal prices, which potentially make many units unprofitable.
●●
●●● ●
●
●
●●
●●
●
●
●
●
●
●●
●
●
●●
●
●●●
●
●
●●●
●
●
0.00
0.25
0.50
0.75
1.00X
injia
ngQ
ingh
aiS
haan
xiN
ingx
iaG
ansu
Inne
r Mon
golia
Sha
nxi
Heb
eiS
hand
ong
Tian
jinLi
aoni
ng Jilin
Hei
long
jiang
Gua
ngxi
Hai
nan
Yunn
anG
uizh
ouG
uang
dong
Cho
ngqi
ngJi
angx
iH
unan
Hen
anH
ubei
Sic
huan
Zhej
iang
Anh
uiFu
jian
Jian
gsu
Sha
ngha
i
Province
Sco
reGrid
Northwest China Grid
China Southern Power Grid
North China Grid
Central China Grid
Northeast China Grid
East China Grid
0
300
600
900
1200
1500
1800
0 500 1000 1500 2000 2500 3000 3500 4000 4500 5000 5500Operating hours per year
Coa
l pric
e, 2
015R
MB
per
ton
GridNorthwest China Grid
North China Grid
Northeast China Grid
China Southern Power Grid
Central China Grid
East China Grid
GridCentral China Grid
China Southern Power Grid
East China Grid
North China Grid
Northeast China Grid
Northwest China Grid
b

13 A HIGH AMBITION COAL PHASEOUT IN CHINA
3 PLANT-BY-PLANT RETIREMENT ALGORITHM
3.3 ENVIRONMENTAL IMPACTSOur assessment of environmental impacts integrates three elements—global climate change, local air pollution and human health, and water impact. First, the CO2 emission rate refers to the amount of CO2 emitted per unit of electricity generation and is used to evaluate the impact on climate change. It depends on plant efficiency as well as the type of coal combusted. However, given the small variation of emission factors across coal types, the CO2 emission rate is mainly associated with the plant’s technical attributes. In general, emissions rates increase as a plant gets older, smaller and/or uses a less efficient combustion technology (see Metrics in the Technical Appendix for more details).
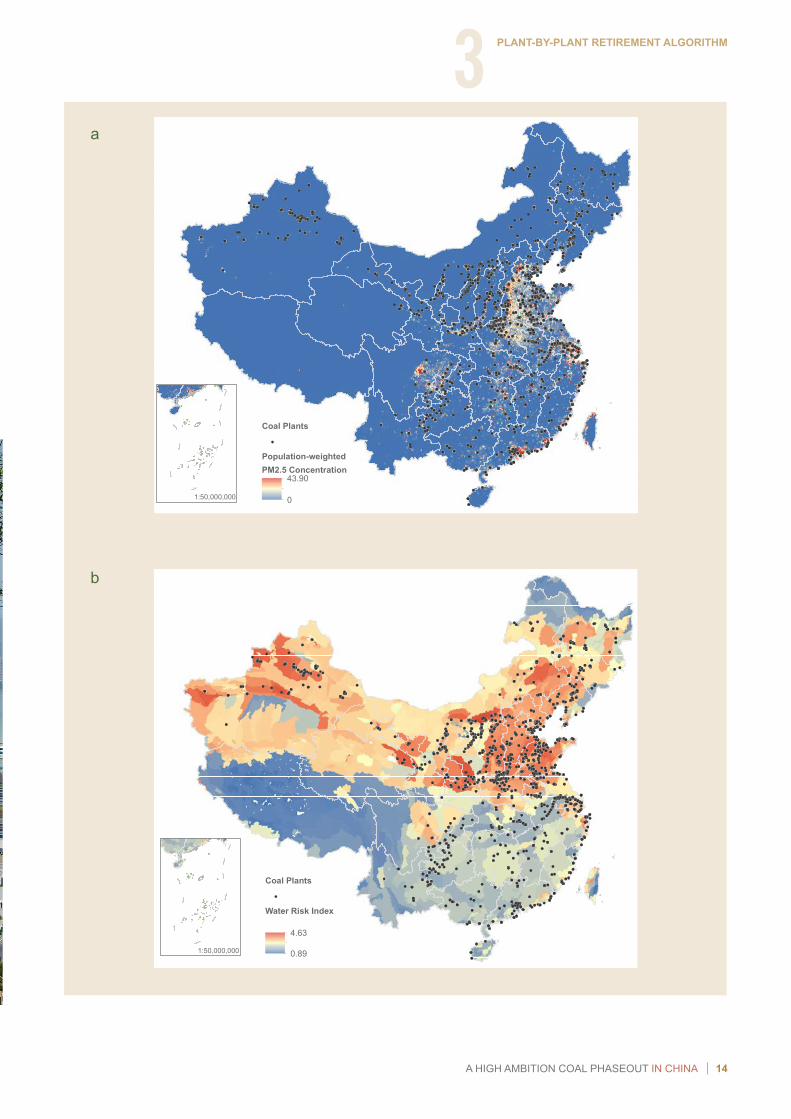
Second, the local air pollution and human health impact is assessed by looking at the population weighted PM2.5 concentration level at a plant’s location. The issue of air pollution poses a serious threat to Chinese public health and is mainly contributed from burning coal. In the past few years, the majority of coal-fired power plants in China implemented local air pollution control technologies and significantly lowered their SO2, NOx, and primary PM emissions.16 Although this has reduced some urgency in certain locations for reducing local air pollution immediately, coal plants will remain a critical piece in the longer term effort to further improve air quality in line with the WHO guidelines on the safer PM2.5 concentration level. Therefore, our metric, the annual PM2.5 concentration17 weighted by population density,18 represents the potential health benefit by closing coal units in that gridded cell. The higher the current health impact, the larger the marginal benefit of shutting down a coal plant, assuming the same level of air pollution control implemented. For example, plants located along the densely populated Beijing-to-Shanghai corridor and several major cities such as Guangzhou and Chongqing, will receive a lower score on this metric (Figure 7a).
Third, using a similar method, water impact is estimated with the water risk level of a plant’s location. The water risk metric, derived from 12 global water-related risk indicators, including water quantity, water variability, water quality, public awareness of water issues, access to water, and ecosystem vulnerability, provides a good representation of the physical, regulatory and
reputational water risk level.19 It represents the potential reduction in water impact by closing coal units in that gridded cell. In particular, the northern provinces face more severe water crisis due to limited water resources and water pollution problem, therefore plants located in those regions will receive a lower score on this metric (Figure 7b).
The combined environmental score shows a strong regional pattern. Coal plants retired in southern provinces tend to have smaller health and water benefits and thus receive higher scores. By contrast, those located in the northern grids and certain provinces in central and east China—i.e. Henan and Shanghai—can bring larger health and water benefits through retirement and hence receive lower scores (Figure 7c).
14A HIGH AMBITION COAL PHASEOUT IN CHINA
3 PLANT-BY-PLANT RETIREMENT ALGORITHM
reputational water risk level.19 It represents the potential reduction in water impact by closing coal units in that gridded cell. In particular, the northern provinces face more severe water crisis due to limited water resources and water pollution problem, therefore plants located in those regions will receive a lower score on this metric (Figure 7b).
The combined environmental score shows a strong regional pattern. Coal plants retired in southern provinces tend to have smaller health and water benefits and thus receive higher scores. By contrast, those located in the northern grids and certain provinces in central and east China—i.e. Henan and Shanghai—can bring larger health and water benefits through retirement and hence receive lower scores (Figure 7c).
a
b
Coal Plants
Population-weightedPM2.5 Concentration
43.90 01:50,000,000
Coal Plants
Water Risk Index
4.63
0.891:50,000,000

15 A HIGH AMBITION COAL PHASEOUT IN CHINA
3 PLANT-BY-PLANT RETIREMENT ALGORITHM
3.4 THE COMBINED METRICTo get the combined retirement algorithm, we start with an equal weight for all the three dimensional scores and calculate the weighted average for the combined metric. Different weighting options are tested and discussed in the sensitivity analysis (see Sensitivity in Technical Appendix).
The combined score, from zero to one, ranks all operating plants from first to last for retirement. In general, plants that rank near the top of the retirement priority are older, smaller, less efficient, and/or self-use units located in highly air polluted and water scarce regions. By contrast, large plants above 600 MW with the most efficient ultra-supercritical technology all receive an above-average score after combining all
FIGURE 7. Environmental impacts of existing coal plants.
(a) Local air pollution and health impact at operating coal plants’ locations: Higher population weighted PM2.5 concentration level is associated with a lower score for plants in that gridded cell, indicating higher marginal health benefit by retiring those units. (b) Local water impact at operating coal plants’ location: Higher water risk level is associated with a lower score for units in that gridded cell, indicating higher marginal water benefit by closing those plants. (c) Provincial distribution of the environmental score: Plants in South China tend to have smaller environmental impact and receive higher scores, while those located in the northern grids and certain provinces in Central and East China have lower scores with larger environmental impact.
c
●●●
●●
●●●
●●●●●
●
●●
●
●
●
0.00
0.25
0.50
0.75
1.00N
ingx
iaX
injia
ngS
haan
xiG
ansu
Qin
ghai
Inne
r Mon
golia
Sha
nxi
Heb
eiTi
anjin
Sha
ndon
gJi
linH
eilo
ngjia
ngLi
aoni
ngG
uang
xiYu
nnan
Hai
nan
Gui
zhou
Gua
ngdo
ngC
hong
qing
Hub
eiJi
angx
iH
unan
Sic
huan
Hen
anA
nhui
Fujia
nJi
angs
uZh
ejia
ngS
hang
hai
Province
Sco
reGrid
Northwest China Grid
China Southern Power Grid
North China Grid
Central China Grid
Northeast China Grid
East China Grid
the criteria, and thus would retire and the end of the phaseout period (Figure 8a).
In terms of provincial distribution, the top ten provinces where coal plants receive the lowest combined scores on average are Shanghai, Shandong, Heilongjiang, Hebei, Gansu, Liaoning, Shanxi, Jilin, Qinghai, and Henan (Figure 8b). Plants in these regions tend to perform poorly across all three dimensions, but the key drivers vary across provinces. Some are mainly due to undesirable technical attributes, like the aging plants located in Shanghai and the three northeast provinces. Others are driven by the large health and water impacts, such as those in Shanghai, Shandong, Hebei, and Qinghai, and others are mainly because of low profitability, such as plants in Gansu.

16A HIGH AMBITION COAL PHASEOUT IN CHINA
3 PLANT-BY-PLANT RETIREMENT ALGORITHM
Moreover, we identify 18% of the operating units, or a total of 112 GW of capacity (10%), as particularly suitable for near-term retirement—the low-hanging fruit. These units receive a below-median score for each of all three dimensions evaluated and therefore are always likely to retire first regardless of which criteria are prioritized in the decision-making. These units often have been operating for more than 10 years, have a smaller size less than 600 MW, and use less efficient subcritical combustion technologies (Supplementary Figure S5 in Technical Appendix). About 23% of all self-
use plants are identified as low-hanging fruit, which is higher than power only (19%) and CHP plants (17%). These units are concentrated in the northeast and central east of China. Specifically, 60% of them, a total of 68 GW, are located in six provinces, including Shandong, Inner Mongolia, Henan, Hebei, Jiangsu and Shanxi. Moreover, in province like Hebei, Heilongjiang, Shanghai, and Shandong, more than 20% of existing coal capacity is identified as the low-hanging fruit (Table 1).
TABLE 1. Number of units and installed capacity of low-hanging fruit, by province.
Number of units Installed capacity
Unit Percentage of provincial total MW Percentage of
provincial totalShandong 98 29% 18586 20% Inner Mongolia 50 19% 11710 14% Henan 48 27% 10005 15% Jiangsu 46 21% 9489 13% Hebei 36 29% 9910 26% Shanxi 36 19% 8425 14% Xinjiang 30 15% 4785 9% Heilongjiang 29 37% 4295 23% Liaoning 27 25% 5110 18% Jilin 18 26% 3076 18% Zhejiang 16 16% 2602 6% Gansu 14 22% 3485 17% Shaanxi 14 12% 3515 9% Guangdong 9 7% 1770 3% Shanghai 9 35% 2715 23% Fujian 8 15% 2000 7% Tianjin 8 31% 1956 17%Hunan 7 15% 1950 10%Ningxia 6 9% 1980 7%Sichuan 6 18% 1860 16%Anhui 4 4% 1480 3%Hubei 4 6% 220 1%Qinghai 3 30% 405 13%Guizhou 0 0% 0 0%Jiangxi 0 0% 0 0%Guangxi 0 0% 0 0%Chongqing 0 0% 0 0%Yunnan 0 0% 0 0%
Hainan 0 0% 0 0%

17 A HIGH AMBITION COAL PHASEOUT IN CHINA
3 PLANT-BY-PLANT RETIREMENT ALGORITHM
a
b
FIGURE 8. Combined retirement rank score of existing coal plants.
(a) The combined score is based on the equal-weighted average of dimensional scores of technical attributes, profitability, and environmental impacts. The combined score, from zero to one, ranks all operating plants from first to last for retirement. Overall, plants to retire first are older, smaller, less efficient, self-use plants located in highly air polluted and water scarce regions. (b) The ten provinces with the lowest combined scores are Shanghai, Shandong, Heilongjiang, Hebei, Gansu, Liaoning, Shanxi, Jilin, Qinghai, and Henan.
Technical attributes Profitability Environmental
impacts
Combined metric
GW
GW
GW
GW
●●
●
●
●●
●●
●●
●
●
●●
●
●●
●●●●
●●●
●
●
●●
●●
●
●
0.00
0.25
0.50
0.75
1.00
Nin
gxia
Sha
anxi
Xin
jiang
Qin
ghai
Gan
suIn
ner M
ongo
liaTi
anjin
Sha
nxi
Heb
eiS
hand
ong
Jilin
Liao
ning
Hei
long
jiang
Hai
nan
Gua
ngxi
Gui
zhou
Yunn
anG
uang
dong
Jian
gxi
Cho
ngqi
ngH
ubei
Hun
anS
ichu
anH
enan
Anh
uiFu
jian
Zhej
iang
Jian
gsu
Sha
ngha
i
Province
Sco
re
GridNorthwest China Grid
China Southern Power Grid
North China Grid
Central China Grid
Northeast China Grid
East China Grid
4. ALTERNATIVE RETIREMENT
PATHWAYS

4. ALTERNATIVE RETIREMENT
PATHWAYS
18A HIGH AMBITION COAL PHASEOUT IN CHINA

19 A HIGH AMBITION COAL PHASEOUT IN CHINA
4 ALTERNATIVE RETIREMENT PATHWAYS
This chapter examines alternative coal retirement pathways and discusses what a sound pathway may look like based on different po l icy des igns . We s tar t by assess ing amount o f power
generation from conventional coal plants through 2050 that would be consistent with the Paris climate goals. We then develop two alternative pathways for the retirement of individual coal plants
based on different policy designs, t ha t wou ld ensu re f eas ib l e achievement of both economic and climate goals.
4.1 POWER GENERATION UNDER THE PARIS GOALSWe use two models, the Global Change Assessment Model with subnational details of China (GCAM-China) and the Integrated Policy Assessment Model of China (IPAC), to explore power generation pathways through 2050 consistent with the Paris climate goals. The two models allow exploration of complementary dimensions of the challenge, with GCAM-China developed to primarily understand China’s energy future in the context of global climate goals and global energy markets, and IPAC developed domestically to better support national energy planning. The two models differ in their structure and data source. Understanding the similarities and differences between the two models help us better understand the robustness of long-term coal power retirement scenarios in China under stringent deep decarbonization goal (see Models and Scenarios in Technical Appendix for more details).
In particular, GCAM-China was used to simulate a 1.5°C,
a well-below-2°C, and a higher-than-2°C scenario, and IPAC for a 1.5°C and a 2°C scenario. These models show that China’s energy-related CO2 emissions would peak around 10 to 11 billion Mt around 2020 and then decline by more than 90% under the global 1.5°C scenarios and about 70% under the well-below-2°C and the 2°C scenario.
China’s total power generation will increase to about 12,000~12,500 TWh by 2050 under the 2°C scenarios, and to about 14,500~15,000 TWh under 1.5°C. However, both models show a rapid shift away from coal to low carbon technologies. Specifically, generation from conventional coal plants will decline more than 90% by 2040 and 2050 under the 1.5°C and 2°C targets, and will drop to zero by 2045 and 2055, respectively. To displace conventional coal in the power system, a wide range of alternative technologies will be deployed. By 2050, renewable energy including solar, wind, hydro, and bioenergy will provide 50% to 75% of total electricity generation across scenarios and models, while nuclear and CCS make up 25% to 50% (Table 2 and Supplementary Figure S6 in Technical Appendix).
4 ALTERNATIVE RETIREMENT PATHWAYS

20A HIGH AMBITION COAL PHASEOUT IN CHINA
4 ALTERNATIVE RETIREMENT PATHWAYS
TABLE 2. Percentage of 2050 power generation by different technologies under the 1.5°C and 2°C goals.
1.5°C 2°C
GCAM-China IPAC GCAM-China IPAC
Conventional coal 0% 0.8% 0.6% 4.1%
Coal CCS 8.7% 3.6% 9.2% 11.6%
Gas (incl. CCS) 1.0% 6.1% 1.0% 8.0%
Nuclear 11.7% 28.0% 13.9% 26.0%
Hydro power 7.7% 11.2% 8.5% 14.0%
Wind 23.0% 21.0% 24.0% 19.0%
Solar 44.2% 20.6% 40.7% 12.4%
Biomass (incl. CCS) 3.5% 8.3% 1.8% 4.7%
Others 0.2% 0.4% 0.3% 0.2%
Moreover, we find that the generation pathways from conventional coal mainly depends on emission constraints, or the stringency of climate targets. Therefore, across the range of different energy demand as well as technological assumptions that we tested, coal generation pathways have small variation and show largely consistent trends (see Models and Scenarios in Technical Appendix).
With these national generation pathways, we then develop two phaseout scenarios of coal plants based on different assumptions about changes in operating hours and lifetime. One focuses on constant utilization of plants, and another relaxes this requirement to allow some plants to operate at lower levels of generation before retirement.
Importantly, the retirement pathways suggested by this analysis depend on an immediate halt of new construction of conventional coal plants in China. Our analysis focuses on operating units only, but we also recognize that a total of 121 GW of coal plants are currently under construction and 74 GW planned20, in addition to the 160 GW of projects that have been suspended by the central government through a series of policies since 2016.21 Building these new coal plants would largely increase the risk of stranded assets and
shorten the lifetimes of all coal units—by 5 years when completing projects under construction and by 10 years when completing projects that are planned or under construction.22
4.2 RETIREMENT PATHWAY 1: CONSTANT UTILIZATION OF COAL PLANTS
The first scenario, constant utilization, assumes all units will continue to operate at today’s utilization level until they are retired. The retirement schedule will follow the plant-by-plant scoring system starting from the lowest to highest of the combined score, in a deep decarbonization pathway consistent with the national generation constraint.
Under this scenario, the rate at which bottom-up individual coal plant retire matches the national coal power generation decline from the models. Specifically, more than 90% of conventional coal plants will retire by 2040 and 2050 under the 1.5°C and well-below-2°C

21 A HIGH AMBITION COAL PHASEOUT IN CHINA
4 ALTERNATIVE RETIREMENT PATHWAYS
targets, respectively. However, due to technical, economic and environmental consideration in different provinces, coal plants in certain provinces are phased out faster than others (Figure 9). For example, the majority of existing plants in Shandong, Shanxi, and Inner Mongolia will retire by 2035 under the 1.5°C
scenario due to a combination of their poor technical attributes, low profitability, and high environmental impacts. By contrast, plants in Anhui and Jiangsu tend to perform better across all dimensions, and therefore the majority will not phase out until 10 years’ later by 2045.
FIGURE 9. National and provincial coal capacity pathways under constant utilization.
The retirement schedule will follow the plant-by-plant scoring system starting from the lowest to highest of the combined score. More than 90% of conventional coal plants will retire by 2040 and 2050 under the 1.5°C and well-below-2°C targets, respectively. Coal plants in certain provinces are phased out faster, such as Shandong, Shanxi, and Inner Mongolia.
Higher 2oC
Well-below 2oC
1.5oC
Target

22A HIGH AMBITION COAL PHASEOUT IN CHINA
4 ALTERNATIVE RETIREMENT PATHWAYS
4.3 RETIREMENT PATHWAY 2: GUARANTEED LIFETIME OF COAL PLANTSThe second scenario, guaranteed lifetime, assumes a policy regime in which most existing coal plants—except for the low-hanging fruit—are allowed to operate through a minimum lifetime of 20 or 30 years; however, to meet the same national generation constraints, these plants will need to operate at gradually reduced utilization levels.
Specifically, the minimum operational lifetime is defined as 30 years under the well-below-2°C scenario and 20 years under the 1.5°C scenario. These thresholds are chosen because they tend to be highly relevant to investment decision-making and government policy-making. Chinese coal power plants typically have a 30-year designed lifetime of operation and a 20-year depreciation period.23 Reaching the designed lifetime or at least the financial depreciation time can help alleviate the immediate financial burden to the project developers and investors.
It is clear that, under the constant utilization scenario, the majority of coal plants must retire before reaching the guaranteed lifetimes and at younger ages for the more stringent climate target (Figure 10a and Figure 10c). In contrast, most plants are allowed to extend their operational lifetimes under the guaranteed lifetime scenario (Figure 10b and Figure 10d). As a result, the national retirement pathways of coal plants are delayed by about 5 years during the next few decades until towards the phaseout year—2040 and 2050, under the 1.5°C and the well-below-2°C scenario, respectively. However, the regional impact can be highly variable. About half of the provinces including Jiangsu and Zhejiang show less than three years’ difference in terms of the two retirement pathways, while a few
other provinces including Xinjiang, Shanxi, Shandong, Shaanxi and Gansu show about 10 years of delay in the retirement pathway with the guaranteed lifetime and reduced utilization. (Figure 11a). This is because some of the newest plants are retired based on other non-age-related criteria under the constant utilization scenario. These are, for instance, self-use plants in Xinjiang, unprofitable plants in Gansu and Shanxi, plants located in highly polluted and populated area in Shandong. With the guaranteed lifetime, plant age plays a larger role in determining the retirement order, and these plants can get a longer lifetime extension than others.
The t rade-off for the guaranteed l i fe t ime and corresponding delayed retirement of coal plants is that the coal plants must operate at gradually reduced operating hours, given a fixed generation pathway to meet the climate target. Under the well-below-2°C scenario, operating hours on average will be reduced from today’s 4,350 hours to 3,750 hours in 2030, 2,500 hours in 2040, and below 1,000 hours in 2050. Under the 1.5C scenario, it will be reduced to 2,640, 1680, and zero hours in 2030, 2040 and 2045, respectively. (Figure 11b). Moreover, across all provinces, coal plants located in about half of the country will be operating below 2,000 hours by 2040 under 1.5°C. It indicates that by then a large portion of coal plants will be used for load-following and peaking service only, which would require additional investment to retrofit these plants for higher flexibility.
Units that want to operate at longer hours or continue operating beyond the phaseout schedule will need to be equipped with CCS. While most provinces in China are estimated to have sufficient CO2 storage potential, there are several coastal provinces have limited storage capacity.24 About 86 GW of early retired coal plants in Guangdong, Fujian, Guangxi, and Hainan, are not viable candidates for CCS retrofitting. Moreover, when retrofitted with CCS, coal plants suffer about 30% parasitic loss of efficiency. 25

23 A HIGH AMBITION COAL PHASEOUT IN CHINA
4 ALTERNATIVE RETIREMENT PATHWAYS
FIGURE 10. Unit Lifetimes under “Constant Utilization” (Left) and “Guaranteed Lifetime” (Right) scenarios, for both 2°C (top) and 1.5°C (bottom) pathways.
Under the constant utilization scenario, the majority of existing coal plants will be retired before reaching the designed lifetime of 30 years under well-below-2°C (a) and at younger ages for the more stringent 1.5°C target (c). Alternatively, all plants, except for the low-hanging fruit, are guaranteed to operate through a minimum lifetime—specifically, 30 years under the well-below-2°C scenario (b) and 20 years under the 1.5°C scenario (d). Note: the scale (y-axis) of the guaranteed lifetime and constant utilization figures is not the same –80GW vs. 400GW.
Guarantee a minimum of
30 years’ lifetime
Guarantee a minimum of
20 years’ lifetime
Constant utilization
1.5°CConstant utilization
Well-below 2°C Guaranteed lifetime
Guaranteed lifetime
a
c
b
d

24A HIGH AMBITION COAL PHASEOUT IN CHINA
4 ALTERNATIVE RETIREMENT PATHWAYS
FIGURE 11. National and provincial phaseout pathways and gradually reduced operating hours under a guaranteed lifetime scenario.
(a) Compared to the constant utilization scenario, national retirement pathways are delayed by about 5 years; regional impact varies largely across provinces. (b) Due to the delayed retirement of coal plants, remaining capacity must operate at gradually reduced hours.
a
b
Constant utilization
Guaranteed lifetime
1.5oC
Well-below 2oC
Target
Scenario
● ●
●
●
●
●
●
● ●
●
●
●
●
●
●
0
2000
4000
6000
8000
2020 2030 2040 2050Year
Ope
ratin
g ho
urs
per y
ear
ScenarioConstant utilization Guaranteed lifetime
Target● ● ●Well-below-2oC 1.5oC Historical

5. POTENTIAL IMPACTS
25 A HIGH AMBITION COAL PHASEOUT IN CHINA

26A HIGH AMBITION COAL PHASEOUT IN CHINA
5 POTENTIAL IMPACTS
An accelerated coal phaseout in China, even if done carefully, would have implications for grid management, economic impact in terms of stranded assets, social impact in terms of employment,
and ret i rement of assets for large power companies. These are important but complicated issues whose management will require discussion and judgment on the part of policy authorities
and technical experts. Here, we use simplified metrics to quantify the magnitude and distribution of these impacts.
5.1 GRID MANAGEMENT FOR STABILITY A successful coal phaseout pathway can ensure grid stability. As discussed above, reducing coal generation while reducing carbon emissions will require larger contributions from non-emitting electricity sources. Wind and solar power are expected to be key contributors to China’s future mix. Power generation from wind and solar will range from 18% to 43% across the six Chinese regional grids in 2030 under the 2°C scenario (Table 3). As a point of comparison, already in 2018, this percentage was 25% in Germany and 21% in the United Kingdom.26 This demonstrates that these numbers are achievable, with 10 more years of development in grid
technology and management in China.
Under long-term deep decarbonation pathways, the generation contributions from intermitent wind and solar power will continue to grow, and in most grids, could exceed 50% or more of total generation by 2050. In particular, it may exceed 70% in the North China grid and the Northwest China grid (Table 3). This would depend on contributions not only from wind and solar, but a lso f rom sources such as nuclear power, geothermal, and fossil or bioenergy with CCS. Moreover, wind and solar power are variable generation sources. An important consideration is therefore grid management and stability at the higher levels of intermittent generation associated with the coal retirements strategy in this study.
Regional grids2030 2040 2050
1.5°C 2°C 1.5°C 2°C 1.5°C 2°C
Central China Grid 46% 32% 54% 48% 48% 48%
China Southern Power Grid 47% 32% 53% 46% 51% 47%
East China Grid 55% 32% 61% 50% 57% 51%
North China Grid 66% 41% 72% 65% 71% 67%
Northeast China Grid 39% 18% 54% 42% 53% 51%
Northwest China Grid 63% 43% 75% 65% 70% 65%
TABLE 3. Percentage of intermittent wind and solar power generation (without storage), by regional grid.
5 POTENTIAL IMPACTS

27 A HIGH AMBITION COAL PHASEOUT IN CHINA
5 POTENTIAL IMPACTS
Management of intermit tent generat ion at high penetrations is not unique to China. Solar, wind, and battery storage costs have fallen dramatically in recent years and are expected to fall still further. As countries develop strategies to reduce emissions, they are increasingly looking to wind and solar power to supply much of their future electricity. Studies consistently show contributions of well over 50% of generation are viable but will require substantial evolution of grid management approaches.27,28 This includes some amount of reliable generation capacity to complement the renewables. It may also include the curtailment of excess renewable power, incorporation of battery or other forms of storage, demand flexibility, and long-distance transmission.
The coal retirement strategy elucidated in this report will therefore need to be complemented with forward-looking grid management plans and investments. A deeper assessment of this question is essential to a successful coal transition in China and needs to be answered by future research and policy discussions.
5.2 EQUITY: ECONOMIC AND SOCIAL IMPACTS
A successful coal phaseout pathway also needs to be equitable, whereby the economic and social impacts are not shouldered only by one region or group. We estimate the national and provincial stranded assets of coal plants’ early retirement, impacts on their future profits, employment across provinces, as well as the retirement rates across the major Chinese power companies.
Economic impacts: stranded assets and profit reduction
Stranded assets are defined as economic losses caused by retirement of assets. It includes unrecovered initial investments and unpaid expected return between the retirement year and the end of the 30-year design lifetime (see Calculation of stranded assets in Technical Appendix for more details).29
We find that the guaranteed lifetime of coal plants scenario significantly lowers total national stranded assets compared to the constant utilization scenario; specifically, from 889 billion yuan (~$127 billion) to 241 billion yuan (~$34 billion) under 1.5°C, and from 244 billion yuan (~$35 billion) to 65 billion yuan (~$9.3 billion) under well-below-2°C (Figure 12a). By definition, the vast majority of plants, about 90% of total capacity, will not be stranded under well-below-2°C with the 30-year guaranteed lifetime and will be able to fully recover initial investments under 1.5°C with the 20-year guaranteed lifetime. Overall, our estimates of stranded assets tend to be lower than previous studies30,31 mainly because: first, shorter operational lifetime (30 years) is assumed for existing Chinese coal plants; second, specific policy designs for a more gradual phaseout lowers the risk of early retirement; and third, future plants are not included in the analysis (Supplementary Table S4 in Technical Appendix for comparison with the literature).
The trade-off for the avoided stranded assets in the guaranteed lifetime scenario is that the coal plants might earn less profits during the operation period because they must gradually reduce utilization. When holding electricity and coal prices constant, coal plants operating at reduced level will lower future profits by 451 billion yuan (~$64 billion) under 1.5°C and 357 billion yuan (~$51 billion) under well-below-2°C (Figure 12a). Therefore, between the two phaseout scenarios, there is a trade-off between lowering stranded assets and avoiding profit reduction at the national level. That is, the guaranteed lifetime scenario can significantly lower stranded assets, while simultaneously reducing future profits, and vice versa for the constant utilization scenario. However, a large amount of assets stranded over a short period of time tends to impact not only the investors but also the financial system overall. On the other hand, income reduction due to lower generation can potentially be compensated through a transitional support mechanism for providing peaking services to the grid (see the chapter of Policy Discussion).
Across provinces, stranded assets tend to be highest in Shandong, Xinjiang, Inner Mongolia, Shanxi, and Henan across both phaseout scenarios and under both climate targets (Figure 12b and Supplementary Figure S9 in Technical Appendix). For most provinces, the same

28A HIGH AMBITION COAL PHASEOUT IN CHINA
5 POTENTIAL IMPACTS
trade-off between lowering stranded assets and avoiding profits reduction exists when comparing the two phaseout scenarios. However, for a few others like Xinj iang, the guaranteed l i fet ime scenar io wi l l
significantly lower stranded assets while only slightly reduce future profits, and hence tends to be a more favorable option compared to the constant utilization scenario.
a
b
FIGURE 12. National and provincial direct economic impacts of coal plants phaseout.
(a) With a guaranteed lifetime, national total stranded assets are significantly reduced compared to constant utilization, but total future profits also decline due to reduced operating hours. (b) Under 1.5°C, stranded assets tend to be highest in Shandong, Xinjiang, Inner Mongolia, Shanxi, and Henan across all both phaseout scenarios assessed.
889
241 244
65
3534
3083
52784921
Stranded Assets Future Profits
1.5°C well-below-2°C 1.5°C well-below-2°C0
1000
2000
3000
4000
5000
6000
0
200
400
600
800
1000
Bill
ions
RM
B
Constant utilization Guaranteed lifetime
Future Profits under 1.5°C
Stranded Assets under 1.5°C
Sha
ndon
gX
injia
ngIn
ner M
ongo
liaS
hanx
iH
enan
Heb
eiS
haan
xiJi
angs
uG
uang
dong
Nin
gxia
Liao
ning
Gan
suA
nhui
Jilin
Hei
long
jiang
Gui
zhou
Gua
ngxi
Zhej
iang
Tian
jinH
ubei
Fujia
nC
hong
qing
Sic
huan
Qin
ghai
Hun
anYu
nnan
Jian
gxi
Sha
ngha
iH
aina
n
0
50
100
150
0
100
200
300
400
Province
Bill
ions
RM
B
Constant utilization Guaranteed lifetime

29 A HIGH AMBITION COAL PHASEOUT IN CHINA
5 POTENTIAL IMPACTS
Social impacts: employment across provinces
We estimate total employment of coal power plants in each province to assess the potential social impacts of a coal phaseout strategy. Overall, smaller and older plants, especially those implemented before 2007, have larger number of workers per unit of capacity. Shandong province has the largest employment in the coal power industry, almost 50% higher than Inner Mongolia despite similar total capacity. Heilongjiang and Jilin also have a relatively large number of people working at smaller and older coal plants, even though total capacity in these provinces is low.
Although employment at coal power plants is only a marginal share of total population (less than 0.1% in most provinces), impacts at the local level could be much higher. As coal plants retire at a faster pace, the resettlement of workers, if not carefully planned and managed, could cause serious disruption to local communities. Transition management can benefit both the individuals and the communities as a whole, such as investing in education and occupational training programs to help younger workers continue to work at power plants with different technologies (i.e. solar and wind), offering retirement incentives to older employees, and providing economic stimulation packages to diversify the local economy.
FIGURE 13. Total employment of coal power plants, by province.
Older plants implemented before 2007 tend to have a much larger number of workers per unit of capacity. Shandong province has the largest employment in the coal power industry, almost 50% higher than Inner Mongolia with similar total capacity. Heilongjiang and Jilin also have relatively large numbers of people working at older coal plants despite the small total capacity in these provinces.
55,4
60
39,2
98
37,8
14
30,0
59
28,3
81
23,0
90
22,2
89
19,5
20
16,8
16
16,3
90
16,2
01
15,5
10
14,3
70
12,6
78
11,4
78
10,3
36
9,59
2
9,45
0
8,86
0
7,70
0
6,44
0
6,28
1
5,59
0
5,38
0
5,16
1
4,98
7
4,10
0
1,28
0
760
SH
AN
DO
NG
JIA
NG
SU
INN
ER
MO
NG
OLI
A
HE
NA
N
SH
AN
XI
XIN
JIA
NG
GU
AN
GD
ON
G
HE
BE
I
ZH
EJI
AN
G
LIA
ON
ING
SH
AA
NX
I
AN
HU
I
HE
ILO
NG
JIA
NG
GU
IZH
OU
HU
BE
I
JILI
N
GA
NS
U
NIN
GX
IA
FU
JIA
N
HU
NA
N
JIA
NG
XI
GU
AN
GX
I
YU
NN
AN
CH
ON
GQ
ING
SIC
HU
AN
SH
AN
GH
AI
TIA
NJI
N
QIN
GH
AI
HA
INA
N

30A HIGH AMBITION COAL PHASEOUT IN CHINA
5 POTENTIAL IMPACTS
Equity across major power companies
We look at the retirement rates across the top five state-owned power companies in China. Together, China Energy Investment Corporation (China Energy), China Huaneng Group Corporation Ltd. (Huaneng), China Datang Corporation Ltd. (Datang), China Huadian Corporation Ltd. (Huadian), and State Power Investment Corporation Ltd. (SPIC) own more than half of the operating coal power generation capacity in 2019. Other enterprises—including the state-owned (SOE) and others—own the remaining 45% (Figure 14a).
Among the top-five corporations, Datang’s coal plants tend to retire most rapidly. By 2040 under a well-below-2°C pathway, Datang will shut down 80% of current coal capacity under the constant utilization scenario (Figure 14b) and 63% under the guaranteed lifetime scenario (Figure 14c), respectively. In comparison, China Energy will retire 61% and 45%, respectively. Guaranteed lifetime delays all companies’ coal retirement, but it benefits SPIC, the other SOEs, and other private companies even more. Similar trends are found for 1.5°C but with faster retirement for all (Supplementary Figure S10 in Technical Appendix).
FIGURE 14. Coal plants’ retirement speed by the top-five largest power companies.
Market share of existing coal power capacity (a): The top-five largest power companies own more than half of the national total. Percentage of existing capacity retirement under well-below-2°C, with constant utilization (b) and guaranteed lifetime (c): Datang’s coal plants tend to retire most rapidly among the “big five”.
a
b c
17%
12%
10%
10%6%
33%
12%
China EnergyHuanengDatangHuadianSPICOther SOEsOthers
10%
45%
94%
20%
53%
98%
16%
63%
97%
18%
49%
93%
11%
44%
96%
13%
40%
96%
13%
39%
96%
2030 2040 2050
20%
61%
95%
26%
65%
99%
35%
80%
99%
28%
62%
96%
19%
69%
100%
25%
70%
98%
29%
71%
100%
2030 2040 2050

6. POLICY DISCUSSION
31 A HIGH AMBITION COAL PHASEOUT IN CHINA

32A HIGH AMBITION COAL PHASEOUT IN CHINA
6 POLICY DISCUSSION
Today, China faces challenges in the rapid transition to a clean energy system that will serve its economy, its people, its ecological health, and the global environment. Fortunately, China has successfully managed rapid and effective infrastructure build out in the past, and implementing this energy transition today will provide multiple benefits in providing clean air for citizens in urban areas, economic growth distributed across provinces, and enhanced domestic industry based on technologies with strong domestic manufacturing and export markets tomorrow and for decades to come.
In addition, China's emerging leadership role as one of the world's largest economies extends to its leadership on climate change. Other countries are looking to China as a model for how to implement sustainable and ecologically friendly development that also keeps warming under 1.5°C. All countries around the world are vulnerable to climate impacts, including China—and global efforts to reduce emissions hinge on China’s success in achieving its own rapid clean energy transition.
In this light, the global understanding of both what is necessary—and what is possible—has changed rapidly in the past five years. Previously, countries planned around a 2°C goal. Now, due to recent research, countries understand that 1.5°C is the necessary goal, as the consequences of even 1.5°C warming are more severe and immediate than most people understood before.
At the same time that these expectations for what
is necessary have changed, expectations for what is possible have also changed. The dramatic and surprising decrease in renewable energy costs, and the rapid improvements in other technological aspects of clean energy, has created a very different set of investment opportunities that allow for more rapid transitions than imaged around the time of negotiating the Paris Agreement. At the same time, political support for moving to clean energy has increased as citizens and experts become more aware of both the benefits of clean energy and the risks of older forms of energy.
This backdrop sets forth a potential path for China’s energy system. It is now well recognized globally that China’s decisions about its fleet of coal-fired power plants will determine whether there is global success in reaching a 1.5°C pathway. In addition, as demonstrated in this report, success will require a more rapid phasedown of coal-fired electricity generation in China than the conventional wisdom from a few years ago had expected.
At the same time, this report also demonstrates how this transition is now possible for China. Recognizing the importance of a transition that still enables economic vitality and growth, and utilizing some of the best analytical tools available, we outline in this report that a rapid coal phaseout in China that is compatible with 1.5°C is possible. Specifically, it shows how such a pathway can be achieved in a systematic way that allows an appropriately paced retirement strategy for individual plants that simultaneously maintains power stability and economic security.

33 A HIGH AMBITION COAL PHASEOUT IN CHINA
6 POLICY DISCUSSION
Our key findings show:
● China can achieve a 2°C compatible coal power phaseout by 2050-2055 with little economic impact. A more ambitious 1.5ºC phaseout by 2040-2045 is also feasible with a carefully designed retirement plan and a financial compensation mechanism.
● Any new construction of conventional coal plants is not in line with China’s long-term deep decarbonization pathways. A total of 121 GW of coal plants are currently under construction and 74 GW planned, in addition to the 160 GW suspended. Building these new coal plants would largely increase the risk of stranded assets and shorten the lifetimes of all coal units.
● We identified 18% of existing power plants, or a total of 112 GW of capacity, as low-hanging fruit that need a rapid retirement in the near-term. These plants often have operated for more than 10 years, have a smaller size less than 600 MW, and use the less efficient subcritical combustion technologies. Self-use plants have a larger share identified as low-hanging fruit than power only and CHP plants. Across provinces, more than 60% of these plants, a total of 68 GW, are located in Shandong, Inner Mongolia, Henan, Hebei, Jiangsu and Shanxi. Moreover, Hebei, Heilongjiang, Shanghai, and Shandong have a larger percentage, more than 20% of capacity, identified as low-hanging fruit (Table 1).
● The roadmap for retirement compatible with a well-below-2°C goal is based on an immediate halt to new construction of conventional coal plants, near-term retirement of low-hanging fruit, and then a gradual retirement of remaining plants based on their retirement rank score but with a minimum operational lifetime of 30 years. Applying this guaranteed lifetime will lower the average operating hours from today’s 4,350 hours to 3,750, 2,500, and below 1,000 hours in 2030, 2040 and 2050, respectively, if not retrofitting for CCS (Figure 11).
● The roadmap for retirement compatible with a 1.5°C goal reduces the guaranteed lifetime to 20 years. Operating hours on average will decline to 2,640, 1,680 and zero hours in 2030, 2040, and 2045, respectively. Plants that want to operate at longer hours or continue operating beyond the phaseout schedule will need to be equipped with CCS, which, however, may not be viable for about 86 GW of early retired coal plants in Guangdong, Fujian, Guangxi, and Hainan provinces due to lack of onshore storage capacity.
● Compared to alternative policy design, the retirement roadmaps described above with the guaranteed lifetimes of coal plants lower total stranded assets to about 241 billion yuan (~$34 billion) under 1.5°C and 65 billion yuan (~$9.3 billion) under well-below-2°C. However, the trade-off for the avoided stranded assets is that the coal plants will earn less profits during the operation period due to reduced utilization, by 451 billion yuan (~$64 billion) under 1.5°C and 357 billion yuan (~$51 billion) under well-below-2°C. Across provinces, stranded assets are highest in Shandong, Xinjiang, Inner Mongolia, Shanxi, and Henan (Figure 12).

34A HIGH AMBITION COAL PHASEOUT IN CHINA
6 POLICY DISCUSSION
Principles of A Successful Strategy
These results speak clearly that rapid coal phaseout in China is possible, at a critical juncture where the world is looking to China for leadership in the global economy, on the clean energy transition, and on climate change. A successful and feasible strategy based on the insights from this report can be implemented based on three principles:
1. No New Coal. Successful implementation of the 2°C- and 1.5°C-compatible coal phaseout pathways proposed in this report depends on an immediate halt to new construction of conventional coal plants in China. Deciding not to build planned or under-construction plants will avoid stranding valuable investments and will give existing plants more flexibility to phase out at an appropriate pace.
2. Eliminate the Laggards. We identify a small set of existing units that are eligible for faster shut-down based on multiple technical, economic and environmental criteria —for example, they are old, small, inefficient and dirty.
3. Guaranteed Lifetime. Remaining existing units can be offered a guaranteed lifetime with gradually and responsibly reduced hours. The proposed pathways are designed for a gradual retirement that gives time to install new generation and modernize the electricity grid to take on a greater share of wind and solar. A phaseout is based on multiple assessment criteria such as energy stability of the grid, minimizing provincial economic disparity, and providing immediate health benefits to citizens.
35 A HIGH AMBITION COAL PHASEOUT IN CHINA
6 POLICY DISCUSSION
Complementary Policies
Achieving this impressive and feasible goal will require strong partnerships and new policy from the government. Entering the 14th five-year plan period, implementation of this phase out will require near-term conversations and decisions on implementation of a set of complementary policies.
Transition financial support. Providing financial support and other compensation mechanisms may facilitate reduced electricity generation. With the guaranteed lifetime, most of the existing Chinese coal plants can operate over the designed lifetime of 30 years for a 2°C pathway, and get initial investments paid back by running for 20 years for a 1.5°C pathway. Under such a strategy, the main drivers of potential economic impacts to plants are operating at reduced hours and/or not further extending the operation period. When coal plants running at reduced hours to support large-scale renewable energy in the system, a limited-duration subsidy or load-adjusting price may in certain circumstances be appropriate, as has been seen in other countries. Any such financial compensation mechanism should be limited to currently existing plants to discourage new construction.
Continued Market Reform. Ongoing power sector reforms and switching to market-based dispatch mechanisms is a key component of this transition. Market-based dispatch will support accelerated renewable generation by allowing the most cost-competitive resources to be prioritized. Meanwhile, it would remove the hidden protections that have shielded the coal plants from unfavorable market conditions and policy signals that would otherwise have shut them down.
Grid Planning and Modernization. China has a mismatch of renewable resources in the north and west that are distant from the high energy demand regions in eastern coastal provinces. Long-distance and ultra-high voltage (UHV) transmission technologies are potentially part of the solution, but after a decade of fast development, UHV lines have not performed as expected.32 Moreover, accommodating a large amount of intermittent electricity from wind and solar would require substantial grid management and forward planning. In the long run, modernizing grid transmission and distribution, developing next-generation storage and other flexibility technologies, and deploying demand-side management technologies are promising solutions but will require additional investments and R&D resources from both the public and private sectors.
This report outlines options for what this high-ambition coal phaseout pathway would look like across all existing units. It sets forth a three-part strategy that can guide conversations in the future. This research provides evidence for achieving deep decarbonization in China’s power system and informs both policy and investment decision-making.
China’s long-term development strategy is highly consistent with the global agenda and the long-
term climate goals. Although it is not yet clear what China’s long-term climate mitigation strategy might look like exactly, the political environment has changed significantly in the past few years. It shows that China has chosen to move towards these pathways. In this light, China has great potential to eventually achieve these goals through a structured and rapid coal retirement plan.

36A HIGH AMBITION COAL PHASEOUT IN CHINA
REFERENCE 1. IPCC, Global warming of 1.5°C. (Geneva: Intergovernmental Panel on Climate Change, 2018).
2. Cui, R.Y., Hultman, N., Edwards, M.R. et al. Quantifying operational lifetimes for coal power plants under the Paris goals. Nat Commun 10, 4759 (2019) doi:10.1038/s41467-019-12618-3
3. Global Coal Plant Tracker, Global Energy Monitor, July (2018).
4. Mills, A. D., Wiser, R. H., & Seel, J. Power Plant Retirements: Trends and Possible Drivers (No. LBNL-2001083). Lawrence Berkeley National Lab. (LBNL), Berkeley, CA (United States), (2017).
5. Li, J., Yang, Z., & Li, X. China coal consumption cap plan and research report: The 13th Five-Year Plan Coal Cap Mid-term Review and Outlook. China Coal Cap Project (NRDC), China, April (2019).
6. Press Statement on Climate Change following the Meeting Between the State Councilor and Foreign Minister of China, Foreign Minister of France and the United Nations Secretary-General, June (2019)https://www.un.org/sg/en/content/sg/note-correspondents/2019-06-29/press-statement-climate-change-following-the-meeting-between-the-state-councilor-and-foreign-minister-of-china-foreign-minister-of-france-and-the-united
7. Tong, D., Zhang, Q., Davis, S.J. et al. Targeted emission reductions from global super-polluting power plant units. Nat Sustain 1, 59–68 (2018) doi:10.1038/s41893-017-0003-y
8. Gray, M., Ljungwaldh, S., Watson, L., & Kok, I. Powering down coal: Navigating the economic and financial risks in the last years of coal power. Carbon Tracker, November (2018).
9. Yuan, J., Hu, Z., & Zhang, W. Economic research on China's coal-fired power generation project. Coal and Electricity Economic Research Group in North China Electric Power University, China, April (2016).
10. Spencer, T., Berghmans, N., & Sartor, O. Coal transitions in China’s power sector: A plant-level assessment of stranded assets and retirement pathways. IDDRI, France, Paris, November (2017).
11. Global Coal Plant Tracker, Global Energy Monitor, January (2019).
12. State of Global Coal, http://stateofglobalcoal.org/, May (2019)
13. China Electric Power Industry Annual Development Report 2019, China Electricity Council (CEC), (2019).
14. National Development and Reform Commission (NDRC). 2016. Policies on CHP management. Accessed from: http://www.gov.cn/zhengce/2016-05/24/content_5076252.htm (In Chinese)
15. Fleischman, L., Cleetus, R., Deyette, J., Clemmer,S,& Frenkel, S. Ripe for retirement: An economic analysis of the US coal fleet. The Electricity Journal 26(10): 51-63 (2013).
16. Tang, L., Qu, J., Mi, Z., Bo, X., Chang, X., Anadon, L. D., ... & Zhao, X. Substantial emission reductions from Chinese power plants after the introduction of ultra-low emissions standards. Nature Energy, 4(11), 929-938 (2019).
17. Xue, T., Zheng, Y., Tong, D., Zheng, B., Li, X., Zhu, T., & Zhang, Q. Spatiotemporal continuous estimates of PM2. 5 concentrations in China, 2000–2016: A machine learning method with inputs from satellites, chemical transport model, and ground observations. Environment International, 123: 345-357 (2019).
18. Center for International Earth Science Information Network (CIESIN), Columbia University. Gridded Population of the World, Version 4 (GPWv4): Population Density Adjusted to Match 2015 Revision of UN WPP Country Totals, Revision 11. Palisades, NY: NASA Socioeconomic Data and Applications Center (SEDAC). (2018) https://doi.org/10.7927/H4F47M65.
19. Gassert, F., M. Luck, M. Landis, P. Reig, and T. Shiao. “Aqueduct Global Maps 2.0.” Working Paper. Washington, DC: World Resources Institute (2013). https://www.wri.org/resources/data-sets/aqueduct-global-maps-20.
20. Global Coal Plant Tracker, Global Energy Monitor, July (2019).
21. 关于推进供给侧结构性改革防范化解煤电产能过剩风险的意见 (2017) http://news.bjx.com.cn/html/20170804/841506.shtml

37 A HIGH AMBITION COAL PHASEOUT IN CHINA
22. Cui, R.Y., Hultman, N., Edwards, M.R. et al. Quantifying operational lifetimes for coal power plants under the Paris goals. Nat Commun 10, 4759 (2019) doi:10.1038/s41467-019-12618-3
23. Yuan, J., Zhang, W., Zeng, Y., Guo, X., & Zhou, Y. Estimating stranded assets in China’s coal power sector. School of Economics and Management, North China Electric Power University, China, Beijing (2019).
24. Yu, S., Horing, J., Liu, Q., et al. CCUS in China’s mitigation strategy: insights from integrated assessment modeling. International Journal of Greenhouse Gas Control, 84, 204-218 (2019).
25. Supekar and Skerlos, Reassessing the Efficiency Penalty from Carbon Capture in Coal-Fired Power Plants. Environ. Sci. Technol. 49: 12576−12584 (2015)
26. BP Statistical Review of World Energy 2019.
27. Charles Teplin, Mark Dyson, Alex Engel, & Grant Glazer. “The Growing Market for Clean Energy Portfolios: Economic Opportunities for a Shift from New Gas-Fired Generation to Clean Energy Across the United States Electricity Industry.” Rocky Mountain Institute, 2019. https://rmi.org/cep-reports
28. Miller, N.W., Shao, M., Pajic, S. & D’Aquila, R. “Western Wind and Solar Integration Study.” General Electric, subcontract report for National Renewable Energy Laboratory (2014). https://www.nrel.gov/docs/fy15osti/62906.pdf
29. Yuan, J., Zhang, W., Zeng, Y., Guo, X., & Zhou, Y. Estimating stranded assets in China’s coal power sector. School of Economics and Management, North China Electric Power University, China, Beijing (2019).
30. 袁家海 , 张为荣 . 发电计划放开、煤电“去补贴”与搁浅资产处置 . Natural Resources Defense Council (2017).
31. Caldecott, B., Dericks, G., Tulloch, D. J., Liao, X., Kruitwagan, L., Bouveret, G. & Mitchell, J. Stranded Assets and Thermal Coal in China: An analysis of environment-related risk exposure. Smith School of the Enterprise and the Environment, University of Oxford, February (2017).
32. Downie, E. Sparks fly over ultra-high voltage power lines (2018). https://www.chinadialogue.net/article/show/sin-gle/en/10376-Sparks-fly-over-ultra-high-voltage-power-lines
37 A HIGH AMBITION COAL PHASE OUT IN CHINA

排 版 印 制 / 136 7111 7637