Insulin resistance and cancer: the role of insulin and insulin-like ...

A Hierarchical Whole-body Modeling
Approach Elucidates the Link between in Vitro
Insulin Signaling and in Vivo Glucose
Homeostasis
Elin Nyman, Cecilia Johansson, Robert Palmér, Jan Brugard,
Fredrik Nyström, Peter Strålfors and Gunnar Cedersund
Linköping University Post Print
N.B.: When citing this work, cite the original article.
This research was originally published in:
Elin Nyman, Cecilia Johansson, Robert Palmér, Jan Brugard, Fredrik Nyström, Peter Strålfors
and Gunnar Cedersund, A Hierarchical Whole-body Modeling Approach Elucidates the Link
between in Vitro Insulin Signaling and in Vivo Glucose Homeostasis, 2011, Journal of
Biological Chemistry, (286), 29, 26028-26041.
http://dx.doi.org/10.1074/jbc.M110.188987
© the American Society for Biochemistry and Molecular Biology
http://www.asbmb.org/
Postprint available at: Linköping University Electronic Press
http://urn.kb.se/resolve?urn=urn:nbn:se:liu:diva-70109

1
A hierarchical whole body modeling approach elucidates the
link between in vitro insulin signaling and in vivo glucose
homeostasis
Elin Nyman1,2
, Cecilia Brännmark1, Robert Palmér
1, Jan Brugård
2, Fredrik H
Nyström3, Peter Strålfors
1, Gunnar Cedersund
1,4
1 Department of Clinical and Experimental Medicine, Diabetes and Integrative Systems
Biology, Linköping University, SE58185 Linköping, Sweden 2 MathCore Engineering AB, SE58330 Linköping, Sweden
3 Department of Medical and Health Sciences, Linköping University, SE58185 Linköping,
Sweden 4 Freiburg Institute of Advanced Sciences, School of Life Sciences, Germany
Running title: Multi-level modeling of glucose homeostasis
Corresponding authors:
Modeling: Gunnar Cedersund, Department of Clinical and Experimental Medicine,
Linköping University, SE58185 Linköping, Sweden, Phone: +46-702-512323, Fax:
+46-10 1034149, Email: [email protected]
Experimental: Peter Strålfors, Department of Clinical and Experimental
Medicine, Linköping University, SE58185 Linköping, Sweden, Phone: +46-10 1034315,
Fax: +46-10 1034149, Email: [email protected]
Keywords. Hierarchical modeling, insulin signaling, mathematical models, primary
adipocytes
Type 2 diabetes is a metabolic disease that
profoundly affects energy homeostasis. The
disease involves failure at several levels and
sub-systems, and is characterized by insulin
resistance in target cells and tissues, i.e., by
impaired intracellular insulin signaling. We
have earlier used an iterative experimental-
theoretical approach to unravel the early
insulin signaling events in primary human
adipocytes. That study, as most insulin
signaling studies, is based on in vitro
experimental examination of cells, and the in
vivo relevance of such studies for human
beings has not been systematically examined.
Herein, we develop a hierarchical model of the
adipose tissue, which links intracellular insulin
control of glucose transport in human primary
adipocytes with whole body glucose
homeostasis. An iterative approach between
experiments and minimal modeling allowed us
to conclude that it is not possible to scale up
the experimentally determined glucose uptake
by the isolated adipocytes to match the glucose
uptake profile of the adipose tissue in vivo.
However, a model that additionally includes
insulin effects on blood-flow in the adipose
tissue and GLUT4 translocation due to cell
handling can explain all data, but neither of
these additions is sufficient independently. We
also extend the minimal model to include
hierarchical dynamic links to more detailed
models (both to our own models and to those
by others), which act as sub-modules that can
be turned on or off. The resulting multi-level
hierarchical model can merge detailed results
on different sub-systems into a coherent

2
understanding of whole body glucose
homeostasis. This hierarchical modeling can
potentially create bridges between other
experimental model systems and the in vivo
human situation, and offers a framework for
systematic evaluation of the physiological
relevance of in vitro obtained
molecular/cellular experimental data.
The incidence of type 2 diabetes is rapidly
increasing in many parts of the world, to a large
extent the result of overeating and a sedentary life
style. The disease is characterized by
malfunctioning energy homeostasis, in particular
glucose homeostasis, which is due to both insulin
resistance in insulin responding tissues and to
insufficient insulin release by the pancreatic -
cells. Insulin controls the flow of energy
substrates between its target tissues – adipose,
muscle and liver –, during both eating and fasting
states, through the insulin signaling network.
Insulin signaling in adipocytes is of special
interest, as resistance of the adipose tissue
appears to influence other target tissues of the
hormone, in particular muscle and liver, to
become insulin resistant (1). This insulin
resistance in the target organs progresses to type
2 diabetes when the insulin producing -cells fail
to compensate by releasing more insulin. Energy
homeostasis is a complex process, involving
several layers of regulation, multiple organs,
different cell types, and many hormones and
metabolites. This complexity has hampered
progress towards understanding the pathogenesis
and treatment of the disease. This complexity is
also the main reason why mathematical modeling
increasingly is used as a tool to complement and
analyze experimental results when untangling
various biological sub-systems. Nevertheless,
while such modeling is mainstream in physics
and engineering, its application to biology and
medicine is still in its infancy.
Insulin signaling is initiated by insulin binding to
the insulin receptor (IR) (footnote 2), which has
been modeled to some extent (2-5). These
modeling efforts have considered nonlinear
behaviors such as cooperativity (4) and the effects
of more than one insulin molecule binding to the
IR (5). Binding of insulin leads to rapid
autophosphorylation and endocytosis of the
insulin-autophosphorylated insulin-IR complex,
and an increased receptor tyrosine protein kinase
activity towards downstream signal mediators
such as the insulin receptor substrate-1 (IRS1).
The dynamics of the IR-IRS1 interaction has also
been modeled (6,7) and we recently completed a
comprehensive and integrated
experimental/modeling-based analysis of the
early molecular events in IR signal transduction
(8). Therein, we sorted out the importance of
different possible feedback-mechanisms during
the first phase of the signaling, and concluded
that a negative feedback mechanism that requires
endocytosis of IR is an essential part of the first
five minutes of signaling. Notably, these
conclusions were drawn without relying on
known or uniquely estimated parameter values.
Furthermore, many other plausible mechanisms -
such as insulin degradation, competitive
inhibition, and endocytosis or feedbacks on their
own – could be rejected as sole mechanistic
explanations to the experimental observations.
Note that such rejections are strong conclusions
and at least as important as the ultimately
proposed model (8).
More downstream events in insulin signaling
have been less modeled, but one earlier model by
Sedaghat et al. (7) involves many of the most
studied signaling intermediates. However, the
model suffers from problems such as unrealistic
parameters and concentrations. There are also
some similarly detailed models that have been
developed using alternative frameworks, in
particular Boolean networks (9,10). Boolean
networks are good for preliminary modeling of a
system, but Boolean networks do not make use of
the full information content in data and cannot
accurately investigate neither gradual and
quantitative changes nor feedbacks and other
cyclic mechanisms. Regarding connection of
intracellular signaling with whole-body glucose
homeostasis, Chew et al. (11) have connected the
Sedaghat model (7) with a previously published
whole-body model (12). They link the two levels
simply by scaling up cellular glucose uptake to
the whole body level. A more detailed description
of that link is included in the multi-level model
by Kim et al. (13), but this model is based on
little data, especially compared with the high
complexity of the model. The discrepancy
between the complexity in the model by Kim et
al. and the information content in the data
severely limits the possibilities to validate the
model, and to use their modeling approach to
draw conclusions. Another potentially interesting
multi-level modeling initiative is the PhysioLab
platform, developed by the company Entelos

3
(14). This platform is, however, commercial and
therefore not available to the scientific
community. An interesting recent model by Dalla
Man et al. (15) describes whole-body glucose
homeostasis in an organ-based manner. The
glucose and insulin-fluxes in this model are
particularly interesting, as they are based on
virtually model-independent measurements in
more than 200 healthy human subjects. Notably, a
type 1 diabetes version of this model has been
accepted by the FDA as a possible replacement
for studies on animals when certifying certain
insulin treatments. The Dalla Man-model is
nevertheless of limited use for e.g. drug screening
or identification of drug targets, as it lacks
intracellular details regarding signaling and
metabolic pathways. In summary, existing models
for insulin signaling and whole-body glucose
homeostasis are either focusing on one level only
or are so over-parameterized that they fail to draw
the kind of strong conclusions that can be drawn
from minimal models and a hypothesis testing
approach.
Most modeling of energy homeostasis and insulin
signaling is, moreover, based on data obtained in
cell lines or animals, and the relevance of these
model systems for the true in vivo situation in
human beings is usually not known. Isolated
primary human cells from biopsies or surgery,
such as isolated adipocytes, arguably constitute a
highly relevant experimental model system to
study the molecular and cellular basis of human
physiology and human disease, such as type 2
diabetes. These model systems are nonetheless in
vitro models and the relation between an isolated
cell system and the same cells in the intact
organism, i.e. in vivo, has to be sorted out to fully
exploit the understanding and therapeutic
potential of experimental research at the
molecular/cellular level. Linking the two levels is
important in drug development, as the
intracellular level is where metabolic and other
types of dysfunctions occur and where drugs act,
while the whole-body level is where diseases are
manifested and clinical diagnosis is possible.
Herein, we extend our previously developed
parameter-free modeling approach (8) to a
hierarchical multi-level modeling framework,
which we use to link insulin signaling in isolated
human adipocytes with whole-body glucose
homeostasis. In this process we can reach strong
conclusions because of already published high-
quality data of the in vivo organ fluxes in
response to a meal (15). In our new modeling
framework these in vivo fluxes serve as
constraints to an adipocyte-based organ-model
and allow us to conclude (as opposed to just
propose) that in vitro insulin signaling and control
of glucose uptake in isolated adipocytes is
insufficient to explain the in vivo glucose uptake
profile of the adipose tissue. We also propose
mechanistic explanations for the observed
discrepancy, which are presented in a minimal
acceptable model. We also extend this minimal
model into a detailed hierarchical model where
differently detailed sub-modules of the insulin
signaling network can be turned on or off, and
which also allows for future inclusion of more
details, as new knowledge and data are obtained.
Our work demonstrates for the first time a
methodology to i) assess the physiological
relevance of molecular/cellular data obtained in
in vitro experimental model systems, and ii)
merge such data in an expandable and internally
consistent body of knowledge for whole-body
glucose homeostasis.
MATERIALS AND METHODS
Subjects - Informed consent was obtained from
all participating individuals, the procedures were
approved by the Regional Ethics Committee at
Linköping University and were performed in
accordance with the Declaration of Helsinki.
Abdominal subcutaneous fat was obtained, during
elective surgery with general anaesthesia, from
female patients recruited consecutively at the
Clinic of Obstetrics and Gynaecology at the
University Hospital in Linköping. The patients
were usually subjected to hysterectomy and they
were not diagnosed with diabetes.
Glucose uptake (see below) was determined at
0.5 mM 2-deoxy-glucose in adipocytes obtained
from subjects 39-76 years age (average 50 years)
with BMI 19.2 – 28.2 kg/m2 (average 23.0
kg/m2); and at 5 mM 2-deoxy-glucose from
subjects 35-74 years age (average 55 years) with
BMI 23.2 – 36.2 kg/m2 (average 27.2 kg/m
2)
We calculated % body fat from body mass index
(BMI), body weight, age and gender according to
(16), and thus obtained each individual´s volume
of adipose tissue. We then calculated the whole-
body glucose uptake in mg glucose/kg body
weight/min (same unit as in the Dalla Man model
(15)) by accounting for the adipose tissue volume
and the body weight of each subject.

4
Isolation and incubation of adipocytes -
Adipocytes were isolated from subcutaneous
adipose tissue by collagenase (type 1,
Worthington, NJ, USA) digestion as described
previously (17). Cells were washed in Krebs-
Ringer solution (0.12 M NaCl, 4.7 mM KCl, 2.5
mM CaCl2, 1.2 mM MgSO4, and 1.2 mM
KH2PO4) containing 20 mM HEPES, pH 7.40,
1% (w/v) fatty acid-free bovine serum albumin,
100 nM phenylisopropyladenosine, and 0.5 U/ml
adenosine deaminase with 2 mM glucose, at 37°C
on a shaking water bath (18). After overnight
incubation (18) cells were washed and incubated
with insulin (19).
Protein phosphorylation – The protein
phosphorylation data used was compiled from
previous (18,20) and unpublished work. In brief,
cell incubations were terminated by separating
cells from medium using centrifugation through
dinonylphtalate. To minimize postincubation
signaling modifications in the cells and protein
modifications, which can occur during
immunoprecipitation, the cells were immediately
dissolved in SDS and -mercaptoethanol with
protease and protein phosphatase inhibitors,
frozen within 10 sec, and thawed in boiling water
for further processing (17). Equal amounts of
cells as determined by lipocrit, that is total cell
volume, was subjected to SDS-PAGE and
immunoblotting (18). The phosphorylation of
IRS1, insulin receptor (IR), and protein kinase B
(PKB) was normalized to the amount of IRS1, IR
and PKB, respectively, protein in each sample.
Determination of glucose transport - After
transfer of cells to medium without glucose, cells
were incubated with indicated concentrations of
insulin for 15 min, when glucose transport was
determined as uptake of 0.05 mM or 0.5 mM 2-
deoxy-D-[1-3H]-glucose (18,21), as indicated,
during 30 min. To determine the transport at 5
mM of 2-deoxy-D-[1-3H]-glucose, cells were
incubated with or without 100 nM of insulin for
20 min, when glucose uptake was determined
every minute for 5 min. The slope of the linear
uptake curve was used to calculate rate of uptake.
2-deoxy-glucose at 5 mM had no untoward
effects on the cells, as we ascertained that the
uptake of 2-deoxyglucose at 5mM was
comparable to 2-deoxyglucose at 50 M in the
presence of 5 mM glucose.
Modeling – We used a model-based approach to
elucidate the relation between in vitro insulin
signaling in primary human adipocytes and the in
vivo whole-body glucose homeostasis. We thus
did not aim to develop a single model, but to
utilize many models to analyze, evaluate, and
compare different hypotheses regarding how a
link between intracellular insulin signaling and
whole-body glucose homeostasis can and cannot
be constructed. In a first phase we developed
models that link insulin signaling in the
adipocytes with the adipose tissue level. In this
phase conclusions were drawn and it resulted in a
number of rejections and a minimal model that
can explain the link. In a second phase we
inserted the minimal adipose tissue model as a
module in the whole-body Dalla Man model (15),
and also added more signaling details obtained
from other studies. The resulting model thus
bridges all three levels - whole-body, organ, intra-
cellular – although the model from the first phase
only bridges the organ and intra-cellular levels.
Hypothesis, model structure, and model - We
follow the notations of (8), and distinguish
between a hypothesis, a model structure, and a
model. A hypothesis corresponds to an overall
property of the studied set of assumptions
(models), usually corresponding to the presence
or absence of a specific mechanism. We study
four hypotheses, which are denoted Ma, Mb, Mc
and Md, and which correspond to the assumption
that only insulin signaling (Ma), insulin signaling
plus handling-induced effects on basal GLUT4
translocation (Mb), insulin signaling plus insulin-
effects on the blood flow (Mc), or insulin
signaling plus both handling-induced effects on
GLUT4 translocation and insulin-effects on blood
flow (Md) is sufficient to explain the link
between the intracellular and organ-level. A
model structure is a collection of a set of ordinary
differential equations,
( )
( ) where x represents the states (concentrations of
substances), p the kinetic rate constants, y contains the measurement signals (determined
e.g. by SDS-PAGE and immunoblotting), and f and g are nonlinear functions, which describe a
set of specific dynamic/mechanistic assumptions.
A model structure is hence a specific instance of a
5
hypothesis, and the model structures for
hypothesis Ma are denoted Ma1, Ma2, Ma3, etc.
A model is a model structure with specified initial
conditions, and with values for the kinetic and
measurement parameters. The hypotheses, model
structures, and models are introduced in the
Results section, and in Tables S1 and S2. All
model structures are specified in full detail in
Figures S1 and S2 and the principles of
constructing and simulating a model from these
are given in the Supplemental Methods. All
model equations can be found in the
Supplemental file: ModelFiles.zip.
Optimization and statistical testing - The
optimization is centered on a cost function, ( ), that is given by the sum of least squares.
( ) ∑( ( ) ( ))
( )
where ( ) is the measured signal, ( ) is the
simulated curve, and where this summation is
done over all measured mean points, where the
index runs both over different time-points and
measurement signals. For the optimization we
used the Systems Biology Toolbox for Matlab
(22) and its simannealingSBAO function, which
is a combination of a global simulated annealing
approach with a local, but not gradient-based,
downhill simplex approach. For the uncertainty
analysis of the predictions, we also performed a
modified approach, simannealingSBAOclustering
(8,23), giving widely different but still acceptable
parameters. Note that shared properties among all
found acceptable parameters, also when the
parameters are unidentifiable, indicate uniquely
identified predictions (referred to as core
predictions) (8). In the figures we show
simulations of models for each of the found
extreme acceptable parameter-sets, i.e. the ones
that contain a maximum or a minimum value. In
other words, in our approach we do not deal with
parameter values for the rate constants (for
instance describing the rate of phosphorylation of
IR), but circumvent the problem of determining
these parameters by examining a point-
approximation of all parameters that give an
acceptable agreement with the measurement data.
The statistical tests were performed primarily
using chi-square tests, but we also used a
likelihood ratio test (8,24) to characterize
significant differences between models/model
structures. Regarding degrees of freedom in the
chi-square test, we tested N-6, and N-9 and N-12,
corresponding to a compensation for the
normalization of data, and corresponding to
normalization plus additional 3 and 6 identifiable
parameters, respectively; N denotes the number
of data points. Regarding significance, we tested
both 95%, and 99%. The uncertainties in the data
and in the adipose tissue module constraints were
estimated by the standard error of the mean
(SEM), as we work with models for an “average
subject”.
The results of the optimizations and statistical
tests are summarized in Results and Tables S1
and S2, and all Matlab files used for the
optimizations and statistical tests are included in
the Supplemental file: SimulationFiles.zip.
Differences between our approach and
traditional large-scale grey-box modeling – Our
minimal modeling approach is described in detail
elsewhere (8). The approach differs in several
ways from traditional systems biology
approaches. These differences are summarized in
Table 1, where it should be noted that we have
taken a simplified view of traditional modeling in
order to make the main points clear (e.g. also
traditional modeling may involve more than one
model, but our point is that in our approach we
examine more models than are common; herein
we examined >15 model structures corresponding
to four different hypotheses). The focus of our
approach is to identify models that can be
rejected, because rejections are one of the two
main conclusions in our approach. The other type
of main conclusion are made up by the the core
predictions, which are shared properties among
all acceptable parameters. The handling of
parameter values is a key difference between our
approach and most others because i) parameter
values are usually not known and not uniquely
identifiable based on existing data, and ii) such
non-identifiability implies that corresponding
predictions are weak and non-final. In contrast,
the two types of conclusions we seek – model
rejections and core predictions – are strong
because they are valid for the entire model
structure (instead of for a model, i.e. a model
structure with specified parameters) and because
they will not be revised in the future, as long as
the existing data are not erroneous.

6
Hierarchical modeling – Herein we extended our
previously developed modeling framework to be
able to obtain similarly strong conclusions in
multi-level hierarchical modeling. The multi-level
models (denoted M1- M
3) have different extents
of detail included as sub-modules. To be able to
connect the models consisting of different scales
and levels of details we used a hierarchical,
module based approach. The technical term for
this approach is object-oriented modeling and we
used one of the most common object-oriented
languages, Modelica, which can handle multiple
domains. An object (which we will refer to as a
module or a sub-module) is a replaceable unit
with input and output signals that must be
fulfilled, to maintain the correct communication
with the other objects in the model. We refer to
such input and output signals as module
constraints (Fig. 1), where the input signal part of
module constraints are referred to as input
constraints, and where the output that should be
produced by the module are referred to as output
constraints. (In our case the input-output
constraints correspond to interstitial insulin and
glucose concentrations and to glucose uptake,
respectively.) These module constraints were
used in the minimal modeling cycle while testing
hypotheses (Fig. 2A).
The main idea in extending our previous
approach (8) was to develop a minimal model for
the adipose tissue that bridges insulin signaling
with the adipose tissue input-output profiles (Fig.
2A). Then, in the second phase (Fig. 2B) we
included the adipose tissue module in the whole-
body Dalla Man model (15), and added details
corresponding to previous knowledge. In the first
phase we can draw strong conclusions, and in the
second phase achieve a detailed and multi-level
model.
To simulate the Modelica code, we used the
software MathModelica (25), which is a modeling
tool for analysis of dynamical systems,
traditionally used in the field of mechanics.
MathModelica is built up by component-libraries
for matching applications. By gathering the
components in libraries it is easy to reuse and
replace the created components, and to develop
new ones that fit into an existing hierarchical
model. For modeling of biological systems there
is a recently developed BioChem library available
(http://www.mathcore.com/products/mathmodelic
a/libraries/biochem.php). Both MathModelica and
the Systems Biology Toolbox for Matlab support
the systems biology markup language (SBML),
and it is thus possible to transfer created models
to other software applications.
RESULTS
We developed a mathematical model for insulin
signaling in the adipose tissue, which we inserted
as a dynamic module in an existing model for
whole-body glucose homeostasis by Dalla Man et
al. (15). Because of our modified hypothesis
testing approach depicted in Figure 2, this
resulted in a detailed model that, nonetheless,
allow conclusions to be drawn, rather than mere
suggestions and descriptions. An important
addition to our earlier approach (8) was that
inputs consist of both experimental data and
module constraints (Fig. 1, 2). These constraints
are mandatory for the dynamic fitting of the
organ module to the rest of the whole-body
model. The constraints allowed for a conventional
hypothesis-testing approach during model
development, i.e., despite of a high complexity of
the combined multi-level model the constraints
allowed for the study of isolated sub-systems and
sub-problems, with real conclusive statements,
such as rejections of hypotheses, core predictions,
and minimal models. Once found, the minimal
model was inserted as a module in the whole-
body model (Fig. 2B). Where detailed data or
prior models are available, these could
subsequently be filled in as sub-modules to
various parts of the minimal model to obtain a
more detailed version of the model (Fig. 2B).
Identification of the adipose tissue module
constraints – We first identified the input and
output module constraints that ensure that our
developed adipose tissue models fit in with the
whole-body level. For this we made use of the
organ fluxes of insulin and glucose that have been
obtained experimentally in the modeling effort by
Dalla Man et al. (15,26,27). These data provide
the glucose uptake of the combined insulin
sensitive tissues – mainly corresponding to
muscle and fat – which in that model is described
by one entity. To relate our insulin signaling to
these data we determined the adipose tissue
contribution to the combined tissue data. Previous
studies in man have shown that in the fasting state
and in the postprandial insulin-stimulated states,
approximately 20% of the glucose consumption
by insulin-responding tissues can be attributed to
the adipose tissue, and 80% to muscle tissues
(Table 2). This fraction was preserved between
7
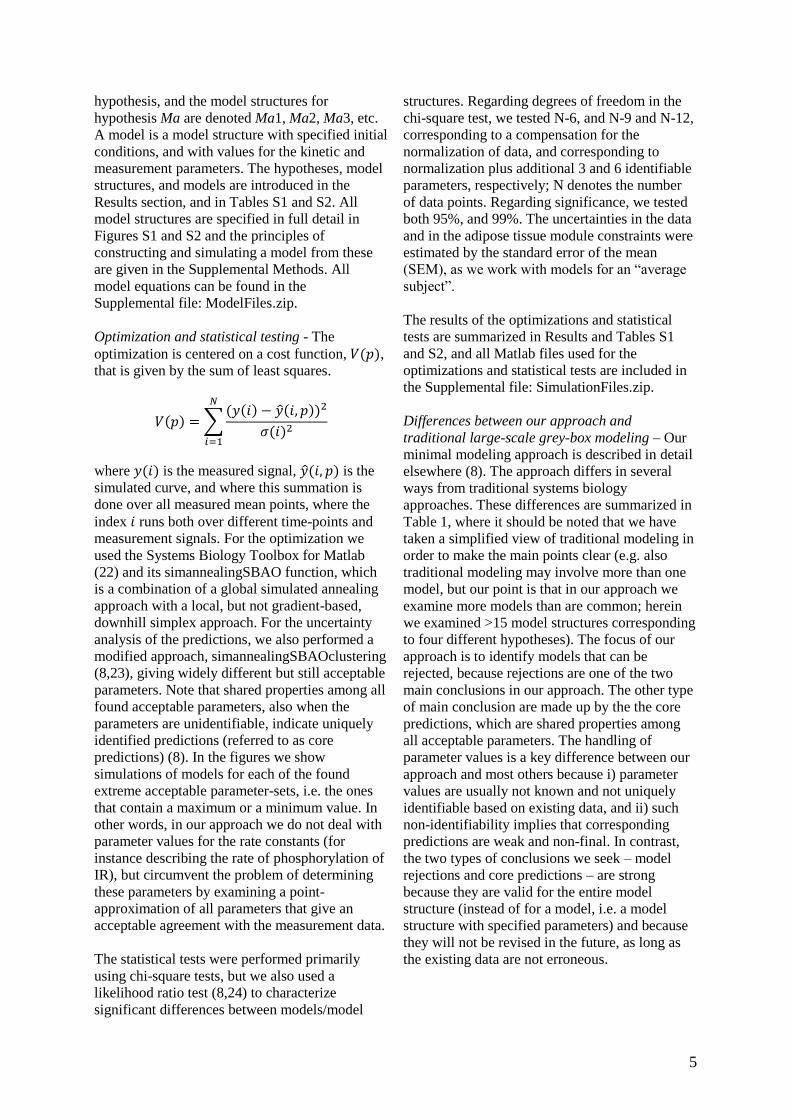
Figure 1. Module constraints.
The behavior of an adipose tissue module inserted in a whole-body model is governed by input and output constraints. Input constraints are used as inputs to
the module and the resulting output of the model must fit the output constraints.
A,B, Input constraints from the Dalla Man-model in response to a meal (15). Interstitial insulin concentration (- -), our modified interstitial insulin
concentration that is restricted to positive values (–) (A). Interstitial glucose concentration (B).
C, Output constraints calculated from the Dalla Man-model in response to a meal: rate of glucose uptake by the adipose tissue module.

8
Figure 2. Modeling strategy.
In the minimal modeling cycle (A) mechanistic hypotheses are tested against experimental datasets and conclusions are drawn. Conclusions are in the form of
core predictions (uniquely identified predictions) and rejected hypotheses. Non-rejected, i.e. acceptable, minimal models can be included as organ modules
when creating multi-level models (B) provided that the module constraints are fulfilled. The minimal model can further be extended with more details, as long
as the sub-modules fit their relevant module-constraints. The result is a hierarchical multi-level model with optional sub-modules of varying complexity.

9
the two relevant physiological states (fasting and
eating) covered by the Dalla Man-model (15). We
therefore sub-divided the Dalla Man-model’s
insulin-responding glucose uptake entity in two
parts, muscle and adipose tissue, with static 80/20
proportions. The glucose uptake profile of the
adipose tissue module, when the Dalla Man-
model simulates the breakdown of a meal, is
depicted in Figure 1C. Figure 1C thus depicts, the
output constraints of the module, i.e., the
mandated output of the developed adipose tissue
module to which the model is fitted. The glucose
uptake by the adipose tissue module should be
obtained with the corresponding tissue
concentrations of glucose and insulin (Fig. 1A, B)
as input constraints. These adipose tissue module
constraints (Fig. 1) are part of all three datasets
(Z1-3) used below.
Two additional concerns regarding the module
constraints. First, the reported proportions for
glucose uptake by the adipose and muscle tissues
range between 15-30% (Table 2). We therefore
tested also other proportions in this range, and
none of the key conclusions herein were affected
by such changes to the organ constraints (see
below). Second, the interstitial concentration of
insulin has in the Dalla Man-model an unrealistic
behavior when approaching steady-state: it
becomes very slightly negative (Fig. 1A, broken
line). Since the size of the negative
concentrations are small, unrealistic, and leads to
numerical and interpretation problems, we shifted
the curve to positive values (Fig. 1A, continuous
line).
Accounting for adiposity, gender, age and insulin
sensitivity – This study centers around the
combination of two datasets – one in vivo set, and
one in vitro set – that have been obtained for two
different populations. Differences in populations
include gender, body weight, body constitution
(fat/muscle proportions), etc, and require a
careful choice of scaling and conversion into a
common unit when comparing the data. The
derivation of a common unit for total uptake of
glucose by the adipose tissue is obviously
dependent on the amount of adipose tissue: more
adipose tissue can take up more glucose.
However, insulin resistance in the adipose tissue
is manifested in reduced maximal rate of glucose
uptake by the adipocytes (19,28). The overall
effect of increased adiposity is thus the result of
these two opposing effects. We therefore
examined how adiposity correlated to glucose
uptake in adipocytes isolated from subjects
exhibiting a wide range of obesity (measured as
Body Mass Index, BMI). The rate of glucose
uptake by the adipocytes significantly decreased
with increasing BMI of the cell donor, both
maximal rate in response to insulin and basal rate
in the absence of the hormone (Fig. 3A). Thus
both insulin-stimulated and basal glucose uptake
were negatively correlated with obesity.
Interestingly, this effect of obesity on glucose
uptake disappeared by unit conversion from
uptake per cell, or a volume of cells, to whole-
body uptake (Fig. 3B) (see Materials and
methods). This means that per kg body weight the
increased amount of fat is exactly compensated
for by the insulin resistance. We thus used this
unit (mg glucose/kg body weight/min) in linking
the adipocyte in vitro and the in vivo data.
A first attempt at a minimal adipose tissue model
- To create a minimal, insulin signaling-
controlled adipose tissue module for glucose-
uptake we included insulin activation of IR,
which via phosphorylation of IRS1 and protein
kinase B/Akt (PKB) enhances glucose uptake
through the insulin-regulated glucose transporter
(GLUT4). This signaling sequence is perhaps the
most established path between insulin binding
and glucose uptake. The actual situation involves
multiple feedbacks, branch-points, dependencies
on location, and cross-talk with other regulatory
sub-systems, but, as we will show, many of our
important conclusions hold also for this
simplified signaling network. In addition to
glucose uptake by GLUT4 we included glucose
transporter-1 (GLUT1)-catalyzed uptake of
glucose, which is not significantly stimulated by
insulin. The resulting model structure is denoted
Ma1 (Fig. S1), because it is the first model that
belongs to our first hypothesis, Ma (Table 3). The
Ma hypothesis has as the common denominator
that model structures only include insulin effects
on glucose uptake via the insulin signaling
cascade, which is assumed to be independent of
whether the cells are in an in vivo or in an in vitro
situation. The differential equations of a model
structure are given in Figure 4. All model
structures are graphically depicted in Figures S1
and S2, and the model equations are given in the
file ModelFiles.zip.
We complemented the input and output module
constraints described above (Fig. 1) with
experimental dose-response data for insulin
stimulation of IR autophosphorylation (Fig. 5A),

10
Figure 3. Glucose uptake by isolated adipocytes in relation to BMI.
A, Rate of glucose uptake, with (filled) or without (open) 100 nM insulin, in relation to BMI of the
individual cell donor.
B, Rate of glucose uptake, with (filled) or without (open) 100 nM insulin, multiplied by the fat tissue
volume (in L, calculated as in Methods) and divided by body weight (in kg) of the individual cell
donor. Indicated are p-values for correlation between rate of glucose uptake and BMI.

11
Figure 4. Model equations example.
The model equations for Ma2 demonstrate how the models are formulated. The states are the
simulated signaling proteins that are phosphorylated (indicated with p) or non-phosphorylated. IR,
insulin receptor; IRS1, insulin receptor substrate-1; PKB, protein kinase B; GLUT4, insulin-regulated
glucose transporter-4. Insulin and glucose, the input constraints, are functions of time. Glucose uptake,
the output constraint, is given by an expression depending both on insulin (via GLUT4 in the plasma
membrane = GLUT4pm) and glucose. The model parameters, i.e. the rate constants, are searched for
in the optimization process while fitting models to experimental data and output constraints. The
complete model equations for all models are provided in the Supplemental file ModelFiles.zip
12
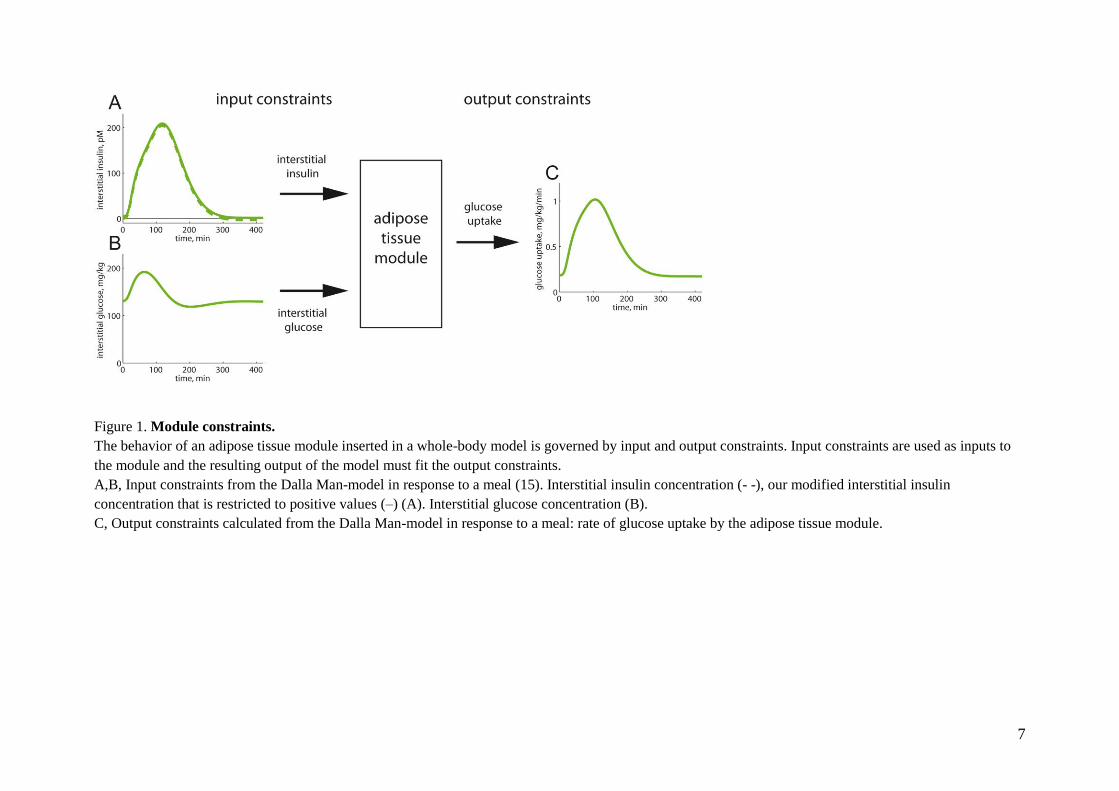
Figure 5. Simulations by model Ma2 in comparison with datasets Z1 and Z2.
A-D, Dose-response to increasing concentrations of insulin. Insulin receptor (IR) phosphorylation (A),
insulin receptor substrate-1 (IRS1) phosphorylation (B), protein kinase B (PKB) phosphorylation (C),
glucose uptake (D). Simulated results are depicted as blue solid lines (one line for each extreme
acceptable parameter-set), and experimental data are depicted as red, filled circles with error-bars (±
one SE). Experimental data from isolated adipocytes.
E, Glucose uptake of the adipose tissue in response to a meal. Simulated results are depicted as blue
solid lines (one line for each extreme acceptable parameter-set), and experimental data are depicted as
red, filled circles with error-bars (± one SE). Experimental data from the Dalla Man-model (15).
F, Predicted glucose uptake (blue, solid lines) with 5 mM glucose in the medium.
G, Experimentally determined (red bars, plus/minus one SE) vs. fitted/simulated (blue bars) glucose
uptake for the isolated adipocytes in the presence of 5mM glucose, with or without 100 nM insulin, as
indicated.
13
receptor phosphorylation of IRS1 (Fig. 5B),
phosphorylation of PKB at threonine 308 (Fig.
5C), and of glucose uptake by isolated primary
human adipocytes (Fig. 5D). This combined
dataset is referred to as dataset Z1 (Table 4).
We fitted the model Ma1 to the dataset Z1
(Materials and methods), but despite extensive
searches in the parameter space, we could not
find an acceptable fit. That even the best fits were
unacceptable was formally tested using a chi
square test (Materials and methods), which
rejected the model Ma1 with a significance of
<0.05. We examined several variations of the
same hypothesis, involving feedbacks (models
Ma2-3, Fig. S1), Hill equations (model Ma4, Fig.
S1), a basal translocation of GLUT4 (model Ma5,
Fig. S1), more signaling intermediates (models
Ma6 and Ma7, Fig. S1), more complex signaling
involving branch-points (model Ma7, Fig. S1),
and IR endocytosis (model Ma6, Fig. S1).
Different significance levels and degrees of
freedom were tested (Materials and methods) and
the results are summarized in Tables 2 and S1.
Some of the tests are on the border of rejections
(Ma4 passes a test with 31, but not with 28
degrees of freedom; Ma3 is rejected with a
significance of p<0.05, but not p<0.01). Because
of these ambiguities we complemented the chi-
square test with a likelihood ratio test, which
indicates that the two nested models Ma1 and
Ma2 are significantly different (2(Ma1)-
2
(Ma2)=54.2-40.9=13.3> 2 (1, =0.01) = 6.63).
In other words, the added parameter in model
Ma2 corresponding to the positive feedback
contributes significantly to the fit of the model to
data. In summary, the two models Ma2 and Ma6
pass all tests and thus move to the next step:
identification of experimentally testable core
predictions (Fig. 2A).
The minimal modeling reveals that insulin-
stimulated glucose uptake in isolated adipocytes
cannot account for the observed in vivo glucose
uptake by the adipose tissue – We sought to
identify an approximation of all acceptable
parameters for Ma2, using as threshold a chi-
square test with significance level of 0.05 and 34
degrees of freedom (Fig. 5 A-E). The glucose
uptake data in dataset Z1 were determined at 0.5
mM glucose, a sub-physiological concentration
(29-31). The predicted dose-response curves by
Ma2 for glucose uptake by the adipose tissue at
physiological (5 mM) glucose are shown in
Figure 5F. As can be seen, also when accounting
for the uncertainty in the prediction due to the
lack of specific parameter values, a distinct curve
is obtained. A similar prediction is also produced
by the model structure Ma6 (Fig. S3). These
predictions thus fulfill the conditions for an
experimental test: they are core predictions (8)
that are physiologically relevant/interesting, and
that can be experimentally tested.
We thus determined glucose uptake by isolated
adipocytes at 5 mM glucose (Fig. 5G). The
expanded dataset containing these new glucose
uptake data plus dataset Z1 is denoted Z2 (Table
4). In the next step of the minimal modeling cycle
(Fig. 2A) we tested the model structures Ma2 and
Ma6 with the expanded dataset Z2. Optimization
plus statistical tests showed that none of these
models were acceptable with 36 degrees of
freedom, even for = 0.01 (Tables 3 and S1). We
further examined models Ma2 and Ma6 with a
modified dataset Z2, using two different sub-
divisions of the adipose/muscle tissue
compartments (15/85 or 30/70), and this also led
to rejections of both Ma2 and Ma6.
Extension of the model to include other effects
than insulin signaling for control of glucose
uptake – The above analysis showed that all
models corresponding to hypothesis Ma are
rejected. The rejection of Ma means that
something more than mere in vitro intracellular
insulin signaling to increased glucose uptake is
needed to obtain an adipose tissue module
compatible with in vivo determination of adipose
tissue glucose fluxes. We refer to such
differences as in vitro/vivo-differences, and they
can correspond to different mechanisms. Basal
translocation of GLUT4, and thus basal glucose
uptake, is a possible in vitro/vivo-difference,
since it has been reported that GLUT4 can
artefactually translocate to the plasma membrane
in response to cell handling (32). It is also
possible that the lack of counter-regulatory
factors in the isolated cell system can cause an
increased translocation of GLUT4 in the absence
of insulin. We refer to a model incorporating this
GLUT4 translocation hypothesis as Mb (Table 3,
Fig. S2). Another possibility is that insulin
signaling to enhanced glucose uptake by the
adipocytes is not the only effect of insulin in the
adipose tissue that enhances glucose uptake.
Insulin has, for instance, effects on the blood-
flow (33) that could affect the availability of
glucose and insulin in the local interstitial tissue
surrounding the adipocytes, which in turn would
14
effect glucose uptake by the adipocytes. We refer
to this blood-flow hypothesis as Mc (Table 3, Fig.
S2).
The results from optimization of model structures
belonging to hypotheses Mb or Mc with respect to
dataset Z2 are summarized in Tables 3 and S2. Mb
and Mc were implemented by six model
structures together, whereof all are rejected. We
thus rejected both hypotheses Mb and Mc. A
shared property among Mb and Mc is the single
included in vitro/vivo-difference. The next step
was therefore to create variants of the hypotheses
with more than one in vitro/vivo-difference. We
refer to the multiple in vitro/vivo-difference
hypothesis as Md. None of the model structures in
Md were rejected when fitting them to the dataset
Z2 (Tables 3 and S2). Additionally, the best
model from the hypothesis Md, Md3, is
significantly better than the best models from the
hypotheses Ma, Mb and Mc [2(Ma2) -
2(Md3) =
66.8 - 33.8 = 33 > 2(2, = 0.01) = 9.2;
2(Mb2)
- 2(Md3) = 54.6 - 33.8 = 20.8 (equal number of
parameters); 2(Mc2) -
2(Md3) = 49.5 - 33.8 =
15.7 > 2(1, = 0.01) = 6.6]. For our further
multi-level modeling, we thus chose Md3 as our
minimal model.
Construction of hierarchical multi-level models
with plug-in sub-modules for greater mechanistic
detail in insulin signaling – At this point we had
obtained a minimal model (Md3) and leaved the
iterative scheme in Figure 2A in order to progress
to the next phase (Fig. 2B). Here we added more
known signaling intermediates and more
mechanistic details, as plug-in sub-modules, to
the minimal model Md3. For more mechanistic
details in upstream insulin signaling, we used a
previously developed model ((8), therein referred
to as Mifa). Mifa describes the first few minutes
of the IR-IRS1 phosphorylation dynamics, which
involve IR endocytosis and generation of a
negative feedback. The Mifa model can explain
all our available data for this sub-system,
including time-series to single and multiple
insulin stimulations at different concentrations,
responses to inhibition of endocytosis, and
measurements of the amount of internalized
receptors (8). We merged this dataset for the IR-
IRS1 sub-system with the dataset Z2, and denoted
the resulting dataset Z3 (Table 4). We then
merged the Mifa model as a sub-module within
the minimal model Md3, and referred to the
resulting detailed model as M1 (Table 5). Fitting
the parameters in M1 showed that it can explain
the Z3 dataset (Fig. S4).
Downstream insulin signaling to control of
glucose uptake involves branching and feedbacks;
we therefore next included more details regarding
some of the most well-established such
mechanisms (Fig. 6). First, the signaling from
IRS1 to PKB involves several steps, in particular
the phosphoinositide-3-kinase (PI3K) and
phosphoinositide-dependent kinase-1 (PDK1).
Second, signaling from PDK1 to GLUT4 has two
branches: one involving PKB and one involving
protein kinase C (PKC). Finally, some of the
known or hypothesized feedbacks include
feedback from PKB, via the mammalian target of
rapamycin (mTOR) to serine-phosphorylation of
IRS1, and another one from PKC to serine
phosphorylation of IRS1; serine-phosphorylation
of IRS1 is believed to increase or decrease the
tyrosine phosphorylation of IRS1 and thus affect
the insulin signaling through IRS1 (19,34,35). All
these mechanisms were added to M1, and the
resulting model denoted M2 (Table 5) can also
explain the Z3 dataset (Fig. S5). At this point we
thus had a detailed hierarchical model of glucose
homeostasis with optional adipose tissue plug-in
sub-modules, representing different extents of
mechanistic detail in the insulin signaling.
Merging of our hierarchical model with models of
others - We next continued to show how we
could further expand the hierarchical model M2
by merging it with models and insights obtained
by others.
In a recent work by Kiselyov et al. (5) the binding
of insulin to IR, with a focus on the importance of
double- and triple-binding of insulin to its
receptor, has been modeled. That model contains
a more comprehensive description of the insulin-
IR binding dynamics than we have tested (8), and
it would thus be valuable to incorporate that
model in our adipose tissue module. The model
by Kiselyov et al., however, has been developed
for other cell types (IM9 and 293EBN cells), and
for low temperatures to reduce the effect of
endocytosis. It is therefore not possible to use that
model’s data or parameter values, but only the
underlying model structure, in our adipose tissue
module. We thus replaced the structure of the
insulin binding reactions in M2 with those in the
Kiselyov model, resulting in a final detailed
model M3 (Fig. 7, Table 5, Supplementary
material), and fitted that model to the dataset Z3

15
Figure 6. Schematic outline of insulin signaling pathways.
Insulin binding to the insulin receptor (IR, brown) causes autophosphorylation of IR at
tyrosine, thus activated IR will phosphorylate the insulin receptor substrate-1 (IRS1) at
tyrosine to create binding sites for SH2-domain containing proteins such as the
phosphatidylinositol 3-kinase (PI3kinase). Thus activated PI3kinase will phosphorylate
phosphoinositides in the cell membrane, allowing phosphoinositide-dependent kinase-1
(PDK1) to phosphorylate and activate protein kinase B (PKB) and protein kinase C (PKC).
Thus activated PKB can activate mammalian target of rapamycin (mTOR) in complex with
raptor, through which insulin can control protein synthesis, autophagy and mitochondrial
function. mTOR and protein kinase PKC relay feedback signals (green) to phosphorylation of
IRS1 at serine residues. Blue arrows indicate downstream signaling by insulin, black arrow
indicates translocation of insulin-regulated glucose transporter-4 (GLUT4) from an
intracellular location to the plasma membrane (thick gray line), hatched lines indicate poorly
defined signal paths, P indicates phosphate. Glucose transporter-1 (GLUT1) is not affected by
insulin.

16
Figure 7. Hierarchical, module-based modeling – the final multi-level model M3.
The left panel depicts the top-level part of the model, which is the glucose/insulin whole-body model
from (15), but with an adipose tissue module extracted from the original single insulin-dependent
tissue. The adipose tissue module in the middle panel is expanded to show the next level of the model:
insulin signaling to enhanced glucose uptake via the insulin-regulated glucose transporter-4 (GLUT4)
translocation. In the right panel insulin binding to the insulin receptor (IR) is expanded with the
insulin-IR-binding model from (5) and insulin-IR internalization/feedback model from (8). Together
all three panels constitute the final hierarchical model, M3.

17
Figure 8. Simulations of the final hierarchical model M3 compared with dataset Z3.
Simulated results are depicted as blue solid lines (one line for each extreme acceptable parameter-set),
and experimental data are depicted as red, filled circles with error-bars (± one SE).
A, Insulin receptor (IR) phosphorylation in response to 100 nM insulin. Experimental data from
isolated adipocytes.
B, Insulin receptor substrate-1 (IRS1) phosphorylation in response to 100 nM insulin. Experimental
data from isolated adipocytes.
C, IRS1 phosphorylation in response to first 1.2 nM at 0 min, and then 10 nM insulin at 4 min.
Experimental data from isolated adipocytes.
D, IRS1 phosphorylation in response to 10 nM insulin. Experimental data from isolated adipocytes.
E, Dose-response for glucose uptake in response to increasing concentrations of insulin. Experimental
data from isolated adipocytes.
F, Glucose uptake by the adipose tissue in response to a meal. Experimental data from the Dalla Man-
model (15).

18
(Fig. 8A-F). As can be seen, also M3 can describe
all our data. Hence, it is now possible to translate
the effects of multiple insulin-IR-binding (5) to
the corresponding whole-body effects in response
to a meal (Fig. 9A-F). We thus have three multi-
level models with differently detailed versions of
an adipose tissue module (M1, M
2, M
3) that all can
explain the complete dataset Z3. This was
possible because the differences between the
different detailed models are restricted to certain
well-defined areas in the adipose tissue module.
Note also that these localized switches are easy to
turn on or off using our object-oriented software
environment (Materials and methods). We can
therefore refer to the models (M1, M
2, M
3) as the
same hierarchical model with modules and sub-
modules of different levels of detail.
DISCUSSION
We have herein extended a previous model for
insulin signaling, which focused on the early
response of the IR/IRS1 subsystem to insulin (8),
to include more mechanistic and downstream
details and a link to whole-body glucose
homeostasis. This has required a closer
examination of the data from the two levels.
Most modeling of energy homeostasis and insulin
signaling is based on data obtained in cell lines or
animals, and the relevance of these model
systems for the true in vivo situation is poorly
understood. Our experimental model system –
primary human cells from biopsies or surgery – is
arguably an unusually realistic model system.
Nonetheless, also ours is an in vitro system, since
the cells have been isolated from their native
environment in the living human body; the
consequences of which we know little. Our herein
presented hierarchical modeling approach is a
first attempt to create a bridge between this in
vitro and the whole-body in vivo situation.
The modeling analysis revealed that the GLUT1
and insulin signaling-enhanced GLUT4 mediated
uptake of glucose by isolated human adipocytes
cannot simply be scaled up to explain the glucose
uptake by the adipose tissue in the intact body.
This is a conclusive statement, and it is supported
by different types of arguments. i) All models
belonging to the hypothesis Ma, i.e. models that
scale up the insulin signaling-mediated glucose
uptake by the isolated adipocytes to the
corresponding uptake by the adipose tissue, fail to
describe the dataset Z2 and are rejected by
statistical tests. Also, all models from the
hypotheses Mb and Mc, which include single in
vitro/vivo-differences, are rejected. ii) Acceptable
models from the hypothesis Md (which include
multiple in vitro/vivo-differences) are
significantly better than the best models from the
hypotheses Ma, Mb or Mc, as measured using
likelihood ratio tests with a high significance
(p<0.01). iii) We have sought to make our
conclusions independent of a specific model
structure, by analyzing a family of models
corresponding to each rejected or acceptable
hypothesis. Also, the conclusions are independent
of specific parameter values, since model
rejections reject the whole model structure. This
parameter value-independent aspect also holds for
core predictions, since they are shared properties
among all acceptable parameters (8). The
conclusions, however, rely on the assumption that
we have not overlooked any crucial acceptable
parameters or model structures.
The strength of these conclusions can be
illustrated by comparison with previously
published modeling efforts. Concerning models
that include both a whole-body and an
intracellular level, we are not aware of any
previous examples that could draw the types of
conclusions as herein. Although the model by
Kim et al. (13) includes such additional factors
that we have concluded are necessary, Kim et al.
have not demonstrated that these factors are
required. On the contrary, they have constructed a
complete model at once. Such a one-model/one-
parameter value approach does neither allow for
rejection conclusions nor – because of the
extremely high dimensionality of the parameter
space – for reliable core predictions. Another
example is the modeling by Chew et al (11),
which is based on a model where the insulin-
stimulated glucose uptake has been scaled in
exactly such a way that we show is not possible.
They have not detected the problem because they
have not used input-output constraints, such as
those from the Dalla Man-model; this comparison
thus clearly demonstrates the importance of
including such module constraints (Fig. 1).
Although several of the models studied in this
paper utilize previously published model
structures, all analyzed models are in fact new. In
particular, we have made use of the Dalla Man
model (in M1-M
3), the Mifa model from (8) (in
Ma6, Mb3, M1-M
3), the Sedaghat model (in Ma7),
and the Kiselyov model (in M3), but these
19
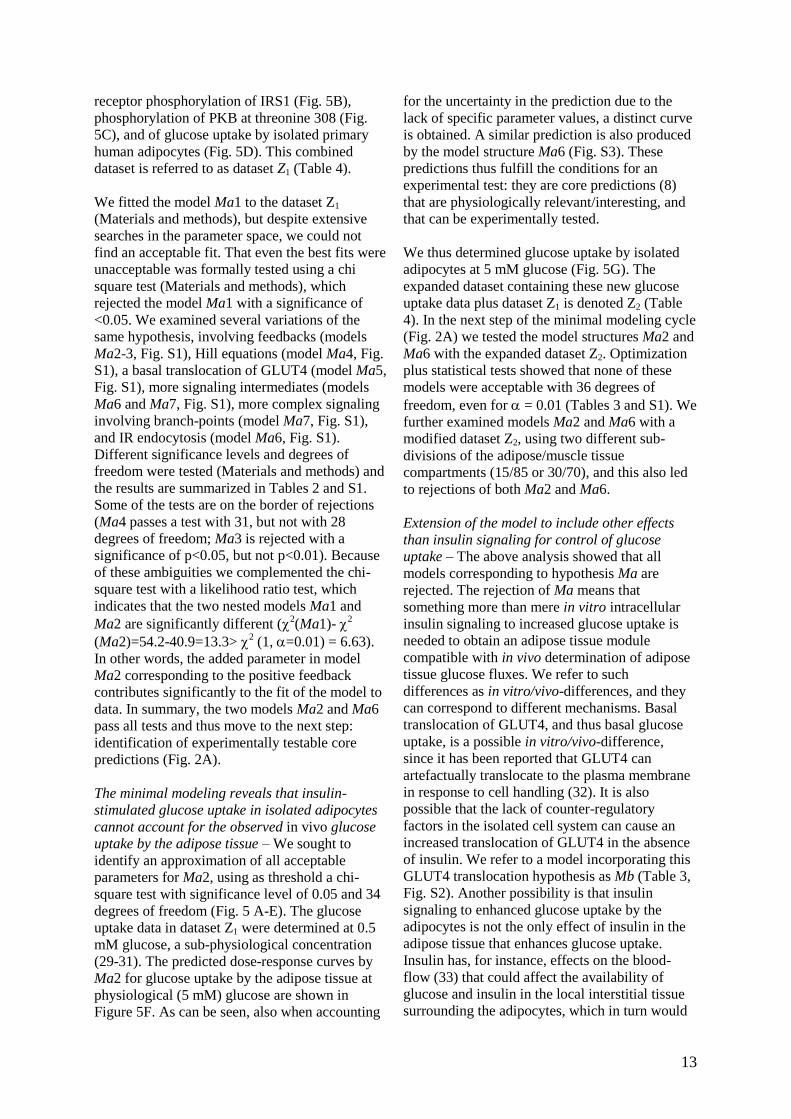
Figure 9. Simulations/core predictions of the final hierarchical model M3.
Simulations of the final hierarchical model (M3) for each extreme acceptable parameter-set of the
adipose tissue module can be used as core predictions (uniquely identifiable predictions) to draw
conclusions. Here are some examples of such simulations (one blue line for each extreme acceptable
parameter-set) from different levels of the model: plasma glucose concentration (A); plasma insulin
concentration (B); glucose uptake in the adipose tissue module (C); protein kinase B (PKB)
phosphorylation in adipose tissue module (D); the fraction of insulin receptor (IR) states with two or
three insulin molecules bound in the sub-module of insulin binding to IR (E); fraction of internalized
IR in the sub-module of insulin binding to IR (F).

20
borrowed models only appear in certain well-
defined areas. More specifically, the Dalla Man
model only appears in M1-M
3 at the whole-body
level, i.e. the organ and sub-cellular levels are
new. Similarly, the Mifa and Sedaghat models
only describe the initial insulin-signaling, i.e. the
parts of the models describing downstream links
to the glucose uptake, and to the organ level, are
new. The Kiselyov model appears in the insulin
binding level, and the links from insulin binding
to internalization to downstream signaling are
new. This indeed illustrates one of the strengths
of our approach, that different existing or new
models are easily incorporated in the model as
defined sub-modules.
There are different possible candidates for what
mechanisms the in vitro/vivo-differences might
represent. We examined in detail two possible
mechanisms, blood-flow (Mc) and an increased in
vitro basal GLUT4-translocation (Mb). Neither of
those fundamentally different mechanistic
hypotheses are sufficient to explain the
experimental dataset Z2, but multiple in
vitro/vivo-differences, as in the hypothesis Md,
are required. The model structures of both Mb
and Mc correspond to fairly loosely specified
mechanisms, and therefore there are other
possible interpretations to the same model
equations. For instance, cell-intercellular matrix
interactions in situ have been reported to affect
glucose uptake (36), and this might be another
explanation for the in vitro/vivo-differences.
There are also hormones and metabolites other
than insulin with a regulatory function in the
control of glucose homeostasis, which are not
included in the Dalla Man model, and thus also
not in our model. Such missing entities could
serve as alternative interpretations of the models
corresponding to the Mc hypothesis. Irrespective
of the actual responsible mechanism(s), our
modeling analysis demonstrates the inadequacy
of cell-based data only to describe insulin-
controlled uptake of glucose by the adipose tissue
in vivo. As an important corollary, it was not
possible to simply scale glucose uptake by the
isolated adipocytes to match the glucose uptake
profile of the adipose tissue in an in vivo setting.
Such simple scaling was precluded because the in
vitro cell-based data and the in vivo whole-body
data had been obtained under fundamentally
different conditions, such as addition of insulin to
cells versus consumption of a meal, with very
different time-scales and insulin concentration
profiles over time. It is, for instance, not feasible
to mimic ingestion of a meal by increasing and
decreasing the concentration of insulin added to
isolated adipocytes. In contrast, modeling is well
suited to deal with such differences by requiring
that a model explain both the in vitro and in vivo
uptake of glucose, given the corresponding
inputs. The rejection of a simple scaling,
moreover, is not trivial as some of the model
structures can explain dataset Z1 but not Z2,
indicating that details of the model structure are
critical.
These conclusions could not have been drawn
from a direct inspection of data, because the in
vitro cell-based data and the in vivo whole-body
data were obtained under fundamentally different
conditions, such as addition of a constant amount
of insulin (cellular data) versus consumption of a
meal leading to time-varying insulin stimulation
(whole-body data). Modeling is well suited to
deal with such differences by simply requiring
that a model explain both the in vitro and in vivo
uptake of glucose, given the corresponding
inputs. Moreover, some of the model structures
can explain dataset Z1 but not Z2, demonstrating
that details of the model structure and the details
in the data-series are critical, and that the
rejection conclusion is non-trivial.
A further, potentially alternative interpretation to
the data comes from the differences in the
subjects examined. The Dalla Man-data are from
non-diabetic, healthy middle-aged men, while the
adipocytes examined herein were obtained from
non-diabetic, middle-aged women undergoing
abdominal surgery. Such gender differences
implicate differences in the amount and location
of body fat, which could have a role in the
observed in vitro/vivo-differences. We have,
however, compensated for the extent of obesity
and for the fact that we study women, when
translating adipocyte glucose uptake to the
whole-body units of measure used in the Dalla
Man-model (see Section “Accounting for
adiposity, gender, age, and insulin sensitivity”).
Likewise, our testing of other muscle/adipose
tissue proportions for glucose uptake than 80/20
means that the key rejections herein probably
hold despite the gender difference. To
summarize, we have identified an important
object for further research: to untangle the
quantitative role of these potentially important
components that, in addition to insulin signaling
in the adipocytes, may regulate the glucose
uptake in the adipose tissue. In the future the

21
model will also have to account for different fat
locales and their properties. In particular
abdominal subcutaneous versus visceral adipose
tissue (37), the latter that drains to the portal vein
and the liver, and may therefore directly affect
liver metabolism through increased fatty acid
release. Future models should also include data
obtained during physical exercise, which entails
insulin-independent stimulation of glucose uptake
in muscle.
Finally, insulin signaling is one of many sub-
systems involved in whole-body glucose
homeostasis. There is currently no consensus
regarding which of these sub-systems that
actually is most important for the overall
regulation, and which of these sub-systems that
are most decisive for the malfunctioning in type 2
diabetes. We have here demonstrated how pieces
of knowledge can be merged together using a
hierarchical modeling approach, and also how
such an approach efficiently can pin-point
important missing components. Therefore, we
believe that our hierarchical multi-level modeling
is an important step towards the achievement of
more comprehensive and internally consistent
views of cellular level and whole-body glucose
and energy homeostasis, which will be required
for the eventual understanding and sound
treatment of type 2 diabetes; in line with the
Tokyo Declaration from 2008 (38,39).
REFERENCES 1. Herman, M. A., and Kahn, B. B. (2006)
J. Clin. Inv. 116, 1767-1775
2. Borisov, N., Aksamitiene, E., Kiyatkin,
A., Legewie, S., Berkhout, J., Maiwald,
T., Kaimachnikov, N. P., Timmer, J.,
Hoek, J. B., and Kholodenko, B. N.
(2009) Mol. Syst. Biol. 5, 256
3. Martin, T. J., and May, J. M. (1986) J.
Recept. Res. 6, 323-336
4. Wanant, S., and Quon, M. J. (2000) J.
Theor. Biol. 205, 355-364
5. Kiselyov, V. V., Versteyhe, S., Gauguin,
L., and DeMeyts, P. (2009) Mol. Syst.
Biol. 5, 243
6. Cedersund, G., Roll, J., Ulfhielm, E.,
Danielsson, A., Tidefelt, H., and
Strålfors, P. (2008) PLoS Comput. Biol.
4, e1000096
7. Sedaghat, A., Sherman, A., and Quon, M.
(2002) Am. J. Physiol. 283, E1084-E1101
8. Brännmark, C., Palmér, R., Glad, S. T.,
Cedersund, G., and Strålfors, P. (2010) J.
Biol. Chem. 285, 20171-20179
9. Wu, M., Chang, X., and Chan, C. (2009)
PLoS ONE 4, e8040
10. Zielinski, R., Przytycki, P., Zheng, J.,
Zhang, D., Przytycka, T. M., and Capala,
J. (2009) BMC Syst. Biol. 3, 88
11. Chew, Y. H., Shia, Y. L., Lee, C. T.,
Majid, F. A., Chua, L. S., Sarmidi, M. R.,
and Aziz, R. A. (2009) Mol. Cell.
Endocrinol. 303, 13-24
12. Cobelli, C., and Mari, A. (1983) Med.
Biol. Eng. Comput. 21, 390-399
13. Kim, J., Gerald, M. S., and Cabrera, M.
E. (2007) Ann. Biomed. Eng. 35, 69-90
14. Ghosh, S., Young, D. L., Gadkar, K. G.,
Wennerberg, L., and Basu, K. (2007)
Conf. Proc. IEEE Eng. Med. Biol. Soc.,
3292-3295
15. Dalla-Man, C., Rizza, R. A., and Cobelli,
C. (2007) IEEE Trans. Biomed. Eng. 54,
1740-1749
16. Deurenberg, P., Weststrate, J. A., and
Seidell, J. C. (1991) Br. J. Nutr. 65, 105-
114
17. Strålfors, P., and Honnor, R. C. (1989)
Eur. J. Biochem. 182, 379-385
18. Danielsson, A., Öst, A., Lystedt, E.,
Kjolhede, P., Gustavsson, J., Nystrom, F.
H., and Strålfors, P. (2005) FEBS J. 272,
141-151
19. Öst, A., Svensson, K., Ruishalme, I.,
Brännmark, C., Franck, N., Krook, H.,
Sandström, P., Kjolhede, P., and
Strålfors, P. (2010) Mol. Med. 16, 235-
246
20. Öst, A., Danielsson, A., Liden, M.,
Eriksson, U., Nystrom, F. H., and
Strålfors, P. (2007) FASEB J. 21, 3696-
3704
21. Frost, S. C., Kohanski, R. A., and Lane,
M. D. (1987) J. Biol. Chem. 262, 9872-
9876
22. Schmidt, H., and Jirstrand, M. (2005)
Bioinformatics 22, 514-515
23. Pettersson, T. (2008) Linköping
University Press,
http://www.control.isy.liu.se/student/exjo
bb/databases/show.html?643
24. Cedersund, G., and Roll, J. (2009) FEBS
J. 276, 903-922
22
25. Brugård, J., and Aronsson, P. (2009)
Modelica 2009 Proceedings,
http://www.mathcore.com/products/math
modelica
26. Basu, R., Di Camillo, B., Toffolo, G.,
Basu, A., Shah, P., Vella, A., Rizza, R.,
and Cobelli, C. (2003) Am. J. Physiol.
284, E55-E69
27. Basu, R., Dalla-Man, C., Campioni, M.,
Basu, A., Klee, G., Toffolo, G., Cobelli,
C., and Rizza, R. A. (2006) Diabetes 55,
2001-2014
28. Kahn, B. B. (1996) Diabetes 45, 1644-
1654
29. Jansson, P. A., Fowelin, J., Smith, U.,
and Lönnroth, P. (1988) Am. J. Physiol.
255, E218-E220
30. Schaupp, L., Ellmerer, M., Brunner, G.
A., Wutte, A., Sendlhofer, G., Trajanoski,
Z., Skrabal, F., Pieber, T. R., and Wach,
P. (1999) Am. J. Physiol. 276, E401-E408
31. Lindpointner, S., Korsatko, S., Köhler,
G., Köhler, H., Schaller, R., Schaupp, L.,
Ellmerer, M., Pieber, T. R., and
Regettnig, W. (2010) Diabetes Care 33,
833-838
32. Vega, F. V., and Kono, T. (1979) Arch.
Biochem. Biophys. 192, 120-127
33. Bergman, R. N. (2003) J. Clin.
Endocrinol. Metab. 88, 4556-4558
34. Johnston, A. M., Pirola, L., and
vanObberghen, E. (2003) FEBS Lett. 546,
32-36
35. Danielsson, A., Öst, A., Nystrom, F. H.,
and Strålfors, P. (2005) J. Biol. Chem.
280, 34389-34392
36. Li, Q., Hosaka, T., Jambaldorj, B.,
Nakaya, Y., and Funaki, M. (2009) J.
Med. Invest. 56, 142-149
37. Erlingsson, S., Herard, S., Dahlqvist-
Leinhard, L., Lindström, T., Länne, T.,
Borga, M., and Nystrom, F. H. (2009)
Metabolism 58, 995-1001
38. Kitano, H. (2010) Frontiers in
Physiology 1, Article 3
39. Jones, D. (2008) Nat. Rev. Drug Discov.
7, 278-279
40. Gerich, J. E. (2000) Diabetes Obes.
Metab. 2, 345-350
41. Virtanen, K. A., Iozzo, P., Hällsten, K.,
Huupponen, R., Parkkola, R., Janatuinen,
T., Lönnqvist, F., Viljanen, T.,
Rönnemaa, T., Lönnroth, P., Knuuti, J.,
Ferrannini, E., and Nuutila, P. (2005)
Diabetes 54, 2720-2726
42. Mitrou, P., Boutati, E., Maratou, E.,
Papakonstantinou, A., Komesidou, V.,
Sidossis, L., Tountas, N., Katsilambros,
N., Economopoulos, T., Raptis, S. A.,
and Dimitriadis, G. (2009) J. Clin.
Endocrinol. Metab. 94, 2958-2961
Footnote 1: We thank European Commission
Networks of Excellence Biosim and BioBridge,
Östergötland County Council, Novo Nordisk
Foundation, Lions, Swedish Diabetes
Association, and Swedish Research Council for
financial support. EN and JB are hired by the
company developing MathModelica.
Footnote 2: The abbreviations used are IR, insulin
receptor; IRS1, insulin receptor substrate-1; PKB,
protein kinase B; GLUT1, glucose transporter-1;
GLUT4, insulin-regulated glucose transporter-4;
PI3K, phosphoinositide-3-kinase; PDK1,
phosphoinositide-dependent kinase-1; PKC,
protein kinase C; mTOR, mammalian target of
rapamycin; ODE, ordinary differential equation;
SBML, systems biology markup language; in
vitro/vivo-difference, in vitro/in vivo difference.
Titles of supplementary material
Supplemental information: Figures S1-S5, Tables
S1-S2, Supplemental Methods, and Supplemental
Description of Model M3
ModelFiles.zip – zip file with models from the
paper given as .txt files
(www.isbgroup.eu/ModelFiles.zip).
SimulationFiles.zip – zip file with all simulation,
model, and optimization files used in the paper
(www.isbgroup.eu/SimulationFiles.zip).

23
Table 1
Characterizing features of traditional large-scale grey-box modeling and the conclusive minimal
modeling approach demonstrated herein.
Feature Traditional modeling Our approach
Number of models
One Many
Mechanistically based model
structures
Yes Yes
Included mechanisms All known and relevant As few as possible
Only those necessary
Main insights from
comparing with data
Model can explain the data Something crucial is missing
Parameter values A single set of values, from
literature and fitting
All acceptable parameters
Prediction identification Simulation Shared properties among all
acceptable parameters
Type of predictions Non-unique suggestions Uniquely identified
Finality of conclusions No, will be revised in the
future
Yes, both rejections and core
predictions are final

24
Table 2
Adipose tissue glucose uptake compared to muscle glucose uptake.
Table 3
Summary of tested hypotheses.
Dataset
Hypothesis
Z1 Z2
Ma Intracellular signalling OK Rejected
Mb In vitro/vivo-different basal GLUT4
translocation
OK Rejected
Mc In vitro/vivo-different blood-flow OK Rejected
Md Multiple in vitro/vivo-differences OK OK
Nutritional state Total adipose
tissue glucose
uptake
Total muscle
glucose uptake
Ratio adipose
tissue / muscle
Reference
Postabsorptive state 5 % of total
glucose uptake
20 % of total
glucose uptake
20 / 80 (40)
Postprandial state 7-15 % of total
glucose uptake
35-40 % of total
glucose uptake
15-30 / 70-85 (40)
Euglycemic
hyperinsulinemia
9.5 % of total
glucose uptake
52.5 % of total
glucose uptake
15 / 85 (41)
Postprandial state 120 μmol/min 650 μmol/min 16 / 84 (42)

25
Table 4
Contents of datasets Z1-Z3.
Dataset Adipose tissue
module
constraints
Dose-response
phosphorylation
data
Glucose uptake
(0.5 mM
glucose)
Glucose uptake
(5 mM glucose)
Dynamic
phosphorylation
data*
Z1 X X X - -
Z2 X X X X -
Z3 X X X X X
*From (8).
Table 5
Summary of the detailed hierarchical models. The model equations are found in the supplemental file
ModelFiles.zip
Detailed model Included modules/sub-modules
M1
Md3 + Mifa (from (8))
M2 M
1 + downstream signaling details
M3 M
2 + Kiselyov model (from (5))


![In vivo cardiac phase response curve elucidates human ...mros/pdf/NatCommPRC.pdf · In vivo cardiac phase response curve elucidates human respiratory heart rate ... science [9 {11],](https://static.fdocuments.in/doc/165x107/5b7bc69f7f8b9a474a8d5cf1/in-vivo-cardiac-phase-response-curve-elucidates-human-mrospdfnatcommprcpdf.jpg)