A HANDBOOK OF DATA COLLECTION TOOLS ......Page 4 A Handbook of Data Collection Tools Focus Group:...
51
A HANDBOOK OF DATA COLLECTION TOOLS: COMPANION TO “A GUIDE TO MEASURING ADVOCACY AND POLICY” FUNDED BY AND PREPARED FOR ANNIE E. CASEY FOUNDATION PREPARED BY ORGANIZATIONAL RESEARCH SERVICES RESEARCHED AND WRITTEN BY JANE REISMAN, PH.D. ANNE GIENAPP, M.P.A. SARAH STACHOWIAK, M.P.A.
Transcript of A HANDBOOK OF DATA COLLECTION TOOLS ......Page 4 A Handbook of Data Collection Tools Focus Group:...
A HANDBOOK OF DATA COLLECTION TOOLS: COMPANION TO “A GUIDE TO MEASURING ADVOCACY AND POLICY” FUNDED BY AND PREPARED FOR
ANNIE E. CASEY FOUNDATION PREPARED BY
ORGANIZATIONAL RESEARCH SERVICES RESEARCHED AND WRITTEN BY
JANE REISMAN, PH.D. ANNE GIENAPP, M.P.A. SARAH STACHOWIAK, M.P.A.

TABLE OF CONTENTS Introduction .........................................................................................................................1 Measuring Core Outcome Areas.........................................................................................1 Outcome Area: Shift in Social Norms .......................................................................... 2 Interview Protocol: Changes in Awareness and Prioritization............................... 2 Focus Group: Changes in Attitudes ........................................................................ 4 Meeting Observation Checklist: Changes in Community Members’
Beliefs about the Importance of a Particular Issue ............................................... 4 Survey: Changes in Prioritization of Specific Issues .............................................. 6 Rolling Sample Survey: Changes in Community Awareness .................................. 6 Outcome Area: Strengthened Organizational Capacity ............................................... 7 Self-Assessment Tool: Alliance for Justice Advocacy Capacity
Assessment ............................................................................................................... 7 Self-Assessment: Spider Diagram .......................................................................... 9 Self-Assessment: KIDS COUNT Self-Assessment Tool..........................................10 Outcome Area: Strengthened Alliances......................................................................12 Tracking Form: Intensity of Integration Assessment ...........................................12 Outcome Area: Strengthened Base of Support..........................................................14 Tools for Measuring Public Support.......................................................................15 Logs: Increased Public Involvement in an Issue............................................15 Log: Increased Engagement of Champions ...................................................15 Survey: Increased Public Involvement............................................................16 Self-Assessment: Checklist for Mobilization and Advocacy ..........................17 Tools for Measuring Media Support ......................................................................20 Media Tracking Form: Increased Media Coverage ........................................21 Composite News Scores: Media Impact.........................................................23 Log: Increased Visibility ...................................................................................23 Outcome Area: Improved Policies ...............................................................................24 Log: Legislative Process Tracking .........................................................................26 Log: Policy Tracking Analysis.................................................................................26 Survey: Assessing Number and Type of Policies..................................................28 Log: Monitoring Policy Implementation ................................................................28 Environmental Assessments: Changes in Physical Environments .....................30 Outcome Area: Changes in Impact .............................................................................32 Tools and Methods for Other Evaluation Designs........................................................... 33 Evaluation of Strategic Progress...................................................................................... 33 Method: Appreciate Inquiry Approach to Process Evaluation...................................34 Measuring Short-Term Incremental Objectives............................................................... 35 Case Study Documentation of Process and Impacts...................................................... 38 Method: Case Studies..................................................................................................38 Method: Theory-based Evaluation ..............................................................................40 Method: Use of Coding Protocol with Qualitative Data .............................................42 Reporting Tool: Alliance for Justice Advocacy Evaluation Tool .................................45

TABLE OF TOOLS Excerpted Questions from Policy Brief Stakeholder Survey ................................................. 3 Sample Focus Group Questions Regarding Attitudes about Welfare................................ 4 Observation Checklist for Meetings (Community, City Council) ........................................ 5 Sample Survey Questions: Community Members’ Perceptions about
Prioritization Of Issues ............................................................................................. 6 Excerpt from Alliance for Justice Advocacy Capacity Assessment Tool ........................... 8 Spider Diagram for Capacity Building Advocacy ................................................................ 9 KIDS COUNT Self-Assessment Tool ..................................................................................10 Partnership Integration Tracking Form .............................................................................14 Campaign Champions Data Collection Tool .....................................................................16 Example Questions from a Survey of Constituents Receiving “Issue Alerts” ................17 Excerpt from Build Initiative Checklist-..............................................................................19 Excerpt from KIDS COUNT Media Tracking Form ............................................................21 Born Learning Washington Monthly Media Tracking Form .............................................24 Legislative Process Tracking Log ......................................................................................26 Excerpt from Policy Tracking Analysis Tool .......................................................................27 Policy Tracking Form Example ..........................................................................................29 Sample Billboard Survey Form ..........................................................................................31 Sample Process Evaluation Questions: Appreciative Inquiry Approach ........................34 Interview Protocol: Intense Period Debrief ......................................................................40 Sample “So That” Chain ....................................................................................................41 Key Informant Interview Guide Sample Impact Questions .............................................43 Sample Coding Categories for Key Informant Interviews ...........................................................44

A Handbook of Data Collection Tools Page 1
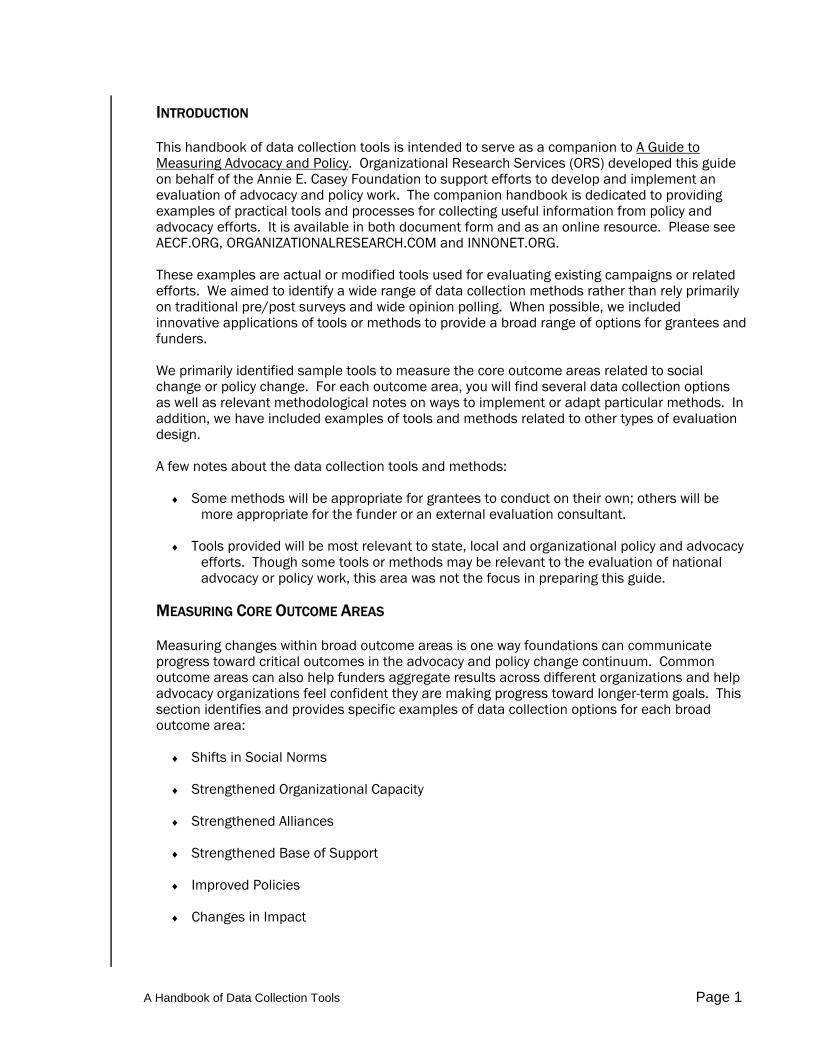
INTRODUCTION
This handbook of data collection tools is intended to serve as a companion to A Guide to Measuring Advocacy and Policy. Organizational Research Services (ORS) developed this guide on behalf of the Annie E. Casey Foundation to support efforts to develop and implement an evaluation of advocacy and policy work. The companion handbook is dedicated to providing examples of practical tools and processes for collecting useful information from policy and advocacy efforts. It is available in both document form and as an online resource. Please see AECF.ORG, ORGANIZATIONALRESEARCH.COM and INNONET.ORG.
These examples are actual or modified tools used for evaluating existing campaigns or related efforts. We aimed to identify a wide range of data collection methods rather than rely primarily on traditional pre/post surveys and wide opinion polling. When possible, we included innovative applications of tools or methods to provide a broad range of options for grantees and funders.
We primarily identified sample tools to measure the core outcome areas related to social change or policy change. For each outcome area, you will find several data collection options as well as relevant methodological notes on ways to implement or adapt particular methods. In addition, we have included examples of tools and methods related to other types of evaluation design.
A few notes about the data collection tools and methods:
♦ Some methods will be appropriate for grantees to conduct on their own; others will be more appropriate for the funder or an external evaluation consultant.
♦ Tools provided will be most relevant to state, local and organizational policy and advocacy efforts. Though some tools or methods may be relevant to the evaluation of national advocacy or policy work, this area was not the focus in preparing this guide.
MEASURING CORE OUTCOME AREAS
Measuring changes within broad outcome areas is one way foundations can communicate progress toward critical outcomes in the advocacy and policy change continuum. Common outcome areas can also help funders aggregate results across different organizations and help advocacy organizations feel confident they are making progress toward longer-term goals. This section identifies and provides specific examples of data collection options for each broad outcome area:
♦ Shifts in Social Norms
♦ Strengthened Organizational Capacity
♦ Strengthened Alliances
♦ Strengthened Base of Support
♦ Improved Policies
♦ Changes in Impact

Page 2 A Handbook of Data Collection Tools
OUTCOME AREA: SHIFT IN SOCIAL NORMS
Shifts in social norms include the knowledge, attitudes, values and behaviors that compose the normative structure of culture and society. Advocacy and policy work has become increasingly focused on this area of changes in recognition of the importance of aligning advocacy and policy goals with core or enduring social values and behaviors. Shifts in social norms comprise many types of changes, including the following:
♦ Changes in awareness;
♦ Increased agreement about the definition of a problem;
♦ Changes in beliefs/attitudes/values; and
♦ Changes in the salience/importance of an issue,
Because changes in norms require determining how people feel and think about particular issues, data collection methods will typically include surveys, focus groups or interview questions. The unit of analysis for this outcome area includes either individuals at large or specific groups of individuals or population groups. When evaluating this outcome area, it is important to identify who has been targeted for change. This could range from the general population in a city or geographical region to a population group, such as the working poor, to a smaller targeted group of legislators.
Interview Protocol: Changes in Awareness and Prioritization
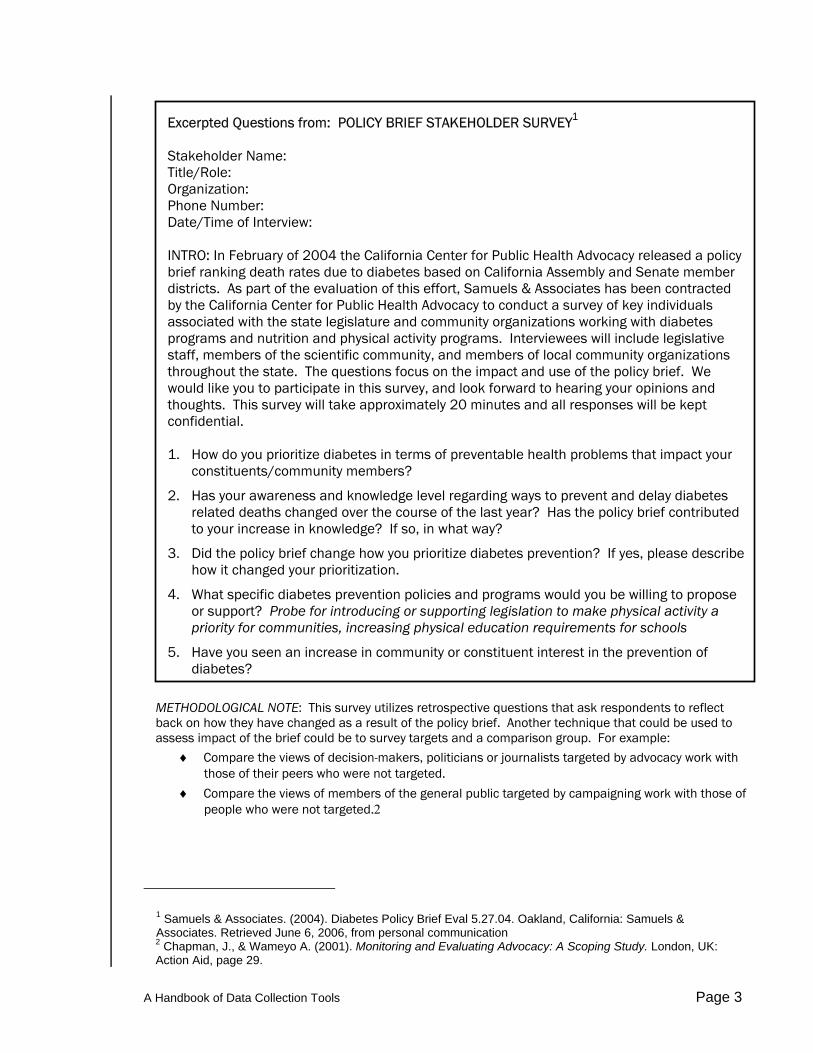
Samuels & Associates ─ a public health evaluation, research and policy consulting firm in California ─ evaluated the impact of a policy brief released by the California Center for Public Health (CCPH) that provided information on death rates due to diabetes based on California senate and assembly member districts. Samuels & Associates surveyed stakeholders to learn, in part, how they had changed their awareness and knowledge levels regarding prevention of diabetes and prioritized the issue as a result of the policy brief.
A Handbook of Data Collection Tools Page 3
Excerpted Questions from: POLICY BRIEF STAKEHOLDER SURVEY1 Stakeholder Name: Title/Role: Organization: Phone Number: Date/Time of Interview: INTRO: In February of 2004 the California Center for Public Health Advocacy released a policy brief ranking death rates due to diabetes based on California Assembly and Senate member districts. As part of the evaluation of this effort, Samuels & Associates has been contracted by the California Center for Public Health Advocacy to conduct a survey of key individuals associated with the state legislature and community organizations working with diabetes programs and nutrition and physical activity programs. Interviewees will include legislative staff, members of the scientific community, and members of local community organizations throughout the state. The questions focus on the impact and use of the policy brief. We would like you to participate in this survey, and look forward to hearing your opinions and thoughts. This survey will take approximately 20 minutes and all responses will be kept confidential.
1. How do you prioritize diabetes in terms of preventable health problems that impact your
constituents/community members?
2. Has your awareness and knowledge level regarding ways to prevent and delay diabetes related deaths changed over the course of the last year? Has the policy brief contributed to your increase in knowledge? If so, in what way?
3. Did the policy brief change how you prioritize diabetes prevention? If yes, please describe how it changed your prioritization.
4. What specific diabetes prevention policies and programs would you be willing to propose or support? Probe for introducing or supporting legislation to make physical activity a priority for communities, increasing physical education requirements for schools
5. Have you seen an increase in community or constituent interest in the prevention of diabetes?
METHODOLOGICAL NOTE: This survey utilizes retrospective questions that ask respondents to reflect back on how they have changed as a result of the policy brief. Another technique that could be used to assess impact of the brief could be to survey targets and a comparison group. For example:
♦ Compare the views of decision-makers, politicians or journalists targeted by advocacy work with those of their peers who were not targeted.
♦ Compare the views of members of the general public targeted by campaigning work with those of people who were not targeted.2
1 Samuels & Associates. (2004). Diabetes Policy Brief Eval 5.27.04. Oakland, California: Samuels & Associates. Retrieved June 6, 2006, from personal communication 2 Chapman, J., & Wameyo A. (2001). Monitoring and Evaluating Advocacy: A Scoping Study. London, UK: Action Aid, page 29.

Page 4 A Handbook of Data Collection Tools
Focus Group: Changes in Attitudes
Focus groups are facilitated discussions with a small group that can allow you to see an issue from community members’ perspectives. Focus groups can help explain how people regard an experience, idea or event and provide more detailed and richer information than a single interview because of the interaction among members of the group. However, there is also the danger that some participants may be inhibited about expressing information contrary to the group sentiment. Therefore, it is useful to consider holding focus groups with “like” groups and holding multiple groups to gather information.
Sample Focus Group Questions regarding Attitudes about Welfare3
1. What do you think the government’s role should be in relation to poverty and poor
people? (Probes: Should it be a safety net? Should the government provide a ladder of opportunity to families in need?)
2. What should the federal government’s priorities be for the welfare system? 3. Do you think the current welfare system encourages or discourages poor people to find
work? Why? 4. How do you feel about current government spending on programs to help people on
welfare move to work? 5. How do you feel about Congress promoting marriage among parents on welfare? 6. What are concerns you have about the current welfare system? What is your biggest
concern? 7. What do you think the government should do to improve the welfare system?
METHODOLOGICAL NOTE: Focus groups can be held over time to assess changes that might occur in relation to activities that have been conducted; alternatively, focus groups can be held after activities have occurred. Be sure to find out if participants are aware of or have been impacted by activities as well as how their feelings or beliefs have changed as a result. Meeting Observation Checklist: Changes in community members beliefs about the importance of a particular issue
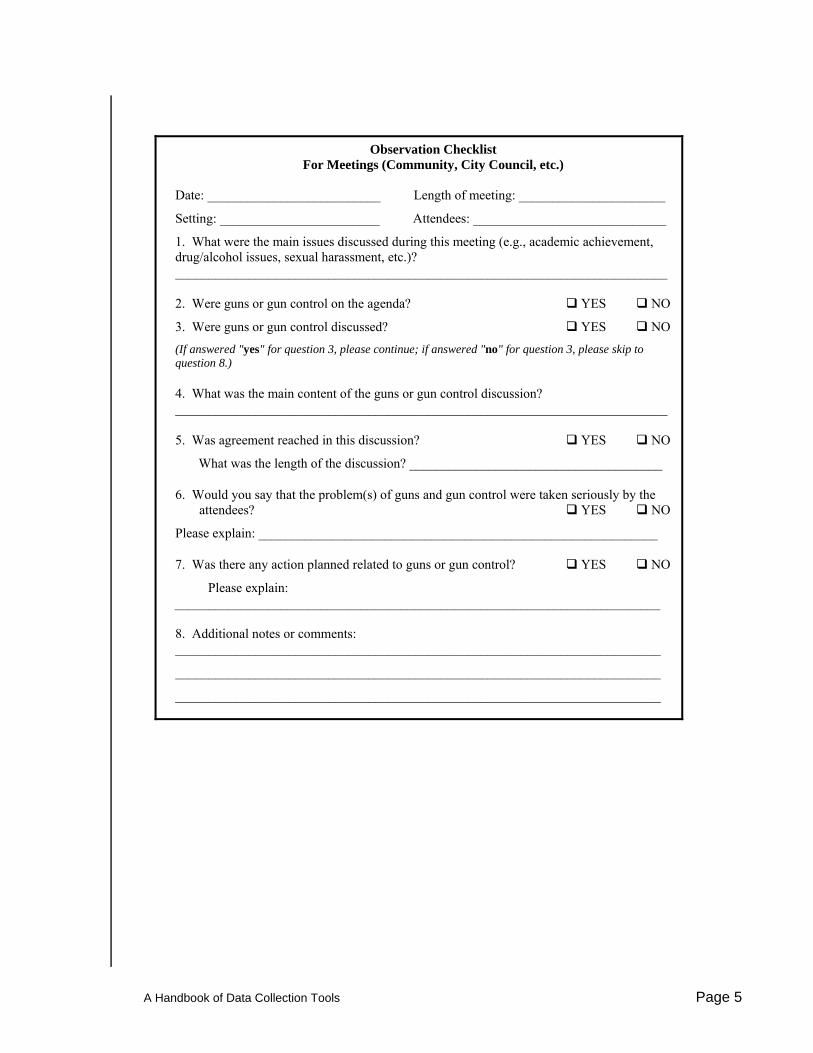
To move toward policy change, advocates may need to see how communities and groups prioritize specific issues. When an issue is a higher priority to community members, you can expect to see more activity in that area. For example, a simple observation checklist can help you capture how often an issue is placed on a meeting agenda, whether it was discussed, what the main content was, the discussion length and the perception of ‘seriousness’.
3 Peter D. Hart Research Associates, Inc. (2001). Study #6502b: Casey-TANF. Washington, D.C.: Peter D. Hart Research Associates, Inc.
A Handbook of Data Collection Tools Page 5
Observation Checklist For Meetings (Community, City Council, etc.)
Date: __________________________ Length of meeting: ______________________
Setting: ________________________ Attendees: _____________________________
1. What were the main issues discussed during this meeting (e.g., academic achievement, drug/alcohol issues, sexual harassment, etc.)? __________________________________________________________________________
2. Were guns or gun control on the agenda? YES NO
3. Were guns or gun control discussed? YES NO
(If answered "yes" for question 3, please continue; if answered "no" for question 3, please skip to question 8.)
4. What was the main content of the guns or gun control discussion? __________________________________________________________________________
5. Was agreement reached in this discussion? YES NO
What was the length of the discussion? ______________________________________
6. Would you say that the problem(s) of guns and gun control were taken seriously by the attendees? YES NO
Please explain: ____________________________________________________________
7. Was there any action planned related to guns or gun control? YES NO
Please explain: _________________________________________________________________________ 8. Additional notes or comments: _________________________________________________________________________
_________________________________________________________________________
_________________________________________________________________________

Page 6 A Handbook of Data Collection Tools
Survey: Changes in Prioritization of Specific Issues
These survey questions elicit data on how community members’ perceptions of how others in the community prioritize issues compare to their personal prioritization.
Sample Survey Questions: Community Members’ Perceptions About Prioritization Of Issues How seriously do you think your COMMUNITY treats each of the following problems?
1 2 3 4 5 Not Very Seriously Very Seriously
CHOOSE A NUMBER FROM THE SCALE ABOVE THAT SHOWS HOW SERIOUSLY YOU THINK YOUR COMMUNITY TREATS EACH PROBLEM, AND WRITE THE NUMBER (1-5) IN THE SPACE BESIDE EACH PROBLEM.
___Living Wage ___K-12 Education ___Early Education ___Environmental Issues ___Access to Health Care ___Transportation
___Child Abuse ___Privacy Issues How seriously do YOU treat each of the following problems?
1 2 3 4 5 Not Very Seriously Very Seriously
CHOOSE A NUMBER FROM THE SCALE ABOVE THAT SHOWS HOW SERIOUSLY YOU TREAT EACH PROBLEM, AND WRITE THE NUMBER (1-5) IN THE SPACE BESIDE EACH PROBLEM. ___Drug and alcohol abuse ___Teen Pregnancy
___Living Wage ___K-12 Education ___Early Education ___Environmental Issues ___Access to Health Care ___Transportation
___Child Abuse ___Privacy Issues
Rolling Sample Survey; Changes in Community Awareness4
An evaluation of the “Voluntary Ozone Action Program” in Atlanta, Georgia, focused on assessing changes in awareness about and the importance of ground-level ozone in the Atlanta region related to a public information campaign. Rolling sample surveys (daily tracking surveys) were the primary assessment method. These surveys obtained measures from an independent sample of 32 residents each day; once individuals were interviewed, they were not interviewed again. The surveys queried individuals about 30 behavioral, awareness, and attitudinal items including the importance of five issues from a personal and community standpoint, awareness of ozone alerts, perceived efficacy and perceived personal health risks.
Results showed that ozone alerts increased the amount of awareness about ground-level ozone. Those who were more aware of ozone said the issue was more important to them. Greater exposure to media messages and articles published on the front page increased awareness, whereas articles in the newspaper’s Metro section did not.
4 Coffman, J. (2003). Lessons in Evaluating Communications Campaigns: Five Case Studies. Retrieved May 31, 2006, from http://www.gse.harvard.edu/hfrp/pubs/onlinepubs/lessons/stop.html. Pages 19-24.

A Handbook of Data Collection Tools Page 7
Though this evaluation was sophisticated and resource-intensive, its implementation provided definitive findings about the campaign’s effectiveness. The rolling sample survey methodology, adapted from political polling methods, was useful because it was possible to know which days were ozone alert days, and the process did not require repeating surveys with the same people or asking people to remember or predict behavior. The surveys also measured public opinion over time, providing data to test messages and opportunities for ongoing learning. While most agencies will not have the capacity to use this type of methodology, it offers a good example of how a funder that invests in an intensive or more broadly focused communications campaign could support evaluation of outcomes related to that effort.
Other Evaluative Considerations
In addition to assessing the changes in awareness, values and attitudes, funders and grantees may also want to consider the contextual factors that may impact the effectiveness of their efforts. This can include process evaluation (understanding the implementation of the strategies and efforts) or formative evaluation of the messaging itself (assessing whether the message/strategy is likely to reach the intended audiences and achieve intended objectives). Many organizations have developed tools to help test and assess messages and communications materials. For example, organizations that have adopted the Frameworks Institute’s Strategic Framing Analysis for communications could use the checklist developed by Frameworks to ensure utilization of the Frameworks strategies in their message development.5 Evaluating factors such as relevance, resonance of message and alignment of messages with other societal values can be an important step toward achieving social norm changes.
OUTCOME AREA: STRENGTHENED ORGANIZATIONAL CAPACITY
One key component of successful advocacy work is having a strong organization that is able to respond to conditions and opportunities nimbly and effectively. Organizational capacities include the skill set, staffing and leadership, organizational structure and systems, finances, and strategic planning among non-profit organizations and formal coalitions that plan and carry out advocacy and policy work. The development of these core capacities is critical to the organization’s ability to implement and sustain advocacy and policy change efforts. The tools for this area include several different self-assessments that allow agencies to identify strengths and areas for growth while providing measures to observe change over time. The unit of analysis for evaluating this outcome area includes advocacy or non-profit organizations and coalitions. Sample outcomes include the following:
♦ Improved organizational capacity of organizations involved with advocacy and policy work (e.g., management, strategic abilities, effectiveness)
♦ Increased ability of organization to identify policy change process.
Self Assessment Tool: Alliance for Justice Advocacy Capacity Assessment
Alliance for Justice, in collaboration with The George Gund Foundation, developed new advocacy evaluation and advocacy capacity assessment tools for foundations to use with grantees and prospective grantees. They were assisted in this endeavor by Mosaica: The Center for Nonprofit Development and Pluralism. Using a pragmatic approach to evaluation, Build Your Advocacy Grantmaking: Advocacy Evaluation Tool & Advocacy Capacity Assessment
5 Bales, S.N. (2002). Framing Public Issues. Retrieved 2006, from http://www.frameworksinstitute.org/strategicanalysis/FramingPublicIssuesfinal.pdf, pages 33-35

Page 8 A Handbook of Data Collection Tools
Tool is designed to assist both private and public foundations, as well as grantees that are seeking better evaluation methods.6
Foundations can use the Advocacy Capacity Assessment Tool to assess the advocacy capacity of a prospective or current grantee, work with the grantee to develop a plan for building its advocacy capacity, or serve as a catalyst for discussion among the foundation’s staff or with grantees. The nine indicators in this tool, divided into three categories ― organizational, relationship, and knowledge and skills ― describe capacities to which an organization should aspire if it wants to institutionalize its advocacy work. However, no one organization is necessarily expected to achieve all capacities.
Excerpt from Advocacy Capacity Assessment Tool7
Advocacy Agenda: The organization has a clearly defined agenda in place to guide advocacy activities. The agenda may be organization-wide or project-specific and may cover one year or multiple years.
Measures:
STATEMENT IS:
True, and functioning
well
True, but needs
strengthening Not true, but in process
Not true, but under
consideration
Not true and not desired
1. The organization has a written agenda, adopted by its board, that identifies the organization’s priorities (such as issue priorities) for legislative and other types of advocacy.
2. The agenda is based on research and analysis, including an analysis of constituent needs, the impact of current policies, and the policy environment.
6 To order Build Your Advocacy Grantmaking: Advocacy Evaluation Tool & Advocacy Capacity Assessment Tool, e-mail [email protected] or call 1-866-675-6229 or 202-822-6070, or visit www.allianceforjustice.org. If you would like to discuss this model, please contact Marcia Egbert ([email protected]) at The George Gund Foundation or Susan Hoechstetter ([email protected]) at Alliance for Justice. 7 Alliance for Justice. (2005). Build Your Advocacy Grantmaking: Advocacy Capacity Assessment Tool. Washington, D.C.: Alliance for Justice

A Handbook of Data Collection Tools Page 9
Self-Assessment: Spider Diagram8,9
Another tool for organizations to assess their competencies for advocacy work over time, the “Spider Diagram,” provides an opportunity to represent a capacity assessment graphically. Program staff can consider aspects of capacity for advocacy work and collectively decide how they would place themselves ― or they can use an external facilitator to employ this evaluation method. Organizations can assess their level for seven dimensions within the diagram on a scale of zero to three.
0=undesirable level calling for a large amount of improvement 1=poor level having much room for improvement 2=good situation with room for improvement 3=ideal situation with little room for improvement
8 Chapman, J., & Wameyo A., op.cit. Note: Spider Diagram for Capacity Building for Advocacy is copyrighted and appears with permission from Save the Children UK. 9 Gosling, L. and Edwards, M. (1995) Toolkits: A practical guide to non-profit monitoring and evaluation. Save the Children Fund

Page 10 A Handbook of Data Collection Tools
Self-Assessment: KIDS COUNT Self-Assessment Tool 10
The KIDS COUNT Network Self-Assessment Tool, designed by Innovation Network, is geared toward helping KIDS COUNT grantees assess their work in Data Collection and Analysis, Communications and Dissemination, Policy Analysis, Community and Constituency Mobilization, and Fund Development/Sustainability. The tool includes a ratings section and related work plan for further improvement in each assessment area.
How well did we do this activity?
Policy analysis activities
Out
stan
ding
Satis
fact
ory
Nee
ds w
ork
Not
app
licab
le
1) Identify priority policy issues Definitions: Outstanding = Project identifies and tracks its priority policy issues, which
are consistent with the mission and goals of the project and relevant to the analysis of KIDS COUNT data. There is a system in place that allows the project to periodically review its priorities and alter them as needed. Project is knowledgeable about the priorities of other organizations.
Satisfactory = Project tracks its priority policy issues, but there is no system in place to periodically review the priorities. Project may be knowledgeable about the priorities of other organizations.
Needs work = Project does not identify and track its priority policy issues, nor is there a system in place to periodically review the priorities. Project not aware of the priorities of other organizations.
10 Innovation Network, Inc. (2005). KIDS COUNT Network Self-Assessment Tool: Policy Analysis. Washington, D.C.: Innovation Network, pages 18-2o. These materials were developed by Innovation Network, Inc. in collaboration with the KIDS COUNT Self-Assessment Working Group.

A Handbook of Data Collection Tools Page 11
2) Use data to contribute to policy issues
Definitions: Outstanding = Project consistently brings data to bear on policy issues,
and, if not already collecting data on an important issue, attempts to collect it and report on it. Project seeks opportunities to offer data related to policy issues.
Satisfactory = Project sometimes links their data to the policy issues, and may collect and report on data on an important issue if available. Project responds to data requests related to policy issues.
Needs work = Project does not link their data to the policy issues or collect data on an important issue even if available.
3) Analyze state legislation Definitions: Outstanding = Project consistently tracks legislation related to child
wellbeing, stays apprised of upcoming and pending bills, attends hearings or reviews official records of the hearings, and reports on the implications of the bills on child wellbeing.
Satisfactory = Project occasionally tracks legislation related to child wellbeing, and is somewhat informed about the legislation and its outcome. May attend hearings and report on policy implications on child wellbeing.
Needs work = Project does not track legislation related to child wellbeing and does not attend hearings or report on policy implications on child wellbeing.
4) Produce and disseminate special reports and issue briefs on policy issues
Definitions: Outstanding = Project keeps its constituents informed of important policy
issues by consistently producing and disseminating special reports and issue briefs on policy issues using data.
Satisfactory = Project sometimes produces and disseminates special reports and issue briefs for its constituents.
Needs work = Project does not produce and disseminate special reports and issue briefs.
5) Research and report on promising programs for children Definitions: Outstanding =Project conducts formal research on promising programs for
children in the state and reports on the research findings on at least an annual basis.
Satisfactory = Project informally collects information on promising programs for children in the state and includes its research in data products.
Needs work = Project does not research or report on promising programs for children in the state.

Page 12 A Handbook of Data Collection Tools
The McKinsey Capacity Assessment Grid is another tool designed to help nonprofit organizations assess their organizational capacity across seven elements. While this method provides a good overall assessment of a non-profit, a few areas have particular relevance to capacities related to policy and advocacy work. Changes over time could be assessed by having organization representatives complete the assessment at two time points or by assessing themselves retrospectively for a certain time point in the past. The full assessment is available at: http://www.venturepp.org/learning/reports/capacity/assessment.pdf. The developers also note that the tool is a starting point for assessing capacity, and they encourage users to adapt this tool to meet their particular capacity assessment needs.
OUTCOME AREA: STRENGTHENED ALLIANCES
Partnership development is often an important activity for policy and advocacy efforts. Changes in alliances include the level of coordination, collaboration and alignment among community and system partners. These structural changes in communities and institutions have become essential forces in presenting common messages, pursuing common goals, enforcing policy changes and insuring the protection of policy ‘wins” if they are threatened. Outcomes related to partnership development include the following:
♦ Increased number of partners supporting an issue;
♦ Increased levels of collaboration between partners;
♦ Improved alignment of partnership efforts; and,
♦ Increased strategic breadth or diversity of partnerships.
The units of analysis for alliance outcomes include individuals, groups, organizations and/or institutions. Choosing the correct unit will depend on the target of these efforts i.e., are advocates hoping to partner with other organizations, such as a union or affinity group, or individuals, such as key business leaders?
Tracking Form: Intensity of Integration Assessment
Organizations often need to work with multiple partners at varying levels of collaboration to accomplish policy goals. Some alliances may be geared toward networking and information sharing, while others may involve joint planning or other more intense levels of collaboration. The following framework provides a continuum of levels of integration that organizations may develop.

A Handbook of Data Collection Tools Page 13
Intensity of Integration Continuum11
Informal Formal 1 2 3 4 5 6 7 8 9 10
Information Sharing and Communication
Cooperation and Coordination
Collaboration Consolidation Integration
Level Activities
Information Sharing and Communication
Talk with one another Willingness to help on ad hoc basis Share information
Cooperation and Coordination
Do joint planning on specific program components Joint staff meetings Factor in what is happening on other side when
operating program [campaigns]
Collaboration
Informal/Formal joint planning Joint funding Written MOUs or interagency agreements Effort to share funding/services
Consolidation
Formalized joint planning Regular meetings of key players Cross-training of staff Designated planning council
Integration Shared funding of key positions (boundary-spanners) Joint budget development Pooled funding
Organizations should consider the goals of the partnership, i.e., the specific dimensions for which they are assessing the level of integration. For example, organizations may assess their level of integration with other organizations specifically for a particular campaign focus area (e.g., gun control, land protection) or a specific campaign (e.g., get out the vote campaign, a specific initiative).
11 Konrad, E. (1996). A multidimensional framework for conceptualizing human service integration initiatives. New Directions for Evaluation, 69, 5-19

Page 14 A Handbook of Data Collection Tools
Partnership Integration Tracking Form
Partner: _________________________________________________________
Date: ___________________________________________________________
Baseline level of integration (1-10): ___________________________________
Notes: Why was this level chosen? What are specific examples that reflect this relationship? ______________________________________________________
_________________________________________________________________
_________________________________________________________________
Follow-up Date: ___________________________________________________
Level of integration (1-10):
Notes: Why was this level chosen? What are specific examples that reflect this relationship? ______________________________________________________
_________________________________________________________________
_________________________________________________________________
METHODOLOGICAL NOTE: Organizations interested in tracking the diversity of their alliances may also want to look at tools in the following outcome area related to strengthening the base of support.
Other Evaluative Considerations
In addition to assessing outcomes related to collaboration levels, some groups may also benefit from learning more about the functioning of their partnerships. Many easy-to-use partnership assessments are available that measure aspects of how well a partnership’s collaborative process is working, such as looking at the “synergy” of a partnership. The Partnership Self-Assessment Tool (www.cacsh.org)12 is one example of a tool whose measures are applicable to partnerships that focus on any kind of goal as well as those which meld various combinations of people and organizations.
OUTCOME AREA: STRENGTHENED BASE OF SUPPORT
Strengthened base of support outcomes include the grassroots, leadership and institutional support for particular policy changes. The breadth and depth of support among the general public, interest groups and opinion leaders for particular issues provides a major structural condition for supporting changes in policies. Whether your particular paradigm for achieving community-level change focuses on engaging a broad base of community members or a few key influentials, it may be useful to assess the breadth and depth of support among your target audience throughout a campaign The following outcomes relate to this area:
♦ Increased public involvement in an issue;
♦ Increased level of actions taken by champions of an issue;
♦ Increased voter registration;
12 Center for the Advancement of Collaborative Strategies in Health. (2006). Available at: www.cacsh.org
A Handbook of Data Collection Tools Page 15
♦ Changes in voter behavior;
♦ Increased breadth of partners supporting an issue;
♦ Increased media coverage; and,
♦ Increased visibility of the campaign message.
As with partnership outcomes, the unit of analysis for change encompasses individuals, groups, organizations or institutions. The focus of evaluation will depend on the type of activities undertaken and the target of those efforts.
Tools for Measuring Public Support
Logs: Increased Public Involvement in an Issue
Simple logs can provide useful information about involvement in an issue by looking at participation over time. These could track:
♦ Levels of organizations and activism at the grassroots level13
• number of groups working on the issue • membership levels • levels of activity around the issue.
♦ Grassroots involvement
• #/% voters registered • % turnout at elections • % vote for priority issue
♦ Civic Engagement
• attendance at events Log: Increased Engagement of Champions
Born Learning, a public engagement campaign developed by United Way of America and United Way Success By 6 in partnership with the Ad Council, Civitas and Families and Work Institute, helps parents, grandparents and caregivers explore ways to turn everyday moments into fun learning opportunities for young children.14 The Born Learning campaign includes a mobilization component for community early learning efforts. As part of the Born Learning Washington campaign, communities that implement the campaign locally are tracking the number of champions engaged, as well as the actions these champions undertake.
13 Bruner, C. (2006). State Baseline Information for the Build Initiative. Des Moines, Iowa: Child & Family Policy Center for the Build Initiative 14 Born Learning (2006). Born Learning.Org: About Us. Retrieved June 9, 2006, from www.bornlearning.org

Page 16 A Handbook of Data Collection Tools
Campaign Champions Data Collection Tool15 Instructions: Please indicate champions with whom Born Learning has engaged each month and who have taken actions (e.g., people engaged from diverse segments of the community to advocate on behalf of early education).
a. Champions are individuals who take actions to advance the public will outcomes.
b. Examples of actions taken are written or verbal communication, convening of meetings, policy proposals, coalition development. Actions taken can be small steps or major developments and they reflect initiation on the part of a champion for early education.
Name of
Champion Affiliation Action Taken Date
METHODOLOGICAL NOTE: As the campaign begins, communities are collecting open-ended qualitative data for the types of actions taken. Over time, Born Learning Washington will likely develop standard categories for both the types of champions engaged (e.g., business, faith-based, K-12) and the types of actions champions typically take (e.g., convening meetings, speaking at public events, writing letters to the editor) based on the data collected. With these data, they will be able to assess the change in number of active champions engaged and increases in the level of support based on their documented actions.
Survey: Increased Public Involvement
The Children’s Alliance, an advocacy organization in Seattle, Washington, issues Children’s Action Alerts to its members via email, mail and fax. In 1999, the Children’s Alliance decided to measure the effectiveness of this strategy by surveying its membership about actions taken, along with additional questions to improve their alerts. An organization with a similar interest could implement a survey of a sample of constituents or stakeholders that asked the following kinds of questions:
15 Bruner, C. (2005). Build Initiative Self-Assessment Checklist for Mobilization and Advocacy. Des Moines, Iowa: Child & Family Policy Center for the Build Initiative

A Handbook of Data Collection Tools Page 17
EXAMPLE QUESTIONS FOR A SURVEY OF CONSTITUENTS RECEIVING “ISSUE ALERTS” 1. Please indicate much you agree or disagree with the following statements. Since receiving email alerts: Strongly
Disagree Disagree Neither
Agree Nor Disagree
Agree Strongly Agree
I am more knowledgeable about [issue]. I am more knowledgeable about how to counter opposition on [issue ].
I am more knowledgeable about what I can do to support [issue].
I am more motivated to support [issue]. I have told others about the issue. I have told others what they can do about the issue.
2. Due to an “Issue Alert” I received, I have (check all that apply) □ Made a donation to support [issue] □ Read a report or additional material about [issue] □ Emailed a legislator about [issue] □ Called a legislator about [issue] □ Attended an event related to [issue[ □ Volunteered, e.g., collected signatures for ballot initiative, made calls, done other volunteering for an
organization that supports [issue] □ Forwarded an “Issue Alert” to other individuals □ Encouraged other individuals to take action regarding [issue] □ Other (please describe):
Self-Assessment: Checklist for Mobilization and Advocacy
The Build Initiative is a multi-state partnership that helps states construct a coordinated system of programs, policies and services that responds to the needs of young children and their families. The partnership supports those who set policies, provide services and advocate for children from birth through age five so that our youngest children are safe, healthy, eager to learn and ready to succeed in school. Build serves as a catalyst for change and a national resource on early learning.16 One goal for states affiliated with Build is to develop “effective champions for building an early learning system across a range of different constituent bases that go well beyond those who are part of the provider community. These champions promote early learning system building to political leaders and within their own sphere of influence.” 17
16 Early Childhood Funders' Collaborative (2002). BUILD: About Build. Retrieved June 9, 2006, from http://www.buildinitiative.org/aboutbuild.html 17 Bruner. (2005) State Baseline, op. cit.

Page 18 A Handbook of Data Collection Tools
As part of its overall evaluation, states that partner with Build received a self-assessment checklist to help assess their progress in developing an early learning system. The self-assessment is intended to help these states better understand where they are now and what areas and actions they should focus on in the future. The following tool sample shows the assessment of the mobilization and advocacy efforts.
Though the sample partners may be specific to an early learning campaign, this list could be modified to include the appropriate partners or potential champions for any advocacy effort.

A Handbook of Data Collection Tools Page 19
Excerpt from Build Initiative Self-Assessment Checklist18
For each of the potential champions identified, mark a number from 1-5 that best represents where they are today in regards to mobilization and advocacy activities. If desired, also check those areas where Build and the state have made substantial progress since Build began.
Powerful friends abound and are
willing and frequent spokespersons for systems building,
willingly using political capital to gain support from policy makers and
within their own constituencies
Some new champions have
been identified and are taking some public steps to
support systems building, but not
generally at the top of their agendas nor used to enlist others
to be supporters
Limited champions with other interest groups not seeing any relevance to
their work and as a possible
competing demand on policy
resources and action
Substantial progress has been made
(check for yes)1 2 3 4 5
Corporate leaders and economic development heads
1 2 3 4 5
Local businesses and chambers of commerce 1 2 3 4 5
Law enforcement and corrections
1 2 3 4 5
Faith communities 1 2 3 4 5
Seniors
1 2 3 4 5
Doctors and leaders in health care 1 2 3 4 5
School superintendents
1 2 3 4 5
Elementary school principals and teachers 1 2 3 4 5
Parent organizations
1 2 3 4 5
18 Bruner, C. (2005). Build Initiative Self-Assessment, op. cit.

Page 20 A Handbook of Data Collection Tools
Based upon the answers to the above, complete the overview statements for this element:
Powerful friends abound and are
willing and frequent spokespersons for systems building,
willingly using political capital to gain support from policy makers and
within their own constituencies
Some new champions have
been identified and are taking some public steps to
support systems building, but not
generally at the top of their agendas nor used to enlist others
to be supporters
Limited champions with other interest groups not seeing any relevance to
their work and as a possible
competing demand on policy
resources and action
Substantial progress has been made
(check for yes)
1 2 3 4 5
After completing this section, what specific actions do you think could be taken by Build in this area? Please highlight any actions that should represent priority actions.
_______________________________________________________________________________________________________________________________________________________________________________________________________________________________________________________________________________________________________________________________________________________________________________________
METHODOLOGICAL NOTE: The self-assessment can be used by a small group of stakeholders or by a broad collaborative. It can also be completed individually. Compiled results can identify areas of agreement and concern among different stakeholders. The method by which the data are collected needs to be the same at each time point to have comparable data over time.
Tools for Measuring Media Support
Media support can be an integral part of strengthening the base of support for an issue or campaign. Because there are a number of data collection tools and methods that are specific to measuring changes within media coverage, they are grouped together below.

A Handbook of Data Collection Tools Page 21
Excerpts from KIDS COUNT Media Tracking Form19
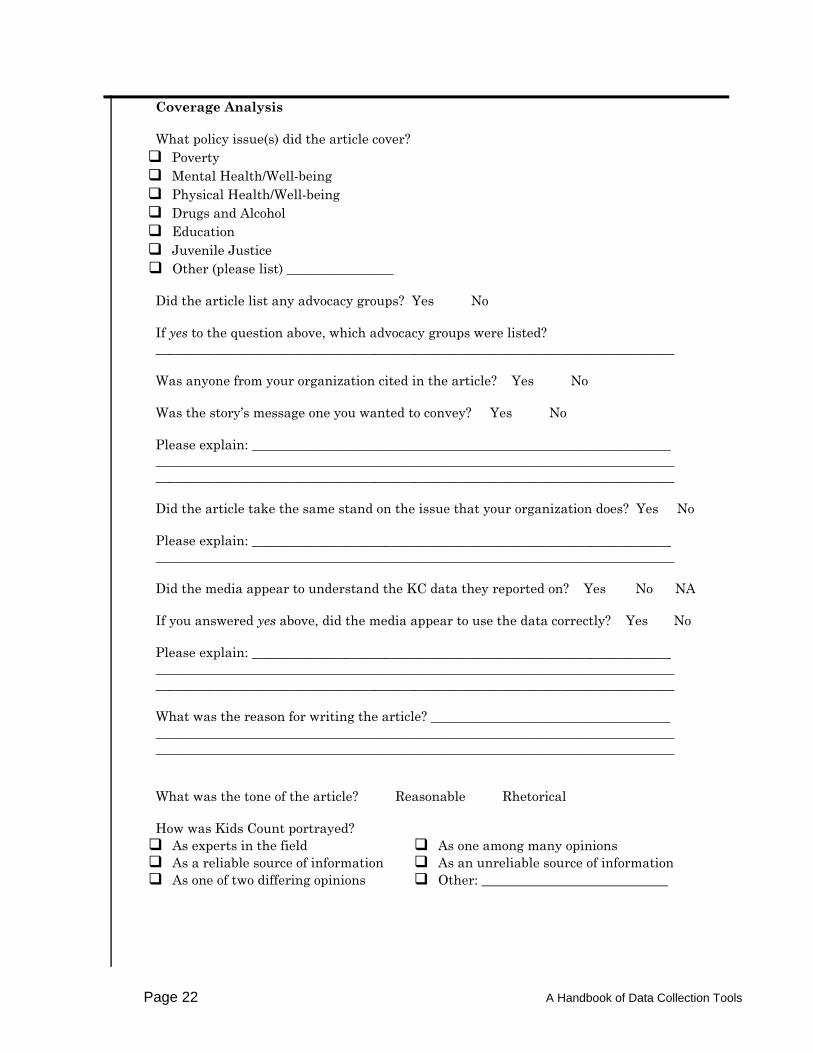
Media Tracking Form: Increased media coverage KIDS COUNT grantees track their ability to disseminate messages and gain support for important issues that affect children and families. This tool, developed by Innovation Network for the Annie E. Casey Foundation, provides an easy way for organizations to systematically track how effectively and accurately KIDS COUNT projects receive coverage in the media.
Publication Information
Story Title/Media Outlet:________________________________________________________ Date of story: ________________________ Author: ________________________________
Publication Type (circulation): Newspaper (_____________________) Magazine (______________________) Newsletter (_____________________) Radio (__________________________) TV (_____________________________) Online publication (______________) Other (_____________)
Geographic Reach: City Region State National International
How often is it published?
Daily Weekly Bi-Weekly Monthly Yearly
Placement Information
Story Source: Press release Press conference Special event Initiated by media Personal contact Prompted by local issue In response to other advocacy news
Story type: News story Feature article Editorial Column Letter to the editor Mention in a child advocacy article Other: ___________________________
Size of article (paragraphs): _____________ Size of article (inches): __________________ Duration of newscast (min): _____________ Photo: Yes No Of what? ______________________________
19 Innovation Network, Inc., Op. cit.
Page 22 A Handbook of Data Collection Tools
Coverage Analysis
What policy issue(s) did the article cover? Poverty Mental Health/Well-being Physical Health/Well-being Drugs and Alcohol Education Juvenile Justice Other (please list) ________________
Did the article list any advocacy groups? Yes No
If yes to the question above, which advocacy groups were listed? ______________________________________________________________________________
Was anyone from your organization cited in the article? Yes No
Was the story’s message one you wanted to convey? Yes No
Please explain: _______________________________________________________________ ______________________________________________________________________________ ______________________________________________________________________________
Did the article take the same stand on the issue that your organization does? Yes No
Please explain: _______________________________________________________________ ______________________________________________________________________________
Did the media appear to understand the KC data they reported on? Yes No NA
If you answered yes above, did the media appear to use the data correctly? Yes No
Please explain: _______________________________________________________________ ______________________________________________________________________________ ______________________________________________________________________________
What was the reason for writing the article? ____________________________________ ______________________________________________________________________________ ______________________________________________________________________________
What was the tone of the article? Reasonable Rhetorical
How was Kids Count portrayed? As experts in the field As a reliable source of information As one of two differing opinions
As one among many opinions As an unreliable source of information Other: ____________________________

A Handbook of Data Collection Tools Page 23
What is your reaction to the story? _____________________________________________ ______________________________________________________________________________ ______________________________________________________________________________ ______________________________________________________________________________
Other notes: ______________________________________________________________________________ ______________________________________________________________________________ ______________________________________________________________________________
Composite News Scores: Media Impact20
While many advocacy organizations report the number of times that articles are published about a topic, the gross number of publications does not necessarily correlate with the likely impact of these articles. Evaluators of the Community Trials Project, a five-year comprehensive prevention strategy to reduce the incidence of alcohol-related risk factors and outcomes, developed a composite news score metric to provide a more meaningful gauge of media coverage. The tool compiled data for a community on the following:
♦ Total number of stories
♦ Total area or time allotted to each story
♦ Total number of news stories above average length
♦ Total stories with pictures and graphics
♦ Total stories on the front page or in the local TV news program
The evaluation teams selected articles from the first two sections of daily newspapers, as well as the editorials and letters to the editor. The tool calculated composite scores by month and by community. In this particular evaluation, participating organizations also tracked their media advocacy activities and created a chronology that tracked their activities and the changes in media coverage over time.
Log: Increased Visibility
As part of the awareness campaign of Born Learning Washington, local communities are tracking the amount of media visibility they likely contributed to, either by paying for media or earning media coverage. By tracking the amount of campaign-generated media, communities can assess changes in the visibility of the issue that they can likely attribute to their efforts.
20 Coffman, J. (2003)., op. cit. page 28.

Page 24 A Handbook of Data Collection Tools
Born Learning Washington Monthly Media Tracking Form21
Name of Media Date(s)
Type of Media (circle) Type of Placement Choose One:
# of Times Media Type
Ran □ TV/ network
□ TV / cable □ Radio □ Print □ Other:
□ PSA □ News story □ Programming (e.g.,
topic of call-in show) □ Op-Ed □ Letter to the Editor □ Other: Details about media (length of story, format, audience, etc.)
□ Earned (e.g., story picked up based on press release)
□ Paid (e.g., donated PSA or paid ads)
□ Placed (e.g., placed in newsletter by partner)
□ Other (please describe)
METHODOLOGICAL NOTE: This log could also capture more detailed information on factors that might impact the effects of media similar to that of the Composite News Score approach. These might include data on time of day, location of media (e.g., section of paper, location of billboard) in addition to type and number of times ran.
Other Evaluative Considerations
There is value to measuring short-term outcomes. However, it is important to caution against overestimating the impact of the work by solely focusing on short-term changes, particularly for long-term, ongoing efforts.22 Having strong theoretical underpinnings through the theory of change development can help illuminate how change is expected to occur and which short-term outcomes are most important to track and measure. In addition, it may be important to consider evaluating the overall theory.
OUTCOME AREA: IMPROVED POLICIES
While the previous outcomes and data collection tools and methods have focused on the work that precedes policy changes, policy and advocacy work does not end with a proposed bill. The outcome area of improving policies includes the following stages of policy change in the public policy arena: policy development, adoption, implementation and funding. In the past, this outcome has frequently been the measure of success of advocacy and policy work. Though it is certainly the major focus of such work, policy improvements are rarely achieved without changes in the preconditions to policy change identified in the other outcome categories. In
21 Reisman, J. (2006). Born Learning Washington Campaign Data Collection Form 3 – Campaign Champions. Seattle, Washington: Organizational Research Services. 22 Salmon, C.T.; Post, L.A. & Christense, R.E. (2003). Mobilizing Public Will for Social Change. Lansing, Michigan: Michigan State University, page 34; Coffman, J., op.cit., page 37.

A Handbook of Data Collection Tools Page 25
addition, a simple “yes/no” on whether a policy was passed or not is not the endpoint. The passage of a desired policy may still necessitate continued work to ensure adequate funding and implementation through assessment, surveillance and monitoring. The unit of analysis for this outcome area can be policies themselves or changes among policymakers, administrators or other planners. Outcomes in this area include the following:
♦ Development of Improved Policy
♦ Adoption of Improved Policy
♦ Implementation of Improved Policy
♦ Enforcement of Improved Policy

Page 26 A Handbook of Data Collection Tools
Log: Legislative Process Tracking
A simple log to track legislative activities could be used to monitor changes in sponsors and votes for and against a specific piece of legislation.
Date
Priority area
Law/legislation
Summary
Key partners
Legislative sponsors
Votes for
Votes against
Funded?
Comments
Next steps
Log: Policy Tracking Analysis
A policy tracking system can document the types of policies developed and their path to adoption or rejection. Data from the tracking system can be used to describe how successful policy strategies were and assess changes to policies over time. This log tracks desired policy components and whether a policy exceeds, meets, partially meets or does not meet these components.23
The following example tracks adoption of school policies related to healthy foods and physical activity. However, the tool could be modified to contain the desired components of any type of policy for different levels of jurisdiction (e.g., city, county, state)
23 Boyle, M.; Purciel, M.; Craypo, L.; Stone-Francisco, S.; & Samuels, S.E. (2004). National Evaluation & Measurement Meeting on School Nutrition and Physical Activity Policies. Oakland, California: Prepared by Samuels & Associates. Appendix A, page 40

A Handbook of Data Collection Tools Page 27
Excerpt from Policy Tracking Analysis Tool24
Exceeds (E); Meets (M); Partially Meets (PM) Doesn’t Meet (DM)
Site A
Site B
A. POLICY COMPONENTS
I. COMPETITIVE FOODS & BEVERAGES
Access to “healthy” foods and beverages, including explicit nutrient and quality standards:
An individual food item sold to a student during morning or afternoon breaks must meet specific nutritional standards:
Water, milk & 100% fruit juices (or fruit-based drinks with no less than 50% fruit juice & no added sweeteners) are the only beverages that can be sold to students, regardless of time of day
Limit access to “unhealthy” foods and beverages :
Food items that don’t meet other SB19 criteria can be sold by pupils at fundraising events, if sales take place(*): • off school premises OR • at least 1/2 hour after the end of the school day.
Encourage fundraisers that promote good health habits and discourage fundraisers that promote unhealthy foods (2)
III. ACCESS TO PHYSICAL EDUCATION/PHYSICAL ACTIVITY
Improve the quality of physical education curricula
Enforce existing physical education requirements
V. ENVIRONMENT CONDUCIVE TO HEALTHY EATING AND PHYSICAL ACTIVITY
Ensure pupils a minimum of 30 minutes to eat lunch and 20 minutes to eat breakfast, when provided. (10)
VII. STAKEHOLDER & STAFF EDUCATION (i.e., professional development)
Increase training of physical education teachers.
Ensure regular professional development for food services staff.
VIII. FINANCIAL MECHANISMS
Alter the economic structures in place to encourage healthy eating by pupils and reduce dependency on generating profits for the school from the sale of unhealthy foods. (15)
Develop a financing plan to implement the policies
B. POLICY PROCESS (e.g., development, implementation, monitoring, and enforcement)
Child Nutrition & Physical Activity Advisory Committee (CNPAAC) membership should include, but not limited to, school district governing board members, school administrators, food service staff, staff, parents, pupils, physical and health education teachers, dieticians, health care professionals, and interested community members.
Child Nutrition & Physical Activity Advisory Committee policy development process:
a) Convene committee b) Hold at least 1 public hearing to develop policies c) Develop and recommend to the governing board of the school
for its adoption school district policies on nutrition and PA including but not limited to #1-18.
24 Samuels & Associates. (2004). SB19 Policy Tracking Analysis. Oakland, California: Samuels & Associates. Retrieved June 6, 2006, from personal communication

Page 28 A Handbook of Data Collection Tools
Survey: Assessing Number and Type of Policies
The University of Kentucky School of Public Health wanted to assess workplace tobacco use prevention and cessation policies in manufacturing facilities and to explore factors associated with tobacco policies and practices in the tobacco-growing state of Kentucky. Through a phone survey, they assessed the number and types of tobacco policies, as well as tobacco prevention education, in manufacturing companies in urban and rural facilities.25
A similar approach could be used to assess many types of policies that organizations might have. In addition, a survey could be used over time to see if policies have changed for individual organizations or at a population level. Indicators of improved policies could include the number of organizations that have adopted policies around a particular issue and/or the number of policies that conform to elements of effective policy that have been identified based on a review of research. Survey items could address:
1) Whether an organization has an officially adopted policy about a particular issue 2) The elements of the policy 3) How the policy is attended to and/or enforced 4) Perceived effectiveness of the policy 5) Satisfaction with the policy
METHODOLOGICAL NOTE: Surveys of this type could also be used as a needs assessment or as a way to generate data for other efforts, such as policy briefs or white papers. To use it as an outcome measurement tool, the survey would need to be administered at two time points or edited to ask people retrospective questions about changes over time.
Log: Monitoring Policy Implementation
In January 2006, Texas began piloting a new system for signing up for or renewing public benefits, including Food Stamps, Children’s Medicaid/CHIP and TANF. Under the new system, most clients would need to apply for benefits through a call center or internet application rather than through in-person visits to a local state office. Though the implementation of the new system is being monitored by the state and the USDA (the federal agency with food stamp oversight), the Center for Public Policy Priorities (CPPP) was concerned that the new system and monitoring plan neglected to pay adequate attention to the challenges the new system would present for vulnerable populations. In addition, the current monitoring plan did not closely examine “procedural denials,” instances when an application is denied before the state can collect enough information to determine eligibility, such as when someone fails to show for a required interview.
To help non-profits and community-based organizations play a role in monitoring the policy during an initial two-county pilot, CPPP provided information on whom to contact for individuals having problems signing up for benefits. They also developed a standardized tracking form to assist in monitoring and sharing clients’ experiences. Though CPPP is not receiving information on all issues reported to the state, they have been able to use the information from community-based organizations and individuals to evaluate the implementation of the new policy and have reported common problems and issues to legislators and administrators. This formal documentation also provides a record that could be used in future actions or litigation if needed.
25 See: Hahn, E.J.; Rayens, M.K.; Okoli, C.T.C.; Love, K.; & Sanggil, K. (2004). Tobacco Use Prevention and
Cessation Policies in Manufacturing Facilities in the Tobacco-Growing State of Kentucky. American Journal of Health Promotion, Inc. 18. 3, 225-231

A Handbook of Data Collection Tools Page 29
Policy Tracking Form26 EXAMPLE—NOT A REAL CASE
Date Logged
March 2
Agency/CBO (if applicable) St. John’s Food Pantry
Information about client (if available AND client gives permission to share)
Mary Jones, Lives in Wichita Falls, HHSC office located on 100 State St.
Benefits sought (if general system or customer service problem, please say so)
Food Stamps
Description of the problem/complaint
Client submitted an online application for food stamps 14 days ago and hasn’t heard back. When she called 211, the call center had no record of her application; neither did her local office. Local office told her to contact call center for a new application
Date(s) of problem Applied on Jan 20, 2006 Impact on client or your agency
Came to our food pantry for help in feeding her two children
Where did it occur? (local office, 211, call center, Internet—be specific)
1. Submitted application online at www.yourtexasbeneftis.com 2. Call center staff (spoke with Jane Doe) had no record 3. Local office staff (spoke with John Doe in Wichita Falls office) had no record
Response from state/contractor/ federal official List name(s) of any person(s) you spoke to and dates you spoke to them
Contacted MaryLou Franks on Mar 1 and reported problem. She referred me to Bill Dowdy who said he would research case. Email to Ms. Franks is attached
Any client file an appeal? (If so, give date of appeal) No
Was problem resolved? If so, how and when? No
Note: the original format of this report log is an Excel spreadsheet. For formatting purposes, the orientation was changed from horizontal to vertical for this manual.
METHODOLOGICAL NOTE: This tool could be used to measure other outcomes as well. For example, an organization could track the number of different community groups and agencies that reported problems over time to assess changes in levels of partnerships or for strengthened base of support.
26 Hagert, C. (2006). Problems Enrolling in Public Benefits? Retrieved May 2, 2006, from http://ww.cppp.org/research.php?aid=501

Page 30 A Handbook of Data Collection Tools
Environmental Assessments: Changes in Physical Environments27
Environmental assessments, including use of GIS mapping, can also be used for evaluation of policies. Any organization involved in changing policies related to the physical environment —including parks, sidewalks, retail outlets, land preservations and availability of other community resources — could use these types of assessments to track implementation of policies or to provide watchdog data on the protection of certain assets. Environmental assessments range from observation tools that can be completed by volunteers or staff to more complex development of geocoded maps that include relevant local factors. Here are a few specific examples of environmental assessments.
Walkability Checklist/Bikeability Checklist A number of different types of groups — public health, environmental and transportation planners — may focus on policies to incentivize walking and bicycling for community members. Two ready-made assessments, the Walkability Checklist (www.walkinginfo.org) and the Bikeability Checklist (www.bikinginfo.org), are provided by the Pedestrian and Bicycle Information Center. These assessments include checklists of five to seven questions responded to by individual community members that result in a community rating. In addition, the assessments include suggestions for community members to improve their community based on the problems they identified.
Alcohol Promotion Billboard Survey Form Alcohol advertising exposes young people to alcohol messages. Research has shown that long-term exposure to advertising and promotional activities increases the likelihood that children will drink alcoholic beverages. To evaluate the implementation of policies that restrict alcohol advertising, community members can record changes in the amount and/or location of alcohol advertising.
27 Join Together. (2005). How do we know we are making a difference?: Availability: Alcohol Advertising. Retrieved August 1, 2006, from http://www.indicatorshandbook.org/indicators/availability/advertising.html

A Handbook of Data Collection Tools Page 31
SAMPLE BILLBOARD SURVEY FORM28
Address of Billboard:____________________________ City:____________________
What Company is being advertised:___________________________________ Type of sign: __Junior poster (75 sq ft) __Poster panel (300 sq ft) __Painted bulletin (672 sq ft)
Area: __Industrial __Mixed residential / commercial __Central business district __Strip commercial
Neighborhood: __Residential __Commercial __Historic district
Neighborhood is predominately: __Black __Asian __Latino __White __Other
Can you see any of the following: __Residences __Parks __Historic sites __Hospitals __Churches __Schools
The ad is for: __Wine __Beer __Liquor / spirits __Malt liquor
Does the billboard ad contain: __Animals __Alcohol product __Cartoons __Logo of the alcohol company __People __Minorities
If the ad shows people, estimate their age: __Under 18 __18 to 20 __Over 21
Beyond drinking, what does the billboard promote? Photo taken of the billboard? __Yes (If yes, attach to the survey) __No Please record the advertising copy on the billboard: How many other billboards are visible nearby?____ Total number of billboards in an eight block area:____ Total number of alcohol billboards in this eight block area:____ Your Name:______________________________ Date:__________ Your age:__________
28 FACE - Resources, Training & Action on Alcohol Issues. (2000). Community Action Kits. Retrieved August 1, 2006, from http://faceproject.org/freereports/Reports/Alcohol-Billboard-CAK.pdf
Page 32 A Handbook of Data Collection Tools
Mapping Environmental Factors Related to Diabetes The California Endowment funded the development and implementation of culturally appropriate programs to assist at-risk groups to better manage and prevent chronic diseases and conditions, including diabetes.29 The project recognized that specific environmental stressors affect the experience of diabetes, as well as its prevention, treatment and management.30 In certain communities, there is abundant access to unhealthy foods and a lack of access to parks and recreational areas. To evaluate the environmental factors that influence residents’ health behaviors, evaluators developed local maps using publicly available data. Evaluators tracked locations of liquor/convenience stores, fast-food outlets, farmers markets, community gardens, major medical resources, and parks and recreation areas.31
Though more time- and resource-intensive than the other assessments noted above, GIS mapping technology can provide rich information on community factors or physical environments that might be changed through policy decisions. In this particular case, changes in the local environment could be tracked over time to see if positive resources increase and unhealthy factors decrease in the long term. In other cases, it might be important to ensure that resources are maintained (e.g., environmental protection advocacy).
OUTCOME AREA: CHANGES IN IMPACT
Organizations advocate for policy change to ultimately impact lives and conditions through policy implementation. This is generally a longer-term goal, though the time horizon for these impacts varies depending on the level of policy change being considered. While state level policy changes may take many years, changes in local policies and their resulting impacts on organizations may be more realistic in a shorter time frame. In both cases, however, the ultimate success of impacts on individuals or an environment are a result of successful policy implementation, funding, and potentially some direct interventions — not policy change alone. The unit of analysis for this outcome area includes populations or ecosystems.
Because numerous resources that assess changes in impact are more readily available to organizations ─ and the myriad types of potential impacts would make it difficult to provide examples with wide applicability ─ this manual will not provide specific tools in this area. Rather, we will provide some examples of secondary data sources for population-level data that might be relevant for assessing impacts of policies over the long term.
A number of indicator initiatives currently underway could prove useful to advocacy organizations. Indicators are available for different focus areas and at different levels of aggregation (e.g., neighborhood, county, state, national). Here are just a few examples:
♦ KIDS COUNT: www.kidscount.org
♦ National School Readiness Core Indicators: www.gettingready.org
29 Samuels, S.E.; Stone-Francisco, S.; & Cardoza-Clayson, Z. (2004). An Ethnographic Case Study Synthesis & Mapping Environmental Factors Related to Diabetes in six Ethnics Communities. In Samuels & Associates, The Social & Environmental Experience of Diabetes: Implications for Diabetes Prevention, Management and Treatment Programs, a Series of Case Studies. Retrieved June 06, 2006, from http://www.google.com/u/calendow?q=Synthesis&domains=calendow.org&sitesearch=calendow.org, page 1. 30 Ibid, page 6 31 Ibid, pages 8-9.

A Handbook of Data Collection Tools Page 33
♦ Healthy People 2010: www.healthypeople.gov
♦ Childstats.gov
♦ Childtrendsdatabank.org
♦ National Neighborhood Indicators Project: www.urban.org/nnip
Other Evaluative Considerations
While population-level measures provide general information on the well-being of children, families, environments and communities, it is difficult to ascertain what impact any one policy may have had based on these figures. In addition, external factors could enhance or hinder results so that population-level data changes may have little bearing on the effectiveness of a given policy. Understanding the true impact of a policy will necessitate more detailed exploration into the direct impact on recipients, contextual factors, degree of funding and implementation of intended policy and success of implementation of direct services. However, population data that is periodically updated can provide some indication of population status prior to the adoption or implementation of new policies and initiatives.32
TOOLS AND METHODS FOR OTHER EVALUATION DESIGNS
As stated in previous sections, evaluation design decisions should be made based on a number of factors: the purpose and audience of the evaluation, the nature of the grant awarded (e.g., scope, scale, size, capacity) and the types of questions the evaluation aims to address.
The previous tools were geared toward collecting data for specific outcome categories. However, other approaches can also be considered:
♦ Evaluation of Strategic Process;
♦ Short-Term Incremental Objectives; or
♦ Case Study Documentation.
This section will provide tools and methods that can be used for these evaluation designs. Some of these approaches can be used in tandem with measurement of core outcome areas or on their own. See Section 2 for more information about the applicability and benefits of these design options.
EVALUATION OF STRATEGIC PROGRESS
Because policy and advocacy work exist in complex and dynamic systems in which myriad factors can contribute to or hinder efforts, process evaluation will continue to be extremely valuable for exploring and documenting context, unexpected developments and synergies. Process evaluation can help organizations, funders and grantees learn more about the process and answer core questions about how change occurs, what needs to change, what has been learned based on recent experiences and what contextual factors impacted the work.
32 Weiss, C.H. 1999. Nothing as Practical as Good Theory: Exploring Theory-Based Evaluation for Comprehensive Community Initiatives for Children and Families. In New Approaches to Evaluating Community-Wide Initiatives Volume 1: Concepts, Methods, and Contexts. Edited by James P. Connell, Anne C. Kubisch, Lisbeth B. Schorr, and Carol H. Weiss, page 85.

Page 34 A Handbook of Data Collection Tools
Method: Appreciative Inquiry Approach to Process Evaluation
Appreciative Inquiry (AI) can be best described as a new paradigm in how we approach change in organizations and communities. It invites people to tell the stories they want to tell and jointly search for what gives life to organizations and communities. This approach is increasingly applied in both small and large change processes, ranging from small personal change to mega-cities or entire regions to multi-national companies such as McDonald's or British Airways. 33
The merits of AI in evaluation have been described in a recently published book, Using Appreciative Inquiry in Evaluation, edited by H. Preskill and A. T. Coghlan. According to the authors, AI is particularly appropriate for the following situations, many of which are particularly relevant for advocacy organizations:
♦ Where previous evaluation efforts have failed
♦ Where there is a fear of skepticism about evaluation
♦ With varied groups of stakeholders who know little about each other or the program being evaluated
♦ With hostile or volatile environments
♦ When change needs to be accelerated
♦ When dialogue is critical to moving the organization forward
♦ When relationships among individuals and groups have deteriorated and there is a sense of hopelessness
♦ When there is a desire to build evaluation capacity to help others learn from evaluation practice
♦ When there is a desire to build a community of practice; and
♦ When it is important to increase support for evaluation and possibly the program being evaluated. 34
The use of language is crucial to facilitating the Appreciative Inquiry approach in organizational development and evaluation work. Rather than assuming the traditional position of objective observer, the evaluator uses the language of the inquiry to intentionally lead stakeholders toward mutually developed positive plans of action.35 For example, if you wanted to understand the ways and extent to which collaboration is working in an organization, you might typically phrase questions as follows:
1. What are the current barriers to collaborating?
2. How could collaboration be improved?
33 The Change Management Toolbook. (2005). Appreciative Inquiry Revisited A New Approach for Monitoring and Evaluation. Retrieved June 23, 2006, from http://www.change-management-toolbook.com/tools/AI.html 34 Ibid. 35 Hansen, K. (2004). Transformative Designs: Appreciative Inquiry. Retrieved June 23, 2006, from http://www.transformativedesigns.com/appreciative_inquiry.html

A Handbook of Data Collection Tools Page 35
Using an AI approach, the questions might be rephrased like this:
1. Think of a time when you were collaborating with someone (or a group) from another department, and you felt excited, alive, proud and successful. Describe that time: What was happening? What made it successful? What was your role? What did others do to make it effective?
2. If you could have three wishes for ensuring more of these successful collaborations, what would those wishes be?36
Here are some sample process evaluation questions that are written in the spirit of the AI paradigm:
1. What was your peak moment when you felt best about [campaign/policy/activity x]?
2. What have you learned that you would share with others doing similar work?
3. Did anything surprise you when doing [campaign/policy/activity x]?
4. What would help you be more successful?
5. What is one wild idea you have for improving [campaign/policy/activity x]?
MEASURING SHORT-TERM INCREMENTAL OBJECTIVES
This evaluation direction provides those engaged in advocacy and policy work with a focus and accountability on indicators of progress. The shorter-term nature of this approach can be beneficial given the dynamic and chaotic nature of social change. This approach may be especially relevant for cases in which funding is short term, one time or targeted for a specific activity or product.
Objectives are specific measurable accomplishments within a certain timeframe. Unlike outcome and outputs which have been firmly defined through the language of logic models,37 objectives can reflect achievement of outputs, outcomes or indicators.38 For this section, we will provide samples of relevant outputs, or units of services or products.39 It can be valuable to capture “outputs,” or information about the type of activities undertaken in addition to or instead of information about outcomes, particularly in the funding contexts noted above. For
36 Ibid. 37 See the following: Organizational Research Services. (2000). Outcomes for Success! Seattle, Washington: The Evaluation Forum. W.K. Kellogg Foundation. (2004). Using Logic Models to Bring Together Planning, Evaluation, and Action: Logic Model Development Guide. Retrieved May 31, 2006, from www.wkkf.org/Pubs/Tools/Evaluation/Pub3669.pdf; United Way of America. (1996). Measuring program outcomes: A practical approach. Retrieved June 1, 2006, from http://national.unitedway.org/outcomes/resources/ 38 We define outputs, outcomes and objectives as follows:
Outputs: Amount of services delivered or products created by a program. Outcomes: Short, intermediate and long-term changes in the lives of individuals, families, communities, organizations or systems that are influenced by programs, e.g. changes in attitudes, knowledge, skills, behaviors, norms, partnerships, policies. Indicators: Specific measurable and observable changes that can be “seen, heard or read” to demonstrate that an outcome is being met. Objectives/Performance Measures: Specific measurements that reflect achievement of outputs, outcomes, or indicators. These can overlap with indicators, outcomes, and outputs depending on the type of achievement desired.
39 Organizational Research Services (2000) Outcomes for Success, op.cit., page 25 and 31.

Page 36 A Handbook of Data Collection Tools
organizations that have objectives that reflect achievement of outcomes, please see the data collection examples for the Core Outcome Areas section.
Important outputs related to the changing social norms activities, such as media campaigns, message development or development of trusted messengers/champions, could include the following:
♦ Number and type of activities (e.g., number of PSAs, number of billboards, number of messengers trained)
♦ Number and type of audiences reached (e.g., community members, legislators, organizations, clubs)
♦ Intensity of outreach efforts to specific audiences (e.g., how many outreach efforts to each audience, high or low “touch”)
Important outputs related to organizational capacity activities, such as trainings, consultation support or other capacity building, could include the following:
♦ Number and type of activities (e.g., training sessions, institutes/conferences attended);
♦ Number/percentage staff member participation
♦ Completion of plans, documents, protocol, etc.
♦ Hours of consultation/training received
Important outputs related to alliance strengthening activities could include the following:
♦ Number and type of activities (e.g., meetings, contacts)
♦ Number and diversity of partners engaged
Important outputs related to strengthened base of support activities, such as public engagement campaigns, coalition development and voter registration, could include the following:
♦ Number and type of activities (e.g., number of pieces of mail sent, how many voters registered, number of events held)
♦ Number and type of audiences reached (e.g., community members, legislators, organizations, clubs)
♦ Number of volunteers trained
Important outputs related to improved policies activities, such as development of products, research and briefings, could include the following:
♦ Number and type of activities (e.g., meetings with key legislators, type of research undertaken, number of successful pilots/demonstrations implemented)
♦ Number and type of audiences reached (e.g., legislators, organizations, clubs)
♦ Number of products developed (e.g., white papers, amicus briefs)
A Handbook of Data Collection Tools Page 37
METHODOLOGICAL NOTE: Outputs can be a useful measure for accountability. However, they are also an important component of understanding the outcomes generated through an organization’s efforts. Knowing the scope and scale of activities provides a context for anticipating what kind of outcomes to expect and from whom.

Page 38 A Handbook of Data Collection Tools
CASE STUDY DOCUMENTATION OF PROCESS AND IMPACTS
Advocacy organizations and their partners and stakeholders can benefit from learning about what has happened in the process of social change, including types of strategies and partners engaged, “wins” and “losses,” the context (e.g. political, social, economic) of change, case illustrations and lessons learned. Typically, these types of evaluations are more time- and resource-intensive and will necessitate support outside of funded organizations for data collection, analysis and reporting. This section will provide some information about methods that foundations or other funders could implement with this type of evaluation design.
Method: Case Studies
Case studies are a “focused, in-depth description, analysis and synthesis of a particular program or other object.”40 Case studies look at a program (or coalition or initiative), the contexts it exists within and its internal operations. Generally, case studies employ a variety of different qualitative and quantitative methods to triangulate multiple perspectives and data sources to create a picture of a program, process or organization. Typical questions answered by a case study are as follows:
What is the program in concept and practice?
How does it actually operate to produce outcomes?
What are the shortfalls and negative side effects?
What are the positive side effects?
What are the most important reasons for successes and failures?
What has been or could be successfully transported to other sites or organizations?
Strengths of a case study approach include a focus on the audience’s most important questions, consideration of contextual influences, a focus on strengths and weaknesses, holistic and in-depth examination, and utilization of quantitative and qualitative approaches.41
This approach can be particularly helpful for learning about successful—and unsuccessful—campaigns or advocacy efforts. The in-depth information developed can help build knowledge for future funding or activities.
The Atlantic Philanthropies and the Coalition for Comprehensive Immigration Reform (CCIR), a bipartisan coalition of diverse groups and national organizations advocating for comprehensive immigration reform, engaged Innovation Network to evaluate CCIR’s lobbying and grassroots efforts.42 Innovation Network designed a “Debrief Interview Protocol” to be used following intense periods of advocacy to document and evaluate the advocacy coalition’s activities and success. In recognition that advocacy tends to depend on numerous external factors and that change often occurs when an “opportunity window” is presented, systematic application of this tool is intended to follow the peaks and valleys of the advocacy cycle. The purpose of this protocol is to engage key players in a focus group shortly after a policy window — and the inevitably corresponding intense period — occurs to capture the following information:
40 Stufflebeam, D.L. (2001). Evaluation Models, New Directions for Evaluation 89, page 34. 41 Ibid, pages 44-52 42 Innovation Network, Inc. Material obtained at: http://www.innonet.org/index.php?section_id=99&content_id=466

A Handbook of Data Collection Tools Page 39
The context of the opportunity window
What happened and how campaign members responded to events
What strategies were followed
Key players’ perspectives on the outcome(s) of the period
How key players would change their strategies going forward based on what was learned during the intense period
This protocol complements other methodologies and serves to capture information on the multiple perspectives of what happens during an intense period of advocacy.
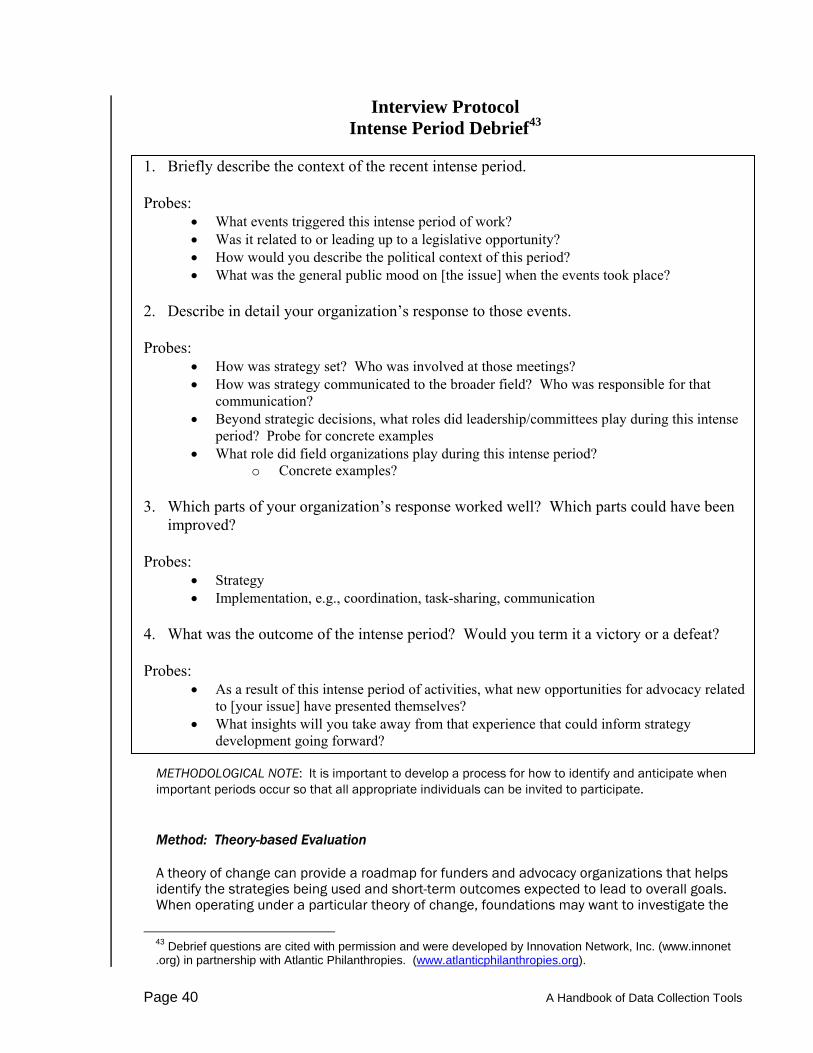
Page 40 A Handbook of Data Collection Tools
Interview Protocol Intense Period Debrief43
1. Briefly describe the context of the recent intense period. Probes:
• What events triggered this intense period of work? • Was it related to or leading up to a legislative opportunity? • How would you describe the political context of this period? • What was the general public mood on [the issue] when the events took place?
2. Describe in detail your organization’s response to those events. Probes:
• How was strategy set? Who was involved at those meetings? • How was strategy communicated to the broader field? Who was responsible for that
communication? • Beyond strategic decisions, what roles did leadership/committees play during this intense
period? Probe for concrete examples • What role did field organizations play during this intense period?
o Concrete examples? 3. Which parts of your organization’s response worked well? Which parts could have been
improved? Probes:
• Strategy • Implementation, e.g., coordination, task-sharing, communication
4. What was the outcome of the intense period? Would you term it a victory or a defeat? Probes:
• As a result of this intense period of activities, what new opportunities for advocacy related to [your issue] have presented themselves?
• What insights will you take away from that experience that could inform strategy development going forward?
METHODOLOGICAL NOTE: It is important to develop a process for how to identify and anticipate when important periods occur so that all appropriate individuals can be invited to participate.
Method: Theory-based Evaluation
A theory of change can provide a roadmap for funders and advocacy organizations that helps identify the strategies being used and short-term outcomes expected to lead to overall goals. When operating under a particular theory of change, foundations may want to investigate the
43 Debrief questions are cited with permission and were developed by Innovation Network, Inc. (www.innonet .org) in partnership with Atlantic Philanthropies. (www.atlanticphilanthropies.org).
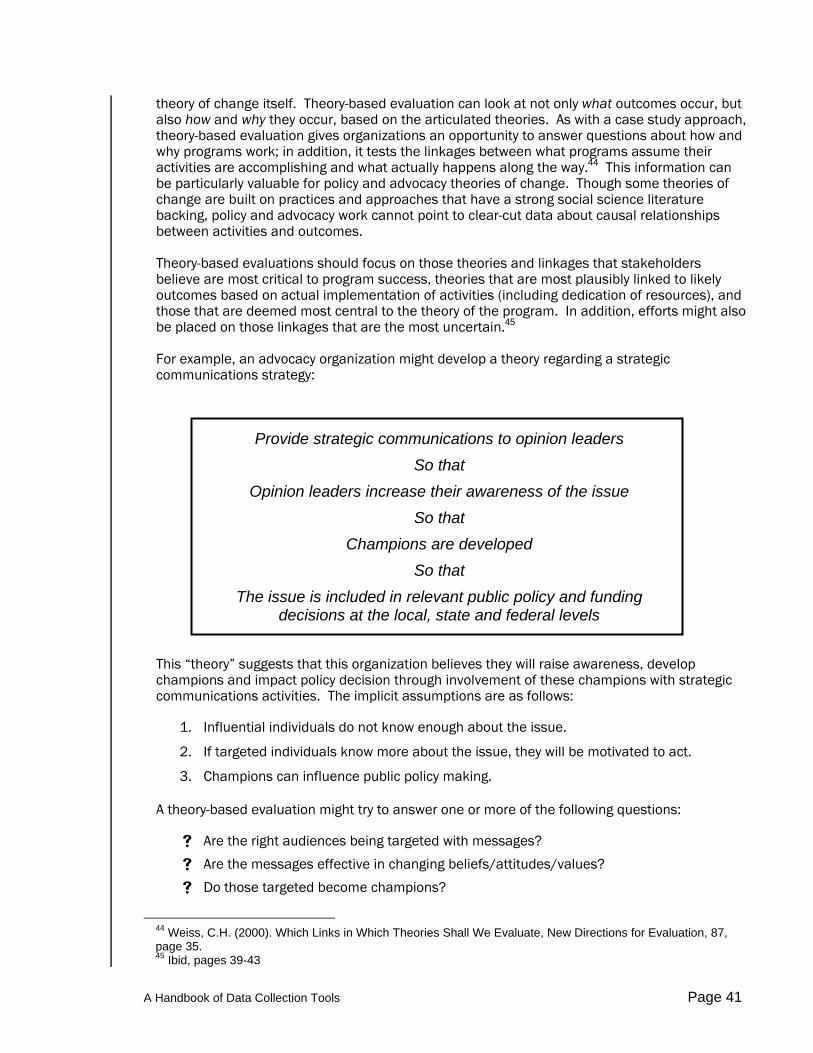
A Handbook of Data Collection Tools Page 41
theory of change itself. Theory-based evaluation can look at not only what outcomes occur, but also how and why they occur, based on the articulated theories. As with a case study approach, theory-based evaluation gives organizations an opportunity to answer questions about how and why programs work; in addition, it tests the linkages between what programs assume their activities are accomplishing and what actually happens along the way.44 This information can be particularly valuable for policy and advocacy theories of change. Though some theories of change are built on practices and approaches that have a strong social science literature backing, policy and advocacy work cannot point to clear-cut data about causal relationships between activities and outcomes.
Theory-based evaluations should focus on those theories and linkages that stakeholders believe are most critical to program success, theories that are most plausibly linked to likely outcomes based on actual implementation of activities (including dedication of resources), and those that are deemed most central to the theory of the program. In addition, efforts might also be placed on those linkages that are the most uncertain.45
For example, an advocacy organization might develop a theory regarding a strategic communications strategy:
Provide strategic communications to opinion leaders So that
Opinion leaders increase their awareness of the issue So that
Champions are developed So that
The issue is included in relevant public policy and funding decisions at the local, state and federal levels
This “theory” suggests that this organization believes they will raise awareness, develop champions and impact policy decision through involvement of these champions with strategic communications activities. The implicit assumptions are as follows:
1. Influential individuals do not know enough about the issue.
2. If targeted individuals know more about the issue, they will be motivated to act.
3. Champions can influence public policy making.
A theory-based evaluation might try to answer one or more of the following questions:
Are the right audiences being targeted with messages?
Are the messages effective in changing beliefs/attitudes/values?
Do those targeted become champions?
44 Weiss, C.H. (2000). Which Links in Which Theories Shall We Evaluate, New Directions for Evaluation, 87, page 35. 45 Ibid, pages 39-43

Page 42 A Handbook of Data Collection Tools
Are messages alone enough to develop champions?
How do champions interact with or impact the policy process?
How effective are champions at influencing policy?
Method: Use of Coding Protocol with Qualitative Data
There may be times when organizations want to allow relevant outcomes to emerge from an exploration of activities. Qualitative methods, such as focus groups or key informant interviews, may be used to learn more about a process and the outcomes experienced. These data can then be coded using a standardized set of codes to identify themes to create quantitative data for analysis.
Allies Against Asthma, a national program funded by the Robert Wood Johnson Foundation, provides support to community-based coalitions that are implementing comprehensive pediatric asthma management programs. Coalition efforts include improved access to and quality of medical services, education, family and community support, and environmental and policy initiatives.46 Though policy initiatives were not the primary emphasis of coalition efforts, some example policy priority areas they could address include the following:
♦ Promoting reimbursement of asthma education and institutionalizing Community Health Worker services;
♦ Promoting coordination of care and services through creating access to common client-specific asthma-related health data (e.g., on-line asthma registries);
♦ Adopting and enforcing healthy indoor air standards;
♦ Increasing the number of smoke-free workplaces and banning smoking in public places;
♦ Promoting school policies that support students with asthma; and
♦ Promoting policies in the housing sector to support healthy home environments for children with asthma.47
Results of the coalition’s efforts, including policy and advocacy outcomes, have been measured qualitatively as part of a cross-site evaluation of Allies Against Asthma through key informant interviews with coalition members, staff and leadership, as well as key community leaders outside of the coalition.48 The Key Informant Interview Guides collected a broad range of perspectives on the activities of a coalition through a semi-structured format.49 Evaluators then coded the qualitative data from these interviews to assess the types of impacts reported.
While this tool specifically asks about coalition activities for asthma management, it could be modified for other types of coalitions.
46 Allies Against Asthma. (2006). About Allies: Program Overview. Retrieved June 23, 2006, from http://www.asthma.umich.edu/About_Allies/Program_Summary/prog_sum.html 47 Group Health Community Foundation & King County Allies Against Asthma Foundation. (2005) Section 7 – Promoting Asthma Control Policies. King County Allies Against Asthma Evaluation Report. Retrieved June 29, 2006, from http://www.metrokc.gov/health/asthma/evaluation/index.htm. 48 Allies Against Asthma. (2006) About Allies: Evaluation Design and Instruments. Retrieved June 29, 2006, from http://www.asthma.umich.edu/About_Allies/Evaluation/methods.html 49 Battelle Centers for Public Health Research and Evaluation and Allies Against Asthma. (2003). About Allies: Cross-Site Evaluation Instruments: Key Informant Interview Guides. Retrieved June 29, 2006, from http://www.asthma.umich.edu/About_Allies/Products/eval_instrus.html, page 1.
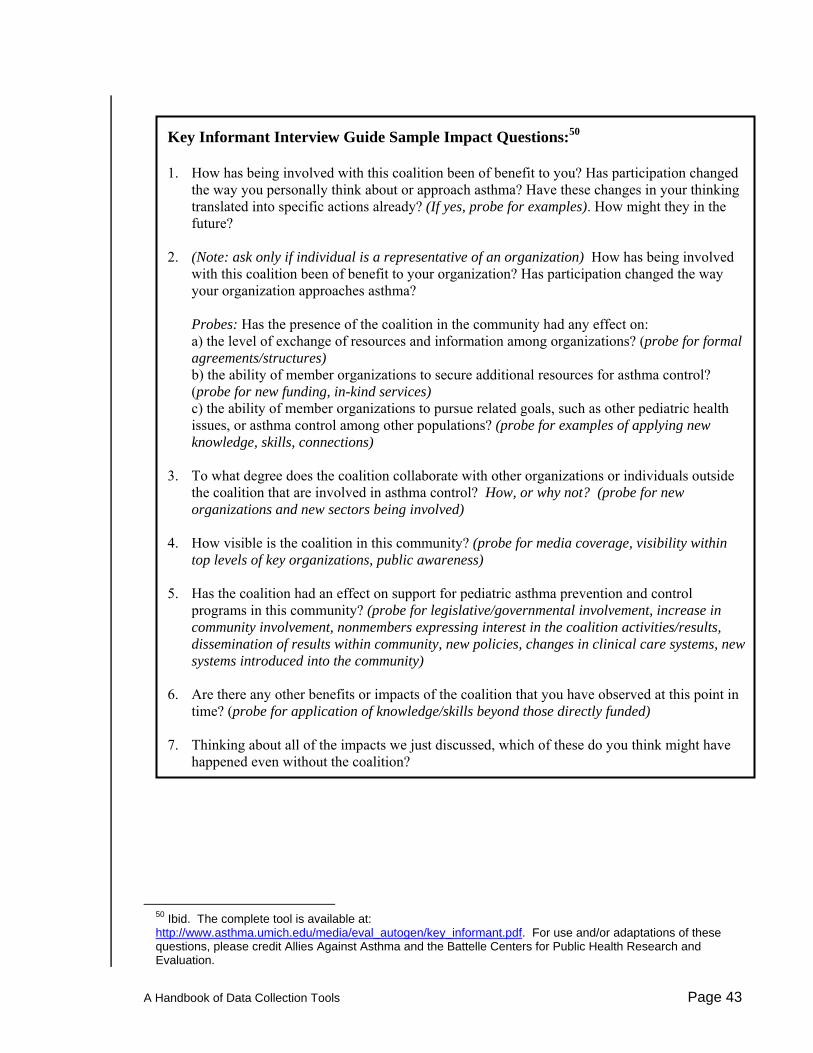
A Handbook of Data Collection Tools Page 43
Key Informant Interview Guide Sample Impact Questions:50
1. How has being involved with this coalition been of benefit to you? Has participation changed the way you personally think about or approach asthma? Have these changes in your thinking translated into specific actions already? (If yes, probe for examples). How might they in the future?
2. (Note: ask only if individual is a representative of an organization) How has being involved with this coalition been of benefit to your organization? Has participation changed the way your organization approaches asthma? Probes: Has the presence of the coalition in the community had any effect on: a) the level of exchange of resources and information among organizations? (probe for formal agreements/structures) b) the ability of member organizations to secure additional resources for asthma control? (probe for new funding, in-kind services) c) the ability of member organizations to pursue related goals, such as other pediatric health issues, or asthma control among other populations? (probe for examples of applying new knowledge, skills, connections)
3. To what degree does the coalition collaborate with other organizations or individuals outside the coalition that are involved in asthma control? How, or why not? (probe for new organizations and new sectors being involved)
4. How visible is the coalition in this community? (probe for media coverage, visibility within top levels of key organizations, public awareness)
5. Has the coalition had an effect on support for pediatric asthma prevention and control programs in this community? (probe for legislative/governmental involvement, increase in community involvement, nonmembers expressing interest in the coalition activities/results, dissemination of results within community, new policies, changes in clinical care systems, new systems introduced into the community)
6. Are there any other benefits or impacts of the coalition that you have observed at this point in time? (probe for application of knowledge/skills beyond those directly funded)
7. Thinking about all of the impacts we just discussed, which of these do you think might have happened even without the coalition?
50 Ibid. The complete tool is available at: http://www.asthma.umich.edu/media/eval_autogen/key_informant.pdf. For use and/or adaptations of these questions, please credit Allies Against Asthma and the Battelle Centers for Public Health Research and Evaluation.
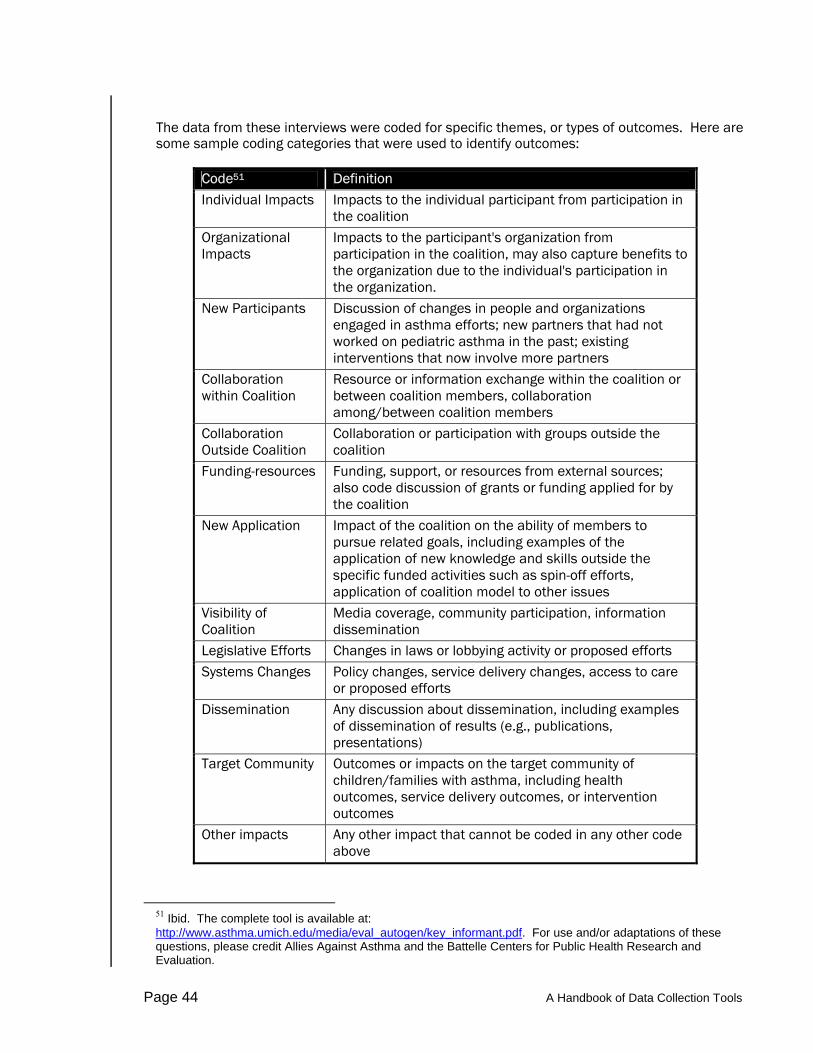
Page 44 A Handbook of Data Collection Tools
The data from these interviews were coded for specific themes, or types of outcomes. Here are some sample coding categories that were used to identify outcomes:
Code51 Definition Individual Impacts Impacts to the individual participant from participation in
the coalition Organizational Impacts
Impacts to the participant's organization from participation in the coalition, may also capture benefits to the organization due to the individual's participation in the organization.
New Participants Discussion of changes in people and organizations engaged in asthma efforts; new partners that had not worked on pediatric asthma in the past; existing interventions that now involve more partners
Collaboration within Coalition
Resource or information exchange within the coalition or between coalition members, collaboration among/between coalition members
Collaboration Outside Coalition
Collaboration or participation with groups outside the coalition
Funding-resources Funding, support, or resources from external sources; also code discussion of grants or funding applied for by the coalition
New Application Impact of the coalition on the ability of members to pursue related goals, including examples of the application of new knowledge and skills outside the specific funded activities such as spin-off efforts, application of coalition model to other issues
Visibility of Coalition
Media coverage, community participation, information dissemination
Legislative Efforts Changes in laws or lobbying activity or proposed efforts Systems Changes Policy changes, service delivery changes, access to care
or proposed efforts Dissemination Any discussion about dissemination, including examples
of dissemination of results (e.g., publications, presentations)
Target Community Outcomes or impacts on the target community of children/families with asthma, including health outcomes, service delivery outcomes, or intervention outcomes
Other impacts Any other impact that cannot be coded in any other code above
51 Ibid. The complete tool is available at: http://www.asthma.umich.edu/media/eval_autogen/key_informant.pdf. For use and/or adaptations of these questions, please credit Allies Against Asthma and the Battelle Centers for Public Health Research and Evaluation.

A Handbook of Data Collection Tools Page 45
Reporting Tool: Alliance For Justice Advocacy Evaluation Tool
Alliance for Justice, in collaboration with The George Gund Foundation, developed new advocacy evaluation and advocacy capacity assessment tools for foundations to use with grantees and prospective grantees. They were assisted in this endeavor by Mosaica: The Center for Nonprofit Development and Pluralism. Build Your Advocacy Grantmaking: Advocacy Evaluation Tool & Advocacy Capacity Assessment Tool uses a pragmatic approach to evaluation and is designed to assist both private and public foundations, as well as grantees, that are seeking better evaluation methods.52 The Advocacy Evaluation Tool is intended to help foundations and grantees identify and measure advocacy effectiveness. It helps organizations “articulate advocacy goals, strategies to achieve those goals, and benchmarks to evaluate progress and outcomes.” Foundations can use the tool to do the following:
♦ Assess progress in meeting project advocacy goals
♦ Help grantees to develop long-term and incremental measures of success and progress
♦ Assist grantees in planning their advocacy efforts
♦ Help grantees identify and apply lessons learned from advocacy efforts
♦ Stimulate discussion among the foundation’s board, staff and grantees about how to accomplish effective advocacy and techniques for evaluating advocacy
♦ Build realistic expectations for advocacy and advocacy capacity-building efforts funded by the foundation
Advocacy Evaluation Tool Part 1
The pre-grant evaluation form asks grantees to identify and share with funders their goals; expected strategies for legislative, executive branch, judicial, and/or nonpartisan election related work; projected results and activities, and areas in which the organization will strengthen its resources and ability to carry out effective advocacy campaigns. In order to help identify capacity building goals, the organization can also complete the capacity assessment tool (see page 8 for information about the Alliance for Justice Capacity Assessment Tool).
Advocacy Evaluation Tool Part 2
The evaluation reporting form asks grantees to measure and describe the results and impact of their work and share it with funders, including progress made on the planned goals, strategies, and long- and short-term results and activities. Grantees are prompted to briefly "tell the story" of how they engineered the changes and what challenges they encountered in their advocacy work during the grant period. The form includes questions that are designed to promote an overall discussion of lessons learned.
52 To order Build Your Advocacy Grantmaking: Advocacy Evaluation Tool & Advocacy Capacity Assessment Tool, e-mail [email protected] or call 1-866-675-6229 or 202-822-6070, or visit www.allianceforjustice.org. If you would like to discuss this model, please contact Marcia Egbert ([email protected]) at The George Gund Foundation or Susan Hoechstetter ([email protected]) at Alliance for Justice.