A Guide for Estimating Cover - University of Arizona
3
236 Ran ge/ends8(5), October 1986 A Guide for Estimating Cover E. William Anderson The 1983 report of the Society for Range Management's Range Inventory Standardization Committee (RISC) pro- poses definitions for three kinds of cover measurements: canopy cover, foliar cover, and ground cover. RISC defines canopy cover as: "the percentage of ground covered by a vertical projection of the outermost perimeter of the natural spread of foliage of plants. Small openings within the canopy are included. It may exceed 100%." Foliar cover is defined as: "the percentage of ground covered by the vertical projection of the aerial portion of plants. Small openings in the canopy and intraspecific overlap are excluded. Foliar cover is always less than canopy cover; either may exceed 100%." Ground cover is defined as: "the percentage of material, otherthan bare ground, covering the land sur- face. It may include live and standing dead vegetation, litter, cobble, gravel, stones, and bedrock. Ground cover plus bare ground would total 100%." Canopy cover ignores small openings In the canopy, whereas, foliar cover takes these into account. Ground cover is thetotal of everythingprovid- ing direct cover to the land,whereas, canopy cover and foliar cover take into account vegetationallayering that commonly occurs in plant communities. Eachhas its own attributes. Of the three, canopy cover is best suited as a practical field procedure for documenting a plant community. Author is Certified Range Management Consultant, 1509 Hemlock Street, Lake Oswego, Oregon 97034 (503) 636-8017. As a field procedure, canopy cover is equally adapted to grassland, shrubby, woodland, and forest ecological sites. Gramineae, forb, shrub, tree, and moss/lichen species can be measured by this method of quantification. Bare ground, gravel and stones, and litter/mulch also can be measured by the canopy cover procedure. This is especially important in watershed analysis and evaluation of trend in ecological status. This attribute—one procedure for measuring all these factors—strongly enhances the value of the data for ecologi- cal interpretation. The canopy cover procedure provides reasonably accu- rate data suitable for decision-making consistent with the needs of practical resource management and with a min- imum of effort and cost. A disadvantage of using canopy cover is that it must be corrected for herbage removed by grazing. Thisis not diff i- cult if there are ungrazed areas nearby which can be observed. There Is inherent observer error in estimating canopy cover which can be minimized by the use of a com- parison chart. This will improve the accuracy and, evenmore important, consistency of an observer from day to day, and conformity between observers. Comparison charts havebeen used for estimating vegeta- tional density and cover for many years. The bestone I have used is shown in Figure 1.' It was originally developed by a 'An 8 X 10 inch lithographed print of the comparison chart on which the circles are 1 inch diameter can be obtained from the author by sending a self- addressed stamped envelope. Comparison chart for visual estimation of percent foliage cover. Reprinted from theJournal of Sedimentary Petrology with permission from the Journal, authors, and Society of Economic Paleontologists and Mineralogists. t3T ! — L (T \_____// 1% (7:.. 3% (T N__ ' 1% 4 S '•iFj•, -y 5% -. 25% ..; 'f '— 40% 0 H 2% 5% 10% 20% 30% 50%
Transcript of A Guide for Estimating Cover - University of Arizona
236 Ran ge/ends 8(5), October 1986
A Guide for Estimating Cover E. William Anderson
The 1983 report of the Society for Range Management's Range Inventory Standardization Committee (RISC) pro- poses definitions for three kinds of cover measurements: canopy cover, foliar cover, and ground cover.
RISC defines canopy cover as: "the percentage of ground covered by a vertical projection of the outermost perimeter of the natural spread of foliage of plants. Small openings within the canopy are included. It may exceed 100%." Foliar cover is defined as: "the percentage of ground covered by the vertical projection of the aerial portion of plants. Small openings in the canopy and intraspecific overlap are excluded. Foliar cover is always less than canopy cover; either may exceed 100%." Ground cover is defined as: "the percentage of material, other than bare ground, covering the land sur- face. It may include live and standing dead vegetation, litter, cobble, gravel, stones, and bedrock. Ground cover plus bare ground would total 100%." Canopy cover ignores small openings In the canopy, whereas, foliar cover takes these into account. Ground cover is the total of everything provid- ing direct cover to the land, whereas, canopy cover and foliar cover take into account vegetational layering that commonly occurs in plant communities. Each has its own attributes. Of the three, canopy cover is best suited as a practical field procedure for documenting a plant community.
Author is Certified Range Management Consultant, 1509 Hemlock Street, Lake Oswego, Oregon 97034 (503) 636-8017.
As a field procedure, canopy cover is equally adapted to grassland, shrubby, woodland, and forest ecological sites. Gramineae, forb, shrub, tree, and moss/lichen species can be measured by this method of quantification. Bare ground, gravel and stones, and litter/mulch also can be measured by the canopy cover procedure. This is especially important in watershed analysis and evaluation of trend in ecological status. This attribute—one procedure for measuring all these factors—strongly enhances the value of the data for ecologi- cal interpretation.
The canopy cover procedure provides reasonably accu- rate data suitable for decision-making consistent with the needs of practical resource management and with a min- imum of effort and cost.
A disadvantage of using canopy cover is that it must be corrected for herbage removed by grazing. This is not diff i- cult if there are ungrazed areas nearby which can be observed. There Is inherent observer error in estimating canopy cover which can be minimized by the use of a com- parison chart. This will improve the accuracy and, even more important, consistency of an observer from day to day, and conformity between observers.
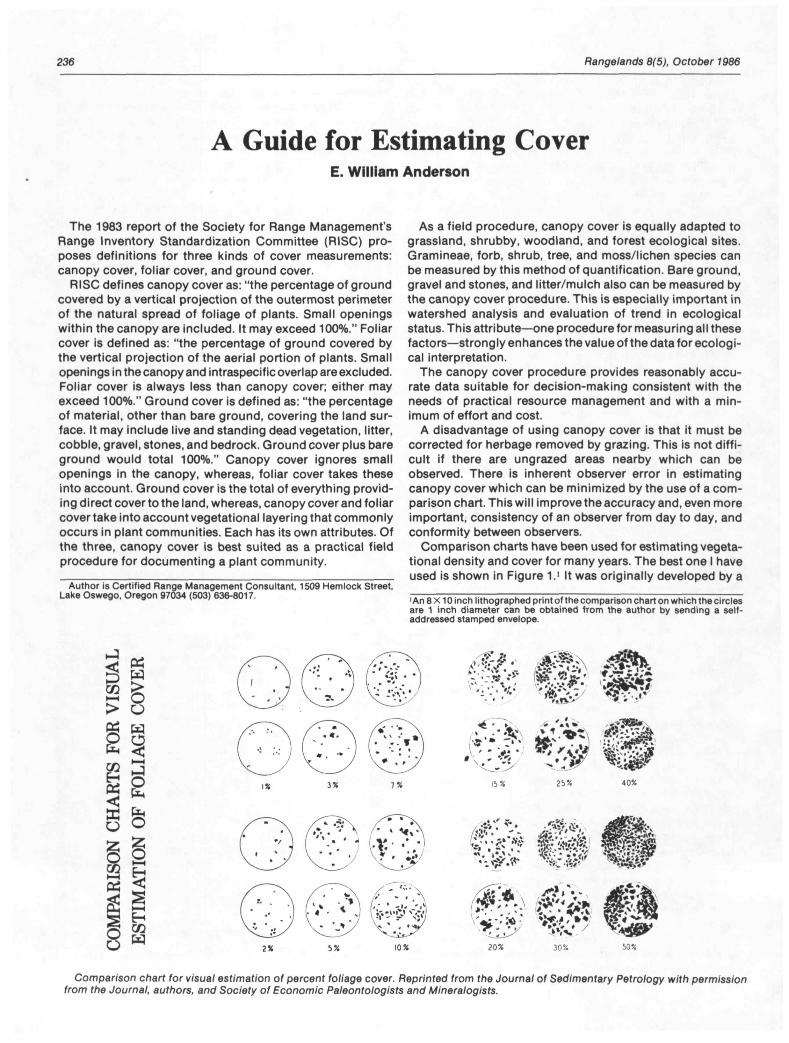
Comparison charts have been used for estimating vegeta- tional density and cover for many years. The best one I have used is shown in Figure 1.' It was originally developed by a
'An 8 X 10 inch lithographed print of the comparison chart on which the circles are 1 inch diameter can be obtained from the author by sending a self- addressed stamped envelope.
Comparison chart for visual estimation of percent foliage cover. Reprinted from the Journal of Sedimentary Petrology with permission from the Journal, authors, and Society of Economic Paleontologists and Mineralogists.
t3T
! — L
(T \_____//
1%
(7:.. 3%
(T N__
' 1%
4
S '•iFj•, -y
5%
-.
25%
..; 'f
'— 40%
0 H 2% 5% 10% 20% 30% 50%
Ran gelands 8(5), October 1986 237
Russian sedimentologist to help visually estimate percen- tages of minerals in rock sections. It was published in U.S.A. by Terry and Chilinger (1965).
The chart is mathematically accurate. The major feature which makes it unusually well adapted to estimating cover of plants is that the black spots are clustered, which simulates the way single species, especially forbs, usually occur in the plant community. Two arrangements of black spots, one of small and one of larger spots, are shown for each percen- tage. This helps select a circle which fits the relative size and distribution pattern of species being rated. When estimating cover of a species, group of species, or total plant commun- ity that exceeds 50%, use the black spots on the chart to connote openings, i.e., a 70% canopy cover is shown by the white areas on the 30% circle.
Estimating Canopy Cover Percent cover is estimated for each species, one at a time.
If a species has less than one percent cover, a trace (T) is recorded. On the comparison chart, each plant of a species is the equivalent of a small black spot; groups of plants of a single species equate with the largest spots in the circle. Select the circle in which the spots best represent the aver- age size, density and dumpiness of the species being rated.
When estimating a small species such as a single-stem annual or perennial, a small sized area, sometimes less than 24 inches diameter, is represented by the circle. Therefore, a number of readings scattered over the area being sampled are required to visualize an average. When each spot repre- sents a larger species such as juniper or pine trees, the area represented by the circle is much larger and one reading can represent the entire area being sampled. For example, the 1% circle can represent the average canopy cover of cheatgrass as well as juniper trees on the area being sampled but the surface area represented by the circle is very different in each case.
This variability in size of area represented by a circle on the comparison chart is due to the relationship between the size of canopy of the species and the distance between canopies. This does not affect the validity of cover estimates made by this procedure since cover data are independent of plot size, shape and sampling design (Holscher, 1959).
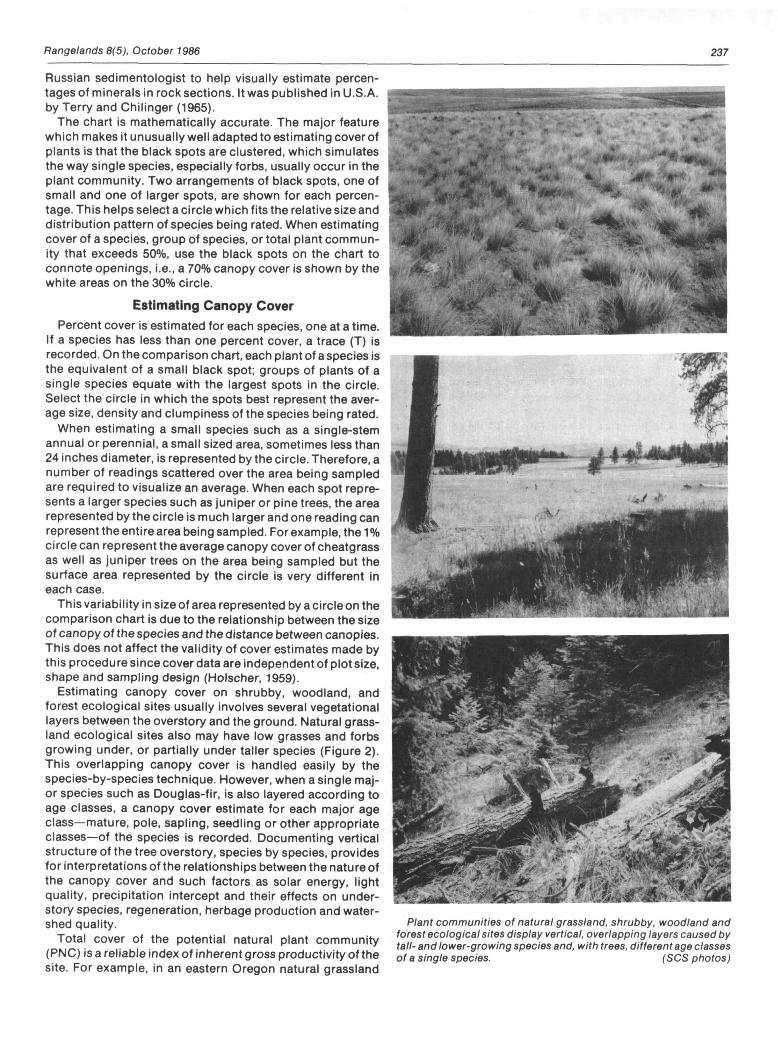
Estimating canopy cover on shrubby, woodland, and forest ecological sites usually involves several vegetational layers between the overstory and the ground. Natural grass- land ecological sites also may have low grasses and forbs growing under, or partially under taller species (Figure 2). This overlapping canopy cover is handled easily by the species-by-species technique. However, when a single maj- or species such as Douglas-fir, is also layered according to age classes, a canopy cover estimate for each major age class—mature, pole, sapling, seedling or other appropriate classes—of the species is recorded. Documenting vertical structure of the tree overstory, species by species, provides for interpretations of the relationships between the nature of the canopy cover and such factors as solar energy, light quality, precipitation intercept and their effects on under- story species, regeneration, herbage production and water- shed quality.
Total cover of the potential natural plant community (PNC) is a reliable index of inherent gross productivity of the site. For example, in an eastern Oregon natural grassland
Plant communities of natural grassland, shrubby, woodland and forest ecological sites display vertical, overlapping layers caused by tall- and lower-growing species and, with trees, different age classes of a single Species. (SCS photos)

238 Rangelands 8(5), October 1986
PNC on silty soil under 9 to 11 inches annual precipitation, the total canopy cover is about 95% of which 30% consists of mosses and lichens in the interspaces between grasses and forbs. By comparison, a mixed fir forest PNC on silty soil under 26 to 40 inches precipitation has a canopy cover of about 170% of which 120% consists of trees of various age classes.
It is good technique to validate the sum of cover estimates for individual species by a quick comparison with the overall plant community cover. Appropriate circles on the chart will provide an approximation of the total cover. If a gross differ- ence exists, reconsider each species to find the error. In multi-layered plant communities it helps to estimate cover for all grasses and forbs as a group, then all shrubs, and all trees to arrive at a total for the plant community.
Aspect Dominance Ratings Some of the most important species in the plant commun-
ity commonly exist only as a "Trace" in the canopy cover. These include palatable forbs which have special signifi- cance as wildlife forage, species which signify early trend in ecological status, and species which are ecological indica- tors of site potential. When estimating cover, a Trace (T) is recorded whether there is one plant of a species on the area sampled or the species occurs throughout the stand but not quite at the 1% canopy-cover level. Obviously, it is beneficial for ecological interpretation to document the relative density of each species, including those that occur as a Trace.
As the canopy cover of each species is quantified, the species is also rated as to its dominance in the aspect physi- ognamy of the plant community. This is done by using a numerical code in which the digit 5 connotes the dominant species; 4 connotes the codominant species; 3 connotes species easily seen in the stand; 2 connotes species seen only by changing position and looking intently; 1 connotes rare species, have to search for it. This dominance rating provides data that not only help reconstruct a mental image of the vegetational physiognamy or aspect of the area sampled but also enhances the quantification of small and single-stemmed species which individually exist only as a Trace or low percentage. Species with a Trace canopy cover can have a dominance rating of 1, 2, or 3 and there can be considerable ecological significance attached to the domi- nance rating. For example, in measuring trend in ecological status, a species that changes from a Trace cover with a dominance rating of 1 to a Trace cover with a dominance rating of 3 in the stand can be as significant, or more so, than a species that changes from 1% to 3% canopy cover. This is especially true in early stages when changes in species occurrence first begin to occur.
All species occurring as a Trace canopy cover collectively contribute to the total canopy cover of the plant community. However, Traces cannot be added arithmetically to numerals to arrive at a sum total. Arbitrarily, therefore, an arithmetic value can be assigned to a group of Traces. For example, ten Traces of species having a dominance rating of 1 can be
counted as being equivalent to 1% canopy cover. Likewise, three Traces of species having a dominance rating of 2 or 3 can be counted as 1% canopy cover.
Plot Size
On rangeland ecological sites, the size of the area sampled when estimating canopy cover is about 50 feet radius (about 8,000 sq. ft.) which will normally encompass the major vari- ability of the plant community being sampled. All species on this area are listed. Cover and aspect dominance ratings are made for each species.
On woodland and forest ecological sites, the size of the area sampled usually needs to be larger to encompass the variability of the plant community. Smaller areas may be adequate to sample the plant community of a dry or moist bottomland site on which the plant community is fairly uniform.
Application This canopy cover procedure is not suitable for measuring
the plant community on wet meadow sites because the dense, multi-layered vegetation makes estimating per cent cover of individual species virtually impossible. Further- more, the occurrence and aspect dominance of wet-meadow species commonly changes markedly as the growing season progresses; different readings are obtained at difterent times.
Experience has shown that cover estimate using the com- parison chart tend to be quantitatively less than estimates based on judgement alone. This is partly because each spe- cies is scrutinized when compared with the chart and each estimate is based upon a standard visual guide. In contrast, judgement estimates are based on a mental concept which varies from person to person and from time to time. This is particularly true for species which have a low percentage cover.
There are many important species that individually consti- tute a low percentage cover in the plant community. Conse- quently, using cover classes or dominance ratings alone is practically worthless and misleading as a measurement of single species for ecological interpretation.
Canopy cover data are so valuable for ecological interpre- tation of the total plant community and related cover factors such as bare ground, litter/mulch and gravel/stones that cover data should be documented even though one or more other procedures are also used for documenting the plant community.
Literature Cited
Holscher, ClarkE. 1959. Report of the committee on plant cover and composition. In: Proceedings, Techniques and Methods of Meas- uring Understory Vegetation. U.S. Forest Serv. Southern & South- eastern Forest Exp. Sta. 174 pgs.
Terry, RIchard 0., and George V. Chllanger. 1955. Summary of "Concerning some additional aids in studying sedimentary forma- tions" by M.S. Shvetsov. J. Sedimentary Petrology 25(3):299-234. September.