A GUIDANCE DOCUMENT FOR TESTING RECREATIONAL WATERS...
86
TESTING RECREATIONAL WATERS USING USEPA qPCR METHOD 1611 ASLAN A., KINZELMAN, J., DREELIN, E., ANAN’EVA, T., LAVANDER, J. APRIL, 2013 A GUIDANCE DOCUMENT FOR
Transcript of A GUIDANCE DOCUMENT FOR TESTING RECREATIONAL WATERS...
TESTING RECREATIONAL WATERS USING USEPA qPCR METHOD 1611
ASLAN A., KINZELMAN, J., DREELIN, E., ANAN’EVA, T., LAVANDER, J.
APRIL, 2013
A GUIDANCE DOCUMENT FOR
PrefaceReal-time testing of surface water quality is beneficial to public health agencies for preventing of exposure to polluted recreational water. However, the current US EPA approved culture-based standard methods require a minimum of 18 – 24 hours from receipt of sample to reporting of results to coastal beach managers, which prevents timely reporting of the results to protect public health.
Rapid testing methodologies, such as quantitative real-time polymerase chain reaction (qPCR), are intended to shorten the period between sampling and posting publicly available results, with the goal of having same-day water quality information. Therefore, qPCR has been adapted as a rapid, laboratory-based method for enumerating fecal indicator bacteria (FIB) and suggested as an alternative to culture based methods in the USEPA 2012 Recreational Water Quality Criteria.
These new rapid methods are ready for routine monitoring however, implementing the new methods is a challenge at the local health department level. qPCR requires specific equipment and expertise, which may cause delays in transferring this technology.
This manual aims to provide technical assistance to laboratories that will be using qPCR for the first time. The content describes the steps necessary to decide whether qPCR is feasible, to outfit a qPCR laboratory, to collect and process samples, to apply quantitative polymerase chain reaction method for the detection of enterococci in recreational waters (Method 1611), and to interpret and report results.
This manual is intended to serve as general guidance for the development of laboratory and method-specific QA/QC procedures for PCR analysis of environmental samples.
This document does not address federal, state, and local regulations governing waste management, hazardous materials, and radioactive material; it is the laboratory's responsibility to comply with all relevant regulations. Furthermore, this guidance does not address related safety issues; it is the laboratory’s responsibility to establish appropriate safety and health practices.
The analytical procedure and supporting information in this manual were adapted from:
Method 1611: Enterococci in Water by TaqMan Quantitative Polymerase Chain Reaction (qPCR) Assay by USEPA, April, 2012
Essentials of Real Time PCR by Applied Biosystems
http://www3.appliedbiosystems.com/cms/groups/mcb_marketing/documents/generaldocuments/cms_042485.pdf
Quality Assurance/Quality Control Guidance for Laboratories Performing PCR Analyses on Environmental Samples by USEPA, 2004
Kinzelman, J., Anan’eva, T., Lavender, J. (2010). QPCR for Newbies E. coli in Water by Scorpion® Quantitative Polymerase Chain Reaction Assay.
http://www3.appliedbiosystems.com/cms/groups/mcb_marketing/documents/generaldocuments/cms_042485.pdf
http://www3.appliedbiosystems.com/cms/groups/mcb_marketing/documents/generaldocuments/cms_042485.pdf
TABLE OF CONTENTS1. Introduction 8
1.1. What is PCR? 9
1.2. What is qPCR? 11
1.3. What does qPCR measure? 12
2. Can I Use qPCR for Recreational Water quality Monitoring 14
2.1. Components of a Feasibility Study 15
2.2. Feasibility Case Study 18
3. Setting up a qPCR Laboratory 19
3.1. Facility Design 20
3.1.1. Designation of workstations 21
3.2. Instrument Selection, Calibration and Standardization 25
3.3. Laboratory Quality Assurance and Quality Control 26
3.4. Personnel Training 27
4. Preanalytical Set Up for Method 1611 28
4.1. Equipment and Supplies for Each Workstation 29
4.1.1. Membrane filtration preparation workstation equipment and supplies 29
4.1.2. Crude DNA extraction workstation equipment and supplies 30
iii
4.1.3. Mastermix preparation workstation equipment and supplies 31
4.1.4. Reaction preparation workstation equipment and supplies 31
4.1.5. Amplification and product detection workstation equipment and supplies 32
4.2. Work Area Preparation 32
4.3. Preparing Cell Suspensions, Whole Cell Calibrators and Standard Curve 33
4.3.1. Preparing cell suspensions (stock cultures) of E. faecalis 33
4.3.2. Determining the concentration of the stocks 33
4.3.3. Storage of the standards 36
4.3.4. Preparation of E. faecalis genomic DNA standards 36
4.3.5. Preparing whole cell calibrators 39
4.3.6. Generation of standard curve 40
4.3.7. Quality Assurance and Quality Control for Standards and Calibrators 42
4.4. Preparing Controls 42
4.4.1. Salmon DNA Sample Processing Control (SPC) (Non-target DNA Control) 43
4.4.2. Use of calibrators as positive controls 44
4.4.3. Method Blank 45
4.4.4. Filter Blank 45
4.4.5. No Template Control 45
iv
4.5. Complete List of Reagents 46
4.6. Quality Assurance and Quality Control for Reagents 47
5. Sampling for Recreational Water Quality Monitoring 47
5.1 Sampling Equipment 50
5.2. Sample Collection 51
5.3. Sample Transport 52
5.4. Environmental Sample Acceptance Protocol 52
6. Analytical Procedures for Method 1611 54
6.1. Membrane Filtration (Concentration of target DNA) 55
6.1.1. Method Blank Membrane Filtration Protocol 55
6.1.2. Water Sample Membrane Filtration Protocol 57
6.2. Nucleic Acid Extraction 57
6.2.1. Preparation of Enterococcus Calibrator Sample Extract 58
6.2.2. Preparation of the Samples and Method Blank Extracts 60
6.3. Mastermix Preparation 61
6.4. Template, Positive and Negative Control Preparation 62
6.5. Quantification 63
7. Data Assessment 64
v
7.1. Data Analysis and Calculations 65
7.1.1. Calculating efficiency and amplification factor from the genomic standard curve 65
7.1.2. Calculation of average target sequence in calibrator sample extracts per reaction 66
7.1.3. Calculation of CCE /100ml 67
7.1.4. Descriptive statistics of results 68
7.2. Data Handling 69
7.2.1. Replicate pair sample agreement 69
7.2.2. Negative controls 69
7.2.3. Positive controls 70
7.2.4. Incomplete target detection 70
7.2.5. Inhibition 71
7.3. Reporting the Results 72
8. Conclusion 74
9. Strategies for Saving Time During qPCR Analysis 77
Glossary 79
References 83
vi

vii
CHAPTER 1
Introduction
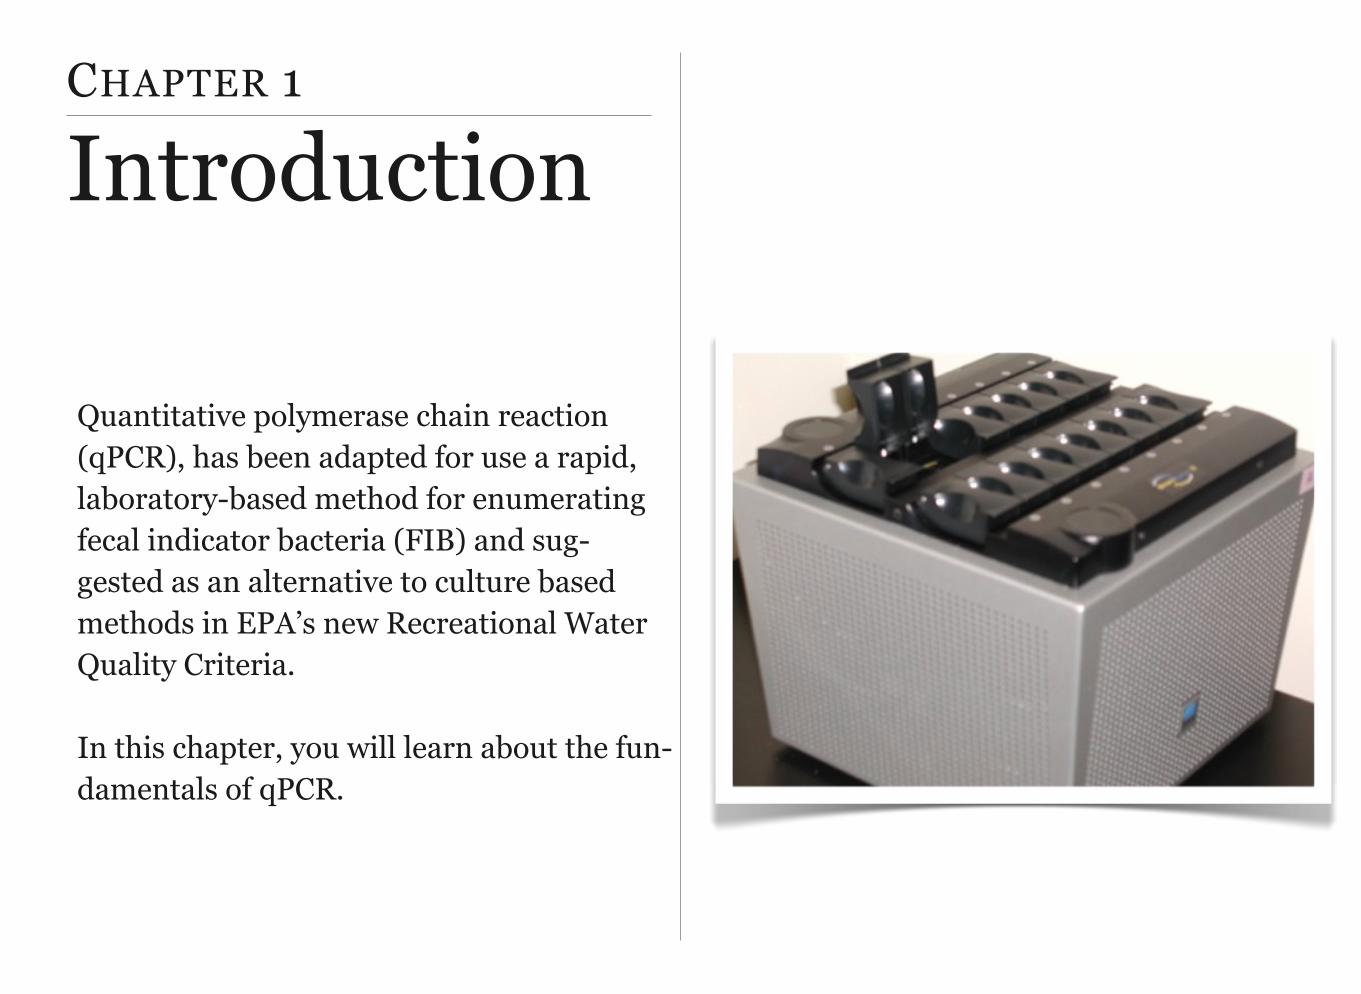
Quantitative polymerase chain reaction (qPCR), has been adapted for use a rapid, laboratory-based method for enumerating fecal indicator bacteria (FIB) and sug-gested as an alternative to culture based methods in EPA’s new Recreational Water Quality Criteria.
In this chapter, you will learn about the fun-damentals of qPCR.
CONTENTS
1.1. What is polymerase chain reaction (PCR)?
1.2. What is quantitative PCR (qPCR)?
1.3. What does qPCR measure?
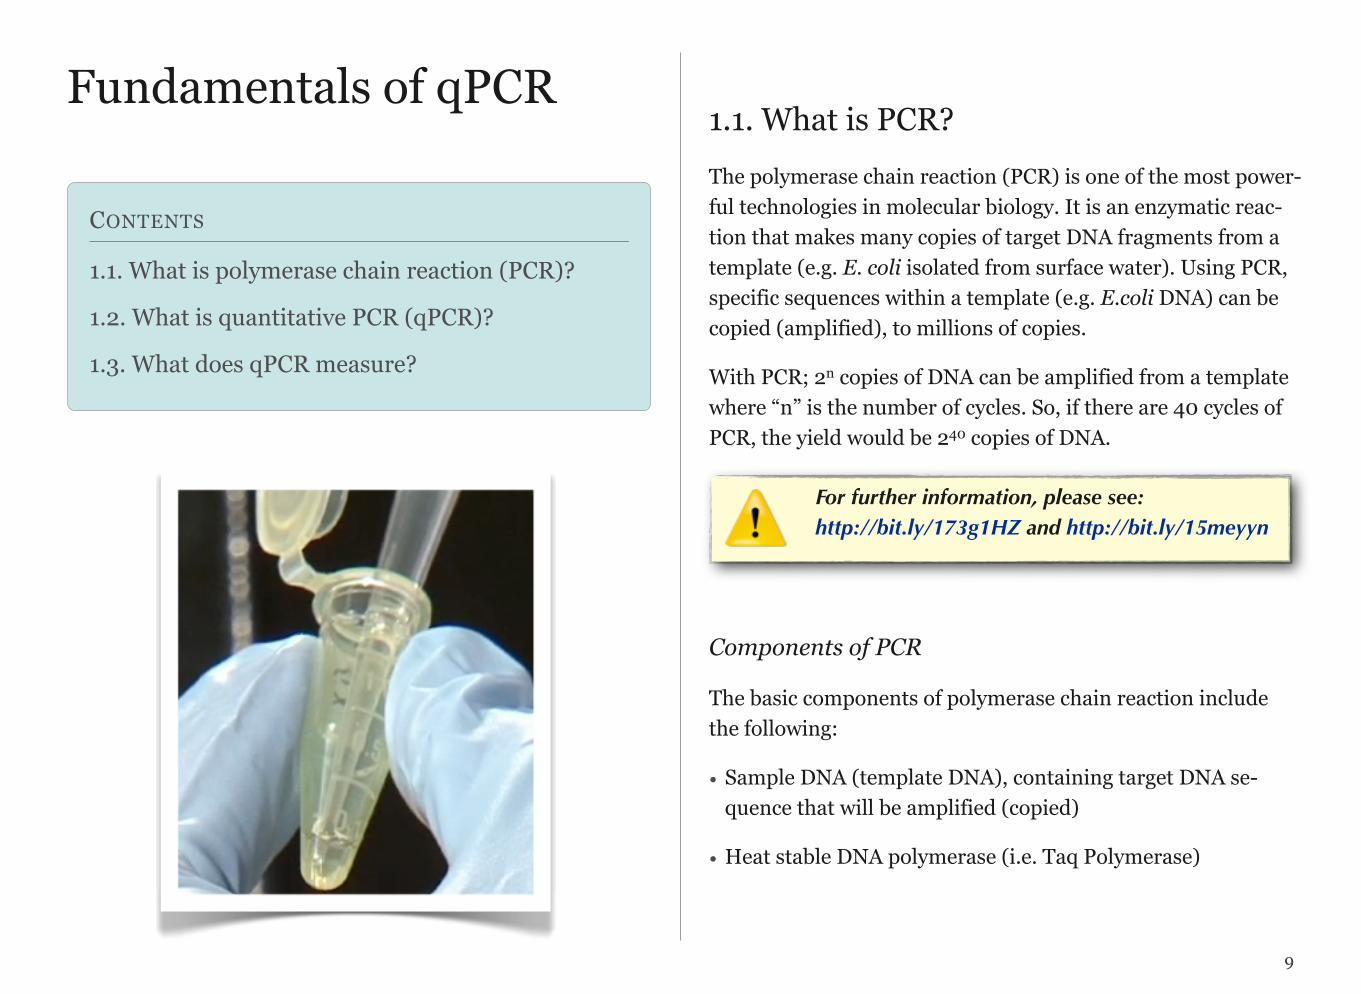
Fundamentals of qPCR1.1. What is PCR?The polymerase chain reaction (PCR) is one of the most power-ful technologies in molecular biology. It is an enzymatic reac-tion that makes many copies of target DNA fragments from a template (e.g. E. coli isolated from surface water). Using PCR, specific sequences within a template (e.g. E.coli DNA) can be copied (amplified), to millions of copies.
With PCR; 2n copies of DNA can be amplified from a template where “n” is the number of cycles. So, if there are 40 cycles of PCR, the yield would be 240 copies of DNA.
Components of PCR
The basic components of polymerase chain reaction include the following:
• Sample DNA (template DNA), containing target DNA se-quence that will be amplified (copied)
• Heat stable DNA polymerase (i.e. Taq Polymerase)
9
For further information, please see: http://bit.ly/173g1HZ and http://bit.ly/15meyyn
• Forward and reverse primers (short nucleotide sequences complimentary to target DNA)
• Deoxynucleoside triphosphates (dNTPs; the building blocks of DNA, used to synthesize the new strand)
• Buffer solution that provides optimal pH conditions for the reaction to proceed
• Ions (i.e. Mg+2)
PCR Steps
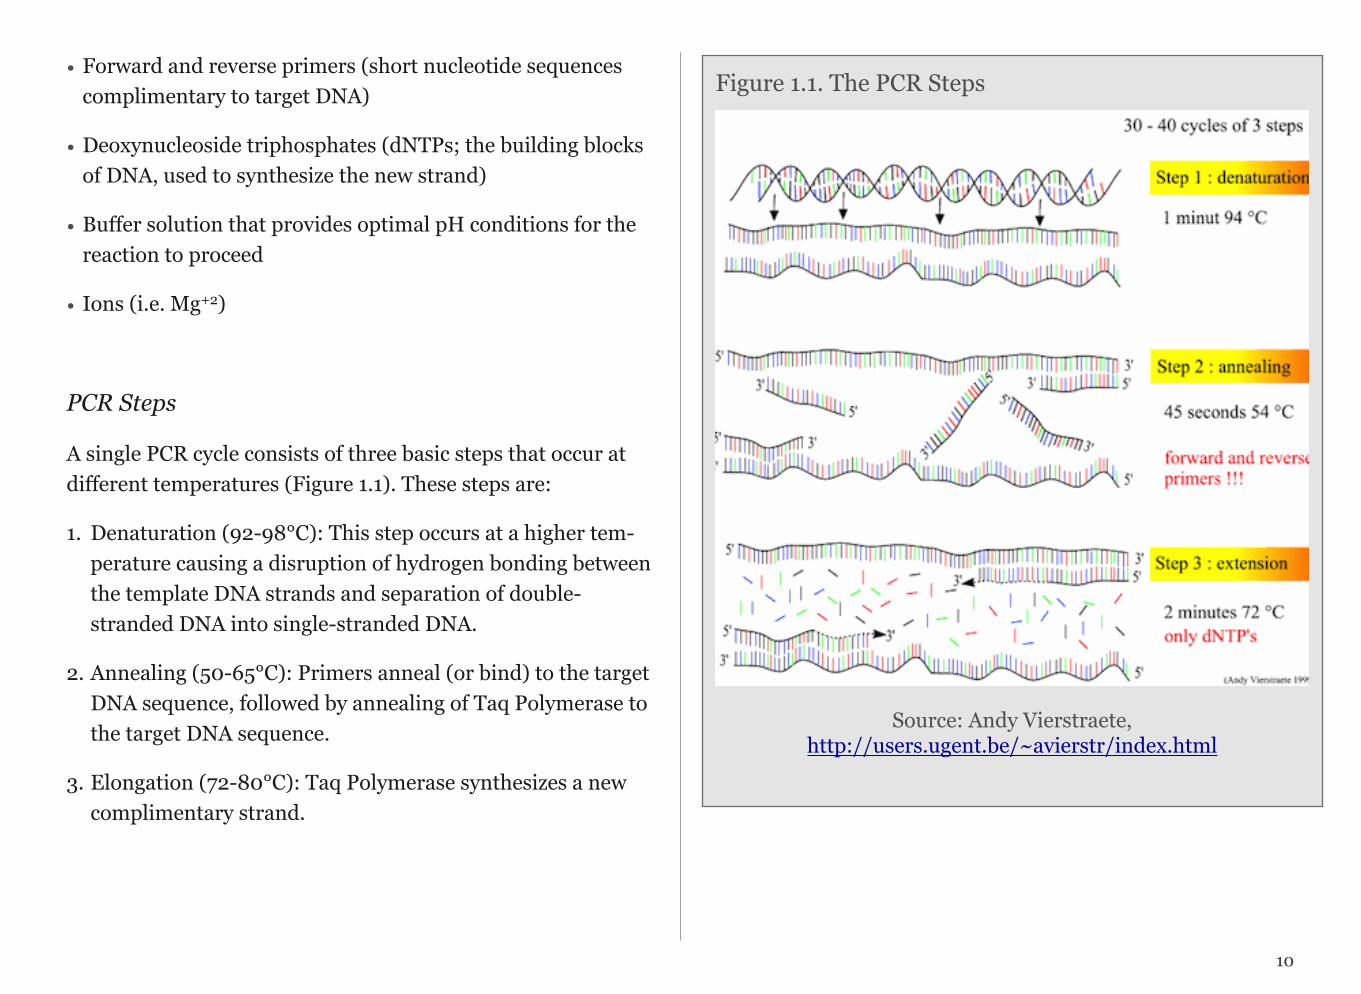
A single PCR cycle consists of three basic steps that occur at different temperatures (Figure 1.1). These steps are:
1. Denaturation (92-98°C): This step occurs at a higher tem-perature causing a disruption of hydrogen bonding between the template DNA strands and separation of double-stranded DNA into single-stranded DNA.
2. Annealing (50-65°C): Primers anneal (or bind) to the target DNA sequence, followed by annealing of Taq Polymerase to the target DNA sequence.
3. Elongation (72-80°C): Taq Polymerase synthesizes a new complimentary strand.
10
Source: Andy Vierstraete, http://users.ugent.be/~avierstr/index.html
Figure 1.1. The PCR Steps
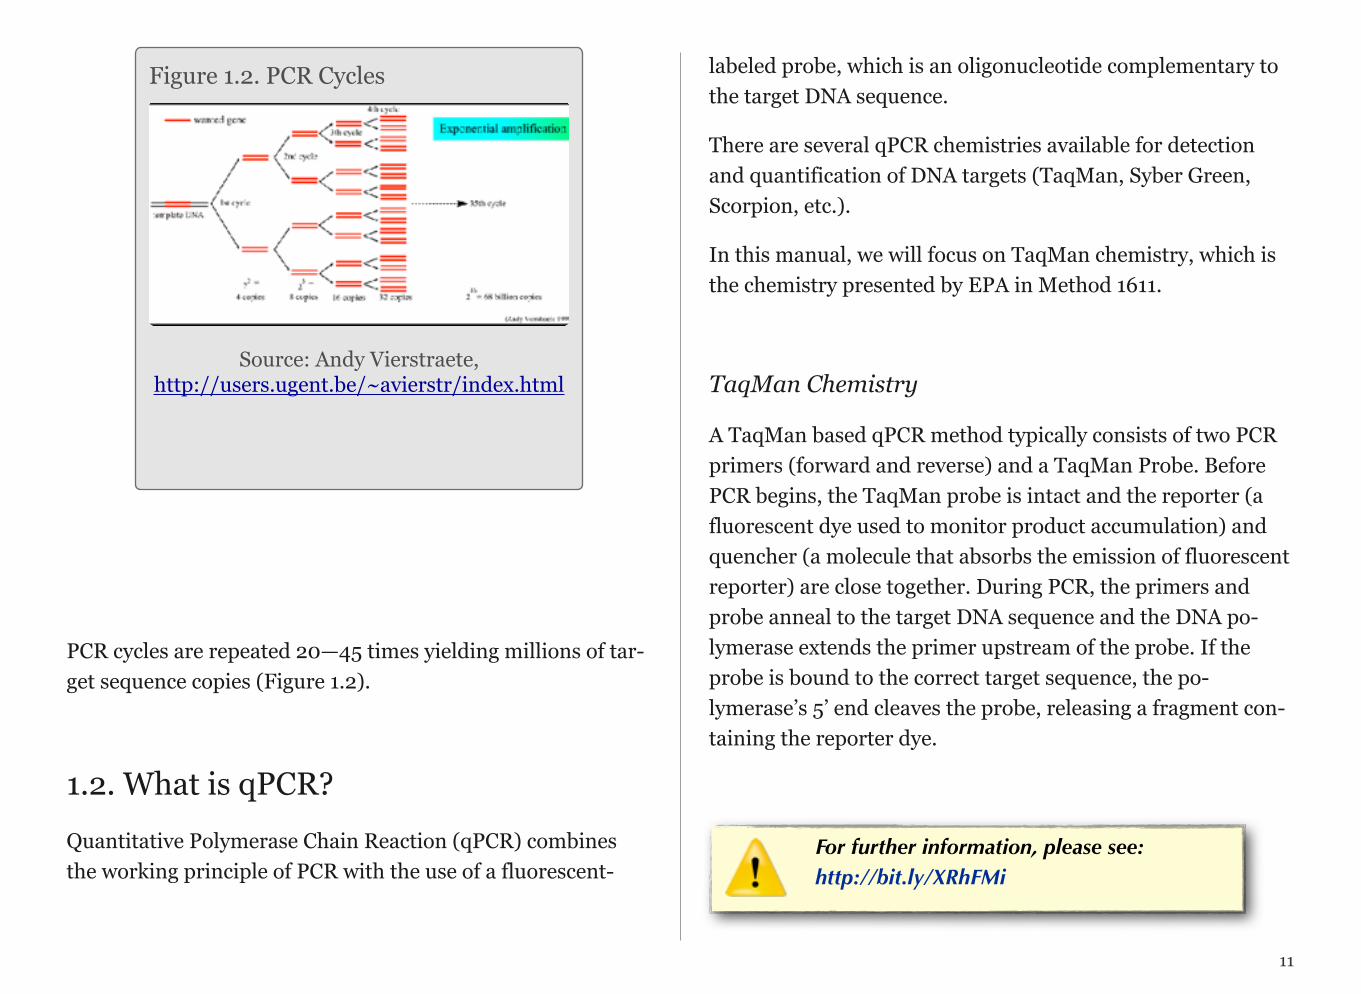
PCR cycles are repeated 20—45 times yielding millions of tar-get sequence copies (Figure 1.2).
1.2. What is qPCR?Quantitative Polymerase Chain Reaction (qPCR) combines the working principle of PCR with the use of a fluorescent-
labeled probe, which is an oligonucleotide complementary to the target DNA sequence.
There are several qPCR chemistries available for detection and quantification of DNA targets (TaqMan, Syber Green, Scorpion, etc.).
In this manual, we will focus on TaqMan chemistry, which is the chemistry presented by EPA in Method 1611.
TaqMan Chemistry
A TaqMan based qPCR method typically consists of two PCR primers (forward and reverse) and a TaqMan Probe. Before PCR begins, the TaqMan probe is intact and the reporter (a fluorescent dye used to monitor product accumulation) and quencher (a molecule that absorbs the emission of fluorescent reporter) are close together. During PCR, the primers and probe anneal to the target DNA sequence and the DNA po-lymerase extends the primer upstream of the probe. If the probe is bound to the correct target sequence, the po-lymerase’s 5’ end cleaves the probe, releasing a fragment con-taining the reporter dye.
11
Source: Andy Vierstraete, http://users.ugent.be/~avierstr/index.html
Figure 1.2. PCR Cycles
For further information, please see:http://bit.ly/XRhFMi
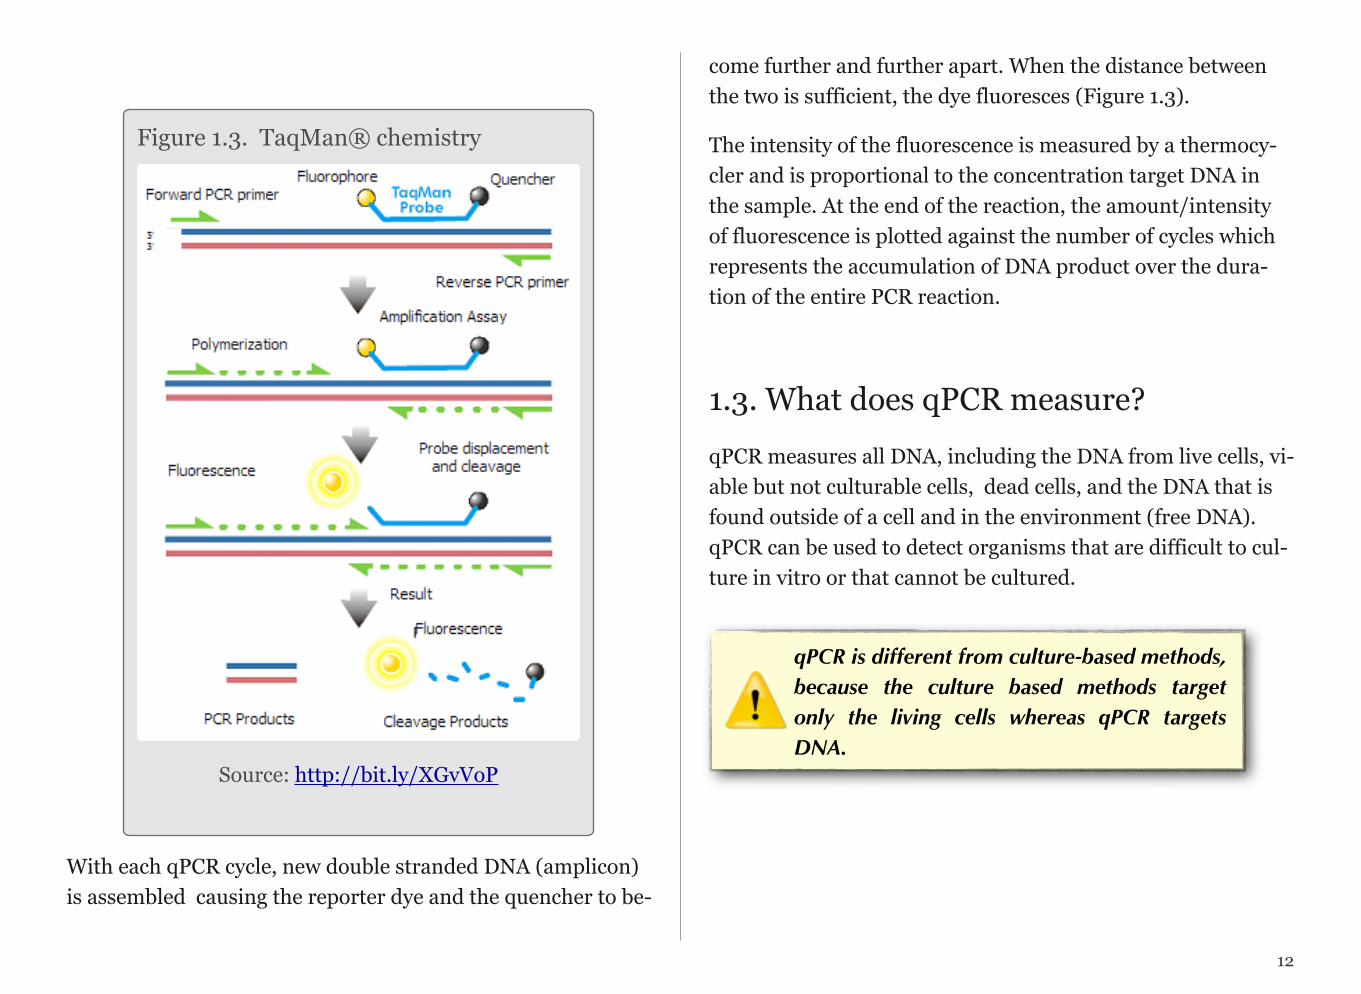
With each qPCR cycle, new double stranded DNA (amplicon) is assembled causing the reporter dye and the quencher to be-
come further and further apart. When the distance between the two is sufficient, the dye fluoresces (Figure 1.3).
The intensity of the fluorescence is measured by a thermocy-cler and is proportional to the concentration target DNA in the sample. At the end of the reaction, the amount/intensity of fluorescence is plotted against the number of cycles which represents the accumulation of DNA product over the dura-tion of the entire PCR reaction.
1.3. What does qPCR measure?qPCR measures all DNA, including the DNA from live cells, vi-able but not culturable cells, dead cells, and the DNA that is found outside of a cell and in the environment (free DNA). qPCR can be used to detect organisms that are difficult to cul-ture in vitro or that cannot be cultured.
qPCR is different from culture-based methods, because the culture based methods target only the living cells whereas qPCR targets DNA.
12
Source: http://bit.ly/XGvVoP
Figure 1.3. TaqMan® chemistry
qPCR is a rapid tool and has advantages such as:
• The reaction occurs in less than 3 hours, enabling rapid pub-lic notification
• Accurate and precise quantification over wide range of target concentrations
However, because the target is different (total DNA) in qPCR versus culture-based methods (living cells) and has different sensitivity levels, laboratories have to go through a decision stage in which they compare these two methods and find out whether a switch to qPCR would be beneficial in their respec-tive water environment. Therefore, careful consideration should be given before the qPCR method can be approved for use.
Conducting feasibility and method validation studies will en-sure accurate result reporting and also provide information on implementation considerations at the individual laboratory level including, but not limited to: physical requirements, ap-propriate choice of instrument platform, approved product sourcing, costs, staff training needs, turn-around-time, and the ability of the method to accurately characterize water qual-ity (Kinzelman and Anan’eva, in review).
The next chapter will discuss how to conduct a feasibility study and actions to be taken before investing in a qPCR labo-ratory.
13
CHAPTER 2
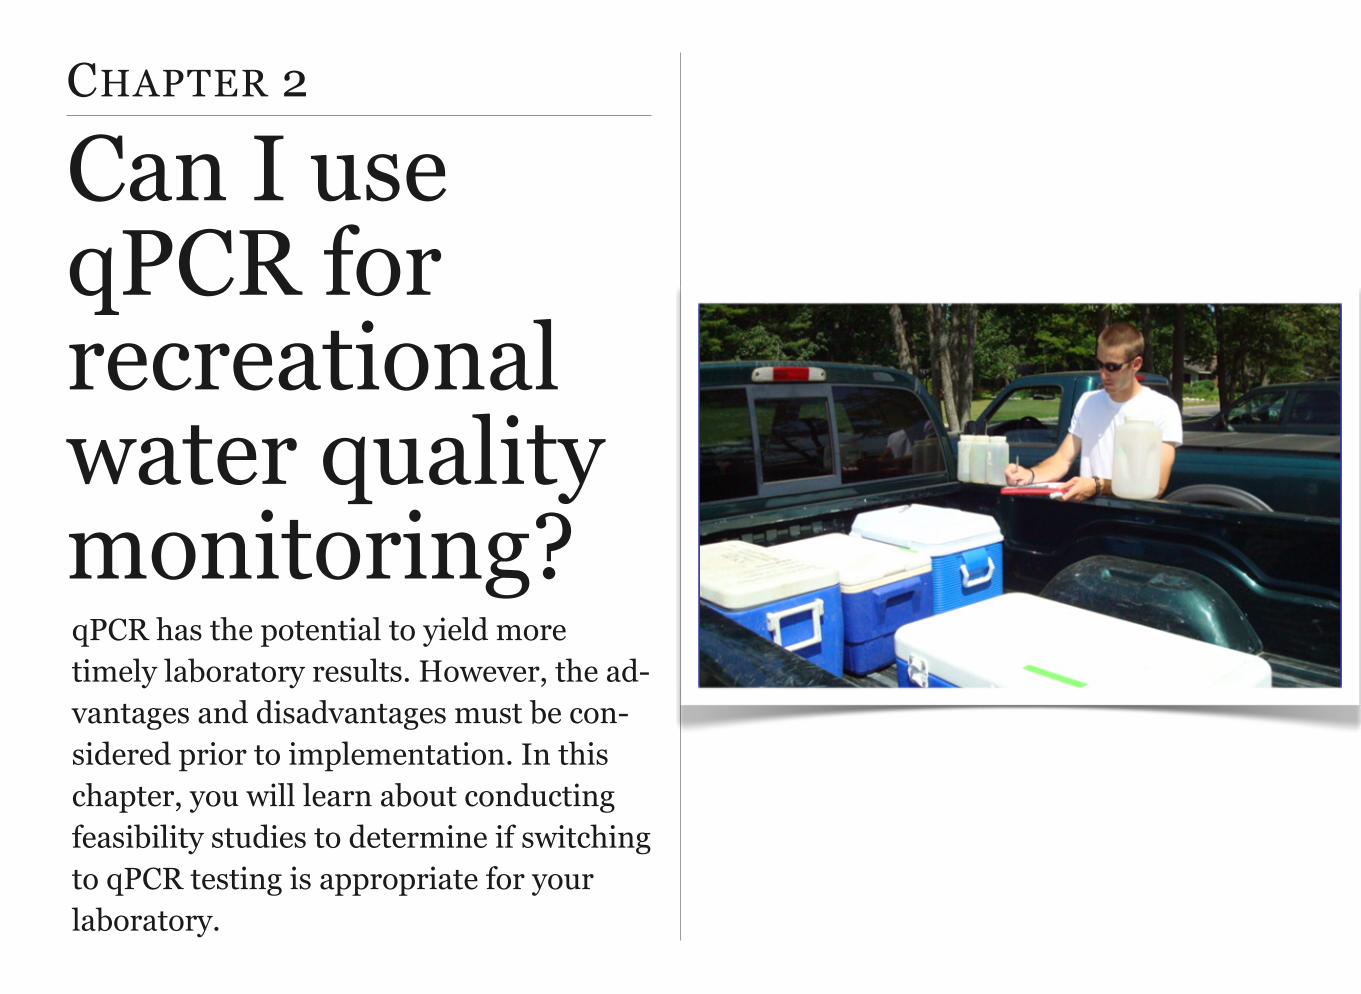
Can I use qPCR for recreational water quality monitoring?qPCR has the potential to yield more timely laboratory results. However, the ad-vantages and disadvantages must be con-sidered prior to implementation. In this chapter, you will learn about conducting feasibility studies to determine if switching to qPCR testing is appropriate for your laboratory.
CONTENTS
2.1. Components of a Feasibility Study
2.2. Feasibility Case Study
Using qPCR method in recreational water quality detection
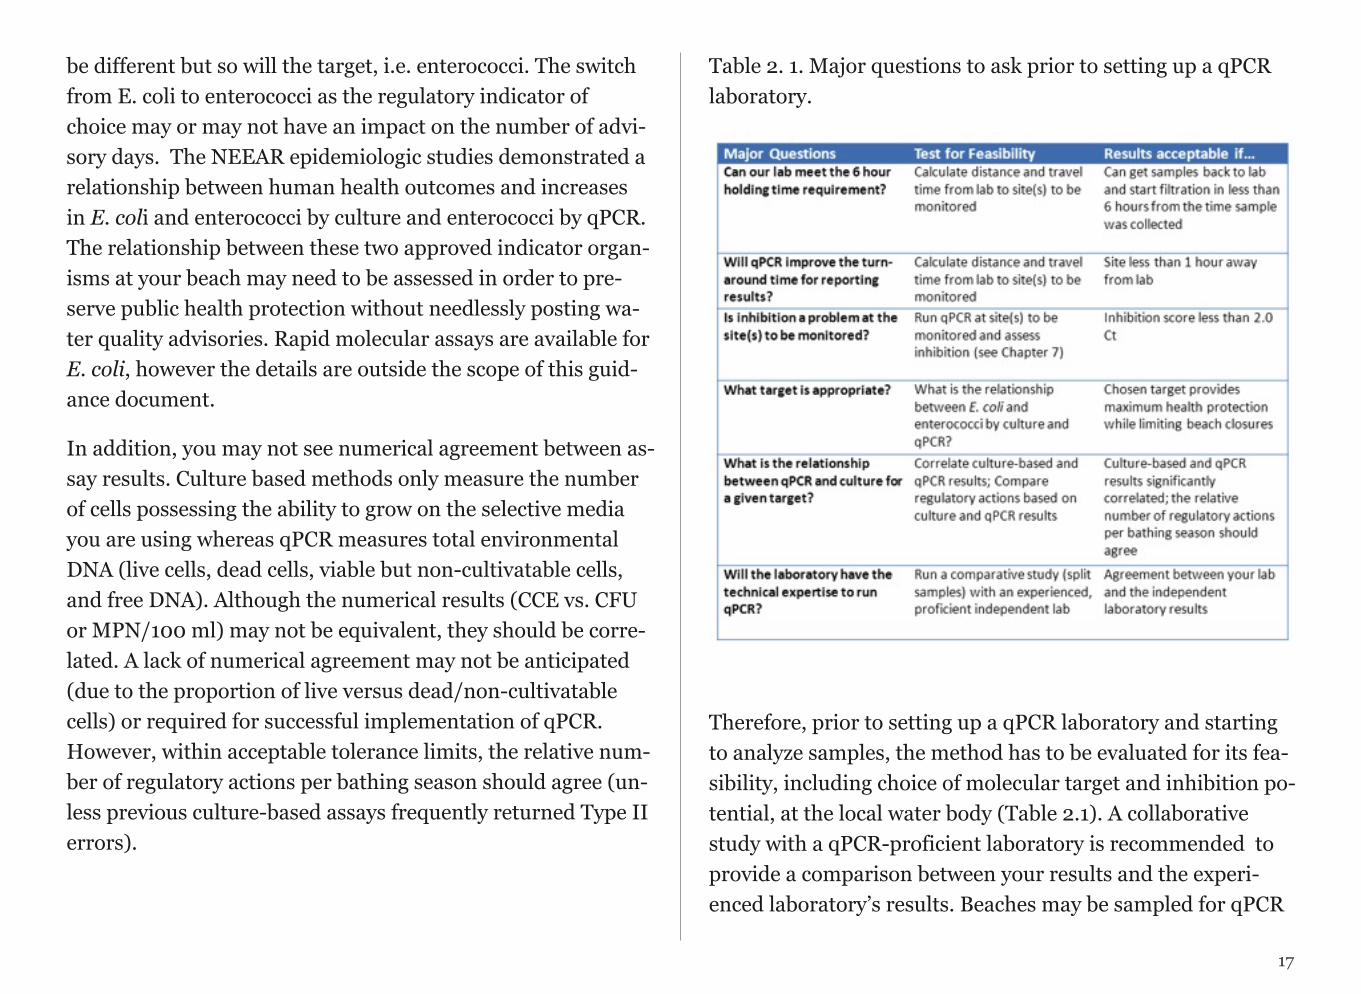
2.1. Components of a Feasibility StudyA feasibility study encompasses the entire decision-making process leading up to the choice for or against using qPCR at your facility. During the feasibility study, you will address the following questions:
• Can we meet the 6 hour hold requirement?
• Will qPCR improve the turn-around time for reporting results?
• Is inhibition a problem at the site(s) to be monitored?
• What target is appropriate?
• What is the relationship between culture and qPCR for the chosen target?
• Is our lab technically capable of running qPCR effec-tively?
To address the first two questions above, you will need to con-sider the distance between the beach to be monitored and the testing facility with the capability to generate a same day re-sult. If your beaches are more than one hour away from a laboratory with molecular capabilities, you may not receive your regulatory monitoring results until late in the afternoon. You may also exceed the 6 hour hold time (time between sam-
15
ple collection to processing), which could potentially compro-mise the qPCR results.
For example, if the field sampler begins their work day at 0700, collecting samples from several beaches prior to deliver-ing them to the analytical laboratory at 1200, the earliest a re-sult could be generated with US EPA Method 1611 is approxi-mately 1530. While the sample-to-result process has occurred within a single operational unit, i.e. the same day, late after-noon notification may result in the removal of beach patrons from the water in the middle of their visit. Although this may be good from a public health perspective, it may not be well received from a public relations standpoint. Therefore, de-sired turnaround time should be the first step in the process.
If there is no existing facility able to accommodate your de-sired turnaround time, you may look to local, state and federal public health agencies, water or wastewater utilities, or univer-sities to expand your capabilities with respect to molecular testing. These agencies and universities are typically certified water testing laboratories and may, in the case of local or state public health agencies, already be using qPCR technology for food-borne outbreak or clinical disease investigation/surveillance. Universities may be equipped for molecular as-says as a result of ongoing research or student instruction.
One must also remember when considering a molecular method that while the final output may be in units per 100 ml of fecal indicator bacteria, this assay is more similar to a chemical analysis rather a microbiological one. While culture-
based assays depend on bacterial growth, qPCR assays are based on the quantification of a constituent within the sam-ple, in this case DNA. As with other chemical analyses, there may be other components in the sample which may cause an incomplete reaction or completely prevent the chemical reac-tion from occurring, thereby reducing the recovery of your tar-get DNA. The process by which this occurs is called inhibition (further discussed in Chapter 7). Use of the US EPA routine, on-site beach sanitary survey tool may help to determine site specific environmental conditions preceding, or occurring con-comitantly, that result in inhibited samples. In some in-stances, inhibition may be resolved by dilution of the sample. In other cases it may require the use of a DNA clean and con-centrate kit, of which there are several on the market. How-ever, there are times when inhibition is irresolvable, for exam-ple if the target level is very low the application of multiple se-rial dilutions may result in a sample below the limit of detec-tion. There are other confounding factors that may limit the ability of qPCR to accurately quantify the DNA target. It has also been observed, in areas with frequent filamentous green algal blooms that target non-detection may occur in the ab-sence of inhibition. Competition for target with bacteria-rich samples may also take place, e.g. methods that employ an in-ternal amplification control (IAC).
Another consideration is the choice of molecular target. Great Lakes beaches have typically been regulated using an E. coli standard. When considering rapid molecular methods, such as US EPA Method 1611, not only will the analytical procedure
16
be different but so will the target, i.e. enterococci. The switch from E. coli to enterococci as the regulatory indicator of choice may or may not have an impact on the number of advi-sory days. The NEEAR epidemiologic studies demonstrated a relationship between human health outcomes and increases in E. coli and enterococci by culture and enterococci by qPCR. The relationship between these two approved indicator organ-isms at your beach may need to be assessed in order to pre-serve public health protection without needlessly posting wa-ter quality advisories. Rapid molecular assays are available for E. coli, however the details are outside the scope of this guid-ance document.
In addition, you may not see numerical agreement between as-say results. Culture based methods only measure the number of cells possessing the ability to grow on the selective media you are using whereas qPCR measures total environmental DNA (live cells, dead cells, viable but non-cultivatable cells, and free DNA). Although the numerical results (CCE vs. CFU or MPN/100 ml) may not be equivalent, they should be corre-lated. A lack of numerical agreement may not be anticipated (due to the proportion of live versus dead/non-cultivatable cells) or required for successful implementation of qPCR. However, within acceptable tolerance limits, the relative num-ber of regulatory actions per bathing season should agree (un-less previous culture-based assays frequently returned Type II errors).
Table 2. 1. Major questions to ask prior to setting up a qPCR laboratory.
Therefore, prior to setting up a qPCR laboratory and starting to analyze samples, the method has to be evaluated for its fea-sibility, including choice of molecular target and inhibition po-tential, at the local water body (Table 2.1). A collaborative study with a qPCR-proficient laboratory is recommended to provide a comparison between your results and the experi-enced laboratory’s results. Beaches may be sampled for qPCR
17
over the course of a recreational season in addition to routine monitoring procedures. If diurnal variation is a concern, i.e. samples are to be collected at a different time of day than in previous years or prior sampling techniques (such as compos-ite sampling) are to be used they should be incorporated into the comparative sample analysis study(Kinzelman and Leittl, 2012; Mudd et al., 2012). The bacterial data (both qPCR and culture based data performed at the local and independent labs) collected along with the beach sanitary survey data should be evaluated statistically. This approach will allow for a better understanding of whether it is appropriate for your lab to switch targets and/or methods for a particular site. The next section will provide an example of a pilot feasibility study that was done in Racine, WI.
2.2. Feasibility Case StudyThe City of Racine Health Department laboratory was the agency responsible for regulatory recreational water quality monitoring for the last several decades leading up to the devel-opment of rapid molecular assays with the potential to de-crease sample to result turnaround time from greater than 24 hours to as little as three. Already a certified water testing laboratory, they had previously purchased the necessary in-strumentation and ancillary equipment to conduct qPCR, us-ing grant funds, in an effort to increase their lab capacity for public health emergency response. Although some staff had experience with traditional PCR through previous employ-
ment or academia, nobody was familiar with qPCR. However, the proximity of the lab to the nearby public bathing beaches (about 2.0 miles away) made the possibility of more rapid pub-lic notification both desirable and feasible. Because the equip-ment was already in place for other purposes the decision was made to procure training for the primary analyst and conduct the feasibility study in house with aid from external, method proficient laboratories.
After training was completed, routine, recreational, single sample and composite, surface water samples were collected, up to four times per week, during the beach season (roughly Memorial Day to Labor Day). The US EPA routine beach sani-tary survey form was completed on each day that sample col-lection occurred. Samples were analyzed by both qPCR and culture-based assays for E. coli (the current target) and entero-cocci (the potential new target). Split samples (filters) for the qPCR assay were exchanged with proficient laboratories and the results were subjected to statistical analysis. Sanitary sur-vey data was examined on each day that inhibition occurred. E. coli and enterococci were correlated. Inhibition occurred in less than 3% of samples collected and was associated to days with high turbidity and intense wave activity. When it oc-curred, serial dilution was able to compensate without dilut-ing out the target. Numerical agreement was 60 – 70% and regulatory action agreement was above 90%. Due to the favor-able results, further comparative studies could be conducted.
18
CHAPTER 3
Setting up a qPCR laboratory
Once the feasibility studies are completed and the decision has been made to switch to qPCR, a fully equipped laboratory has to be set up. One advantage of setting up a qPCR laboratory is that it can be used for addi-tional analytical testing including source tracking or other public health related medi-cal testing. In this chapter, we will focus on the details for setting up a laboratory that is capable of conducting qPCR assays.

CONTENTS
3.1. Facility Design
3.2. Instrument Selection, Calibration and Standardization
3.3. Laboratory Quality Assurance and Quality Control
3.4. Personnel Training
Design for a qPCR Labora-tory
3.1. Facility DesignThe laboratory workflow should be designed to prevent con-tamination of current qPCR reactions with products from pre-vious assays, cross-contamination between samples, and con-tamination from other analytical testing; all are potential sources of invalid qPCR results. Therefore, it is recommended that there should be strict separation between workstations and/or different steps of the qPCR method. Thus, a laboratory performing qPCR analyses on environmental samples should be divided into several physically separate workstations.
Some of these stations should be physically sepa-rated whereas others can be combined in a single room depending on the physical space.
Examples for workstation designations are as follows:
•Membrane filtration workstation
•Nucleic acid extraction workstation (This station can be com-bined with the membrane filtration station)
•Mastermix preparation workstation (ideally using positive pressure to prevent the introduction of contamination). This station has to be strictly separated from other work-stations and preferably should be set up in a sepa-rate room.
20

•Reaction preparation workstation (ideally using negative pressure to keep template nucleic acids in the station). This station can be on a clean bench top if there is limited space close to the amplification and product detection workstation.
• Amplification and product detection workstation (This work-station has the thermocycler).
3.1.1. Designation of workstations
Separate workstations for each step in the qPCR analysis should be designated in order to reduce cross-contamination and to create an efficient workflow (Figure 3.1). All stations should be clearly labeled and have necessary warnings on them. Micropipettors should be dedicated to a particular sta-tion and labeled appropriately. If your micropipettors are auto-clavable, you should routinely sterilize them. If the micropipet-tors are not autoclavable, wipe them down with a freshly pre-pared 10% bleach solution and UV sterilize for 20 minutes.
All materials, supplies, or equipment belonging to one spe-cific workstation should remain at their respective area at all times.
All materials, supplies, or equipment belonging to one specific workstation should remain in its re-spective area.
Membrane Filtration Workstation
This workstation should be designed for the preparation and storage of the filters obtained by filtering the environmental water samples. Fresh gloves and dedicated laboratory coats should be worn at all times to control contamination. Person-nel should perform tasks at this workstation before working in the crude DNA extraction, mastermix preparation, reaction preparation or amplification and product detection workstati
21
Figure 3.1. Diagram of workflow.
ons to avoid contamination. Samples, equipment or supplies should not move from these workstations back to the mem-brane filtration workstation.
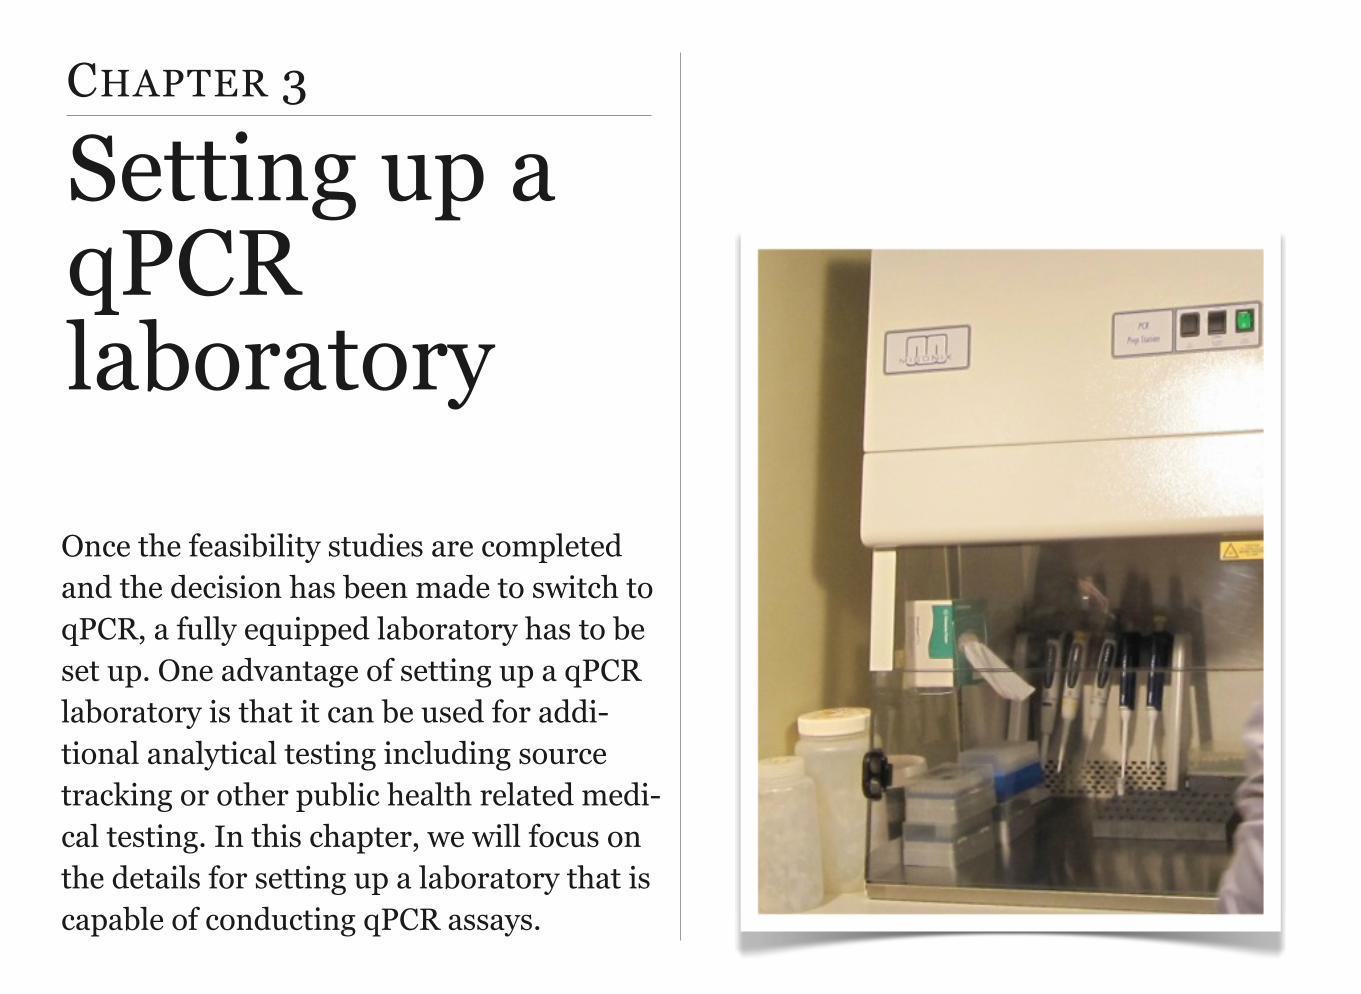
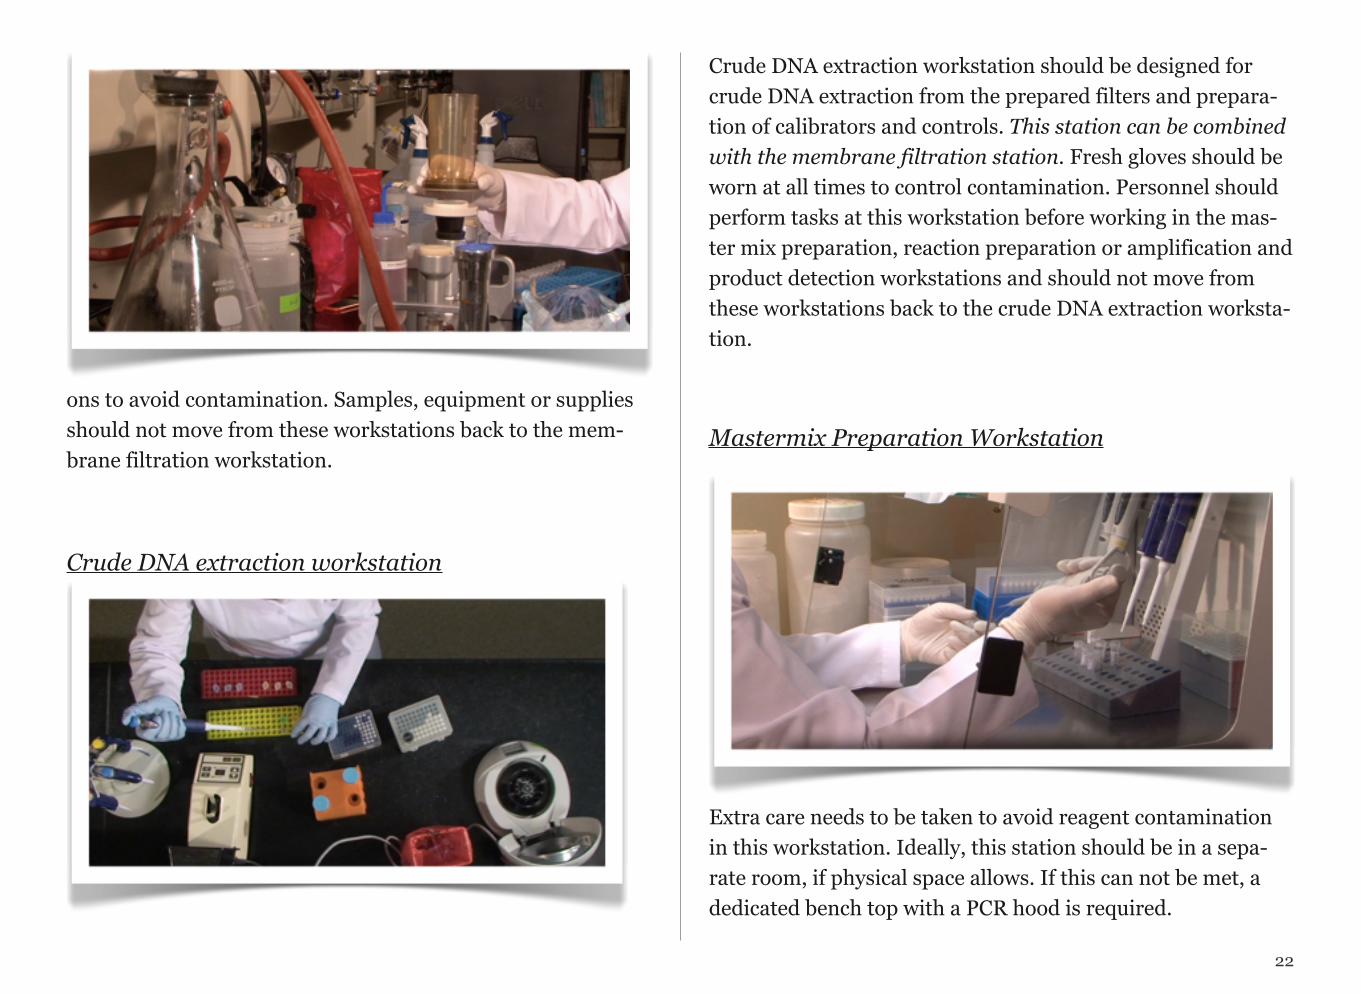
Crude DNA extraction workstation
Crude DNA extraction workstation should be designed for crude DNA extraction from the prepared filters and prepara-tion of calibrators and controls. This station can be combined with the membrane filtration station. Fresh gloves should be worn at all times to control contamination. Personnel should perform tasks at this workstation before working in the mas-ter mix preparation, reaction preparation or amplification and product detection workstations and should not move from these workstations back to the crude DNA extraction worksta-tion.
Mastermix Preparation Workstation
Extra care needs to be taken to avoid reagent contamination in this workstation. Ideally, this station should be in a sepa-rate room, if physical space allows. If this can not be met, a dedicated bench top with a PCR hood is required.
22
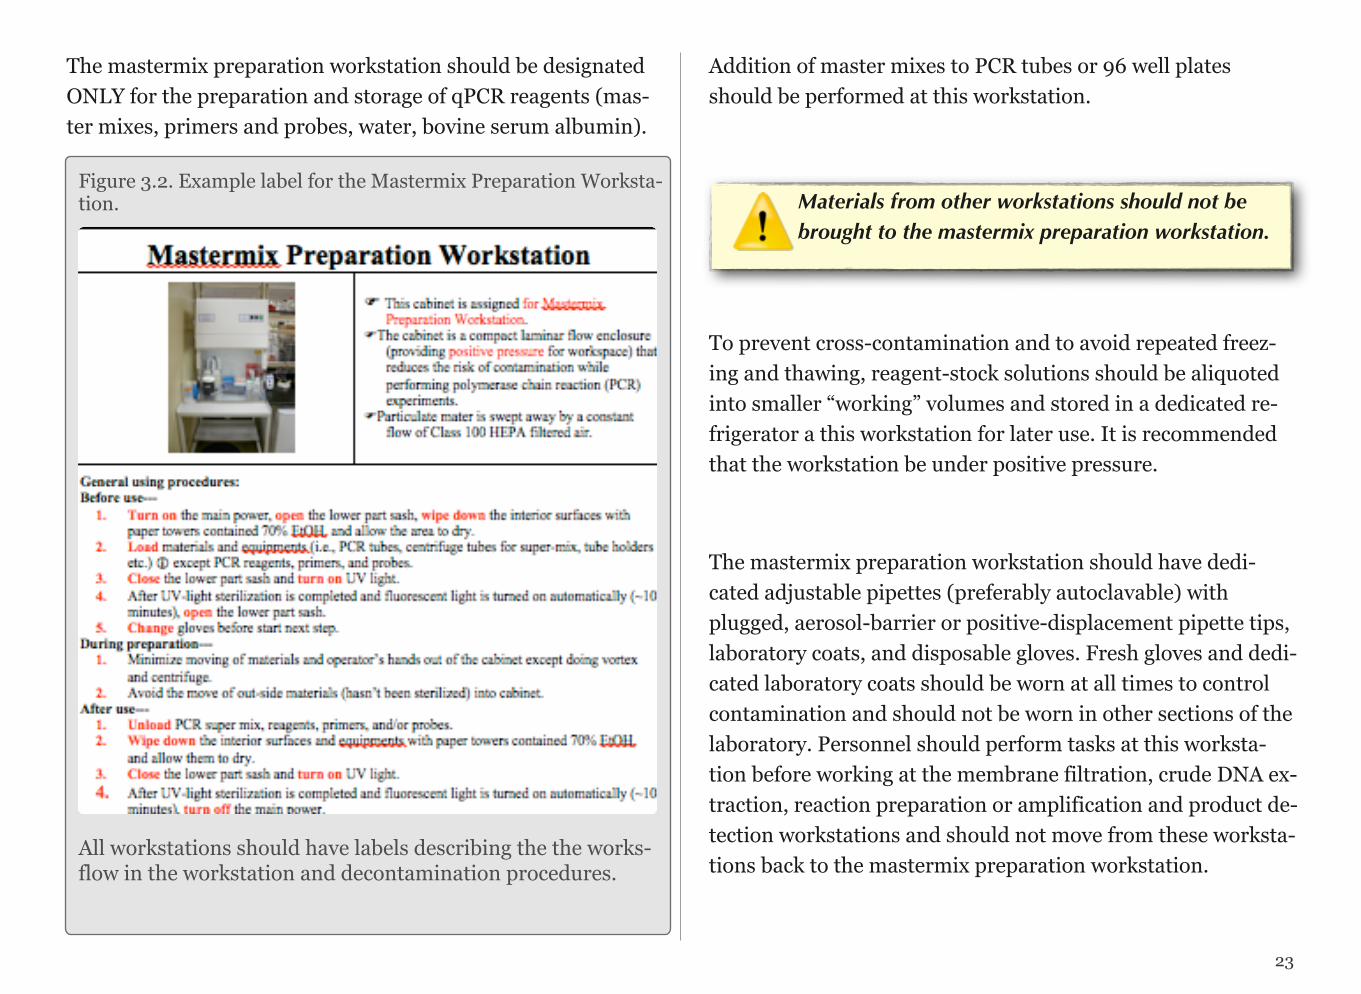
The mastermix preparation workstation should be designated ONLY for the preparation and storage of qPCR reagents (mas-ter mixes, primers and probes, water, bovine serum albumin).
Addition of master mixes to PCR tubes or 96 well plates should be performed at this workstation.
Materials from other workstations should not be brought to the mastermix preparation workstation.
To prevent cross-contamination and to avoid repeated freez-ing and thawing, reagent-stock solutions should be aliquoted into smaller “working” volumes and stored in a dedicated re-frigerator a this workstation for later use. It is recommended that the workstation be under positive pressure.
The mastermix preparation workstation should have dedi-cated adjustable pipettes (preferably autoclavable) with plugged, aerosol-barrier or positive-displacement pipette tips, laboratory coats, and disposable gloves. Fresh gloves and dedi-cated laboratory coats should be worn at all times to control contamination and should not be worn in other sections of the laboratory. Personnel should perform tasks at this worksta-tion before working at the membrane filtration, crude DNA ex-traction, reaction preparation or amplification and product de-tection workstations and should not move from these worksta-tions back to the mastermix preparation workstation.
23
All workstations should have labels describing the the works-flow in the workstation and decontamination procedures.
Figure 3.2. Example label for the Mastermix Preparation Worksta-tion.
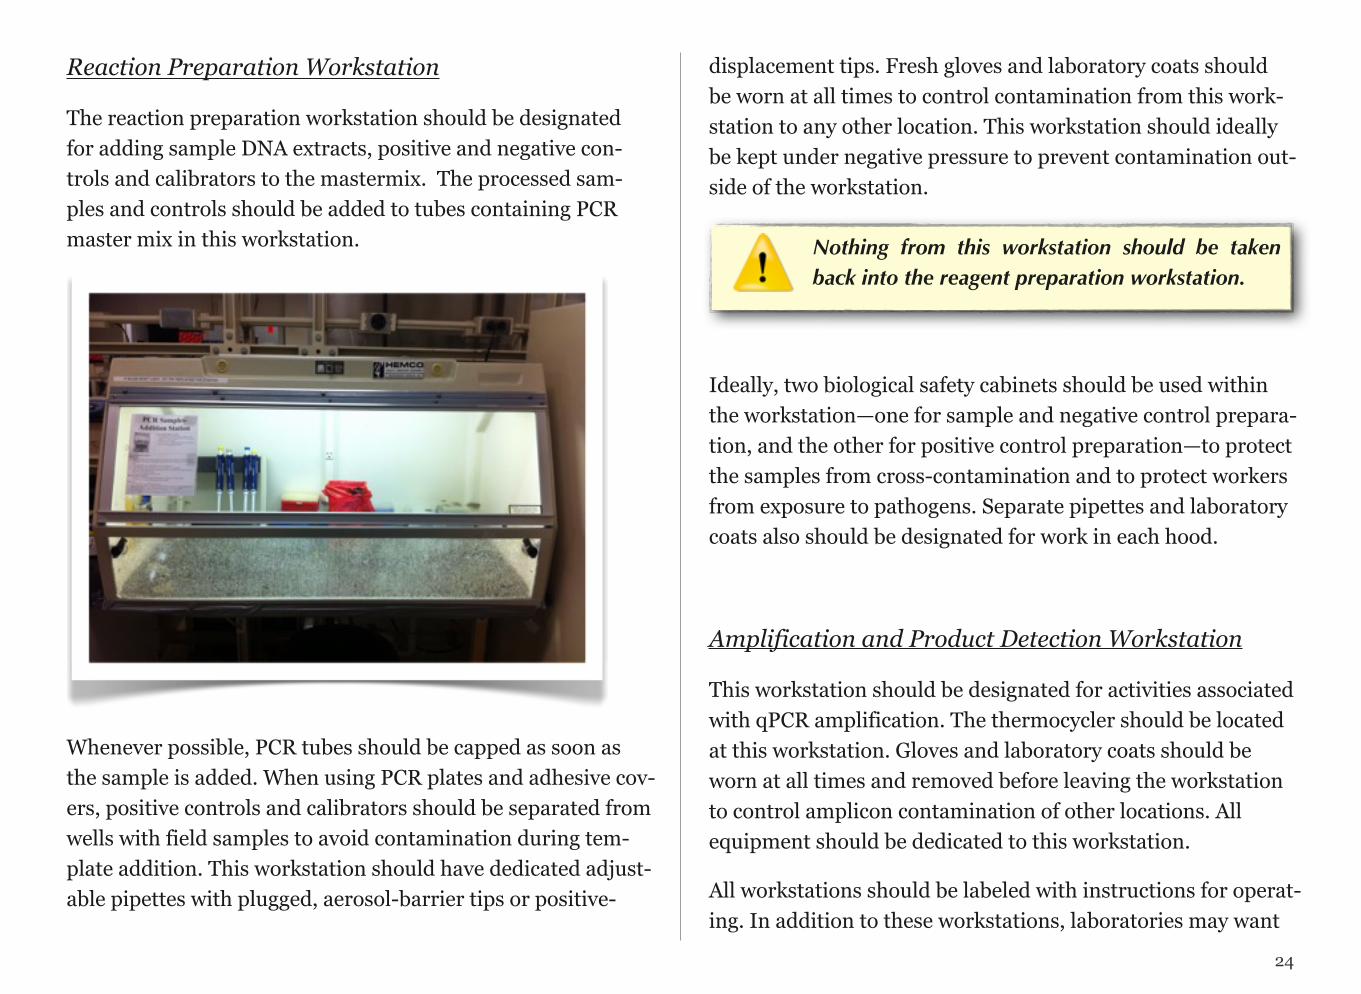
Reaction Preparation Workstation
The reaction preparation workstation should be designated for adding sample DNA extracts, positive and negative con-trols and calibrators to the mastermix. The processed sam-ples and controls should be added to tubes containing PCR master mix in this workstation.
Whenever possible, PCR tubes should be capped as soon as the sample is added. When using PCR plates and adhesive cov-ers, positive controls and calibrators should be separated from wells with field samples to avoid contamination during tem-plate addition. This workstation should have dedicated adjust-able pipettes with plugged, aerosol-barrier tips or positive-
displacement tips. Fresh gloves and laboratory coats should be worn at all times to control contamination from this work-station to any other location. This workstation should ideally be kept under negative pressure to prevent contamination out-side of the workstation.
Nothing from this workstation should be taken back into the reagent preparation workstation.
Ideally, two biological safety cabinets should be used within the workstation—one for sample and negative control prepara-tion, and the other for positive control preparation—to protect the samples from cross-contamination and to protect workers from exposure to pathogens. Separate pipettes and laboratory coats also should be designated for work in each hood.
Amplification and Product Detection Workstation
This workstation should be designated for activities associated with qPCR amplification. The thermocycler should be located at this workstation. Gloves and laboratory coats should be worn at all times and removed before leaving the workstation to control amplicon contamination of other locations. All equipment should be dedicated to this workstation.
All workstations should be labeled with instructions for operat-ing. In addition to these workstations, laboratories may want
24

to include a designated enclosed area or workstation for sam-ple receiving and storage. This workstation would contain re-frigerators for sample storage and should be isolated from any of the other areas. Personnel should not move from this work-station to the mastermix preparation workstation. A list of qPCR equipment and supplies organized by station is pro-vided in Chapter 4.
In the absence of a laminar flow hood or biological safety cabinet, protective dust masks or surgical masks may be worn to further reduce the risk of contamination of airborne nucleic acids from the analyst.
3.2. Instrument Selection, Calibration and StandardizationThere are many different models of qPCR instruments avail-able on the market. Depending on the user’s needs, several types of blocks are available which accept a variety of PCR re-action vessels (48-well plates, 96-well plates, 384-well plates, 384-microwell cards or 3072-through-hole plates).
Although there are several options, all qPCR instruments need to provide:
• An excitation source, which excites the fluorescent dyes,
• A detector to detect the fluorescent emissions (specifically FAM),
• And software for data collection and analysis.
The equipment used to perform qPCR methods should func-tion properly and generate reliable data. To verify that equip-ment is functioning properly, the laboratory should have a schedule for equipment maintenance. The schedule should in-clude the setup, calibration, repair, record keeping, and nor-mal operation of all equipment used in sample analysis, as stated in the SOP for each individual instrument or method. The results of all tests should be documented in an equipment logbook and/or electronic database. The logbook or database should be checked monthly by the QA/QC officer or the labora-
25
tory supervisor, and any problems and corrective actions noted.
As previously stated, equipment should be dedicated to a spe-cific laboratory workstation, and the instrument manuals from the manufacturer should be available.
Individual laboratories should decide which tests to perform to assess the functionality of the instruments and the fre-quency of calibration. Examples of PCR quality assurance measures are provided in the 2004 USEPA guidance docu-ment, “Quality Assurance/Quality Control Guidance for Labo-ratories Performing PCR Analyses on Environmental Sam-ples” Sections 2.4.1 through 2.4.11.
Calibration and Standardization of Instruments
• Check temperatures in incubators twice daily with a mini-mum of 4 hours between each reading to ensure operation within stated limits.
• Check thermometers at least annually against a “National In-stitute of Standards and Technology (NIST)” certified ther-mometer or one that meets the requirements of NIST Mono-graph SP 250-23. Check columns for breaks.
• The spectrophotometer should be calibrated each day of use using OD calibration standards. Follow manufacturer in-structions for calibration.
• Micropipettors should be calibrated at least annually and tested for accuracy on a weekly basis.
• Follow manufacturer’s instructions for all calibrations. It is recommended that thermocyclers be re-calibrated every 1-3 years.
3.3. Laboratory Quality Assurance and Quality ControlThe successful application of qPCR requires proper use of tech-niques and interpretation of results. This method can amplify small amounts of nucleic acid and therefore, it is essential to establish standardized quality assurance and quality control procedures.
QA/QC procedures are necessary because the ability of qPCR to produce many copies of target DNA creates the possibility of contamination by previously amplified products, which can lead to false-positive results. A good QC program will also de-tect false negatives resulting from inhibition or underestima-tion of the target.
Laboratories performing qPCR analyses on environmental samples should develop a written QA Management Plan that describes how the laboratory will conduct its day-to-day rou-tine operations in order to ensure accurate result reporting.
26
The main components of a QA Management Plan include: plans for personnel training, facility design, sampling forms, list of equipment, list of reagents and kits, handling and stor-age of reagents and kits, sample collection and processing pro-tocols, method sensitivity, precision and recovery records, documentation of controls, data reporting and plans for cor-rective action measures. The plan should further include pro-cedures for proficiency testing, data recording, data evalua-tion and the limitations of test results.
Quality control should include descriptions and procedures for positive and negative controls (method blank, filter blank, no template control, calibrator, salmon processing control), the development of calibration curves and the frequency they need to be performed. Inhibition must also be defined within the context of the method. For example, the US EPA defines inhibition a 3 cycle threshold difference between the calibrator-SPC pair and unknown-SPC pair. Also, acceptable levels of detection limits within the negative control (no-template control, NTC) must be determined:
• >35 CT in more than a single NTC
• <45 CT in a third of NTC reactions for a single mastermix
3.4. Personnel Training Personnel working in a laboratory performing qPCR analysis should have previous training in aseptic techniques and han-
dling of molecular reagents and equipment. Strict adherence to guidelines concerning personal protective equipment outer-wear is a must. In addition, method specific training is re-quired.
Personnel should use dedicated laboratory coats and powder-free gloves should be available in each workstation. Labora-tory coats should be removed and gloves discarded before leav-ing each workstation. Changing laboratory coats and gloves reduces the possibility of contamination with template (the nu-cleic acid from which the PCR is performed) or amplified nu-cleic acid.
Laboratory coats should be separated from non-laboratory clothing (i.e., laboratory coats should not to be taken home and washed with other clothes), and cleaned only with other laboratory coats that were in the same workstation.
Gloves should be changed after :
• working with seeded or environmental samples
• handling template or amplified nucleic acids
• contact of the outside of the gloves with skin or surfaces
27
CHAPTER 4
Preanalytical set up for Method 1611
In this chapter, we will focus on the prepa-rations prior to the analysis of enterococci in recreational waters using qPCR accord-ing to US EPA Method 1611.
CONTENTS
4.1. Equipment and Supplies for Each Workstation
4.2. Work Area Preparation
4.3. Preparing Cell Suspensions, Whole Cell Calibrators and Standard Curve
4.4. Preparing Controls
4.5. Quality Assurance and Quality Control Procedures for Reagents
4.6. Complete List of Reagents
Preanalytical Procedures 4.1. Equipment and Supplies for Each Workstation
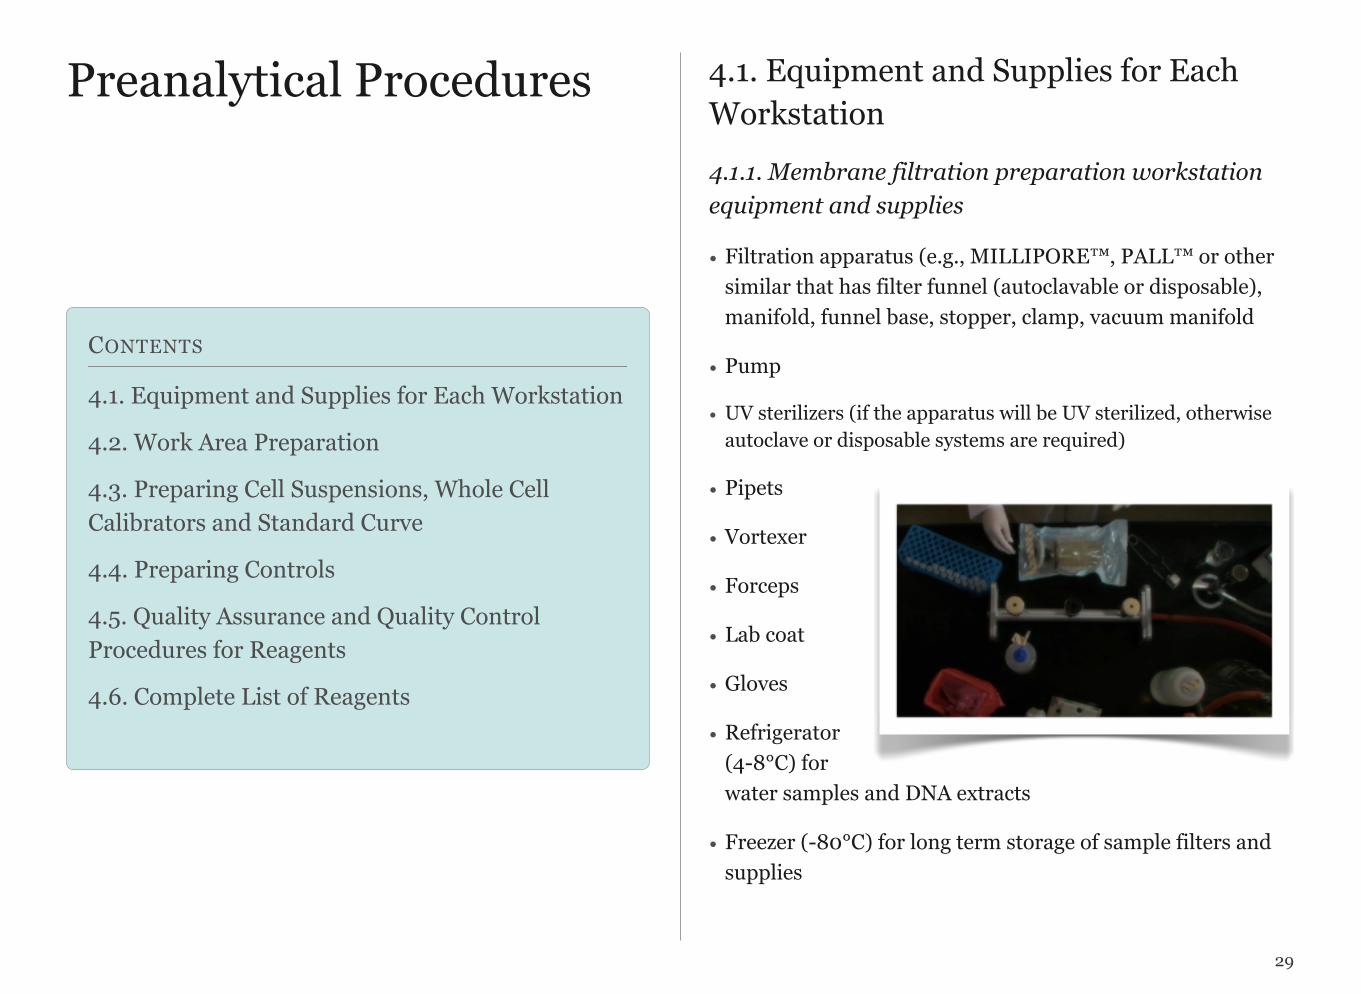
4.1.1. Membrane filtration preparation workstation equipment and supplies
• Filtration apparatus (e.g., MILLIPORE™, PALL™ or other similar that has filter funnel (autoclavable or disposable), manifold, funnel base, stopper, clamp, vacuum manifold
• Pump
• UV sterilizers (if the apparatus will be UV sterilized, otherwise autoclave or disposable systems are required)
• Pipets
• Vortexer
• Forceps
• Lab coat
• Gloves
• Refrigerator (4-8°C) for water samples and DNA extracts
• Freezer (-80°C) for long term storage of sample filters and supplies
29
• Polycarbonate membrane filters, sterile, white, 47mm diame-ter, with 0.45 µm pore size (e.g., GE Osmonics K04CP04700 or equivalent)
• Glass beads, acid washed, 213-300 µm (e.g., Sigma G-1277 or equivalent)
• Extraction tubes: Semi-conical, sterile, screw cap microcen-trifuge tubes w/ O-Ring cap, 2.0 ml (e.g., Phenix, SCS-020FS or equivalent)
• Balance capable of accuracy to 0.01 g
• PCR grade water –Sterile, nuclease-free water (e.g., EMD 9610 or equivalent)
• Permanent ink markers for labeling
• Test tube racks for microcentrifuge tubes
Tube preparation should be performed in advance of water sampling and DNA extraction procedures. The tubes with beads may be purchased premade.
Measure out 0.30 ±0.01g glass beads into needed number of extraction tubes. Seat the o-ring then back off one turn. Check the tube for proper O-ring seating . Autoclave 15 minutes at 121°C, 15 PSI.
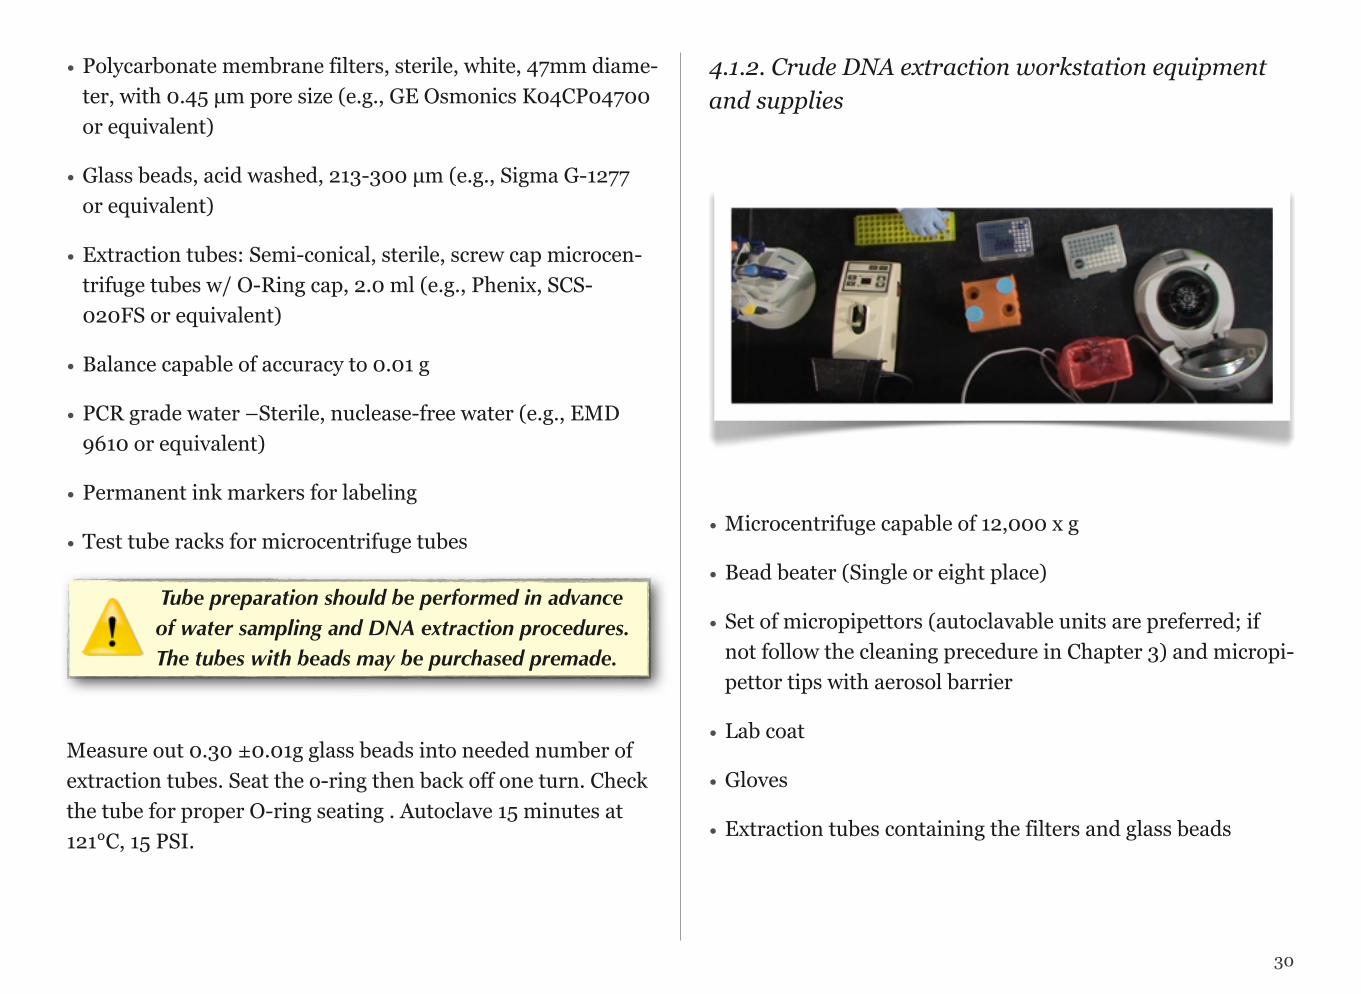
4.1.2. Crude DNA extraction workstation equipment and supplies
• Microcentrifuge capable of 12,000 x g
• Bead beater (Single or eight place)
• Set of micropipettors (autoclavable units are preferred; if not follow the cleaning precedure in Chapter 3) and micropi-pettor tips with aerosol barrier
• Lab coat
• Gloves
• Extraction tubes containing the filters and glass beads
30
4.1.3. Mastermix preparation workstation equipment and supplies
• Preferably HEPA-filtered laminar flow hood or PCR worksta-tion
• UV light source
• Set of micropipettors (autoclavable units are preferred; if not follow the cleaning precedure in Chapter 3) and micropi-pettor tips with aerosol barrier
• Refrigerator (4-8°C) dedicated only for master mix reagents
• Vortexer
• Microcentrifuge (2,000 x g)
• Lab coat
• Gloves
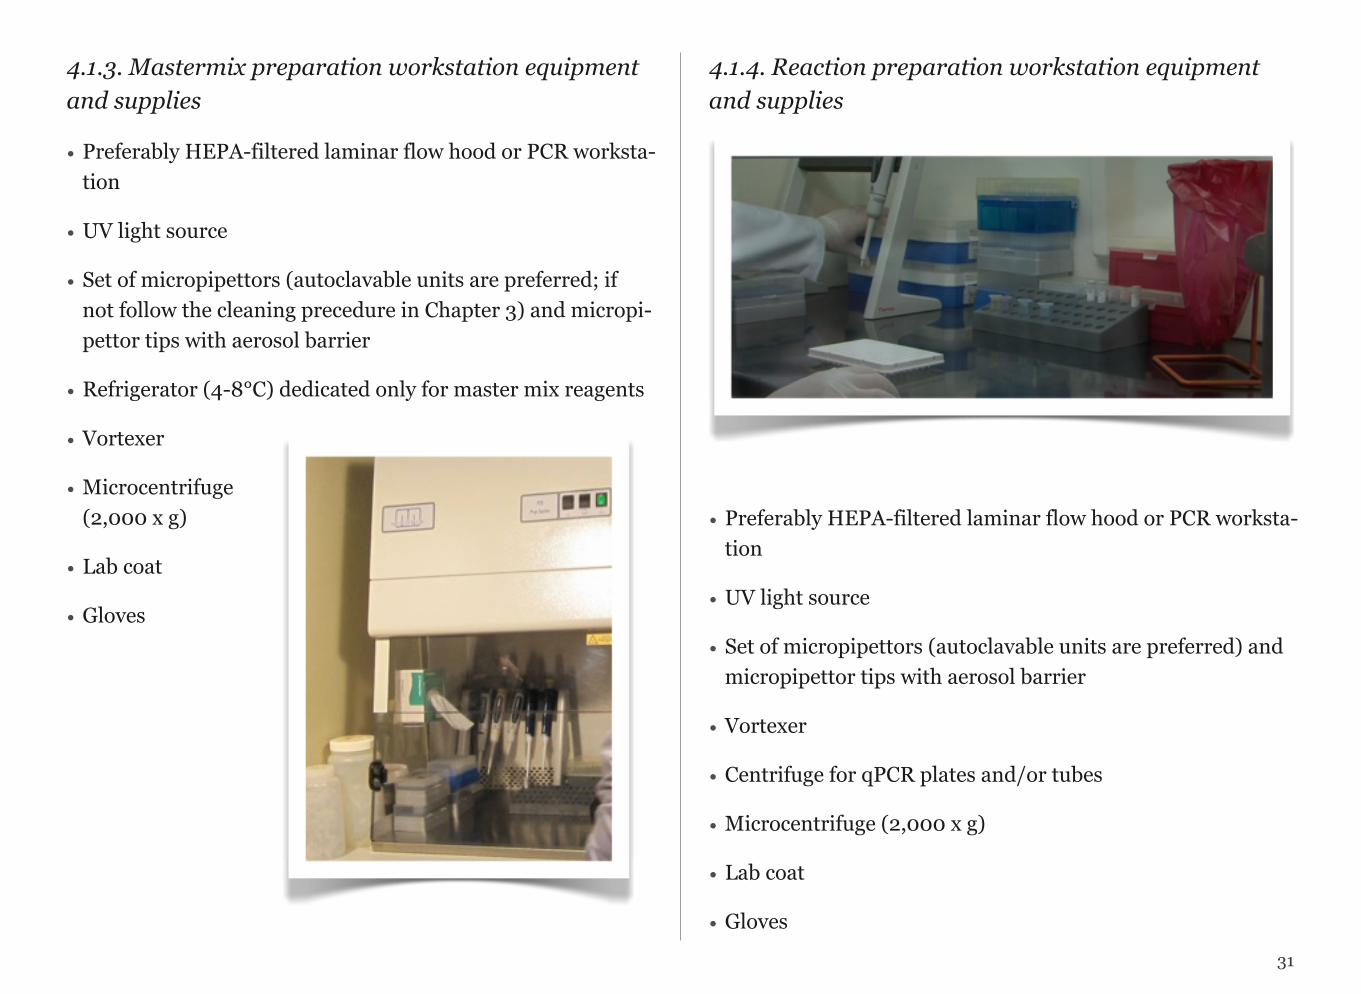
4.1.4. Reaction preparation workstation equipment and supplies
• Preferably HEPA-filtered laminar flow hood or PCR worksta-tion
• UV light source
• Set of micropipettors (autoclavable units are preferred) and micropipettor tips with aerosol barrier
• Vortexer
• Centrifuge for qPCR plates and/or tubes
• Microcentrifuge (2,000 x g)
• Lab coat
• Gloves
31
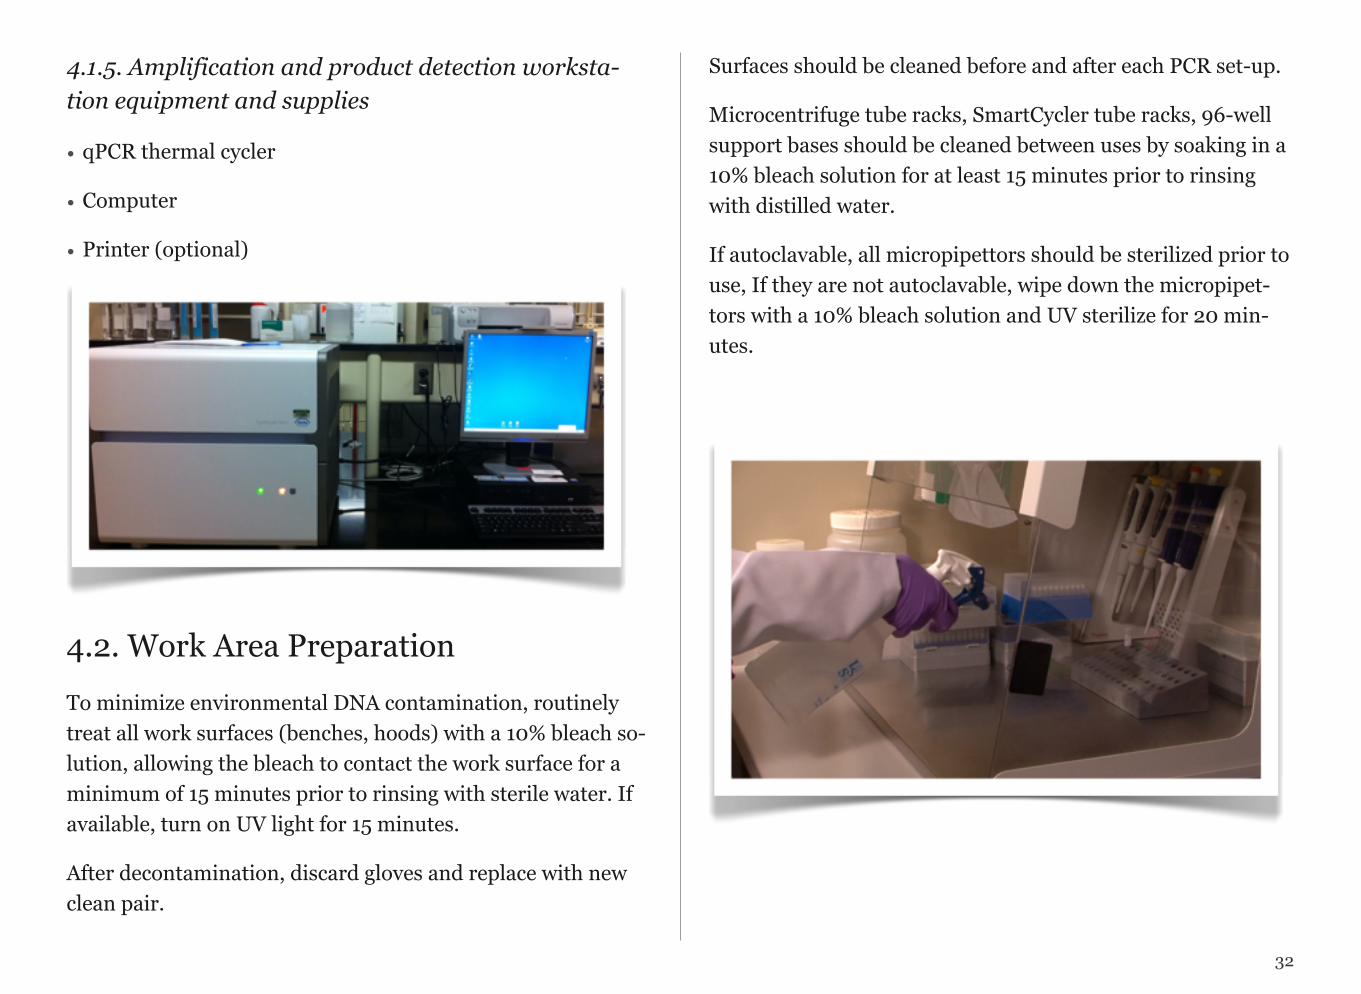
4.1.5. Amplification and product detection worksta-tion equipment and supplies
• qPCR thermal cycler
• Computer
• Printer (optional)
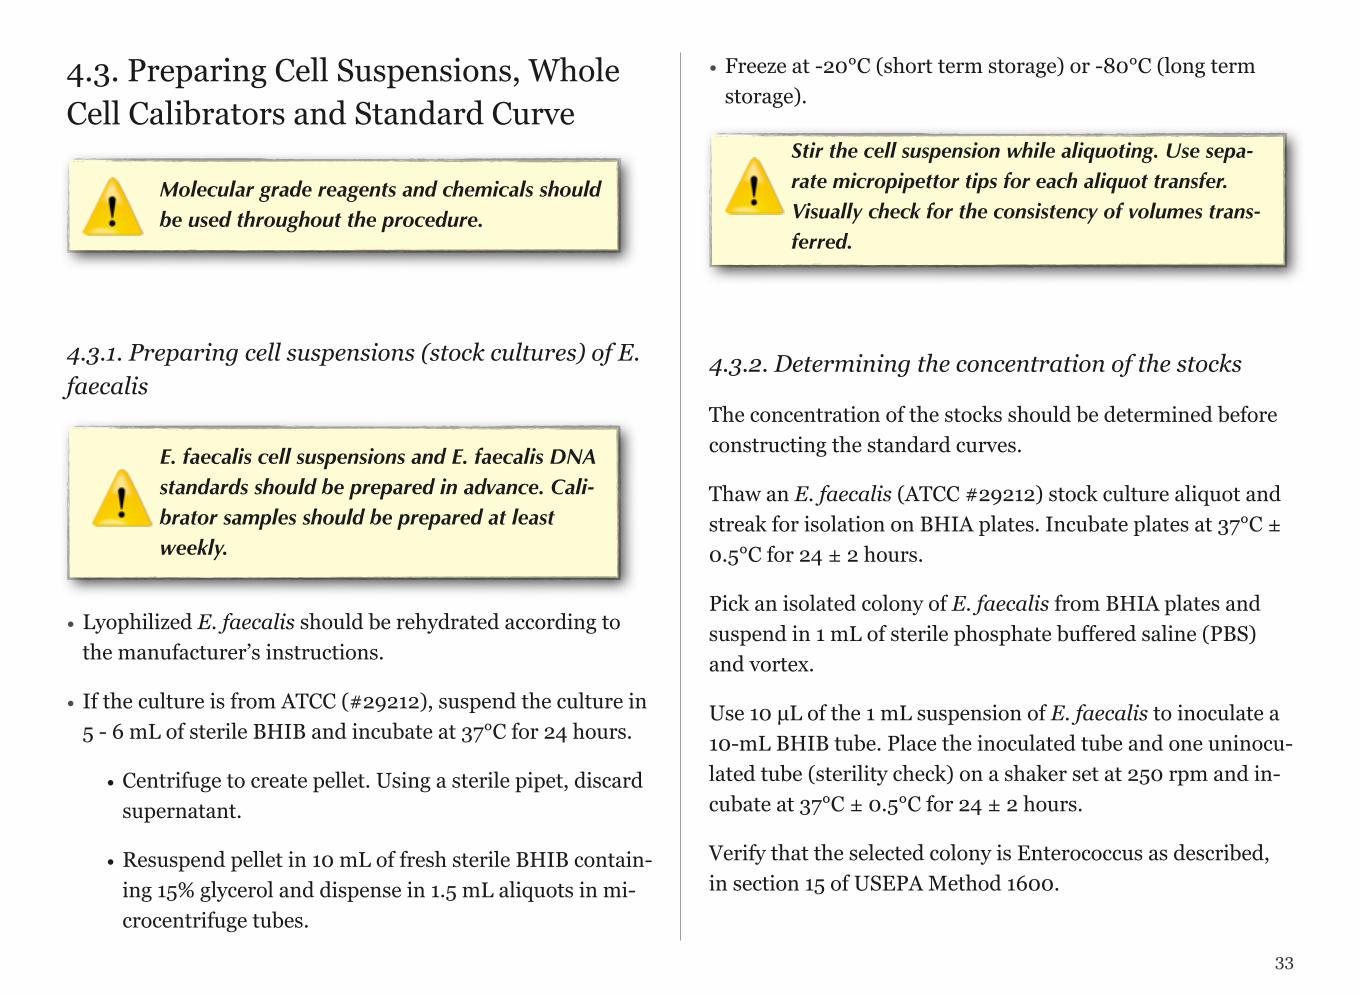
4.2. Work Area PreparationTo minimize environmental DNA contamination, routinely treat all work surfaces (benches, hoods) with a 10% bleach so-lution, allowing the bleach to contact the work surface for a minimum of 15 minutes prior to rinsing with sterile water. If available, turn on UV light for 15 minutes.
After decontamination, discard gloves and replace with new clean pair.
Surfaces should be cleaned before and after each PCR set-up.
Microcentrifuge tube racks, SmartCycler tube racks, 96-well support bases should be cleaned between uses by soaking in a 10% bleach solution for at least 15 minutes prior to rinsing with distilled water.
If autoclavable, all micropipettors should be sterilized prior to use, If they are not autoclavable, wipe down the micropipet-tors with a 10% bleach solution and UV sterilize for 20 min-utes.
32
4.3. Preparing Cell Suspensions, Whole Cell Calibrators and Standard Curve
Molecular grade reagents and chemicals should be used throughout the procedure.
4.3.1. Preparing cell suspensions (stock cultures) of E. faecalis
E. faecalis cell suspensions and E. faecalis DNA standards should be prepared in advance. Cali-brator samples should be prepared at least weekly.
• Lyophilized E. faecalis should be rehydrated according to the manufacturer’s instructions.
• If the culture is from ATCC (#29212), suspend the culture in 5 - 6 mL of sterile BHIB and incubate at 37°C for 24 hours.
• Centrifuge to create pellet. Using a sterile pipet, discard supernatant.
• Resuspend pellet in 10 mL of fresh sterile BHIB contain-ing 15% glycerol and dispense in 1.5 mL aliquots in mi-crocentrifuge tubes.
• Freeze at -20°C (short term storage) or -80°C (long term storage).
Stir the cell suspension while aliquoting. Use sepa-rate micropipettor tips for each aliquot transfer. Visually check for the consistency of volumes trans-ferred.
4.3.2. Determining the concentration of the stocks
The concentration of the stocks should be determined before constructing the standard curves.
Thaw an E. faecalis (ATCC #29212) stock culture aliquot and streak for isolation on BHIA plates. Incubate plates at 37°C ± 0.5°C for 24 ± 2 hours.
Pick an isolated colony of E. faecalis from BHIA plates and suspend in 1 mL of sterile phosphate buffered saline (PBS) and vortex.
Use 10 µL of the 1 mL suspension of E. faecalis to inoculate a 10-mL BHIB tube. Place the inoculated tube and one uninocu-lated tube (sterility check) on a shaker set at 250 rpm and in-cubate at 37°C ± 0.5°C for 24 ± 2 hours.
Verify that the selected colony is Enterococcus as described, in section 15 of USEPA Method 1600.
33

After incubation, centrifuge the BHIB containing E. faecalis for 5 minutes at 6000 × g.
Aspirate the supernatant and resuspend the cell pellet in 10 mL PBS.
Repeat the two previous steps twice and suspend final E. fae-calis pellet in 5 mL of sterile PBS. Label the tube as E. faecalis undiluted stock cell suspension, noting cell concentration af-ter determination with one of the following steps:
Determination of calibrator concentrations can be based on one of the four options below:
Option 1: Spectrophotometric absorbance
Remove three 0.1 mL aliquots of undiluted cell suspension and dilute each with 0.9 mL of PBS (10-1 dilution). Read absor-bance at 595 nm in spectrophotometer against PBS blank (readings should range from 0.05 to 0.3 OD). Calculate cells/mL (Y) in undiluted cell suspension using the formula from the standard curve shown below where X is the average 595 nm spectrophotometer reading.
Y = (1 x 10⁹ cells / mL × X) / 0.19
Option 2: Hemocytometer counts
Serially dilute 10 µL of undiluted cell suspension with PBS to 10-1, 10-2, and 10-3 dilutions and determine cell concentration of 10-2 or 10-3 dilutions in a hemocytometer or Petroff Hauser counting chamber under microscope.
Option 3: Plating
BHIA plates should be prepared in advance if this option is chosen. For enumeration of the E. faecalis undiluted cell sus-pension, dilute and inoculate according to the following. Note: BHIA plates should be made in advance if this option is cho-sen.
• Mix the E. faecalis undiluted cell suspension by vigor-ously shaking the 5-mL tube a minimum of 25 times. Use a sterile pipette to transfer 1.0 mL of the undiluted cell suspension to 99 mL of sterile PBS, cap, and mix by vigorously shaking the bottle a minimum of 25 times. This is cell suspension dilution “A”. A 1.0-mL volume of dilution “A” is 10-2 mL of the original undiluted cell sus-pension.
• Use a sterile pipette to transfer 11.0 mL of cell suspen-sion dilution “A” to 99 mL of sterile PBS, cap, and mix by vigorously shaking the bottle a minimum of 25 times. This is cell suspension dilution “B”. A 1.0-mL volume of
34

dilution “B” is 10-3 mL of the original undiluted cell sus-pension.
• Use a sterile pipette to transfer 11.0 mL of cell suspen-sion dilution “B” to 99 mL of sterile PBS, cap, and mix by vigorously shaking the bottle a minimum of 25 times. This is cell suspension dilution “C”. A 1.0-mL volume of dilution “C” is 10-4 mL of the original undiluted cell sus-pension.
• Use a sterile pipette to transfer 11.0 mL of cell suspen-sion dilution “C” to 99 ml of sterile PBS, cap, and mix by vigorously shaking the bottle a minimum of 25 times. This is cell suspension dilution “D”. A 1.0-mL volume of dilution “D” is 10-5 mL of the original undiluted cell sus-pension.
• Use a sterile pipette to transfer 11.0 mL of cell suspen-sion dilution “D” to 99 ml of sterile PBS, cap, and mix by vigorously shaking the bottle a minimum of 25 times. This is cell suspension dilution “E”. A 1.0-mL volume of dilution “E” is 10-6 mL of the original undiluted cell sus-pension.
• Prepare BHIA. Ensure that agar surface is dry. Each of the following will be conducted in triplicate, resulting in the evaluation of nine spread plates:
• Pipet 0.1 mL of dilution “C” onto surface of BHIA plate [10-5 mL (0.00001) of the original cell suspension].
• Pipet 0.1 mL of dilution “D” onto surface of BHIA plate [10-6 mL (0.000001) of the original cell suspension].
• Pipet 0.1 mL of dilution “E” onto surface of BHIA plate [10-7 mL of the original cell suspension].
For each spread plate, use a sterile bent glass rod or spreader to distribute inoculum over surface of medium by rotating the dish by hand or on a rotating turntable. Allow inoculum to ab-sorb into the medium completely.
Invert plates and incubate at 35°C ± 0.5°C for 24 ± 4 hours.
Count and record number of colonies per plate. Refer to the equation below for calculation of undiluted cell suspension concentration.
Where:
CFU/mLundiluted = E. faecalis CFU/mL in undiluted cell suspen-sion
CFU = number of colony forming units from BHIA plates yielding counts within the ideal range of 30 to 300 CFU per plate
35
V = volume of undiluted sample in each BHIA plate yielding counts within the ideal range of 30 to 300 CFU per plate
n = number of plates with counts within the ideal range
Option 4: Another option is to quantify Enterococci by using IDEXX Enterolert/Quanti-Tray®/2000 for detection of the stock concentration. Making serial dilutions to achieve a countable plate is needed.
• For example if your stating concentration is 100000 E. feacalis, then your dilutions would be 1/100 (1 ml of your stock diluted to 100 ml of sterile phosphate buffer solution) to ensure that the count is below 2419 MPN/100 ml (highest number of bacteria that can be detected by this method).
4.3.3. Storage of the standards
Divide remainder of undiluted cell suspension (approximately 5 mL) into 6 x 0.5 mL aliquots for DNA standard preparations and 100-200 x 0.01 mL (10 µL) aliquots for calibrator samples and freeze at -20°C.
The DNA standards should be stored and proc-essed in a different area of the laboratory than that used for routine sample processing to avoid contamination.
Once you have the stock cell suspension of your target DNA, now you can prepare the standard curves. There will be two types of standard curves:
I. Genomic DNA standard curve
II. Whole cell calibrator curve
Now, we will focus on each of these curves.
4.3.4. Preparation of E. faecalis genomic DNA stan-dards
1. Remove two 0.5 ml E. coli cell suspensions from freezer and thaw completely.
2. Transfer cell suspensions to extraction tubes with glass beads.
3. Tightly close the tubes, making sure that the O-rings are seated properly.
4. Place the tubes in bead beater and shake for 60 seconds at the maximum rate (5000 rpm).
5. Remove the tubes from the mini bead beater and centrifuge at 12,000 × g for one minute to pellet the glass beads and debris.
6. Using a 200 µL micropipettor, transfer 350 µL of the super-natants to sterile 1.7 mL microcentrifuge tubes. Recover su-
36
pernatants without disrupting the glass beads at the tube bottom.
7. Centrifuge crude supernatants at 12,000 × g for 5 minutes and transfer 300 µL of clarified supernatant to clean, la-beled 1.7 mL low retention microcentrifuge tubes, taking care not to disturb the pellet.
8. Add 1 µL of 5 µg/µL RNase A solution to each clarified su-pernatant, mix by vortexing and incubate at 37°C for 1 hour.
9. Add 0.6 mL of binding buffer solution from a DNA-EZ puri-fication kit to each of the RNase A-treated extracts and mix by vortexing. Note: In general, a minimum concentration of 5 × 10⁸ cells is required for this step.
If DNA-EZ purification kit will not be used, steps 9-15 should be replaced by the manufacturer’s in-structions of the kit that is going to be used. Once DNA is purified, continue from step 16.
10.Insert one DNAsureTM column from the DNA-EZ purifica-tion kit into a collection tube (provided with kit) for each of the two extracts. Transfer the extract and binding buffer mixtures from to a DNAsureTM column and collection tube assembly and centrifuge for 1 minute at 12,000 × g.
11.Transfer each of the DNAsureTM columns to new collection tubes. Discard previous collection tubes and collected liq-uid.
12.Add 500 µL EZ-Wash Buffer from the DNA-EZ purification kit to each of the DNAsureTM columns and centrifuge at 12,000 × g for 1 minute. Discard the liquid in the collection tube.
13.Repeat Step 12.
14.Transfer each of the DNAsureTM columns to a clean, la-beled 1.7 mL low retention microcentrifuge tube and add 50 µL of DNA elution buffer to each column. Centrifuge for 30 seconds at 12,000 × g. Repeat this procedure again to ob-tain a total DNA eluate volume of ~100 µL from each col-umn.
15.Pool the two eluates to make a total volume of approxi-mately 200 µL.
16.Transfer the entire purified DNA eluate volume from each column to a clean and sterile microcuvette for UV spectro-photometer and read absorbance at 260 and 280 nM.
16.1.The cuvette should be blanked with DNA elution buffer before reading sample). If necessary, the sam-ple may be diluted with elution buffer to reach the minimum volume that can be accurately read by the spectrophotometer (see manufacturer’s recommenda-tion), however, this may reduce the DNA concentra-tion to a level that cannot be accurately read by the spectrophotometer. If available, readings can be taken of 2 µL aliquots of the sample with a Nano-DropTM Spectrophotometer.
37
17.Record UV spectrophotometer (e.g. NanoDrop) results.
18.Calculate total DNA concentration in sample by formula: OD260 reading × 50 ng/µL DNA/OD260
19.Transfer sample back to labeled 1.7 mL non-retentive mi-crocentrifuge tube and store at -20°C.
Sample is acceptable as a standard if ratio of OD260/OD280 readings is > to 1.75
20.Using total DNA concentration, calculate E. faecalis PCR target sequence concentration (TSC) in purified extract.
Example:
• OD260 reading= 0.07271
• Calculate total DNA concentration using the formula OD260 reading x 50 (concentration of the DNA)
0.07271 x 50 ng/µL=36.36 ng/µL
• Convert the units to fg/µL by multiplying by 106:
36.36 x 10⁶ fg/µL=3.636 x 107 fg/µL
• Multiply by 4 to get the gene copies per µL (4 is the aver-age number of lsrRNA gene copies in a E. faecalis cell)
3.636 x 10⁷ fg/µL x4=4.04 x 10⁷ gene copies/µl
21.Record UV spectrophotometer results and all calculations.
22.In appropriately labeled 1.7 mL low retention microcentri-fuge tubes, perform serial dilutions using AE buffer to pre-pare DNA standards of 100, 200, 400, 4000, and 40000 TSC/5 µL dilutions.
• Perform 10-fold serial dilutions of the x 107 gene copies/ /5 µL stock (10 µL : 90 µL) with AE buffer to achieve
• 4 × 10⁶ TSC/5 µL,
• 4 × 10⁵ TSC/5 µL,
• 4 × 10⁴ TSC/5 µL,
• 4 × 10³ TSC/5 µL,
• 4 × 10² TSC/5 µL.
• Perform 50-fold dilution of 4 × 10² TSC/5 µL. stock (250 µL : 250 µL) with AE buffer to achieve 2 × 10² TSC/5 µL
• Perform 50-fold dilution of 2 × 10² TSC/5 µL. stock (250 µL : 250 µL) with AE buffer to achieve 1 × 10² TSC/5 µL
23.Aliquots of each of these dilutions should be stored at 4oC in low retention microcentrifuge tubes and can be reused for repeated qPCR analyses. For long term storage, freeze aliquots at - 20°C or -80°C .
38
This procedure should be performed at a different time than the preparation of genomic DNA stan-dards.
This procedure also should be performed at a differ-ent station than membrane filtration workstation to prevent contamination of samples and controls.
24.Generate genomic DNA standard curves using the 100, 200, 400, 4000, and 40000 TSC/5 µL dilutions (3 repli-cates each), as appropriate.
4.3.5. Preparing whole cell calibrators
The preparation of standard curves from whole cell calibra-tors is an important part of QC because the unknown sample results will be calculated from these values. The whole cell cali-brators are made from the same stock cell suspension that was created from the genomic DNA (as described in the previ-ous section).
Preparation of the whole cell calibrator filters
1. Determine the volume of Enterococci calibrator cell sus-pension needed (using CFU/ml obtained from of methods above) to prepare to dilute the cell suspension to a volume that contains 100,000 cells per 10ml in 1L.
• Volume 1xConcentration 1 = Volume 2xConcentration 2
• For example, if the Enterococci stock concentration de-termined using one of the options in Section 4.3.2. was found as 2.63x10⁶ cells/100 ml, then:
X(2.63x10⁶ cells/100ml)=1000 ml (100,000/10ml)
X=380.2 ml cell suspension
2. Add the calculated volume of Enterococcus calibrator cell suspension in to required volume of PBS.
• In this example, 380.2 ml cell suspension should be di-luted in 619.8 ml Phosphate Buffer Solution (PBS) to get reach to 100,000 cells in 1L.
• If the volume is exceedingly small, consider diluting by 10-fold and remeasuring on the spectrophotometer. Mix well by inverting 25 times. Place a stir bar in con-tainer and place on a magnetic stirrer.
3. Set up the membrane filtration system.
4. Pipette 10ml of the 100,000 cfu/10 ml cell suspension (as prepared in 2) onto the filter. Start the filtration system. After filtering, rinse the sides of the funnel at least twice with 20 - 30 mL of sterile PBS. Turn off the vacuum and remove the funnel from the filter base.
5. Label an extraction tube containing glass beads with 100,000 CFU standard, date, and technician initials. On the filtration unit base, fold the filter with the sample side facing inward, being careful to handle the filter only on
39
the edges, where the filter has not been exposed to the sample. Insert the folded filter (see Figure 6.1. and the training video) into the labeled extraction tube with glass beads.
6. Cap the extraction tube. Immediately place on dry ice or place in -80°C freezer. Store at -80°C until use.
7. Repeat the process (1-6) until approximately 100ml re-mains in bottle.
8. With this last 100 ml, perform one of the verification proc-esses (Sections 4.3.2) to determine exact cell number on the filter standard.
Preparation of the whole cell calibrator standards:
1. Remove one tube of Enterococci 100,000 CFU standard fil-ter (prepared as described above) from the freezer.
The 100,000 CFU standard needs to be extracted and PCR analysis performed at least once weekly to check the performance characteristics of the instrument and reagents.
2. Follow DNA Crude Extraction protocol in Chapter 6.
3. Prepare serial dilutions of calibrator standard:
a) Prepare tubes for standard curve by adding 90 µL of AE buffer to 3 clean low retention microcentrifuge tubes and label-ing 10,000; 1,000; and 100 CFU/100 ml.
b) Vortex 100,000 CFU/100ml standard. Briefly microcen-trifuge. Pipette 10µL of 100,000 CFU/100 ml standard into tube labeled 10, 000 CFU/100 ml and containing 90 µL AE buffer. Vortex. Briefly microcentrifuge. This will be your 10,000 CFU/100 ml standard.
c) Vortex 10,000 CFU/100 ml standard. Briefly micro cen-trifuge. Pipette 10µL of 10,000 CFU/100 ml standard into tube labeled 1,000 CFU/100 ml and containing 90 µL AE buffer. Vortex. Briefly microcentrifuge. This will be your 1,000 CFU/100 ml standard.
d) Vortex 1,000 CFU/100 ml standard. Briefly micro centri-fuge. Pipette 10µL of 1,000 CFU/100 ml standard into tube la-beled 100 CFU and containing 90 µL AE buffer. Vortex. Briefly microcentrifuge. This will be your 100 CFU/100 ml standard.
4.3.6. Generation of standard curve
The DNA standard curve is prepared using a serial dilution of purified, RNA-free and spectrophotometrically quantified E. faecalis genomic DNA or whole cell calibrator extracts. When constructing the standard curve, qPCR analyses of the diluted
40

standards should be performed at least three separate times in duplicate.
• Prepare enough E. faecalis assay qPCR Master Mix for 10 re-actions.
• genomic DNA or whole cell calibrators are run in dupli-cate (4x2=8),
• NTC (1) and 1 extra reaction.
• Set up and run qPCR as outlined in Chapter 6.
• After completion of qPCR standard curve run, import the data into MS Office Excel. Organize data in two columns rep-resenting an x-axis and y-axis. The x-axis column should contain the log calibrator cells per standard. The y-axis col-umn should contain the cycle threshold (Ct) values obtained for each standard by running qPCR.
• Calculate average cycle threshold for each standard by MS Excel as described below:
• Select the cells in excel containing the standard curve data (Log calibrator cells and Average Ct) by left clicking and dragging mouse across those cells.
• Click Insert in the top menu, then in the Charts menu select Scatter, and then select Scatter with only Markers
• Right click on any one of the four points on the chart, in the menu that opens up select Add Trendline
• In the Trendline Options menu select Display Equation on chart and Display R-squared value on chart, click Close.
The slope value of generated standard curve results is for cal-culation of qPCR amplification efficiency (AE %).
Multiple qPCR analyses of these standards are used to gener-ate a composite master standard curve. The master standard curve will be subjected to linear regression analysis; values generated from that analysis will be used to establish qPCR as-say performance. An acceptable standard curve should have;
R2 ≥ 0.99
-3.67≤ Slope ≤-3.1
% Amplification efficiency = 87-110%
See chapter 7 for further information on data assessment.
41
4.3.7. Quality Assurance and Quality Control for Stan-dards and Calibrators
If the slope value from a subsequent standard curve regres-sion is outside of the acceptance range, the diluted standards should be re-analyzed. Other conditions for repeating the stan-dard curve and calibrators:
If the positive control (calibrators) fails to exhibit the appropri-ate fluorescence growth curve response, check and/or replace the associated reagents, and reanalyze. If positive controls still fail to exhibit the appropriate fluorescence growth curve re-sponse, prepare new calibrator samples and reanalyze.
If this difference persists, new working stocks of the reagents should be prepared and the same procedure repeated.
If the differences still persist, the amplification factor values used for calculations of target cell numbers should be modi-fied based on the new slope values.
If the slopes are within acceptance range but Y-intercepts are not within acceptance range of this previous average, new se-rial dilutions of the DNA standard should be prepared and analyzed as described in Section 4.3.5.
Additional standard curves should be generated with each new lot of TaqMan® master mix reagents or primers and probes.
4.4. Preparing Controls
4.4.1. Salmon DNA Sample Processing Control (SPC) (Non-target DNA Control)
The SPC is used as a DNA extraction efficiency and inhibition control. SPC is a known concentration of a non-target DNA added to each control or unknown sample to determine extrac-tion efficiency and inhibition potential.
Preparation of SPC
• Place the 20 mg of Salmon DNA (Sigma D1626) in a sterile container.
• Add 500 mL of PCR-grade water.
• Cap tightly, mix on a stirrer with a stirrer bar to resuspend overnight in room temperature or place in a 50°C oven for several hours.
• Salmon sperm will be extremely viscous upon initial re-suspension.
• Measure the absorbance at 260 nm (A260) and calculate the concentration from formula:
DNA Concentration = A260 x 50 µg/ml
An OD260 of 1 is approximately equal to 50 µg/mL.
• Record the DNA concentration and label this volume as the “Salmon DNA Laboratory Stock”. If the concentration is an
42
odd number, it may be useful to dilute the laboratory stock to a concentration that is more convenient (i.e. if your calcu-lated concentration was 1,400 µg/ml dilute this to 1,000 µg/ml). Several dilutions will be required to reach the desired concentration of 50 µg/mL. Measure the OD of the 50 µg/mL solution and adjust if necessary using the formula:
Molarity1/Volume1 = Molarity2/Volume2
• Once the Salmon DNA Laboratory Stock concentration is 50 µg/mL, a working stock solution can be prepared by adding 10 ml of the Salmon DNA laboratory stock to 40 ml of AE buffer. The concentration of the working stock solution will be 10 µg/ml.
• Dispense the 50 µg/mL Salmon DNA laboratory stock and 10 µg/mL working stock suspensions into aliquots (e.g. 1 ml) and freeze at -20°C.
Salmon DNA Extraction Buffer Preparation
• Dilute the working stock with AE buffer to make 0.2 µg/mL Salmon DNA extraction buffer.
M1/V1 = M2/V2
(10 µg/ml)/ (50 ml) = (0.2 µg/ml)/X ml
X = (10/50)/0.2 = 1 ml
• Add 1 ml of 10 µg/mL to 49 ml of AE Buffer.
• Extraction buffer may be prepared in advance and stored at 4°C for a maximum of 1 week.
Determine the total volume of Salmon DNA/extraction buffer required for each day or week by multiplying volume (600 µL) × total number of samples to be analyzed including controls, water samples, and calibrator samples.
• For example, for 18 samples, prepare enough Salmon/DNA extraction buffer for 24 extraction tubes (18÷6 = 3, therefore, 3 extra tubes for water sample filtration blanks (method blanks) and 3 extra tubes for calibrator samples). Note that the number of samples is divided by 6 because you should conduct one method blank for every 6 samples analyzed. Additionally, prepare excess volume to allow for accurate dispensing of 600 µL per tube, generally 1 extra tube.
• Thus, in this example, prepare sufficient Salmon/DNA extraction buffer for 24 tubes plus one extra. The total volume needed is 600 µL × 25 tubes = 15,000 µL. Dilute the Salmon testes DNA working stock 1:50, for a total volume needed (15,000 µL)÷ 50 = 300 µL of 10µg/mL Salmon testes DNA working stock.
• The AE buffer needed is the difference between the total volume and the Salmon testes DNA working stock. For this example, 15,000 µL - 300 µL = 14,700 µL AE buffer needed.
43
Quality Assurance and Quality Control for SPC
While not essential, it is good practice to routinely prepare and analyze standard curves from serial dilutions of Salmon DNA working stocks in a manner similar to that described for the Enterococcus gDNA standard curves. rRNA gene operon copy numbers per genome have not been reported in the litera-ture for the salmon species, therefore log-transformed total DNA concentration values or the dilution factor values can be substituted for target sequence copy numbers on the x-axis val-ues in these plots and regression analyses.
Each test sample’s 5 fold dilution should be within 3 Ct units of the mean of the 5 fold diluted calibrator (and/or method blank) sample results.
Higher CT values may indicate significant PCR inhibition or poor DNA recovery possibly due to physical, chemical, or enzy-matic degradation. Repeat the Enterococcus and Salmon DNA PCR assays of any samples whose 5 fold dilution exhibits a Salmon DNA PCR assay CT value greater than 3 CT units higher than the mean of the calibrator sample results using a 5 fold higher dilution (net dilution: 25 fold) of the extracts.
The Enterococcus PCR result from assaying the original 5-fold dilution of the sample can be accepted if its Salmon DNA as-say CT value is lower than that of the corresponding 25 fold dilution of the sample. This pattern of results is indicative of poor recovery of total DNA in the extract rather than PCR inhi-bition. The poor DNA recovery is compensated for by the cal-culation method.
Contrarily, if the Salmon PCR assay CT value of the 25-fold di-lution of the sample is lower than that of the 5 fold dilution of the sample, then the Enterococcus PCR assay result from the 25 fold dilution of the sample is considered more accurate.
However, the Enterococcus PCR results should be reported as questionable if the Salmon DNA assay’s result is still not within 3 CT units of the mean CT result of the 25 fold dilution of the three calibrators.
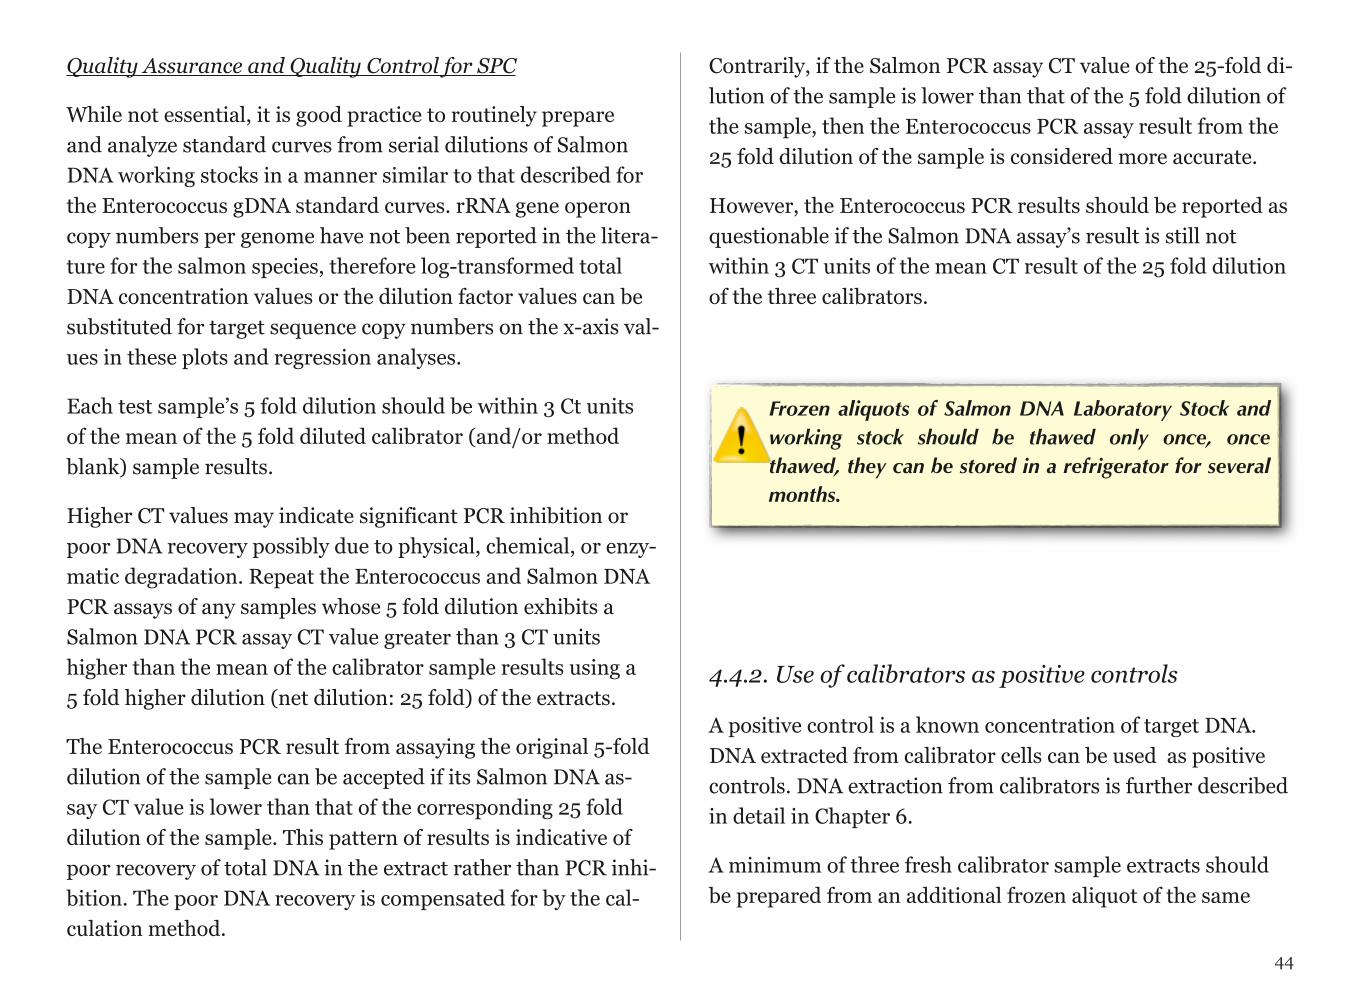
Frozen aliquots of Salmon DNA Laboratory Stock and working stock should be thawed only once, once thawed, they can be stored in a refrigerator for several months.
4.4.2. Use of calibrators as positive controls
A positive control is a known concentration of target DNA. DNA extracted from calibrator cells can be used as positive controls. DNA extraction from calibrators is further described in detail in Chapter 6.
A minimum of three fresh calibrator sample extracts should be prepared from an additional frozen aliquot of the same
44
stock cell suspension at least weekly and preferably daily be-fore analyses of each batch of test samples.
The average Ct value from these analyses should not be signifi-cantly different from the laboratory's average values from analyses of the initial calibrator sample extracts from the same stock cell suspension (i.e., not greater than three stan-dard deviations).
If these results are not within this acceptance range, new cali-brator extracts should be prepared from another frozen ali-quot of the same stock cell suspension and analyzed in the same manner as described Chapter 6. If the results are still not within the acceptance range, the reagents should be checked by the generation of a new standard curve.
4.4.3. Method Blank
The laboratory should analyze “Method Blanks” (MB) to en-sure there was no contamination during sample processing steps (sample filtration and DNA extraction steps). During the analysis, prepare one method blank filter for every six sam-ples or once a day depending on the load of the laboratory. The preparation of the method blank is described in Chapter 6.
4.4.4. Filter Blank
Although EPA does not recommend, it is a value to include a negative control in each run to check for the integrity of the analysis. Therefore, it is suggested that the laboratory should analyze a filter blank to ensure the integrity of the DNA extrac-tion and the downstream processes. These blanks can be pre-pared ahead of time and be kept frozen and used during each run. The procedure is basically, a filter is added into the extrac-tion tube and treated as a sample during the crude DNA ex-traction process. This blank will show the problems starting from extraction.
4.4.5. No Template Control
A No-Template Control (NTC), is a negative control that con-tains only the master mix and molecular grade water.
This control should be included, in duplicate, with every run. If any of the NTC replicates amplify, it means that there is a contamination and the entire qPCR analysis must be repeated (Please see Table 2.1. in Chapter 2).
45
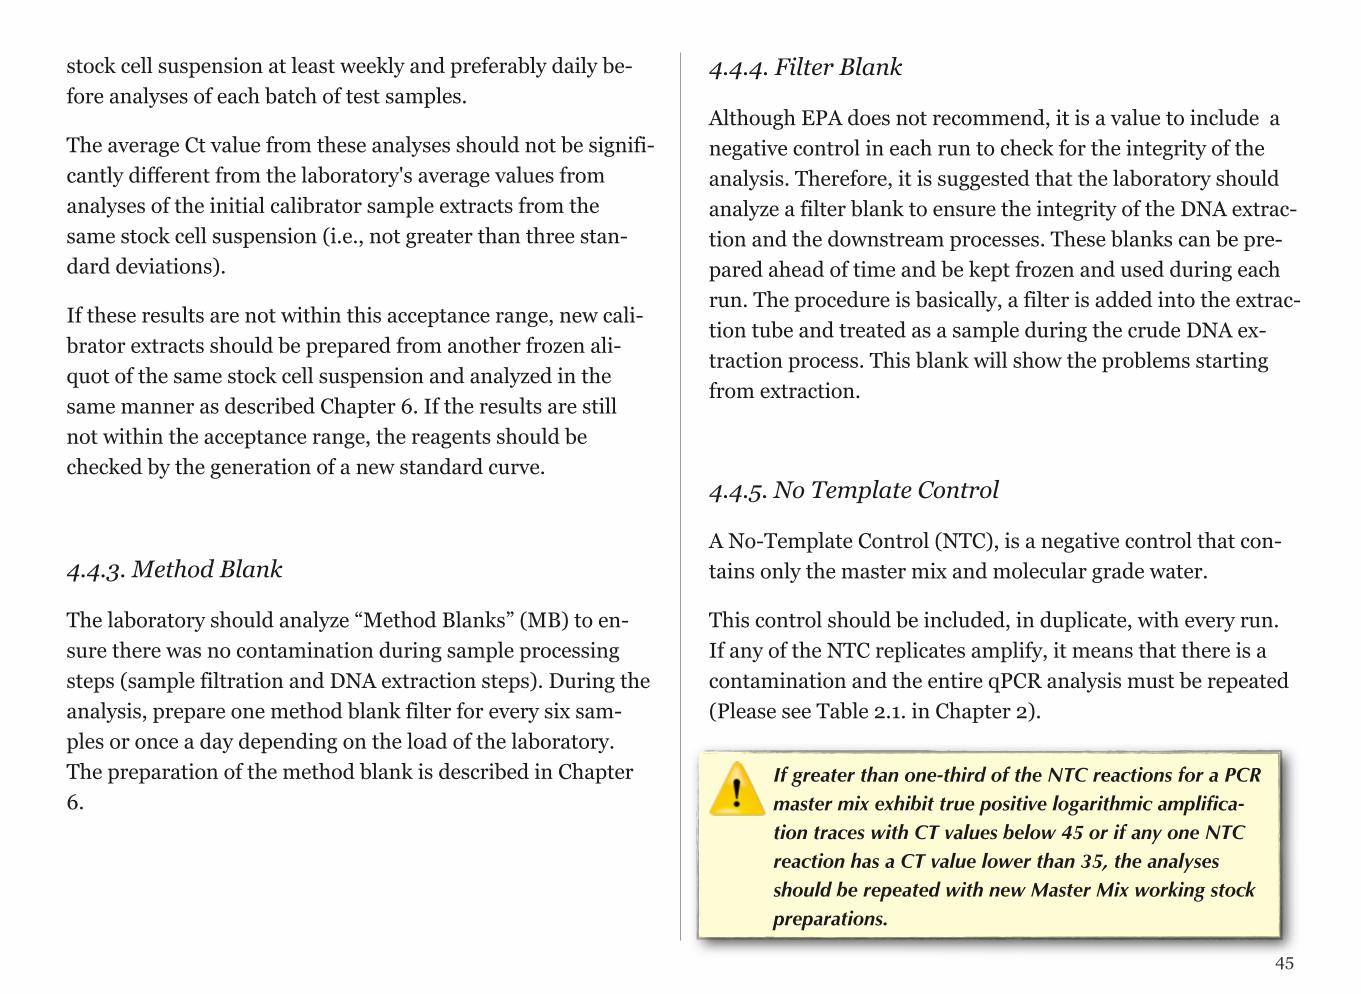
If greater than one-third of the NTC reactions for a PCR master mix exhibit true positive logarithmic amplifica-tion traces with CT values below 45 or if any one NTC reaction has a CT value lower than 35, the analyses should be repeated with new Master Mix working stock preparations.
4.5. Complete List of Reagents1. Stock Culture
Enterococcus faecalis (E. faecalis) ATCC #29212
2. Sample Processing Control (SPC) DNA (source of SPC control sequences)
Salmon testes DNA (e.g., Sigma D1626 or equivalent)
3. Isopropanol or ethanol, 95%, for flame-sterilization
4. AE Buffer, pH 8.0-9.0
Composition:
10 mM Tris-Cl
0.5 mM EDTA (Ethylenediaminetetraacetic acid)
5. Salmon DNA/extraction buffer (see SPC section)
6. Bleach solution: 10% v/v bleach (or other reagent that hy-drolyzes DNA) (used for cleaning work surfaces)
7. Sterile water (used as rinse water for work surface after bleaching)
8. TaqMan® Universal PCR Master Mix
9. Bovine serum albumin (BSA), fraction V powder
Dissolve in PCR grade water a concentration of 2 mg/mL.
10. Primer and probe sets
a. Enterococcus
i. Forward primer (500uM)
5'-GAGAAATTCCAAACGAACTTG
ii. Reverse primer (500uM)
5'-CAGTGCTCTACCTCCATCATT
iii. TaqMan® probe (100uM)
5'-FAM-TGGTTCTCTCCGAAATAGCTTTAGGGCTA-TAMRA
b. Salmon DNA
i Forward primer (500uM)
5'-GGTTTCCGCAGCTGGG
ii Reverse primer (Sketa 22) (500uM)
5'-CCGAGCCGTCCTGGTC
iii TaqMan® probe (100uM)
5'-FAM-AGTCGCAGGCGGCCACCGT-TAMRA
46
11. Purified, RNA-free quantified and characterized E. fae-calis genomic DNA preparations for use as standards used to generate a standard curve (Section 4.3.3).
12. DNA extraction kit
13. Phosphate Buffered Saline (1X PBS)
14. Glycerol
15. Sterile Distilled Water
4.6. Quality Assurance and Quality Con-trol for ReagentsThe reagents used in qPCR amplification can be purchased. Care should be taken to ensure the reagents are maintained contamination-free. All reagents should be clearly labeled with name, expiration date, and relevant safety information. Reagents from different lot numbers should not be inter-changed without prior functional validation (see USEPA 2004 guidance document Section 3.1.1 through 3.4). Molecular-grade water or its equivalent from commercial sources should be used for all assays.
All reagents used for preparation of master mix should be stored and handled separately from all DNA extracts to avoid any contamination.
All reagents should be molecular grade. All reagents from new lots should be tested to ensure that they work properly by run-ning a PCR positive control using the new reagents. If the PCR positive control fails, new lots should be tested against the old lots.
Primers and probes, containing a specific sequence of nucleo-tides, can be obtained from a commercial vendor. Primers and probes should be free from other contaminating sequences and enzymes. Impure oligos will decrease the specificity of the procedure. Certification of the quality of the oligos, including method of purification, purity, and concentration, should be required from all commercial manufacturers.
Every lot of new oligos should be checked for contamination by being used in a PCR negative control No positive results should be found. Primers and probes should be added to the PCR master mix in the reagent preparation area.
The validation of new sets can be done by comparing the qPCR efficiencies of old and new sets.
Most oligos and DNA templates should be stored at -20°C or -70°C in either TE buffer (10 mM Tris-HCl and 0.1mM EDTA, pH 8.0) or molecular grade water. PCR products may also be stored at -20°C or - 70°C. TE buffer generally is the prefer-able storage buffer for oligos and DNA templates, because it may prevent DNA degradation, however, molecular-grade wa-ter may be more suitable for certain purposes, such as taking spectrophotometric readings.
47
The pure, concentrated oligos should be stored in the original tube from the manufacturer and labeled with the primer name and concentration. To minimize the chance of contamination and degradation, these concentrated stocks should not be used on a regular basis. Diluted working stocks should be made for each oligo, and these working stocks should be used for all experiments. Before use, oligos should be thawed and mixed completely.
Laboratories should either set expiration dates of one year for primers and probes, or check their sensitivity when they are a year old and then on a regular basis to see if any degradation has occurred. The sensitivity of primers can be checked by run-ning a PCR positive control using the old and new primers as described in USEPA 2004 guidance document Section 5.1.1. If degradation has occurred, new primers and probes should be prepared.
Enzymes should be purchased from a commercial source to ensure purity. Laboratories should select vendors that provide QA information with the enzymes.
The analyst should have only one container open at a time when working with enzymes.
The manufacturers’ instructions on enzyme storage and use should be followed carefully. Enzymes typically are stored at -20°C, and should never be left at workstation temperature in the laboratory. Insulated bench-top coolers or ice can be used to keep the enzyme cold in the laboratory, when used on the
bench top. “Frost-free” freezers should not be used. Tempera-ture fluctuations lead to reagent degradation.
Pipette tips should be discarded after each dispenses to pre-vent cross-contamination.
48
CHAPTER 5
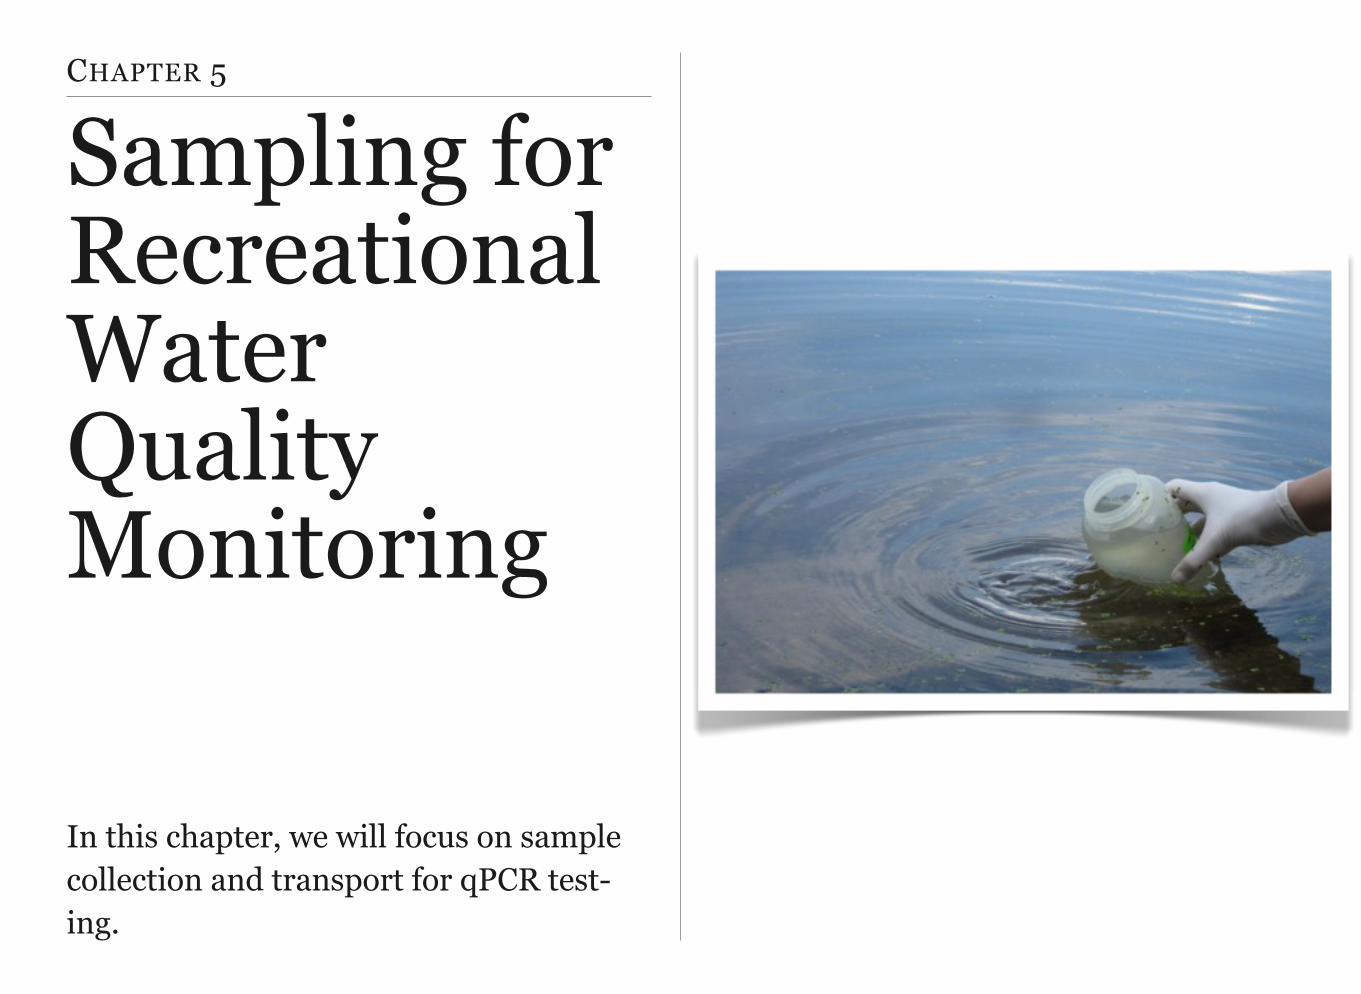
Sampling for Recreational Water Quality Monitoring
In this chapter, we will focus on sample collection and transport for qPCR test-ing.
CONTENTS
5.1. Sampling Equipment
5.2. Sample Collection
5.3. Sample Transport
5.4. Environmental Sample Acceptance Protocol
Sample Collection and Transport
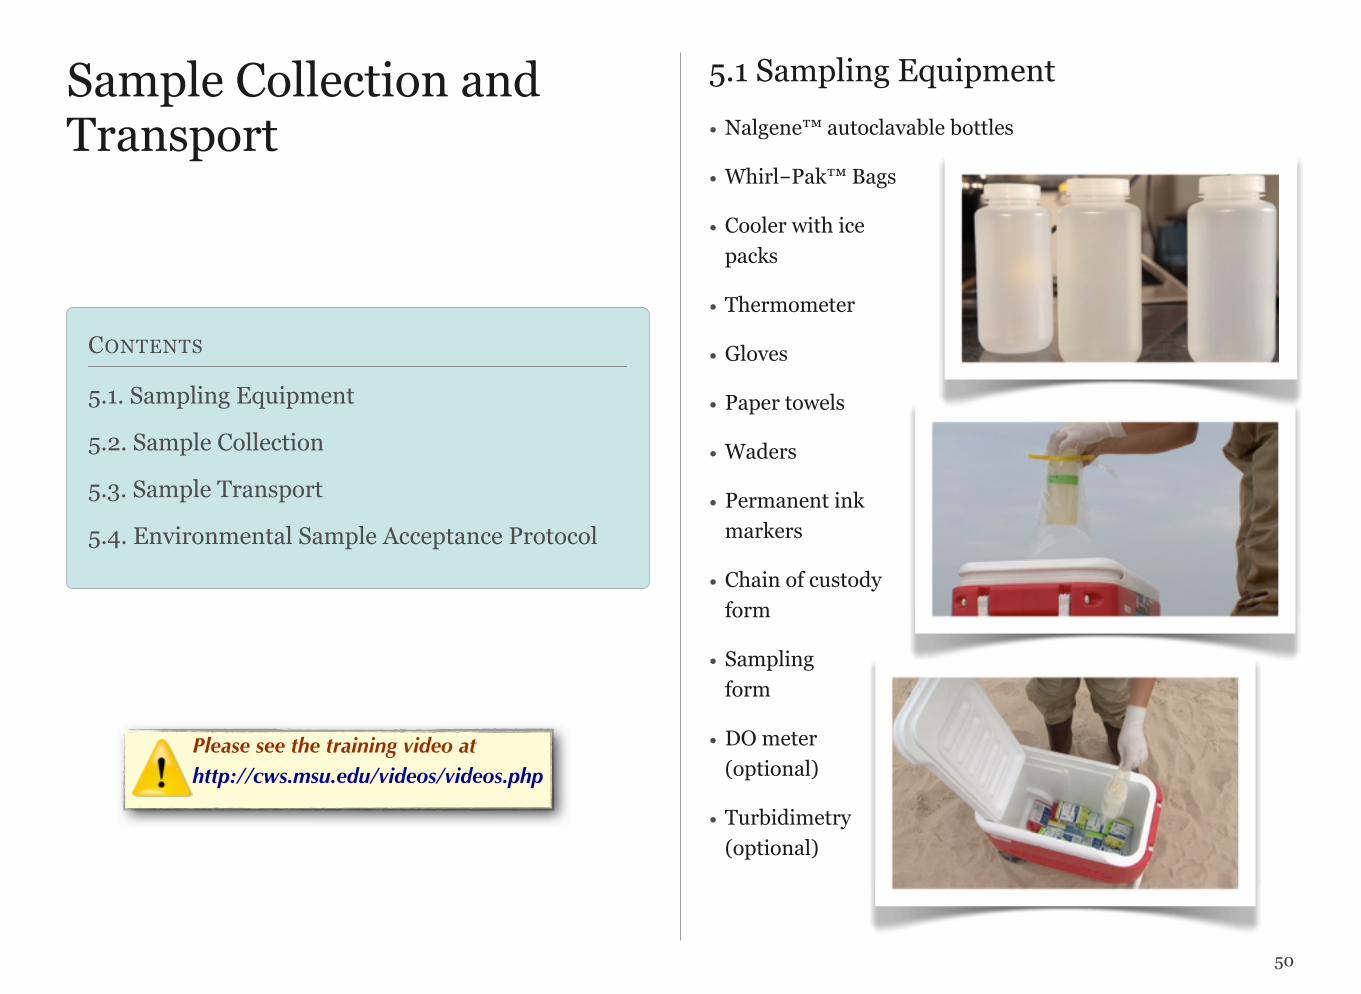
5.1 Sampling Equipment• Nalgene™ autoclavable bottles
• Whirl-Pak™ Bags
• Cooler with ice packs
• Thermometer
• Gloves
• Paper towels
• Waders
• Permanent ink markers
• Chain of custody form
• Sampling form
• DO meter (optional)
• Turbidimetry (optional)
50
Please see the training video at http://cws.msu.edu/videos/videos.php
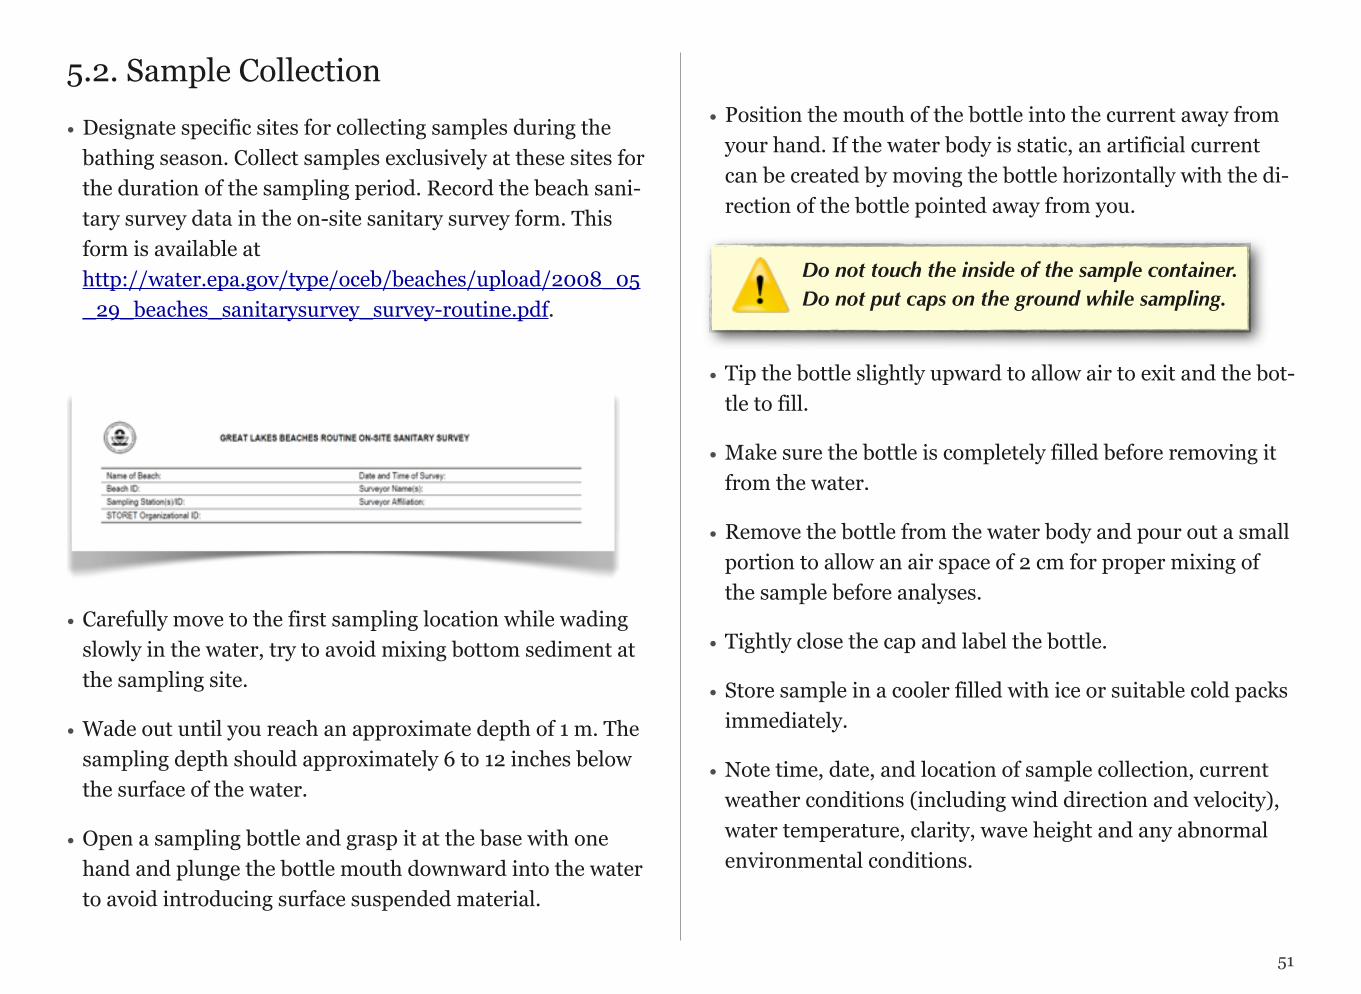
5.2. Sample Collection • Designate specific sites for collecting samples during the
bathing season. Collect samples exclusively at these sites for the duration of the sampling period. Record the beach sani-tary survey data in the on-site sanitary survey form. This form is available at http://water.epa.gov/type/oceb/beaches/upload/2008_05_29_beaches_sanitarysurvey_survey-routine.pdf.
• Carefully move to the first sampling location while wading slowly in the water, try to avoid mixing bottom sediment at the sampling site.
• Wade out until you reach an approximate depth of 1 m. The sampling depth should approximately 6 to 12 inches below the surface of the water.
• Open a sampling bottle and grasp it at the base with one hand and plunge the bottle mouth downward into the water to avoid introducing surface suspended material.
• Position the mouth of the bottle into the current away from your hand. If the water body is static, an artificial current can be created by moving the bottle horizontally with the di-rection of the bottle pointed away from you.
Do not touch the inside of the sample container. Do not put caps on the ground while sampling.
• Tip the bottle slightly upward to allow air to exit and the bot-tle to fill.
• Make sure the bottle is completely filled before removing it from the water.
• Remove the bottle from the water body and pour out a small portion to allow an air space of 2 cm for proper mixing of the sample before analyses.
• Tightly close the cap and label the bottle.
• Store sample in a cooler filled with ice or suitable cold packs immediately.
• Note time, date, and location of sample collection, current weather conditions (including wind direction and velocity), water temperature, clarity, wave height and any abnormal environmental conditions.
51
5.3. Sample Transport
Immediately store collected samples on ice.
Samples should be labeled, iced or refrigerated at 1 - 4 °C im-mediately after collection and during transit to the lab.
Once samples are transferred to the laboratory, they should be stored at 1-4 °C, and processed (ideally) within 6 hours of sam-ple collection.
Care should be taken to ensure that sample bottles are not to-tally immersed in water during transit or storage.
Do not transport the samples with other environ-mental samples.
5.4. Environmental Sample Acceptance Protocol According to USEPA (2004), laboratories should have a proto-col in place for the acceptance of environmental samples for qPCR analysis. This protocol should be documented and ar-chived as a “chain of custody form” and include sample accep-tance criteria and corrective actions for samples that do not
meet the criteria (e.g., recollection of the sample or follow up with the sample collector to obtain missing information).
The sample should be assessed when it is received at the labo-ratory to verify that the sample volume was adequate, the sam-ple was handled and preserved appropriately (e.g. chilled, la-belled), the holding time requirement was met, and that all re-quired sample collection information was recorded by the sam-ple collector.
52
Sample volume, sample handling, and holding times will be method dependent, so sample acceptance criteria should be based on the specifications described in Method 1611 for this particular sampling.
After the sample is assessed, information on the date and time of sample receipt and sample condition should be recorded.
The sample should be marked, logged, and tracked carefully in a chain of custody record form as below:
53
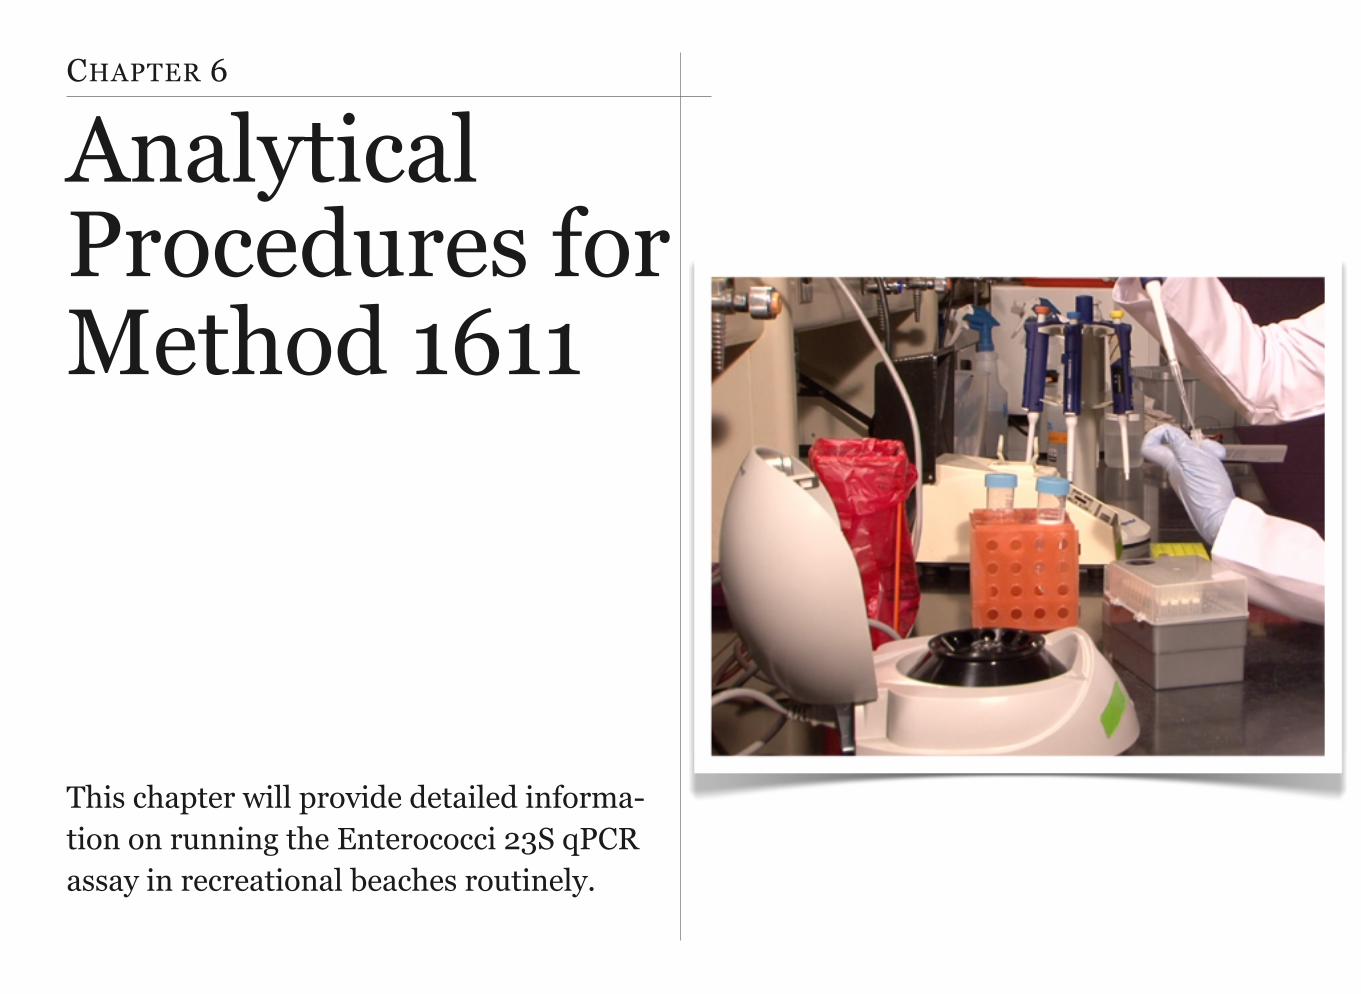
CHAPTER 6
Analytical Procedures for Method 1611
This chapter will provide detailed informa-tion on running the Enterococci 23S qPCR assay in recreational beaches routinely.
CONTENTS
6.1. Membrane Filtration (Concentration of target DNA)
6.2. Nucleic Acid Extraction
6.3. Mastermix Preparation
6.4. Template, Positive and Negative Control Preparation
Running the Method 1611 6.1. Membrane Filtration (Concentration of target DNA)This step concentrates the target DNA from the sample onto a membrane filter prior extraction. Preparation of the method blank is also a part of this step. This step take place at the “Membrane Filtration Preparation Workstation”.
Sterile conditions should be maintained during sample proc-essing. Wear disposable gloves when handling the samples, equipment, and supplies.
Prior to filtration, thorough cleaning of the surfaces is re-quired to avoid cross contamination. Wipe down bench tops before and after sample processing with 10% bleach solution, allowing the bleach to contact the work surface for a mini-mum of 15 minutes prior to rinsing with sterile water. After de-contamination, discard gloves and replace with new clean pair.
6.1.1. Method Blank Membrane Filtration Protocol
The method blank ensures there is no contamination during sample processing (e.g. membrane filtration and DNA extrac-tion).
• Set up filtration apparatus.
55
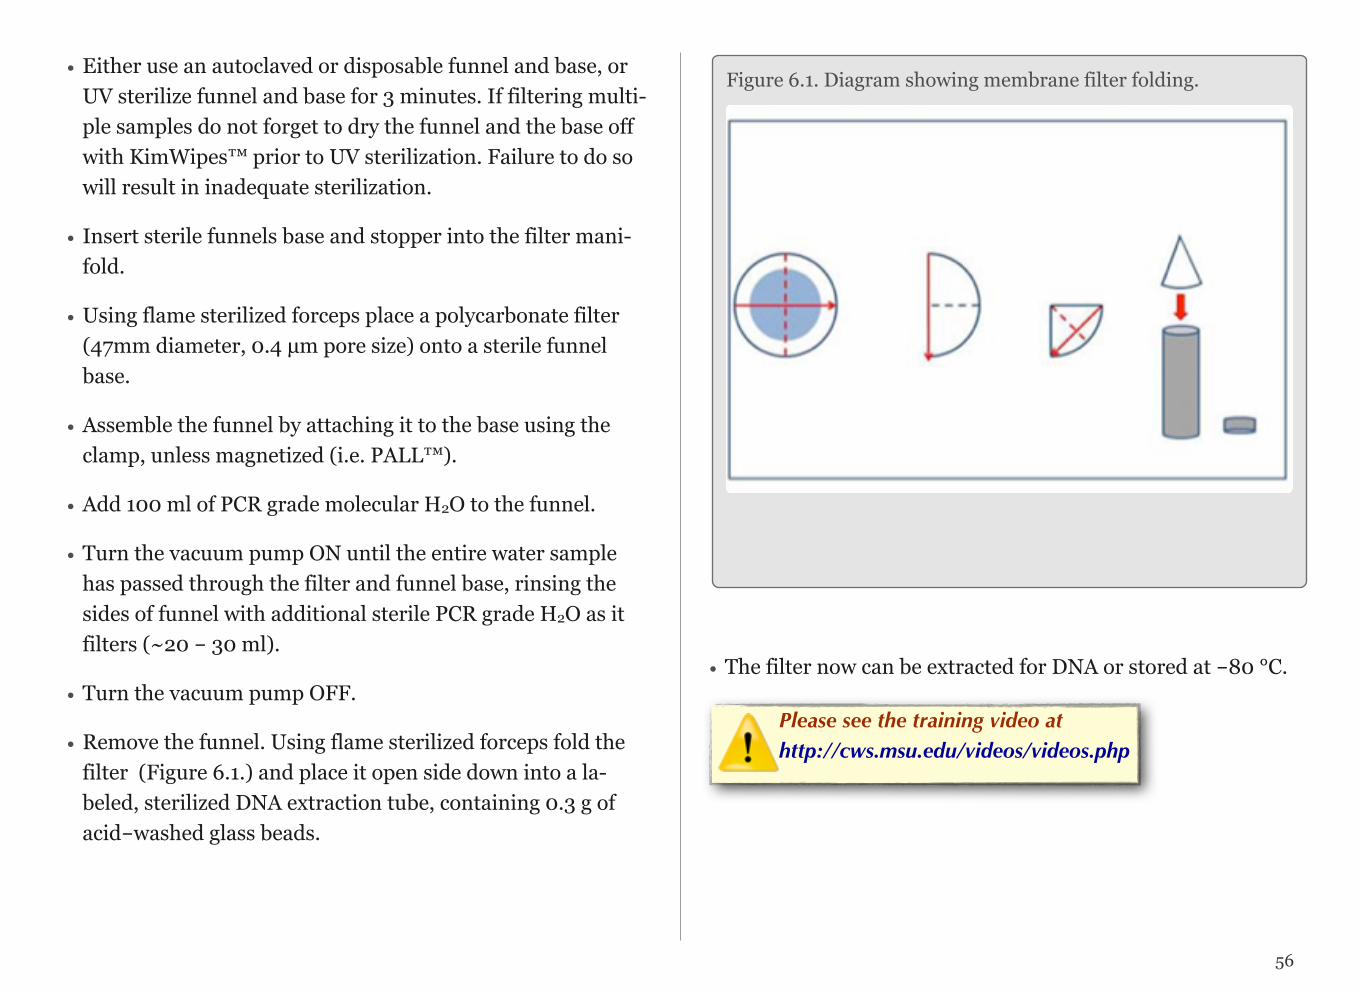
• Either use an autoclaved or disposable funnel and base, or UV sterilize funnel and base for 3 minutes. If filtering multi-ple samples do not forget to dry the funnel and the base off with KimWipes™ prior to UV sterilization. Failure to do so will result in inadequate sterilization.
• Insert sterile funnels base and stopper into the filter mani-fold.
• Using flame sterilized forceps place a polycarbonate filter (47mm diameter, 0.4 µm pore size) onto a sterile funnel base.
• Assemble the funnel by attaching it to the base using the clamp, unless magnetized (i.e. PALL™).
• Add 100 ml of PCR grade molecular H2O to the funnel.
• Turn the vacuum pump ON until the entire water sample has passed through the filter and funnel base, rinsing the sides of funnel with additional sterile PCR grade H2O as it filters (~20 - 30 ml).
• Turn the vacuum pump OFF.
• Remove the funnel. Using flame sterilized forceps fold the filter (Figure 6.1.) and place it open side down into a la-beled, sterilized DNA extraction tube, containing 0.3 g of acid-washed glass beads.
• The filter now can be extracted for DNA or stored at -80 °C.
Please see the training video at http://cws.msu.edu/videos/videos.php
56
Figure 6.1. Diagram showing membrane filter folding.
6.1.2. Water Sample Membrane Filtration Protocol
• Set up filtration apparatus.
• UV sterilize funnel and the base for 3 minutes. If filtering multiple samples do not forget to dry the funnel and the base off with KimWipes™ prior to UV sterilization. Failure to do so will results in inadequate sterilization.
• Insert sterile funnels base and stopper into the filter mani-fold.
• Using flame sterilized forceps place a polycarbonate filter (47mm diameter, 0.4 µm pore size) onto a sterile funnel base.
• Assemble the funnel by attaching it to the base using the clamp, unless magnetized (i.e. PALL™).
• Shake the sample vigorously 25 times in a 1-foot arc within 60 seconds to evenly distribute the bacteria.
• Add the appropriate amount of the sample to the funnel (typically 100 ml).
Dilution might be needed for samples that 100 ml may not pass through the filter.
• For a diluted sample, 25 ml of PCR grade H2O should be added to the funnel first (enough to fill the smaller end of the funnel where it attaches to the funnel base). The desired
amount of sample may then be pipetted and the total vol-ume brought up to 100ml using PCR grade H2O.
• For example, for a 1:10 dilution; fill funnel near base with 25 ml PCR grade H2O, pipette in 10 ml of water sample, fill funnel to 100 ml with PCR grade H2O.
• Turn the vacuum pump ON and apply a vacuum until the en-tire water sample has passed through the filter and funnel base. Rinse the sides of funnel with sterile PCR grade H2O as it filters, passing an additional 20-30 ml through the filter.
• Turn the vacuum pump OFF.
• Remove the funnel. Using flame sterilized forceps fold the filter and place it open side down into a sterilized DNA ex-traction tube, containing 0.3 g of acid-washed glass beads.
• Important note: When folding the filter try to only touch the edges of the filter and fold sample side in.
• The filters now can be extracted for DNA or stored at -80 °C.
6.2. Nucleic Acid Extraction This section takes place at the dedicated workstation or at the membrane filtration workstation. To minimize environmental DNA contamination, routinely treat the work surfaces with a 10% bleach solution, allowing the bleach to contact the work
57
surface for a minimum of 15 minutes prior to rinsing with ster-ile water. After decontamination, discard gloves and replace with new clean pair.
This section will primarily focus on Crude DNA Extraction as described in Method 1611.
6.2.1. Preparation of Enterococcus Calibrator Sample Extract
1. Remove a tube containing a 10 µl aliquot of frozen Entero-coccus stock cell suspension (as prepared in Section 4.3.3) and thaw (preferably on ice, or placed at 4 °C until thawed).
2. 2. While cell stock is thawing, using sterile (or flame-sterilized) forceps, place one sterile polycarbonate filter in each of three extraction tubes with glass beads.
2.1. Alternatively, BioBalls can be purchased and if using BioBalls for calibrators add a single BioBall® to each tube.
3. Dispense 590 µL of Salmon DNA/extraction buffer into each of the three extraction tubes with glass beads and fil-ters. Label tubes as Replicate 1, Replicate 2 and Replicate 3.
3.1. Calibrators contain the same amount of extraction buffer and starting amount of Salmon DNA as the samples.
4. When E. faecalis stock cell suspension has thawed (Step 1), transfer 990 µL AE buffer to the 10 µL E. faecalis stock cell tube and mix thoroughly by vortexing. Pulse microcentri-fuge tube briefly (1 − 2 sec.) to coalesce droplets in tube.
5. Immediately after vortexing the E. faecalis stock cell sus-pension, spot 10 µL onto the polycarbonate filter in the ex-traction tube (Step 2).
6. Tightly close the tube, making sure that the O-ring is seated properly and label tubes appropriately.
7. Repeat this procedure for the other two replicate filters to prepare a total of three E. faecalis calibrator samples.
8. Place the tubes in the mini bead beater and shake for 60 sec-onds at 5000 rpm or the maximum rate.
9. Remove the tubes from the mini bead beater and centrifuge at 12,000 × g for one minute to pellet the glass beads and debris.
10.Using a 200 µL micropipettor, transfer the crude super-natant to the corresponding labeled sterile 1.7 mL microcen-trifuge tube. Transfer 400 µL of supernatant without dis-rupting the debris pellet or glass beads at the tube bottom.
10.1.Generally, 400 µL of supernatant can be easily col-lected. Collect an absolute minimum of 100 µL of su-pernatant. Record volume of supernatant collected.
58
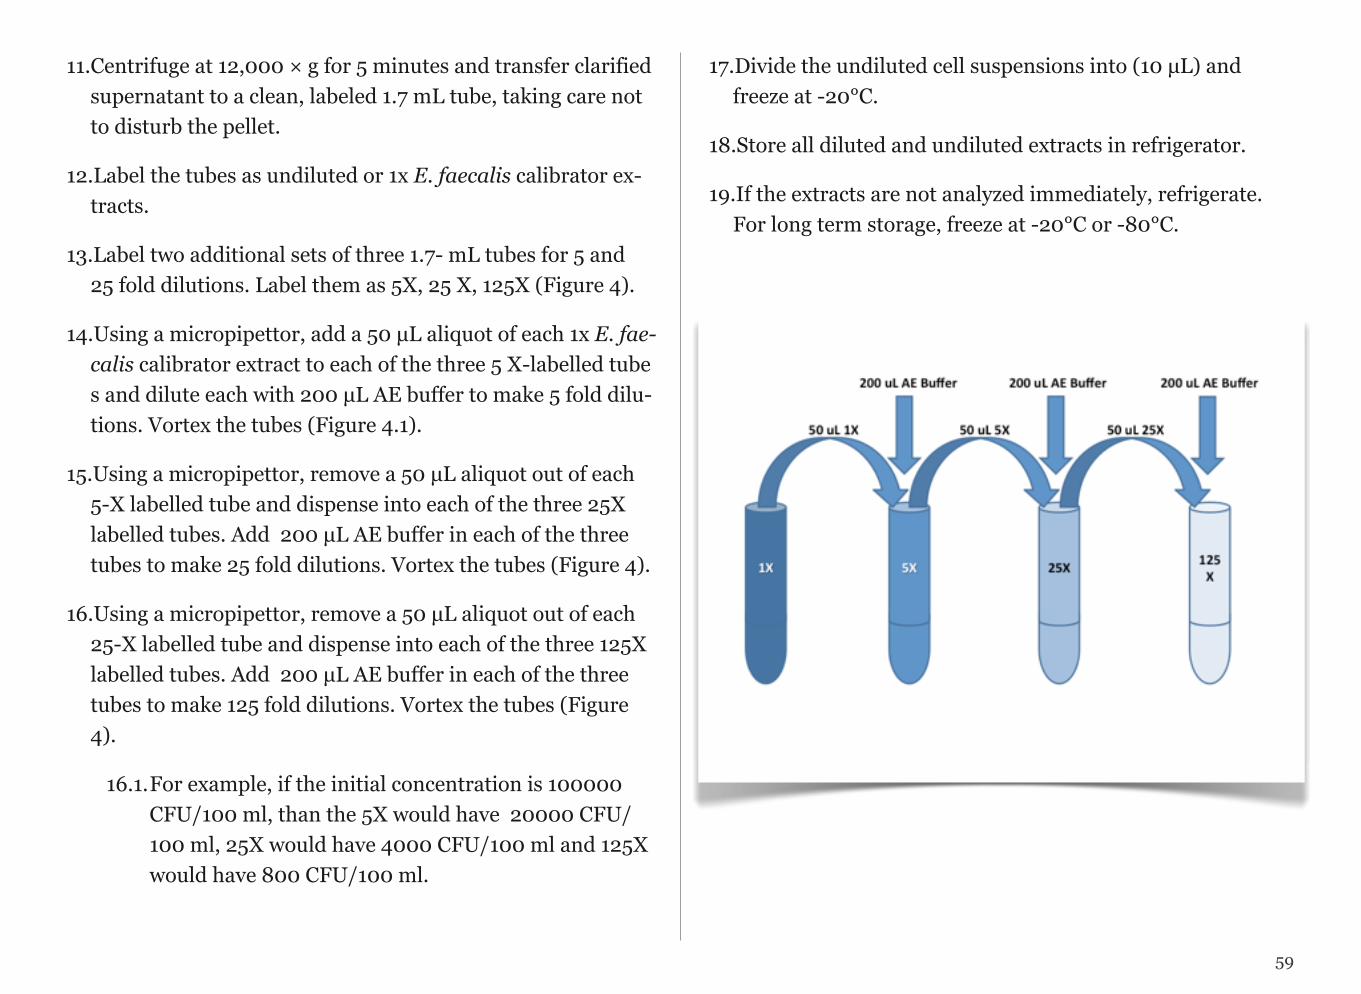
11.Centrifuge at 12,000 × g for 5 minutes and transfer clarified supernatant to a clean, labeled 1.7 mL tube, taking care not to disturb the pellet.
12.Label the tubes as undiluted or 1x E. faecalis calibrator ex-tracts.
13.Label two additional sets of three 1.7- mL tubes for 5 and 25 fold dilutions. Label them as 5X, 25 X, 125X (Figure 4).
14.Using a micropipettor, add a 50 µL aliquot of each 1x E. fae-calis calibrator extract to each of the three 5 X-labelled tube s and dilute each with 200 µL AE buffer to make 5 fold dilu-tions. Vortex the tubes (Figure 4.1).
15.Using a micropipettor, remove a 50 µL aliquot out of each 5-X labelled tube and dispense into each of the three 25X labelled tubes. Add 200 µL AE buffer in each of the three tubes to make 25 fold dilutions. Vortex the tubes (Figure 4).
16.Using a micropipettor, remove a 50 µL aliquot out of each 25-X labelled tube and dispense into each of the three 125X labelled tubes. Add 200 µL AE buffer in each of the three tubes to make 125 fold dilutions. Vortex the tubes (Figure 4).
16.1.For example, if the initial concentration is 100000 CFU/100 ml, than the 5X would have 20000 CFU/100 ml, 25X would have 4000 CFU/100 ml and 125X would have 800 CFU/100 ml.
17.Divide the undiluted cell suspensions into (10 µL) and freeze at -20°C.
18.Store all diluted and undiluted extracts in refrigerator.
19.If the extracts are not analyzed immediately, refrigerate. For long term storage, freeze at -20°C or -80°C.
59
6.2.2. Preparation of the Samples and Method Blank Extracts
• Using a 1000 µL micropipettor, dispense 590 µL of the 0.2 µg/ml Salmon DNA extraction buffer into each labeled ex-traction tube with glass beads containing the water sample or method blank. Extract the method blank last.
• Tightly close the tubes, making sure that the O-ring is seated properly.
• Place the tubes in the mini bead beater and shake for 60 sec-onds at 5000 rpm or the maximum rate.
• Remove the tubes from the mini bead beater and centrifuge at 12,000 × g for 1 minute to pellet the glass beads and de-bris.
• Using a new pair of gloves and the 200 µL micropipettor, transfer 400 µL of the supernatant to a corresponding la-beled sterile 1.7-mL microcentrifuge tube, taking care not to pick up glass beads or sample debris (pellet). Recover the method blank supernatant last.
• The filter will normally remain intact during the bead beating and centrifugation process. Generally, 400 µL of supernatant can easily be collected. Collect an absolute minimum of 100 µL of supernatant.
• Centrifuge crude supernatant for 5 minutes at 12,000 × g. Transfer 350 µL of the clarified supernatant to another
1.7-mL tube, taking care not to disturb pellet. Note that pel-let may not be visible in water samples. Recover the method blank supernatant last.
• Label the tubes as undiluted (or 1x) water sample extracts and with the sample ID. Label additional tubes for method blanks and for 5 and 25 fold dilutions of sample extracts.
• Make the 5X and 25X dilutions as follows:
• In 5X labelled tubes, using a micropipettor, add a 50 µL aliquot of each 1x water sample extract and dilute each with 200 µL AE buffer to make 5 fold dilutions.
• In 25X labeled tubes, using a micropipettor, add a 50 µL aliquot of each 5 fold dilution and dilute each with 200 µL of AE buffer to make 25 fold dilutions.
• Dilute the method blank supernatant last.
• Store all diluted and undiluted extracts in refrigerator.
• Use of 5 fold diluted samples for analysis is currently recom-mended if only one dilution can be analyzed. Analyses of un-diluted water sample extracts have been observed to cause a significantly higher incidence of PCR inhibition while analy-ses of 25 fold dilutions may unnecessarily sacrifice sensitiv-ity.
• If the extracts are not analyzed immediately, refrigerate. For long term storage, freeze at -20°C or -80°C.
60
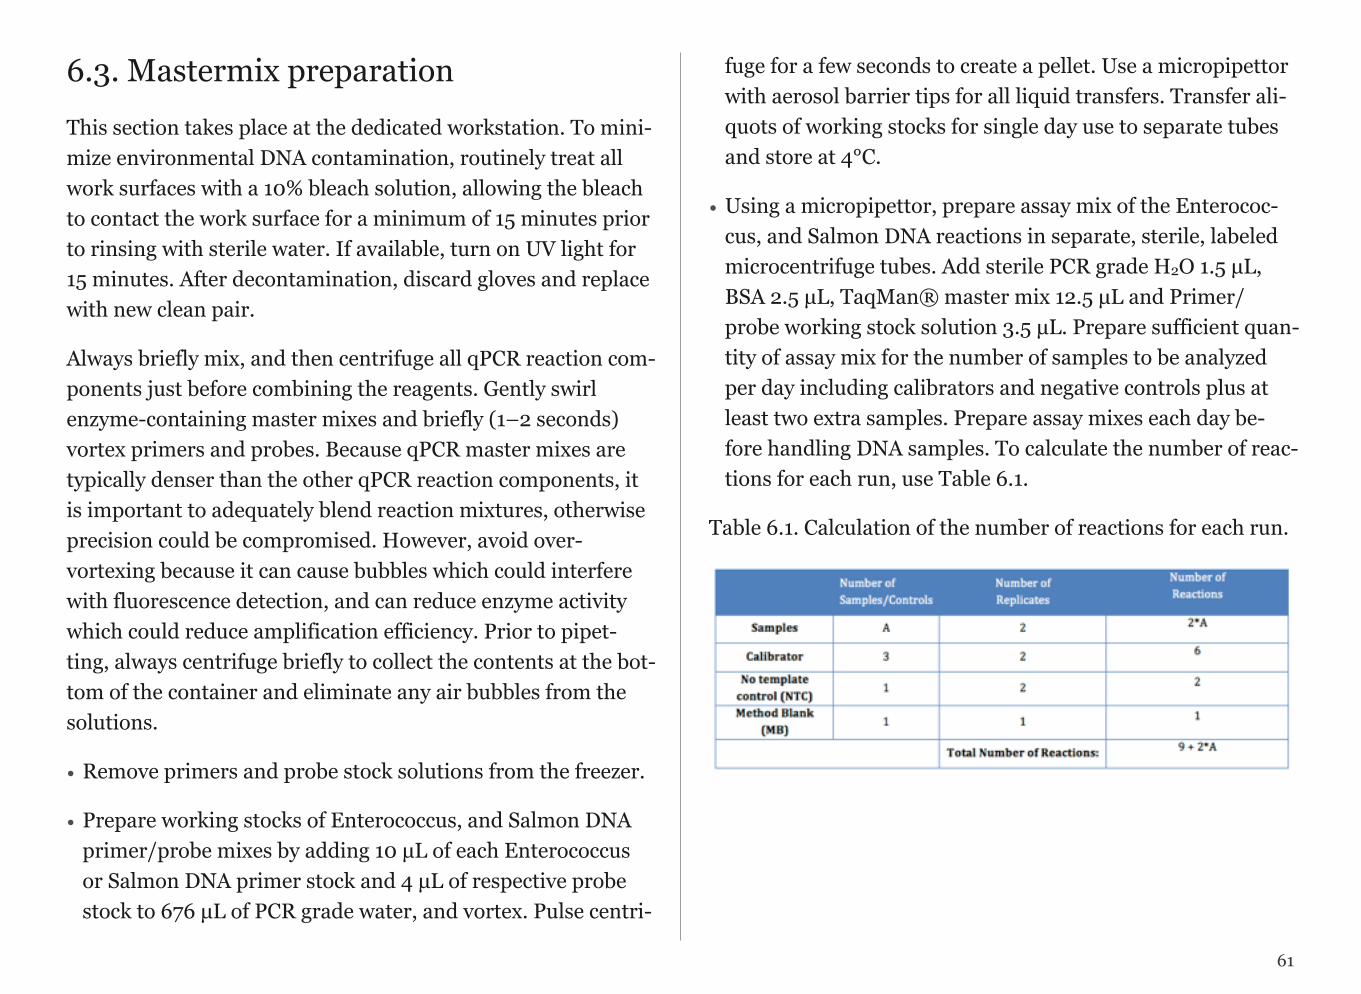
6.3. Mastermix preparationThis section takes place at the dedicated workstation. To mini-mize environmental DNA contamination, routinely treat all work surfaces with a 10% bleach solution, allowing the bleach to contact the work surface for a minimum of 15 minutes prior to rinsing with sterile water. If available, turn on UV light for 15 minutes. After decontamination, discard gloves and replace with new clean pair.
Always briefly mix, and then centrifuge all qPCR reaction com-ponents just before combining the reagents. Gently swirl enzyme-containing master mixes and briefly (1–2 seconds) vortex primers and probes. Because qPCR master mixes are typically denser than the other qPCR reaction components, it is important to adequately blend reaction mixtures, otherwise precision could be compromised. However, avoid over-vortexing because it can cause bubbles which could interfere with fluorescence detection, and can reduce enzyme activity which could reduce amplification efficiency. Prior to pipet-ting, always centrifuge briefly to collect the contents at the bot-tom of the container and eliminate any air bubbles from the solutions.
• Remove primers and probe stock solutions from the freezer.
• Prepare working stocks of Enterococcus, and Salmon DNA primer/probe mixes by adding 10 µL of each Enterococcus or Salmon DNA primer stock and 4 µL of respective probe stock to 676 µL of PCR grade water, and vortex. Pulse centri-
fuge for a few seconds to create a pellet. Use a micropipettor with aerosol barrier tips for all liquid transfers. Transfer ali-quots of working stocks for single day use to separate tubes and store at 4°C.
• Using a micropipettor, prepare assay mix of the Enterococ-cus, and Salmon DNA reactions in separate, sterile, labeled microcentrifuge tubes. Add sterile PCR grade H2O 1.5 µL, BSA 2.5 µL, TaqMan® master mix 12.5 µL and Primer/probe working stock solution 3.5 µL. Prepare sufficient quan-tity of assay mix for the number of samples to be analyzed per day including calibrators and negative controls plus at least two extra samples. Prepare assay mixes each day be-fore handling DNA samples. To calculate the number of reac-tions for each run, use Table 6.1.
Table 6.1. Calculation of the number of reactions for each run.
61
• Vortex the assay mix working stocks; then pulse microcentri-fuge to coalesce droplets. Return the primer/probe working stocks and other reagents to the refrigerator.
• Transfer 20 µL of mastermix to tubes or the individual wells of aPCR reaction tray equal to the number of samples to be analyzed including calibrator and negative control samples.
• The same tip can be used for pipetting multiple aliquots of the same assay mix as long as it doesn’t make contact with anything else).
• When the samples are loaded in the wells cover tray with ad-hesive sealers, or close tubes, and transfer to refrigerator at 4°C (if being stored for later analysis) or transfer directly to the reaction preparation workstation.
6.4. Template, Positive and Negative Con-trol Preparation This part of the analysis takes place at the reaction prepara-tion workstation. To minimize environmental DNA contamina-tion, routinely treat all work surfaces with a 10% bleach solu-tion, allowing the bleach to contact the work surface for a mini-mum of 15 minutes prior to rinsing with sterile water. If avail-able, turn on UV light for 15 minutes. After decontamination, discard gloves and replace with new clean pair.
Recording the positions of each sample, transfer 5 µL each of the DNA extracts of method blanks, samples and correspond-ing dilutions of calibrators to separate tubes or wells of the PCR reaction tray or tubes containing the Enterococcus mix.
Recording the positions of each sample, transfer 5 µL each of the DNA extracts of method blanks, samples and correspond-ing dilutions of calibrators to separate tubes or wells of the PCR reaction tray or tubes containing the Salmon DNA mix.
Transfer 5 µL aliquots of AE buffer to tubes or wells of PCR re-action tray containing Enterococcus mix. (Repeat these for separate tubes or wells of the PCR reaction tray or tubes con-taining the Salmon DNA mix too). These will be the no-template controls. Record positions of these samples.
Cap tubes or seal wells of PCR reaction tray containing sam-ples tightly or cover tray and seal tightly with optical adhesive.
Centrifuge your PCR reaction tray before running reactions in a qPCR machine.
62

6.5. QuantificationProceed to the amplification and product detection worksta-tion. Set up the instrument and follow the instructions of the manufacturer for analysis.
• Run reactions in the thermocycler following instrument spe-cific manufacturer’s instructions.
• See Method 1611, Appendix B for ABI 7500 and 7900 or Cepheid Smart Cycler.
• Follow manufacturer’s instructions when using other brands of instruments.
63
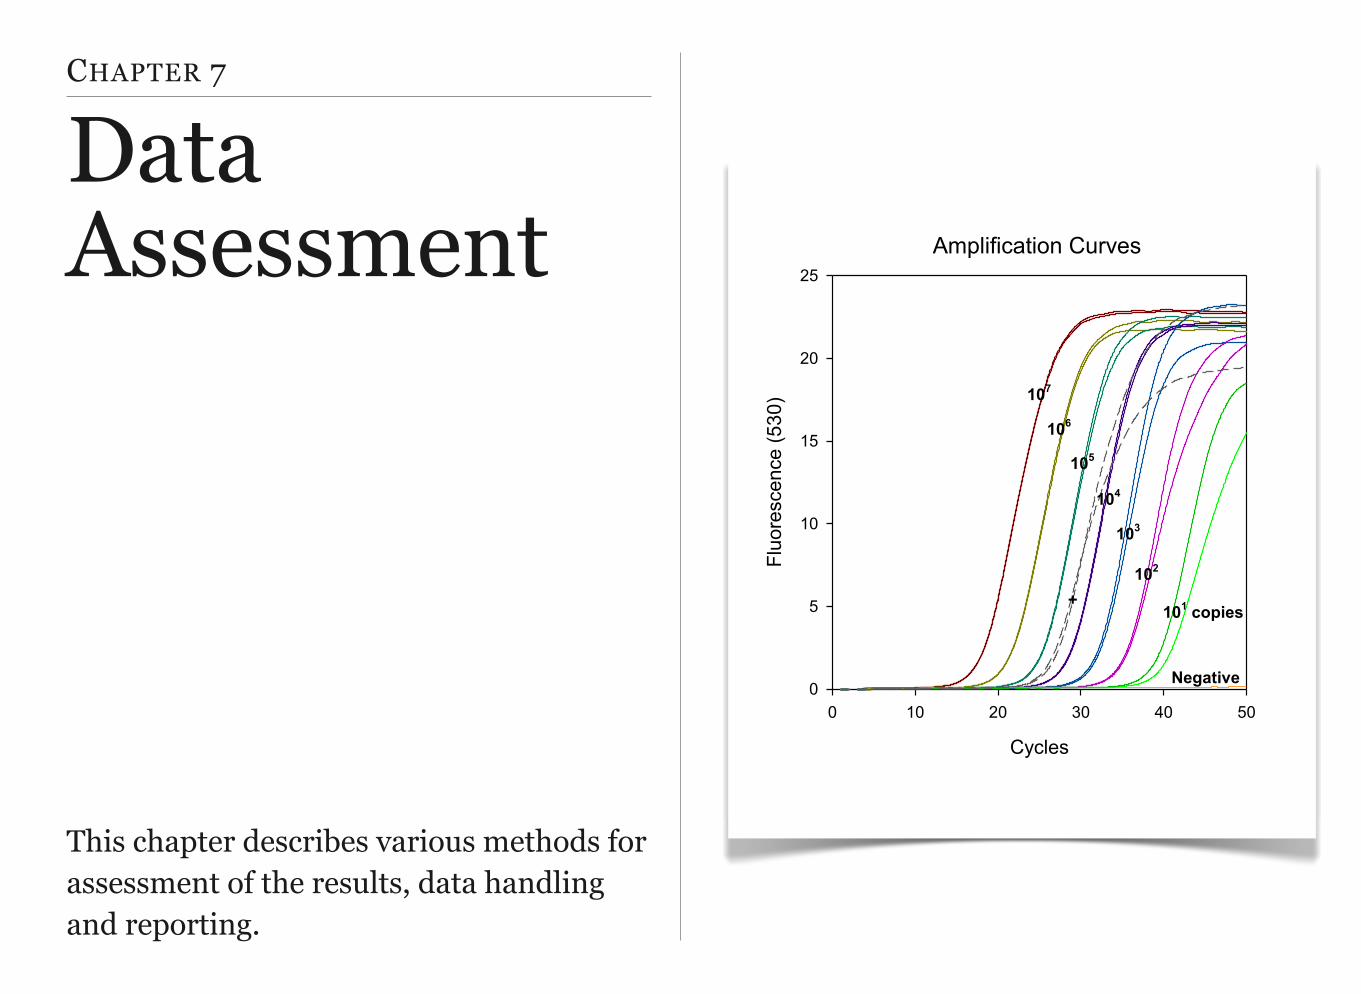
Amplification Curves
Cycles
0 10 20 30 40 50
Fluo
resc
ence
(530
)
0
5
10
15
20
25
107
106
105
+
104
103
102
101 copies
Negative
CHAPTER 7
Data Assessment
This chapter describes various methods for assessment of the results, data handling and reporting.
CONTENTS
7.1. Data Analysis and Calculations
7.2. Data Handling
7.3. Reporting the Results
Calculations, data handling and reporting
7.1. Data Analysis and Calculations
The complete procedures for determining target sequence quantities in water samples are described below.
7.1.1. Calculating efficiency and amplification factor from the genomic standard curve
Genomic DNA standards are used to generate standard curves for the determination of performance characteristics of the qPCR assays and instruments with different preparations of master mixes containing TaqMan® reagent, primers and probes. They may also be used for quantifying target se-quences in calibrator sample extracts. A target sequence is the region of the gene characteristic to the organism you are try-ing to identify, in this case Enterococcus, and which differenti-ates it from other organisms (assay specificity). The instruc-tions for creating a genomic DNA standard curve were previ-ously described in Chapter 4.
To calculate the efficiency, you will need the Ct values of three replicate serial dilutions of the genomic DNA (e.g. 4 x 10⁴, 4 x 10³, 4 x 10², 2 x 10² and 1 x 10² lsrRNA gene sequences per 5 µL) as described in Chapter 4.
Log transform the concentrations. Then plot Ct values vs these log transformed concentrations. Perform a multiple lin-
65
ear regression. The r2 reflects the linearity of the standard curve, therefore indicates how precisely the line fits the data.
The next step is to find out the efficiency of the reaction. The slope of the regression equation equates to the efficiency of the reaction. The efficiency should be as close to 100% as pos-sible, which is equivalent to a slope of -3.32.
You can calculate the percentage using the following formula:
Efficiency% = (10 (-1/-slope)-1) x 100%
For example if the slope is -3.3276 then
Efficiency% = (10 (-1/-3.3276)-1) x 100%= (1.99763845-1) x 100%= 0.99763845 x 100%=99.763845%
Efficiency %=~99.8
Once the slope is determined, the amplification factor can also be calculated. The amplification factor (AF) is a measure of the average efficiency at which the DNA target or SPC se-quences are copied and detected by their respective primer and probe assays during each cycle of the qPCR reaction. It is used in comparative cycle threshold calculation methods like ddCT. AF values can range from 1 (0 % of sequences copied and detected) to 2 (100 % of sequences copied and detected) and are calculated from the standard curve.
Calculate the amplification factor using the equation below:
AF = 10^(1 / (-)slope value)
For example, if the slope is 3.4777, the amplification factor will be:
AF = 10^(1 / 3.4777) = 1.94
7.1.2. Calculation of average target sequence in cali-brator sample extracts per reaction
The average target sequence in calibrator sample extracts is calculated from the genomic DNA standard curve and the CT value of the calibrators used during the run according to the formula below:
10^((average calibrator extract value-intercept of the ge-nomic DNA standard curve) / slope of the genomic DNA stan-dard curve)
For example:
If the regression equation of the genomic DNA standard curve is: y=-3.477x+38.42
and
If the average calibrator extract Ct value obtained during the qPCR analysis of your samples is 25.21;
66
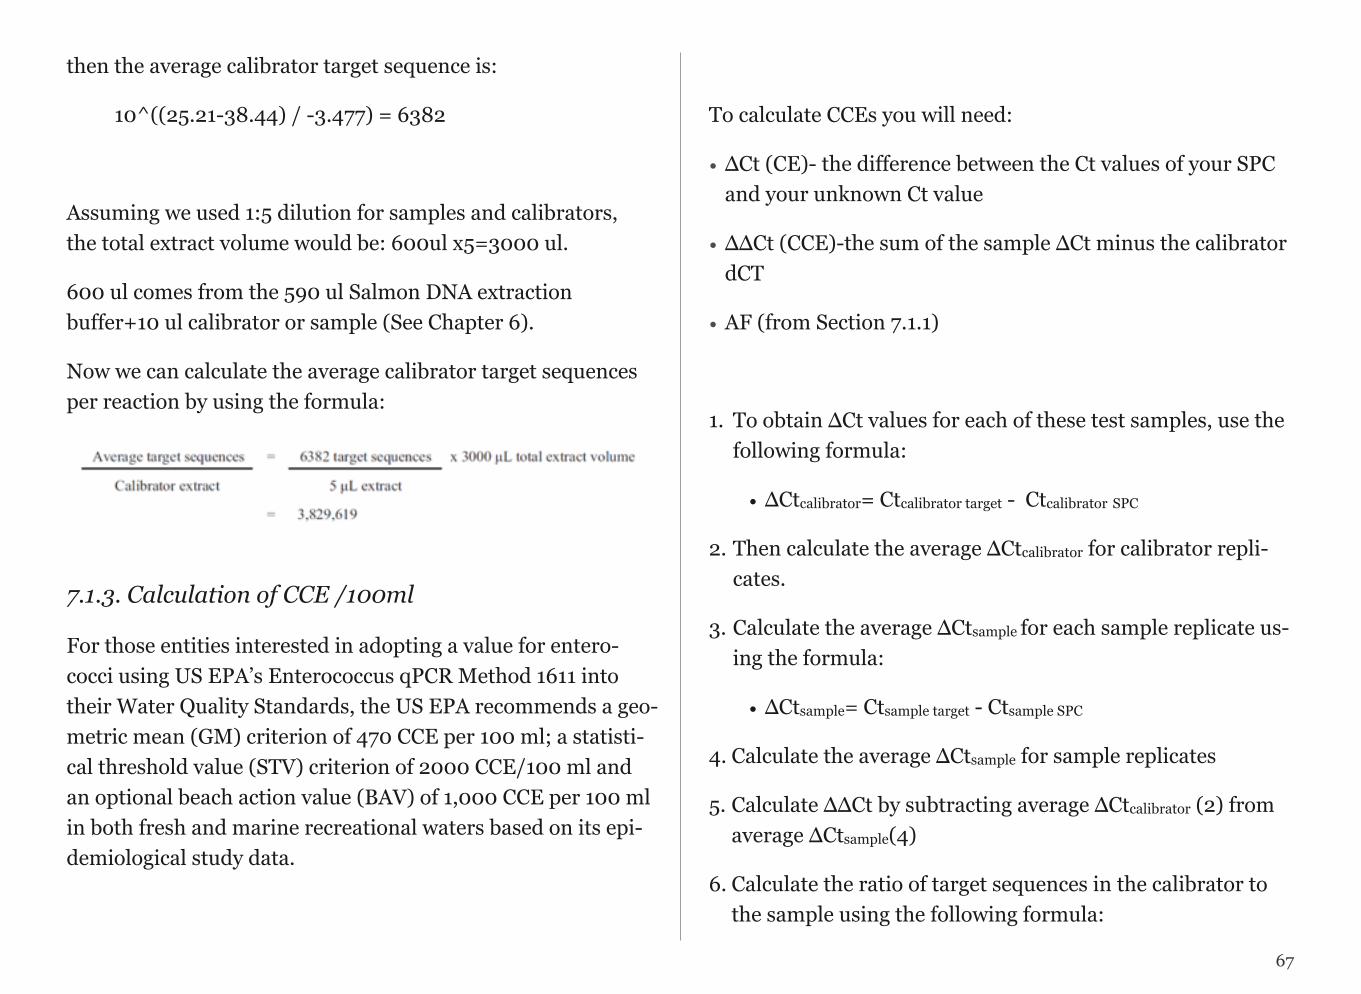
then the average calibrator target sequence is:
10^((25.21-38.44) / -3.477) = 6382
Assuming we used 1:5 dilution for samples and calibrators, the total extract volume would be: 600ul x5=3000 ul.
600 ul comes from the 590 ul Salmon DNA extraction buffer+10 ul calibrator or sample (See Chapter 6).
Now we can calculate the average calibrator target sequences per reaction by using the formula:
7.1.3. Calculation of CCE /100ml
For those entities interested in adopting a value for entero-cocci using US EPA’s Enterococcus qPCR Method 1611 into their Water Quality Standards, the US EPA recommends a geo-metric mean (GM) criterion of 470 CCE per 100 ml; a statisti-cal threshold value (STV) criterion of 2000 CCE/100 ml and an optional beach action value (BAV) of 1,000 CCE per 100 ml in both fresh and marine recreational waters based on its epi-demiological study data.
To calculate CCEs you will need:
• ΔCt (CE)- the difference between the Ct values of your SPC and your unknown Ct value
• ΔΔCt (CCE)-the sum of the sample ΔCt minus the calibrator dCT
• AF (from Section 7.1.1)
1. To obtain ΔCt values for each of these test samples, use the following formula:
• ΔCtcalibrator= Ctcalibrator target - Ctcalibrator SPC
2. Then calculate the average ΔCtcalibrator for calibrator repli-cates.
3. Calculate the average ΔCtsample for each sample replicate us-ing the formula:
• ΔCtsample= Ctsample target - Ctsample SPC
4. Calculate the average ΔCtsample for sample replicates
5. Calculate ΔΔCt by subtracting average ΔCtcalibrator (2) from average ΔCtsample(4)
6. Calculate the ratio of target sequences in the calibrator to the sample using the following formula:
67
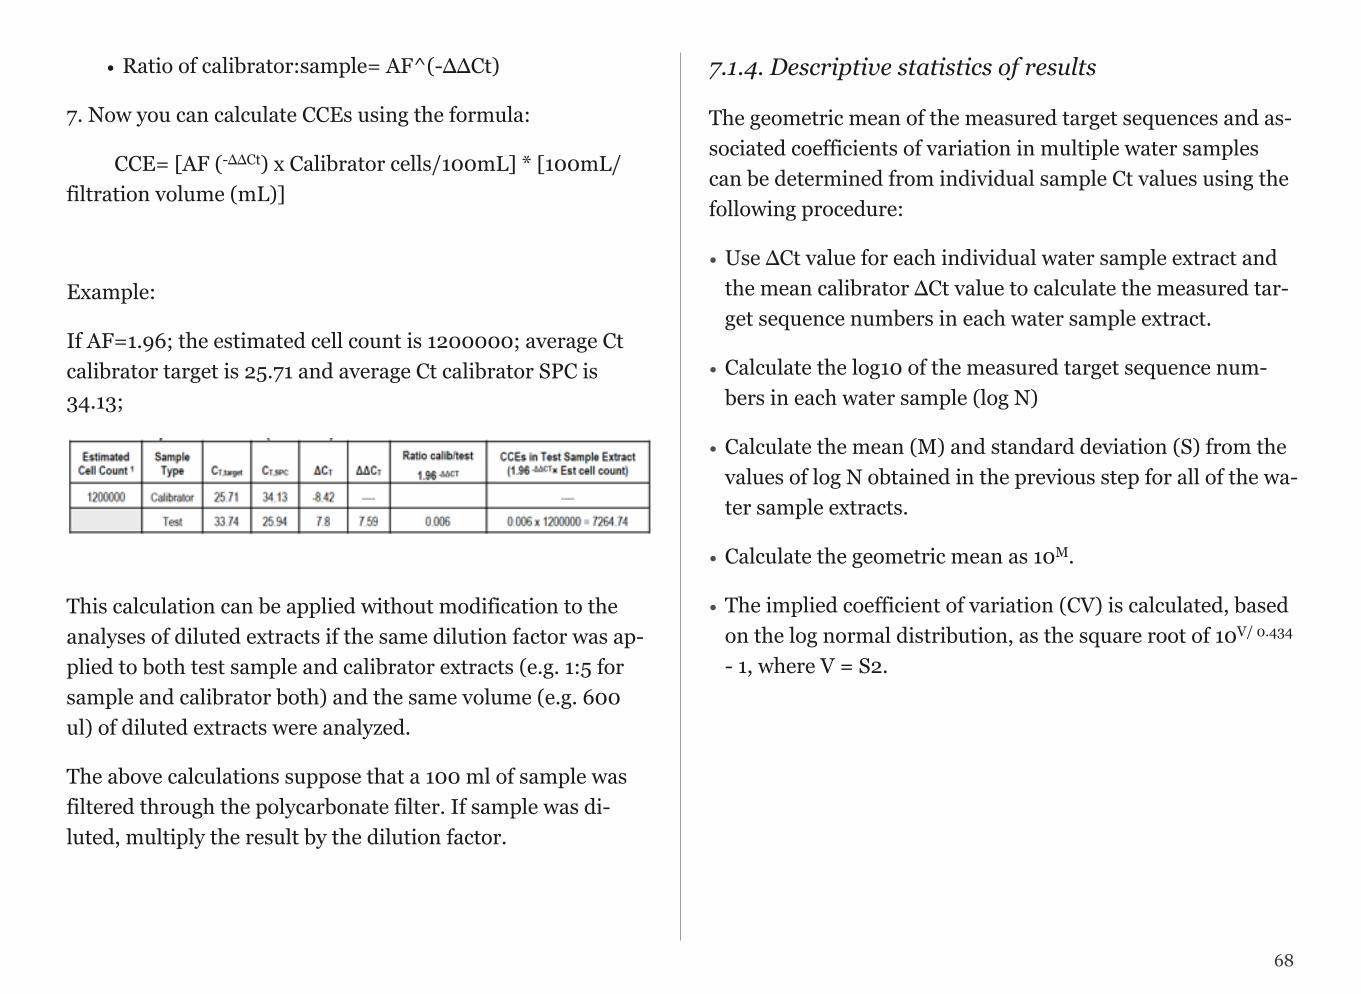
• Ratio of calibrator:sample= AF^(-ΔΔCt)
7. Now you can calculate CCEs using the formula:
CCE= [AF (-ΔΔCt) x Calibrator cells/100mL] * [100mL/filtration volume (mL)]
Example:
If AF=1.96; the estimated cell count is 1200000; average Ct calibrator target is 25.71 and average Ct calibrator SPC is 34.13;
This calculation can be applied without modification to the analyses of diluted extracts if the same dilution factor was ap-plied to both test sample and calibrator extracts (e.g. 1:5 for sample and calibrator both) and the same volume (e.g. 600 ul) of diluted extracts were analyzed.
The above calculations suppose that a 100 ml of sample was filtered through the polycarbonate filter. If sample was di-luted, multiply the result by the dilution factor.
7.1.4. Descriptive statistics of results
The geometric mean of the measured target sequences and as-sociated coefficients of variation in multiple water samples can be determined from individual sample Ct values using the following procedure:
• Use ΔCt value for each individual water sample extract and the mean calibrator ΔCt value to calculate the measured tar-get sequence numbers in each water sample extract.
• Calculate the log10 of the measured target sequence num-bers in each water sample (log N)
• Calculate the mean (M) and standard deviation (S) from the values of log N obtained in the previous step for all of the wa-ter sample extracts.
• Calculate the geometric mean as 10M.
• The implied coefficient of variation (CV) is calculated, based on the log normal distribution, as the square root of 10V/ 0.434 - 1, where V = S2.
68
7.2. Data Handling
7.2.1. Replicate pair sample agreement
As previously stated in various sections of this guidance docu-ment, it is recommended that you run each qPCR reaction in duplicate or triplicate. The suggested frequency is dependent on the type of sample you are analyzing (calibrator/standard, control or sample) and you should refer to the appropriate sec-tion for further information.
The output of your qPCR analysis will not be a concentration of the target. Rather the thermocylcer generates results in units called cycle thresholds (Ct). A cycle is the unit of time for one complete PCR reaction to occur, i.e. double stranded DNA denaturation, annealing of the probe and primers to the single stranded DNA, and the extension/formation of new dou-ble stranded DNA. Method 1611 is comprised of 45 PCR cy-cles. The concentration of target in your calibrator, control, or unknown sample is directly proportional to the cycle at which fluorescence is first detected. This is an inverse relationship, with higher concentrations of target producing lower Ct val-ues. Each log difference is approximately equal to a three Ct spread, e.g. a sample with a Ct of 27 would have approxi-mately one log greater concentration of target than a sample with a Ct value of 30. A sample with a Ct value of 45 is consid-ered a non-detection of target, i.e. no measureable fluores-cence occurred within 45 PCR cycles, or during the entire du-ration of the assay. This does not mean that there is no target present in your sample, only that it was not detectable within
the confines of the assay’s limit of detection (sensitivity). This value could represent a true negative but could also represent assay failure, e.g. inhibition, which will be discussed later in this section.
Therefore, the initial action following the completion of the as-say is to examine the returned Ct values of your replicate analyses (remember that it is recommended that you run each reaction in duplicate or triplicate). Replicate analyses, from a single DNA extract, should agree within 1.0 Ct. If there is more than a 1.o Ct spread, the assay should be repeated. Repli-cate reaction agreement is a good measure of precision and fre-quently a direct result of the analyst’s ability to pipet in a man-ner that generates reproducible results. If an analyst has con-sistent problems with replicate pair mismatches, pipetting drills may assist in improving method performance. If your lab does not have an SOP for this procedure, there are several examples available online; e.g. http://www.johnmorris.com.au/files/files/PDFs/Gilson/Verification%20Procedure%20for%20Accuracy%20and%20Precision.pdf.
If your replicate pairs are in agreement the next step in data review is to examine your positive and negative control values.
7.2.2. Negative controls
The filter blank, method blank, and no template control are considered negative controls. As such the CT value of these
69
reactions should ideally be 45, e.g. a non-detection of target (enterococci) DNA. There are some exceptions however, please refer to Table 2.1. If your values do not conform to the acceptable parameters delineated in this table you likely have sample, reagent, or instrument/equipment contamination. You should repeat the reaction. If it comes back negative you can rerun your samples without additional actions. If the con-tamination persists you will have to summarily rule or rule out sources through stepwise substitution of reagents or con-sumables prior to repeating your sample analysis. A good first place to start is to thoroughly clean your workstations and equipment.
7.2.3. Positive controls
Your positive controls are the calibrator(s) and specimen proc-essing controls (SPC). These samples have known quantities of DNA which allows you to compare the anticipated to the ac-tual result as a measure of assay performance. The returned values of your positive controls will directly influence the qual-ity of your analytical (reportable) results as they are used in the ΔΔCt calculations which translate Ct values into units of measure called calibrator cell equivalents (CCE). This is the value that will be reported as a measure of target per volume of surface water analyzed (typically 100 ml) in the same way as culture-based data are reported. The concentration of qPCR target, i.e. enterococci, is directly tied to regulatory com-pliance via epidemiological studies which linked threshold fe-
cal indicator bacteria (FIB) levels to human health outcomes (US EPA 2012).
The calibrator(s) employed as positive controls in your test runs should represent point(s) on your master standard curve (Section 4.3.6). As a general guideline, the Ct value of your daily control should not differ from the master standard curve value by more than two standard deviations (see Table 2.1). If the calibrator value does not meet acceptability criteria you should rerun the reaction. If results are acceptable you may repeat your run. If it still fails to meet criteria for acceptance, a new calibrator should be prepared. In either case all of your unknown samples in that run will need to be repeated.
The same acceptance criteria also applies to the SPC. You will remember that the SPC is a known quantity of non-target (salmon) DNA that you added to all samples (positive and negative controls as well as unknown samples) at the DNA ex-traction phase of Method 1611. Because you know the amount of DNA added, the SPC functions as a recovery control, i.e. you should get out what you put in. However, it also serves a second purpose as a sentinel for assay performance with re-spect to incomplete or frank failure to detect a DNA target.
7.2.4. Incomplete target detection
Incomplete target detection means that you are quantifying some, but not all, DNA present in your sample. This could be due to a variety of factors including: malfunction of the ther-
70
mal cycler, incorrect qPCR reaction mixture, poor DNA po-lymerase activity, or the presence of interfering substances in the sample (Råström et al. 2003). Incomplete quantification can result from competition for the oligonucleotides (primers) and Taqman™ DNA polymerase (target competition). This sce-nario can sometimes be seen in methods containing an inter-nal amplification control (IAC). In contrast to a (external) posi-tive control such as a calibrator, an IAC is a non-target DNA sequence, which is co-amplified simultaneously with the tar-get sequence, conceptually similar to the SPC. However, un-like the SPC, an IAC will produce a signal even if there is no target sequence present. While the US EPA considered the ad-dition of an IAC to Method 1611, it is currently not a compo-nent of this assay.
Experimental factors such as the length, secondary structure, and GC (guanine and cytosine) content of the amplicon or the dynamics of the reaction itself, the use of non-optimal reagent concentrations, and enzyme quality can result in efficiencies below 90%. These conditions may lead to inaccurate target quantification, referred to as underestimation. If this hap-pens, samples should be rerun with a new set of reagents. If this situation arises frequently, e.g. in surface water samples containing high amounts of algal biomass, consider analyzing samples by an alternative method (not qPCR).
7.2.5. Inhibition
Inhibition equates to assay failure resulting in underestima-tion or complete absence of target detection. qPCR inhibition is defined as a delay in target DNA amplification and can be caused by various environmental compounds present in the sample matrix. qPCR inhibitors may include humic sub-stances, polysaccharides, salts, acids, proteins/enzymes, ions, and alcohols. These inhibiting agents can interfere with qPCR by binding to and degrading the target DNA, interacting with Taq Polymerase and inhibiting its enzymatic activity, and/or preventing annealing of the probe and primers to target DNA template. The presence of PCR inhibitors in one or more of the reagents can also produce amplification efficiencies (AF) of greater than 110%. If inhibition is present, the qPCR results are considered invalid and no management decision on beach closure can be made based on the qPCR analysis.
The specimen processing control (SPC) is used to test for inhi-bition. The SPC is a known quantity of Salmon testes DNA that is added to all samples and calibrators before DNA extrac-tion (see Section 6.2.2). To identify inhibition, compare Ct val-ues of samples to those of the calibrator. Because the same quantity of SPC was added to all the samples and calibrator, the Ct values should be relatively close. If the sample Ct value is significantly higher than that of the calibrator, the sample is considered inhibited and qPCR results for that sample are con-sidered invalid. Inhibition can be quantified by taking the dif-ference between sample SPC Ct and calibrator SPC Ct. This dif-ference is referred to as an inhibition score. Ideally, the inhibi-
71

tion score should be less than 2.0 Ct. By US EPA definition, a sample is considered inhibited if the inhibition score is ≥ 3.0 Ct.
If inhibition is found, you can try to reduce it by using one of the following techniques: serial dilution of the DNA extracts, a DNA extraction or clean/concentrate kits, and/or adding of compounds that stabilize qPCR (for example, bovine serum albumin or BSA). Serial dilution of the sample DNA extract is the fastest and cheapest resolution for qPCR inhibition but may not be useful in samples where the target concentration is projected to be low because you will effectively decrease the target to below the limit of quantification. DNA extraction kits can remove inhibitors and concentrate target, an alterna-tive for samples with low target copy numbers, but they will increase the cost of, and time required, to perform the assay. Beach sanitary survey data may be used to identify ambient environmental conditions which are more likely to be associ-ated with qPCR inhibition, e.g. high turbidity or antecedent precipitation. Foreknowledge will allow you appropriately pre-treat your sample prior to the initial analysis, saving time and money. Not all inhibition is resolvable. If your site suffers from frequent, irresolvable inhibition it may not be a good can-didate for qPCR implementation (see Chapter 2).
If all quality control criteria are met and there is no evidence of target underestimation or inhibition of the qPCR assay you may report out your sample results (as CCE/100 ml using the ΔΔCt calculation method as described in Section 7.1.3).
7.3. Reporting the Results Replicate sample analyses are recommended and should be performed for each unknown surface water sample. Calculate the results as Enterococcus (large subunit ribosomal RNA gene) CCE/100 ml.
Please consider the following prior to reporting out your re-sults. While you may have good sample replicate agreement with respect to CT values, i.e. less than 1.0 Ct spread, the calcu-lated CCE/100 ml may be far apart. Remember that in calcu-lating CCE/100 ml you are looking at the relative difference between the calibrator/SPC paired analyses and your un-known sample/SPC paired analyses as a function of your stan-dard curve. The ΔΔCt calculation used to determine this rela-tionship, and your final results, may result in numerical dis-agreement of the CCEs from replicates 1 and 2. If both fall above or below your regulatory action threshold there is no op-erational difference even though the individual numbers may be relatively far apart, e.g. 140 and 900 CCE/100 ml. How-ever, if the CCE values are variable and fall on either side of the criteria thresholds, you will need to rerun the analysis un-til you get replicate pair agreement (at minimum with respect to regulatory action decision agreement) or default to an alter-native method such as a culture or predictive model estima-tion.
It may be desirable to report out a single CCE value, rather than the range of values returned from the analysis of the rep-licate pairs. If both values fall above or below the regulatory
72
threshold and they are within one order of magnitude for val-ues less than or equal to 102 and two orders of magnitude for values greater than 102 they can be arithmetically averaged. In other situations, you may use the geometric mean calcula-tion as described in Method 1611. When the qPCR Ct values are 45, non-detection, report your CCE/100ml as one half of the reciprocal of the dilution factor employed, i.e. a non-detect on a sample processed using a 1:10 dilution would be reported as 5 CCE/100 ml. Reporting data in this manner will provide consistency and the ability to conduct future statisti-cal analysis.
73
CHAPTER 8
Conclusion
Concluding remarks for those who are in-terested in implementing US EPA Method 1611. Chicago, 2010
Real-time quantitative qPCR is a rapid, laboratory-based method for enumerating fecal indicator bacteria (FIB) in rec-reational surface waters and has been included, subject to site-specific suitability, in the recently released revised na-tional Recreational Water Quality Criteria (USEPA 2012). This method shows promise for detecting FIB as part of rou-tine recreational water quality monitoring programs, a func-tion of many certified water and local public health laboratories. Before these methods can be approved for use (in lieu of or in addition to culture-based methods) feasibility studies, validation, and side-by-side comparative testing must take place. This will ensure accurate result reporting and also provide information on implementation considerations at the individual laboratory level including, but not limited to: physi-cal space requirements, appropriate indicator (target), ap-proved product sourcing, costs, staffing training needs, turn-around-time, and the ability of the method to accurately char-acterize water quality.
This guidance manual has been assembled to aid those inter-ested in implementation through the steps of US EPA Method 1611 based on the personal experiences of the Directors and staff of the Michigan State University Center for Water Sci-ences and City of Racine Health Department Laboratory. In 2011 the City of Racine became the first entity nationally to re-ceive US EPA approval for regulatory monitoring of recrea-tional water using rapid molecular methods. This came about
after several years of method implementation and compara-tive culture/qPCR studies.
What is the way forward for broader implementation from our perspective? The performance of site-specific culture/qPCR comparative studies, an intimate knowledge of your beach via the use of the US EPA beach sanitary survey tool, predictive modeling (e.g. US EPA Virtual Beach), or quantitative micro-bial risk assessment. These tools will not only help end user laboratories characterize the beach environment and potential human health hazards but also interpret the results of analyti-cal method correlation studies, provide insight on the relation-ship between inhibition and ambient conditions and help make sense of false positive/negative analytical results in the presence of environmental condition triggers.
Additional information on troubleshooting and result interpre-tation, as well as guidance for laboratories new to these meth-ods, is being developed. In the future, laboratory certification and proficiency testing programs will be necessary for stan-dardization and laboratory examination officers will be trained to evaluate molecular laboratories for consistency and accuracy in result reporting. Commercial calibration materi-als will soon be available and should reduce assay variability within and between laboratories. This is a living document which will be updated to reflect the availability of these and
75

other method-related support materials as they become avail-able.
This project was funded through a grant from Great Lakes Res-toration Initiative with support from the Michigan State Uni-versity, Center for Water Sciences.
76
CHAPTER 9
Strategies for Saving Time During qPCR Analysis
Once the user has become proficient in run-ning the qPCR as outlined in the laboratory protocols the following time saving tips can be implemented to help streamline the qPCR process and give results in less time.
• Always complete all autoclaving at least a day before the analysis.
• Set up all working stations (if not permanent in the lab; i.e. the membrane filtration workstation) ahead of time and dou-ble check all equipment and supplies in each workstation.
• When filtering water samples, some of them may take longer time to be filtered than others. Using multi channeled mani-folds can save a lot of filtering time. When using multi-channel manifolds, you do not always have to wait for all samples to pass completely through the filters. If one sample has passed though its filter completely, than the filter can be removed from its respective funnel by turning off the mani-fold first. Never leave the filter unattended or for long peri-ods of time while filtering.
• All labeling can be done anytime in advance as long as the labelled items (tubes, petri dishes etc.) are stored in an area where there are not likely to be contaminated (DNA crude extraction tubes and PCR tubes can be stored in racks, in their respective workstations or SmartCycler tubes).
• Prepare all controls ahead of time. The 1X calibrators can be prepared up to a day in advance and stored at 4 °C.
• Prepare the tubes containing method blanks with AE buffer ahead of time. Renew these stocks if a new bottle of AE buffer has been opened.
• Crude DNA extraction tubes can be labeled and assembled in advance and stored in a clean area to avoid possible cross-contamination.
• If using a single tube bead beater, complete bead beating in two samples. Once bead beating is completed, place these two tubes into the microcentrifuge and place the next sam-ple into the bead beater. When the centrifugation is com-pleted, remove the tubes and place them in a test tube rack. From now on, as the extracting and centrifuging continue for the next series of samples, you can use the time to trans-fer the extracted supernatant to the labeled 1X extract 1.5 ml microcentrifuge tube.
• If you are using DNA extraction kits, remember that they may have steps that need to be prepared in advance (e.g., make sure to turn on the water baths ahead of time, or add prepare the working buffer solutions according to the manu-facturer's instructions).
• qPCR master mix can be prepared ahead of time on the day it is going to be used, while waiting for the samples.
• You can also set up the qPCR conditions on the computer while waiting for the samples.
78

CHAPTER 10
Glossary
This chapter describes the terms used throughout this manual.
Definitions
Absolute quantification: Absolute quantification describes a real-time PCR experiment in which samples of known quan-tity are serially diluted and then amplified to generate a stan-dard curve. Unknown samples are then quantified by compari-son with this curve.
Amplification factor: The amplification factor (AF) is a measure of the average efficiency at which the DNA target or SPC sequences are copied and detected by their respective primer and probe assays during each cycle of the qPCR reac-tion. It is used in comparative cycle threshold calculation methods like ddCT. AF values can range from 1 (0 % of se-quences copied and detected) to 2 (100 % of sequences copied and detected) and are calculated from the standard curve.
Amplification plot: The plot of cycle numbers versus fluo-rescence signal which correlates with the initial amount of tar-get nucleic acid during the exponential phase of PCR.
Baseline: Baseline is the initial cycles of PCR during which there is a little change in fluorescence signal. It is set to distin-guish relevant amplification signal from the background and by default, usually, q PCR instrument software automatically sets the threshold at 10 times the standard deviation of the fluorescence value of the baseline. However, the positioning of the threshold can be set at any point in the exponential phase
of PCR. When modified manually, it is recommended that the baseline should eliminate the “noise” of the reaction due to the chemistry occurring at the beginning of the reaction. The baseline may cover the initial cycles before the actual amplifi-cation but it should not be strong enough to cover the signal of the actual amplification. Comparing the Ct values of same assays of different runs would be useful to decide for setting up the baseline.
Calibrator: A single reference sample used as the basis for relative-fold increase during the PCR.
Comparative quantification algorithms
ΔCt:
This is comparative quantification in its most basic form. A Ct is obtained for expression of the gene of interest from both a test and calibrator sample, and the difference between them is the ΔCt. The fold difference is then simply 2 to the power of ΔCt. Fold difference = 2ΔCt This basic method is inadequate because it does not control for differences in sample quantity, sample quality, or reaction efficiency.
ΔΔCt:
The ΔΔCt method is another technique that compares results from experimental samples with both a calibrator (e.g., un-treated or wild-type sample) and a normalizer (e.g., reference DNA). With this method, Cts for the gene of interest in both the test sample(s) and calibrator sample are now adjusted in
80
relation to a normalizer gene Ct from the same two samples. The resulting ΔΔCt value is incorporated to determine the fold difference in expression.
Correlation coefficient (R2): The square of a correlation coefficient of regression reflects the linearity of the standard curve, therefore indicates how precisely the line fits the data. The R2 in qPCR analysis should be greater than 0.99, indicat-ing that the standard curve was constructed precisely.
FAM: (6-carboxy fluorescein) Most commonly used quencher at the 5’ end of TaqMan® probe.
Log-dilution: Serial dilutions in powers of 10.
No template control: includes all the qPCR reagents except the template. No product should be synthesize at the end of the reaction.
Quencher: the molecule that absorbs the emission of fluores-cent reporter when in close vicinity.
Real-time PCR: The continuous collection of fluorescent sig-nal from polymerase chain reaction throughout cycles.
Relative quantification: Relative quantification describes a real-time PCR experiment in which the expression of a gene of interest in one sample (i.e., treated) is compared to expres-sion of the same gene in another sample (i.e., untreated). The results are expressed as fold change (increase or decrease) in expression of the treated in relation to the untreated. A nor-
malizer gene (such as β-actin) is used as a control for experi-mental variability in this type of quantification.
Reporter dye: The fluorescent dye used to monitor ampli-con accumulation. This can be attached to specific probe.
Slope (Efficiency): The slope is a measure of reaction effi-ciency. The efficiency should be as close to 100% as possible, which is equivalent to a slope of -3.32.
The efficiency is calculated from the formula:
E = 10(-1/slope)-1
Standard curve: Obtained by plotting Ct values against log-transformed concentrations of serial ten-fold dilutions of the target nucleic acid. Standard curve is obtained for qPCR and the range of concentrations included should cover the ex-pected unknown concentrations range.
TAMRA: (6-carboxy tetra methyl rhodamine): Most com-monly used quencher at the 3’ end of TaqMan ®probe.
TaqMan® probe: A dual-labeled specific hydrolysis probe designed to bind to a target sequence with a fluorescent re-porter dye at one end and a quencher at the other.
Threshold cycle (Ct) : The threshold cycle (Ct) is the cycle number at which the fluorescence generated within a reaction crosses the threshold. A threshold is usually 10X the standard deviation of reporter signal for early PCR cycles (baseline). Therefore it is useful for calculations. The Ct is negatively cor-
81
ralled to the logarithm of the initial copy number. As the tem-plate concentration decreases, the cycle number increases.
Unknown: A sample containing an unknown quantity of tem-plate. This is the sample of interest whose quantity is being de-termined.
Y-intercept (Sensitivity): The y-intercept is less reproduci-ble than the slope but gives some indication of the sensitivity of the assay. The y-intercept corresponds to the theoretical limit of detection of the reaction, or the Ct value expected if the lowest copy number of target molecules denoted on the x-axis gave rise to statistically significant amplification. The y-intercept value may be useful for comparing different amplifi-cation systems and targets.
82
ReferencesDorak MT 2006. Real-Time PCR (Advanced Methods Series). Taylor and Francis, Oxford, UK (ISBN 0-4153-7734-X).
Essentials of Real Time PCR by Applied Biosystems
http://www3.appliedbiosystems.com/cms/groups/mcb_marketing/documents/generaldocuments/cms_042485.pdf
Kinzelman, J., Anan’eva, T., Lavender, J. 2010. QPCR for Newbies E. coli in Water by Scorpion® Quantitative Po-lymerase Chain Reaction Assay.
Kinzelman, J. and Leittl, M. 2012. Validity of Composite Sam-pling for Enumerating E. coli from Recreational Waters by Mo-lecular Methods (qPCR) (In) Significance of Faecal Indicators in Water – A Global Perspective, Kay and Fricker (Eds). Royal Society of Chemistry, London. 188p. ©2012
Mudd, D., Anan’eva, T. and Kinzelman, J. 2012. Examination of Di-urnal Variation a Non-Sewage Impacted Beach via qPCR and Cul-ture Based Methods. J. Environ. Protection. 3(10):1310-1317. doi: 10.4236/jep.2012.310149.
Quality Assurance/Quality Control Guidance for Laboratories Performing PCR Analyses on Environmental Samples by USEPA, 2004
USEPA Method 1611: Enterococci in Water by TaqMan Quantitative Polymerase Chain Reaction (qPCR) Assay, April, 2012.
http://www.youtube.com/watch?v=RSVenfEUioI
http://www.youtube.com/watch?v=DkT6XHWne6E
http://users.ugent.be/~avierstr/index.html
http://www.invitrogen.com/site/us/en/home/Products-and-Services/Applications/PCR/real-time-pcr/qpcr-education/ask-taqman/ask-taqman-video-gallery.html
http://www3.appliedbiosystems.com/cms/groups/mcb_marketing/documents/generaldocuments/cms_042485.pdf
http://www3.appliedbiosystems.com/cms/groups/mcb_marketing/documents/generaldocuments/cms_042485.pdf
http://www3.appliedbiosystems.com/cms/groups/mcb_marketing/documents/generaldocuments/cms_042485.pdf
http://www3.appliedbiosystems.com/cms/groups/mcb_marketing/documents/generaldocuments/cms_042485.pdf
http://www3.appliedbiosystems.com/cms/groups/mcb_marketing/documents/generaldocuments/cms_042485.pdf

84

85