A Global and Targeted Proteomic Investigation of ...eprints.maynoothuniversity.ie/6696/1/Rebecca...
411
A Global and Targeted Proteomic Investigation of Aspergillus fumigatus Rebecca Owens BSc Thesis submitted to the National University of Ireland for the degree of Doctor of Philosophy September 2012 Supervisor: Head of Department: Prof. Sean Doyle, Prof. Paul Moynagh Biotechnology Laboratory, Department of Biology, National University of Ireland Maynooth Co. Kildare.
Transcript of A Global and Targeted Proteomic Investigation of ...eprints.maynoothuniversity.ie/6696/1/Rebecca...

A Global and Targeted Proteomic
Investigation of Aspergillus fumigatus
Rebecca Owens BSc
Thesis submitted to the
National University of Ireland
for the degree of
Doctor of Philosophy
September 2012
Supervisor: Head of Department:
Prof. Sean Doyle, Prof. Paul Moynagh
Biotechnology Laboratory,
Department of Biology,
National University of Ireland Maynooth
Co. Kildare.

i
Table of Contents
Declaration of Authorship……………………………………………………………….x
Acknowledgements…………………………………………………………………..…xi
Publications and Presentations…………………………………………………………xii
Abbreviations………………………………………………………………………….xiii
Summary………………………………………………………………………………xix
Chapter 1. Introduction ............................................................. 1
1.1 General Characteristics of Aspergillus fumigatus ........................................ 1
1.2 Fungal Systems Biology ............................................................................. 4
1.3 Functional and Comparative Proteomics in Aspergilli ................................. 6
1.4 Pathogenesis of A. fumigatus .................................................................... 11
1.4.1 A. fumigatus-related disease ...................................................................... 11
1.4.2 Detection and diagnostic strategies for IA ................................................. 15
1.5 Anti-fungal therapy for IA ........................................................................ 19
1.6 Factors contributing to A. fumigatus pathogenicity .................................... 22
1.7 Secondary Metabolism.............................................................................. 32
1.7.1 Identification of Secondary Metabolite Clusters ........................................ 32
1.7.2 Secondary Metabolite Cluster Regulation ................................................. 35
1.8 Gliotoxin .................................................................................................. 39
1.8.1 General Information .................................................................................. 39
1.8.2 Gliotoxin Biosynthesis .............................................................................. 41
1.8.3 Gliotoxin: Effects on host cells ................................................................. 48
1.9 Thesis Rationale and Objectives ............................................................... 59

ii
Chapter 2. Materials and Methods ......................................... 61
2.1 Materials................................................................................................... 61
2.1.1 Solutions for pH Adjustment..................................................................... 61
2.1.1.1 5 M Hydrochloric Acid (HCl) ................................................................... 61
2.1.1.2 5 M Sodium Hydroxide (NaOH) ............................................................... 61
2.1.2 SDS-PAGE and Western Blotting Reagents .............................................. 61
2.1.2.1 10 % (w/v) Sodium Dodecyl Sulfate (SDS) .............................................. 61
2.1.2.2 1.5 M Tris-HCl pH 8.3 .............................................................................. 61
2.1.2.3 0.5 M Tris-HCl pH 6.8 .............................................................................. 62
2.1.2.4 10% (w/v) Ammonium Persulfate (APS) .................................................. 62
2.1.2.5 1% (w/v) Bromophenol blue ..................................................................... 62
2.1.2.6 0.5% (w/v) Bromophenol blue .................................................................. 62
2.1.2.7 5 X Solubilisation buffer ........................................................................... 62
2.1.2.8 5 X SDS Electrode running buffer ............................................................ 63
2.1.2.9 1 X SDS Electrode running buffer ............................................................ 63
2.1.2.10 Coomassie® Blue Stain Solution .............................................................. 63
2.1.2.11 Destain Solution ....................................................................................... 63
2.1.2.12 Gel Fixing Solution for Colloidal Coomassie® Stain ................................ 63
2.1.2.13 Incubation Buffer for Colloidal Coomassie® Stain ................................... 63
2.1.2.14 Towbin Electrotransfer Buffer for Semi-Dry Transfer ............................... 64
2.1.2.15 Wet Transfer Buffer .................................................................................. 64
2.1.2.16 Blocking Solution ..................................................................................... 64
2.1.2.17 BSA Blocking Solution............................................................................. 64
2.1.2.18 Antibody Buffer........................................................................................ 64
2.1.2.19 BSA Antibody Buffer ............................................................................... 64
2.1.2.20 Phosphate Buffered Saline (PBS) .............................................................. 64

iii
2.1.2.21 Phosphate Buffered Saline/ Tween-20 (PBST 0.05%) ............................... 65
2.1.2.22 DAB Substrate Buffer ............................................................................... 65
2.1.2.23 Developing Solution ................................................................................. 65
2.1.2.24 Fixing Solution ......................................................................................... 65
2.1.2.25 8M Urea ................................................................................................... 65
2.1.2.26 100 mM Borate Buffer pH 7.0 .................................................................. 65
2.1.2.27 2 mM Borate Buffer pH 8.0 ...................................................................... 66
2.1.3 Mass Spectrometry Reagents .................................................................... 66
2.1.3.1 100 mM Ammonium bicarbonate (NH4HCO3) .......................................... 66
2.1.3.2 50 mM Ammonium bicarbonate (NH4HCO3) ............................................ 66
2.1.3.3 10 mM Ammonium bicarbonate(NH4HCO3) ............................................. 66
2.1.3.4 1 M Dithiotreitol (DTT) ............................................................................ 66
2.1.3.5 1 M Iodoacetamide ................................................................................... 66
2.1.3.6 Whole Protein Lysate Fungal Extraction Buffer ........................................ 67
2.1.3.7 Trypsin diluent ......................................................................................... 67
2.1.3.8 0.1 % (v/v) Formic Acid ........................................................................... 67
2.1.3.9 10 % (v/v) Methanol in 0.1% (v/v) Formic Acid ....................................... 67
2.1.3.10 0.1 % (v/v) Trifluoroacetic acid (TFA) ..................................................... 67
2.1.3.11 Matrix (α-cyano-4-hydroxycinnamic acid) (4-HCCA) .............................. 67
2.1.4 Reverse Phase-High Performance Liquid Chromatography (RP-HPLC)
Reagents ................................................................................................................. 68
2.1.4.1 Solvent A: 0.1 % (v/v) Trifluoroacetic Acid (TFA) in HPLC grade water . 68
2.1.4.2 Solvent B: 0.1 % (v/v) Trifluoroacetic Acid (TFA) in HPLC grade
Acetonitrile ................................................................................................................. 68
2.1.5 Aspergillus Media and Reagents ............................................................... 68
2.1.5.1 Aspergillus Trace Elements....................................................................... 68

iv
2.1.5.2 50 X Aspergillus Salt Solution .................................................................. 68
2.1.5.3 100 X Ammonium Tartrate ....................................................................... 69
2.1.5.4 0.3 M L-glutamine .................................................................................... 69
2.1.5.5 Aspergillus Minimal Media (AMM) ......................................................... 69
2.1.5.6 Aspergillus Minimal Media (AMM) Agar ................................................. 69
2.1.5.7 Malt Extract Agar (MEA) ......................................................................... 70
2.1.5.8 Sabouraud Dextrose Broth ........................................................................ 70
2.1.5.9 Czapek-Dox Broth .................................................................................... 70
2.1.5.10 Czapek-Dox Agar ..................................................................................... 70
2.1.5.11 YES broth ................................................................................................. 70
2.1.5.12 RPMI media ............................................................................................. 71
2.1.5.13 Phosphate Buffered Saline/ Tween-20 (PBST 0.1% (v/v)) ........................ 71
2.1.5.14 100 mM Phenylmethylsulfonyl fluoride (PMSF)....................................... 71
2.1.5.15 Pepstatin A (1 mg/ml) ............................................................................... 71
2.1.5.16 1M DTT ................................................................................................... 71
2.1.5.17 Aspergillus lysis buffer; reducing .............................................................. 71
2.1.5.18 Aspergillus lysis buffer; non-reducing ....................................................... 72
2.1.5.19 100 % (w/v) TCA ..................................................................................... 72
2.1.5.20 10 % (w/v) TCA ....................................................................................... 72
2.1.5.21 Plate assays ............................................................................................... 72
2.1.5.22 5’-Iodoacetamidofluorescein (IAF) (20 mg/ml)......................................... 73
2.1.5.23 5’-IAF (3 mg/ml) ...................................................................................... 73
2.1.5.24 500 mM Sodium Borohydride ................................................................... 73
2.1.6 2D-PAGE reagents ................................................................................... 74
2.1.6.1 2M DTT ................................................................................................... 74
2.1.6.2 2D-PAGE Isoelectric Focusing Buffer (IEF) ............................................. 74
v
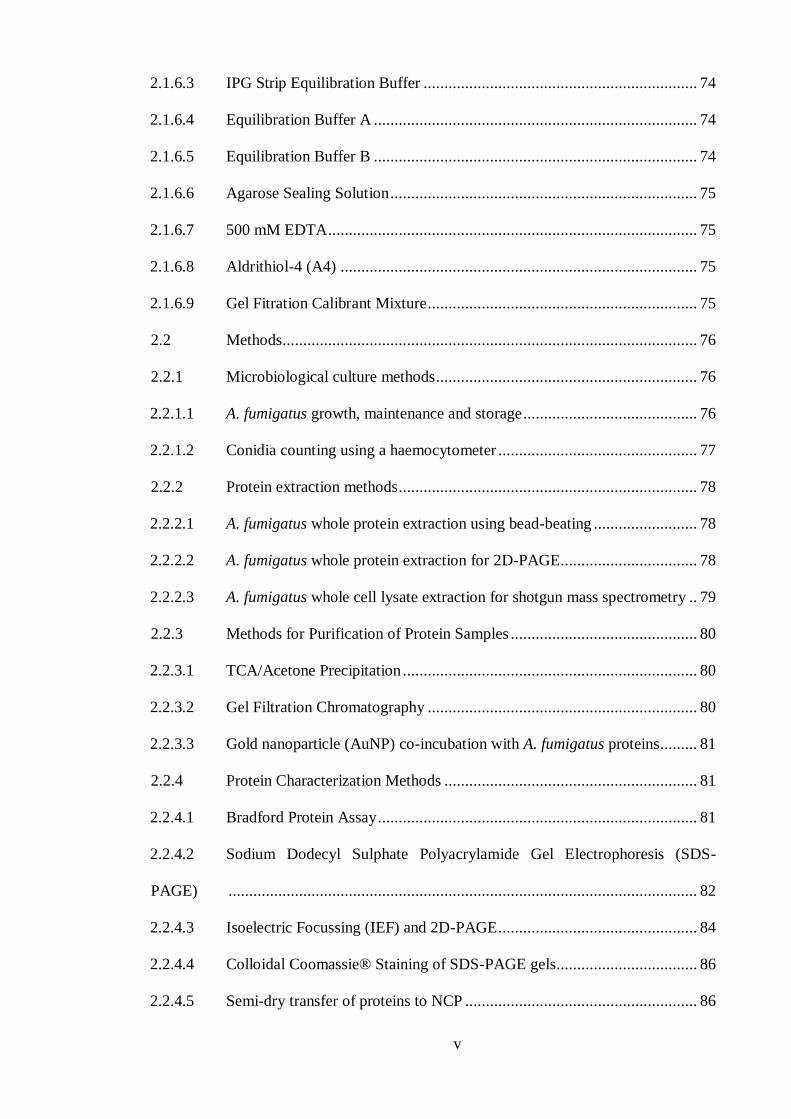
2.1.6.3 IPG Strip Equilibration Buffer .................................................................. 74
2.1.6.4 Equilibration Buffer A .............................................................................. 74
2.1.6.5 Equilibration Buffer B .............................................................................. 74
2.1.6.6 Agarose Sealing Solution .......................................................................... 75
2.1.6.7 500 mM EDTA ......................................................................................... 75
2.1.6.8 Aldrithiol-4 (A4) ...................................................................................... 75
2.1.6.9 Gel Fitration Calibrant Mixture ................................................................. 75
2.2 Methods .................................................................................................... 76
2.2.1 Microbiological culture methods ............................................................... 76
2.2.1.1 A. fumigatus growth, maintenance and storage .......................................... 76
2.2.1.2 Conidia counting using a haemocytometer ................................................ 77
2.2.2 Protein extraction methods ........................................................................ 78
2.2.2.1 A. fumigatus whole protein extraction using bead-beating ......................... 78
2.2.2.2 A. fumigatus whole protein extraction for 2D-PAGE ................................. 78
2.2.2.3 A. fumigatus whole cell lysate extraction for shotgun mass spectrometry .. 79
2.2.3 Methods for Purification of Protein Samples ............................................. 80
2.2.3.1 TCA/Acetone Precipitation ....................................................................... 80
2.2.3.2 Gel Filtration Chromatography ................................................................. 80
2.2.3.3 Gold nanoparticle (AuNP) co-incubation with A. fumigatus proteins ......... 81
2.2.4 Protein Characterization Methods ............................................................. 81
2.2.4.1 Bradford Protein Assay ............................................................................. 81
2.2.4.2 Sodium Dodecyl Sulphate Polyacrylamide Gel Electrophoresis (SDS-
PAGE) ................................................................................................................. 82
2.2.4.3 Isoelectric Focussing (IEF) and 2D-PAGE ................................................ 84
2.2.4.4 Colloidal Coomassie® Staining of SDS-PAGE gels .................................. 86
2.2.4.5 Semi-dry transfer of proteins to NCP ........................................................ 86

vi
2.2.4.6 Wet transfer of proteins to NCP ................................................................ 86
2.2.4.7 Western Blot Analysis .............................................................................. 87
2.2.4.8 Determination of Relative Immunoreactivity of A. fumigatus proteins ...... 88
2.2.4.9 Dialysis of protein samples ....................................................................... 88
2.2.4.10 Analysis of Supernatant Proteins from A. fumigatus .................................. 88
2.2.4.11 Organic Extraction of A. fumigatus Culture Supernatants .......................... 89
2.2.4.12 Rotary evaporation of Organic Extraction Samples ................................... 89
2.2.5 Comparative Metabolite Profile Analysis by Reverse Phase - High
Performance Liquid Chromatograhy (RP-HPLC) ........................................................ 90
2.2.5.1 RP-HPLC Analysis ................................................................................... 90
2.2.5.2 5’-IAF Labelling of Sulphydral groups of A. fumigatus metabolites .......... 91
2.2.5.3 Preparation of A. fumigatus Mycelial Lysates for Intracellular Metabolite
Investigation ............................................................................................................... 92
2.2.5.4 Determination of Sulphydral Groups in A. fumigatus Mycelial Lysates ..... 92
2.2.6 Mass Spectrometry Methods ..................................................................... 93
2.2.6.1 In-gel Digestion of SDS-PAGE Samples .................................................. 93
2.2.6.2 In-solution Digestion of Protein Samples .................................................. 94
2.2.6.3 LC-MS/MS Analysis of Peptide Mixtures ................................................. 94
2.2.6.4 LC-MS/MS Analysis of A. fumigatus Metabolites ..................................... 95
2.2.7 MALDI-ToF analysis ............................................................................... 95
2.2.7.1 Database Search........................................................................................ 96
2.2.7.2 Bioinformatic Analysis of Identified Proteins ........................................... 96
Chapter 3 .................................................................................. 98
3.1 Introduction .............................................................................................. 98
3.2 Results .................................................................................................... 103

vii
3.2.1 Identification of 370 proteins from A. fumigatus mycelia using shotgun mass
spectrometry ............................................................................................................. 103
3.2.2 Identification of A. fumigatus secondary metabolite cluster expression at
protein level .............................................................................................................. 109
3.2.3 Identification of 173 proteins from A. fumigatus mycelia using shotgun mass
spectrometry coupled with gel filtration pre-fractionation ......................................... 114
3.2.4 Identification of A. fumigatus proteins adsorbing to gold nanoparticles ... 118
3.2.5 Identification of 42 proteins from A. fumigatus supernatants using 1D-SDS
PAGE and shotgun mass spectrometry ...................................................................... 125
3.3 Discussion .............................................................................................. 132
Chapter 4 .................................................................................152
4.1 Introduction ............................................................................................ 152
4.2 Results .................................................................................................... 158
4.2.1 Detection of immunoreactivity to A. fumigatus mycelia proteins in normal
human sera ............................................................................................................... 158
4.2.2 2D-PAGE of A. fumigatus ATCC26933 and Western Blot analysis using
normal human sera .................................................................................................... 160
4.2.3 Mass spectrometry analysis of immunoreactive proteins ......................... 164
4.2.4 Optimised 2D-PAGE of A. fumigatus ATCC26933 and Western Blot
analysis using normal human sera ............................................................................. 166
4.2.5 Mass spectrometry analysis of immunoreactive proteins ......................... 170
4.2.6 Putative location of immunogenic region on HexA protein ..................... 174
4.3 Discussion .............................................................................................. 176
Chapter 5 .................................................................................191

viii
5.1 Introduction ............................................................................................ 191
5.2 Results .................................................................................................... 195
5.2.1 Phenotypic analysis of A. fumigatus ATCC26933 and ΔgliK in response to a
combination of gliotoxin and H2O2 ........................................................................... 195
5.2.2 Comparative 2D-PAGE analysis of A. fumigatus ATCC26933 following
exposure to a combination of H2O2 and gliotoxin ...................................................... 200
5.2.3 Identification of differentially expressed proteins by LC-MS/MS............ 207
5.2.4 Comparative 2D-PAGE analysis of A. fumigatus ΔgliK following exposure
to gliotoxin ............................................................................................................... 214
5.2.5 LC-MS/MS identification of differentially expressed proteins................. 217
5.3 Discussion .............................................................................................. 222
Chapter 6 .................................................................................254
6.1 Introduction ............................................................................................ 254
6.2 Results .................................................................................................... 261
6.2.1 Identification of Optimal Culture Conditions for Gliotoxin Production by A.
fumigatus ATCC26933 ............................................................................................. 261
6.2.2 Comparative analysis of A. fumigatus ATCC26933, wild-type and ΔgliK,
extracellular metabolites ........................................................................................... 263
6.2.2.1 RP-HPLC analysis of organic extracts from A. fumigatus ATCC26933,
wild-type and ΔgliK, culture supernatants ................................................................. 263
6.2.2.2 Reduction and alkylation of organic extracts from A. fumigatus, wild-type
and ΔgliK, culture supernatants ................................................................................. 265
6.2.2.3 Analysis of A. fumigatus ATCC26933, wild-type and ΔgliK, metabolite
profiles by LC-MS/MS ............................................................................................. 269

ix
6.2.3 Comparative analysis of A. fumigatus ATCC26933, wild-type and ΔgliK,
intracellular metabolites ............................................................................................ 274
6.2.3.1 Analysis of intracellular A. fumigatus ATCC26933, wild-type and ΔgliK,
metabolite profiles by RP-HPLC ............................................................................... 274
6.2.3.2 Quantitation of free sulphydrals present in lysates from A. fumigatus, wild-
type and ΔgliK, mycelia ............................................................................................ 276
6.2.3.3 Alkylation of lysates from A. fumigatus, wild-type and ΔgliK, mycelia ... 277
6.2.3.4 LC-MS/MS analysis of 5’-IAF labelled intracellular metabolite .............. 280
6.3 Discussion .............................................................................................. 286
Chapter 7: Discussion .............................................................300
7.1 Overview ................................................................................................ 300
7.2 Global Proteomic and Immunoproteomic Characterisation of A. fumigatus ...
............................................................................................................... 301
7.3 Gliotoxin-associated mechanisms in A. fumigatus ................................... 307
Chapter 8: Bibliography .........................................................319
Chapter 9: AppendixI .............................................................360

x
Declaration of Authorship
This thesis has not previously been submitted in whole or in part to this or any
other University for any other degree. This thesis is the sole work of the author, with the
exception of the generation of the A. fumigatus gliK mutant, which was generated by
Dr. Lorna Gallagher.
Rebecca Owens BSc.

xi
Acknowledgements
I would like to sincerely thank my supervisor Prof. Sean Doyle for the unlimited
support, guidance and encouragement provided throughout the course of my PhD. I
have really appreciated all of your time and help over the years. I would also like to
thank Drs Luke O’ Shaughnessy and Stephen Carberry for answering endless questions
with great patience. Additionally, sincere thanks to Caroline Batchelor for assistance
and training on the Ion Trap (LC-MS), and to Michelle and all of the technicians for
your help along the way. I would like to acknowledge and thank the Irish Research
Council (IRCSET), Kildare County Council and the biology department, for funding
this PhD and providing this opportunity. In addition, I would like to thank the HEA for
providing equipment funding for the HPLC and LC-MS, both of which facilitated this
work.
To all the members of the Biotech lab, I couldn’t have asked for a better place to spend
the last few years. Grainne, Cindy, Carol, Lorna, Karen, Natasha, Lara, Stephen H and
the honorary members, John and Karen T, thank you all for the help, chats and the ‘odd’
tea break. Also thank you, to all the students in the lab over the years. Thanks also to
everyone in the biology department for helping out with advice, reagents or just a chat
when needed.
A special thanks to my better half, Ro, I would not have come through this without you.
For your unwavering support, patience and belief in me, I am eternally grateful. Thank
you for always knowing how to pick me up, make me laugh, and encourage me to keep
going when it got tough. (I promise I won’t do another thesis)
I would like to thank my sisters, Liz (and brother-in-law Denis), Kelley and Hannah.
Thank you for always being there (or a phonecall, text or skype away) when I needed a
break and a chat. To my gorgeous nieces and nephew, Ash, Cait, Shay and Molly, I
hope at least one of you thinks science is ‘cool’ now because of your aunty.
Finally, I wish to thank my parents, who have always believed in me and made me the
person I am today. Mum, your encouragement and support have always made me strive
to do my best and I could not have started this journey without you. I miss you every
day and I hope I have made you proud. Dad, I can never thank you enough for being so
strong and keeping us all going. I dedicate this thesis to you both.

xii
Publications and Presentations
Research Publications:
Gallagher, L., Owens, R.A., O’ Keeffe, G., Dolan, S.K., Schrettl, M., Kavanagh, K.,
Jones, G. and Doyle, S. (2012). The Aspergillus fumigatus Protein GliK Protects
Against Oxidative Stress and is Essential for Gliotoxin Biosynthesis. Eukaryotic Cell,
11(10): 1226-1238.
Owens, R.A., O’ Keeffe, G., Jones, G. and Doyle, S. (2012). Gliotoxin: Defender and
Attacker. In preparation.
Owens, R.A., Moore, M. and Doyle, S. (2012). Large-scale proteomic and
immunoproteomic analysis of Aspergillus fumigatus. In preparation.
Owens, R.A., O’ Keeffe, G., and Doyle, S. (2013). Virulence of Human Fungal
Pathogens: Aspergillus. In Human Pathogenic Fungi: New technologies and new
insights. D. Sullivan and G. Moran, ed. (Horizon Scientific Press). In preparation.
Oral Presentations:
Large-scale investigation of the Aspergillus fumigatus proteome and identification of
novel immunoreactive antigens in mycelia. Irish Fungal Society Inaugural Meeting.
Trinity College Dublin 16-17th
June 2011. Awarded 1st prize.
Proteomic and Immunoproteomic investigation of Aspergillus fumigatus. British Society
for Medical Mycology Annual Meeting. Glasgow, Scotland 17-19th April 2011.

xiii
Poster Presentations:
Mechanisms involved in gliotoxin relief of oxidative stress in A. fumigatus. Biology
Research Day. NUI Maynooth, 20th July 2012.
Mechanisms involved in gliotoxin relief of oxidative stress in A. fumigatus. Irish
Fungal Society Meeting. Belfast City Hospital, 21-22th June 2012.

xiv
Abbreviations
2D-PAGE Two-dimensional polyacrylamide gel electrophoresis
2PF 2-Pentylfuran
4-HCCA α-cyano-4-hydroxycinnamic acid
5'-IAF 5'-iodoacetamidofluorescein
A4 Aldrithiol-4
aa-tRNA Aminoacyl-tRNA
ABC ATP-binding cassette
ABPA Allergic bronchopulmonary aspergillosis
AICAR 5-aminoimidazole-4-carboxamide ribonucleotide
AIF Apoptosis-inducing factor
AmB Amphotericin B
AMM Aspergillus minimal media
APS Ammonium persulfate
AspGD Aspergillus Genome Database
AuNP Gold nanoparticle
BAL Bronchoalveolar lavage
bFGF Basic fibroblast growth factor
bmGT Bis-methylated gliotoxin
BSA Bovine serum albumin
bZIP Basic leucine zipper
CADRE Central Aspergillus Data Repository
CF Cystic fibrosis
CFTR Cystic fibrosis transmembrane conductance regulator
CGD Chronic granulomatous disease
COPD Chronic obstructive pulmonary disease
CSF Colony stimulating factor

xv
CTL Cytotoxic T lymphocytes
DAB 3, 3’-diaminobenzidine tetrachloride hydrate
DC Dendritic cell
DIC Differential interference contrast
DMAT Dimethylallyl tryptophan synthetases
DMSO Dimethyl sulfoxide
DNA Deoxyribonucleic acid
DTT Dithiothreitol
EF Elongation factor
EGT Ergothioneine
EIA Enzyme-immunoassay
ELISA Enzyme-linked immunosorbent assay
EORTC/MSG European Organisation for Research and Treatment of
Cancer/Invasive Fungal Infections Cooperative Group and the
National Institute of Allergy and Infectious Diseases Mycoses
Study Group
ER Endoplasmic reticulum
ERG-AF Acetamidofluorescein ergothioneine
ESI Electrospray ionisation
ETC Electron transport chain
ETP Epipolythiodioxopiperazine
ETT Ergothioneine transporter
FDA Food and drug administration
FunCat Functional Catalogue
G-CSF Granulocyte-CSF
GDC Glycine decarboxylase complex
GGCT Gamma-glutamyl cyclotransferase
GM Galactomannan
GM-SCF Granulocyte-macrophage CSF

xvi
GO Gene ontology
GRAVY Grand average of hydropathy
GS-AF Acetamidofluorescein glutathione
GSH Glutathione
GST Glutathione-S-transferase
GT Gliotoxin
GT-(AF)2 Di-acetamidofluorescein gliotoxin
H2O2 Hydrogen peroxide
HIV Human immunodeficiency virus
HRP Horseradish peroxidase
HSCT Hematopoietic stem cell transplant
HUVEC Human umbilical vein endothelial cell
IA Invasive aspergillosis
IEF Isoelectric focusing
IFI Invasive fungal infection
IgG Immunoglobulin G
IL Interleukin
IMP Inosine 5’-monophosphate
IPA Invasive pulmonary aspergillosis
IPG Immobilised pH gradient
iTRAQ Isobaric tags for relative and absolute quantitation
kDa Kilodalton
KEGG Kyoto Encyclopedia of Genes and Genomes
LC-MS/MS Liquid chromatography, tandem mass spectrometry
m/z Mass to charge ratio
MAb Monoclonal antibody
MALDI-ToF Matrix assisted laser desorption/ionisation-time of flight

xvii
MAPK Mitogen-activated protein kinase
MBL Mannose-binding lectin
MFS Major facilitator superfamily
MPO Myeloperoxidase
Mr Molecular mass
mRNA Messanger RNA
MS Mass spectrometry
MS2 Tandem mass spectrometry
MSn Tandem mass spectrometry
MTHFR Methylenetetrahydrofolate reductase
MudPIT Multi-dimensional protein identification technology
NaBH4 Sodium borohydride
NCP Nitrocellulose paper
NET Neutrophil extracellular trap
nm Nanometer
NOX NADPH-oxidase
NRP Non-ribosomal peptide
NRPS Non ribosomal peptide synthetase
ns Not significant
O2- Superoxide anion
O22-
Peroxide
OPT Oligopeptide transporter
PBS Phosphate buffered saline
PBST PBS-Tween
PCNA Proliferating cell nuclear antigen
PCR Polymerase chain reaction
PDI Protein disulphide isomerase
xviii
PET Positron emission tomography
PFF Pattern recognition receptor
pI Isoelectric point
PKS Polyketide synthase
PLP Pyridoxal-phosphate
PMN Polymorphonuclear
PMNL Polymorphonuclear leucocytes
PP2A Protein phosphatase 2a
Prx Peroxiredoxin
PTM Post-translational modification
qPCR Quantitative PCR
RIA Reductive iron assimilation
RNA Ribonucleic acid
RNAi RNA interference
RNS Reactive nitrogen species
ROS Reactive oxygen species
RP-HPLC Reversed phase-high performance liquid chromatography
rpm Revolutions per minute
RT Retention time
RT-PCR Reverse transcription-polymerase chain reaction
SAM S-adenosylmethionine
SCX Ion exchange chromatography
SDS Sodium dodecyl sulfate
SDS-PAGE Sodium dodecyl sulfate-Poylacrylamide gel electrophoresis
SILAC Stable-isotope labelling by amino acids in cell culture
SM Secondary metabolite
SMURF Secondary Metabolite Unknown Region Finder

xix
SNP Single nucleotide polymorphism
SOD Superoxide dismutase
TB Tuberculosis
TCA Trichloroacetic Acid
TCA cycle Tricarboxylic acid cycle
THF Tetrahydrofolate
TIC Total ion chromatograph
TLC Thin-layer chromatography
TLR Toll-like receptor
TM Transmembrane
tMr Theoretical molecular mass
TNF-α Tumor necrosis factor alpha
tpI Theoretical isoelectric point
tRNA transfer RNA
Trx Thioredoxin
TrxR Thioredoxin reductase
UFP Unknown function protein
UPR Unfolded protein response
UV Ultraviolet
v/v Volume per volume
Ve Elution volume
VEGF Vascular endothelial growth factor
VOC Volatile organic compound
w/v Weight per volume

xx
Summary
Aspergillus fumigatus is an opportunistic pathogen that can cause invasive
disease in immunocompromised individuals and, less frequently, in immunocompetent
hosts. Proteomic investigation of A. fumigatus has the potential to enable global analysis
of protein expression, identify potential targets for vaccine or diagnostic tool
development, and characterise system-wide responses to external stimuli.
Implementation of a large-scale proteomic strategy lead to the identification of non-
redundant proteins from mycelia (n = 390) and culture supernatants (n = 42) of A.
fumigatus. Utilisation of MS-based proteomics facilitated the identification of proteins
typically under-represented in 2D-PAGE proteome maps, including proteins with
multiple transmembrane regions, hydrophobic proteins and proteins with extremes of
molecular mass and pI. Pre-fractionation of complex protein samples, by gel-filtration
or gold nanoparticle pre-incubation, demonstrated potential for reduction of sample
complexity. Indirect identification of secondary metabolite cluster expression was
achieved using a global MS-based proteomic approach, with proteins (n = 20) from
LaeA-regulated clusters detected. Targeted immunoproteomics resulted in the
identification of antigenic proteins (n = 25) from A. fumigatus, reactive with sera from
healthy individuals, and characterisation of these proteins may shed light on the
pathobiology of A. fumigatus. Mechanisms involved in the interaction of A. fumigatus
with gliotoxin were also examined, using phenotypic analysis, comparative proteomics
and metabolomics. Gliotoxin was observed to relieve H2O2-induced stress, in a dose-
dependent manner (0 - 10 µg/ml) and this correlated with a significant increase in
expression of the gliotoxin oxidoreductase GliT (p < 0.05). This indicates a role for
gliotoxin, and potentially GliT, in relief of oxidative stress in A. fumigatus.
Correspondingly, proteins associated with response to stress were observed to
significantly decrease in expression in the co-addition condition, relative to H2O2 alone
(p < 0.05). Comparative proteomic profiling of the gliotoxin-sensitive mutant, A.
fumigatus ΔgliK, revealed perturbation of translation, the methyl cycle and the
endoplasmic reticulum in response to gliotoxin. This informs on the mechanisms
involved in gliotoxin-mediated toxicity and may apply to other gliotoxin-sensitive
species. Loss of gliotoxin production in A. fumigatus ΔgliK correlated with significant
elevation in intracellular ergothioneine levels (p < 0.001). This study describes the first
identification of ergothioneine in A. fumigatus and represents a target for future redox
investigations.

CHAPTER 1
Introduction

1
1 Chapter 1. Introduction
1.1 General Characteristics of Aspergillus fumigatus
The saprophytic fungus Aspergillus fumigatus is a member of the class
Ascomycota, with over 200 species of the genus Aspergillus identified to date (Anzai et
al., 2008). This soil-associated fungus plays an important role in recycling carbon and
nitrogen, and is prevalent in the environment (Latge, 1999). In a laboratory setting, A.
fumigatus can grow on minimal agar containing a simple carbon source (e.g. glucose), a
nitrogen source (e.g. ammonium tartrate) and trace elements (Brakhage and Langfelder,
2002). The ability of A. fumigatus to thrive at 37 °C enables the pathogenicity of the
fungus. The relative thermo-tolerance of A. fumigatus allows it to grow at temperatures
up to 55 °C, reflective of the presence of an ecological niche in compost heaps, and the
conidia can withstand temperatures up to 70 °C (Latge, 1999; Bhabhra and Askew,
2005). A. fumigatus produces hydrophobic conidia (spores) that are aerially dispersed
and only 2.5-3 µm in diameter (Brakhage and Langfelder, 2002). These conidia are
ubiquitous to the environment and hundreds are inhaled every day (Latge, 1999). The
small size and buoyant nature of these conidia enables them to reach the alveoli of the
lungs, where they are generally cleared in healthy individuals (Dagenais and Keller,
2009). A relatively small proportion of Aspergillus species are associated with human
disease, with A. fumigatus demonstrating the highest pathogenicity (Kradin and Mark,
2008). A. fumigatus is an opportunistic pathogen, which causes disease in immuno-
compromised individuals (Ben-Ami et al., 2010). A markedly high mortality rate is
observed with invasive Aspergillus-related disease, ranging from 40% to 95% (Abad et
al., 2010).
A. fumigatus reproduction is predominantly asexual and is mediated by the
dispersion of haploid conidia. The asexual life cycle of A. fumigatus is initiated by

2
germination of conidia into septate hyphae which form a network of mycelia (Ward et
al., 2005). Conidiophores form on hyphal extensions from the mycelial mass, and
produce chains of grey-green conidia for dispersion (Figure 1.1). Genes regulating
sexual development in A. fumigatus were identified following the sequencing of the
genome, in addition to pheromone-associated genes (Nierman et al., 2005; Paoletti et
al., 2005). Subsequently, the presence of a sexual cycle in A. fumigatus was
experimentally verified (O’Gorman et al., 2009).
Sequencing of the genome of the A. fumigatus clinical isolate Af293 revealed
the presence of 9,926 putative protein-coding genes along eight chromosomes, in a 29.4
megabase genome (Nierman et al., 2005). Subsequently, a second strain of A.
fumigatus, A1163, was sequenced, and demonstrated the presence of a set of core,
highly conserved genes common to both sequenced strains (Fedorova et al., 2008).
Comparison of the A. fumigatus, Neosartorya fischeri and Aspergillus clavatus genome
sequences revealed a number of genes that are unique to A. fumigatus. These include
genes involved in secondary metabolism and detoxification, which may contribute to
pathogenicity (Nierman et al., 2005; Fedorova et al., 2008). Data from genome
sequencing and annotation is available from a number of online warehouses including
the Central Aspergillus Data Repository (CADRE) (http://www.cadre-genomes.org.uk/)
and the Aspergillus Genome Database (AspGD) (http://www.aspgd.org/). These
resources combine in silico computational gene annotation with manually curated
information obtained from experimentation to provide extensive profiling of the
genome. CADRE provides a unique identifier for each gene with the nomenclature
indicating the respective strain (e.g. AFUA_ indicates A. fumigatus Af293, AFUB_
indicates A. fumigatus A1163).

3
Figure 1.1: Overview of asexual life cycle of A. fumigatus. Differential interference
contrast (DIC) microscopy of (a) germinating conidia and (b) septate hyphae of A.
fumigatus (Images from Suh et al. (2012)). (c) Scanning electron microscopy of A.
fumigatus conidiophores (Image from Hannover Medical School). (d) Light microscopy
of conidia release from conidiophore (Image from www.Aspergillus.org.uk).
a.
b.
c.
d.

4
In the case of A. fumigatus Af293 the chromosome number and relative gene
locus are also included in the identifier (e.g. AFUA_6G09740 indicates the gene is at
locus number 9740 along chromosome 6 in A. fumigatus Af293).
1.2 Fungal Systems Biology
The field of systems biology aims to provide a global model of the mechanisms
and interactions taking place in a biological system, through integration of data from
multiple tiers of the ‘omics’ platforms (Rochfort, 2005). Combination of transcriptomic,
proteomic and metabolomic information enables the multi-dimensional interpretation of
data generated from experimental investigations. From the perspective of fungal
systems biology, a large emphasis has been placed on the use of this approach to
elucidate the mechanisms of fungal pathogenicity and related disease (Albrecht et al.,
2011; Rizzetto and Cavalieri, 2011; Santamaría et al., 2011; Horn et al., 2012). While
this approach is still in its infancy in filamentous fungi, advances in global modelling
have been made in unicellular microorganisms such as Escherichia coli, Saccharomyces
cerevisiae and Candida albicans (Guthke et al., 2005; Costanzo et al., 2010; Stincone et
al., 2011; Tierney et al., 2012).
In a dual-transcriptional investigation, Tierney et al. (2012) investigated the
network of interactions between S. cerevisiae and cells of the innate immune system
(dendritic cells and macrophages). This was achieved by simultaneous analysis of the
yeast and mammalian transcriptomes following co-incubation using RNA-seq. The
mechanisms of pathogenicity and conditions experienced in vivo during infection have
also been investigated. Following recovery of fungal material from a murine model of
IA, the transcriptome of A. fumigatus during initiation of infection was characterised
(McDonagh et al., 2008). Analysis of transcript abundance revealed the various stresses
(e.g. oxidative stress, iron-limitation) imposed on A. fumigatus in the neutropenic

5
murine lung, in addition to identifying the increase in expression of various secondary
metabolite clusters. Systems biology has also been applied for the amalgamation of data
generated from distinct sources, demonstrating added value through retrospective
analysis of targeted studies. Using this approach, an exhaustive metabolic map of A.
niger was constructed based on modelling of curated data from published sources
(Andersen et al., 2008). Biochemical reactions, totalling 2240, were mapped to create a
gapless metabolic network, providing a useful tool for future analysis of transcriptomic
or proteomic data, in the context of metabolism (Andersen et al., 2008).
Discrepancies have been observed when combining proteomic and
transcriptomic data and no strict linear relationship exists between these two platforms
(Albrecht et al., 2011). Poor correlation between transcripts and their relative proteins
can be indicative of regulatory mechanisms at either the transcriptional or translational
level (Albrecht et al., 2011). Furthermore, as translation occurs after transcription, a lag
can exist between the appearance of the transcript and the respective protein. Results
from a proteomic investigation of the heat shock response in A. fumigatus were related
to a previous transcriptomic analysis, across a time-course (Nierman et al., 2005;
Albrecht et al., 2010). Low correlation was initially observed between the data sets, but
allowing for a time-shift resulted in improved agreement between the transcriptomic
and proteomic data (Albrecht et al., 2010). This demonstrates that an integrative
approach to global profiling provides a more comprehensive and accurate overview of
the systems involved in response to the applied stimulus.

6
1.3 Functional and Comparative Proteomics in Aspergilli
Large scale analyses of the proteomes of the genus Aspergillus have been
emerging following the sequencing and annotation of multiple genomes from these
species (Galagan et al., 2005; Machida et al., 2005; Nierman et al., 2005; Pel et al.,
2007; Fedorova et al., 2008). Methods for fungal proteomic investigations are
summarised in Figure 1.2, and can typically be divided into two categories, gel-based
and gel-free. Techniques utilised in proteomics, included MS-based proteomics and 2D-
PAGE, will be outlined in detail in Chapters 3 and 5.
Figure 1.2: Outline of general workflow of proteomic approach in fungal studies. From
González-Fernández et al. (2010).

7
While A. nidulans has represented a model organism of filamentous fungi in
terms of genetics and cell biology research, the majority of proteomic investigations
carried out to date have focused on A. fumigatus (Kniemeyer, 2011). This may be due to
the status of A. fumigatus as the major pathogen of the Aspergillus genus. The focus of
proteomic studies carried out with A. niger is predominately related to the
characterisation of the secreted and intracellular enzymes produced by this fungus,
reflective of the biotechnological associations of A. niger (Adav et al., 2010; Lu et al.,
2010; Ferreira de Oliveira et al., 2011). Changes in the proteome of A. fumigatus have
been studied in response to various stimuli, in an attempt to further elucidate the stress-
response pathways and mechanisms utilised by this opportunistic pathogen to colonise
susceptible hosts. Further understanding of the factors contributing to the ability of A.
fumigatus to grow and persist in the human host may aid in the directed development of
anti-fungal therapies or improved diagnostic tools (Abad et al., 2010).
The robust nature of filamentous fungal cells, due to the presence of a cell wall,
meant that initial proteomic investigations required optimisation of more vigorous
techniques for optimal protein extraction, than those required for eukaryotic cells of
animal origin (Kim et al., 2007). Development of reproducible extraction and
purification methodologies lead the way for future use of 2D-PAGE in comparative
analyses of A. fumigatus (Carberry et al., 2006; Kniemeyer et al., 2006). Production of
proteome maps for the mycelia, mitochondria and conidia of A. fumigatus established
large-scale identification of translation products, identified cellular localisations of
proteins and could be used to validate genomic annotations of ‘hypothetical’ proteins
(Asif et al., 2006; Carberry et al., 2006; Kniemeyer et al., 2006; Vödisch et al., 2009;
Teutschbein et al., 2010; Doyle, 2011b). Identification of so-called ‘hypothetical’ or
‘predicted’ proteins by MS, allows re-annotation as ‘unknown function proteins’ (UFPs)

8
due to confirmation of their existence (Doyle, 2011b). A large number of
immunoproteomic studies have also emerged, detecting allergenic and antigenic
proteins from intracellular and extracellular fractions (Asif et al., 2010; Singh et al.,
2010a, 2010b; Shi et al., 2012a). These studies will be described in more detail in
Chapter 4. More recently, a move towards mass spectrometry-based proteomics is
evident and represents the next generation in the proteome research (Cagas et al.,
2011b; Suh et al., 2012). Advances in mass spectrometry technology, coupled with
software development for enhanced analysis capabilities, is paving the way for
proteomics to match the high genome coverage attained in transcriptomics (Gstaiger
and Aebersold, 2009).
Comparative proteomic investigations have expanded the understanding of the
molecular response of Aspergillus species to stress, whether physical (e.g. heat shock),
chemical (e.g. antifungals) or due to nutrient limitation (e.g. iron-depletion)
(Hortschansky et al., 2007; Gautam et al., 2008; Albrecht et al., 2010). The oxidative
stress response has been investigated in both A. fumigatus and A. nidulans using two
distinct triggers of reactive oxygen stress. Addition of H2O2, leading to a rise in
intracellular peroxide (O22-
) levels, resulted in fold increases in the putative thioredoxin
peroxidase Aspf3 and peroxiredoxin Prx1 (Lessing et al., 2007). Paradoxically,
extended use of menadione to induce oxidative stress in A. nidulans lead to the
significant repression of peroxiredoxin and peroxidase translation (Pusztahelyi et al.,
2011). Menadione generates oxidative stress through the production of superoxide and
hydroxyl radicals, and this variance in the type of ROS produced may explain the
differentiation in regulation. Alternatively, the exposure of A. fumigatus to H2O2 (45
min) compared to the incubation of A. nidulans with menadione (6 h) may suggest
different short- and long-term adaptations to oxidative stress (Kniemeyer et al., 2011).

9
Comparative analysis of exposure to hypoxia has also been independently investigated
in A. fumigatus and A. nidulans using 2D-PAGE (Shimizu et al., 2009; Vödisch et al.,
2011; Barker et al., 2012). Vödisch et al. (2011) examined the response to low oxygen
over 30 h, following initial cultivation of A. fumigatus in normoxia, and observed an
increase in the levels of respiratory proteins and reactive nitrogen species (RNS)-
detoxifying protein. Additionally, expression of the secondary metabolite pseurotin A
biosynthesis cluster was up-regulated at the transcriptional and translational level
following prolonged exposure to hypoxia. Short-term adaptation to hypoxia in A.
fumigatus revealed a decrease in proteins constituting the TCA cycle, along with a
decrease in purine metabolism and ribosome biogenesis (Barker et al., 2012).
Cultivation of A. nidulans in hypoxic conditions, followed by a time-course proteomic
investigation indicated the increase in pentose and nucleotide metabolism, with a
corresponding rise in the expression of thiamine biosynthesis enzymes. These apparent
differences may again arise from time-dependent adaptation to hypoxia or alternatively
demonstrate distinct mechanisms of hypoxia response between the species (Kniemeyer
et al., 2011). Comparative 2D-PAGE analysis in A. fumigatus will be discussed in more
detail in Chapter 5.
Comparative proteomics can also be employed to deduce changes to the
proteome of the organism following deletion of a specific gene. In combination with
phenotypic analysis, this approach can provide insight into the role of the respective
protein through monitoring of the processes altered in the deletion strain relative to the
parent strain (Doyle, 2011b). This methodology has been used for the functional
investigation of a number of proteins from the Aspergillus species (Bruneau et al., 2001;
Hortschansky et al., 2007; Lessing et al., 2007; Sato et al., 2009; Zhang et al., 2009;
O’Hanlon et al., 2012). The production of non-ribosomal peptides (NRPs) is carried out

10
by large modular enzymes, referred to as NRP synthetases (NRPSs). The respective
peptide products of these NRPSs can be difficult to identify, and gene deletion studies
can facilitate matching of the enzyme to the respective product, in addition to
elucidating the biochemical role of the NRP in the cell (Balibar and Walsh, 2006;
Cramer et al., 2006; Kupfahl et al., 2006; Maiya et al., 2006; Reeves et al., 2006;
O’Hanlon et al., 2011, 2012). Deletion of the gene encoding the largest NRPS, pes3,
from A. fumigatus resulted in the generation of a strain with impaired germ tube
formation, increased sensitivity to voriconazole and demonstrating enhanced virulence
in a corticosteroid mouse model of IA (O’Hanlon et al., 2011). Reduced
immunogenicity of the Δpes3 strain was also observed and evasion of the immune
reaction may attribute to the increase in virulence noted in this mutant. Comparative
2D-PAGE was used to analyse the relative changes to the proteome of A. fumigatus
germlings following deletion of the pes3 gene. O’Hanlon et al. (2011) detected an
increase in the protein Rab11, with a predicted role in the regulation of plasma
membrane-endosome trafficking. Disruption of this mechanism may account for the
enhance sensitivity to voriconazole associated with Δpes3. Down-regulation of actin,
spermidine synthase and the petafunctional AroM protein are reflective of the observed
morphological differences and germination deficiency of Δpes3. The differential
characterisation of the proteomes of Δpes3 and the parent strain, provided confirmatory
data for phenotypic analyses and indicated a structural role for the Pes3-encoded peptide
(O’Hanlon et al., 2011). This demonstrates the capacity for proteomics to contribute to
the functional elucidation of genes and their down-stream products, through
characterising the effects of gene deletion (Doyle, 2011b).

11
1.4 Pathogenesis of A. fumigatus
1.4.1 A. fumigatus-related disease
The opportunistic pathogen, A. fumigatus, is responsible for a range of diseases,
with host susceptibility closely linked to the immune status of the individual (Latge,
1999). A. fumigatus-associated disease can be classified into three general groups; (a)
allergic reactions, (b) colonisation with limited invasiveness and (c) invasive infections
(Brakhage and Langfelder, 2002). The latter category tends to be observed in
immunocompromised individuals, demonstrative of the classification of A. fumigatus as
an opportunistic pathogen (Abad et al., 2010).
Allergic airway diseases, associated with A. fumigatus, include allergic
bronchopulmonary aspergillosis (ABPA) and related conditions. ABPA is a
hypersensitivity disorder that predominantly affects individuals with cystic fibrosis (CF)
and asthma (Knutsen and Slavin, 2011). ABPA can lead to chronic lung damage and
deterioration of lung function in this cohort of patients (Kraemer et al., 2006;
Chaudhary and Marr, 2011). The major predisposing factor for development of ABPA
is the ineffective clearance of inhaled conidia from the lung (Pihet et al., 2009;
Patterson and Strek, 2010). Structural abnormalities associated with chronic lung
disease can contribute to the conidial evasion of the host mucociliary clearance
mechanism (Thomas et al., 2010; Chaudhary and Marr, 2011). CF is characterised by
mutations in the CF transmembrane conductance regulator (CFTR), leading to
disruption of chloride channels in many epithelial cells. This results in the development
of thick, viscous mucous in the lung, which can impede the clearance of inhaled
microorganisms (Pihet et al., 2009). In the absence of ABPA, lung function is not
affected by A. fumigatus colonisation, which is observed frequently in CF patients (De
Vrankrijker et al., 2011). Conidia evading extrusion from the lung must germinate

12
before allergy can be established, as dormant conidia are immunologically inert due to
presence of an external hydrophobic rodlet layer (Aimanianda et al., 2009). Damage to
pulmonary epithelium following germination permits exposure of A. fumigatus antigens
to host dendritic cells (DCs). Pulmonary DCs subsequently elicit a Th2-type response
with secretion of cytokines and B-cell isotype switching to IgE production (Chaudhary
and Marr, 2011). Elevation of total IgE levels and secretion of proinflammatory
cytokines is indicative of the allergic response associated with ABPA (Knutsen, 2006;
Patterson and Strek, 2010). Diagnostic guidelines for ABPA include presence of pre-
disposing conditions (e.g. CF), elevation in total IgE, elevation in anti-A. fumigatus
antibodies and a number of other criteria (Agarwal, 2011).
Aspergilloma is an example of the second category of A. fumigatus-related
disease, characterised by colonisation in the absence of extensive invasiveness. A.
fumigatus colonisation of pre-existing cavities in the lung can result in the formation of
an aspergilloma (fungus-ball). Tuberculosis (TB) is the most common cause of
cavitation leading to aspergilloma formation, with 11 % of individuals possessing
cavities showing radiographical signs of aspergilloma (Kawamura et al., 2000; Zmeili
and Soubani, 2007). The aspergilloma consists of a mass of fungal hyphae,
inflammatory cells, fibrin mucous and cell debris and the condition is usually non-
invasive (Latge, 1999; Zmeili and Soubani, 2007). Detection and diagnosis of
aspergilloma is usually through routine radiography, as the condition is often
asymptomatic (Zmeili and Soubani, 2007; Kradin and Mark, 2008). Sporulation of
conidia, is postulated to occur in addition to mycelial growth, as multiple isogenic,
azole-resistant strains were isolated from an aspergilloma during a course of anti-fungal
therapy (Camps et al., 2012). Surgical intervention is utilised for removal of the

13
aspergilloma, and the use of anti-fungals as an adjunct has been found to be ineffective
(Brik et al., 2008; Sagan and Goździuk, 2010).
The third sub-category of disease associated with A. fumigatus is classified by
invasive disease, which may disseminate and result in systemic infection. Invasive
aspergillosis (IA) is a term used to describe clinical presentations that fall into this
group. IA is the most detrimental Aspergillus-related disease, with associated mortality
rates ranging from 40 to 95 % (Nivoix et al., 2008; Abad et al., 2010). Various factors
including the immune status of the patient, site of infection and treatment affect these
mortality rates (Maertens et al., 2002). Individuals at risk for the development of IA
include patients with haematological malignancies (e.g. leukaemia), chronic obstructive
pulmonary disease (COPD), solid organ and hematopoietic stem cell transplant (HSCT)
recipients, extended corticosteroid use and HIV-positive individuals (Dagenais and
Keller, 2009; Gangneux et al., 2010). COPD has been identified as a risk factor for
development of Aspergillus-related hypersensitivity and ABPA (Agarwal et al., 2010).
Genetic factors also influence the susceptibility of individuals to IA, and individuals
with single nucleotide polymorphisms (SNPs) in genes such as plasminogen, IL-10 and
mannose-binding lectin (MBL) are pre-disposed to develop IA (Crosdale et al., 2001;
Brouard et al., 2005; Sainz et al., 2007; Zaas et al., 2008). Two distinct risk factors exist
for the development of IA, neutropenia and corticosteroid-induced immunosuppression
(Figure 1.3). Prolonged neutropenia represents the dominant risk for development of
pulmonary IA and the associated disease is characterised by angioinvasion and
disseminated fungal growth (Kradin and Mark, 2008; Ben-Ami et al., 2010).
Additionally, disruption in neutrophil function (e.g. chronic granulomatous disease
(CGD) can result in a similar clinical presentation of IA, although angioinvasion is
generally not observed in this sub-set of patients (Segal and Romani, 2009). A different

14
pathology is observed in IA associated with corticosteroid-induced immunosuppression.
Non-neutropenic or corticosteroid-related IA is generally non-angioinvasive, with
limited fungal development or dissemination. Instead, the condition is characterised by
excessive inflammation resulting in damage to tissues due to an aggressive host
response (Balloy et al., 2005). Inhaled conidia that evade mucociliary clearance, are
generally phagocytosed by macrophages in the lung (Bhatia et al., 2011). In addition to
their function as phagocytes, alveolar macrophages modulate the immune response, and
elicit the migration of other immune effector cells through the release of chemo- and
cytokines. Engulfed conidia are killed in macrophages through the action of reactive
oxygen species (ROS) and acidification in the phagolysosome (Ibrahim-Granet et al.,
2003; Philippe et al., 2003). While corticosteroids do not affect phagocytosis of conidia
by alveolar macrophages, ROS-mediated killing is inhibited. This can lead to
germination of phagocytosed conidia in individuals undergoing corticosteroid treatment
(Philippe et al., 2003). Circulating neutrophils are recruited to the lung and are
important in defence against fungal hyphae. Neutrophils mediate killing of hyphae by
oxidative mechanisms following attachment to hyphal surfaces and de-granulation
(Levitz and Farrell, 1990; Feldmesser, 2006). Tissue damage resulting from
corticosteroid-associated IA is through an excessive influx of neutrophils and associated
inflammation (Balloy et al., 2005). Conversely, in neutropenia-associated IA, hyphal
growth and extensive fungal development occurs due to the absence of neutrophils
(Balloy et al., 2005; Feldmesser, 2006). Diagnosis of IA is often delayed due to the non-
specificity of the associated symptoms and limited sensitivity of diagnostic tests, which
can contribute to delayed treatment (Segal and Walsh, 2006; Trof et al., 2007).
Treatment of IA involves the use of anti-fungal therapy, which includes the azole,
echinocandin and polyene classes of drugs (Kontoyiannis, 2012).

15
1.4.2 Detection and diagnostic strategies for IA
Diagnosis of IA has been hampered by the presence of a multi-factorial disease,
coupled with a wide-range of pre-disposing host factors. Together with the limited array
of validated laboratory diagnostic methods, late diagnosis of IA contributes to delayed
treatment and correspondingly high mortality rates (Maertens et al., 2007). This
phenomenon is exemplified by the high disparity between post-mortem detection and
ante-mortem diagnosis of invasive fungal infections (IFIs), and specifically IA
(Chamilos et al., 2006; Antinori et al., 2009). The current criteria for diagnosis of IFIs
have been outlined by the consensus group of the European Organisation for Research
and Treatment of Cancer/Invasive Fungal Infections Cooperative Group and the
National Institute of Allergy and Infectious Diseases Mycoses Study Group
(EORTC/MSG) (De Pauw et al., 2008). Following the revised EORTC/MSG guidelines
diagnoses of IFIs can be delineated into proven, probable or possible categories of
disease. Classification is dependent on the presence of host factors (e.g. recent
neutropenia or prolonged corticosteroid use), observation of clinical indications (e.g.
radiographic findings) and mycological criteria (e.g. direct microscopy or detection of
antigens). Mycological evidence of IFI involves the direct or indirect detection of the
causative fungal agent. Direct methods of detection include culture of the fungus from
patient specimens, including sputum or bronchoalveolar lavage (BAL) fluid, or
observation of fungal elements by microscopy. Indirect mycological detection methods
currently approved for use in EORTC/MSG guidelines are typically only applicable to
aspergillosis and candidiasis due to the selectivity of these tests (De Pauw et al., 2008).

16
Figure 1.3: Pathogenesis of IA based on immune status of the host. (a) A. fumigatus conidia are inhaled and reach the alveoli of the lungs, where
germination occurs. (b) Conidia are cleared by cells of the immune system, including alveolar macrophages and PMN cells. (c) Germination and tissue
invasion occurs in individuals with reduced quantity or efficacy of PMN cells. (d) Non-neutropenic hosts (e.g. long-term corticosteroid use) develop
tissue damage as a result of excessive PMN cell recruitment. From Ben-Ami et al. (2010).
a. b. c.
d.

17
Detection of circulating antigens using the enzyme-immunoassay (EIA) format
has contributed to the detection and monitoring of Aspergillus infections.
Galactomannan is a heat-stable polysaccharide component of the cell walls of
Aspergillus and Penicillium spp, which is secreted during fungal growth (Latgé et al.,
1994). The FDA-approved Platelia© sandwich EIA, for the detection of Aspergillus
galactomannan, is routinely used as an adjunct diagnostic tool for IA (Maertens et al.,
2007). Levels of circulating galactomannan (GM) have been considered to be
proportional to the relative fungal load, with absence of GM subsidence an indicator of
prognosis (Boutboul et al., 2002). An additional cell wall constituent, β-glucan, is
another diagnostic target for IFIs. Since β-glucan is present on cell walls from most
pathogenic fungi, excluding Cryptococcus and Zygomycetes, it does not specifically
indicate IA but instead is a ‘pan-fungal’ detection strategy (Hope et al., 2005; Maertens
et al., 2007; Thornton, 2010). Investigation of the specificity and sensitivity of these
indirect detection strategies, currently in routine use for IFI diagnosis, has resulted in
widely varying results. Host-factors appear to influence the performance of these
antigen assays, with accuracy of GM detection differing between patients with
haematological disorders and immunosuppressed individuals (Pfeiffer et al., 2006; Ku
et al., 2012). Furthermore, anti-fungal therapy can also reduce the sensitivity of these
antigen immunoassays, highlighting the need for further validated tests for IA diagnosis
(Marr et al., 2005). Polymerase chain reaction (PCR)-based detection strategies, for use
in IA diagnosis, are undergoing development, with further validation required before
they can be included in the EORTC/MSG guidelines for IFI diagnosis (De Pauw et al.,
2008). Efforts have been undertaken to standardise procedures used in PCR-based
detection of IA, in addition to reduction in the incidence of false-positives (White et al.,
2010, 2011). Emerging real-time quantitative PCR (qPCR) strategies for detection of
Aspergillus are compliant with stringent guidelines for reporting and may signal the

18
shift towards inclusion of these molecular tests in the IA diagnostic tool-belt (Johnson et
al., 2012).
Several novel strategies are under investigation for the diagnosis of IA,
including immuno-based methods and detection of Aspergillus-specific low molecular
mass metabolites. The use of monoclonal antibodies (MAbs) for detection of alternative
targets to previously described (i.e. GM, β-glucan) has been examined by a number of
groups with the potential for enhanced selectivity and sensitivity of detection. The
development of an Aspergillus antigen capture ELISA has been described, using two
distinct MAbs for the enhanced capture and detection of an Aspergillus antigen (Hao et
al., 2008). Combination of an antigen-assay with detection of anti-Aspergillus
antibodies has also been explored, for the overall improvement in diagnostic
capabilities. The gliotoxin oxidoreductase, GliT, has demonstrated immunoreactivity
and has been identified both intracellularly and extracellularly in A. fumigatus (Schrettl
et al., 2010; Kumar et al., 2011). Measurement of anti-GliT antibody levels, has been
examined as a putative tool for IA diagnosis in non-neutropenic patients, although
coupling of this assay with GM detection was suggested for optimal results (Shi et al.,
2012b). A lateral flow device has been developed for the detection of an Aspergillus-
specific antigen, utilising a MAb directed against an undisclosed external component of
Aspergillus, which is secreted during active growth (Thornton, 2008). Due to the ease of
use, this device represents a significant development in IA diagnostics (Thornton et al.,
2012).
Additional studies have been carried out to investigate the potential of low
molecular mass fungal metabolites in diagnosis. A novel metabolite-based detection
strategy, under preliminary investigation, comprises a breath test for IA, and is based on
the detection of an Aspergillus-specific volatile organic compound (VOC) (Chambers et

19
al., 2011). The premise of this test is the use of 2-Pentylfuran (2PF) as a biomarker of
IA, however technical apparatus required to characterise these samples make this
technology incompatible with a clinical setting in its current form (Chambers et al.,
2011). MS-based detection of cyclic non-ribosomal peptides has been proposed as a
way by which to detect fungal infection and distinguish between fungal strains, based
on distinct cyclic peptide profiles (Jegorov et al., 2006). Additionally, detection of the
bis-methylated derivative of gliotoxin (bmGT), was achieved using thin layer
chromatography (TLC) and high performance liquid chromatography (HPLC), and was
put forward as a more reliable diagnostic candidate than native gliotoxin (Domingo et
al., 2012). Further to their potential for use as biomarkers of infection, fungal
metabolites can also be employed for detection of fungal growth in vivo. Petrik et al.
(2010) exploited the iron scavenging activity of A. fumigatus, by using modified
siderophores as a reporting mechanism. Radio-labelled siderophores were selectively
taken up by A. fumigatus in vivo and accumulation allowed the detection of A.
fumigatus infection using positron emission tomography (PET). Again this strategy
hinged on the principle of using fungal-specific molecules or mechanisms for detection,
to eliminate false positives from host interference. Further development of indirect
detection methods for IA is of paramount importance, as sensitive and selective
techniques would preclude the need for invasive diagnostic procedures.
1.5 Anti-fungal therapy for IA
Therapeutic goals in the treatment of invasive fungal infections (IFI) include the
restoration of immune function, if applicable, and the reduction of the fungal burden
(Traunmüller et al., 2011). Anti-fungal agents are utilised to achieve the latter, and
include polyenes, triazoles and echinocandins for the treatment of IA (Thompson and
Patterson, 2008). Due to relatively close phylogenetic relationship between fungi and

20
humans, unique targets for anti-fungal therapeutics are limited and the identification of
differential mechanisms may expand this base (Denning and Hope, 2010). One such
target for anti-fungal agents is the cell wall, which represents a fungal-specific entity,
distinct from the host background (Vandeputte et al., 2012). Additionally ergosterol, a
component of the fungal cell membrane, is not found in human cell membranes, with
particular classes of drugs targeting these molecules (Beauvais and Latgé, 2001). The
polyene class of anti-fungals, including amphotericin B (AmB) deoxycholate, exploit
this unique fungal target to elicit their function. AmB binds to ergosterol in the fungal
cell membrane and forms pores, which lead to leakage of potassium ions. The resultant
proton gradient ultimately results in fungal cell death (Lemke et al., 2005). AmB was
classically the primary anti-fungal used for the treatment of IA, however substantial side
effects, including nephrotoxicity, have lead to the development and use of lipid
formulations with reduced toxicity (Wingard et al., 1999; Kleinberg, 2006; Ullmann et
al., 2006).
Voriconazole, itraconazole and posaconazole are member of the triazole class of
anti-fungals used to treat invasive fungal infection. Triazoles inhibit the cytochrome
P450 enzyme resulting in disruption of ergosterol biosynthesis and consequently cell
membrane dysfunction and cell death (Thompson and Patterson, 2008). Voriconazole
inhibits the action of 14α-lanosterol demethylase, a key step in the production of
ergosterol which is required for normal cell membrane function (Denning and Hope,
2010). Some hepatic-related side effects are associated with voriconazole use,
principally due to metabolism via host cytochrome P450 enzymes (Johnson and
Kauffman, 2003). Despite this, voriconazole has emerged as the primary therapy for IA
due to the reduced toxicity profile and enhanced efficacy, relative to AmB (Herbrecht et
al., 2002; Azie et al., 2012). Emergence of resistance to azoles has been noted in some

21
cases and this represents a potential concern for long-term use of these therapeutics
(Howard et al., 2006; Trof et al., 2007; Camps et al., 2012).
Caspofungin is a member of the echinocandin class of anti-fungal agents, which
function by disrupting cell wall synthesis. Caspofungin is currently recommended for
use as a second line or salvage therapy for IA (Maertens et al., 2004; Kartsonis et al.,
2005). Recent studies have also indicated the effectiveness of this agent in the primary
treatment of IA, with efficacy and favourable toxicity profiles shown in patients with
haematological disorders and HSCT recipients (Herbrecht et al., 2010; Jarque et al.,
2012). The mechanism of action of caspofungin is the targeted disruption of β(1,3)-D-
glucan biosynthesis, through non-competitive inhibition of β(1,3)-D-glucan synthase.
Inhibition of β(1,3)-D-glucan biosynthesis, a principle cell wall component, results in
destabilisation of fungal cell walls and limits fungal growth (Letscher-Bru, 2003).
Caspofungin is utilised as a monotherapy for IFIs, in addition to inclusion in
combination therapy (Maertens et al., 2010). Combination therapy for the treatment of
IA offers a number of theoretical advantages, including reduced risk of resistance, wider
target area, and more rapid effect, however preliminary studies have not conclusively
demonstrated the effectiveness of this approach over monotherapy (Trof et al., 2007;
Tunger et al., 2008; Garbati et al., 2012). In vitro studies suggest positive outcomes
upon combinations of azoles with echinocandins, possibly due to differential targets
associated with these agents (Jeans et al., 2012).
Immunotherapy represents another strategy for the treatment of IA, focusing on
modulation of immune function for enhanced anti-fungal activity (Carvalho et al.,
2012). Administration of recombinant colony stimulating factors (CSFs), including
granulocyte-CSF (G-CSF) and granulocyte-macrophage CSF (GM-CSF), has been
investigated for potential in the treatment of invasive fungal infections. G-CSF

22
stimulates the proliferation and survival of neutrophils and their precursors, and is used
in the prevention of chemotherapy-associated febrile neutropenia (Silvestris et al.,
2012). GM-CSF promotes neutrophil survival and stimulates neutrophil effector
function, in addition to stimulation of macrophage proliferation and activity (Hercus et
al., 2012). Therapeutic use of these CSFs in treatment of IFI was expected to restore
immune function and consequently enhance fungal clearance, however results from
various in vitro studies and clinical reports were contradictory (Lehrnbecher et al.,
2011). Post-transplant administration of G-CSF has also been demonstrated to impair
immune recovery due to the induction of an inflammatory Th2 response (Volpi et al.,
2001). GM-CSF represents a more appropriate agent for use against Aspergillus-
associated infection due to stimulation of both neutrophils and macrophage activity.
Additionally GM-CSF, unlike G-CSF, does not dramatically increase total leukocytes
counts, resulting in reduced tissue injury from the inflammatory neutrophil response
(Graybill et al., 1998). Use of G-CSF has been shown to shorten recovery times and
length of hospitalisation when used in the treatment of IA, however no effect was noted
regarding mortality rates (Pagano et al., 2010). The most beneficial use of CSFs appears
to be in prophylactic treatment for the prevention of infection in high-risk patient
cohorts (Falagas et al., 2008). Therefore this immunotherapy represents a promising
preventative or adjunct therapy for IA.
1.6 Factors contributing to A. fumigatus pathogenicity
A. fumigatus has been postulated to be an accidental pathogen, lacking
sophisticated virulence factors (McCormick et al., 2010). Many of the traits of A.
fumigatus, which contribute to its pathogenicity under opportune conditions, have
developed to enable survival in the primary ecological niche of this fungus, the soil.
Through functional genomics investigations a number of genes connected to thermo-

23
tolerance in A. fumigatus were identified, including afpmt1 (AFUA_3G06450), afmnt1
(AFUA_5G10760), cgrA (AFUA_8G02750), thtA (AFUA_1G03992) and midA
(AFUA_3G10960) (Bhabhra et al., 2004; Chang et al., 2004; Zhou et al., 2007;
Wagener et al., 2008; Dichtl et al., 2012). The genes afmnt1, cgrA, thtA and midA are
essential for growth at 48 °C, while conidiation at 50 °C is inhibited upon deletion of
afpmt1. A range of distinctive mechanisms contribute to attenuation of thermo-tolerance
in these deletion strains. CprA has a role in ribosomal synthesis, and is required for
conidial germination at higher temperatures. Afpmt1 and afmnt1 code for an α-1,2-
mannosyltransferase and an O-mannosyltransferase respectively, with deletion of these
genes resulting in loss of cell wall integrity (Zhou et al., 2007; Wagener et al., 2008).
This implicates the cell wall as an integral component in resistance to thermal stress.
Comparative proteomics has also identified mechanisms that are differentially regulated
upon exposure to heat shock. Protein chaperones, proteins involved in carbon and
nitrogen metabolism, translation, and proteins involved in defence against oxidative and
nitrosative stress, were all significantly up-regulated upon temperature shift from 30 to
48 °C (Albrecht et al., 2010). Proteins involved in cell wall and cytoskeleton assembly
were also observed to increase in expression following thermal stress, further
demonstrating the importance of cell wall integrity in resistance to stress.
The cell wall provides a physical barrier between the fungal cell and the external
environment, affording structural integrity to the hyphae and conidia in addition to
physical protection from exogenous stresses. The cell wall of A. fumigatus is composed
primarily of polysaccharides, and is a dynamic structure embedded with proteins, that
can change in response to environmental stimuli (Abad et al., 2010). The constituents of
the cell wall include α(1,3)-glucans, β(1,3)-glucans, chitins and galactomannans (Figure
1.4). Disruption of the cell wall integrity increases the sensitivity of A. fumigatus to

24
external stresses, and additionally can enhance the susceptibility to antifungal agents.
Deletion of afmnt1 and afpmt1, involved in cell wall component biosynthesis, increases
the sensitivity of the mutants to azoles and hygromycin respectively (Zhou et al., 2007;
Wagener et al., 2008). Additionally, wsc1 mutants lacking a protein involved in cell
wall integrity signalling, are significantly more sensitive to echinocandin treatment
(Dichtl et al., 2012). The cell wall constituent, β-glucan is recognised by the host
immune system and is a ligand for the Dectin-1 receptor, which activates the
inflammatory immune response (Steele et al., 2005). β-glucan is not exposed on the
surface of resting conidia, but becomes available for Dectin-1 binding following the
initiation of conidia swelling and germination (Hohl et al., 2005). Components of the
cell wall also exhibit immunomodulatory mechanisms, which can result in attenuation
of the innate immune response. Specifically, α-glucan reduces toll-like receptor (TLR)-
2 and TLR4-mediated production of interleukin (IL)-6, while β-glucan decreases IL6
production via TLR4 (Chai et al., 2011b). These effects were dose-dependent and more
pronounced IL6 attenuation was observed using extracts from germinating conidia
compared to resting conidia (Chai et al., 2011b). TLRs recognise specific non-self
molecules and trigger immune responses through signalling mechanisms. IL6 triggers
the innate immune response and modulation of the production of this molecule
demonstrates an immunoevasion mechanism elicited by the cell wall of A. fumigatus.
As described earlier, the innate immune response directed against A. fumigatus
involves alveolar macrophages and dendritic cells, resident in the lung, as a first-line of
defence. Additionally, recruitment and activation of other leukocytes is required to fend
off infiltrating fungal infection. As A. fumigatus is an opportunistic pathogen, virulence
is associated with impairment in the host defence system.

25
Figure 1.4: Schematic of A. fumigatus cell wall. From Abad et al. (2010).

26
Moreover, A. fumigatus has a number of characteristics that enhance immune
evasion and enable resistance to components of the host immune response. In addition
to the cell wall components discussed previously, A. fumigatus possesses exterior
features that impart protection against external stresses. Melanin is located on the
external surface of conidia and is responsible for the dark pigment associated with A.
fumigatus conidia (Tsai et al., 1999; Schmaler-Ripcke et al., 2009). Melanin has been
demonstrated to play a protective role in A. fumigatus conidia through a number of
mechanisms: (i) protection against UV light, (ii) down-regulation of the complement
cascade, (iii) ROS scavenging and (iv) masking cell surface ligands of the innate
immune system (e.g. β-glucan) (Tsai et al., 1998, 1999; Brakhage and Liebmann, 2005;
Nosanchuk and Casadevall, 2006; Chai et al., 2011a). Furthermore, following
phagocytosis of conidia by macrophages, melanin inhibits phagolysosome acidification
and apoptosis, thus prolonging the survival of infected macrophages (Thywißen et al.,
2011; Volling et al., 2011). An additional hydrophobic layer, encases the surface of
conidia, and is composed of RodA protein covalently bound to the cell wall. This rodlet
or hydrophobin layer aids in the dispersion of conidia, through the associated
hydrophobicity, and also decreases the immunogenicity of resting conidia. Conidia from
mutants deficient in the RodA protein activated dendritic cells and alveolar
macrophages, with associated release of cytokines, while wild-type resting conidia were
immunologically silent (Aimanianda et al., 2009; Dagenais et al., 2010). An additional
mechanism employed by neutrophils in the defence against A. fumigatus is the
production of neutrophil extracellular traps (NETs), consisting of secreted DNA
complexes with anti-microbial granular proteins, which surround the fungal cells
(Wartha et al., 2007; Bruns et al., 2010a). RodA is responsible for reduced NET
formation, with reduced levels or absence correlating with enhanced secretion of NETs
by neutrophils (Bruns et al., 2010a). As with melanin, the hydrophobin layer provides a

27
mask for immunogenic cell surface ligands in dormant conidia, allowing spores to
evade host defences prior to germination.
An integral component of A. fumigatus, in resistance to effector functions of the
host defences, is the plethora of enzymes for detoxification of ROS. Macrophage and
neutrophil-mediated killing of conidia and hyphae is achieved in part through the
generation of ROS. NADPH-oxidase (NOX) is responsible for release of ROS and is
essential for defence against fungal infection (Brown et al., 2009a). Correspondingly,
defects in the NOX enzyme, associated with CGD, results in impaired capacity of
neutrophils to kill fungi and leads to increased susceptibility to infections (Segal and
Romani, 2009). The mitogen-activated protein kinase (MAPK) family of enzymes play
a role in cell signalling and regulate intracellular responses to stress. In A. fumigatus,
MpkA and SakA are two MAPKs associated with response to ROS and mediate their
function through signal transduction cascades (Du et al., 2006; Valiante et al., 2008).
MpkA is involved in the regulation of a number of genes encoding anti-oxidant
proteins, including catalases and superoxide dismutase (SOD) (Jain et al., 2011). In A.
nidulans, the interaction of SakA with the transcription factor AtfA facilitates stress
signalling and is involved in the regulation of catalase and peroxiredoxin expression
(Lara-Rojas et al., 2011). The transcription factor, Yap1, plays an integral role in the
regulation of antioxidant genes in A. fumigatus (Aguirre et al., 2006). Upon exposure to
oxidative stress, Yap1 accumulates in the nucleus and induces the transcription of genes
involved in protecting the cell from stress-induced damage (Kuge et al., 1997). Yap1
targets, identified by comparative proteomics using a yap1 deletion strain, included
catalases, chaperones, peroxidases and a mitochondrial peroxiredoxin (Lessing et al.,
2007). While Δyap1 displayed no change in pathogenicity relative to the wild-type in a
mouse model of invasive pulmonary aspergillosis (IPA), Yap1 was essential for

28
virulence in an ocular keratitis infection model (Lessing et al., 2007; Sixto et al., 2012).
This may result from the use of a neutropenic mouse model for IPA infection, as Yap1
is crucial in the defence against neutrophil-mediated killing (Lessing et al., 2007; Sixto
et al., 2012). A zinc finger transcription factor, SebA, has recently been identified in A.
fumigatus, with a role in protection against various forms of stress, including oxidative
and heat shock stress (Dinamarco et al., 2012). The deletion strain of sebA,
demonstrated increased sensitivity to H2O2 and paraquat treatments, and sebA-
dependent regulation of anti-oxidant enzymes was observed in response to these stimuli
(Dinamarco et al., 2012). The fungal response to oxidative stress therefore plays an
integral role in the ability to function as a human pathogen (Brown et al., 2009a) and
further characterisation of this response is necessary for the understanding of
pathogenicity.
The exposure to hypoxia represents a further physiological stress imposed on A.
fumigatus during pathogenesis (Vödisch et al., 2011). The sterol-regulatory element
binding protein, SrbA, regulates ergosterol biosynthesis, maintains cell polarity and is
essential for growth in hypoxic conditions (Willger et al., 2008). Furthermore deletion
of srbA results in attenuated virulence in both neutropenic and corticosteroid models of
IA, underpinning the role of hypoxia adaptation in the pathogenicity of A. fumigatus
(Willger et al., 2008, 2009). Large-scale proteomic and transcriptomic investigations
have been carried out to identify mechanisms differentially regulated in A. fumigatus in
response to both short-term and long-term hypoxia (Vödisch et al., 2011; Barker et al.,
2012). Long-term exposure to low oxygen conditions correlated with the increase in
expression of proteins involved in glycolysis, respiration and secondary metabolite
production. The transcription factor SrbA was activated in response to a requirement for
ergosterol biosynthesis, and additionally NO-detoxifying flavohemoprotein was up-

29
regulated, indicating the production of reactive nitrogen species (RNS) may be
associated with hypoxia (Vödisch et al., 2011). Similarly, following short-term
exposure to hypoxia, ergosterol biosynthesis and flavohemoprotein were also up-
regulated, indicating the requirement for these components in the adaption to, and the
maintenance of growth in, hypoxic conditions (Barker et al., 2012).
As A. fumigatus is a saprophytic fungus, the ability to extract nutrients from the
host plays an integral part in the ability of the fungus to survive and persist in the lung.
Secreted enzymes, including proteases, hydrolases and lipases, allow acquisition of
nutrients, in addition to destruction of host barriers to enable invasive growth. A
transcriptional regulator of proteases, PrtT, was detected in A. fumigatus following the
identification of homologs in A. niger and A. oryzae (Bergmann et al., 2009; Sharon et
al., 2009). While PrtT-regulated proteases were essential for the utilisation of protein as
a nutrient source, these enzymes did not contribute to virulence in a neutropenic or
corticosteroid mouse models of IA (Bergmann et al., 2009; Sharon et al., 2009).
Another prerequisite for the survival of A. fumigatus in the host is the ability to obtain
and store iron, an essential nutrient and cofactor for a number of enzymes (Haas, 2012).
Conditions encountered by A. fumigatus in the lung are iron-limited and the capacity to
acquire iron is crucial for growth (Schrettl et al., 2007; Haas, 2012). Two distinct routes
exist by which A. fumigatus can obtain iron, reductive iron assimilation (RIA) and
siderophore-assisted iron uptake, both of which are induced in iron-limiting conditions
(Schrettl et al., 2007). The latter of these systems involves the production of
siderophores, which specifically chelate ferric iron and can be used to sequester iron
from the host environment or store iron internally (Schrettl et al., 2004). Abrogation of
siderophore biosynthesis, by disruption of the sidA, resulted in complete attenuation of

30
virulence in a neutropenic mouse model of IA, demonstrating the essential role of the
siderophore system in A. fumigatus pathogenicity (Schrettl et al., 2004, 2007).
A. fumigatus is capable of producing a range of toxic molecules which may
attribute to its success as an opportunistic pathogen. Many of these molecules are
secondary metabolites in A. fumigatus and those implicated in pathogenicity are listed in
Table 1.1. Over 200 secondary metabolites are secreted by A. fumigatus and include
melanins and ergosterols discussed earlier (Frisvad et al., 2009). Gliotoxin represents
the most characterised secondary metabolite of A. fumigatus, with relevance to
virulence. The mechanism of action of gliotoxin will be discussed in detail later in the
Chapter, in addition to the effect of gliotoxin on the host defences. Briefly, gliotoxin is a
redox-active metabolite, which exerts numerous immunomodulatory mechanisms,
contributing to the success of A. fumigatus as an opportunistic pathogen (Figure 1.5)
(Abad et al., 2010). Helvolic acid is a triterpene which demonstrates ciliostatic activity,
albeit with lower activity than gliotoxin and fumagillin (Amitani et al., 1995). A
putative cluster involved in helvolic acid biosynthesis has been identified on
Chromosome 4 in A. fumigatus, however the biosynthetic pathway has not been
elucidated to date (Lodeiro et al., 2009; Mitsuguchi et al., 2009). Ergot alkaloids are
conidia-associated toxins that interact with monoamine receptors and can affect the
nervous and reproductive systems through this antagonism (Coyle et al., 2007).
Recently, the non-ribosomal peptide synthetases (NRPS), Pes1 and PesL, have been
implicated in the production of the ergot alkaloid, fumigaclavine C (Figure 1.5)
(O’Hanlon et al., 2012). Fumigaclavine C has been shown to inhibit the proliferation
and activation of T lymphocytes in addition to reducing the production of TNFα in vivo
and in vitro (Zhao et al., 2004). Other mycotoxins associated with conidia have been
identified following sporulation and include fumiquinazoline C, tryptoquivaline F,
31
trypacidin, monomethylsulochrin and questin (Figure 1.5). Of these, trypacidin was
observed to have toxic characteristics, and significantly and substantially reduced the
cell viability of a human alveolar carcinoma cell line (A549) (Gauthier et al., 2012).
Trypacidin triggered cell death through necrosis in both primary and immortal lung
cells, with oxidative stress induction implicated in the irreversible death process
(Gauthier et al., 2012). Fumagillin produced by A. fumigatus has been suggested to have
genotoxic effects on mammalian cells in vivo, in addition to anti-angiogenic activity
(Figure 1.5) (Stanimirovic et al., 2007). Moreover, fumagillin has recently been
identified as an inhibitor of neutrophil function through interruption of the NAPDH
oxidase complex assembly (Fallon et al., 2010). Degranulation of neutrophils was also
reduced in fumagillin treated cells, which could contribute to the persistence of A.
fumigatus in the host (Fallon et al., 2010). Pseurotin A and related analogues have
demonstrated suppression of IgE production in vitro (Figure 1.5) (Ishikawa et al.,
2009). Pseurotin A biosynthesis is encoded by a portion of a secondary metabolite
‘supercluster’ on Chromosome 8, with the sole hybrid polyketide synthase/non-
ribosomal peptide synthetase (PKS/NRPS) in A. fumigatus essential for pseurotin A
production (Maiya et al., 2007; Perrin et al., 2007). The pseurotin precursor molecules,
propionyl-coenzyme A, phenylalanine and malonyl-coenzyme A, are utilised to produce
a PKS-NRPS bound intermediate, with the remaining genes in the cluster putatively
responsible for further modification of this intermediate (Maiya et al., 2007).
No single factor appears to be responsible for virulence of A. fumigatus and the
associated disease is multi-faceted (Abad et al., 2010). Collectively, all of the features
described contribute to the pathogenicity of A. fumigatus in the immunocompromised
host. Further exploration into these mechanisms of tolerance and resistance to host
induced stresses may expand our understanding of the pathogenicity of A. fumigatus.

32
1.7 Secondary Metabolism in Fungi
1.7.1 Identification of Secondary Metabolite Clusters
Secondary metabolites are predominantly low molecular mass molecules,
produced by a range of organisms, which are dispensable for primary growth (Keller et
al., 2005). The production of SMs can often be associated with specific morphological
stages and SMs may confer selective advantages in the presence of competing
organisms (Calvo et al., 2002; Losada et al., 2009). Secondary metabolites can be
broadly categorised based on the enzyme classes responsible for their biosynthesis, and
include (i) polyketides, (ii) non-ribosomal peptides (iii) terpenes and (iv) indole
alkaloids. Biosynthesis of these SMs is carried out by polyketide synthetases (PKSs),
NRPSs, terpene cyclases and dimethylallyl tryptophan synthetases (DMATS),
respectively. These enzymes catalyse the first step in the biosynthesis of SMs and are
referred to as ‘backbone enzymes’ (Khaldi et al., 2010). Enzymes involved in the
biosynthesis of SMs are usually grouped in contiguous clusters in the genome with a
proclivity towards telomeric localisation (Keller et al., 2005; Nierman et al., 2005). This
phenomenon is not observed in primary metabolite biosynthetic pathways, nor in
secondary metabolism genes from other kingdoms. The sequencing of the genome of A.
fumigatus Af293, revealed the presence of 26 SM clusters, including a number of
clusters not identified in A. oryzae or A. nidulans (Nierman et al., 2005). The number of
SM gene clusters was subsequently revised to 22 by Perrin et al. (2007).
Recent developments in automated web-based tools, including Secondary
Metabolite Unknown Region Finder (SMURF), have aided in locating SM clusters in
fungi (Khaldi et al., 2010). Additionally, the inclusion of a second sequenced strain of
A. fumigatus, A1163, has resulted in the total number of SMs in A. fumigatus being
adjusted to 36 (Table 1.2) (Fedorova et al., 2008; Sanchez et al., 2012).
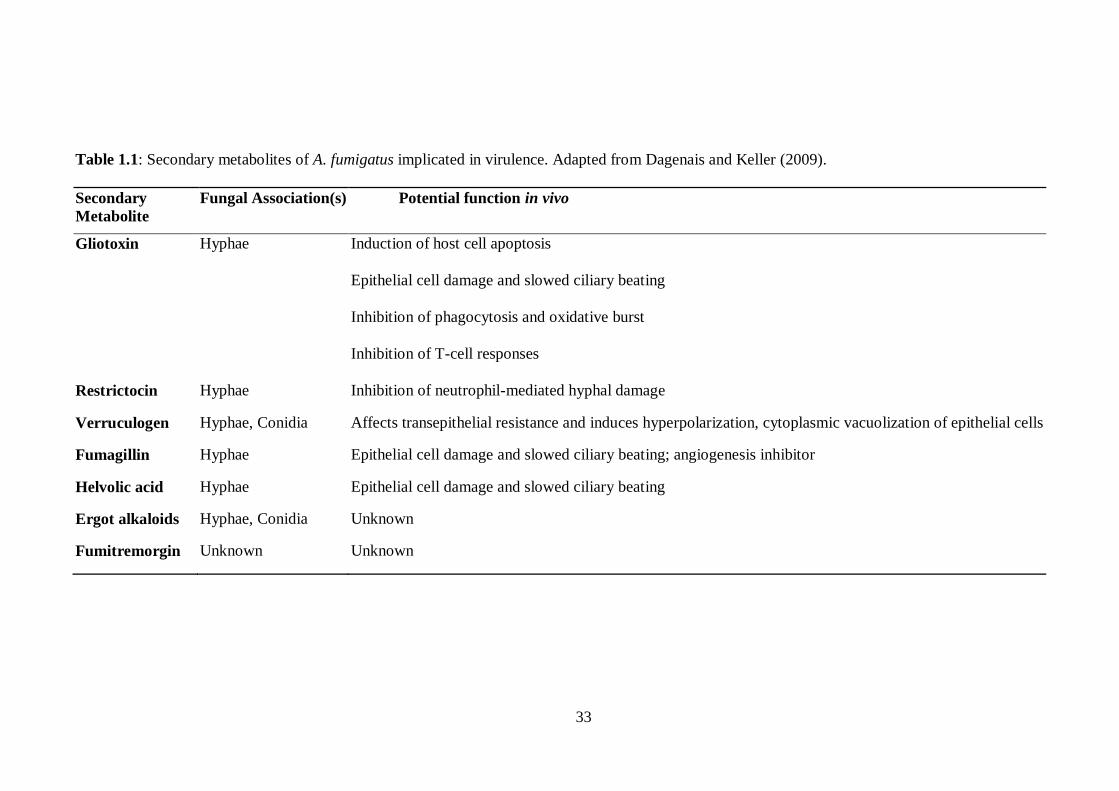
33
Table 1.1: Secondary metabolites of A. fumigatus implicated in virulence. Adapted from Dagenais and Keller (2009).
Secondary
Metabolite
Fungal Association(s) Potential function in vivo
Gliotoxin Hyphae Induction of host cell apoptosis
Epithelial cell damage and slowed ciliary beating
Inhibition of phagocytosis and oxidative burst
Inhibition of T-cell responses
Restrictocin Hyphae Inhibition of neutrophil-mediated hyphal damage
Verruculogen Hyphae, Conidia Affects transepithelial resistance and induces hyperpolarization, cytoplasmic vacuolization of epithelial cells
Fumagillin Hyphae Epithelial cell damage and slowed ciliary beating; angiogenesis inhibitor
Helvolic acid Hyphae Epithelial cell damage and slowed ciliary beating
Ergot alkaloids Hyphae, Conidia Unknown
Fumitremorgin Unknown Unknown

34
Figure 1.5: Structures of several secondary metabolites produced by A. fumigatus.
Images from Rundberget and Wilkins (2002); Kikuchi and Kakeya (2006); Frisvad et
al. (2009).

35
Characterisation of mechanisms required for the production of specific classes of
secondary metabolites has enabled the identification of similar clusters in disparate
species. The identification of the gliotoxin biosynthetic cluster in A. fumigatus was
facilitated by comparison with another previously characterised
epipolythiodioxopiperazine (ETP), sirodesmin, from Leptosphaeria maculans (Gardiner
and Howlett, 2005). Subsequently, both of these biosynthetic clusters were used to
identify other ETP clusters from across a range of fungi, and resulted in the detection of
a second smaller ETP cluster in A. fumigatus (Patron et al., 2007). Techniques routinely
used to identify and characterise secondary metabolites from fungi include organic
extraction, TLC, reversed-phase HPLC (RP-HPLC), LC-MS/MS and NMR. These
methodologies will be elaborated upon in Chapter 6.
1.7.2 Secondary Metabolite Cluster Regulation
Various factors can influence the production of secondary metabolites and regulation of
SM gene cluster expression is controlled by transcription factors. ‘Broad’-domain
transcription factors can co-regulate the expression of multiple gene clusters, resulting
in an integrated response to external stimuli (Keller et al., 2005). Conversely, ‘narrow’
range transcription factors, are often located within gene clusters and specifically
regulate expression of the respective SM pathway. Secondary metabolism is influenced
by external environmental factors, including pH, temperature, light and nutrient source,
in addition to morphological development (Calvo et al., 2002; Reverberi et al., 2010).
In A. terreus the production of the poyketide lovastatin, is influenced by the
carbon:nitrogen ratio, while the biosynthesis of aflatoxin in A. flavus is dependent on
temperature (Casas López et al., 2003; O’Brian et al., 2007).

36
Table 1.2: Secondary metabolism gene clusters in A. fumigatus, with central enzymes (e.g. NRPS, DMATS, PKS) listed.
Adapted from Sanchez et al. (2012).
No Af293 gene A1163 gene Gene Name Actual or predicted product
1 AFUA_1G01010 No homolog
2 AFUA_1G10380 AFUB_009800 pesB (pes1)
3 AFUA_1G17200 AFUB_016590 sidC ferricrocin, hydroxyferricrocin
4 AFUA_1G17740 AFUB_045790
5 AFUA_2G01290 AFUB_018370
6 AFUA_2G05760 AFUB_022790
7 AFUA_2G17600 AFUB_033290 alb1(pksP) YWA1
8 AFUA_3G01410 AFUB_046990
9 AFUA_3G02530 No homolog
10 AFUA_3G02570 No homolog
11 AFUA_3G02670 AFUB_045610
12 AFUA_3G03350 AFUB_044900 sidE
13 AFUA_3G03420 AFUB_044830 sidD fusarinine C, triacetylfusarinine C
14 AFUA_3G12920 AFUB_036270 pesF putative ETP
15 AFUA_3G13730 AFUB_035460 pesG
16 AFUA_3G14700 AFUB_034520
17 AFUA_3G15270 AFUB_033950 pesH

37
No Af293 gene A1163 gene Gene Name Actual or predicted product
18 AFUA_4G00210 AFUB_100730
19 AFUA_4G14560 AFUB_071800
20 AFUA_5G10120 AFUB_057720
21 AFUA_5G12730 AFUB_060400 pesI
22 AFUA_6G03480 AFUB_094810
23 AFUA_6G08560 AFUB_074520
24 AFUA_6G09610 AFUB_075660 pesJ
25 AFUA_6G09660 AFUB_075710 gliP gliotoxin
26 AFUA_6G12050 AFUB_078040 fumiquinazolines
27 AFUA_6G12080 AFUB_078070 fumiquinazolines
28 AFUA_6G13930 AFUB_000820 pyr2 pyripyropene A
29 AFUA_7G00160 AFUB_086700
30 AFUA_8G00170 AFUB_086360 ftmA fumitremorgins
31 AFUA_8G00370 AFUB_086200
32 AFUA_8G00540 AFUB_086030 psoA pseurotin A
33 AFUA_8G01640 AFUB_084950
34 AFUA_8G02350 AFUB_084240
35 No homolog AFUB_07971
36 No homolog AFUB_045640

38
A methyltransferase domain protein, LaeA, is a global regulator of secondary
metabolism and development in Aspergillus species (Bok and Keller, 2004; Sarikaya
Bayram et al., 2010). The function of LaeA is putatively executed via methyltransferase
activity and regulation of chromatin remodelling (Bok and Keller, 2004; Bok et al.,
2005; Keller et al., 2006; Perrin et al., 2007). LaeA was originally identified as a SM
regulator following complementation of the loss of sterigmatocystin biosynthesis from
A. nidulans, and was subsequently recognised as essential for the production of
penicillin and conidial pigments (Bok and Keller, 2004). In A. nidulans, two of the
velvet family of proteins, VeA and VelB, were shown to form a trimeric complex with
LaeA and subsequently up-regulate asexual development and secondary metabolism
(e.g. sterigmatocystin biosynthesis) (Bayram et al., 2008). Translocation of VeA, and
consequently VelB, to the nucleus is inhibited by light and thus interaction with LaeA
occurs in the absence of light (Bayram et al., 2008; Sarikaya Bayram et al., 2010).
While a similar trimeric interaction (VelB-VeA-LaeA) is noted in A. fumigatus, absence
of VeA and VelB did not affect biosynthesis of gliotoxin in A. fumigatus (Park et al.,
2012). A large-scale transcriptional investigation identified multiple SM gene clusters
under full or partial LaeA-regulation in A. fumigatus, including those involved in ergot
alkaloid biosynthesis and the gliotoxin biosynthetic cluster (Perrin et al., 2007). The
contribution of secondary metabolites to the pathogenicity of A. fumigatus was
evidenced by the reduction in virulence, in a neutropenic model of pulmonary
aspergillosis, upon deletion of the laeA gene (Bok et al., 2005). An increase in
macrophage-mediated conidial phagocytosis of ΔlaeA, was caused by a reduction in the
hydrophobic rodlet layer due to delayed expression of rodA (Bok et al., 2005; Dagenais
et al., 2010). Moreover, reduced killing of polymorphonuclear neutrophils (PMNs) by
ΔlaeA hyphae was due to reduction in secreted SMs, causing reduction in the PMN-
respiratory burst (Bok et al., 2005; Sugui et al., 2007a). During the onset of IA, a

39
significant number of the SM genes regulated by LaeA were increased in expression,
including member of the pseurotin and gliotoxin gene clusters (McDonagh et al., 2008).
1.8 Gliotoxin
1.8.1 General Information
Gliotoxin is classified as an epipolythiodioxopiperazine (ETP) toxin, and is
produced by a range of fungal species including A. fumigatus, A. terreus, A. flavus, A.
oryzae, Trichoderma virens and some Penicillium species (Patron et al., 2007). ETPs
are characterised by the presence of an internal disulphide bridge across a
dioxopiperazine ring, formed from a modified cyclic dipeptide (Gardiner et al., 2005b;
Fox and Howlett, 2008). The toxicity and reactivity of gliotoxin is mediated by the
disulphide bridge, which can cross-link proteins through reaction with thiol-containing
cysteine residues (Patron et al., 2007). Additionally, gliotoxin is a redox-active
metabolite, generating ROS as it cycles between its oxidised (disulphide) and reduced
(dithiol) forms (Figure 1.6) (Gardiner and Howlett, 2005). Gliotoxin (C13H14N2O4S2) is
a 326 Da metabolite, and through radiolabelled isotope feeding experiments the
precursor molecules for the diketopiperazine core were found to be phenylalanine and
serine (Suhadolnik and Chenowath, 1958; Winstead and Suhadolnik, 1960). Gliotoxin
has been extensively studied for its toxicity properties towards mammalian cells, with
anti-microbial activity also attributed to this molecule (Pardo et al., 2006; Carberry et
al., 2012).

40
Figure 1.6: Redox cycling between the reduced (1) and oxidised (2) forms of gliotoxin,
with the oxidation of gliotoxin producing ROS. From Gardiner and Howlett (2005).

41
1.8.2 Gliotoxin Biosynthesis
As mentioned previously, the genes for gliotoxin biosynthesis are clustered
together, and the gli cluster is comprised of thirteen genes (Figure 1.7a) (Gardiner and
Howlett, 2005; Schrettl et al., 2010). Functional genomics demonstrated that the NRPS,
GliP, is essential for the production of gliotoxin (Cramer et al., 2006; Kupfahl et al.,
2006; Spikes et al., 2008). The initial step in the biosynthesis of gliotoxin was
subsequently elucidated, through heterologous expression and purification of GliP from
Escherichia coli (Balibar and Walsh, 2006). GliP was observed to catalyse a
condensation reaction between L-phenylalanine and L-serine, resulting in the formation
of a dipeptide (Balibar and Walsh, 2006). GliP is the ‘backbone’ enzyme of the gli
cluster and is multi-modular, a feature of NRPSs. Release of the dipeptide from the GliP
enzyme occurs non-enzymatically, due to the absence of a thioesterase domain on the
NRPS, and results in a cyclic diketopiperazine molecule (Figure 1.7b) (Balibar and
Walsh, 2006; Davis et al., 2011a).
An integral stage in the formation of gliotoxin is the introduction of the sulphur
atoms that confer the signature redox activity to gliotoxin. Since neither phenylalanine
nor serine are sulphur-containing amino acids, other molecular species were proposed as
potential sulphur donors, including cysteine, methionine and sodium sulphate
(Suhadolnik and Chenowath, 1958; Gardiner et al., 2005b). A putative glutathione-S-
transferase gene, gliG, is situated within the cluster, and presented a potential route for
sulphur incorporation into the gliotoxin precursor (Gardiner et al., 2005b). This
hypothesis was confirmed through functional genomics whereby the gliG was deleted,
resulting in abrogation of gliotoxin biosynthesis and accumulation of an off-pathway
shunt metabolite (Molecule 4; Figure 1.7b) (Davis et al., 2011a; Scharf et al., 2011).
Davis et al. (2011a) validated the glutathione-S-transferase (GST) activity of the

42
enzyme using recombinant GliG and demonstrated that GliG does not confer auto-
protection against exogenous gliotoxin. Scharf et al. (2011) demonstrated the activity of
the P450 monooxygenase, GliC,which is required for a hydroxylation reaction prior to
the GliG-mediated conjugation of glutathione (GSH) to the gliotoxin precursor. The
function of a number of GSTs relates to detoxification of non-polar compounds (i.e.
xenobiotics) through conjugation of GSH, allowing subsequent metabolism of the
glutathionylated molecule. While the proposed gliotoxin biosynthetic pathway partially
resembles this mechanism, GliG is phylogenetically distinct from these detoxification
enzymes (Davis et al., 2011a; Scharf et al., 2011).
Exposure of the thiol groups of gliotoxin was predicted to be catalysed by GliI
utilising pyridoxyl-5’-phophate (PLP) as a co-factor (Figure 1.5) (Fox and Howlett,
2008; Davis et al., 2011a; Scharf et al., 2011). Recently, the activity of GliI as a C-S
lyase was experimentally verified, and was demonstrated to perform concurrent
cleavage for the formation of both thiols in the ETP (Scharf et al., 2012a). Identification
of a cytosolic, water-soluble intermediate, exclusive to the gliI mutant (ΔgliI), enabled
elucidation of the mechanism of action of this enzyme in gliotoxin biosynthesis (Scharf
et al., 2012a).
The final step in gliotoxin biosynthesis has also been elucidated and involves the
oxidation of the dithiol form of gliotoxin to form the disulphide bridge (Figure 1.7)
(Scharf et al., 2010; Schrettl et al., 2010). This action is mediated by the enzyme, GliT,
which was initially annotated as a thioredoxin reductase. While dithiol to disulphide
oxidation is required to complete the biosynthesis of gliotoxin, GliT also exhibits
NADPH-dependant gliotoxin reductase activity (Schrettl et al., 2010). This mechanism
is key in the auto-protection of A. fumigatus from the toxic effects exerted by gliotoxin
through the disulphide bond. Indeed deletion of gliT resulted in a phenotype that was

43
hypersensitive to exogenous gliotoxin, confirming the role of GliT in self-protection
against gliotoxin (Scharf et al., 2010; Schrettl et al., 2010). Additionally, transformation
of gliT into A. nidulans and S. cerevisiae conferred gliotoxin resistance to these
typically sensitive species. Hlm1, a functionally homologous enzyme to GliT was
recently identified in Streptomyces clavuligerus and is associated with the production of
the antibiotic, holomycin. As with GliT, Hlm1 is responsible for the oxidation of the
dithiol in the final step of holomycin biosynthesis, and also confers protection against
the toxic effects of this molecule (Li and Walsh, 2011).
The gli cluster also contains a selection of genes that are not directly involved in
the gliotoxin biosynthetic process, namely the transporter, gliA, and the transcriptional
regulator, gliZ. The gliA gene encodes a transporter of the major facilitator superfamily
(MFS), while the homologous gene in the sirodesmin cluster of L. maculans, sirA,
encodes an ATP binding cassette (ABC) transporter (Gardiner and Howlett, 2005). MFS
transporters are more commonly found in fungal toxin biosynthetic clusters (e.g.
aflatoxin) than ABC transporters (Gardiner et al., 2005a). Disruption of the gliA
homolog, sirA, in L. maculans resulted in increased secretion of sirodesmin, indicating
that SirA is not solely responsible for efflux of sirodesmin from the cell. Despite this
observation, ΔsirA demonstrated enhanced sensitivity to exogenous sirodesmin and
gliotoxin, relative to the parent strain (Gardiner et al., 2005a). Furthermore,
complementation of ΔsirA with gliA resulted in acquired tolerance to gliotoxin but not
sirodesmin. This indicates that the MFS transporter, GliA, specifically imparts auto-
protection against the gliotoxin through its action as an efflux pump.
Regulation of the gli cluster expression is controlled by the global transcription
factor, LaeA (Bok and Keller, 2004). Additionally, a narrow range transcriptional
regulator, GliZ, is present within the cluster and regulates the expression of the cluster

44
genes in response to various stimuli (Bok et al., 2006; Schrettl et al., 2010). GliZ is a
Zn2Cys6 transcription factor and deletion of gliZ gene results in abolition of gliotoxin
biosynthesis due to loss of expression of a number of gli cluster genes, including gliA,
gliG and gliI (Bok et al., 2006; Schrettl et al., 2010). Exogenous gliotoxin induces gli
cluster expression, a process mediated by GliZ (Schrettl et al., 2010). In the absence of
gliZ, gliotoxin is unable to induce expression of cluster components such as gliG or
gliA, however gliT expression is regulated independently of gliZ (Schrettl et al., 2010).
While deletion of gliZ resulted in reduced virulence of A. fumigatus in an insect model
of infection, ΔgliZ demonstrated no significant change in pathogenicity in a murine IA
infection model relative to the parent strain (Bok et al., 2006; Schrettl et al., 2010). This
is in contrast to deletion of the global SM regulator, laeA, which resulted in reduced
virulence owing to the disruption of SM biosynthesis (Bok et al., 2005, 2006).
Furthermore, supernatants from both ΔlaeA and ΔgliZ triggered significantly less
apoptosis of PMN in vitro, relative to the respective parent strains (Bok et al., 2006).
Recently, differential metabolomic analysis has resulted in the identification of a
number of gliZ-dependent metabolites (Forseth et al., 2011). While many of these
molecules represent shunt metabolites of the gliotoxin biosynthesis pathway, they may
elaborate on the mechanisms involved in gliotoxin biosynthesis (Forseth et al., 2011).
Several of the sulphurised gliZ-dependent metabolites identified were S-methylated,
including the previously characterised bisdethiobis(methylthio)gliotoxin, with a methyl
group bound to each of the thiol groups on the piperazine ring (Forseth et al., 2011).
While the significance of this thiol methylation is not yet understood, this may represent
a mechanism by which to reduce the toxicity of gliotoxin and associated intermediates
in A. fumigatus, through capping of the reactive moieties.
45
To date, the putative functions of the other members of the gli cluster have not
been experimentally validated. While both gliC and gliF genes are predicted to encode
cytochrome P450 monooxygenases, the hydroxylation of the diketopiperazine, prior to
C-S bond formation, does not appear to involve GliF (Scharf et al., 2011). GliM and
GliN have putative assigned functions as an O-methyltransferase and a
methyltransferase, respectively, and both genes have homologs in the sirodesmin
biosynthetic cluster (Gardiner and Howlett, 2005). Transfer of methyl groups to
gliotoxin precursors is likely mediated through the methyl donor S-adenosylmethionine
(SAM) (Davis et al., 2011a). Additionally, a GliM homolog is also found in a second
smaller putative ETP biosynthetic cluster in A. fumigatus (Kremer et al., 2007; Patron et
al., 2007). A putative dipeptidase, GliJ, may act by cleavage of L-glutamate groups
from the bis-glutathionylated intermediate (Molecule 8; Figure 1.7) or alternatively may
release the cyclic peptide, tethered to the GliP enzyme (Fox and Howlett, 2008; Davis et
al., 2011a; Scharf et al., 2011). Finally, two unknown function proteins, GliK and GliH
are included in the gli cluster. GliH (AFUA_6G09745) was recently recognised as a
member of the gliotoxin biosynthetic cluster and is not involved in self-protection
against gliotoxin (Schrettl et al., 2010). Prior to the work carried out in this thesis, the
function of GliK had not been investigated. No GliK homolog is present in the
sirodesmin biosynthetic cluster in L. maculans, indicating that the function of GliK may
be specific to gliotoxin biosynthesis as opposed to broad ETP synthetic activity
(Gardiner and Howlett, 2005; Gardiner et al., 2005b). Indeed, gliK-like genes are only
found in gliotoxin-producing species such as A. oryzae, A. terreus and T. virens (Patron
et al., 2007). Additionally, the presence of gliK in fungal ETP clusters coincides with
the presence of a MFS transporter as opposed to an ABC transporter in that cluster
(Patron et al., 2007). Elucidation of the contribution of GliK to A. fumigatus

46
biochemistry and gliotoxin production could aid in the characterisation of this protein in
other organisms.

47
a.
b.
Figure 1.7: (a) Gliotoxin biosynthetic cluster and (b) proposed biosynthetic pathway.
GliP-mediated conjugation of L-Phe and L-Ser lead to the formation of an acyl imine
intermediate (7), which undergoes glutathionylation via GliG. Subsequent reactions,
putatively catalysed by GliJ and GliI de-protect the thiol groups on the gliotoxin
precursor. From Scharf et al. (2012) and Davis et al. (2011), respectively.

48
1.8.3 Gliotoxin: Effects on host cells
Gliotoxin has been shown to elicit a range of modulatory mechanisms on
immune and non-immune cells, both in vitro and in vivo (Pardo et al., 2006; Kwon-
Chung and Sugui, 2009). Induction of mammalian cell apoptosis has been associated
with gliotoxin, and this effect has been demonstrated in a range of cells from the
immune system. Polymorphonuclear (PMN) cells undergo apoptosis following
incubation with purified gliotoxin in vitro, in both hypoxic and normoxic conditions
(Dyugovskaya et al., 2011). Apoptosis of monocytes, the precursors of macrophages,
was also induced by gliotoxin (Stanzani et al., 2005; Orciuolo et al., 2007). Culture
supernatants from A. fumigatus mutants, deficient in gliotoxin production (e.g. ΔgliP,
ΔgliZ), induced significantly less apoptosis in PMN and macrophage-like cells (Bok et
al., 2006; Kupfahl et al., 2006; Sugui et al., 2007b). Gliotoxin-induced apoptosis is
mediated by a member of the proapoptotic Bcl-2 family, Bak (Pardo et al., 2006). The
Bak protein is localised in the mitochondria of mammalian cells and elicits initiation of
apoptosis following a conformational change in response to cell-damage stimuli (Figure
1.8) (Griffiths et al., 1999). Subsequent oligomerisation of the Bak protein occurs and
creates a pore in the mitochondrial membrane resulting in membrane permeability
(Dewson et al., 2009). Gliotoxin interacts with the Bak protein to cause a
conformational change and consequently leads to ROS production and disruption of the
mitochondrial membrane (Figure 1.8) (Pardo et al., 2006). Interestingly oligomerisation
of the Bak protein involves cysteine linkages (Dewson et al., 2009) and may represent
the mode of action for gliotoxin activation of this process. Following activation of Bak,
release of other proapoptotic factors, including cytochrome c and apoptosis-inducing
factor (AIF), from the mitochondria ultimately results in cell death (Figure 1.8). This

49
mechanism contributes to the virulence of the fungus, with mice deficient in Bak
exhibiting reduced mortality in a corticosteroid model of IA (Pardo et al., 2006).
Figure 1.8: Proposed mechanism of gliotoxin (GT)-induced apoptosis. Gliotoxin
produced by A. fumigatus enters mammalian cells and causes a conformational change
in the mitochondrial Bak protein. This results in mitochondrial membrane disruption,
depolarisation (↓Δψm) and ROS production, leading to release of pro-apoptotic proteins
and cell death. AIF, apoptosis-inducing factor; Cyt c, cytochrome C. Adapted from
Pardo et al. (2006).

50
Another mechanism employed by gliotoxin, to suppress the immune response to
A. fumigatus, is the inhibition of the NADPH-dependent oxidative burst from PMN
cells such as neutrophils. Culture supernatants from gliotoxin-producing strains of A.
fumigatus inhibited the oxidative burst of human neutrophils, while gliotoxin-deficient
mutants had no inhibitory effects (Sugui et al., 2007b). ROS generation is achieved
through the NADPH oxidase enzyme, which generates O2- from molecular oxygen
(Figure 1.9). Release of ROS from immune effector cells contributes to the killing of
invading microorganisms, and defects in NADPH oxidase (e.g. CGD) result in
increased incidence of invasive fungal infections (IFIs) (Henriet et al., 2012). The
components of NADPH oxidase are dispersed between the cytosol and the membrane in
resting cells. Upon stimulation the cytosolic elements (p47phox
, p67phox
, p40phox
and
Rac2) translocate to the membrane and assemble with flavocytochrome b558 (Figure
1.9). Gliotoxin inhibits the assembly and activation of the NADPH oxidase enzyme
through disruption of the translocation of p47phox
, p67phox
and p40phox
to the membrane
(Tsunawaki et al., 2004). Furthermore, gliotoxin directly interacts with flavocytochrome
b558, inhibiting electron transport capabilities prior to assembly of the oxidase enzyme
(Nishida et al., 2005). These authors postulated that the mechanism of inhibition of
flavocytochrome activity was through the reaction of gliotoxin with available cysteines
on the protein. In this way gliotoxin prevents the activation of NADPH oxidase but it
not effective in inhibiting the activity of the assembled enzyme (Tsunawaki et al.,
2004). The action of gliotoxin is mediated through the disulphide bridge on the ETP
molecule, and blocking the thiol groups of gliotoxin negated the effect of the metabolite
on NADPH activation (Tsunawaki et al., 2004).

51
Figure 1.9: Model of assembled NADPH oxidase enzyme at cell membrane, and
associated activities. SOD, superoxide dismutase; MPO, myeloperoxidase. From Segal
and Romani (2009).

52
Angiogenesis, the formation of new blood vessels from existing ones, is a
feature of IA and occurs possibly in response to tissue hypoxia associated with invasion
of the pulmonary vasculature (Ben-Ami et al., 2010). Following interaction with A.
fumigatus hyphae, endothelial cells release proinflammatory cytokines, including TNFα
and IL-8, and this event is not affected by the presence or absence of gliotoxin (Chiang
et al., 2008). The activation of pro-angiogenic signalling pathways is elicited by these
cytokines, resulting in the induction of vascular endothelial growth factor (VEGF) and
basic fibroblast growth factor (bFGF) (Yoshida et al., 1997). Cytokine-mediated
recruitment of PMN cells to the site of infection results in the release of ROS, and
consequently, induction of NF-κB. Further up-regulation of pro-angiogenic molecules is
induced by NF-κB (Figure 1.10). ROS, including H2O2, derived from NADPH oxidase,
are important mediators of angiogenesis (Ushio-Fukai and Alexander, 2004). Gliotoxin
performs an anti-angiogenic function through reduction of ROS generation by PMN
cells and inhibition of NF-κB (Figure 1.10). Gliotoxin also has the potential to act as an
antioxidant, reducing intracellular H2O2 to H2O via the mammalian thioredoxin redox
system, hence eliminating a potent inducer of NF-κB and angiogenesis (Choi et al.,
2007). By replacing the function of 2-cys peroxiredoxin, gliotoxin reduces H2O2 in a
dose-dependent manner, thus preventing H2O2-induced angiogenesis (Choi et al., 2007).
Redox-cycling between the oxidised and reduced forms of gliotoxin is integral to this
action and involves the transfer of electrons from NADPH to gliotoxin (Choi et al.,
2007). This suggests a dual-function for gliotoxin, in production and neutralisation of
ROS, and further investigation of this dichotomy is required to understand the role of
gliotoxin in A. fumigatus and pathogenesis. Despite the pro-angiogenic signals elicited
by A. fumigatus infection, culture filtrates were demonstrated to have potent anti-
angiogenic properties in vitro (Ben-Ami et al., 2009).
53
Figure 1.10: Pro- and anti-angiogenic signals in IA. Pro-angiogenic factors secreted
from endothelial cells, macrophages and PMN cells are positioned on the left of the
image. The anti-angiogenic activities elicited by gliotoxin are indicated on the right of
the figure. From Ben-Ami et al. (2010).

54
This anti-angiogenic activity is attributable to secondary metabolites in A.
fumigatus, as evidenced by the loss of this activity from the ΔlaeA mutant. Using a
gliotoxin-deficient mutant, ΔgliP, these authors verified that gliotoxin was responsible
for approximately 40% of the LaeA-dependent anti-angiogenic activity of A. fumigatus
(Ben-Ami et al., 2009, 2010).
A number of other immunomodulatory effects are attributable to gliotoxin and
may contribute to the virulence of A. fumigatus in vivo. These functions include
inhibition of T-cell responses, impairment of phagocytosis and reduction in ciliary
movement of epithelial cells (Abad et al., 2010). Gliotoxin interferes with human T-cell
activation, suppressing the response of these cells to antigens. This action is
accomplished by inhibition of antigen presentation as opposed to directly impairing T-
cell function (Stanzani et al., 2005). Gliotoxin also impedes the activities of cytotoxic T
lymphocytes (CTLs) through blocking the binding of CTLs to target cells (Yamada et
al., 2000). Again, the disulphide bridge of gliotoxin is indispensible for this process, as
reduced gliotoxin (i.e. dithiol form) was unable to inhibit CTL-mediated cytotoxicity
(Yamada et al., 2000). The influence of gliotoxin on phagocytosis has also been
highlighted, with low concentrations of gliotoxin significantly inhibiting the phagocytic
capacity of human PMN cells (Coméra et al., 2007; Orciuolo et al., 2007). It was also
noted that gliotoxin promoted cytoskeleton reorganisation, with F-actin collapse noted
around nuclei of affected cells, however it was proposed that these events were
independent (Coméra et al., 2007). Through inhibition of phagocytosis, gliotoxin could
contribute to the persistence of A. fumigatus in infected tissue. Additionally, reduction
in the rate of ciliary movement, as caused by gliotoxin, could result in impaired
clearance of inhaled conidia from the lung and reduced capacity to keep conidia from
reaching the epithelium (Amitani et al., 1995).

55
The variety of host mechanisms affected by gliotoxin is due to the disulphide
bridge across the piperazine ring. This confers the ability to cross-link proteins or other
molecules via thiol residues and can result in antagonism of active sites or induction of
conformational changes, disrupting protein function (Waring et al., 1995; Hurne et al.,
2000; Srinivasan et al., 2006). Furthermore, redox cycling between the reduced (dithiol)
and oxidised (disulphide) forms of gliotoxin can produce ROS, with deleterious effects
(Bernardo et al., 2003; Gardiner et al., 2005b; Kwon-Chung and Sugui, 2009). As
discussed in the previous section, ROS reducing activity is also possible through
incorporation into the thioredoxin redox system (Choi et al., 2007), contributing to the
multi-faceted role of gliotoxin. An increase in the potency of gliotoxin is observed upon
reduction of mammalian cell density, as a result of active concentration of the toxin
within cells (Bernardo et al., 2003). The oxidised (disulphide) form of gliotoxin can
gain entry into cells while the reduced (dithiol) form cannot permeate cells (Bernardo et
al., 2003). This mechanism forms the basis of gliotoxin accumulation in cells and the
consequent execution of toxic effects. Oxidised gliotoxin, is subsequently reduced by
intracellular glutathione (GSH) leading to concentration of reduced gliotoxin within the
cell (Figure 1.11). The ensuing depletion of glutathione leads to reversion of gliotoxin
to the oxidised form and efflux is restored. Glutathione-dependent accumulation of
gliotoxin correlated with an increase in mammalian cell apoptosis and hence defines a
route by which this metabolite exerts its effects (Bernardo et al., 2003). This process
allows recycling of gliotoxin from apoptotic cells and increases the efficiency of
cytotoxicity. These authors also postulated that the accrual of gliotoxin intracellularly
could be caused by other cellular reductants, in addition to glutathione, indicating
intracellular redox potential as a moderator of gliotoxin susceptibility.

56
Figure 1.11: Schematic representation of glutathione-dependent accumulation of
gliotoxin inside cells. (1) Oxidised gliotoxin passes into cells and (2) is reduced by
intracellular glutathione (GSH). (3) Reduced gliotoxin is unable to permeate cells and
so is concentrated intracellularly. (4) Depletion of intracellular GSH leads to
spontaneous re-oxidation of gliotoxin (Bernardo et al., 2003).

57
Despite the range of effects of gliotoxin on mammalian cells, the contribution of
gliotoxin to the pathogenicity of A. fumigatus has been debated. Mouse models infected
with gliotoxin-deficient strains of A. fumigatus displayed divergent results, making the
definition of gliotoxin as a virulence factor tentative. The immunosuppression regime
utilised for the IA infection model appears to be of paramount importance in assessing
the effect of gliotoxin on the pathogenicity of A. fumigatus. Mice treated with
cyclophosphamide (inducing neutropenia) coupled with corticosteroids demonstrated
comparable mortality rates when infected with gliotoxin-deficient strains of A.
fumigatus (ΔgliP, ΔgliZ), relative to the respective gliotoxin-producing parent strains
(Bok et al., 2006; Cramer et al., 2006; Kupfahl et al., 2006; Spikes et al., 2008). These
results appeared to indicate that gliotoxin did not contribute significantly to the
development of IA in the absence of neutrophils. Conversely, when corticosteroids were
used alone for immunosuppression, gliotoxin-deficient strains of A. fumigatus displayed
significantly reduced pathogenicity compared to the wild-type strains (Sugui et al.,
2007b; Spikes et al., 2008). This observation correlates with the effects of gliotoxin on
neutrophils and suggests that gliotoxin contributes to virulence in a non-neutropenic
setting but may be dispensable in a more severely immunocompromised host.
In addition to induction of toxicity in mammalian cells, gliotoxin also exhibits
anti-fungal effects (Losada et al., 2009; Schrettl et al., 2010; Coleman et al., 2011;
Carberry et al., 2012). Metabolite extracts from A. fumigatus, containing gliotoxin, were
demonstrated to induce moderate inhibition on a number of Aspergillus species, and this
may have contributed to A. fumigatus out-competing A. clavatus in co-culture
conditions at 37 °C (Losada et al., 2009). Carberry et al. (2012) confirmed the activity
of gliotoxin against a number of filamentous fungi, including A. terreus, A. niger and
Neurospora crassa. The activity of gliotoxin against various species of yeast has also

58
been illustrated, with potent anti-fungal activity observed against C. albicans,
Cryptococcus neoformans and Saccharomyces cerevisiae (Coleman et al., 2011;
Carberry et al., 2012). This anti-fungal activity may confer a competitive advantage to
A. fumigatus in its environmental niche or in the human host. Furthermore the
sensitivity of fungal strains to gliotoxin was linked to glutathione levels, as observed in
mammalian cells (Bernardo et al., 2003; Carberry et al., 2012). Deletion of a
glutathione biosynthetic enzyme, gsh1, in S. cerevisiae correlated with reduced
sensitivity to gliotoxin. Similarly, elevated GSH levels were present in the gliotoxin
sensitive mutant A. fumigatus ΔgliT, which, in addition to GliT absence, may contribute
to the potency of gliotoxin (Carberry et al., 2012). The presence of mechanisms for
gliotoxin resistance in A. fumigatus, including the gliotoxin oxidoreductase GliT and the
putative gliotoxin transporter GliA, provide protection from the toxic effects of
gliotoxin (Scharf et al., 2010; Schrettl et al., 2010; Coleman et al., 2011). Additional
uncharacterised protective mechanisms may exist in A. fumigatus, which confer
resistance to gliotoxin. This allows A. fumigatus to remain tolerant to gliotoxin while
benefiting from its activity against competitors or host cells.

59
1.9 Thesis Rationale and Objectives
A large proportion of fungal proteins are annotated as ‘hypothetical’ or
‘conserved hypothetical’ due to a lack of sequence homology to functionally
characterised proteins (Brachat et al., 2003; Nierman et al., 2005). Many of these
proteins currently represent in silico predicitions from nucleic acid sequences, and with
no experimental detection, the existence of these proteins remains unconfirmed.
Expansion of fungal proteomics through large-scale detection of proteins by MS, can
aid in the corroboration of genome sequencing data. Furthermore, de novo elucidation
of functions for ‘hypothetical’ proteins and validation of bioinformatically assigned
functions, will greatly enhance the analysis and interpretation of data from future
studies (Lubec et al., 2005; Mazandu and Mulder, 2012). Determination of protein
function can also facilitate the retrospective analysis of previously conducted studies.
Strategies for the characterisation of proteins include identification of protein
localisation, in silico analysis, comparative analysis and determination of
immunogenicity of proteins of interest (Doyle, 2011b).
The GliK protein forms part of the gliotoxin biosynthesis cluster, but as of yet
the function of this protein has not been investigated (Gardiner and Howlett, 2005). No
role for GliK as part of the gliotoxin biosynthetic pathway has previously been
proposed. Characterisation of an A. fumigatus gliK deletion mutant by comparative
proteomic and metabolomic analysis should therefore aid in the elucidation of the role
of GliK in A. fumigatus biochemistry.
Therefore, the overall objectives of this thesis were as follows:
(i) To expand the identification of A. fumigatus proteins, both intracellular and
extracellular, through the use of MS-based proteomics.

60
(ii) To characterise the immunoreactivity of intracellular A. fumigatus mycelial proteins,
with subsequent identification of antigenic proteins.
(iii) Phenotypic characterisation of A. fumigatus ATCC26933 and ΔgliK to
combinatorial stresses of gliotoxin and H2O2, with subsequent use of comparative
proteomics for the identification of mechanisms involved in observed phenotypic
alterations.
(iv) To investigate the role of GliK in gliotoxin biosynthesis and overall A. fumigatus
biochemistry through comparative metabolite profiling of A. fumigatus ATCC26933
and ΔgliK.

CHAPTER 2
Materials and Methods

61
2 Chapter 2. Materials and Methods
2.1 Materials
All chemicals were purchased from Sigma-Aldrich Chemical Co. Ltd. (U.K.),
unless otherwise stated
2.1.1 Solutions for pH Adjustment
2.1.1.1 5 M Hydrochloric Acid (HCl)
Hydrochloric Acid (43.64 ml) was added slowly to deionised water (40 ml) in a
glass graduated cylinder. The final volume was adjusted to 100 ml with deionised water.
The solution was stored at room temperature.
2.1.1.2 5 M Sodium Hydroxide (NaOH)
NaOH pellets (20 g) were added to deionised water (80 ml) and dissolved using
a magnetic stirrer. The final volume was adjusted to 100 ml with deionised water. The
solution was stored at room temperature.
2.1.2 SDS-PAGE and Western Blotting Reagents
2.1.2.1 10 % (w/v) Sodium Dodecyl Sulfate (SDS)
SDS (10 g) was added to 80 ml of distilled water and dissolved. The solution
was adjusted to 100 ml with distilled water and stored at room temperature.
2.1.2.2 1.5 M Tris-HCl pH 8.3
Trizma-hydrochloride (23.64 g) was dissolved in 60 ml distilled water. The pH
was adjusted to 8.3 using 5 M NaOH (Section 2.1.1.2). The volume was adjusted to 100
ml with distilled water and stored at 4 °C.

62
2.1.2.3 0.5 M Tris-HCl pH 6.8
Trizma-hydrochloride (7.88 g) was dissolved in 60 ml distilled water. The pH
was adjusted to 6.8 using 5 M NaOH (Section 2.1.1.2). The volume was adjusted to 100
ml with distilled water and stored at 4 °C.
2.1.2.4 10% (w/v) Ammonium Persulfate (APS)
Ammonium persulfate (0.1 g) was added to 1 ml distilled water. The solution
was stored at 4 °C and used within 8 h.
2.1.2.5 1% (w/v) Bromophenol blue
Bromophenol blue (0.2 g) was added to distilled water (20 ml). The solution was
stored at 4 °C.
2.1.2.6 0.5% (w/v) Bromophenol blue
Bromophenol blue (0.1 g) was added to distilled water (20 ml). The solution was
stored at 4 °C.
2.1.2.7 5 X Solubilisation buffer
Glycerol (8 ml) was added to distilled water (4 ml), containing 1.6 ml of 10 %
(w/v) SDS (Section 2.1.2.1) and 1 ml of 0.5 M Tris-HCl, pH 6.8 (Section 2.1.2.3). 2-
mercaptoethanol (0.4 ml) was added to the solution along with 0.2 ml of 0.5 % (w/v)
bromophenol blue solution (Section 2.1.2.6). The solution was stored at -20 °C in
aliquots.

63
2.1.2.8 5 X SDS Electrode running buffer
Trizma base (30 g), glycine (144 g) and SDS (10 g) were added to 1600 ml
distilled water, and dissolved using a magnetic stirrer. The pH was adjusted to between
8.6 and 8.8. The final volume was adjusted to 2 L. The solution was stored at room
temperature.
2.1.2.9 1 X SDS Electrode running buffer
5 X SDS Electrode running buffer (200 ml) (Section 2.1.2.8) was added to 800
ml distilled water.
2.1.2.10 Coomassie® Blue Stain Solution
Distilled water (600 ml), glacial acetic acid (100 ml) and methanol (300 ml)
were added to a glass bottle containing 1 g Coomassie® Brilliant Blue R. The solution
was stored at room temperature.
2.1.2.11 Destain Solution
Glacial acetic acid (100 ml) was added to distilled water (600 ml) and methanol
(300 ml). The solution was stored at room temperature.
2.1.2.12 Gel Fixing Solution for Colloidal Coomassie® Stain
Phosphoric acid (30 ml) was added to ethanol (500 ml) and distilled water (470
ml). The solution was stored at room temperature.
2.1.2.13 Incubation Buffer for Colloidal Coomassie® Stain
Ammonium sulfate (170 g) was dissolved in a solution containing methanol
(340 ml), phosphoric acid (30 ml) and brought to 1 L with distilled water.

64
2.1.2.14 Towbin Electrotransfer Buffer for Semi-Dry Transfer
Trizma base (6.06 g) and glycine (28.8 g) were added to distilled water (600 ml)
and methanol (200 ml). The final volume was adjusted to 1 L with distilled water. The
solution was stored at room temperature.
2.1.2.15 Wet Transfer Buffer
Trizma base (3.03 g) and glycine (14.4 g) were added to distilled water (600 ml)
and methanol (200 ml). The final volume was adjusted to 1 L with distilled water. The
solution was stored at 4 °C.
2.1.2.16 Blocking Solution
Marvel® (Powdered milk) (5 g) was added to 100 ml PBST (Section 2.1.2.21)
2.1.2.17 BSA Blocking Solution
Marvel® (Powdered milk) (5 g) and bovine serum albumin (1 g) (BSA) were
added to 100 ml PBST (Section 2.1.2.21)
2.1.2.18 Antibody Buffer
Marvel® (Powdered milk) (1 g) was added to 100 ml PBST (Section 2.1.2.21)
2.1.2.19 BSA Antibody Buffer
Marvel® (Powdered milk) (1 g) and bovine serum albumin (1 g) (BSA) were
added to 100 ml PBST (Section 2.1.2.21).
2.1.2.20 Phosphate Buffered Saline (PBS)
One PBS tablet (Oxoid) was dissolved in 100 ml distilled water. The solution
was stored autoclaved at 121 °C for 15 min and stored at room temperature.

65
2.1.2.21 Phosphate Buffered Saline/ Tween-20 (PBST 0.05%)
Tween-20 (0.5 ml) was added to 1 L PBS (Section 2.1.2.20). The solution was
stored at room temperature.
2.1.2.22 DAB Substrate Buffer
Trizma-HCl (15.76 g) was added to 700 ml distilled water and the pH was
adjusted to 7.6 with 5 M NaOH (Section 2.1.1.2). The final volume was adjusted to 1 L.
2.1.2.23 Developing Solution
Developing Solution (Kodak, 200 ml) was added to 400 ml distilled water and
stirred. The bottle was stored at room temperature, protected from light.
2.1.2.24 Fixing Solution
Fixing Solution (Kodak, 150 ml) was added to 450 ml distilled water and stirred.
The bottle was stored at room temperature, protected from light.
2.1.2.25 8 M Urea
Urea (24 g) was dissolved in distilled water and brought to a final volume of 50
ml. The solution was stored at room temperature.
2.1.2.26 100 mM Borate Buffer pH 7.0
Borax (38.14 g) was dissolved in 800 ml distilled water and the pH was adjusted
to 7.0. The solution was brought to 1 L and stored at room temperature.

66
2.1.2.27 2 mM Borate Buffer pH 8.0
100 mM Borate buffer pH 7.0 (Section 2.1.2.26) (20 ml) was added to 800 ml
distilled water. The pH was adjusted to 8.0 and solution was brought to 1 L with
distilled water.
2.1.3 Mass Spectrometry Reagents
2.1.3.1 100 mM Ammonium bicarbonate (NH4HCO3)
NH4HCO3 (395 mg) was dissolved in deionised water (50 ml). The solution was
prepared fresh on day of use.
2.1.3.2 50 mM Ammonium bicarbonate (NH4HCO3)
100 mM ammonium bicarbonate (Section 2.1.3.1) (5 ml) was added to 5 ml of
deionised water. The solution was prepared fresh on day of use.
2.1.3.3 10 mM Ammonium bicarbonate(NH4HCO3)
100 mM ammonium bicarbonate (Section 2.1.3.1) (1 ml) was added to 9 ml of
deionised water. The solution was prepared fresh on day of use.
2.1.3.4 1 M Dithiotreitol (DTT)
DTT (154 mg) was dissolved in 100 mM ammonium bicarbonate (Section
2.1.3.1) (1 ml). The solution was prepared fresh on day of use.
2.1.3.5 1 M Iodoacetamide
Iodoacetamide (185 mg) was dissolved in 100 mM ammonium bicarbonate
(Section 2.1.3.1) (1 ml). The solution was prepared fresh on day of use.

67
2.1.3.6 Whole Protein Lysate Fungal Extraction Buffer
Trizma hydrochloride (790 mg), Guanidine hydrochloride (114.6 g) and DTT
(308 mg) were dissolved in distilled water (150 ml). The pH was adjusted to 8.6 using 5
M NaOH (Section 2.1.1.2) and the solution was brought to 200 ml. The solution was
stored at 4 °C.
2.1.3.7 Trypsin diluent
100 mM ammonium bicarbonate (Section 2.1.3.1) (1 ml) and acetonitrile (1 ml)
were brought to 10 ml with distilled water. The solution was prepared fresh on day of
use.
2.1.3.8 0.1 % (v/v) Formic Acid
Formic Acid (1 ml) was added to LC-MS grade water (1 L).
2.1.3.9 10 % (v/v) Methanol in 0.1% (v/v) Formic Acid
HPLC-grade methanol (1 ml) was added to 0.1 % (v/v) formic acid (9 ml)
(Section 2.1.3.8).
2.1.3.10 0.1 % (v/v) Trifluoroacetic acid (TFA)
Trifluoroacetic acid (TFA) (10 µl) was added to HPLC-grade water (9.99 ml).
This solution was prepared immediately before use.
2.1.3.11 Matrix (α-cyano-4-hydroxycinnamic acid) (4-HCCA)
Trifluoroacetic acid (Section 2.1.3.10) (0.1 % (v/v); 350 µl) was added to 4-
HCCA (5 mg) and vortexed for 30 s. Acetonitrile (350 µl) was added to the mixture and
vortexed for an additional 30 s. The sample was centrifuged at 13000 rpm for 1 min in a

68
microfuge and 200 µl of the supernatant was retained. Internal calibrants, hATCH 19 -
39 and Angiotensin fragment III, were added in sufficient quantities for visualisation by
MALDI-ToF analysis.
2.1.4 Reverse Phase-High Performance Liquid Chromatography (RP-HPLC)
Reagents
2.1.4.1 Solvent A: 0.1 % (v/v) Trifluoroacetic Acid (TFA) in HPLC grade water
TFA (1 ml) was added to 1 L of HPLC grade water. Solution was prepared fresh
on day of use.
2.1.4.2 Solvent B: 0.1 % (v/v) Trifluoroacetic Acid (TFA) in HPLC grade
Acetonitrile
TFA (1 ml) was added to 1 L of HPLC grade acetonitrile. Solution was prepared
fresh on day of use.
2.1.5 Aspergillus Media and Reagents
2.1.5.1 Aspergillus Trace Elements
Na2B4O7.7H2O (0.04 g), CuSO4.5H20 (0.4 g), Fe (III) SO4.2H2O (0.8 g),
Na2MoO.2H20 (0.8 g), ZnSO4.7H2O (8 g) were dissolved in deionised water (900 ml) in
the order given. The solution was adjusted to a final volume of 1 L with deionised
water. The solution was split into 50 ml aliquots and stored at - 20 °C
2.1.5.2 50 X Aspergillus Salt Solution
KCl (26 g), MgSO4.7H20 (26 g), KH2PO4 (76 g) and Aspergillus Trace elements
(50 ml) (Section 2.1.5.1) were dissolved in 800 ml distilled water. The solution was

69
brought to 1 L with distilled water and autoclaved. Chloroform (2 ml) was added to the
solution and it was stored at room temperature.
2.1.5.3 100 X Ammonium Tartrate
Ammonium tartrate (92 g) was dissolved in 1 L of distilled water and
autoclaved. The solution was stored at room temperature.
2.1.5.4 0.3 M L-glutamine
L-glutamine (43.8 g) was dissolved in 800 ml distilled water, with 1-2 drops of 5
M HCl (Section 2.1.1.1) added to aid solubility. The pH was adjusted to 6.5 and brought
to a final volume of 1 L with distilled water. The solution was filter sterilised (0.22 µm
filter) and stored at room temperature.
2.1.5.5 Aspergillus Minimal Media (AMM)
100 X ammonium tartrate (10 ml) (Section 2.1.5.3), 50 X Aspergillus salt
solution (20 ml) (Section 2.1.5.2) and glucose (10 g) were added to 800 ml distilled
water and dissolved. The pH was adjusted to 6.8 and the solution was made up to 1 L
with distilled water. The solution was autoclaved at 105 °C for 30 min and stored at
room temperature.
2.1.5.6 Aspergillus Minimal Media (AMM) Agar
100 X ammonium tartrate (10 ml) (Section 2.1.5.3), 50 X Aspergillus salt
solution (20 ml) (Section 2.1.5.2) and glucose (10 g) were added to 800 ml distilled
water. The pH was adjusted to 6.8. Agar (18 g) (Scharlau Chemie S.A., Barcelona,
Spain) was added to the solution and made up to 1 L with distilled water. The solution
was autoclaved at 105 °C for 30 min and allowed to cool to ~50 °C before being poured

70
into 90 mm petri dishes under sterile conditions. The plates were allowed to set and
were stored at 4 °C.
2.1.5.7 Malt Extract Agar (MEA)
Malt extract agar (50 g) (Oxoid Ltd, Hants., England) was dissolved in 1 L of
distilled water. Agar solution was autoclaved at 115 °C for 10 min and allowed to cool
to ~50 °C before being poured into 90 mm petri dishes under sterile conditions.
2.1.5.8 Sabouraud Dextrose Broth
Sabouraud dextrose powder (30 g) (Oxoid Ltd, Hants., England) was dissolved
in 1 L of distilled water. Solution was autoclaved at 121 °C for 15 min.
2.1.5.9 Czapek-Dox Broth
DifcoTM
Czapek-Dox powder (35 g) (BD Biosciences) was dissolved in 1 L of
distilled water and autoclaved at 121 °C for 15 min.
2.1.5.10 Czapek-Dox Agar
Agar (18 g) (Scharlau Chemie S.A., Barcelona, Spain) was added to 1L of
Czapek-Dox broth (Section 2.1.5.9). The solution was autoclaved at 121 °C for 15 min
and allowed to cool to ~50 °C before being poured into 90 mm petri dishes under sterile
conditions. The plates were allowed to set and were stored at 4 °C.
2.1.5.11 YES broth
Yeast extract (20 g) and sucrose (40 g) were dissolved in 800 ml distilled water.
The pH was adjusted to 5.8 and the solution was adjusted to a final volume of 1 L with
distilled water. The solution was autoclaved at 121 °C for 15 min to sterilise.

71
2.1.5.12 RPMI media
Sucrose (10g) was dissolved in RPMI 1640 (400 ml) and the volume was
adjusted to 465 ml with RPMI 1640. The solution was autoclaved at 121 °C 15 min to
sterilise. L-glutamine (0.3 M; 35 ml) (Section 2.1.5.4) was added using sterile
techniques once the media had cooled to 50 °C.
2.1.5.13 Phosphate Buffered Saline/ Tween-20 (PBST 0.1% (v/v))
Tween-20 (1 ml) was added to 1 L PBS (Section 2.1.2.20). The solution was
autoclaved at 121 °C for 15 min and stored at room temperature.
2.1.5.14 100 mM Phenylmethylsulfonyl fluoride (PMSF)
PMSF (17.4 mg) was dissolved in 1 ml methanol. The solution was stored at
room temperature.
2.1.5.15 Pepstatin A (1 mg/ml)
Pepstatin A (10 mg) was brought to 10 ml with distilled water. The solution was
split into 1 ml aliquots and stored at -20 °C.
2.1.5.16 1M DTT
DTT (154 mg) was brought to 1 ml with distilled water. The solution was
prepared fresh prior to use.
2.1.5.17 Aspergillus lysis buffer; reducing
Tris-HCl (15.7 g) and NaCl (2.9 g) were dissolved in 60 ml distilled water.
Glycerol (10 ml) was added to the solution and 4 ml of 500 mM EDTA (Section
2.1.6.7) before adjusting the pH of the solution to 7.5. The solution was brought to a

72
final volume of 100 ml with distilled water and stored at 4 °C. Immediately prior to use,
the solution was brought to 1 mM PMSF, 1 µg/ml Pepstatin A and 30 mM DTT by
addition of appropriate amounts of the stock solutions (Section 2.1.5.14; 2.1.5.15,
2.1.5.16).
2.1.5.18 Aspergillus lysis buffer; non-reducing
Tris-HCl (15.7 g) and NaCl (2.9 g) were dissolved in 60 ml distilled water.
Glycerol (10 ml) was added to the solution and 4 ml of 500 mM EDTA (Section
2.1.6.7) before adjusting the pH of the solution to 7.5. The solution was brought to a
final volume of 100 ml with distilled water and stored at 4 °C. Immediately prior to use,
the solution was brought to 1 mM PMSF and 1 µg/ml Pepstatin A by addition of
appropriate amounts of the stock solutions (Section 2.1.5.14; 2.1.5.15).
2.1.5.19 100 % (w/v) TCA
Trichloroacetic acid (100 g) was added to 45.4 ml distilled water and dissolved.
The solution was stored in the dark at 4 °C.
2.1.5.20 10 % (w/v) TCA
100 % (w/v) TCA (5 ml) (Section 2.1.5.19) was diluted in distilled water (45 ml)
and stored in the dark at 4 °C.
2.1.5.21 Plate assays
A. fumigatus wild-type and mutant strains were grown on Czapek-Dox agar
(Section 2.1.5.10) for 5 days at 37 C after which conidia were harvested (Section
2.2.1.1). Conidia (5 µl; 5 x 10³ conidia) were spotted in triplicate onto agar plates
containing various additives (Table 2.1). Plates were incubated at 37 C and growth was

73
monitored at specific time intervals by measuring the diameter of radial growth (cm) of
each colony.
Table 2.1: Reagents and concentrations used in plate assays to test for phenotypic
alterations in A. fumigatus.
Reagent Stock Concentration Concentration range used
Hydrogen peroxide 1 M in Czapek-Dox Broth
(Section 2.1.5.9)
0 – 1 mM
Gliotoxin 1 mg/ml in Methanol 0 – 10 µg/ml
2.1.5.22 5’-Iodoacetamidofluorescein (IAF) (20 mg/ml)
5’-Iodoacetamidofluorescein (IAF) (20 mg) was dissolved in 1 ml dimethyl
sulfoxide (DMSO). The solution was stored, protected from light, at -20 °C.
2.1.5.23 5’-IAF (3 mg/ml)
5’-IAF (20 mg/ml) (Section 2.1.5.22) was diluted in DMSO. The solution was
prepared fresh on day of use and protected from light.
2.1.5.24 500 mM Sodium Borohydride
Sodium borohydride (1.89 g) was dissolved in 100 ml of distilled water. The
solution was used within 30 min of preparation. Lid was not closed on bottle as
hydrogen gas is liberated from solution.
74
2.1.6 2D-PAGE reagents
2.1.6.1 2M DTT
DTT (308 mg) was brought to 1 ml with IEF buffer (Section 2.1.6.2). The
solution was prepared fresh prior to use.
2.1.6.2 2D-PAGE Isoelectric Focusing Buffer (IEF)
Urea (9.6 g), Thiourea (3.04 g), Trizma base (24 mg) Chaps (0.8 ml), Triton X-
100 (0.2 ml) were brought to 20 ml with distilled water. The solution was split into 1 ml
aliquots and stored at -20 °C. 2M DTT (Section 2.1.6.1) (32 µl) and appropriate
ampholytes (GE Healthcare) (8 µl) were added to a 1 ml aliquot immediately prior to
use.
2.1.6.3 IPG Strip Equilibration Buffer
Glycerol (150 ml), SDS (10 g), Urea (180 g) and Trizma base (3.03 g) were
dissolved in 450 ml of distilled water. The pH was adjusted to 6.8 and the solution was
brought to 500 ml. The solution was split into 50 ml aliquots and stored at -20 °C.
2.1.6.4 Equilibration Buffer A
DTT (200 mg) was added to IPG Strip Equilibration Buffer (Section 2.1.6.3) (10
ml). This volume was adequate for 1 strip. The solution was prepared immediately prior
to use.
2.1.6.5 Equilibration Buffer B
Iodoacetamide (250 mg) was added to IPG Strip Equilibration Buffer (Section
2.1.6.3) (10 ml). This volume was adequate for 1 strip. Trace amounts of bromophenol
blue was added to the solution. The solution was prepared immediately prior to use.

75
2.1.6.6 Agarose Sealing Solution
Trizma base (1.5 g), glycine (7.2 g) and SDS (0.5 g) were dissolved in 80 ml
deionised water. Agarose (0.7g) and 1% (w/v) Bromophenol blue solution (200 µl)
(Section 2.1.2.5) were added and the solution was adjusted to 100 ml with deionised
water. The solution was heated to dissolve the agarose and stored at room temperature.
2.1.6.7 500 mM EDTA
Ethylenediaminetetraacetic acid dipotassium salt dehydrate (46.53 g) was added
to 200 ml of distilled water. The pH was adjusted to 8.0 in order to dissolve the salt. The
solution was brought to 250 ml with distilled water and stored at room temperature.
2.1.6.8 Aldrithiol-4 (A4)
Aldrithiol-4 (11 mg) was dissolved in absolute ethanol (1 ml). The solution was
stored at -20 °C.
2.1.6.9 Gel Fitration Calibrant Mixture
Thyroglobulin (25 mg/ml) (200 µl), Aldolase (25 mg/ml) (160 µl) and RNAse A
(25 mg/ml) (160 µl) were brought to 1 ml with PBS (Section 2.1.2.20). The solution
was stored at 4 °C. All calibrants used were included in the HMW gel filtration
calibration kit (GE Healthcare).

76
2.2 Methods
2.2.1 Microbiological culture methods
Fungal strains used in this study are listed in Table 2.2.
Table 2.2: List of fungal strains used in this study.
Species Strain used Genotype Source/ Reference
Aspergillus fumigatus ATCC 26933 Wild-type ATCC collection
Aspergillus fumigatus ΔgliK Mutant Gallagher et al. (2012)
2.2.1.1 A. fumigatus growth, maintenance and storage
A. fumigatus strains were maintained on MEA (Section 2.1.5.7) or AMM agar
(Section 2.1.5.6). A sterile inoculation loop was used to seed conidia onto agar plates.
The inoculated agar plates were incubated at 37 °C for 5-7 days. Conidia were harvested
in a biological safety cabinet using sterile PBST (Section 2.1.5.13). Harvested conidia
were centrifuged at 2000 g for 10 min and the conidia were washed twice with sterile
PBS (Section 2.1.2.20) (10 ml). Centrifugation was repeated and the conidia were
resuspended in sterile PBS (Section 2.1.2.20) (5 ml). Harvested conidia were stored at 4
°C. A. fumigatus mycelium was obtained by inoculation of sterile liquid media with
relevant conidia. These cultures were incubated at 37 °C, with shaking at 200 rpm, for a
time relevant to each experiment. Mycelia were harvested by filtering liquid culture
through miracloth and PBS (Section 2.1.2.20) was used to wash media from the
mycelium. Excess moisture was removed from mycelia by pressing between sheets of

77
absorbent paper. The mycelium was snap frozen in liquid nitrogen and stored at -80 °C
until required.
2.2.1.2 Conidia counting using a haemocytometer
A haemocytometer was used to count conidia. Prior to use, the chamber and the
coverslip were cleaned with alcohol and the coverslip was fixed in place. The conidia
suspension was diluted 1/100 (i.e. 10 µl of conidia stock added to 990 µl of PBS
(Section 2.1.2.20)). Diluted conidia suspension (10 µl) was placed on the grid of the
haemocytometer. The slide was then viewed by a compound microscope under the 10X
objective lens. The cells were counted in the large central gridded square (1 mm2)
(Figure 2.1). The conidia count was then multiplied by the dilution factor and also by 1
x 104
to estimate the number of conidia per ml. This count was performed on duplicate
samples and the average was obtained.
Figure 2.1 Diagram of haemocytometer. The circled region shows the large central grid
used to count conidia.

78
2.2.2 Protein extraction methods
2.2.2.1 A. fumigatus whole protein extraction using bead-beating
Harvested mycelia (Section 2.2.1.1) was placed in a 50 ml tube, snap-frozen in
liquid nitrogen and lyophilised overnight. 100 mg of lyophilised mycelium was placed
in a 2 ml microfuge tube along with a tungsten bead. The mycelium was subjected to
bead-beating at 30 Hz for 5 min in a bead beater (MM300, Retsch®). Ice-cold A.
fumigatus lysis buffer, reducing (Section 2.1.5.17) or non-reducing (2.1.5.18) (0.5 ml),
was added to the mycelium and the bead-beating step was repeated. An additional 0.1-
0.5 ml of ice-cold A. fumigatus lysis buffer was added to the lysate and the suspension
was incubated on ice for 1 h. The lysate was centrifuged at 12000 g for 5 min at 4 °C.
The supernatant was placed in a sonication bath (Fisher Scientific) for 5 min and the
centrifugation step was repeated. The supernatant was brought to 3 mM PMSF and 2
µg/ml Pepstatin A, final concentrations (Section 2.1.5.14; 2.1.5.15). Relative quality of
extracted protein was analysed by SDS-PAGE (Section 2.2.4.2) and aliquots were
stored at -20 °C until required for use.
2.2.2.2 A. fumigatus whole protein extraction for 2D-PAGE
Harvested mycelia (Section 2.2.1.1) was placed in a mortar and crushed into a
fine powder using liquid nitrogen and a pestle. Mycelial powder was collected and
stored immediately at -70 °C. Mycelial powder (250 mg) was weighed into a 15 ml
tube. 10 % (w/v) TCA (Section 2.1.5.20) (1.5 ml) at 4 °C was added to the mycelia. The
suspension was sonicated with a sonication probe (Bandelin Sonopuls, Bandelin
electronic, Berlin) at 10% power, cycle 6 for 10 seconds. This was repeated twice more
with the sample being cooled on ice between each sonication. The sample was
incubated on ice for 15-30 min before being centrifuged at 10000 g for 10 min at 4 °C.

79
The supernatant was discarded and distilled water (60 µl) was added to the sample
followed by vortexing. Ice-cold acetone (1 ml) was added to the sample and the pellet
was resuspended as completely was possible by pipetting. The sample was vortexed and
placed at -20 °C for 1 h, with vortexing at 10 min intervals. The sample was stored at -
20 °C overnight. The sample was centrifuged at 10000 g for 10 min and the supernatant
was removed. Ice-cold acetone (0.5 ml) was added to the sample and the centrifugation
step was repeated. The supernatant was removed and the pellet was left to air-dry for a
maximum of 5 min. The pellet was resuspended as completely as possible in IEF buffer
(Section 2.1.6.2) (0.5 ml). The sample was left at room temperature for 1 h and then
centrifuged at 13000 rpm for 1 min. The supernatant was removed to a clean 1.5 ml
microfuge tube. Protein quantitation was carried out using the Bradford protein assay
(Section 2.2.4.1)
2.2.2.3 A. fumigatus whole cell lysate extraction for shotgun mass spectrometry
Harvested mycelia (Section 2.2.1.1) was placed in a mortar and crushed into a
fine powder using liquid nitrogen and a pestle. Mycelia powder was collected and
stored immediately at -70 °C. Mycelia powder (1 g) was weighed into a 15 ml tube.
Whole Protein Lysate Fungal Extraction Buffer (Section 2.1.3.6) (6 ml) was added
gradually to disperse the mycelia. The suspension was sonicated at 10% power, cycle 6
for 10 seconds. This was repeated four more times with the sample being cooled on ice
between each sonication. A small volume (0.1 ml) was retained for determination of
protein concentration (Section 2.2.4.1). Following sonication, reduction was carried out
using DTT, followed by alkylation using iodoacetamide. Briefly, 10 µl of 1 M DTT
(Section 2.1.3.4) was added per ml of lysate and incubated at 56 °C for 30 min. The
sample was allowed to cool to room temperature and 55 µl of 1 M iodoacetamide
(Section 2.1.3.5) was added per ml of lysate. The sample was incubated in the dark for

80
20 min at room temperature. The whole cell lysate was dialysed (Section 2.2.4.9)
against 100 mM ammonium bicarbonate (Section 2.1.3.1). The dialysed protein was
stored at -20 °C until required for use.
2.2.3 Methods for Purification of Protein Samples
2.2.3.1 TCA/Acetone Precipitation
Solutions containing protein to be concentrated were brought to 10 % (w/v)
TCA by addition to 1 volume of ice-cold 100 % (w/v) TCA (Section 2.1.5.19) to 9
volumes of protein solution at 4 °C. Samples were incubated on ice for 30 min followed
by centrifugation at 12,000 g for 10 min at 4 °C. The supernatants were removed and
the pellets were resuspended in ice-cold acetone (1 ml). The samples were incubated at
– 20 °C for 1 h before centrifugation at 12,000 g for 10 min at 4 °C. The supernatants
were removed and the pellets were washed once more with ice-cold acetone. After the
supernatant was removed, the pellets were air-dried for 5 min. The pellets were
resuspended in 8 M urea (Section 2.1.2.25).
2.2.3.2 Gel Filtration Chromatography
Gel filtration chromatography was carried out using an ÄKTA purifier coupled
with (i) a Superose 6 10/300 GL column (GE Healthcare, Germany), used for analytical
gel filtration, or (ii) a Sephacryl XK 16/S400 column, used for preparative gel filtration.
Lines were purged prior to use and the column was equilibrated with PBS (Section
2.1.2.20). Samples were filtered through 0.22 µm filter or centrifuged at 10000 g for 10
min to remove particulates prior to injection onto column. A selection of molecular
weight calibrants were applied to the column in order to prepare a standard curve based
on molecular weight versus elution volume (Ve) (Section 2.1.6.9). The flow rate was set

81
to 0.2 ml/min, with absorbance monitored at 215, 254 and 280 nm. Fractions were
collected if required for further analysis.
2.2.3.3 Gold nanoparticle (AuNP) co-incubation with A. fumigatus proteins
Colloidal gold (30 nm) (BB International, UK) (2 ml) was centrifuged at 10000
g for 10 min at 4 °C and the supernatant was removed. Pellet was resuspended in 2 mM
borate pH 8.0 (Section 2.1.2.27) (1 ml). A. fumigatus protein lysates (Section 2.2.2.1)
were diluted to 3 mg/ml using 2 mM borate pH 8.0 (Section 2.1.2.27). A. fumigatus
lysates (100 µl) were incubated with colloidal gold (50 µl), with gentle mixing, for 30
min at room temperature. The gold:A. fumigatus protein solutions was centrifuged at
10000 g for 10 min at 4 °C and the supernatants were removed. The pellets were
washed four times with PBST (Section 2.1.2.21) (40 µl) with centrifugation repeated
each time. The final pellet was resuspended in 5X solubilisation buffer (Section 2.1.2.7)
(40 µl) and boiled for 5 min. The A. fumigatus proteins that interact closely with the
gold nanoparticles were analysed by SDS-PAGE (Section 2.2.4.2). Lanes containing
this fraction was cut horizontally into 3 mm slices and subjected to trypsin digestion
(Section 2.2.6.1) followed by LC-MS analysis (Section 2.2.6.3).
2.2.4 Protein Characterization Methods
2.2.4.1 Bradford Protein Assay
Bio-Rad protein assay dye was diluted 1/5 in sample buffer prior to use. The
sample to be assayed was also diluted appropriately. 20 µl of the sample was added to
980 µl of the diluted Bio-Rad protein assay dye and mixed thoroughly. The final sample
(1 ml) was transferred to a 1 ml plastic cuvette and incubated for 5 min at room
temperature. The A595nm was read relative to a blank and the protein concentration was

82
determined based on values obtained from a standard curve. All samples were prepared
and analysed in duplicate.
2.2.4.2 Sodium Dodecyl Sulphate Polyacrylamide Gel Electrophoresis (SDS-
PAGE)
SDS-PAGE gels, both stacking and resolving, were prepared according to Table
2.3 and Table 2.4, respectively. The gels were cast using the Mini-Protean II gel casting
apparatus (BioRad, CA, USA) according to the manufacturer’s guidelines. Samples
were prepared by adding one volume of 5X solubilisation buffer (Section 2.1.2.7) to
every 4 volumes of sample in a 1.5 ml microfuge tube. The samples were boiled for 5
min and centrifuged briefly to collect the sample to the bottom of the tube. An
appropriate volume of sample was loaded onto the gel using a Hamilton syringe. A
molecular mass marker was run alongside samples in order to estimate the relative size
of observed proteins. The molecular mass marker used throughout this study ranged
from 7-175 kDa (P7703, NEB). The electrophoresis tank was filled with 1X SDS
electrode running buffer (Section 2.1.2.9). Electrophoresis was carried out initially at 80
V for 30 min, followed by electrophoresis at 120 V until the dye front reached the
bottom of the gel.

83
Table 2.3: Reagents composition for SDS-PAGE Resolving Gels
Table 2.4: Reagents composition for SDS-PAGE Stacking Gel
Number of Minigels 2 5 8
0.5 M Tris-HCl pH 6.8 (Section 2.1.2.3) 2.5 ml 4.0 ml 5.2 ml
10 % SDS (Section 2.1.2.1) 100 µl 160 µl 210 µl
30 % Acrylamide, 0.8 % Methylene bis
Acrylamide
1.0 ml 1.5 ml 2.0 ml
Distilled water 6.4 ml 9.6 ml 12.8 ml
10 % Ammonium persulfate (Section
2.1.2.4)
100 µl 150 µl 200 µl
TEMED 10 µl 15 µl 20 µl
% Acrylamide 10% 10% 12% 12% 15%
Number of Minigels 5 8 5 8 5
1.5 M Tris-HCl pH 8.3 (Section
2.1.2.2) 7.0 ml 10.5 ml 7.0 ml 10.5 ml 7.0 ml
10 % SDS (Section 2.1.2.1) 280 µl 420 µl 280 µl 420 µl 280 µl
30 % Acrylamide, 0.8 %
Methylene bis Acrylamide
9.3 ml 13.9 ml 11.3 ml 16.9 ml 13.9 ml
Distilled water 12.3 ml 18.4 ml 9.3 ml 13.9 ml 6.3 ml
10 % Ammonium persulfate
(Section 2.1.2.4)
100 µl 150 µl 100 µl 150 µl 100 µl
TEMED 23 µl 35 µl 23 µl 35 µl 23 µl

84
2.2.4.3 Isoelectric Focussing (IEF) and 2D-PAGE
Protein samples were prepared to the appropriate concentration and volume for
the IPG strip size according to Table 2.5. Bromophenol blue was added to the protein
samples, which were then centrifuged at 12,000 g for 5 min. Protein samples were
loaded into the positive end of the ceramic IPG strip holders. The IPG strip was added,
gel-side down, using a forceps, while the holder was tilted slightly to evenly distribute
the sample along the holder. Care was taken to prevent the trapping of air bubbles
underneath the strip. The strips were overlaid with Plus One Drystrip Coverfluid
(Amersham) (1 - 1.5 ml) and subjected to IEF on an IPGphor II IEF Unit using the
following programme;
Step 50 V 12 h
Step 250 V 0.15 h
Gradient 5000V 2 h
Step 5000 V 5 h
Gradient 8000 V 2 h
Step 8000 V 1 h
Step 250 V 1 h
Following IEF, the IPG strips were equilibrated in Reduction Buffer (Section
2.1.6.4) for 20 min, followed by equilibration in Alkylation Buffer (Section 2.1.6.5) for
20 min. The IPG strips were rinsed in 1 X Electrode Running Buffer (Section 2.1.2.9)
and placed on top of 12 % SDS-PAGE gels (Table 2.6) using a forceps. The gels were
overlaid with Agarose Sealing Solution (Section 2.1.6.6). Once set, the gels were placed
in the PROTEAN Plus Dodeca Cell (BIO-RAD) as per manufacturer’s instructions. The
gels were electrophoresed in 1 X Electrode Running Buffer (Section 2.1.2.9) overnight

85
at 1.5 W per gel. In the morning, the voltage was increased to 5 W per gel until the dye-
front was 2 cm from the end of the gels. The gels were stained with Colloidal
Coomassie® Blue (Section 2.2.4.4).
Table 2.5: Protein amounts and volumes for different length IPG Strips
Strip Length Protein amount Volume of IEF Buffer
7 cm 125 µg 125 µl
13 cm 300 µg 250 µl
Table 2.6: Composition for large, 12 % acrylamide, SDS-PAGE Resolving Gels
No. of Gels 2 10
1.5 M Tris-HCl pH 8.3 (Section 2.1.2.2) 31.5 ml 157.5 ml
10 % SDS (Section 2.1.2.1) 1.21 ml 6.05 ml
30 % Acrylamide, 0.8 % Methylene bis Acrylamide 50.7 ml 253.5 ml
Distilled water 41.7 ml 208.5 ml
10 % Ammonium persulfate (Section 2.1.2.4) 405 µl 2.25 ml
TEMED 105 µl 525 µl

86
2.2.4.4 Colloidal Coomassie® Staining of SDS-PAGE gels
Following SDS-PAGE, gels were incubated for 3 h or overnight in fixing
solution (Section 2.1.2.12). Following this period, the gels were washed 3 X 20 min
with distilled water before being incubated for 1 h in Colloidal Coomassie® stain buffer
(Section 2.1.2.13). A quantity of Colloidal Coomassie® Blue G-250 (Serva
Electrophoresis, Germany) was scattered over each gel to attain a concentration of
approximately 35 mg/ml. Gels were incubated, with stain, for 5 days and washed
repeatedly with distilled water.
2.2.4.5 Semi-dry transfer of proteins to NCP
Nitrocellulose paper (NCP) and six sheets of filter paper were cut to the
appropriate size of the gel and pre-soaked in Towbin Transfer Buffer (Section 2.1.2.14)
for 15 min. The protein gels were removed carefully from the electrophoresis unit and
assembled on the transfer unit in a NCP “sandwich” consisting of 3 sheets of saturated
filter paper, soaked NCP, protein gel and an additional 3 sheets of saturated filter paper.
Transfer was carried out at 18 V for 20 min using a semi-dry transfer unit. Ponceau S
solution was applied to NCP to detect protein transfer with excess stain removed
through washing with distilled water.
2.2.4.6 Wet transfer of proteins to NCP
Nitrocellulose paper (NCP) and two sheets of filter paper were cut to the
appropriate size of the gel and pre-soaked in wet transfer buffer (Section 2.1.2.15) along
with two transfer sponges. The protein gels were removed carefully from the
electrophoresis unit and assembled as follows: sponge, filter paper, NCP, gel, filter
paper, sponge. The layers were clamped together, ensuring no air bubbles are trapped.
The clamped unit was submerged in wet transfer buffer (Section 2.1.2.15) in the transfer

87
tank with the NCP oriented next to the cathode and the gel oriented next to the anode.
An ice pack was placed in the unit or alternatively the transfer unit was placed in a
container of ice. Transfers were carried out at 100 V for 70 min for small gels or at 15 V
overnight for large gels. Ponceau S solution was applied to NCP to detect protein
transfer with excess stain removed through washing with distilled water.
2.2.4.7 Western Blot Analysis
Protein transferred to NCP using semi-dry transfer (Section 2.2.4.3) or wet
transfer (Section 2.2.4.6) was used to carry out Western blot analysis. Blocking buffer
(Section 2.1.2.16 or Section 2.1.2.17) was applied to the NCP and incubated for 1 h at
room temperature with gentle rocking. The blocking buffer was poured off the blot and
primary antibody, diluted in Antibody buffer (Section 2.1.2.18, 2.1.2.19), was added to
the blot. This was incubated for 1 h at room temperature with gentle rocking. Three 10
min PBST (Section 2.1.2.21) washes were carried out on the blot. The secondary
antibody was diluted in antibody buffer (Section 2.1.2.18, 2.1.2.19) and incubated with
the blot for 1 h at room temperature with gentle rocking. Three 10 min PBST washes
were carried out and the blot was developed using Supersignal West Pico enhanced
chemiluminescent (ECL) substrate according to manufacturer’s guidelines (Pierce
Biotechnology). An alternative chromogenic development system was also employed.
3, 3’-diaminobenzidine tetrachloride hydrate (DAB) (10 mg) was dissolved in DAB
Substrate buffer (Section 2.1.2.22) (15 ml). Hydrogen peroxide (7 µl) was added to the
substrate solution which was then applied to blots. Blots were allowed to develop for 10
min and distilled water was applied to stop the reaction and reduce background staining.

88
2.2.4.8 Determination of Relative Immunoreactivity of A. fumigatus proteins
2D-PAGE Coomassie stained gels, Ponceau S stained 2D-PAGE blots and
corresponding antisera probed immunoblots were aligned using Progenesis™ SameSpot
Software (Nonlinear Dynamics Ltd, UK). Normalised volumes of aligned Coomassie
stained spots were related to the normalised volumes of the corresponding spots on the
antisera-probed immunoblots. The intensity of immunoreactivity relative to the amount
of protein present was calculated as follows:
Normalised Volume of Immunospot = X
Normalised Volume of Coomassie Stained Spot
High immunoreactivity (H) was indicated if X ≥ 3.5; Low immunoreactivity was
indicated if X ≤ 0.02; Medium immunoreactivity (M) was indicated if 0.02 < X < 3.5.
2.2.4.9 Dialysis of protein samples
Dialysis tubing was pre-soaked in the appropriate buffer for 10 min. Protein
sample was added to the dialysis tubing with an additional 50% free space included to
allow for sample volume expansion. The sealed tubing, containing the sample, was
dialysed against 50 volumes. Dialysis was carried out at 4 °C with stirring. A minimum
of three buffer changes were carried out at 3 h intervals.
2.2.4.10 Analysis of Supernatant Proteins from A. fumigatus
A. fumigatus ATCC 26933 conidia (200 µl: 1 x 10⁷ conidia) were inoculated into
flasks containing AMM (Section 2.1.5.5) (200 ml) and cultured in static conditions at
37 °C for periods of 1, 2 and 3 weeks. Culture supernatants were harvested at each time
point by filtering through miracloth and snap-frozen in liquid nitrogen. Lyophilisation
of culture supernatants (40 ml) was carried out and resultant samples were stored at -70

89
°C. Samples were resuspended in 10 % (w/v) TCA (Section 2.1.5.20) (5 ml) and
incubated on ice overnight. Solutions containing precipitated protein were centrifuged at
1700 g for 15 min at 4 °C, and the supernatant was discarded. Pellets were resuspended
in ice-cold acetone (2 ml) and centrifuged at 10000 g for 15 min at 4 °C. This washing
step was repeated twice more and the final pellet was resuspended in 8 M urea (Section
2.1.2.25). The sample was incubated on ice for 1 h before a final centrifugation step to
remove insoluble material. Re-solubilised protein was quantified (Section 2.2.4.1) and
analysed by SDS-PAGE (Section 2.2.4.2). The lane containing each sample was cut
horizontally into slices and each one was subjected to trypsin digestion (Section
2.2.6.1). LC-MS analysis (Section 2.2.6.3) was subsequently carried out in order to
perform a large-scale identification of secreted or external A. fumigatus proteins.
2.2.4.11 Organic Extraction of A. fumigatus Culture Supernatants
A. fumigatus culture supernatants (20 ml) were added to chloroform (20 ml) in a
50 ml tube and agitated vigorously for 3 min, with regular venting of the tube. The
mixtures were centrifuged at 650 g for 10 min at room temperature to separate the
organic layer from the aqueous layer. The lower organic layer was retained and stored at
-20 °C until required.
2.2.4.12 Rotary evaporation of Organic Extraction Samples
Organic extracts (Section 2.2.4.11) (20 ml) were placed in a glass evaporation
bulb. The chloroform was evaporated under vacuum whilst sitting in a water bath set to
37 oC (Heidolph Laborata 4001 efficient, Vacuubrand CVC 2000 II). The dried extract,
retained in the bulb, was resuspended in HPLC grade methanol (200 µl). The
resuspended extract was then transferred to clean glass vial and stored at – 20 oC.

90
2.2.5 Comparative Metabolite Profile Analysis by Reverse Phase - High
Performance Liquid Chromatograhy (RP-HPLC)
2.2.5.1 RP-HPLC Analysis
Organic extracts from supernatants (Section 2.2.4.11, 2.2.4.12) or intracellular
fractions (Section 2.2.5.3) were analysed by RP-HPLC with UV detection (Agilent
1200 system), using a C18 RP-HPLC column (Agilent Zorbax Eclipse XDB-C18; 5 mm
particle size; 4.6 x 15 mm) at a flow rate of 1 ml/min. A mobile phase of water (Section
2.1.4.1) and acetonitrile (Section 2.1.4.2), with TFA, was used under various gradient
conditions (Table 2.7, Table 2.8). Injection volume was set to 20 µl and fractions were
collected if required.

91
Table 2.7: RP-HPLC Gradient 1
Time (min) % B % B / min
0 5
5 5 95 % Δ B / 20 min
20 100 4.75 % Δ B / min
28 100
30 5
Table 2.8: RP-HPLC Gradient 2
Time (min) % B % B / min
0 35
3 35 25 % Δ B / 6.25 min
9.25 60 4 % Δ B / min
10 100
14 100
16 35
2.2.5.2 5’-IAF Labelling of Sulphydral groups of A. fumigatus metabolites
Sodium borohydride (NaBH4) mediated reduction of disulfide bonds, and
subsequent alkylation with 5’-Iodoacetamidofluorescein (5’-IAF) was carried out
according to Davis et al. (2011). Briefly, organic extracts from A. fumigatus culture
supernatants (Section 2.2.4.11; 2.2.4.12) (50 µl) or protein lysates (Section 2.2.5.3) (50
µl) were reduced by the addition of 500 mM NaBH4 (Section 2.1.5.24) (1.25 µl; 625
nmoles) and incubation at room temperature for 1 h. Free sulphydral groups were then

92
alkylated by the addition of 5’-IAF (Section 2.1.5.23) (10 µl; 60 nmol) and samples
were incubated at room temperature for 40 min in the dark. Control samples were
prepared in-tandem, in which reduction was not carried out prior to 5’-IAF labelling.
RP-HPLC analysis was carried out using Gradient 1 (Table 2.9) or Gradient 2 (Table
2.10). MALDI-ToF analysis (Section 2.2.7) was also carried out to ascertain the mass of
the labelled compound.
2.2.5.3 Preparation of A. fumigatus Mycelial Lysates for Intracellular Metabolite
Investigation
Mycelia, from A. fumigatus liquid cultures (ATCC 26933 and ΔgliK; 72 h; 37
°C) in Czapek-Dox (Section 2.1.5.9), were harvested by filtering through miracloth
(Section 2.2.1.1). Protein was extracted from lyophilised mycelia (Section 2.2.2.1) using
non-reducing lysis buffer (Section 2.1.5.18). Protein lysates (30 µl) were added to PBS
(Section 2.1.2.20) (105 µl) along with HPLC-grade methanol (15 µl). These solutions
were centrifuged at 10000 g for 10 min at 4 °C and the supernatants were retained. An
aliquot (50 µl) of each supernatant was reduced and labelled with 5’-IAF (Section
2.2.5.2) followed by RP-HPLC analysis (Section 2.2.5.1).
2.2.5.4 Determination of Sulphydral Groups in A. fumigatus Mycelial Lysates
Mycelia, from A. fumigatus liquid cultures (ATCC26933 and ΔgliK; 72 h; 37
°C) in Czapek-Dox (Section 2.1.5.9), was harvested by filtering through miracloth
(Section 2.2.1.1). Protein was extracted from lyophilised mycelia (Section 2.2.2.1) using
non-reducing lysis buffer (Section 2.1.5.18). Protein lysates (100 µl) were diluted with
PBS (400 µl) (Section 2.1.2.20). A control, consisting of non-reducing lysis buffer (100
µl) in PBS (400 µl) was also prepared. A volume of the control (100 µl) was transferred
to a 0.1 ml quartz cuvette and this solution was used to blank at 280 nm on a

93
spectrophotometer. The A280nm of the diluted mycelial lysate was measured
(A280nm(Sample)). A volume of the control (100 µl) was then used to blank at 324 nm.
A4 (2 µl) (Section 2.1.6.8) was added and the A324nm was measured after 1 min
(A324nm(Control)). The diluted mycelial lysates (100 µl) was used to blank at 324 nm
and then A4 (2 µl) (Section 2.1.6.8) was added and the A324nm was read after 1 min
(A324 nm(Sample)). The concentration of free sulphydral groups ([SH]), relative to
protein concentration ([Protein]), in the sample was determined using the following
equations:
[Protein] mg/ml = A280nm x5
[SH] nMoles/ml = A324nm(Sample) – A324nm(Control) x 5
0.0198*
(*0.0198 is the A4 extinction coefficient)
[SH] nMoles/ml = nMoles SH/mg of protein.
[Protein] mg/ml
2.2.6 Mass Spectrometry Methods
2.2.6.1 In-gel Digestion of SDS-PAGE Samples
In-gel digestion of SDS-PAGE samples was carried out according to the
protocol of Shevchenko et al. (2007). Briefly, selected bands or spots from SDS-PAGE
gels were excised and placed in individual 1.5 ml microfuge tubes. Gel pieces were
destained by addition of 100 µl of 100 mM ammonium bicarbonate (Section 2.1.3.1) :
acetonitrile (1:1 v/v). Samples were vortexed periodically for 30 min. Acetonitrile (500
µl) was added to samples, followed by vortexing until the gel pieces became white and
shrunk. Acetonitrile was removed and replaced with 50 µl of trypsin, diluted to 13 ng/µl

94
in trypsin buffer (Section 2.1.3.7). Samples were incubated at 4 °C for 2 h, with
additional trypsin added to cover gel pieces if required. Samples were then incubated at
37 °C overnight. Gel pieces were subsequently placed in a sonication bath for 10 min
followed by transfer of the digest supernatant to fresh microfuge tubes. Samples were
dried to completion using a speedy vac (DNA Speedy Vac Concentrator, Thermo
Scientific) and resuspended in 0.1% formic acid (Section 2.1.3.8) (20 µl). The samples
were filtered through 0.22 µm Cellulose Spin-filters (Costar) before transfer to
polypropylene vials. Care was taken to ensure there was no air trapped in the vials.
2.2.6.2 In-solution Digestion of Protein Samples
Solutions that had previously reduced and alkylated (Section 2.2.2.3) were
subjected to trypsin digestion. Trypsin was diluted to 400 µg/ml in trypsin buffer
(Section 2.1.3.7). Trypsin solution (5 µl; 2 µg) was added to protein samples (0.1 ml)
and incubated at 37 °C overnight. Digested samples were diluted in 0.1 % formic acid
(Section 2.1.3.8) prior to LC-MS analysis.
2.2.6.3 LC-MS/MS Analysis of Peptide Mixtures
Peptide mixtures generated from (i) in-gel digestion of protein spots or bands
from SDS-PAGE (Section 2.2.6.1) or (ii) from in-solution digestion of protein samples
(Section 2.2.6.2) were analysed using a 6340 Model Ion Trap LC-Mass Spectrometer
(Agilent Technologies, Ireland) using electrospray ionisation. Samples (Sections
2.2.6.1, 2.2.6.2) (1 - 5 µl) were loaded onto a Zorbax 300 SB C-18 Nano-HPLC Chip
(150 mm x 75 µm) with 0.1 % (v/v) formic acid (Section 2.1.3.8) at a flow rate of 4
µl/min. A high capacity HPLC chip with a 160 nL enrichment column (150 mm 300 Å
C18) was employed for analysis of samples prepared by in-solution digestion (Section
2.2.6.2). Peptides were eluted using the appropriate gradient with a post run of 5 min.

95
The eluted peptides were ionised and analysed by the mass spectrometer. MSn analysis
was carried out on the 3 most abundant peptide precursor ions at each time point, as
selected automatically by the mass spectrometer. Singly charged ions were excluded
from analysis by the mass spectrometer.
2.2.6.4 LC-MS/MS Analysis of A. fumigatus Metabolites
Metabolites isolated by (i) organic extraction from culture supernatants of A.
fumigatus (Section 2.2.4.11, 2.2.4.12) or (ii) fractionation following RP-HPLC analysis
(Section 2.2.5.1) of intracellular metabolites, were analysed by LC-MS/MS. Samples
were diluted in 0.1 % (v/v) formic acid (Section 2.1.3.8) prior to mass spectrometry and
were loaded onto a Zorbax 300 SB C-18 Nano-HPLC Chip (150 mm x 75 µm) with 0.1
% (v/v) formic acid (Section 2.1.3.8) at a flow rate of 4 µl/min. Metabolites were eluted
using the appropriate gradient with a post run of 5 min. MSn was carried out on the 3
most abundant precursor ions at each timepoint, with n ranging from 2 to 5, depending
on the analysis. Singly charged ions were not excluded from analysis, with the precursor
range adjusted to include ions with m/z between 15 and 2200.
2.2.7 MALDI-ToF analysis
Aqueous samples were prepared for MALDI-ToF analysis by direct mixing of
samples with prepared matrix (Section 2.1.3.11). Matrixed samples (0.5 µl) were
deposited onto individual positions on the MALDI target slide and allowed to dry.
Organic samples were applied using a layering technique, whereby matrix (Section
2.1.3.11) (0.5 µl) was deposited on the MALDI slide and allowed to dry, followed by
addition of organic sample to the same position. All samples were subjected to delayed
extraction reflectron MALDI-ToF analysis with a nitrogen laser (337 nm) at 20 kV
using an Ettan™ MALDI-ToF Pro mass spectrometer (Amersham Biosciences). Each

96
MALDI target slide contained one spot of external calibration mix (LaserBio Labs,
Proteomix C104) and these along with internal calibrants, Angiotensin III and ACTH
fragment 18-39, were used to calibrate spectra.
2.2.7.1 Database Search
Database searches for identification of proteins were carried out using Spectrum
Mill MS Proteomics Workbench (Revision A.03.03.084 SR4). Validation criteria were
set to (i) maximum of two missed cleavages by trypsin, (ii) fixed modification:
carboxymethylation of cysteines, (iii) variable modifications: oxidation of methionine,
deamidation of asparagine, (iv) mass tolerance of precursor ions ± 2.5 Da and product
ions ± 0.7 Da were employed and searches were carried out against a protein database
of 8 Aspergillus species. Protein grouping was carried out based on the presence of ≥ 1
shared peptide. Protein identifications were manually verified based on the presence of
≥ 1 and a Spectrum Mill protein score ≥ 18.0.
Alternatively, MASCOT MS/MS Ion search, with interrogation of the NCBI
(National Centre for Biotechnology Information, http://www.ncbi.nlm.nih.gov)
database, was used for protein identification. Criterion for each search was set at (i)
Taxonomy: Fungi, (ii) two missed cleavages by trypsin, (iii) fixed modification:
carboxymethylation of cysteines, (iv) variable modification: oxidation of methionine,
(v) mass tolerance of precursor ions ± 2Da and product ions ± 1Da.
2.2.7.2 Bioinformatic Analysis of Identified Proteins
Proteins identified from LC-MS analysis (Section 2.2.6.3) and database searches
(Section 2.2.7.1) were managed using the BioEdit Sequence Alignment Editor V 7.0.9.0
(Hall, 1999) and proteins were characterised using a range of bioinformatics programs
(Table 2.9).

97
Table 2.9: List of programs used to characterise proteins identified by LC-MS.
Program Name Protein charcterisation performed Program link
ExPASy Compute
pI/Mw tool Theoretical Mr and pI determination http://web.expasy.org/compute_pi/
Phobius Putative transmembrane regions (Kall et al., 2004) http://phobius.sbc.su.se/
SignalP Putative signal peptide presence (Petersen et al., 2011) http://www.cbs.dtu.dk/services/SignalP/
GRAVY calculator Relative hydrophobicity score calculated http://www.gravy-calculator.de/
FungiFun Functional annotation based on GO, FunCat and KEGG classification
schemes (Priebe et al., 2011) https://www.omnifung.hki-jena.de/FungiFun/
BLAST2GO Functional annotation based on BLAST and InterProScan searches
(Conesa et al., 2005)
http://www.blast2go.com/b2glaunch/start-
blast2go

CHAPTER 3
Large-scale Proteomic
Investigation of A. fumigatus

98
3 Chapter 3
3.1 Introduction
Following the publication of A. fumigatus Af293 (Nierman et al., 2005) genomic
sequence in 2005, and the more recent sequencing of a second A. fumigatus strain,
A1163 (Fedorova et al., 2008), numerous projects have been undertaken to characterise
the proteome of this opportunistic pathogen (Asif et al., 2006; Carberry et al., 2006;
Kniemeyer et al., 2006; Vödisch et al., 2009; Teutschbein et al., 2010; Cagas et al.,
2011b; Wartenberg et al., 2011; Suh et al., 2012; Wiedner et al., 2012). Traditional
proteomic strategies have utilised 2D-PAGE separation with subsequent protein
identification by mass spectrometry (MS). This approach involves the separation of
complex protein mixtures based on their isoelectric point (pI) in the first dimension,
followed by molecular mass (Mr) resolution using SDS-PAGE. Resolved proteins are
subjected to in-gel digestion and resultant peptides are identified by MS coupled with
database searching. However 2D-PAGE can be limiting for the identification of
particular subsets of proteins, namely hydrophobic proteins, membrane proteins, and
proteins with large molecular mass or extreme pI (Kniemeyer et al., 2011). MS-based
proteomics have developed more recently and provide an alternative method to 2D-
PAGE for proteome profiling.
The premise of MS-based proteomics is the identification of peptides from
complex mixtures by mass spectrometry (Aebersold and Mann, 2003). This is preceded
by enzymatic digestion of protein extracts before fractionation of the resultant peptides.
The first step involved in proteomics - based mass spectrometry is the imparting of
charge to peptides, which can be achieved by electrospray ionisation (ESI) or matrix-
assisted laser desorption ionisation (MALDI) (Karas and Hillenkamp, 1988; Fenn et al.,
1989). Electrospray ionisation is usually preceded by nano spray high performance

99
liquid chromatography (HPLC) which facilitates separation of peptides based on their
relative hydrophobicity. This is typically achieved through the use of a reversed phase
C18 column, and an appropriate solvent gradient (Finoulst et al., 2011). ESI involves the
reduction in size of small charged droplets of the analyte as they are directed towards
the mass analyser via an electric field. Desolvation of droplets during flight results in
further dispersion into smaller droplets based on electrostatic repulsions. Repetition of
this cycle produces charged gas phase molecular ions that enter the mass analyser (Han
et al., 2005). MALDI provides an alternative method of sample ionisation, whereby
desorption of molecular ions from a crystallised matrix is achieved by irradiation of the
sample (Albrethsen, 2007). While ESI is capable of producing molecular ions with
multiple charges, MALDI typically only produces singly charged ions (Karas et al.,
2000). Following ionisation, peptides are separated based on their mass to charge (m/z)
ratio by the mass analyser. Tandem mass spectrometry (MS/MS) can be carried out
using ion trap analysers allowing multi-stage fragmentations of selected precursor ions
(Griffiths and Wang, 2009). MS/MS provides fragmentation patterns of analysed
peptides in addition to the m/z of intact peptide.
The advent of shotgun or MS-based proteomics has expanded the range of
studies in this field in recent years. Shotgun proteomics can take multiple forms
including, (i) direct LC-MS/MS, (ii) indirect LC-MS/MS and (iii) 2D-LC-MS/MS
(multidimensional protein identification technology, MudPIT) (Link et al., 1999;
Washburn et al., 2001). Direct LC-MS/MS involves the on-line separation of complex
peptide mixtures using a reversed phase nano column with an extended gradient.
Indirect LC-MS/MS is where complex peptide or protein mixtures are pre-fractionated
off-line (e.g. by 1D SDS PAGE) before LC-MS/MS analysis (Aebersold and Mann,
2003). Sample complexity can also be reduced using affinity pre-fractionation, whereby

100
abundant proteins can be removed or reduced in concentration (Pernemalm et al., 2009).
Affinity fractionation can be achieved through the use of beads possessing a library of
ligands, facilitating differential binding to a range of proteins and subsequently the
equalisation of protein concentration ranges (Thulasiraman et al., 2005). Keidel et al.
(2010) have shown that use of these ligand libraries may be redundant as the affinity of
proteins for the solid phase beads themselves, based on hydrophobic binding, outweighs
the specific protein-ligand affinity. Inorganic nanoparticles (e.g. gold nanoparticles
(AuNPs) also exhibit adherent qualities, with proteins adsorbing to the nanoparticles
surface and forming a protein shell or ‘corona’ (Casals et al., 2010). Proteins adhering
with high affinity to the nanoparticle surface form the hard corona (Lundqvist et al.,
2008). These qualities can be exploited to reduce sample complexity prior to MS. 2D-
LC-MS/MS involves the on-line separation of peptides using two capillary columns
arranged in a series, and fractionating based on two separate peptide attributes (e.g.
acidity, hydrophobicity) before MS/MS (Link et al., 1999; Washburn et al., 2001). As
with 2D-PAGE, MS-based proteomics can be used in either a quantitative or a
qualitative manner. Quantitative methods involve isotope labelling of peptides using
chemical tags (e.g. isobaric tags for relative and absolute quantification, iTRAQ) or
through the metabolic introduction of isotopes (e.g. stable-isotope labelling by amino
acids in cell culture, SILAC) (Ong et al., 2002; Ross et al., 2004). Label-free methods
of MS-based quantitation, based on spectral counting and peak intensities, are also used
(Old et al., 2005).
2D-PAGE based proteomic maps of A. fumigatus have provided a global
overview of the proteins from mycelia, conidia and the secretome (Asif et al., 2006;
Carberry et al., 2006; Kniemeyer et al., 2006; Vödisch et al., 2009; Teutschbein et al.,
2010; Wartenberg et al., 2011). Sub-proteome strategies have also been implemented to

101
investigate glutathione binding (Carberry et al., 2006) and mitochondrial proteins
(Vödisch et al., 2009). The recent emergence of MS-based proteomics studies of A.
fumigatus has been observed. A large-scale study of the A. fumigatus plasma membrane
identified 530 associated proteins utilising a combination of 1D PAGE fractionation of
total proteins followed by peptide separation and identification by 2D-LC-MS/MS
(Ouyang et al., 2010). This study could not have been undertaken using 2D-PAGE due
to the incompatibility of hydrophobic proteins, and proteins with transmembrane (TM)
regions with the detergents used in isoelectric focusing, the first separation stage of 2D-
PAGE (Rabilloud, 2009). Quantitative MS-based proteomics, both label-free and using
iTRAQ, have been used to comparatively profile the stages of A. fumigatus germination
(Cagas et al., 2011b; Suh et al., 2012). In addition, a recent MS-based study has
investigated the proteomic response of A. fumigatus to growth on human serum
(Wiedner et al., 2012).
The generation of large volumes of data from global proteomics investigations
requires a ‘systems biology’ approach to data interpretation. This is aided by the
availability of various bioinformatics tools, which allow semi-automation of data
analysis (Conesa et al., 2005; Priebe et al., 2011). These tools include programs for the
prediction of protein characteristics, such as protein molecular mass and pI based on
primary structure, relative hydrophobicity, presence of transmembrane helices and
signals for secretion (Bendtsen et al., 2004; Kall et al., 2004; Petersen et al., 2011).
Functional categorisation of proteins, detected in large-scale studies, can assist in the
identification of pathways, processes or subsets of proteins that are active or targeted
under particular experimental conditions. Functional classification schemes regularly
used in A. fumigatus studies include Functional Catalogue (FunCat) (Ruepp et al.,
2004), Gene Ontology (GO) (Ashburner et al., 2000) and Kyoto Encyclopedia of Genes

102
and Genomes (KEGG) (Kanehisa et al., 2012). These classification schemes can be
simultaneously accessed, for a range of fungal species, using the web-based FungiFun
application (Priebe et al., 2011; https://www.omnifung.hki-jena.de/FungiFun/). FunCat
is an annotation scheme that provides a multilevel functional classification allowing
proteins to be grouped into broad first level categories, with more specific categories
branching from these (Ruepp et al., 2004). GO provides a standardised terminology for
the description of genes and their products across all organisms. It is divided into three
sub-categories, describing biological process, molecular function and cellular
localisation relevant to the gene product (Ashburner et al., 2000). KEGG is unique in
that it provides graphical representation of various metabolic pathways, displaying the
relationship between a network of enzymes and metabolites.
The application of MS-based proteomics to dissect the proteome of A. fumigatus
has the potential to provide a global overview of the pathways and biological processes
active under a set of conditions. In addition, bioinformatic analysis can expand the
characterisation of large datasets generated by MS-based proteomics. The aims of the
work described in this Chapter were (i) to generate a global profile of the A. fumigatus
mycelial proteome using MS-based proteomics, (ii) to investigate methods to reduce
sample complexity prior to MS-based proteomics, (iii) to identify proteins in the
secretome of A. fumigatus using direct and indirect methods of MS-based proteomics
and (iv) to characterise the proteome of A. fumigatus using bioinformatic analysis.

103
3.2 Results
3.2.1 Identification of 370 proteins from A. fumigatus mycelia using shotgun mass
spectrometry
Mycelia from A. fumigatus shaking cultures were harvested after 48 h in
Aspergillus minimal media (AMM), and extracted protein was subjected to trypsin
digestion as described in Sections 2.2.2.3 and 2.2.6.2. Tryptic peptide mixtures were
separated on extended liquid chromatography gradients and subjected to tandem mass
spectrometry using the Agilent 6340 Ion Trap LC-MS System (Agilent Technologies)
(Section 2.2.6.3).
Utilising a direct shotgun proteomics approach a total of 1844 unique peptides
were identified, corresponding to 511 unique A. fumigatus proteins. Proteins (n = 370)
were manually verified, based on the presence of ≥ 2 peptides or a Spectrum Mill
MS/MS search score ≥ 18.0 (Appendix I). The protein sequences of the entire A.
fumigatus proteome were obtained from the Aspergillus comparative database provided
by the Broad Institute (Aspergillus Comparative Sequencing Project, Broad Institute of
Harvard and MIT (http://www.broadinstitute.org/). The sequences of the proteins
identified in this study (n = 370) were extracted and the associated theoretical molecular
mass (tMr) and isoelectric point (tpI) were calculated using the Compute pI/MW tool
from the ExPASy Proteomics Server. These proteins (n = 370) spanned a theoretical pI
range of 3.9 to 11.8 and a Mr range of 9 to 434 kDa (Figure 3.1). All peptides identified
contributed to a sequence coverage range of between 1 and 62 % of the relative
proteins, with Spectrum Mill scores ranging between 18 and 1266.
.

104
In order to determine the relative hydrophobicity of identified proteins, the
grand average of hydropathy (GRAVY) index was calculated using GRAVY calculator
(www.gravy-calculator.de). The GRAVY index for identified proteins ranged from -
1.632 to 0.483, with positive scores being indicative of hydrophobicity (Figure 3.2a). A
number of hydrophobic proteins were identified (n = 28; 7.57 % of total identified
proteins), based on positive GRAVY scores. Additionally, GRAVY scores were
collected for the entire predicted proteome of A. fumigatus and it was observed that 15.6
% of the total proteome possess positive GRAVY scores (Figure 3.2). The majority of
proteins identified by shotgun mass spectrometry (71.3 %) were slightly hydrophilic,
with GRAVY scores ranging from -0.5 to 0. This is in-line with the total predicted
proteome of A. fumigatus, where 55.1 % of all predicted proteins fall within this range.
Using Phobius (phobius.cbr.su.se/), the number of putative transmembrane regions
present in each identified protein was determined (Figure 3.2b). Proteins with
transmembrane helices (n = 37; 10.0 % of total identified proteins) were detected.
Several proteins were detected with 10 and more putative TM regions, including a
plasma membrane H+ - ATPase (AFUA_ 3G07640), an amino acid permease (Gap1)
(AFUA_7G04290) and 2 ABC transporters (AFUA_1G14330 and AFUA_5G06070).
One protein, a small oligopeptide transporter (OPT family) (AFUA_2G15240) was
detected with 14 putative transmembrane regions and a GRAVY score of 0.276263.
Identified proteins were grouped into functional categories based on the FunCat
(Functional Catalogue), GO (Gene Ontology) and KEGG (Kyoto Encyclopedia of
Genes and Genomes) annotations, using the FungiFun application
(https://www.omnifung.hki-jena.de/FungiFun/) (Priebe et al., 2011). Annotations were
available for 89.19 %, 86.76 % and 51.89 % of identified proteins using the FunCat, GO
and KEGG schemes respectively (Figure 3.3). Based on the FunCat classification,

105
functional categories that were significantly overrepresented were protein synthesis (n =
77, p = 1.03 x 10⁻²⁰
), energy (n = 86, p = 6.95 x 10⁻¹⁹
), protein with binding function or
cofactor requirement (n = 227, p = 1.14 x 10⁻¹²
), transcription (n = 26, p = 1.97 x 10⁻⁹
)
and cell cycle and DNA processing (n = 46, p = 0.028). Proteins (n = 21; 5.7 %) were
identified which have no functional classifications using the aforementioned methods.

106
Figure 3.1: Proteome map showing distribution of A. fumigatus proteins based on
theoretical Mr and pI Proteins identified by shotgun mass spectrometry (n = 370; red)
are shown overlaid on the total A. fumigatus proteome (black). tMr, theoretical
molecular mass, axis drawn on logarithmic scale; tpI, theoretical isoelectric point, axis
drawn on linear scale.
Theoretical distribution of A. fumigatus
predicted and observed proteins

107
a.
b.
Figure 3.2: Distribution of proteins identified by shotgun mass spectrometry (MS)
according to (a) their relative hydrophobicity and (b) the number of putative
transmembrane regions per protein. Positive GRAVY scores are indicative of
hydrophobic proteins and negative GRAVY scores represent hydrophillic proteins. (a)
Relative distribution of GRAVY score across the entire proteome (black) is indicated
alongside the proteins identified using shotgun MS (grey). (b) The number of putative
transmembrane regions on each protein identified by shotgun MS is shown. GRAVY,
grand average of hydropathy; TM, transmembrane; MS, mass spectrometry.
108
a.
b.
Metabolism14.8%Energy
8.0%
Cell cycle and DNA processing
4.3%
Transcription2.4%
Protein synthesis7.1%
Protein fate (folding, modification, destination)
6.9%
Protein with binding function or cofactor
requirement (structural or catalytic)
21.0%
Regulation of metabolism and protein
function2.0%
Cellular transport, transport facilitation and
transport routes9.2%
Cellular communication/signal
transduction mechanism2.2%
Cell rescue, defense and virulence
5.9%
Interaction with the environment
3.8%
Systemic interaction with the environment
0.1%
Transposable elements, viral and plasmid
proteins0.1%Cell fate
3.0%Development (systemic)
0.4%
Biogenesis of cellular components
5.9%
Cell type differentiation2.8%
Other16.8%
FunCat Organisation of Identified Proteins
Figure 3.3: Distribution of functional annotations of A. fumigatus proteins identified
using shotgun proteomics strategy. (a) GO (gene ontology), KEGG (Kyoto
Encyclopedia of Genes and Genomes) and FunCat (Functional Catalogue) classification
schemes were used for functional annotation utilizing the FungiFun application. A
number of proteins (n = 21) were identified that possessed no functional classification
using this system. (b) The functional categorization of the proteins identified here,
based on the FunCat annotation scheme, are shown.
Unclassified
proteins

109
3.2.2 Identification of A. fumigatus secondary metabolite cluster expression at
protein level
Proteins identified by shotgun mass spectrometry (n = 370) were mapped based
on their relative loci on each of the eight A. fumigatus chromosomes, using their gene
locus identifiers (Figure 3.4a). A number of proteins (n = 14) that comprise a secondary
metabolite supercluster, involved in the production of pseurotin A and fumitremorgin B,
were identified (Table 3.2) (Grundmann and Li, 2005; Maiya et al., 2007; Perrin et al.,
2007). In addition, proteins were identified from the gliotoxin biosynthetic cluster on
chromosome 6 (Gardiner and Howlett, 2005), a putative ETP cluster on chromosome 3
(Patron et al., 2007) and two clusters responsible for the production of unknown
metabolites on chromosomes 3 and 4 respectively (Table 3.2). A phosphoglycerate
kinase PgkA protein (AFUA_1G10350) was also identified, which is predicted to be
part of the Afpes1 NRPS cluster on chromosome 1 (Nierman et al., 2005). The
identification of these proteins is indicative of the respective cluster activity under the
growth conditions used. Interestingly, expression of all of the clusters identified here is
partially or completely regulated by the transcription regulator LaeA (Figure 3.4b)
(Perrin et al., 2007).

110
a.
1
2
3
4
5
6
7
8
0 2000 4000 6000 8000 10000 12000 14000 16000 18000
Ch
rom
oso
me
Nu
mb
er
Gene Locus
Distribution of identified proteins based on gene locus
b.

111
Figure 3.4: (a) Distribution of proteins identified using shotgun mass spectrometry (n =
370) based on gene locus (blue lines). Identification of proteins (n = 14) from a
supercluster on chromosome 8, involved in the production of fumitremorgin B,
pseurotin A and an unknown metabolite (red circle). (b) Summary of secondary
metabolite gene cluster function and regulation by LaeA. A red box is used to indicate
clusters from which protein expression was detected by shotgun mass spectrometry.
From Perrin et al. (2007).
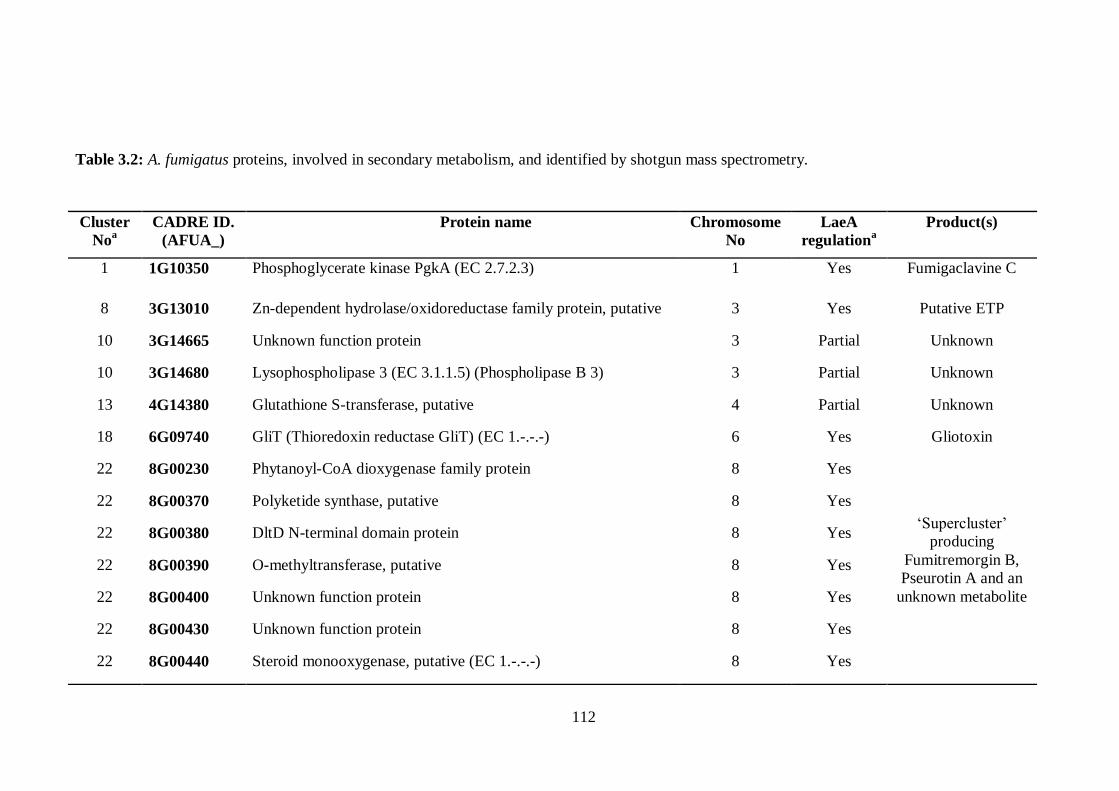
112
Table 3.2: A. fumigatus proteins, involved in secondary metabolism, and identified by shotgun mass spectrometry.
Cluster
Noa
CADRE ID.
(AFUA_)
Protein name Chromosome
No
LaeA
regulationa
Product(s)
1 1G10350 Phosphoglycerate kinase PgkA (EC 2.7.2.3) 1 Yes Fumigaclavine C
8 3G13010 Zn-dependent hydrolase/oxidoreductase family protein, putative 3 Yes Putative ETP
10 3G14665 Unknown function protein 3 Partial Unknown
10 3G14680 Lysophospholipase 3 (EC 3.1.1.5) (Phospholipase B 3) 3 Partial Unknown
13 4G14380 Glutathione S-transferase, putative 4 Partial Unknown
18 6G09740 GliT (Thioredoxin reductase GliT) (EC 1.-.-.-) 6 Yes Gliotoxin
22 8G00230 Phytanoyl-CoA dioxygenase family protein 8 Yes
‘Supercluster’
producing
Fumitremorgin B,
Pseurotin A and an
unknown metabolite
22 8G00370 Polyketide synthase, putative 8 Yes
22 8G00380 DltD N-terminal domain protein 8 Yes
22 8G00390 O-methyltransferase, putative 8 Yes
22 8G00400 Unknown function protein 8 Yes
22 8G00430 Unknown function protein 8 Yes
22 8G00440 Steroid monooxygenase, putative (EC 1.-.-.-) 8 Yes

113
Cluster
Noa
CADRE ID.
(AFUA_)
Protein name Chromosome
No
LaeA
regulationa
Product(s)
22 8G00480 Phytanoyl-CoA dioxygenase family protein 8 Yes
‘Supercluster’
producing
Fumitrmorgin B,
Pseurotin A and an
unknown metabolite
22 8G00500 Acetate-CoA ligase, putative (EC 6.2.1.1) 8 Yes
22 8G00510 Cytochrome P450 oxidoreductase OrdA-like, putative 8 Yes ‘Supercluster’
producing
Fumitremorgin B,
Pseurotin A and an
unknown metabolite
22 8G00530 Alpha/beta hydrolase, putative 8 Yes
22 8G00540 Hybrid PKS-NRPS enzyme, putative 8 Yes
22 8G00550 Methyltransferase SirN-like, putative 8 Yes
22 8G00580 Glutathione S-transferase, putative 8 Yes
CADRE ID., A. fumigatus gene annotation nomenclature according to Nierman et al. (2005) and Mabey et al. (2004). a Clusters numbers and LaeA
regulation as denoted by Perrin et al. (2007).

114
3.2.3 Identification of 173 proteins from A. fumigatus mycelia using shotgun mass
spectrometry coupled with gel filtration pre-fractionation
A. fumigatus mycelia from shaking cultures in AMM were harvested after 48 h.
Protein was extracted and the soluble portion of the whole cell lysate was fractionated
following gel filtration chromatography (Section 2.2.3.2). Fractionated proteins, along
with the insoluble portion of the whole cell lysate, were trypsin digested using the in-
solution method described in Section 2.2.6.2. LC-MS/MS was used to identify A.
fumigatus proteins from each of the fractions (Section 2.2.6.3).
Pre-fractionation of the A. fumigatus mycelia proteome, followed by shotgun
mass spectrometry, resulted in the identification of 768 unique peptides, corresponding
to 227 unique A. fumigatus proteins. Proteins (n = 173) were manually verified, as
before, based on the presence of ≥ 2 distinct peptides or a Spectrum Mill score ≥ 18.0.
Proteins (n = 17) previously not identified by the exclusively shotgun mass
spectrometry approach outlined in Section 3.2.1 are shown in Table 3.3. Proteins (n =
156) that were identified by both gel filtration coupled shotgun mass spectrometry and
shotgun mass spectrometry alone are indicated in Appendix I.
The proteins identified by gel filtration coupled shotgun mass spectrometry (n =
173) spanned a theoretical pI range of 4.08 to 11.36 and a Mr range of 9 to 434 kDa.
Proteins were identified by peptides attributing to between 1 and 65 % sequence
coverage, with Spectrum Mill scores ranging from 18 to 404. The GRAVY index for
proteins identified using this method ranges from -1.577 to 0.415, with 6.9 % of these
proteins possessing a positive GRAVY score. The number of proteins containing
putative transmembrane regions was determined using Phobius software
(phobius.cbr.su.se/) and these accounted for 7.5 % of the proteins identified here. The

115
most hydrophobic protein identified using the approach described in this section was an
amino acid permease (Gap1) (AFUA_7G04290), which possesses 12 putative TM
regions and a GRAVY score of 0.415.

116
Table 3.3: A. fumigatus mycelia proteins (n = 17) identified by gel filtration coupled shotgun mass spectrometry, previously not identified by shotgun
mass spectrometry alone. Proteins are arranged in order of increasing CADRE ID.
CADRE ID.
(AFUA_)
Protein name tpI tMr GRAVY
score
TM Coverage
(%)
Unique
peptides
SM
Score
1G06940 Chorismate synthase (EC 4.2.3.5) 6.12 44185.92 -0.3466 0 2 1 21.79
1G09550 Dynein light chain (Tctex1), putative 5.27 15325.41 0.076224 0 9 1 20.03
1G13780 Histone H4 11.36 11370.35 -0.53883 0 17 1 19.62
2G10600 NADH-ubiquinone oxidoreductase 299 kDa subunit,
putative (EC 1.6.5.3)
5 27541.84 -0.73595 0 4 1 18.27
2G11340 Phosphatidylglycerol/phosphatidylinositol transfer protein
(PG/PI-TP)
5.56 27290.30 -0.0125 0 14 4 54.95
2G15430 Sorbitol/xylulose reductase Sou1-like, putative (EC 1.-.-.-) 5.96 28220.04 -0.0688 0 12 2 33.85
3G07710 Nucleolin protein Nsr1, putative 4.68 58498.97 -1.37949 0 4 2 22.87
3G10920 Telomere and ribosome associated protein Stm1, putative 9.76 36892.45 -1.57734 0 5 2 27.41
4G10280 Phosphotransmitter protein Ypd1, putative 4.86 21367.02 -0.75393 0 14 2 27.75
4G11390 Ubiquinol-cytochrome c reductase complex 17 kDa protein 4.08 17895.00 -1.24684 0 12 2 36.6
4G12850 Calnexin homolog clxA 4.97 61853.81 -0.58295 1 5 3 35.32
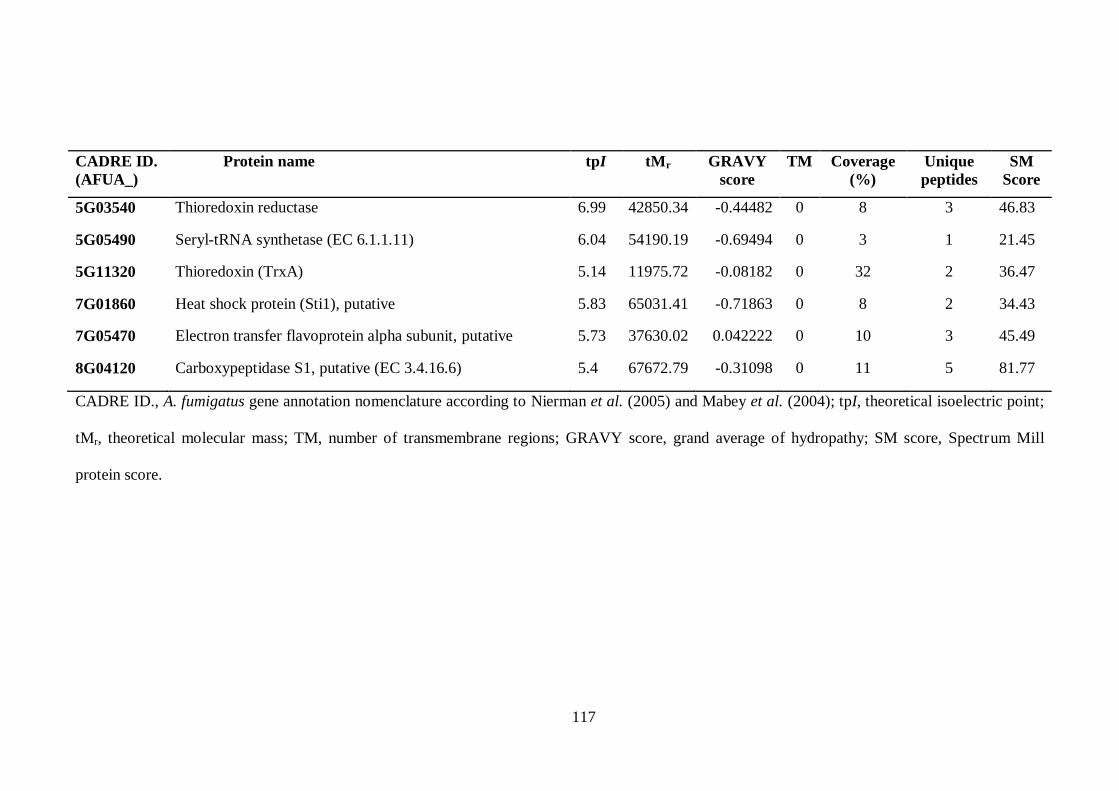
117
CADRE ID.
(AFUA_)
Protein name tpI tMr GRAVY
score
TM Coverage
(%)
Unique
peptides
SM
Score
5G03540 Thioredoxin reductase
6.99 42850.34 -0.44482 0 8 3 46.83
5G05490 Seryl-tRNA synthetase (EC 6.1.1.11) 6.04 54190.19 -0.69494 0 3 1 21.45
5G11320 Thioredoxin (TrxA) 5.14 11975.72 -0.08182 0 32 2 36.47
7G01860 Heat shock protein (Sti1), putative 5.83 65031.41 -0.71863 0 8 2 34.43
7G05470 Electron transfer flavoprotein alpha subunit, putative 5.73 37630.02 0.042222 0 10 3 45.49
8G04120 Carboxypeptidase S1, putative (EC 3.4.16.6) 5.4 67672.79 -0.31098 0 11 5 81.77
CADRE ID., A. fumigatus gene annotation nomenclature according to Nierman et al. (2005) and Mabey et al. (2004); tpI, theoretical isoelectric point;
tMr, theoretical molecular mass; TM, number of transmembrane regions; GRAVY score, grand average of hydropathy; SM score, Spectrum Mill
protein score.

118
3.2.4 Identification of A. fumigatus proteins adsorbing to gold nanoparticles
Mycelia from A. fumigatus ATCC26933 shaking cultures in AMM were
harvested after 48 h. Protein was extracted as described in Section 2.2.2.1 and co-
incubated with 30 nm colloidal gold nanoparticles (Section 2.2.3.3). Gold nanoparticles
(AuNPs) were extensively washed to remove unbound or loosely bound proteins from
the nanoparticles surface. Proteins interacting with the surface of the AuNPs were then
analysed by SDS-PAGE and protein identification was achieved through in-gel trypsin
digestion of the lanes and LC-MS/MS analysis (Section 2.2.6.1, 2.2.6.3).
A total of 43 A. fumigatus proteins that form the hard corona (Lundqvist et al.,
2008) of AuNPs (Figure 3.5), were identified by LC-MS/MS and verified based on a
Spectrum Mill score ≥ 18.0 (Table 3.4). These proteins cover a pI range of 4.77 to 11.46
and a Mr range of 15 to 83 kDa. The GRAVY scores for the protein identified here
extend from -1.016 to 0.247, with 3 proteins exhibiting positive GRAVY score, thus
indicating hydrophobicity. Proteins were identified with up to 3 TM regions (n = 3)
accounting for 7 % of the total number of proteins interacting with the AuNP surface.
Using the FungiFun application (https://www.omnifung.hki-jena.de/FungiFun/)
(Priebe et al., 2011), the proteins identified here were categorized based on their
functional annotations. Annotations were available for 100 %, 90.7 % and 55.81 % of
identified proteins using the FunCat, GO and KEGG schemes respectively. Based on
the FunCat classification, functional categories that were significantly represented in
this dataset included protein synthesis (n = 16, p = 3.25 x 10⁻⁸
), metabolism (n = 9, p =
2.206 x 10⁻⁵
) and energy (n = 13, p = 0.0002). Interestingly, a significant majority of the
proteins identified (n =38/43, 88.4 %; p = 1.18 x 10⁻⁷
) were described as proteins with
binding function or cofactor requirement, according to this system (Figure 3.5).

119
Table 3.3: A. fumigatus mycelia proteins (n = 43) interacting with AuNP surface, identified by 1D-SDS PAGE and LC-MS/MS. Proteins are arranged
in order of increasing CADRE ID.
CADRE ID.
(AFUA_)
Protein name tpI tMr GRAVY
score
TM Coverage
(%)
Unique
peptides
SM
Score
1G03510 ATP synthase gamma chain 7.64 31546.83 -0.22276 0 7 1 19.61
1G04940 Small COPII coat GTPase sar1 (EC 3.6.5.-) 5.96 21431.73 -0.13333 0 15 2 27
1G05390 Mitochondrial ADP,ATP carrier protein (Ant), putative 9.97 33321.49 0.046429 2 20 5 74.33
1G06390 Elongation factor 1-alpha 9.12 50019.60 -0.29565 0 20 7 120.73
1G07440 Molecular chaperone Hsp70 5.08 69660.29 -0.4105 0 14 5 73.29
1G09100 60S ribosomal protein L9, putative 9.67 21843.17 -0.31875 0 6 1 18.35
1G11710 Ribosomal protein 9.88 24252.58 -0.31751 0 5 1 19.71
1G11730 ADP-ribosylation factor, putative (Adp-ribosylation factor,
putative)
5.54 21003.07 -0.27596 0 9 2 29.12
1G12170 Elongation factor Tu 6.69 48285.99 -0.32227 0 7 2 33.57
1G14200 Mitochondrial processing peptidase beta subunit, putative (EC
3.4.24.64)
5.9 53269.94 -0.32401 0 4 2 44.14
1G14410 60S ribosomal protein L17 10.64 21666.02 -0.53041 0 4 1 20.78
2G03290 14-3-3 family protein ArtA, putative 4.77 29101.64 -0.43563 0 5 1 21.25

120
CADRE ID.
(AFUA_)
Protein name tpI tMr GRAVY
score
TM Coverage
(%)
Unique
peptides
SM
Score
2G03730 Ctr copper transporter family protein 8.08 28350.07 0.247082 3 6 1 23.49
2G07970 60S ribosomal protein L19 11.46 24785.90 -1.01611 0 5 2 26.76
2G09090 Prohibitin, putative 10.02 34280.16 -0.30643 0 8 1 19.12
2G09210 60S ribosomal protein L10 10.33 25586.74 -0.53722 0 4 1 19.9
2G09290 Antigenic mitochondrial protein HSP60, putative 5.53 61949.95 -0.09949 0 4 2 38.19
2G09850 Oxidoreductase, 2-nitropropane dioxygenase family, putative
(EC 1.-.-.-)
6.52 37702.48 -0.02873 0 3 1 22.69
2G10600 NADH-ubiquinone oxidoreductase 299 kDa subunit, putative
(EC 1.6.5.3)
5 27541.84 -0.73595 0 4 1 20.74
2G13530 Translation elongation factor EF-2 subunit, putative 6.51 93198.10 -0.23468 0 7 4 65.38
3G05350 Histone H2B 10.12 14955.22 -0.68 0 10 1 19.72
3G05600 60S ribosomal protein L27a, putative 10.44 16761.31 -0.6349 0 10 1 21.15
3G06970 40S ribosomal protein S9 9.95 26670.60 -0.54768 0 7 1 21.49
3G07810 Succinate dehydrogenase subunit Sdh1, putative 6.5 71148.03 -0.41314 0 2 1 19.86
3G08160 ATP-dependent RNA helicase eIF4A (EC 3.6.4.13)
(Eukaryotic initiation factor 4A)
5.05 45778.53 -0.20222 0 5 2 28.15
3G10730 40S ribosomal protein S7e 10.15 22844.25 -0.54677 0 20 2 23.23

121
CADRE ID.
(AFUA_)
Protein name tpI tMr GRAVY
score
TM Coverage
(%)
Unique
peptides
SM
Score
3G13320 40S ribosomal protein S0 4.81 32122.23 -0.16498 0 7 2 27.53
4G03880 60S ribosomal protein L7 9.7 34252.62 -0.56869 0 10 2 32.69
4G06910 Outer mitochondrial membrane protein porin 9.47 36893.97 -0.14029 0 3 1 18.79
4G07210 Mitochondrial acetolactate synthase small subunit, putative
(EC 2.2.1.6)
6.37 35573.55 -0.18012 0 3 1 19.84
4G10800 40S ribosomal protein S6 10.84 27279.81 -0.88819 0 7 1 25.49
4G11250 Carbonic anhydrase (EC 4.2.1.1) 8.62 30827.50 -0.04355 0 10 2 36.23
4G12850 Calnexin homolog clxA 4.97 61853.81 -0.58295 1 2 1 18.98
5G01970 Glyceraldehyde-3-phosphate dehydrogenase (EC 1.2.1.12) 6.96 36314.28 -0.11124 0 20 7 106.8
5G04210 Ubiquinol-cytochrome C reductase complex core protein 2,
putative (EC 1.10.2.2)
8.89 48089.24 -0.02565 0 7 2 36.31
5G06360 60S ribosomal protein L8, putative 10.97 27485.65 -0.53976 0 13 2 28.52
5G10550 ATP synthase subunit beta (EC 3.6.3.14) 5.3 55620.38 -0.07881 0 10 4 70.17
6G04740 Actin Act1 5.87 43893.19 -0.20356 0 8 2 31.59
6G06340 Glucosamine-fructose-6-phosphate aminotransferase 6.24 77286.83 -0.14813 0 1 1 18.87
6G08810 NADH-ubiquinone oxidoreductase 304 kDa subunit (EC
1.6.5.3)
9.28 38191.46 -0.47395 0 1 1 20.4

122
CADRE ID.
(AFUA_)
Protein name tpI tMr GRAVY
score
TM Coverage
(%)
Unique
peptides
SM
Score
6G13300 GTP-binding nuclear protein Ran, putative 6.91 24077.71 -0.23721 0 3 2 22.8
8G04000 Acetyl-CoA acetyltransferase, putative (EC 2.3.1.9) 6.4 40908.96 0.067588 0 4 1 18.02
8G05320
ATP synthase subunit alpha 9.14 59932.73 -0.12824 0 13 5 67.27
CADRE ID., A. fumigatus gene annotation nomenclature according to Nierman et al. (2005) and Mabey et al. (2004); tpI, theoretical isoelectric point;
tMr, theoretical molecular mass; TM, number of transmembrane regions; GRAVY score, grand average of hydropathy; SM score, Spectrum Mill
protein score.

123
(i) (ii)
a.
b.
c.

124
Figure 3.5: (a) Schematic representation of a (i) 30 nm colloidal AuNP (red sphere)
with surrounding hard corona of adherent proteins and (ii) unbound proteins that do not
adsorb to the nanoparticle surface. (b) SDS-PAGE of fractions from AuNP incubation
with A. fumigatus mycelial proteins. M, protein marker; Lane 1, A. fumigatus lysate
prior to AuNP incubation; Lane 2, Unbound A. fumigatus proteins following AuNP
incubation; Lane 3, A. fumigatus proteins adhering to AuNP surface (hard corona). (c)
The functional categorisation of A. fumigatus mycelial proteins (n = 43), comprising the
hard corona of AuNPs, using the FunCat annoation scheme. Categories displaying a p
value < 0.05, as determined by the FungiFun application (Priebe et al., 2011), are shown
and number of proteins with corresponding annotations are indicated in bold. Some
proteins have multiple functional annotations.

125
3.2.5 Identification of 42 proteins from A. fumigatus supernatants using 1D-SDS
PAGE and shotgun mass spectrometry
Supernatants from A. fumigatus static cultures were harvested after 1, 2 and 3
weeks of growth in AMM at 37 °C and lyophilized overnight. Dried supernatants were
subjected to TCA/acetone precipitation (Section 2.2.4.10) and resultant precipitates
were analysed by SDS-PAGE followed by in-gel trypsin digestion as described in
Sections 2.2.4.2 and 2.2.6.1. Samples were also subjected to direct in-solution digestion,
without prior SDS-PAGE, to enable shotgun mass spectrometric identification of
culture supernatant proteins (Section 2.2.6.2). Tryptic peptide mixtures were analysed
by LC-MS/MS and proteins were identified through database interrogation using the
Spectrum Mill Workbench (Section 2.2.6.3, 2.2.7.1).
Utilising both direct (shotgun) and in-direct (SDS-PAGE) methods of sample
processing, a total of 42 A. fumigatus proteins were identified from culture supernatants
(Table 3.5). For the large scale investigation of secreted proteins, SDS-PAGE coupled
with LC-MS/MS yielded more identifications (n = 39) than the shotgun mass
spectrometry approach (n = 10). The culture supernatant proteins identified here
spanned a theoretical pI range of 4.6 to 8.4 and a Mr range of 12 to 106 kDa. Peptides
identified contributed to a sequence coverage range between 1 and 45 % of the relative
proteins, with Spectrum Mill scores ranging between 18 and 300.
Functional annotations were determined for the identified supernatant proteins
using the FungiFun application application (https://www.omnifung.hki-
jena.de/FungiFun/) (Priebe et al., 2011). Annotations were available for 76.19 %, 78.57
% and 28.57 % of identified proteins using the FunCat, GO and KEGG schemes
respectively. Based on the GO classification, biological processes that were

126
significantly overrepresented included carbohydrate metabolic process (n = 13, p = 4.96
x 10-10
), proteolysis (n = 7, p = 1.45 x 10⁻⁶
), pathogenesis (n = 3, p = 0.0001) and
polysaccharide catabolic process (n = 4, p = 0.0002). Molecular functions that were
significantly represented in the sample set included hydrolase activity (n = 24, p = 4.19
x 10-13
) and peptidase activity (n = 4, p = 0.0016). Proteins were identified (n = 7; 16.7
%) were identified which have no functional classification using the aforementioned
methods.
The relative hydrophobicity of the proteins identified was measured as outlined
in Section 3.2.1. The GRAVY score was found to range from -0.6741 to 0.4203 with 9
proteins possessing positive scores (21.43 % of total supernatant proteins identified),
thus indicating their hydrophobicity. Proteins with putative transmembrane regions
were detected (n = 3; 7.14 %). One protein, a monosaccharide transporter
(AFUA_6G03060) was detected with 12 putative TM regions and a GRAVY score of
0.4203. Interestingly, this highly hydrophobic protein was only detected using the
shotgun mass spectrometry approach and not the SDS-PAGE coupled method.
An additional bioinformatics tool was utilized to characterise the proteins
identified from A. fumigatus culture supernatants. SignalP (Petersen et al., 2011) was
utilized to determine that 34 (i.e. 79 %) of the proteins identified here possessed a signal
peptide, that results in their secretion from the organism by classical pathways.
SecretomeP (Bendtsen et al., 2004) determined that an additional 5 (i.e. 12 %) of the
proteins identified here are predicted to be secreted by non-classical pathways. Asp-
hemolysin (Asp-HS) (AFUA_3G00590) and a unknown function protein
(AFUA_6G00180) were not predicted to have a signal peptide or be secreted by a non-
classical pathway, however these proteins have recently been identified in culture
supernatants of A. fumigatus by Wartenberg et al. (2011) and Upadhyay et al. (2012),

127
respectively. This provides a positive validation of the techniques used here, from
sample processing to verification of mass spectrometry data.

128
Table 3.5: A. fumigatus supernatant proteins (n = 42) identified by SDS-PAGE and shotgun mass spectrometry, arranged in order of increasing
CADRE ID.
CADRE ID.
(AFUA_)
Protein name tpI tMr GRAVY
score
TM Coverage
(%)
Unique
peptides
SM
Score
SigP/
SecP
1G00980a,b
FAD-dependent oxidase, putative (EC 1.5.3.-) 6.76 53642.92 -0.0119 0 26 12 208.07 SigP
1G10790a Alpha-1,2-mannosidase family protein, putative 5.97 92750.47 -0.36043 0 4 2 38.19 SigP
1G14560a,b
Probable mannosyl-oligosaccharide alpha-1,2-mannosidase
1B (EC 3.2.1.113) (Class I alpha-mannosidase 1B)
(Man(9)-alpha-mannosidase 1B)
5.09 53840.28 -0.22495 0 37 16 299.83 SigP
1G16190a Probable glycosidase crf1 (EC 3.2.-.-) (Crh-like protein 1)
(allergen Asp f 9)
4.6 40283.87 -0.26076 0 6 2 33.67 SigP
1G16420a GPI anchored protein 5.34 58557.10 -0.30918 0 6 2 35.71 SigP
1G17410a Probable beta-glucosidase M (EC 3.2.1.21) (Beta-D-
glucoside glucohydrolase M) (Cellobiase M)
5.14 82681.18 -0.2736 0 4 3 47.28 SigP
2G00690a Glucoamylase (EC 3.2.1.3) (1,4-alpha-D-glucan
glucohydrolase) (Glucan 1,4-alpha-glucosidase)
5.04 67100.35 -0.10301 0 27 11 178.22 SigP
2G03980a Alpha-1,3-glucanase/mutanase, putative (EC 3.2.1.-) 4.98 54022.65 -0.2123 0 9 3 54.06 SigP
2G09030a Dipeptidyl-peptidase 5 (EC 3.4.14.-) (Dipeptidyl-peptidase
V) (DPP V) (DppV)
5.59 79744.94 -0.41956 0 4 3 44.37 SigP
2G11340b Phosphatidylglycerol/phosphatidylinositol transfer protein
(PG/PI-TP)
5.56 27290.30 -0.0125 0 4 1 18.8 SecP

129
CADRE ID.
(AFUA_)
Protein name tpI tMr GRAVY
score
TM Coverage
(%)
Unique
peptides
SM
Score
SigP/
SecP
2G12630a,b
Allergen Asp f 15 (Allergen Asp f 13) (allergen Asp f 15) 4.61 15943.84 -0.09408 0 15 2 38.33 SigP
2G16720a DUF1237 domain protein 5.94 61508.47 -0.28444 0 14 5 85.7 SigP
3G00270a Probable glucan endo-1,3-beta-glucosidase eglC (EC
3.2.1.39) (Endo-1,3-beta-glucanase eglC)
4.9 44651.21 0.064126 1 10 3 60.34 SigP
3G00320a Endo-1,4-beta-xylanase xynf11a (Xylanase xynf11a) (EC
3.2.1.8) (1,4-beta-D-xylan xylanohydrolase xynf11a)
6.27 24493.69 -0.36096 0 11 2 30.86 SigP
3G00590a,b
Asp-hemolysin (Asp-HS) 5.29 15198.64 -0.6741 0 45 7 111.53 -
3G00840a FAD-dependent oxygenase, putative 6.52 55026.25 -0.16785 0 26 10 182.58 SigP
3G01130a,b
Cell wall protein 4.8 19272.88 0.006667 0 10 2 33.27 SigP
3G02970a Aspergillopepsin, putative (EC 3.4.23.-) 5.02 28013.98 -0.03717 0 10 2 31.69 SigP
3G03060a Cell wall protein PhiA 5.2 19406.49 -0.19514 0 34 3 57.7 SigP
3G03080a Endo-1,3(4)-beta-glucanase, putative (EC 3.2.1.6) 5.09 31087.62 -0.20456 0 27 7 135.29 SigP
4G03240b Cell wall serine-threonine-rich galactomannoprotein Mp1 4.66 27361.21 0.178169 0 4 2 39.53 SigP
4G03490a Tripeptidyl-peptidase sed2 (EC 3.4.14.-) (Sedolisin-B) 5.3 65838.74 -0.36777 0 1 1 20.59 SigP
4G03660a Acid phosphatase, putative (EC 3.1.3.2) 5.94 46131.72 -0.34758 0 12 4 64.95 SigP
4G09030a Aminopeptidase (EC 3.4.11.7) 6.31 106226.80 -0.27671 0 1 1 22.85 SecP

130
CADRE ID.
(AFUA_)
Protein name tpI tMr GRAVY
score
TM Coverage
(%)
Unique
peptides
SM
Score
SigP/
SecP
4G11800a Oryzin (EC 3.4.21.63) (Alkaline proteinase) (ALP)
(Elastase) (Elastinolytic serine proteinase)
6.31 42190.12 -0.1129 0 25 8 139.76 SigP
4G13750a Penicillolysin/deuterolysin metalloprotease, putative (EC
3.4.-.-)
5.71 39404.88 -0.17297 0 11 3 63.45 SigP
4G13770a Glycosyl hydrolase, putative (EC 3.-.-.-) 5.14 36755.60 0.085028 0 29 6 102.6 SigP
5G01200a Carboxypeptidase S1, putative (EC 3.4.16.6) 4.84 54122.23 -0.33873 0 18 6 108.44 SigP
5G01990a BYS1 domain protein, putative 4.8 16026.11 0.102564 0 11 1 21.46 SigP
5G02040a Extracellular lipase, putative (EC 3.1.1.3) 5.59 31443.21 0.110368 0 13 4 84.65 SigP
5G02100a,b
Unknown function protein 5.13 29461.30 -0.65358 0 20 6 115.73 SecP
5G02130a Probable alpha-galactosidase B (EC 3.2.1.22) (Melibiase
B)
5.1 47214.90 -0.39296 0 15 4 68.46 SecP
5G03540a Thioredoxin reductase, putative (EC 1.-.-.-) 6.99 42850.34 -0.44482 0 2 1 18.01 SigP
6G00180a Unknown function protein 8.41 12131.63 -0.33578 1 31 2 38.96 -
6G00430a IgE-binding protein 4.66 20487.89 0.0735 0 6 1 19.14 SecP
6G03060b MFS monosaccharide transporter, putative 6.37 58272.82 0.420339 12 4 1 19.08 -
6G10130a N,O-diacetyl muramidase, putative (EC 3.2.1.-) 6.02 24639.35 -0.16316 0 7 1 23.6 SigP
6G13270a Exo-beta-1,3-glucanase, putative (EC 3.2.1.58) 5 84183.57 -0.01182 0 25 14 270.43 SigP

131
CADRE ID.
(AFUA_)
Protein name tpI tMr GRAVY
score
TM Coverage
(%)
Unique
peptides
SM
Score
SigP/
SecP
7G05140a Class III chitinase, putative (EC 3.2.1.14) 4.89 46234.54 0.034152 0 7 2 36.78 SigP
7G06140a Probable beta-glucosidase L (EC 3.2.1.21) (Beta-D-
glucoside glucohydrolase L) (Cellobiase L)
5.65 78381.15 -0.16482 0 13 6 106.79 SigP
8G01410a,b
Chitinase (Class V chitinase ChiB1) (EC 3.2.1.14) 5.03 47622.12 -0.33418 0 41 11 218.09 SigP
8G07120a Beta-1,6-glucanase Neg1, putative (EC 3.2.1.-) 5.51 51430.21 -0.17254 0 17 6 113.66 SigP
CADRE ID., A. fumigatus gene annotation nomenclature according to Nierman et al. (2005) and Mabey et al. (2004); tpI, theoretical isoelectric point;
tMr, theoretical molecular mass; TM, number of transmembrane regions; GRAVY score, grand average of hydropathy; SM score, Spectrum Mill
protein score; SigP, presence of a signal peptide for secretion by classical pathways; SecP, indicates protein is secreted by non-classical pathways.
aProtein was identified following SDS-PAGE coupled with LC-MS/MS;
bProtein was identified by shotgun mass spectrometry.

132
3.3 Discussion
An extensive investigation of the A. fumigatus intracellular and extracellular
proteome was undertaken using a combination of SDS-PAGE, gel filtration and shotgun
mass spectrometry. This Chapter outlines a global proteomics approach, which was
carried out using alternative methods to those classically used for mapping the proteome
of A. fumigatus mycelia, such as 2D-PAGE coupled with mass spectrometry (Carberry
et al., 2006; Kniemeyer et al., 2006; Vödisch et al., 2009; Teutschbein et al., 2010).
Utilising the methods outlined in this Chapter a total of 427 unique A. fumigatus
mycelial and secreted proteins were identified. Proteins identified from the mycelia of
A. fumigatus ATCC26933, after 48 h in AMM, totalled 390, while 42 proteins were
identified from the culture supernatants of extended static cultures in AMM.
The utilisation of shotgun proteomics in this large scale investigation has
enabled the identification of a number of proteins that are typically difficult to resolve
using 2D-PAGE. High molecular mass proteins, hydrophobic proteins and proteins with
transmembrane regions are generally under-represented in 2D-PAGE studies, due to
their incompatibility with the isoelectric focusing stage or limited separation by SDS-
PAGE (Harder et al., 1999; Rabilloud, 2009). The standard molecular mass resolution
of A. fumigatus mycelia proteins, using 2D-PAGE, ranges from 10 to 142 kDa
(Carberry et al., 2006; Kniemeyer et al., 2006; Vödisch et al., 2009). The constraint of
large molecular mass did not apply to the shotgun proteomic approach used in this
study, with the identification of 10 proteins possessing a molecular mass greater than
142 kDa. The largest protein detected was PesO, a hybrid polyketide synthase/ non-
ribosomal peptide synthetase (PKS/NRPS) (AFUA_8G00540), with a theoretical
molecular mass of 434 kDa. A total of 73 unique peptides were identified from this
protein contributing to a sequence coverage of 28 %. A. fumigatus pesO has been

133
previously investigated in targeted and global transcriptomic studies (Da Silva Ferreira
et al., 2006; Lee et al., 2009a; Vödisch et al., 2011). PesO, the only hybrid PKS/NRPS
in the A. fumigatus genome, is involved in the production of pseurotin A (Maiya et al.,
2007) and its identification provides evidence of expression of this secondary
metabolite cluster. A 267 kDa polyketide synthase (AFUA_8G00370) was also
identified by 10 unique peptides, contributing to 10% sequence coverage. These
findings represent some of the largest A. fumigatus proteins to be identified by mass
spectrometry to date. A study by Cagas et al. (2011b) utilised isobaric tagging for
relative and absolute quantitation (iTRAQ) in order to profile the early development
proteome of A. fumigatus. This gel-free method of large scale proteomic identification
extended the molecular mass limits of detection to 9 to 255 kDa. More recently,
Wiedner et al. (2012) introduced the use of chemical probes, to discern between active
and inactive enzymes, coupled with quantitative MS. This study further expanded the
identification of large molecular mass proteins in A. fumigatus, confirming the value of
alternative methods for proteomic investigation.
Proteins with extended hydrophobic regions are difficult to analyse by 2D-
PAGE due to their low water solubility and resulting incompatibility with the conditions
used in isoelectric focusing (Rabilloud, 2009). This has resulted in the majority of
recent A. fumigatus membrane investigations being carried out utilising SDS-PAGE
coupled with mass spectrometry or gel-free iTRAQ (Ouyang et al., 2010; Cagas et al.,
2011a). In contrast, proteomic analysis of A. fumigatus mycelia is dominated by the use
of 2D-PAGE coupled with mass spectrometry (Carberry et al., 2006; Kniemeyer et al.,
2006; Vödisch et al., 2009). These studies have yielded large volumes of information on
the mycelial proteome of A. fumigatus, however the limitations of 2D-PAGE have
hindered the identification of hydrophobic proteins and proteins with multiple

134
transmembrane regions from these fractions. A comprehensive mycelial proteome
reference map, produced by Vödisch et al. (2009), identified proteins with a GRAVY
score up to 0.158 and fourteen proteins with 1-2 putative TM regions. This correlates to
4.2 %, of the total identified proteins, possessing TM regions. Here, in comparison, 37
proteins possessing predicted TM domains were identified from the mycelia of A.
fumigatus, corresponding to 10 % of the total proteins identified using shotgun mass
spectrometry alone (Figure 3.2). This represents a substantial increase (2.4 fold) in the
identification of proteins with TM regions, compared to previous 2D-PAGE based
studies with similar targets (Vödisch et al., 2009). A small oligopeptide transporter,
OPTB (AFUA_2G15240), was identified, which is predicted to contain 14 TM helices.
While the differential regulation of the transcript of the optB gene has been reported
previously (Da Silva Ferreira et al., 2006; Hartmann et al., 2011), this represents the
first identification of the gene product at the protein level. Analysis of the entire A.
fumigatus proteome predicts up to 24 % of total proteins with at least one TM helix
(Vödisch et al., 2009), and so under-identification of these proteins can result in
disparity in the interpretation of the proteome under various conditions. This case is also
mirrored in the identification of hydrophobic proteins, based on positive GRAVY
scores. Using the shotgun proteomics approach 28 hydrophobic proteins, corresponding
to 7.6 % of total identified proteins, were detected, including a protein transport protein
SEC61 alpha subunit (AFUA_5G08130) with a GRAVY score of 0.4828. With 3.4 %
of mycelia proteins, identified in the 2D-PAGE proteome map of Vödisch et al. ( 2009),
possessing positive GRAVY scores, this too represents a significant improvement on
the gel based methods of proteome investigation.
Functional classification of proteins identified by shotgun mass spectrometry
revealed that categories describing (i) protein synthesis, (ii) energy, (iii) protein with

135
binding function or cofactor requirement, (iv) transcription and (v) cell cycle and DNA
processing were significantly represented in the data set. Identification of a large
number of ribosomal proteins (n = 48) (Figure 3.6) accounts for the high representation
of the protein synthesis and the protein with binding or cofactor requirement functional
categories. Despite their abundance in the cell (Warner, 1999), detection of ribosomal
proteins by 2D-PAGE may be limited due the highly basic or acidic nature of these
proteins and the relative low molecular mass of the subunits. Vödisch et al. (2009)
identified 11 ribosomal proteins during the compilation of the mycelial proteome
reference map of A. fumigatus while no ribosomal proteins were detected in earlier
proteome maps (Carberry et al., 2006; Kniemeyer et al., 2006). Of the ribosomal
proteins identified by shotgun mass spectrometry, 42 exhibited a pI ≥ 8.59 and the
remainder, described as acidic subunits displayed a pI ≤ 5.74. All identified ribosomal
proteins had a molecular mass ≤ 44 kDa, with 87.5 % having a Mr < 30 kDa. KEGG
pathway mapping allows visualisation of the ribosomal proteins identified and their
respective localisation in either the large (60S) or the small (40S) ribosomal subunits
(Figure 3.6).

136
Figure: 3.6: A. fumigatus ribosomal proteins identified by shotgun mass spectrometry. Green boxes represent ribosomal proteins that have been
annotated in A. fumigatus according to KEGG pathways (Kanehisa et al., 2012). Boxes with red font and border represent proteins that were identified
in this study.

137
The functional category describing proteins involved in energy metabolism or
transfer was also significantly represented from the sample set of proteins identified by
shotgun mass spectrometry (n = 86; p = 6.95e-18). The majority of the enzymes
constituting the citrate cycle (TCA) were detected (Figure 3.7), in addition to proteins
involved in electron transport and energy generation by ATP synthases. This
observation reflects the growth on glucose as a sole carbon source, whereby glycolysis
provides a substrate for the TCA cycle which in turn generates energy via the electron
transport chain. Enzymes were also identified that are involved in the pentose phosphate
pathway, an alternative route for glucose oxidation which can produce intermediate
pentoses used in the biosynthesis of nucleic acids or aromatic amino acids. These
enzymes included 6-phosphogluconate dehydrogenase (AFUA_6G08050) which is
responsible for the metabolism of 6-phospho-D-gluconate, a derivative of glucose, to D-
ribulose 5-P (Maaheimo et al., 2001). Following the conversion of ribulose-5-P to D-
xylulose 5-P, transketolase TktA (AFUA_1G13500) catalyses the production of
sedoheptulose 7-P and fructose 6-P in separate reactions (Kleijn et al., 2005).
Sedoheptulose 7-P can then be metabolised to D-erythrose 4-P, an amino acid
precursor, by transaldolase (AFUA_5G09120) (Schaaff et al., 1990).

138
Figure 3.7: A. fumigatus proteins identified by shotgun mass spectrometry, involved in the TCA cycle. Green boxes represent proteins that have been
annotated in A. fumigatus according to KEGG pathways (Kanehisa et al., 2012). Boxes with red font and border represent proteins that were identified
in this study.
Citrate cycle (TCA Cycle)

139
A number of proteins (n = 21) were identified by shotgun proteomics with no
functional annotation, based on FunCat, GO and KEGG annotation, using the FungiFun
application (https://www.omnifung.hki-jena.de/FungiFun/) (Priebe et al., 2011). Many
of these proteins were annotated as hypothetical proteins (AFUA_1G02290,
AFUA_1G09130, AFUA_2G02490, AFUA_3G00730, AFUA_3G06460,
AFUA_3G08440, AFUA_3G14665, AFUA_5G14680, AFUA_6G10450,
AFUA_8G00400, AFUA_8G00430, AFUA_8G04890, and AFUA_8G05600) and can
now be reclassified as unknown function proteins (UFPs) as a result of the biochemical
verification of their translation. Other proteins with unknown functions identified by
shotgun mass spectrometry include high expression lethality protein (Hel10)
(AFUA_1G06580), PT repeat family protein (AFUA_2G17000), conserved lysine-rich
protein (AFUA_4G12450), DUF 89 domain protein (AFUA_5G06710), cipC-like
antibiotic response protein (AFUA_5G09330), CFEM domain protein
(AFUA_6G06690), M protein repeat protein (AFUA_6G08660) and dltD N-terminal
domain protein (AFUA_8G00380).
Additional bioinformatics analysis, using the program BLAST2GO, enabled the
putative functional annotation of some of these proteins based on sequence homology to
proteins on the NCBI database (http://www.blast2go.com/b2glaunch/start-blast2go)
(Conesa et al., 2005). The unknown function protein (AFUA_2G02490) was re-
annotated by this method as a putative glutamineamidotransferase subunit pdxT, with
predicted nucleotide binding and transferase activities. Similarly the unknown function
proteins (AFUA_1G109130, AFUA_1G02290 and AFUA_3G00730) were re-annotated
as putative transcription factor Btf3, cyanovirin-n family protein and a glutathione s-
transferase, respectively. The remaining proteins retained their original sequence
descriptions, however GO identifications were assigned to a number of proteins based

140
on sequence homology. The unknown function protein (AFUA_8G00400) was
predicted to have O-methyltransferase activity and this could allude to its function as
part of the secondary metabolite cluster on Chromosome 8 (Perrin et al., 2007). The M
protein repeat protein was assigned GO identifications indicating its involvement in
signal transduction and a localisation designating it as integral to the membrane. The
DUF89 domain protein (AFUA_5G06710) was denoted putative molecular functions of
protein serine/threonine phosphatase activity and metal ion binding. The conserved
lysine-rich protein (AFUA_4G12450) was deemed to have protein and phospholipid
binding activity, while the PT repeat family protein (AFUA_2G17000) was annotated
with hydrolase and peptidase activity. This study is the first report to date on the
unknown function proteins (AFUA_2G02490, AFUA_3G14665, AFUA_8G04890), PT
repeat family protein and DUF 89 domain protein, with many others accounted for at
the transcript level only (Sheppard et al., 2005; da Silva Ferreira et al., 2006; Twumasi-
Boateng et al., 2009). These proteins represent targets for future functional genomic or
comparative proteomic projects to elucidate their role in the fungal cell (Doyle, 2011b).
Verification of the transcription and translation of genes found in secondary
metabolite clusters was achieved in this study using shotgun mass spectrometry.
Proteins identified are putatively found in six clusters, involved in the production of up
to eight secondary metabolites (SM) (Perrin et al., 2007). Products of these SM clusters
include up to 4 unknown metabolites, fumitremorgin B (Grundmann and Li, 2005;
Maiya et al., 2006), pseurotin A (Maiya et al., 2007), gliotoxin (Gardiner and Howlett,
2005) and a putative ETP (Patron et al., 2007) (Figure 3.8). Perrin et al. (2007)
annotated a ‘supercluster’ on Chromosome 8 (AFUA_8G00100-AFUA_8G00720) that
is involved in the production of fumitremorgin B, pseurotin A and possibly an
additional unknown metabolite (Grundmann and Li, 2005; Maiya et al., 2007). Fourteen

141
proteins identified by shotgun mass spectrometry are annotated members of this
‘supercluster’, with one identified protein involved in fumitremorgin B production, four
proteins involved in the pseurotin A biosynthetic portion of the cluster and the
remaining nine proteins forming part of the cluster producing an unknown metabolite.
Phytanoyl-CoA dioxygenase family protein (FtmF) (AFUA_8G00230) was
identified by 3 unique peptides and a sequence coverage of 14 %. FtmF, a non-heme Fe
(II) and α-ketoglutarate-dependent dioxygenase, catalyses the conversion of
fumitremorgin B to verruculogen via endoperoxide bond formation (Steffan et al.,
2009). This enzyme is also capable of conversion of fumitremorgin B to 12α, 13α-
dihydroxyfumitremorgin C and 13-oxo-verruculogen, by deprenylation and oxidation
mechanisms respectively (Kato et al., 2011). Verruculogen, like fumitremorgin B, is a
tremorgenic mycotoxin and has been shown to produce deleterious effects on
respiratory epithelial cells (Khoufache et al., 2007). The observation of the FtmF
enzyme suggests the production of fumitremorgin B by A. fumigatus under the
conditions of culture and its subsequent conversion to verrulculogen.
Pseurotin A is another metabolite produced by the ‘supercluster’ on
Chromosome 8 (Figure 3.8) (Maiya et al., 2007). Four enzymes, that form part of the
pseurotin biosynthetic cluster, were detected here; an alpha/beta hydrolase
(AFUA_8G00530), a hybrid PKS-NRPS enzyme PesO (AFUA_8G00540), a
methyltransferase SirN-like (AFUA_8G00540) and a putative glutathione S-transferase
(AFUA_8G00580) (Carberry et al., 2006). This cluster has demonstrated increased
expression at both the transcript and protein level under hypoxic conditions (Vödisch et
al., 2011). Furthermore, up-regulation of the methyltransferase and hybrid PKS-NRPS
transcripts was also shown in the mouse lung during experimental aspergillosis
(Vödisch et al., 2011). As discussed earlier, the hybrid PKS-NRPS, a 434 kDa protein,

142
was identified and represents one of the largest proteins detected by MS in A. fumigatus
to date.
The final section of the Chromosome 8 ‘supercluster’ is hypothesised to produce
a secondary metabolite, however this molecule has remained unidentified. Genes
predicted to form this cluster span from AFUA_8G00300 to AFUA_8G00520 and nine
of the corresponding proteins were identified by shotgun mass spectrometry, providing
strong evidence of the production of this unknown metabolite under the conditions
utilised here (i.e. minimal media, 37 °C, 200 rpm, dark, 48 h). Vödisch et al. (2011)
identified two of these proteins, a steroid monooxygenase (AFUA_8G00440) and an
unknown function protein (AFUA_8G00430), with significant upregulation under
hypoxic growth conditions. This may suggest the uncharacterised metabolite could be a
putative virulence factor, as cluster expression is up-regulated in conditions that reflect
the hypoxic in vivo environment. Indeed, transcript expression of six of the proteins
identified from this cluster was up-regulated in A. fumigatus Af293 during the initiation
of murine infection (McDonagh et al., 2008) (Table 3.6).

143
Table 3.6: Differential regulation of a secondary metabolite cluster on Chromosome 8
in A. fumigatus Af293 during initiation of murine infection
Differential expression of genes during initiation of murine infection was depicted by a
colour scale of red (up-) to green (down-regulation). Proteins identified by shotgun
proteomics are surrounded by a red box. New Accessions., A. fumigatus gene
annotation nomenclature according to Nierman et al. (2005) and Mabey et al. (2004).
From McDonagh et al. (2008), supplementary table 6.

144
GliT (AFUA_6G09740), a member of the gliotoxin biosynthesis cluster located
on Chromosome 6 (Gardiner and Howlett, 2005), is responsible for the oxidation and
reduction of the disulphide bridge of gliotoxin. This provides a key component of the
biosynthetic process and also mediates self-protection against the harmful effects of
gliotoxin (Scharf et al., 2010; Schrettl et al., 2010). Gliotoxin belongs to the
epipolythiodioxopiperazine (ETP) class of toxins, whose toxicity is mediated by an
internal disulfide bridge (Patron et al., 2007). Identification of GliT in mycelia extracts
suggests this cluster is active and work carried out in Chapter 6 confirms the presence of
gliotoxin in culture supernatants using the conditions described here.
Zn-dependent hydrolase/oxidoreductase family protein (AFUA_3G13010),
identified here, belongs to a cluster that may putatively produce an additional ETP in
A.fumigatus (Patron et al., 2007; Perrin et al., 2007). Patron et al. (2007) identified this
second ETP cluster, which does not contain the full suite of genes found in the gliotoxin
biosynthetic cluster (Figure 3.8). Crosstalk between the ETP clusters on Chromosomes
3 and 6 could potentially be required for the production of this second ETP from A.
fumigatus. Three additional proteins were identified, that are associated with secondary
metabolite clusters on Chromosomes 3 and 4. Phosphoglycerate kinase PgkA
(AFUA_1G10350) was identified in this study and forms part of a cluster that includes
the NRPS, Pes1 (AFUA_1G10380) (Nierman et al., 2005). This NRP synthethase has
recently been linked to the production of fumigaclavine C (O’Hanlon et al., 2012), an
ergot alkaloid, and PgkA could also be involved in the biosynthetic process of this
metabolite. A putative glutathione S-transferase (AFUA_4G14380) was identified from
a cluster on Chromosome 4 with an unknown product. Lysophospholipase 3
(AFUA_3G14680) and an unknown function protein (AFUA_3G14665) were also
detected and form part of a cluster with an unidentified product.
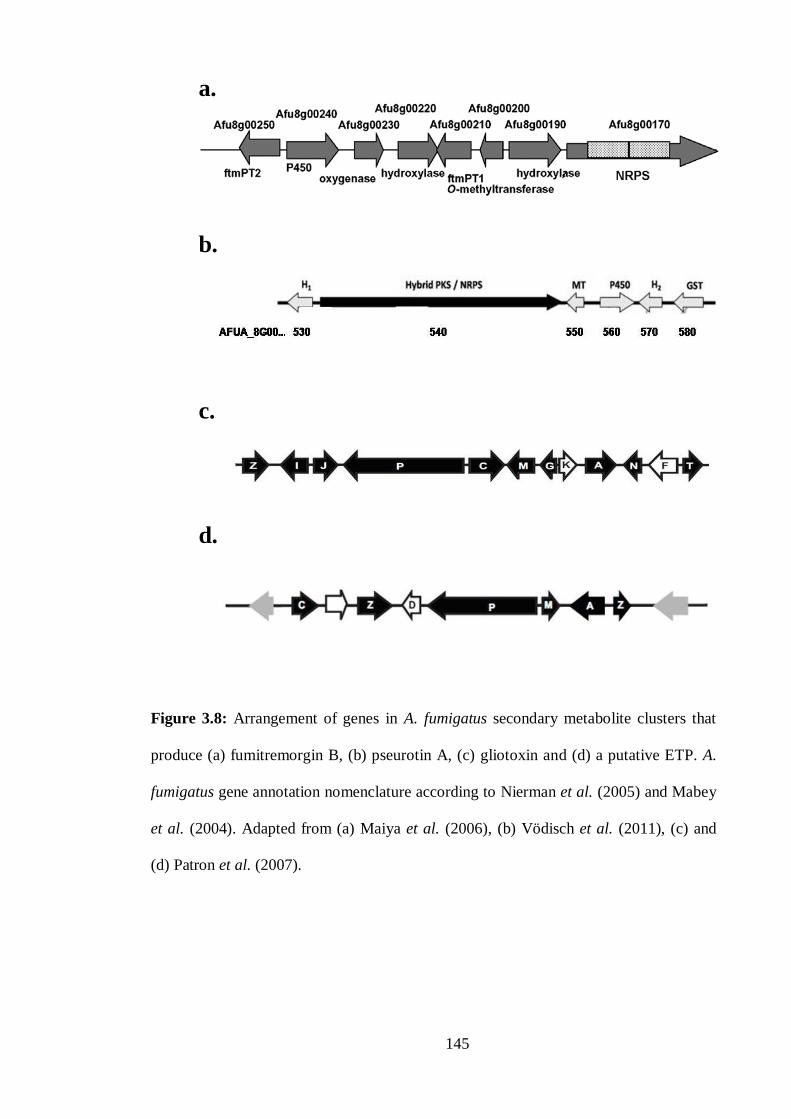
145
a.
b.
c.
d.
Figure 3.8: Arrangement of genes in A. fumigatus secondary metabolite clusters that
produce (a) fumitremorgin B, (b) pseurotin A, (c) gliotoxin and (d) a putative ETP. A.
fumigatus gene annotation nomenclature according to Nierman et al. (2005) and Mabey
et al. (2004). Adapted from (a) Maiya et al. (2006), (b) Vödisch et al. (2011), (c) and
(d) Patron et al. (2007).

146
A noteworthy observation is that expression of all of the clusters, identified here
by mass spectrometry, is either partially or fully regulated by LaeA (Perrin et al., 2007).
LaeA (AFUA_ 1G14660) is a global transcriptional regulator of secondary metabolite
clusters (Bok and Keller, 2004; Bok et al., 2005; Perrin et al., 2007) and its disruption
results in reduced virulence. McDonagh et al. (2008) identified a number of LaeA
regulated secondary metabolite genes that are induced during the initiation of murine
invasive aspergillosis, including pseurotin A and gliotoxin. This highlights the
importance of LaeA directed regulation to the success of A. fumigatus as a pathogen.
In an attempt to reduce the complexity of the A. fumigatus mycelial protein
lysates, gel filtration chromatography was performed prior to in-solution digestion of
size fractionated samples and shotgun mass spectrometry. While this pre-fractionation
approach did not yield as many proteins identifications as shotgun proteomics alone
(173 and 370 protein identifications, respectively), seventeen unique proteins were
detected that had not be observed using the shotgun mass spectrometry method alone.
The proteins identified using gel filtration coupled shotgun mass spectrometry spanned
a similar range of molecular mass and pI, demonstrating that these factors were not
limited by the addition of the pre-fractionation step. Similarly, hydrophobic proteins and
proteins with up to 12 transmembrane regions were detected signifying that these
attributes were compatible with the addition of the size exclusion step. Interestingly,
five of the unique proteins, identified using gel filtration pre-fractionation, are involved
in stress response as denoted by the FunCat classification scheme. Telomere and
ribosome associated protein, Stm1 (AFUA_3G10920), is predicted to be involved in
apoptosis-like cell death in response to oxidative stress, based on homology to the yeast
Stm1 protein (Ligr et al., 2001). The A. nidulans ortholog of the phosphotransmitter
protein, Ypd1 (AFUA_4G10280), is part a signalling pathway that regulates osmotic

147
stress response (Furukawa et al., 2005). The putative heat shock protein, Sti1
(AFUA_7g01860), was also identified and expression of this protein has been shown to
be up-regulated following amphotericin B treatment of A. fumigatus in vitro (Gautam et
al., 2008). Thioredoxin, TrxA (AFUA_5G11320), is predicted to be involved in the
oxidative stress response based on homology the A. nidulans TrxA protein (Thön et al.,
2007). Finally, a calnexin homolog, ClxA (AFUA_4G12850), is necessary for growth in
thermal, nutrient and endoplasmic reticulum stress. Identification of protein expression
from stress response pathways is valuable as these could present potential therapeutic
targets. In order, to expand the number of proteins identified using this pre-fractionation
technique a number of adjustments could be made. Possible improvements to this
methodology include the use of a number of gel filtration columns arranged in a series
for improved separation and resolution (Gordon et al., 2010), or the use of extended
gradients during liquid chromatography.
The A. fumigatus mycelial protein corona of gold nanoparticles was investigated
using SDS-PAGE coupled with LC-MS/MS. A total of 43 proteins were found to
interact strongly with the surfaces of the 30 nm colloidal gold nanoparticles (AuNPs)
(Table 3.4). This ‘affinity’ purification enabled the identification of three additional
mycelial proteins that were not detected by either shotgun proteomics alone or gel-
filtration coupled shotgun mass spectrometry. One of these unique proteins was a
mitochondrial acetolactate synthase small subunit (AFUA_4G07210) that shows
induction during hypoxia (Vödisch et al., 2011). A prohibitin (AFUA_2G09090) was
identified, that has been detected in the germ-tubes of A. fumigatus (Suh et al., 2012),
and Ctr copper transporter family protein (AFUA_2G03730) has not been detected at
the protein level previously. A note-worthy observation is that a significant majority of
proteins identified (n = 38, 88.4 %, p = 1.18e-7) were classified as having a binding

148
function or co-factor requirement according to FunCat annotation. This demonstrates a
potential method by which samples can be enriched for proteins from this functional
category. A recent review by Kniemeyer et al. (2011) has collated all of the A.
fumigatus proteomics data generated to that point and has reported that 18.5 % of all
proteins identified, with FunCat annotations, fall into the category of protein with
binding function or cofactor requirement. Taking this into account, this method could
conversely be used to reduce the dynamic range of complex lysates by the removal of
these proteins.
Several studies have been carried out to explore the A. fumigatus secretome
using a variety of growth substrates and proteomic methodologies (Gautam et al., 2008;
Singh et al., 2010a; Kumar et al., 2011; Wartenberg et al., 2011). Here, two proteomic
strategies were utilised to obtain maximum characterisation of the A. fumigatus
secretome; (i) SDS-PAGE coupled with mass spectrometry and (ii) in-solution digestion
and shotgun mass spectrometry. The former approach yielded 39 A. fumigatus protein
identifications while the latter detected 10 proteins (Table 3.5). Seven proteins were
detected using both methods described, resulting in a total of 42 A. fumigatus
extracellular proteins being identified. These proteins were analysed to determine
whether they contained a signal peptide for secretion or whether they were part of a
non-classical secretion pathway using the programs SignalP and SecretomeP
respectively (Bendtsen et al., 2005; Petersen et al., 2011). This analysis revealed that 34
of the extracellular proteins identified possessed a signal peptide while 5 were predicted
to be involved in a non-classical secretion pathway.
Functional characterisation of the extracellular proteins identified, based on
FunCat annotation, revealed a significant representation of proteins involved in C-
compound and carbohydrate metabolism (n = 19; p = 1.48 x 10⁻⁵
), as expected based on

149
its growth on glucose. Interestingly, despite growth on a minimal media with glucose
as a sole carbon and energy source, a number of enzymes involved in protein/peptide
degradation (n = 8, p = 7.5 x 10⁻⁴
) were present. Six proteins were detected, with no
FunCat, GO or KEGG functional annotations and these proteins were analysed further
to assign putative functions based on sequence homology using the BLAST2GO
program (Conesa et al., 2005). Only one of these proteins was assigned a GO annotation
following this analysis, with methyltransferase activity predicted for the GPI anchored
protein (AFUA_1G16420). With these limitations of systems-based functional
predictions, molecular and biochemical methods will need to be implemented to
elucidate the functions of these proteins and the biological processes in which they are
involved.
A number of proteins, identified in the analysis of the secretome, have not been
reported yet in the literature, including a FAD-dependent oxidase (AFUA_1G00980),
alpha-1,2-mannosidase family protein (AFUA_1G10790), a GPI anchored protein
(AFUA_1G16420), a cell wall protein (AFUA_3G01130) and a thioredoxin reductase
(AFUA_5G03540). In addition several other proteins were described at the transcript
level previously but no protein identification had been achieved until now.
Consequently, analysis of the A. fumigatus secretome has verified both the translation of
these gene products and also confirmed the localisation of the resultant proteins. This
information may aid in future studies to confirm the functions of these extracellular
proteins.
A number of proteins (n = 5) were identified from both mycelial and culture
supernatant sources including the allergen Asp f9 (AFUA_1G16190), a
phosphatidylglycerol/phosphatidylinositol transfer protein (PG/PI-TP)
(AFUA_2G11340), an endo-1,3-beta-glucanase (EglC) (AFUA_3G00270), an

150
aminopeptidase (AFUA_4G09030) and a thioredoxin reductase (AFUA_5G03540).
Aspf9, a well defined allergen, contains a signal peptide (Petersen et al., 2011) and has
been detected in culture supernatants (Singh et al., 2010a; Wartenberg et al., 2011), thus
supporting its detection in the study of secreted proteins performed here. Asp f9 is also
described as a GPI-anchored protein and is found in the cell membrane of A. fumigatus
mycelia (Bruneau et al., 2001), thus validating its identification in the mycelial fraction
of this study. While there are no literature reports on the identification of the PG/PI-TP
protein in A. fumigatus, its ortholog in Saccharomyces cerevisiae, NPC2, has been
detected in both intracellular and supernatant fractions of transfected mammalian cells
(Berger et al., 2005). The EglC protein, a β (1-6)/β (1-3) glucan branching
transglycosidase, has been identified from both A. fumigatus cell wall fraction
(Gastebois et al., 2010b) and culture supernatants (Singh et al., 2010a). The
aminopeptidase has similarly been identified in large scale proteomic studies of mycelia
proteins (Albrecht et al., 2010) and secreted proteins (Wartenberg et al., 2011).
Thioredoxin reductase (AFUA_5G03540) has not been reported in any literature to date
and so this represents the first identification of this protein in A. fumigatus. An ortholog
of thioredoxin reductase in Aspergillus niger, Sox1, has been identified in the
extracellular or membrane fraction of A. niger cultures after growth on xylose and
maltose (Lu et al., 2010). These observations from previous studies validate the
concurrent identification of proteins in both mycelia and secreted fractions and, in the
case of EglC and thioredoxin reductase, provide the first evidence of protein localisation
in A. fumigatus.
In summary, a MS-based proteomics strategy was applied to investigate the
mycelial proteome and the secretome of A. fumigatus ATCC26933. Methods to reduce
sample complexity, and subsequently allow greater proteome characterisation, were also

151
investigated. A total of 427 unique A. fumigatus proteins were identified from this
study, including 390 mycelial proteins and 42 proteins from the secretome. Many of the
proteins identified by this MS-based proteomics strategy are typically underrepresented
in 2D-PAGE studies. Bioinformatic analysis of the resultant datasets identified proteins
with extremes of molecular mass and pI, hydrophobic proteins and proteins with up to
14 transmembrane regions. Proteins of unknown function (n = 21) were also identified
and this study represents the first report of the existence of many of these proteins.
Additionally, large scale proteomic profiling of A. fumigatus mycelia revealed a number
of proteins involved in secondary metabolite clusters, providing strong evidence for the
activation of multiple clusters under the control the transcriptional regulator LaeA in the
conditions tested. Overall, the findings of this Chapter demonstrate the importance of
implementing MS-based proteomics, as an adjunct to gel based proteomics, in order to
comprehensively analyse the biosystems active in A. fumigatus. While MS-based
proteomics provides a global overview of genome-wide expression under set conditions,
gel-based proteomics retains its importance in the proteomic tool-belt due to its well-
defined compatibility with immunodetection and comparative analysis. In Chapter 4
2D-PAGE and immunoblotting will be utilised in an attempt to further characterise the
immunoproteome of A. fumigatus, while Chapter 5 will rely on comparative 2D-PAGE
analysis to discern the mechanism of action of gliotoxin relief of oxidative stress in A.
fumigatus.
CHAPTER 4
Immunoproteomic analysis
of A. fumigatus

152
4 Chapter 4
4.1 Introduction
Immunoproteomics involves the identification and characterisation of antigenic
proteins and provides valuable information on the potential involvement of these
proteins in virulence (Doyle, 2011b). Identification of antigens can be exploited for the
development of diagnostic tools, as the circulating antibodies directed against specific
antigens can be utilised as biomarkers of disease (Tjalsma et al., 2008). Identified
antigens can also be utilised for the development of vaccines directed against the
pathogen of interest (Kniemeyer, 2011). Current methodologies employed for the study
of the immunoproteome can be classified as (i) gel-based or (ii) gel-free methods
(Tjalsma et al., 2008). Gel-free methods include the use of protein microarrays, which
allow large-scale screening of immunoreactivity against semi-purified or recombinantly
produced protein (Davies et al., 2005; Tjalsma et al., 2008). The majority of fungal
immunoproteomics investigations implement gel-based methods for antigen
identification (Kniemeyer, 2011). The coupling of 2D-PAGE and immunoblotting, with
subsequent protein identification by mass spectrometry, enables the isolation, detection
and identification of antigenic proteins (Tjalsma et al., 2008; Doyle, 2011a).
2D-PAGE involves the separation of protein by pI in the first dimension,
followed by separation by relative molecular mass in the second dimension by
electrophoresis (Kniemeyer, 2011). Proteins resolved by 2D-PAGE can be transferred
electrophoretically from the polyacrylamide gel to a membrane to produce a replication
of the protein distribution pattern (Tjalsma et al., 2008). Protein transfer from the gel to
the membrane can be examined through the application of a reversible protein stain
such as Ponceau S (Krah and Jungblut, 2004). These membranes are subsequently
blocked to prevent non-specific binding of antibodies, followed by incubation with

153
purified antibodies or serum samples (Krah and Jungblut, 2004). Reactivity of
antibodies with proteins on the membrane is detected through use of a secondary
antibody conjugated to an enzyme (Figure 4.1) (Doyle, 2011a). Typical experimental
design for 2D-PAGE coupled with immunoblotting involves the separation of protein
extracts in duplicate by 2D-PAGE. Total proteins are visualised on gel 1 by staining,
using Coomassie blue or silver staining. Gel 2 is transferred to membrane reversibly
stained to obtain an image of the protein distribution pattern and subsequent
immunoblotting is carried out (Figure 4.1) (Doyle, 2011a). Using the image of the
reversibly stained blot as a reference, the immunoreactive proteins on the membrane can
be aligned against the proteins from the stained gel (Figure 4.1). Following protein
isolation, mass spectrometry can be utilised to identify the immunoreactive proteins.
Comprehensive identification and characterisation of antigenic proteins from pathogenic
organisms can aid in the development of diagnostic tools, in addition to providing
information on the mechanisms of pathogenesis (Kumar et al., 2011).
Due to the association of IA with neutropenia or immunosuppression, detection
of elevated levels of anti-Aspergillus antibodies is often not possible, contributing to the
difficulty in obtaining a diagnosis (Hope et al., 2005). Instead, detection of circulating
antigens has been investigated as a diagnostic tool for IA (Mennink-Kersten et al.,
2008). Another form of A. fumigatus related disease involves the colonisation of
cavities in the lung, formed as a result of pre-existing conditions such as tuberculosis,
resulting in a mass of hyphae termed an aspergilloma (Ma et al., 2011). Aspergillomas
occur in approximately 10 to 15 % of individuals with these pulmonary cavities and can
be detected by radiography or elevated antibody levels (Latge, 1999). Allergic
bronchopulmonary aspergillosis (ABPA) involves the colonisation of the airways by A.
fumigatus, resulting in an allergy mediated inflammatory response.

154
Figure 4.1: (a) Schematic representation of steps during gel-based immunoproteomics.
2D-PAGE involves protein separation by pI, followed by gel-based separation based on
molecular mass. Next, proteins are transferred from the gel and immobilised on a
membrane by blotting. (b) Antigenic proteins (immunome) can be detected by applying
serum to the blot, after which bound antibodies can be visualised by secondary labelled
antibodies. (c) Two gels are prepared in tandem, with total protein staining carried out
on gel 1, and immunodetection carried out on gel 2. Detected antigens on gel 2 can be
isolated from gel 1 for identification by MS. Adapted from Tjalsma et al. (2008) and
Doyle (2011a).
a.
b.
c.
155
ABPA affects mainly individuals with cystic fibrosis, and is exacerbated by the
limited ability of CF patients to clear inhaled conidia effectively from the lungs (Pihet et
al., 2009). Due to the allergic nature of this disease, an elevation of IgE directed against
A. fumigatus proteins is often associated with ABPA (Hafen et al., 2009). The three
Aspergillus-related diseases outlined involve the mycelial growth of A. fumigatus in the
body and highlight the requirement for diagnostic tools for the detection of the fungus
in this growth phase.
Following inhalation, A. fumigatus conidia encounter the mucous lining of the
lungs along with a number of enclosed pattern recognition receptors (PRRs). These
PRRs can bind to the surface of inhaled conidia and target them for phagocytosis and
killing by alveolar macrophages (Reid et al., 1997). Engulfed conidia swell inside the
phagocyte and are subsequently destroyed through the action of reactive oxygen species
(ROS) (Philippe et al., 2003). Alveolar macrophages are resident in the lung, and
primarily target conidia for phagocytosis. Conversely, neutrophils are recruited to the
site of inflammation from the extensive pulmonary vascular system and are capable of
arresting conidial growth, in addition to targeted killing of hyphae (Bonnett et al., 2006;
Feldmesser, 2006). Consequently, neutropenic individuals exhibit a high risk for
developing invasive aspergillosis (Dagenais and Keller, 2009). Activation of PRRs also
stimulates the maturation of dendritic cells, which function in antigen-presentation and
prime the T-cell immune response. Th2-type responses can be detrimental to the host as
they are related to allergy and may result in the development of asthma or allergic
bronchopulmonary aspergillosis (ABPA). Helper T-cell activation of relevant B-cells,
following antigen detection, results in the production of antibodies directed against A.
fumigatus proteins. While these antibodies may not confer resistance to A. fumigatus,

156
their detection at elevated levels may be indicative of diseases such as aspergilloma and
ABPA (Tillie-Leblond and Tonnel, 2005; Zmeili and Soubani, 2007).
Prior to the availability of the genomic sequence of A. fumigatus (Nierman et al.,
2005), numerous immunoproteomic studies had been carried out without definitive
protein identification (Latge, 1999). Recent characterisation of the antigenic proteome
of A. fumigatus has predominantly been achieved through a combination of 2D-PAGE,
immunodetection and subsequent protein identification by mass spectrometry. Many
studies have focused on the identification of A. fumigatus allergens based on the
presence of reactive IgE in sera from patients with an allergy-based disease (Gautam et
al., 2007; Singh et al., 2010a, 2010b). Others have expanded on this to incorporate
identification of IgG reactive proteins from A. fumigatus, in addition to other antibody
isoforms (IgA and IgM). This was achieved through immunoblotting with sera from
both patients and animal models of A. fumigatus infection (Asif et al., 2010; Singh et
al., 2010a, 2010b; Kumar et al., 2011; Shi et al., 2012a). Another distinguishing factor
between various immunoproteomic studies is the cellular localisation of antigens,
namely whether they are present intracellularly or extracellularly, and the
developmental stage they are associated with (i.e. conidia or mycelia). The secretome of
A. fumigatus presented an attractive target for many immunoproteomic studies, as these
extracellular proteins were considered to come into direct contact with the host during
pathogenesis (Kumar et al., 2011). Investigation of culture filtrates has not only
identified antigenic proteins but has also greatly contributed to the characterisation of
the A. fumigatus secretome (Gautam et al., 2007; Singh et al., 2010a; Kumar et al.,
2011; Shi et al., 2012a). The identification of antigens localised in germinating conidia
has also been undertaken, with the identification of 66 proteins by immunoreactivity
with pooled ABPA patients’ sera (Singh et al., 2010b) and 59 proteins displaying

157
reactivity with rabbit sera following invasive aspergillosis (Asif et al., 2010). While all
of these studies have utilised sera from sources with high anti-Aspergillus antibody
titres, normal sera from healthy individuals also represents a source of these antibodies.
Kurup et al. (2006) noted that sera from normal control subjects exhibited specific IgG1
reactivity to crude extracts of A. fumigatus proteins and a number of controls showed
strong IgA2 reactivity. Additionally, Schrettl et al. (2010) noted the widespread
presence of antibodies from normal sera, directed against the gliotoxin oxidoreductase
GliT, and exploited this observation for the purification of anti-GliT antibodies using
recombinant the antigen.
With the aim of expanding the characterisation of the immunoproteome of A.
fumigatus, an investigation was carried out to identify proteins reactive with normal
human sera. This was carried out using the 2D-PAGE, coupled with mass spectrometric
identification of immunoreactive proteins from the mycelia of this opportunistic
pathogen. A total of 25 unique proteins were identified, including 13 proteins which had
previously not been characterised as antigenic. This novel approach, utilising (i)
mycelia instead of conidia or secreted proteins, and (ii) sera from healthy donors in
place of disease state sera, has demonstrated expansion of the currently described
compilation of A. fumigatus antigens. The findings described in this Chapter may be
relevant for advancing diagnostic tools or provide further elucidation of the mechanisms
of disease.

158
4.2 Results
4.2.1 Detection of immunoreactivity to A. fumigatus mycelia proteins in normal
human sera
Mycelia were harvested from A. fumigatus ATCC26933 shaking cultures in
AMM after 48 h and proteins were extracted as outlined in Section 2.2.2.1. Protein
extracts were separated using SDS-PAGE and gels were transferred to NCP (Section
2.2.4.5). Following transfer, NCP was cut vertically into strips which were then probed
with pools of normal human sera (n = 135 serum samples, n = 29 serum pools; 5 serum
samples/pool). Immunoreactivity directed against A. fumigatus proteins was detected
using an anti-human IgG - HRP conjugate with a chromogenic substrate, DAB (Section
2.2.4.7). A section of the gel was stained with Coomassie blue as a reference (Figure
4.2).
Immunoreactivity against A. fumigatus mycelia proteins was observed in 93 %
of sera pools tested (n = 27 pools). Sera pools displayed differential intensities and
patterns of immunoreactivity, with high immunoreactivity observed from pools shown
in lanes 6, 7 and 11 (Figure 4.2). Low immunoreactivity was observed in other samples,
including sera pools in lanes 12 and 13 (Figure 4.2). Further separation of A. fumigatus
mycelia proteins, using 2D-PAGE and subsequent Western blot analysis, was required
in order to accurately isolate and identify the immunoreactive proteins. Serum pools 6, 7
and 11, identified with high relative immunoreactivity, were combined and
subsequently used to probe 2D-PAGE immunoblots.

159
Figure 4.2: Screen of immunoreactivity of normal human sera samples against A.
fumigatus mycelia proteins. SDS-PAGE of A. fumigatus ATCC26933 stained with
Coomassie Blue (Lane 1) and transferred to NCP for western blot analysis (Lanes 2-13).
NCP strips were probed with pools of normal human sera and immunoreactivity was
detected using an anti-human IgG - HRP conjugate and DAB as a substrate. Differential
levels of reactivity were observed, with high reactivity evident in lanes 6, 7 and 11, and
low reactivity in lanes 12 and 13.

160
4.2.2 2D-PAGE of A. fumigatus ATCC26933 and Western Blot analysis using
normal human sera
A. fumigatus ATCC26933 was grown in AMM for 48 h and protein was
extracted from mycelia as described in Section 2.2.2.2. Protein lysates were
TCA/acetone precipitated and resuspended in IEF buffer (Section 2.1.6.2) and
quantitated (Section 2.2.4.1). Protein (300 µg) was separated by pI on pH 3 - 11 strips
(Section 2.2.4.3) and subsequently by molecular mass by SDS-PAGE on 12 % gels.
Proteins were transferred to NCP (Section 2.2.4.6) and protein transfer was visualised
by Ponceau S staining. Western blot analysis was carried out using pools 6, 7 and 11 of
normal human sera, identified in Section 4.2.1 as displaying immunoreactivity to A.
fumigatus mycelia proteins. IgG reactivity to A. fumigatus proteins was detected as in
Section 4.2.1. Additional reference gels were prepared simultaneously and were stained
with Colloidal Coomassie (Section 2.2.4.4) in order to visualise total proteins and for
use in the identification of proteins by mass spectrometry. Images of Colloidal
Coomassie stained gels, Ponceau S stained and DAB developed blots were aligned
using Progenesis™ SameSpot Software (Nonlinear Dynamics Ltd, UK) (Figure 4.3).
Following image alignments, 10 protein spots were detected that could be
matched to distinct spots on the immunoblots. These spots were excised from the gels
and subjected to in-gel trypsin digestion (Section 2.2.6.1) followed by LC-MS/MS
analysis (Section 2.2.6.3).

161
Colloidal Coomassie stained 2D-PAGE gel
of A. fumigatus mycelial proteins
a.

162
b.
Ponceau S stained 2D-PAGE blot
of A. fumigatus mycelial proteins

163
Figure 4.3: Immunoblot analysis for the detection of A. fumigatus ATCC26933 proteins
reactive with IgG in normal human sera. 2D-PAGE was carried out to separate mycelia
proteins (300 µg) by pI in the pH range 3 – 11 and molecular mass using 12 % gels. (a)
Colloidal Coomassie staining was used to visualise total proteins on gels. (b) Gels were
transferred to NCP and Ponceau S staining was carried out. (c) Blots probed with
normal human sera displayed some immunoreactivity when developed with DAB.
Images were aligned using Progenesis™ SameSpot software and locations of
immunoreactive spots are numbered on all images.
c.
2D-PAGE immunoblot blot of A. fumigatus
mycelial proteins probed with antisera

164
4.2.3 Mass spectrometry analysis of immunoreactive proteins
From the excised spots (n = 10), 7 distinct proteins were identified by LC-
MS/MS (Table 4.1). The highest reactivity was observed from spot number 9 (Figure
4.3), identified as a carboxypeptidase S1 (AFUA_8G04120). A translation elongation
factor EF-1 alpha subunit (AFUA_1G06390; Spot 1) also exhibited relatively high
immunoreactivity.
A number of the identified proteins were observed in more than one spot,
exhibiting different pI or molecular mass. This suggests the occurrence of post-
translational modifications (PTMs) or protein degradation. A cobalamin-independent
methionine synthase MetH/D (AFUA_4G07360; Spots 4 and 5) was detected in two
individual spots with apparently differing pIs. Alpha-ketoglutarate dehydrogenase
complex subunit Kgd1 (AFUA_4G11650; Spots 6, 7 and 8) was detected independently
in three individual spots (Figure 4.3, Table 4.1). Again these spots displayed different
apparent pIs but the same molecular mass, as deduced by their position on the gel. This
is indicative of differential post-translational modification of these proteins.
In order to enhance the detection of immunoreactivity to A. fumigatus mycelial
proteins, the amount of protein separated by 2D-PAGE was increased from 300 µg to
400 µg. The results obtained from this optimised protocol are described in Sections
4.2.4 and 4.2.5.

165
Table 4.1: A. fumigatus mycelia proteins, immunoreactive with normal human sera, identified by 2D-PAGE and LC-MS/MS.
Spot No CADRE ID.
(AFUA_)
Protein name tpI tMr Coverage
(%)
Unique
peptides
MASCOT
Score
1 1G06390 Translation elongation factor EF-1 alpha subunit 9.12 50019.60 16 7 282
2 4G10410 Aspartate aminotransferase 8.94 47892.64 31 12 669
3 6G02470 Fumarate hydratase 9.1 63159.39 28 12 615
4 4G07360 Cobalamin-independent methionine synthase MetH/D 6.33 86894.57 49 33 1444
5 4G07360 Cobalamin-independent methionine synthase MetH/D 6.33 86894.57 29 18 842
6 4G11650 Alpha-ketoglutarate dehydrogenase complex subunit Kgd1, putative 6.47 118900.00 9 7 307
7 4G11650 Alpha-ketoglutarate dehydrogenase complex subunit Kgd1, putative 6.47 118900.00 7 5 230
8 4G11650 Alpha-ketoglutarate dehydrogenase complex subunit Kgd1, putative 6.47 118900.00 4 3 100
9 8G04120 Carboxypeptidase S1 5.4 67672.79 23 8 381
10 5G04170 Molecular chaperone and allergen Mod-E/Hsp90/Hsp1 4.95 80639.96 15 8 320
CADRE ID., A. fumigatus gene annotation nomenclature according to Nierman et al. ( 2005) and Mabey et al. (2004); tpI, theoretical isoelectric point;
tMr, theoretical molecular mass; MASCOT scores > 58 indicate identity or extensive homology (p < 0.05); Spot No. from Figure 4.3.

166
4.2.4 Optimised 2D-PAGE of A. fumigatus ATCC26933 and Western Blot
analysis using normal human sera
A. fumigatus ATCC26933 mycelial protein lysates were prepared as in Section
4.2.2, with the exception of higher protein loading to enhance visualisation of
immunoreactivity. Protein lysates in IEF buffer (400 µg) was separated initially on pH 3
- 11 strips (Section 2.2.4.3) and subsequently by SDS-PAGE on 12 % gels. Proteins
were transferred to NCP (Section 2.2.4.6) and protein transfer was visualised by
Ponceau S staining. Western blot analysis was carried out using pools 6, 7 and 11 of
normal human sera, identified in Section 4.2.1 as displaying immunoreactivity to A.
fumigatus mycelia proteins. IgG reactivity to A. fumigatus proteins was detected as in
Section 4.2.1. Additional reference gels were prepared simultaneously and were stained
with Colloidal Coomassie (Section 2.2.4.4) in order to visualise total proteins and for
use in the identification of proteins by mass spectrometry. Images of Colloidal
Coomassie stained gels, Ponceau S stained and DAB developed blots were aligned
using Progenesis™ SameSpot Software (Nonlinear Dynamics Ltd, UK) (Figure 4.4).
Following image alignments, 28 protein spots were detected that could be
matched to distinct spots on the immunoblots. Strong immunoreactivity was evident in
the acidic region of the blot and appeared to be clustered near the top of the gel,
indicating high molecular mass proteins. Enhanced levels of immunoreactivity were
observed following optimisation of the method described in Section 4.2.2. The spots
were excised from the gels and subjected to in-gel trypsin digestion (Section 2.2.6.1)
followed by LC-MS/MS analysis (Section 2.2.6.3).
167
Colloidal Coomassie stained 2D-PAGE gel
of A. fumigatus mycelial proteins
a.

168
b.
Ponceau S stained 2D-PAGE blot
of A. fumigatus mycelial proteins

169
Figure 4.4: Optimised immunoblot analysis for the detection of A. fumigatus
ATCC26933 proteins reactive with IgG in normal human sera. 2D-PAGE was carried
out to separate mycelia proteins (400 µg) by pI in the pH range 3 – 11 and molecular
mass using 12 % gels. (a) Colloidal Coomassie staining was used to visualise total
proteins on gels. (b) Gels were transferred to NCP and Ponceau S staining was carried
out. (c) Blots probed with normal human sera displayed some immunoreactivity when
developed with DAB. Images were aligned using Progenesis™ SameSpot software and
locations of immunoreactive spots are numbered on all images.
c.
2D-PAGE immunoblot blot of A. fumigatus
mycelial proteins probed with antisera

170
4.2.5 Mass spectrometry analysis of immunoreactive proteins
From the excised spots (n = 28), 24 distinct proteins were identified by LC-
MS/MS (Table 4.2). The highest reactivity was observed from spot number 10 (Figure
4.3), identified as a carboxypeptidase S1 (AFUA_8G04120). An aminopeptidase
(AFUA_2G00220; Spot 14), a 1, 3-β- glucosyltransferase (AFUA_2G05340; Spot 11),
a fumarate hydratase (AFUA_6G02470; Spots 24 and 25) and an aspartate
aminotransferase (AFUA_4G10410; Spot 22) also displayed relatively high
immunoreactivity (Figure 4.4).
A number of the identified proteins were observed in more than one spot,
exhibiting different pI or molecular mass. This suggests the occurrence of post-
translational modifications or protein degradation. A woronin body protein HexA
(AFUA_5G08830; Spots 17, 26 and 27), a fumarate hydratase (AFUA_6G02470; Spots
24 and 25) and a translation elongation factor EF-1 alpha subunit (AFUA_1G06390;
Spots 19 and 21) were all detected in more than one spot (Figure 4.4, Table 4.2).
With the exception of the molecular chaperone and allergen Mod-E/Hsp90/Hsp1
(AFUA_5G04170; Spot 10; Figure 4.3), all of the antigens identified in Section 4.2.3,
were also identified following optimisation of immunoprotein detection strategy. This
demonstrates the improvement of the protocol used, with the identification of an
additional 18 IgG-reactive proteins following method optimisation.

171
Table 4.2: A. fumigatus mycelia proteins, immunoreactive with normal human sera, identified following optimised 2D-PAGE and LC-MS/MS.
Spot No CADRE ID.
(AFUA_)
Protein name tpI tMr Coverage
(%)
Unique
peptides
MASCOT
Score
1
1 4G11650 Alpha-ketoglutarate dehydrogenase complex subunit Kgd1, putative 6.47 118900.00 9 7 307
2 6G12930 Mitochondrial aconitate hydratase 6.26 85529.08 38 23 974
31 4G07360 Cobalamin-independent methionine synthase MetH/D 6.33 86894.57 32 21 1050
4 6G10990 NADPH cytochrome P450 reductase (CprA) 5.38 76782.85 11 6 296
5 8G00440 Steroid monooxygenase 5.48 101032.20 22 16 767
6 3G14680 Lysophospholipase Plb3 5.39 67416.54 27 16 824
7 1G12610 Hsp70 chaperone Hsp88 5.08 80044.81 20 13 477
8 4G08720 Lysophospholipase Plb1 4.59 68143.67 7 5 205
9 5G07330 Carboxypeptidase S1 4.74 68345.84 15 6 269
10
1 8G04120 Carboxypeptidase S1 5.4 67672.79 24 8 371
11 2G05340 1,3-β-glucanosyltransferase Gel4 4.83 58872.59 6 2 100
12 1G07440 Molecular chaperone Hsp70 5.08 69660.29 44 19 758
13 4G06820 GPI-anchored cell wall organization protein Ecm33 4.8 41505.47 8 3 102
14 2G00220 Aminopeptidase 4.99 56702.95 7 2 91

172
Spot No CADRE ID.
(AFUA_)
Protein name tpI tMr Coverage
(%)
Unique
peptides
MASCOT
Score
15 2G05910 Hexokinase Kxk 5.06 54209.22 16 4 300
16 5G10550 ATP synthase F1, beta subunit 5.3 55620.38 62 21 1117
17 5G08830 Woronin body protein HexA 6.56 49836.57 24 11 471
18 4G06910 Outer mitochondrial membrane protein porin 9.47 36893.97 60 17 812
191 1G06390 Translation elongation factor EF-1 alpha subunit 9.12 50019.60 13 5 185
20 6G06370 NAD(+)-isocitrate dehydrogenase subunit I 8.42 49745.35 12 5 212
21
1 1G06390 Translation elongation factor EF-1 alpha subunit 9.12 50019.60 17 5 267
22
1 4G10410 Aspartate aminotransferase 8.94 47892.64 29 13 642
23 1G10350 Phosphoglycerate kinase PgkA 6.31 44761.47 60 22 867
24
1 6G02470 Fumarate hydratase 9.1 63159.39 25 14 596
25
1 6G02470 Fumarate hydratase 9.1 63159.39 4 3 102
26 5G08830 Woronin body protein HexA 6.56 49836.57 17 7 226
27 5G08830 Woronin body protein HexA 6.56 49836.57 31 12 512
28 2G03610 IMP dehydrogenase 6.25 57958.52 13 7 291

173
CADRE ID., A. fumigatus gene annotation nomenclature according to Nierman et al. ( 2005) and Mabey et al. (2004); tpI, theoretical isoelectric point;
tMr, theoretical molecular mass; MASCOT scores > 58 indicate identity or extensive homology (p < 0.05); Spot No. from Figure 4.4; 1Protein also
detected in Section 4.2.3, prior to method optimisation.

174
4.2.6 Putative location of immunogenic region on HexA protein
The woronin body protein HexA (AFUA_5G08830), identified in Section 4.2.5
was detected at three independent locations on the immunoblot, based on its reactivity
with IgG in normal human sera. These locations indicated proteins of differing pI and
molecular mass (Figure 4.4; Spot numbers 17, 26, 27). This protein has a theoretical
molecular mass of 50 kDa and this correlates well with its identification from spots 26
and 27. However, spot number 17 represents a protein with a much lower molecular
mass, indicated by its position at the bottom of the gel.
Examination of the sequence coverage, obtained from LC-MS/MS analysis of
each of the independent protein spots, revealed that the peptides identified from the
proteins in spots 26 and 27 are distributed throughout the entire sequence of the HexA
protein (Figure 4.5). In contrast, the peptides identified from the protein in spot number
17 are localised exclusively in the C-terminus of the protein. (Figure 4.5) This
observation, coupled with its position on the gel, indicate that the protein found in spot
number 17 is a cleavage or breakdown product of the HexA protein. This low molecular
mass C-terminal region of the HexA protein (Spot 17) displays a reduced level of
immunoreactivity compared to that observed from the higher molecular mass HexA
proteins (Spots 26 and 27). The reduction in immunoreactivity to the C-terminus
section of the HexA protein (Spot 17) subsequently indicates the immunogenic epitope
is predominantly located on the N-terminal region of this protein.

175
Figure 4.5: Identification of the woronin body protein HexA in three independent spots
and distribution of peptides detected from each. Peptides identified following trypsin
digestion and LC-MS/MS analysis of each protein spot are shown in red. Peptides
detected from spot 17 correspond exclusively to the C-terminal of the HexA protein.
Spot 26
1 MYSVESKFERDSRRDAQRTANLDFDARVPIPFSVFPSSYRSDAVPETTLT
51 RVEGEVNLDRTSHVEREDTRTSAPLPDPRVYGREEVDIHISKDRLHAPSR
101 KGDDFQVIYEDRAHKDSRVPEVELSRERWKRSENNAKQNKNKNNTSTRRS
151 GDVLKAVSAKKVAPQAQTRADEKASYQLTQKARYRESTSRYEPLPPKPVY
201 DQALESQLDITEREYRRRTDPTYDVNLSYGRHQAPVDSYQAYQPQQTSDV
251 SLHRSKTEIDVSYDKAYTPKPLETRKGDSFSRSELTVESVPSRPSSASSI
301 SQVKVLKPYTAIDQPPARKMGYYDDDGNYHSFRRGVERAVDRITHPFHHH
351 HHHHDREEVVIADERGPVRYRDGVREDVRIVEPRASKTTAESVPIPCHFI
401 RIGDILILQGRPCQVIRISVSPQTGQHRYLGVDLFTRQLQEESSFVSNPS
451 PSVVVQTMLGPVYKTYRILDLHEDGTITAMTETGDVKQALPVVTQGQLFR
501 KIRDAFSEGRGSVRALVINDGGRELVVDYKVIHGSRL
Spot 27
1 MYSVESKFERDSRRDAQRTANLDFDARVPIPFSVFPSSYRSDAVPETTLT
51 RVEGEVNLDRTSHVEREDTRTSAPLPDPRVYGREEVDIHISKDRLHAPSR
101 KGDDFQVIYEDRAHKDSRVPEVELSRERWKRSENNAKQNKNKNNTSTRRS
151 GDVLKAVSAKKVAPQAQTRADEKASYQLTQKARYRESTSRYEPLPPKPVY
201 DQALESQLDITEREYRRRTDPTYDVNLSYGRHQAPVDSYQAYQPQQTSDV
251 SLHRSKTEIDVSYDKAYTPKPLETRKGDSFSRSELTVESVPSRPSSASSI
301 SQVKVLKPYTAIDQPPARKMGYYDDDGNYHSFRRGVERAVDRITHPFHHH
351 HHHHDREEVVIADERGPVRYRDGVREDVRIVEPRASKTTAESVPIPCHFI
401 RIGDILILQGRPCQVIRISVSPQTGQHRYLGVDLFTRQLQEESSFVSNPS
451 PSVVVQTMLGPVYKTYRILDLHEDGTITAMTETGDVKQALPVVTQGQLFR
501 KIRDAFSEGRGSVRALVINDGGRELVVDYKVIHGSRL
Spot 17
1 MYSVESKFERDSRRDAQRTANLDFDARVPIPFSVFPSSYRSDAVPETTLT
51 RVEGEVNLDRTSHVEREDTRTSAPLPDPRVYGREEVDIHISKDRLHAPSR
101 KGDDFQVIYEDRAHKDSRVPEVELSRERWKRSENNAKQNKNKNNTSTRRS
151 GDVLKAVSAKKVAPQAQTRADEKASYQLTQKARYRESTSRYEPLPPKPVY
201 DQALESQLDITEREYRRRTDPTYDVNLSYGRHQAPVDSYQAYQPQQTSDV
251 SLHRSKTEIDVSYDKAYTPKPLETRKGDSFSRSELTVESVPSRPSSASSI
300 SQVKVLKPYTAIDQPPARKMGYYDDDGNYHSFRRGVERAVDRITHPFHHH
351 HHHHDREEVVIADERGPVRYRDGVREDVRIVEPRASKTTAESVPIPCHFI
401 RIGDILILQGRPCQVIRISVSPQTGQHRYLGVDLFTRQLQEESSFVSNPS
451 PSVVVQTMLGPVYKTYRILDLHEDGTITAMTETGDVKQALPVVTQGQLFR
501 KIRDAFSEGRGSVRALVINDGGRELVVDYKVIHGSRL

176
4.3 Discussion
Immunoreactivity of proteins from mycelial lysates of A. fumigatus
ATCC26933, with sera from healthy individuals, was investigated using SDS-PAGE
and Western blot analysis. Positive reactivity was observed against 93 % of pooled sera
samples tested (Figure 4.2), which reflects the constant exposure to environmental
strains of A. fumigatus. Indeed, previous in-house studies investigating the antigenicity
of recombinantly produced A. fumigatus proteins from the gliotoxin biosynthesis cluster
noted a similarly high amount of healthy individuals that were seropositive for IgG
directed against the respective antigens. Through ELISA screening, 63 % (n = 93)
exhibited immunoreactivity against recombinantly produced GliG (AFUA_6G09690)
(Prof. Sean Doyle, personal communication). The gliotoxin oxidoreductase, GliT, also
demonstrated extensive immunoreactivity with normal serum samples and this was
utilised for the purification of anti-GliT antibodies (Schrettl et al., 2010). While this
immunoreactivity would be relatively low compared to sera from patients with A.
fumigatus-related infections (e.g. ABPA or aspergillosis), this nevertheless provides a
way to expand the characterisation of A. fumigatus antigens. Differential levels of
reactivity were observed between sera pools, and those displaying the highest
immunoreactivity were used to identify IgG reactive A. fumigatus antigens. The method
utilised in Section 4.2.1 describes an efficient way by which to screen large numbers of
serum samples for the presence of immunoreactivity, for subsequent use in targeted
immunoproteomics studies.
2D-PAGE was used to resolve the mycelial proteins, and subsequently, identify
immunoreactive proteins with confidence. This initially yielded the identification of 7
unique IgG-reactive A. fumigatus proteins from 10 individual spots (Table 4.1).
Subsequently, optimisation of the protocol was carried out in order to improve the

177
detection of immunoreactive A. fumigatus mycelial proteins. By increasing the amount
of protein separated by 2D-PAGE from 300 µg (Section 4.2.2) to 400 µg (Section
4.2.4), a total of 24 unique proteins were identified from 28 individual protein spots
displaying IgG-reactivity by Western blot analysis (Table 4.2). A substantial majority of
the antigenic proteins detected in Section 4.2.2 (n = 6/7; 85.7 %), were also identified
following optimisation of the immunodetection strategy (Section 4.2.4) demonstrating
validation of the results through reproducibility. The molecular chaperone and allergen
Mod-E/Hsp90/Hsp1 (AFUA_5G04170; Spot 10; Figure 4.3), was not detected
following protocol optimisation and this may be accounted for by the substantial
increase in the intensity of immunoreactivity observed from the carboxypeptidase S1
(AFUA_8G04120; Spot 10; Figure 4.4). This high level of immunoreactivity may have
masked the detection of the molecular chaperone and allergen Mod-E/Hsp90/Hsp1,
located adjacent to it (Figure 4.6). The optimisation of the immunodetection protocol
resulted in the identification of an additional 18 IgG-reactive A. fumigatus proteins
(Table 4.2), demonstrating a substantial improvement in the efficacy of the method,
without significant loss in sensitivity. Collectively, this strategy resulted in the
identification of 25 A. fumigatus proteins reactive with IgG from healthy individuals.

178
Figure 4.6: Increase in intensity of immunoreactivity following optimisation of immunodetection
strategy. Carboxypeptidase S1 (X) masks the detection of the molecular chaperone and allergen
Mod-E/Hsp90/Hsp1 (Y) following an increase in the amount of protein separated by 2D-PAGE,
from (a) 300 µg to (b) 400 µg.

179
A number of proteins were detected that exhibited relatively high
immunoreactivity with sera from healthy subjects. These proteins included a
carboxypeptidase S1 (AFUA_8G04120), an aminopeptidase (AFUA_2G00220), a 1,3-
β-glucosyltransferase (AFUA_2G05340), a fumarate hydratase (AFUA_6G02470) and
an aspartate aminotransferase (AFUA_4G10410) (Figure 4.4). Several proteins were
identified from multiple spots; woronin body protein HexA (AFUA_5G08830; Spots
17, 26 and 27; Figure 4.4) was identified from three individual spots, differing in both
pI and molecular mass. HexA, identified from Spot 17, was positioned at the bottom of
the gel, indicating a protein with a lower molecular mass than predicted and may be the
result of protein degradation. Presence of multiple isoforms of the HexA protein has
been demonstrated previously, with its identification from 12 individual spots in the
mitochondrial proteome map of A. fumigatus (Vödisch et al., 2009). This observation
was confirmed by the detection of peptides exclusively from the C-terminal section of
the HexA protein by LC-MS/MS (Figure 4.5) and further discussion of this protein will
be undertaken later in the Chapter. Translation elongation factor EF-1 alpha subunit
(AFUA_1G06390; Spots 19 and 21; Figure 4.4) was identified from two spots with
apparent differing molecular masses. Fumarate hydratase (AFUA_6G02470; Spots 24
and 25; Figure 4.4) was identified from two spots which appeared to have the same
molecular mass but differed slightly in pI¸ based on their positions side-by-side on the
gel (Figure 4.4). This occurrence was also observed for cobalamin-independent
methionine synthase MetH/D (AFUA_4G07360; Spots 4 and 5; Figure 4.3) and alpha-
ketoglutarate dehydrogenase complex subunit, Kgd1 (AFUA_4G11650; Spots 6, 7 and
8; Figure 4.3). This indicates the presence of isoforms of these proteins, possibly as a
result of post-translational modifications. Additionally, the detection of
immunoreactivity against multiple protein isoforms provides validation of the results
obtained, as it demonstrates binding of IgG to antigenic proteins is specific.

180
Thirteen proteins were identified, which had not been previously detected in A.
fumigatus as antigens, representing a significant expansion of the currently established
immunoproteome (Table 4.3). Among these, a hexokinase Kxk was identified,
displaying 54 % sequence identity with the Candida albicans hexokinase Hxk2p
(BLAST E-value = 0.0). An outer mitochondrial membrane protein porin
(AFUA_4G06910) was also detected, with 42 % sequence identity to the outer
membrane mitochondrial porin Por1p from C. albicans (BLAST E-value = 2 x 10-78
).
These C. albicans proteins demonstrated IgG-reactivity following incubation of protein
lysates with sera from patients with systemic candidiasis (Pitarch et al., 2004).
Immunoreactivity of these A. fumigatus orthologs demonstrates the antigenicity of these
proteins and thus validates their identification as part of the immunoproteome. The
remaining immunoreactive proteins identified here, have previously been characterised
as antigenic and/or allergenic in A. fumigatus, based on their IgG or IgE reactivity
respectively. Immunoproteomic studies carried out on A. fumigatus germlings and
secretome have identified eleven of the antigens described here. Two
lysophospholipases, Plb1 (AFUA_4G08720) and Plb3 (AFUA_2G03610), were
identified, that have also been detected in the immunosecretome of A. fumigatus by
Singh et al. (2010a). These proteins contain a signal peptide for secretion (Petersen et
al., 2011) and are involved in the degradation of phospholipids making them an
important virulence factor (Abad et al., 2010). The well characterised allergens,
molecular chaperone and allergen Mod-E/Hsp90/Hsp1 (AFUA_5G04170), molecular
chaperone Hsp70 (AFUA_1G07440), Hsp70 chaperone, Hsp88 (AFUA_1G12610)
were identified, which have previously been detected in germlings based on their IgE
reactivity (Singh et al., 2010b). IgG-reactivity has previously been shown against
inosine 5’-monophosphate (IMP) dehydrogenase (AFUA_2G03610), aspartate
aminotransferase (AFUA_4G10410) and fumarate hydratase (AFUA_6G02470), using

181
sera from A. fumigatus immunised rabbits (Asif et al., 2010). Phosphoglycerate kinase
PgkA (AFUA_1G10350), cobalamin-independent methionine synthase MetH
(AFUA_4G07360), ATP synthase F1 beta subunit (AFUA_5G10550) and
mitochondrial aconitate hydratase (AFUA_6G12930) have been shown previously to
exhibit IgG and IgE reactivity (Asif et al., 2010; Singh et al., 2010b). Detection of these
previously characterised immunogens provides validation of the experimental process,
despite the use on non-disease state sera.

182
Table 4.3: IgG-reactive proteins (n = 13) identified in this study, previously not classified as antigenic in A. fumigatus
Spot No CADRE ID. Protein name tpI tMr Intensity of immunoreactivity1
(AFUA_) L M H
1 4G11650 Alpha-ketoglutarate dehydrogenase complex subunit Kgd1 6.47 118900.00
4 6G10990 NADPH cytochrome P450 reductase (CprA) 5.38 76782.85
5 8G00440 Steroid monooxygenase 5.48 101032.20
9 5G07330 Carboxypeptidase S1 4.74 68345.84
10 8G04120 Carboxypeptidase S1 5.4 67672.79
11 2G05340 1,3-β-glucanosyltransferase Gel4 4.83 58872.59
13 4G06820 GPI-anchored cell wall organization protein Ecm33 4.8 41505.47
14 2G00220 Aminopeptidase 4.99 56702.95
15 2G05910 Hexokinase Kxk 5.06 54209.22
17 5G08830 Woronin body protein HexA 6.56 49836.57
18 4G06910 Outer mitochondrial membrane protein porin 9.47 36893.97
19 1G06390 Translation elongation factor EF-1 alpha subunit 9.12 50019.60
20 6G06370 NAD(+)-isocitrate dehydrogenase subunit I 8.42 49745.35
21 1G06390 Translation elongation factor EF-1 alpha subunit 9.12 50019.60

183
Spot No CADRE ID. Protein name tpI tMr Intensity of immunoreactivity1
(AFUA_) L M H
26 5G08830 Woronin body protein HexA 6.56 49836.57
27 5G08830 Woronin body protein HexA 6.56 49836.57
CADRE ID., A. fumigatus gene annotation nomenclature according to Nierman et al. ( 2005) and Mabey et al. (2004); tpI, theoretical isoelectric point;
tMr, theoretical molecular mass; Spot No. from Figure 4.4; 1Iintensity of immunoreactivity on immunoblot relative to intensity of the corresponding
spot on the Coomassie stained 2D-PAGE gel; L, low relative intensity; M, medium relative intensity; H, high relative intensity (Section 2.2.4.8).

184
In addition to identification in the mycelia, many of the IgG-reactive proteins
identified here have also exhibited differential developmental or cellular localisation.
The conidia proteome map of Teutschbein et al. (2010) identified five of these antigens
as being enriched or abundant in the conidia of A. fumigatus; Hsp70 chaperone Hsp88
(AFUA_1G12610), translation elongation factor EF-1 alpha subunit (AFUA_1G06390),
molecular chaperone Hsp70 (AFUA_1G07440), phosphoglycerate kinase PgkA
(AFUA_10350) and mitochondrial aconitate hydratase (AFUA_6G12930).
Additionally, an outer mitochondrial membrane protein porin (AFUA_4G06910),
alpha-ketoglutarate dehydrogenase complex subunit Kgd1 (AFUA_4G11650), woronin
body protein HexA (AFUA_5G08830), molecular chaperone and allergen Mod-
E/Hsp90/Hsp1(AFUA_5G04170) and NAD(+)-isocitrate dehydrogenase subunit I
(AFUA_6G06370) were found in the early development proteome of A. fumigatus
germlings (Cagas et al., 2011b; Suh et al., 2012). Two glycosylphosphatidylinositol
(GPI)-anchored proteins were detected, 1,3-β-glucanosyltransferase Gel4
(AFUA_2G05340) and GPI-anchored cell wall organization protein Ecm33
(AFUA_4G06820), with locations on the plasma membrane (Bruneau et al., 2001), are
involved in assembly of the cell wall (Chabane et al., 2006; Gastebois et al., 2010a).
Proteins with signal peptides for secretion included an aminopeptidase
(AFUA_2G00220), two separate carboxypeptidases (AFUA_5G07330,
AFUA_8G04120) and NADPH cytochrome P450 reductase CprA (AFUA_6G10990)
(Petersen et al., 2011). The majority of the remaining proteins were detected in
germinating conidia or the secretome based on their immunoreactivity as discussed
earlier (Asif et al., 2010; Singh et al., 2010a, 2010b). The occurrence of these proteins
extracellularly or in early developmental stages, in addition to intracellularly in the
mycelia, may explain the development of immunoreactivity directed against these
proteins. Routine environmental exposure to A. fumigatus involves inhalation of

185
conidia, followed predominantly by their clearance from the lungs before mycelia
development (Murdock et al., 2011). This would result in the host, in the absence of A.
fumigatus-related disease, predominantly encountering proteins of the conidia, early
germlings and secreted proteins.
Upon detailed review of the literature, on the proteomic response of A.
fumigatus to stress, it was observed that the immunogenic proteins identified here have
been shown to be up-regulated in response to heat shock, oxidative stress, hypoxia and
interactions with host cells (Lessing et al., 2007; Sugui et al., 2008; Albrecht et al.,
2010; Fraczek et al., 2010; Morton et al., 2011; Vödisch et al., 2011). Seven of the
antigens herein detected have been found to be up-regulated in response to heat shock,
brought about by a temperature shift from 30°C to 48°C (Albrecht et al., 2010). The
heat shock proteins, Hsp88, Hsp90 and Hsp70, were up-regulated, in addition to the
translation elongation factor EF-1 alpha subunit, hexokinase Kxk, cobalamin-
independent methionine synthase MetH/D and alpha-ketoglutarate dehydrogenase
complex subunit Kgd1. This may reflect the temperature shift from ambient to 37°C,
experienced by conidia upon entering of the pulmonary alveoli. We speculate that up-
regulation of these proteins could account for their presentation to the adaptive immune
system and the subsequent generation of an antibody response. Cobalamin-independent
methionine synthase MetH/D and Hsp88 also showed Yap1 dependent induction in
response to oxidative stress in the form of H2O2 (Lessing et al., 2007). The molecular
chaperone and allergen Mod-E/Hsp90/Hsp1, in addition to other A. fumigatus allergens,
is also up-regulated in response to H2O2 (Fraczek et al., 2010). Inhaled conidia are
exposed to oxidative stress, in the form of reactive oxygen species (ROS) generated by
alveolar macrophages and polymorphonuclear leucocytes (PMNLs). Another
environmental condition that inhaled conidia encounter is a limited oxygen supply and

186
the inability of A. fumigatus to adapt a hypoxia response is coupled with its loss of
virulence (Willger et al., 2008). Vödisch et al. (2011) identified 59 proteins that were
up-regulated in A. fumigatus ATCC46645 following cultivation in hypoxic compared to
normoxic conditions, including 10 of the IgG-reactive proteins detected here.
Comparative analysis of the entire mycelial proteome revealed up-regulation of
phosphoglycerate kinase PgkA (AFUA_1G10350), asparate aminotransferase
(AFUA_4G10410) and steroid monooxygenase (AFUA_8G00440) in response to
hypoxia. A sub-proteomic investigation of the mitochondria also revealed significant
up-regulation of 1,3-β-glucanosyltransferase Gel3 (AFUA_2G05340),
lysophospholipases Plb1 and Plb3 (AFUA_4G08720 and AFUA_3G14680), GPI-
anchored cell wall organisation protein Ecm33 (AFUA_4G06820), outer mitochondrial
membrane protein porin (AFUA_4G06910), ATP synthase F1, beta subunit
(AFUA_5G10550) and mitochondrial aconitate hydratase (AFUA_6G12930) in
response to hypoxia. Conversely, an additional antigenic protein, woronin body protein
HexA (AFUA_5G08830) was observed as being down-regulated in hypoxia (1.7 fold)
in the whole mycelia proteome comparison. However a truncated version of this protein
was significantly up-regulated in hypoxic conditions (5.68 fold) upon comparison of the
mitochondrial fractions (Vödisch et al., 2011). This differential regulation may be
explained by the fact that many isoforms of the HexA protein are resolved by 2D-PAGE
and these proteins have more relative abundance in the mitochondria (Vödisch et al.,
2009). These conditions of increased temperature, hypoxia and oxidative stress are
similar to those encountered by conidia upon entering the alveoli of the lungs. We
postulate that up-regulation of the immunoreactive proteins identified here, in response
to stress, may allude to the development of an adaptive immune response directed
towards them.

187
Numerous comparative transcriptomic and proteomic studies have been carried
out previously to characterise the regulation of genes and proteins of A. fumigatus in
response to host cells. These, in addition to experiments aiming to replicate
environmental conditions within the host, provide valuable information on the
mechanisms of A. fumigatus virulence. Upon exposure of A. fumigatus conidia to
human neutrophils, three of the antigens identified here were found to be up-regulated at
the transcript level (Sugui et al., 2008). Phosphoglycerate kinase PgkA
(AFUA_1G10350), aspartate aminotransferase (AFUA_4G10410) and mitochondrial
aconitate hydratase (AFUA_6G12930) transcripts were all up-regulated following
incubation of conidia with neutrophils for 1.5 h. These results were replicated when
conidia were incubated with neutrophils from patients with chronic granulomatous
disease (CGD), which are defective in the production of ROS, thus excluding the
influence of ROS on the regulation of these genes (Sugui et al., 2008). Aspartate
aminotransferase (AFUA_4G10410) was also found to be up-regulated following
incubation of A. fumigatus conidia with airway epithelial cells, in addition to the
putative IMP dehydrogenase (AFUA_2G03610) (Oosthuizen et al., 2011) also
identified here. The transcripts of two lysophospholipases, Plb1 (AFUA_4G08720) and
Plb3 (AFUA_2G03610), were observed to be up-regulated in the presence of lecithin, a
constituent of human lung surfactant, in a directed study using quantitative PCR (Shen
et al., 2004). Additionally, the antigenic woronin body protein HexA
(AFUA_5G08830) was up-regulated following 9 and 12 h incubation with immature
human dendritic cells (Morton et al., 2011) and the molecular chaperone and allergen
Mod-E/Hsp90/Hsp1 (AFUA_5G04170) was up-regulated following co-incubation with
macrophages (Fraczek et al., 2010). We hypothesize that up-regulation of these genes,
in the host-pathogen response, may increase the opportunity for presentation to the
adaptive immune system and thus explain the development of their immunoreactivity.

188
The independent detection of the woronin body protein HexA
(AFUA_5G08830) from three separate locations by 2D-PAGE provided an interesting
observation on the putative position of antigenic epitope on the protein (Figure 4.3). As
discussed above the occurrence of multiple isoforms of the HexA protein has been
observed in previous 2D-PAGE studies, with its identification from 12 independent
spots on the mitochondrial and 2 spots in the mycelia protein map (Vödisch et al.,
2009). This phenomenon indicates the presence of modified versions of the protein,
with different pIs and molecular masses as deduced by the positions of the spots on the
gel. Alterations of the isoelectric point of the protein, without a change in apparent
molecular size could result from post-translational modifications such as
phosphorylation. Identification of HexA from spots 26 and 27 (Figure 4.4), was in
agreement with the theoretical molecular mass (tMr = 50 kDa) and pI (6.56) of the
protein. In contrast, the identification of HexA from spot 17 did not correlate to the tMr,
with its position on the gel indicative of a much smaller protein. Interrogation of the
peptides identified from each of the HexA protein spots (Spot numbers: 17, 26 and 27;
Figure 4.4) revealed that while broad sequence coverage of the proteins from spots 26
and 27 was achieved, peptides identified from spot 17 were confined exclusively to the
C-terminal section (Figure 4.5). The level of immunoreactivity to the truncated HexA
protein, observed in spot 17, is lower than that observed from the intact HexA proteins
in spots 26 and 27, which indicates the antigenic epitope recognised by human IgG may
predominantly be contained on the N-terminal section of the protein. Truncation of the
protein may therefore result in loss of the IgG binding site or weaken the affinity of the
IgG towards it.
In summary, the work described in this Chapter expands the characterisation of
the A. fumigatus immunoproteome. Proteins (n = 25) were identified as IgG-reactive

189
antigens, through 2D-PAGE and Western blot analysis using sera from healthy
individuals. This work represents the first classification of 13 of these proteins as
immunogenic which signifies a substantial extension of the currently recognised
collection of A. fumigatus antigens. Many of these IgG-reactive antigens, identified
from the mycelia of A. fumigatus, were also detected previously in the secretome of A.
fumigatus or additionally are associated with early developmental stages of growth.
Additionally 19 of these immunogenic proteins have been described, in comparative
proteomics studies, to be up-regulated in response to cellular stress or in response to
interactions with host cells. These conditions of stress, including heat-shock, oxidative
stress, hypoxia and exposure to host cells, may mimic the internal host environment
encountered by the routinely inhaled conidia of A. fumigatus. We postulate that the up-
regulation of these proteins may account for their presentation to the immune system
and the subsequent generation of an antibody response to A. fumigatus in healthy
individuals. In addition to the characterisation of the A. fumigatus immunoproteome,
2D-PAGE coupled with Western blot analysis enabled the putative location of the
dominant immune-epitope on the HexA protein to be identified. The reduction in the
relative intensity of immunoreactivity to the C-terminal fragment of the HexA protein
indicates the antigenic epitope is located predominantly on the N-terminal section of the
protein. Further work would be required to isolate the exact location of the antigenic
epitope on the HexA protein however this work provides guidance for the direction of
future investigations. The reactivity of disease-state sera with mycelial proteins in future
studies could expand the field of A. fumigatus immunoproteomics further. However, the
use of sera from healthy individuals represents a novel baseline method by which to
characterise the immune response to A. fumigatus in the absence of disease. The global
characterisation of the proteome of A. fumigatus, using MS-based proteomics as
described in Chapter 3, and immunoproteomics, as described in this Chapter, provides a

190
comprehensive overview of the systems operating in this opportunistic pathogen, both
in vitro and in vivo. In Chapter 5, phenotypic analysis of A. fumigatus will be carried out
in response to a combination of stresses and comparative proteomics will be utilised in
order to elucidate the cellular mechanisms differentially regulated in these conditions.

CHAPTER 5
Comparative proteomic profiling
of gliotoxin-associated mechanisms
in A. fumigatus

191
5 Chapter 5
5.1 Introduction
Large-scale MS-based proteomics studies, as described in Chapter 3, can
provide a global overview of the many biochemical systems active in an organism under
a given set of conditions. The traditional proteomics strategy, comprising 2D-PAGE
coupled with MS for protein identification, has been utilised in countless comparative
studies, for relative quantitation of changes in the proteome constituents, in addition to
detection of post-translational modifications (PTMs) (Rabilloud et al., 2010).
Comparative 2D-PAGE has extended the understanding of pathways which respond to
various forms of stress in A. fumigatus (Lessing et al., 2007). Often, comparative 2D-
PAGE studies are undertaken following observation of altered growth phenotypes,
either due to exogenous stress and/or genetic mutations (Doyle, 2011b). 2D-PAGE has
been carried out to elucidate the mechanisms involved in response to hypoxia (Vödisch
et al., 2011; Barker et al., 2012), oxidative stress (Lessing et al., 2007), heat shock
(Albrecht et al., 2010), gliotoxin (Schrettl et al., 2010; Carberry et al., 2012) and anti-
fungal agents (Gautam et al., 2008, 2011; Singh et al., 2012) in A. fumigatus.
Additionally, 2D-PAGE-based proteomics can identify putative targets of specific
genes, through comparative analysis of the proteome changes following gene
disruption. For example, investigation of the bZIP-like transcription factors AfYap1
(Lessing et al., 2007) and HapX (Hortschansky et al., 2007), the nonribosomal peptide
synthetase Pes3 (O’Hanlon et al., 2011), the glucosidase 1 AfCwh41 (Zhang et al.,
2009) and cell wall biosynthesis proteins (Bruneau et al., 2001) employed this
approach.
Lessing et al. (2007) investigated the proteomic response of A. fumigatus to
exogenous H2O2, and identified differential expression of 28 proteins, with functions

192
ranging from stress-response and antioxidant properties to amino acid metabolism.
Many of these proteins represented putative targets of the transcriptional regulator
AfYap1, based on inference from similar studies in yeast. Accordingly, disruption of the
Afyap1 gene, resulted in H2O2- and menadione-sensitive phenotypes. Comparative 2D-
PAGE analysis of wild-type and the Afyap1 mutant, following exposure to H2O2,
revealed altered expression of 29 proteins that could putatively be controlled by
AfYap1. This revealed the Afyap1-dependent expression of a number of catalases, heat
shock proteins and factors involved in protein synthesis in response to H2O2, and
highlighted the importance of this transcriptional regulator in the response to oxidative
stress.
A study carried out by Carberry et al. (2012) charted the proteomic response of
A. fumigatus to gliotoxin and observed the differential regulation of 27 unique proteins.
These included the down-regulation of a catalase and a peroxiredoxin, proteins involved
in the relief of oxidative stress. A member of the gliotoxin biosynthetic cluster, gliT,
encodes a gliotoxin oxidoreductase, which imparts protection to exogenous gliotoxin
(Scharf et al., 2010; Schrettl et al., 2010). GliT has been demonstrated to catalyse
gliotoxin reduction, with the concurrent oxidation of NADPH to NADP+ and
transcription and translation of GliT are induced by exogenous gliotoxin (Schrettl et al.,
2010). Additionally Scharf et al. (2010) characterised the FAD-dependent oxidation of
reduced gliotoxin, in a reaction that generates ROS. In the absence of the GliT protein,
significant sensitivity to exogenous gliotoxin is observed in A. fumigatus and
transformation of the gliT gene into other gliotoxin-sensitive fungi resulted in acquired
resistance to the metabolite (Schrettl et al., 2010).
Another member of the gliotoxin biosynthetic cluster is gliK (Gardiner and
Howlett, 2005), which encodes a protein with a putative gamma-glutamyl

193
cyclotransferase (GGCT) domain (Gallagher et al., 2012). As described in Chapter 1,
the GliK protein has remained experimentally uncharacterised until recently. Work
presented in Chapter 6, demonstrates that the GliK protein is essential for the
biosynthesis of gliotoxin and absence of this protein results in increased sensitivity to
exogenous gliotoxin and to H2O2 (Gallagher, 2010; Gallagher et al., 2012). GliK also
appears to be involved in gliotoxin efflux, with increased accumulation of exogenously
added gliotoxin observed in the deletion strain, ΔgliK (Gallagher, 2010; Gallagher et al.,
2012). Characterisation of the systems involved in the interaction of gliotoxin with A.
fumigatus ΔgliK could facilitate a greater understanding of both the role of GliK in the
cell and the influence of gliotoxin-imposed stress on A. fumigatus.
The effect of combinatorial stresses is emerging as a new focus of investigation,
due to the simultaneous exposure of organisms to distinct stresses in their environment.
As discussed in Chapter 1, A. fumigatus is exposed to an array of physical, chemical and
host-associated stresses as a human pathogen, including heat shock, hypoxia and
oxidative stress. Kaloriti et al. (2012) have demonstrated the influence of combinatorial
stresses on C. albicans and C. glabrata. These authors noted that coupling of oxidative
stress to either osmotic or nitrosative stress significantly decreases growth or viability of
the yeast cells, relative to either stress applied in isolation. The molecular response of
fungi to a combination of stresses has largely gone uncharacterised, with limited large-
scale transcriptomic or proteomic analyses performed in this area to date (Kaloriti et al.,
2012). Comparative proteomics of A. fumigatus, examining the response to stresses,
applied singularly or in tandem, could elaborate on the mechanisms influenced by the
exposure to combinatorial stresses.

194
The work presented in this Chapter stemmed from the hypothesis that, based on
the observed increase in sensitivity of A. fumigatus ΔgliK to gliotoxin and H2O2
individually (Gallagher, 2010), an additive or synergistic effect may be observed by
combining the stresses. In light of any alteration of phenotype, comparative 2D-PAGE
would identify alterations to the proteome in response to a combination of challenges.
These proteomic profiles may reveal the pathways and molecular mechanisms affected
by exposure to a combination of gliotoxin and H2O2. Additionally, analysis of the
proteome of A. fumigatus ΔgliK in response to gliotoxin may further elucidate a
possible function for the yet unclassified, GliK protein. Thus, the aims of the work
carried out in this Chapter were; (i) to carry out phenotypic analysis of A. fumigatus
ATCC26933 and ΔgliK in response to simultaneous challenge with gliotoxin and H2O2,
(ii) to investigate changes to the proteome of A. fumigatus in response to co-addition of
gliotoxin and H2O2 and (iii) to investigate the proteome of A. fumigatus ΔgliK in
response to exogenous gliotoxin.

195
5.2 Results
5.2.1 Phenotypic analysis of A. fumigatus ATCC26933 and ΔgliK in response to a
combination of gliotoxin and H2O2
Following the observation that growth of A. fumigatus ΔgliK is significantly
inhibited relative to the wild-type in the presence of gliotoxin (≥ 1 µg/ml; p < 0.001 ) or
H2O2 (≥ 1 mM; p < 0.001 ) individually (Gallagher, 2010; Gallagher et al., 2012), the
effect of combining these stresses was investigated. Plate assays were carried out in
order to determine the combined phenotypic response of A. fumigatus, ATCC26933 and
ΔgliK, to gliotoxin plus H2O2 (Section 2.1.5.21). A. fumigatus, ATCC26933 and ΔgliK,
were exposed to gliotoxin (1 - 10 µg/ml) and H2O2 (0 - 1 mM) in Czapek-Dox agar
(Section 2.1.5.10), individually and in combination. Equivalent volumes of methanol
were added to appropriate plates as a solvent control for gliotoxin, and the radial growth
of replicate colonies was measured at 72 h.
The radial growth of A. fumigatus ATCC26933 (wild-type) was significantly
attenuated in the presence of 10 µg/ml gliotoxin (p < 0.001), whereas lower gliotoxin
concentrations (≥ 1 µg/ml) were sufficient to significantly inhibit growth of ΔgliK (p <
0.01) (Figure 5.1a and Figure 5.2a). Similarly, A. fumigatus ΔgliK demonstrated
significantly higher sensitivity to H2O2, with p < 0.05 at 0.5 mM and p < 0.001 at 1 mM
H2O2 (Figure 5.1b and Figure 5.2b). No growth of A. fumigatus ΔgliK was visible in
Czapek-Dox agar plates supplemented with 1 mM H2O2 at 72 h. Unexpectedly, co-
addition of gliotoxin and H2O2 resulted in reduced H2O2 sensitivity in both A. fumigatus
wild-type and ΔgliK (Figure 5.1c, Figure 5.2c and d). This relief of H2O2-induced
growth inhibition was achieved in a dose-dependent manner, where 10 µg/ml gliotoxin
was sufficient to restore radial growth to the same level as observed for gliotoxin alone.

196
Gliotoxin-mediated relief of H2O2-induced growth inhibition was observed for both
wild-type and ΔgliK strains of A. fumigatus.
197

198
Figure 5.1: Phenotypic analysis demonstrating the individual and combined effects of
gliotoxin (0-10 μg/ml) and H2O2 on A. fumigatus ATCC26933 and ∆gliK. (a) Gliotoxin
(10 μg/ml) significantly inhibits A. fumigatus ∆gliK growth, relative to ATCC26933. (b)
H2O2 (1 mM) completely inhibits A. fumigatus ∆gliK growth, compared to ATCC26933.
(c) Gliotoxin (1-10 μg/ml) relieves H2O2–mediated growth inhibition of both A.
fumigatus ATCC26933 and ∆gliK in a dose dependent manner.

199
Figure 5.2: Graphical representation of phenotypic analysis shown in Figure 5.1.
Individual and combined effects of gliotoxin (0-10 μg/ml) and H2O2 on A. fumigatus
ATCC26933 (wild-type) and ∆gliK. (a) Gliotoxin (10 μg/ml) significantly inhibits A.
fumigatus ∆gliK growth, compared to wild-type. (b) H2O2 (1 mM) completely inhibits
A. fumigatus ∆gliK growth, relative to wild-type. (c and d) Gliotoxin (1-10 μg/ml)
relieves H2O2–mediated growth inhibition of both A. fumigatus ATCC26933 (wild-
type) and ∆gliK in a dose dependent manner. Co-addition of gliotoxin (10 μg/ml) and
H2O2 (1 mM) recovered growth to the same level as the gliotoxin control (10 μg/ml).
*** indicates p < 0.001, * indicates p < 0.05, ns indicates not significant (p > 0.05).

200
5.2.2 Comparative 2D-PAGE analysis of A. fumigatus ATCC26933 following
exposure to a combination of H2O2 and gliotoxin
In order to elucidate the mechanisms involved in gliotoxin-mediated relief of
H2O2-induced stress in A. fumigatus ATCC26933, a comparative 2D-PAGE study was
undertaken. A. fumigatus ATCC26933 was grown in Sabouraud dextrose medium for 24
h prior to addition of one of the four treatments outlined in Table 5.1. Mycelia (n =
5/treatment) were harvested after 4 h and protein was extracted as described in Section
2.2.2.2. TCA/acetone precipitation was carried out on protein lysates prior to
resuspension of protein in IEF buffer (Section 2.1.6.2). Protein was separated on pH 4 -
7 IEF strips, followed by resolution by SDS-PAGE (Section 2.2.4.3). Colloidal
Coomassie staining was carried out on gels, with subsequent protein spot analysis using
Progenesis™ SameSpot software (Section 2.2.4.4). Gels from all four treatments were
aligned (n = 20; 5 gels/treatment) and subsets of treatments were compared as outlined
in Figure 5.3.
Table 5.1: Treatments carried out on A. fumigatus ATCC26933, with addition of
gliotoxin, H2O2 and/or methanol indicated.
Treatment Gliotoxin (µg/ml)1 H2O2 (mM)
2 Methanol
3
Solvent Control - -
Gliotoxin alone 10
- -
H2O2 alone - 2
Gliotoxin and H2O2
(Co-addition)
10 2 -
1Gliotoxin stock (500 µl) (Table 2.1) added per 50 ml culture.
2 H2O2 stock (100 µl)
(Table 2.1) added per 50 ml culture. 3Methanol (500 µl) added per 50 ml culture as a
solvent control for gliotoxin.

201
Figure 5.3: Comparison sets used for analysis of 2D-PAGE of A. fumigatus
ATCC26933 following gliotoxin and H2O2 exposure, individually and combined.
Arrows point to control gels in each comparison set. Comparison sets include (i)
Gliotoxin alone v Solvent Control, (ii) H2O2 alone v Solvent control, (iii) Co-addition v
Solvent control, (iv) Co-addition v Gliotoxin alone, (v) Co-addition v H2O2 alone.

202
Proteins spots (n = 29) were found to be significantly differentially expressed (p
< 0.05) under these conditions (Figure 5.4). Three of these proteins spots had a fold
increase ≥ 1.5 fold (p < 0.05) and two had a fold decrease ≥ 1.5 fold (p < 0.05),
following exposure to gliotoxin alone relative to the solvent control (Comparison (i)).
Six proteins spots exhibited a fold increase ≥ 1.5 fold (p < 0.05), following exposure to
H2O2 alone relative to the solvent control (Comparison (ii)). Nine of these proteins spots
had a fold increase ≥ 1.5 fold (p < 0.05) and three showed a fold decrease ≥ 1.5 fold (p
< 0.05), under gliotoxin/H2O2 co-addition relative to the solvent control (Comparison
(iii)). Nine proteins spots presented with a fold increase ≥ 1.5 fold (p < 0.05) and one
had a fold decrease ≥ 1.5 fold (p < 0.05), in the co-addition relative to exposure to
gliotoxin alone (Comparison (iv)). Seven proteins spots yielded a fold increase ≥ 1.5
fold (p < 0.05) and six had a fold decrease ≥ 1.5 fold (p < 0.05), in the co-addition
relative to H2O2 alone (Comparison (v)). Redundancy was noted, with some protein
spots included in multiple comparison sets, resulting in the differential expression of 29
unique protein spots. These protein spots were excised and subjected to in-gel trypsin
digestion (Section 2.2.6.1), followed by LC-MS/MS analysis for protein identification
(Section 2.2.6.3).
203
a.
Colloidal Coomassie stained 2D-PAGE gel
of A. fumigatus mycelial proteins;
Solvent control
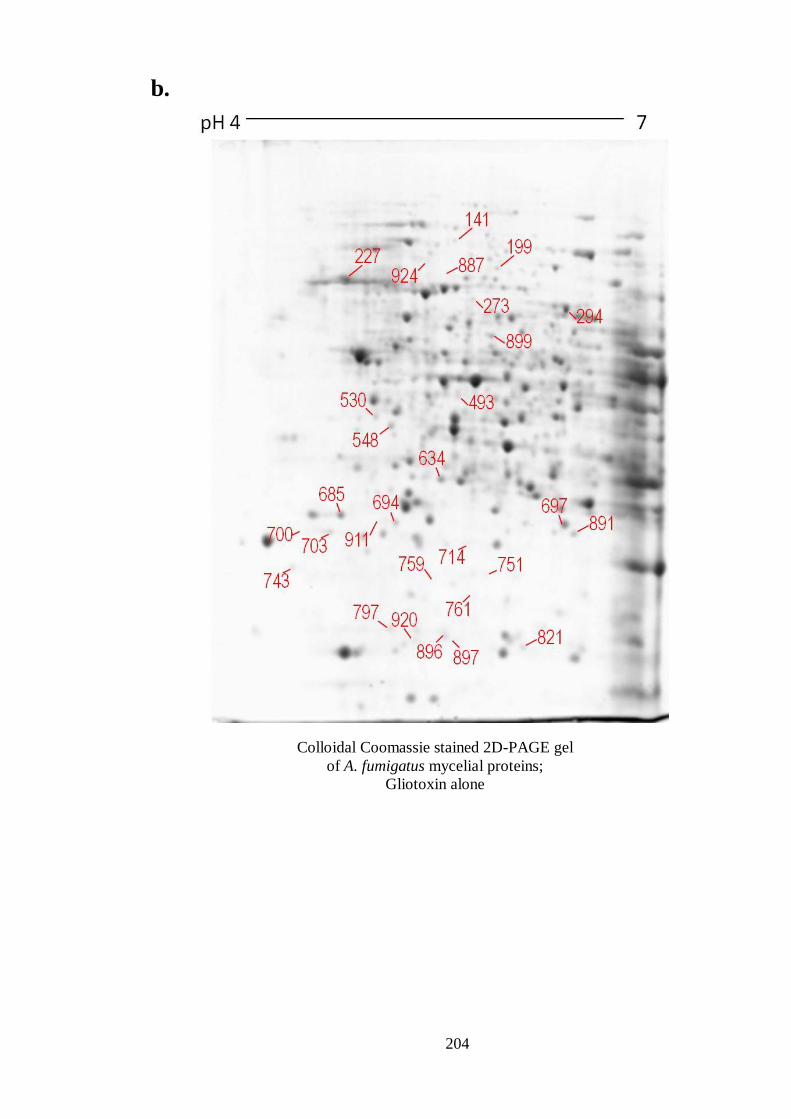
204
b.
Colloidal Coomassie stained 2D-PAGE gel
of A. fumigatus mycelial proteins;
Gliotoxin alone
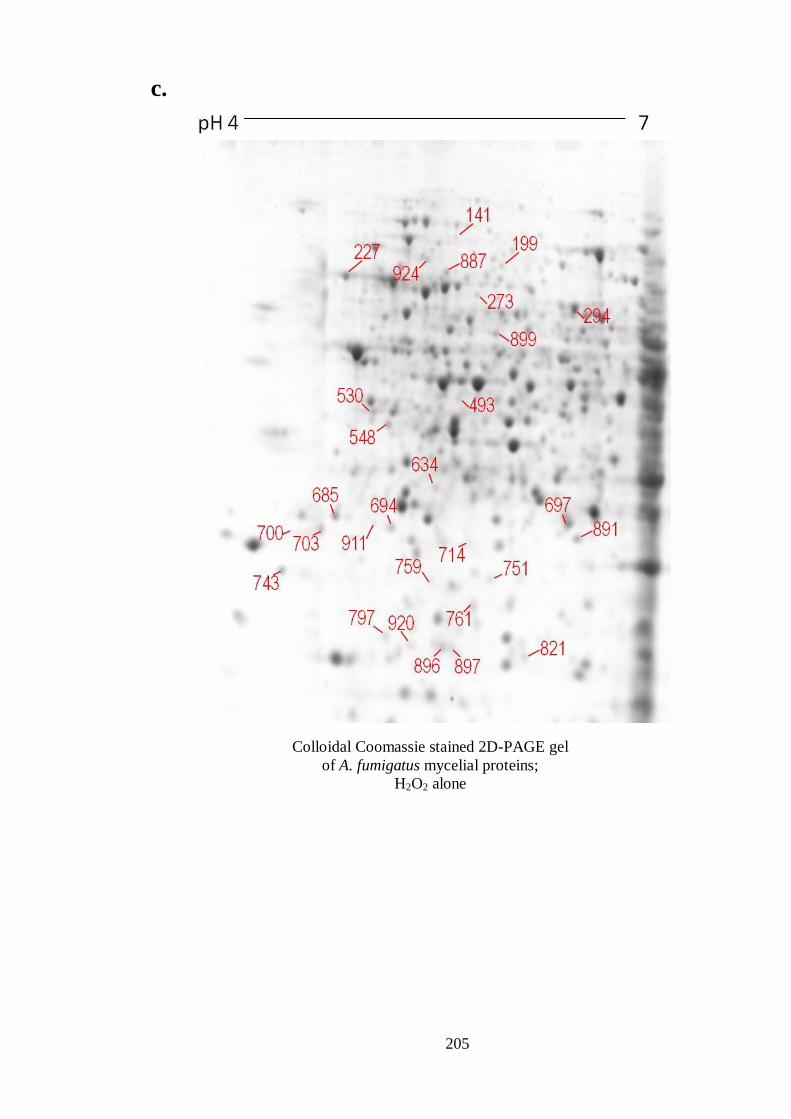
205
c.
Colloidal Coomassie stained 2D-PAGE gel
of A. fumigatus mycelial proteins;
H2O2 alone

206
d.
Figure 5.4: 2D-PAGE analysis of A. fumigatus ATCC26933 (a) solvent control, (b)
following exposure to gliotoxin (10 µg/ml) for 4 h, (c) following exposure to 2 mM
H2O2 for 4 h, (d) following exposure to a combination of gliotoxin (10 µg/ml) and H2O2
(2 mM) for 4 h. The proteins were first separated on pH 4 – 7 strips followed by SDS-
PAGE. Proteins found to be significantly differentially expressed (p < 0.05), after
analysis using Progenesis™ SameSpot software, are numbered.
Colloidal Coomassie stained 2D-PAGE gel
of A. fumigatus mycelial proteins;
Gliotoxin and H2O2 combined

207
5.2.3 Identification of differentially expressed proteins by LC-MS/MS
LC-MS/MS analysis was used to identify the 29 protein spots differentially
expressed following challenges with gliotoxin and H2O2, individually or in combination
(Tables 5.2 and 5.3). Protein expression was assessed for all conditions relative to the
solvent control (Table 5.2) The expression of proteins after gliotoxin/ H2O2 co-exposure
was also assessed relative to the individual treatments of gliotoxin alone or H2O2 alone
(Table 5.3). In total, 28 unique proteins were identified by LC-MS/MS, from 29 excised
protein spots. Molecular chaperone and allergen Mod-E/Hsp90/Hsp1 (termed Hsp90)
(AFUA_5G04170) was identified from two distinct spots (Spots 743 and 924; Figure
5.4). The positions of these protein spots indicate proteins with low and high molecular
masses, respectively, and may be indicative of protein degradation or cleavage.
Proteins (n = 13) were significantly altered in expression following co-addition
relative to H2O2 alone (p < 0.05) (Table 5.3, Comparison set (v)). Proteins up-regulated
in the co-addition included those with oxidation-reduction activity. GliT, a gliotoxin
oxidoreductase (Scharf et al., 2010; Schrettl et al., 2010), was up-regulated in the co-
additive condition relative to H2O2 alone (5.0 fold) but was not induced by H2O2 alone
(Figure 5.5, Tables 5.2 and 5.3). A decrease in expression of proteins associated with
response to stress was observed following gliotoxin/ H2O2 co-exposure, relative to H2O2
alone. Hsp90 and the oxidative stress protein Svf1 were down-regulated in the co-
addition (2.1 and 1.7 fold, respectively), reflective of the relief of H2O2-induced stress
(Table 5.3, Comparison set (v)). An increase in expression of the Ran-specific GTPase
and the proliferating cell nuclear antigen (PCNA), involved in cell-cycle regulation and
DNA-repair (Baumer et al., 2000; Burkovics et al., 2009), respectively, was also
observed in the co-addition analysis (Table 5.3). The class V chitinase, associated with
cell autolysis (Yamazaki et al., 2007), was expressed at a significantly lower level in the

208
co-addition relative to H2O2 alone (p < 0.05) (Table 5.3, Comparison set (v)). Two
hydrolases, isochorismate family hydrolase and the HAD family hydrolase, were up-
regulated when both gliotoxin and H2O2 were present (Table 5.3). Proteins involved in
amino acid and nucleic acid metabolism (Valerius et al., 2001; Sieńko et al., 2007),
glutamine amidotransferase:cyclase and methylenetetrahydrofolate reductase, were also
differentially expressed (Table 5.3). Additionally an unknown function protein
(AFUA_6G03460) was detected, which underwent a 2.7 fold decrease in expression in
the co-addition scenario, relative to H2O2 alone (Table 5.3).

209
Untreated control
Gliotoxin alone
(10 µg/ml)
H2O2 alone
(2 mM)
Gliotoxin (10 µg/ml)
and H2O2 (2 mM),
combined
AFUA_6G09740
GliT
Figure 5.5: Increased expression of the gliotoxin oxidoreductase GliT in response to
gliotoxin but not H2O2. GliT expression was increased following exposure to exogenous
gliotoxin alone (4.6 fold) and in combination with H2O2 (4.7 fold), relative to the
solvent control. No significant difference in expression of GliT was detected upon
exposure of A. fumigatus to H2O2 alone, relative to the control (p > 0.05), indicating
GliT expression is mediated by gliotoxin only.

210
Table 5.2: Proteins undergoing significant differential expression1 in A. fumigatus ATCC26933 following exposure to gliotoxin and H2O2, separately
or combined, relative to the solvent control. Protein identification was achieved by 2D-PAGE and LC-MS/MS.
Protein name Gliotoxin
v Control2
(i)
H2O2
v Control2
(ii)
Co-addition
v Control2
(iii)
Sequence
coverage
%
tMr
(Da)
CADRE
ID.
(AFUA_)
Spot
No.
14-3-3 family protein ArtA - ↑ 1.9 ↑ 2.1 46 29102 2G03290 703
ATP synthase gamma chain, mitochondrial precursor, putative - ↑ 1.6 ↑ 1.9 38 31547 1G03510 891
Molecular chaperone and allergen Mod-E/Hsp90/Hsp1 - ↑ 2.0 - 8 80640 5G04170 743
Unknown function protein - ↑ 2.3 - 10 63462 6G03460 887
14-3-3 family protein - ↑ 1.9 - 38 30104 6G06750 685
Thioredoxin reductase Trr1/Trr2 - ↑ 1.6 - 18 42190 4G12990 493
Thioredoxin reductase GliT ↑ 4.6 - ↑ 4.7 16 36004 6G09740 634
Proteasome component Pre8 ↓ 1.8 - 27 30463 7G05870 761
Succinate dehydrogenase subunit Sdh1 ↑ 1.5 - 18 71148 3G07810 294
Translation elongation factor EF2 subunit ↑ 1.6 - 9 93198 2G13530 697
Bifunctional purine biosynthetic protein Ade1 ↓ 1.7 - 9 86419 6G04730 141

211
Protein name Gliotoxin
v Control2
(i)
H2O2
v Control2
(ii)
Co-addition
v Control2
(iii)
Sequence
coverage
%
tMr
(Da)
CADRE
ID.
(AFUA_)
Spot
No.
Proliferating cell nuclear antigen (PCNA) - - ↑ 7.5 8 24034 1G04900 700
Glycyl-tRNA synthetase - - ↓ 1.9 4 79100 5G05920 199
Cytochrome c peroxidase Ccp1 - - ↑ 1.8 14 40379 4G09110 714
Unknown function protein - - ↑ 1.9 26 27921 3G00730 797
Isochorismatase family hydrolase - - ↑ 1.6 31 20904 6G12220 821
NADH-ubiquinone dehydrogenase 24 kDa subunit - - ↑ 1.8 12 29771 2G09130 897
Xanthine-guanine phosphoribosyl transferase Xpt1, putative - - ↑ 1.9 28 19505 4G04550 896
Methylenetetrahydrofolate reductase (MTHFR) - - ↓ 1.6 10 69279 2G11300 273
Glutamine amidotransferase:cyclase - - ↓ 2.0 27 60190 2G06230 899
1p< 0.05;
2Fold increase (↑) or decrease (↓) of protein upon exposure of A. fumigatus ATCC26933 to gliotoxin alone, H2O2 alone or the co-addition,
relative to control. CADRE ID., A. fumigatus gene annotation nomenclature according to Nierman et al. (2005) and Mabey et al. (2004); tMr,
theoretical molecular mass; Spot No, according to Figure 5.4; Co-addition: incubation with gliotoxin and H2O2 in combination.(i, ii, iii) indicates
comparison sets as described in Figure 5.3.

212
Table 5.3: Proteins undergoing significant differential expression1 in A. fumigatus ATCC26933 following exposure to a combination of gliotoxin and
H2O2 (co-addition), relative to the control, gliotoxin alone or H2O2 alone. Protein identification was achieved by 2D-PAGE and LC-MS/MS.
Protein Name Co-addition
v Control2
(iii)
Co-addition
v Gliotoxin2
(iv)
Co-addition
v H2O22
(v)
Sequence
coverage
%
tMr
(Da)
CADRE
ID.
(AFUA_)
Spot
No.
Proteasome component Pre8 - ↑ 2.6 - 27 30463 7G05870 761
HAD superfamily hydrolase - ↑ 2.4 ↑ 1.6 22 27360 5G08270 911
Hsp70 chaperone BiP/Kar2 - ↓ 1.6 - 24 73385 2G04620 227
Proliferating cell nuclear antigen (PCNA) ↑ 7.5 ↑ 7.9 ↑ 2.3 8 24034 1G04900 700
F-actin capping protein alpha subunit - ↑ 1.8 - 18 30422 6G10060 694
ATP synthase gamma chain, mitochondrial precursor, putative ↑ 1.9 ↑ 1.7 - 38 31547 1G03510 891
Glucosamine-6-phosphate isomerase/6-
phosphogluconolactonase family
- ↑ 2.1 - 3 93269 1G02980 751
Isochorismatase family hydrolase ↑ 1.6 ↑ 1.7 ↑ 1.5 31 20904 6G12220 821
NADH-ubiquinone dehydrogenase 24 kDa subunit ↑ 1.8 ↑ 1.8 ↑ 1.5 12 29771 2G09130 897
Xanthine-guanine phosphoribosyl transferase Xpt1, putative ↑ 1.9 ↑ 1.7 - 28 19505 4G04550 896
Thioredoxin reductase GliT ↑ 4.7 - ↑ 5.0 16 36004 6G09740 634

213
Protein Name Co-addition
v Control2
(iii)
Co-addition
v Gliotoxin2
(iv)
Co-addition
v H2O22
(v)
Sequence
coverage
%
tMr
(Da)
CADRE
ID.
(AFUA_)
Spot
No.
Class V chitinase - - ↓ 1.5 24 43638 3G11280 548
Unknown function protein - - ↓ 2.7 10 63462 6G03460 887
NADH-quinone oxidoreductase, 23 kDa subunit - - ↑ 1.8 12 25752 1G06610 920
Molecular chaperone and allergen Mod-E/Hsp90/Hsp1 - - ↓ 2.1 6 80640 5G04170 924
Glutamine amidotransferase:cyclase ↓ 2.0 - ↓ 1.6 27 60190 2G06230 899
Methylenetetrahydrofolate reductase (MTHFR) ↓ 1.6 - ↓ 1.6 10 69279 2G11300 273
Ran-specific GTPase-activating protein 1 - - ↑ 2.0 13 27644 5G12180 759
Oxidative stress protein Svf1 - - ↓ 1.7 9 43421 5G11820 530
14-3-3 family protein ArtA ↑ 2.1 - - 46 29102 2G03290 703
Glycyl-tRNA synthetase ↓ 1.9 - - 4 79100 5G05920 199
Cytochrome c peroxidase Ccp1 ↑ 1.8 - - 14 40379 4G09110 714
Unknown function protein ↑ 1.9 - - 26 27921 3G00730 797
1 p < 0.05;
2Fold increase (↑) or decrease (↓) of protein in the co-addition, relative to the solvent control, gliotoxin alone or H2O2 alone. CADRE ID., A.
fumigatus gene annotation nomenclature according to Nierman et al. (2005) and Mabey et al. (2004); tMr, theoretical molecular mass; Spot No,
according to Figure 5.4; Co-addition: incubation with both gliotoxin and H2O2. (i, ii, iii) indicates comparison sets as described in Figure 5.3. Data
from comparison set (iii) (Co-addition v Control) from Table 5.2 is included for ease of analysis.

214
5.2.4 Comparative 2D-PAGE analysis of A. fumigatus ΔgliK following exposure
to gliotoxin
Following the observation in Section 5.2.1 that A. fumigatus ΔgliK exhibited
increased sensitivity to exogenous gliotoxin, 2D-PAGE was carried out to investigate
the proteome changes associated with this phenotype. A. fumigatus ΔgliK was cultured
in Sabouraud dextrose broth for 24 h before addition of gliotoxin (10 µg/ml) or the
equivalent volume of methanol as a control (n = 5, respectively). After 4 h, mycelia
were harvested and protein was extracted as described in Section 2.2.2.2. Protein lysates
were subjected to TCA/acetone precipitation before resuspension in IEF buffer (Section
2.1.6.2) and separation on pH 4 - 7 strips (Section 2.2.4.3). Following separation of
proteins by SDS-PAGE, Colloidal Coomassie staining was carried out to visualise total
proteins on the gels (Section 2.2.4.4). Progenesis™ SameSpot software was
subsequently used to analyse the stained gels, and protein spots demonstrating
significant differential expression were located (Figure 5.6).
Protein spots (n = 33) were found to be differentially expressed in A. fumigatus
ΔgliK upon exposure to gliotoxin (10 µg/ml) for 4 h. Nineteen of these proteins spots
had a fold increase ≥ 1.5 (p < 0.05), while the remaining fourteen protein spots
exhibited a fold decrease ≥ 1.5 (p < 0.05) in response to gliotoxin. These protein spots
were excised from the gels and subjected to trypsin digestion as described in Section
2.2.6.1. LC-MS/MS analysis was carried out to ascertain the identity of these proteins
(Section 2.2.6.3).

215
a.
Colloidal Coomassie stained 2D-PAGE gel
of A. fumigatus ΔgliK mycelial proteins;
Solvent control

216
b.
Figure 5.6: 2D-PAGE analysis of A. fumigatus ΔgliK (a) control, (b) following
exposure to gliotoxin (10 µg/ml) for 4 h. The proteins were first separated on pH 4 – 7
strips followed by SDS-PAGE. Proteins found to be significantly differentially
expressed (p < 0.05), after analysis using Progenesis™ SameSpot software, are
numbered.
Colloidal Coomassie stained 2D-PAGE gel
of A. fumigatus ΔgliK mycelial proteins;
Gliotoxin (10 µg/ml)

217
5.2.5 LC-MS/MS identification of differentially expressed proteins
Proteins (n = 30) were identified by LC-MS/MS, from the 31 protein spots
differentially regulated in A. fumigatus ΔgliK, following exposure to gliotoxin for 4 h
(Table 5.4). Translation elongation factor eEF-3 (AFUA_7G05660; Spot 297; Figure
5.6) showed the largest fold increase in response to exogenous gliotoxin, while pyruvate
dehydrogenase E1 component alpha subunit (AFUA_1G06960; Spot 1200; Figure 5.6)
displayed the largest decrease.
Up-regulation of eighteen protein spots, corresponding to seventeen distinct A.
fumigatus proteins, was observed in ΔgliK in response to gliotoxin (Table 5.4). A
decrease in expression of thirteen distinct A. fumigatus proteins was detected in
gliotoxin-exposed ΔgliK (Table 5.4). Cobalamin-independent methionine synthase
MetH/D (AFUA_4G07360) was identified from two independent spots positioned
alongside each other on the gel (Spots 600 and 607, Figure 5.6) and was up-regulated
1.9 and 2.2 fold respectively, following gliotoxin exposure. The positions of these
protein spots indicated that the proteins had the same molecular mass but differed
slightly in pI. These slight changes in pI may be a result of post-translational
modification of the protein. Down-regulation of thirteen proteins was observed in A.
fumigatus ΔgliK upon exposure to gliotoxin (Table 5.4). Two isoforms of the thiazole
biosynthesis enzyme, encoded by the pyrithiamine resistance gene (ptrA) from A.
oryzae were also identified. This gene was used as a selection marker in the generation
of the gliK deletion strain.
Proteins undergoing significant differential expression in A. fumigatus ΔgliK
following exposure to gliotoxin include those involved in translation, amino acid
metabolism, those exhibiting regulatory roles and endoplasmic reticulum (ER)

218
associated proteins. The translation initiation factor EifCb, translation elongation factors
EF3, eEF3 and G1 and the alanyl-tRNA synthetase are involved in translation (Triana-
Alonso et al., 1995; Kapp and Lorsch, 2004; Towpik, 2005; Jackson et al., 2010). A
number of proteins are involved in the processes surrounding amino acid metabolism.
Specifically, cobalamin-independent methionine synthase MetH/D and the
methylenetetrahydrofolate reductase are associated with methionine biosynthesis
(Sieńko et al., 2007; Suliman et al., 2007). Diphthamide synthase is involved in
histidine modification (Liu et al., 2004), while glycine dehydrogenase and alanine
aminotransferase catalyse the reversible catabolism of glycine and alanine, respectively
(Piper et al., 2002; Garcia-Campusano et al., 2009). Homogentisate 1,2-dioxygenase is
associated with tyrosine and phenylalanine degradation (Schmaler-Ripcke et al., 2009).
Regulatory proteins identified here include a subunit of protein phosphatase 2A (PP2A)
and the zinc finger protein ZPR1, which each have distinct roles in the control of
transcription and translation (Mishra et al., 2007; Kaul et al., 2011). Protein disulphide
isomerise Pdi1 also exhibits a regulatory role and is associated with the ER-unfolded
protein response (Gauss et al., 2011). Several other ER-associated proteins were
identified, including CRAL/TRIO domain protein, aspartic endopeptidase Pep2 and the
vesicular fusion protein Sec17 (Schnabl et al., 2003; Parr et al., 2007; Perry et al., 2009)

219
Table 5.4: Proteins undergoing a significant change in expression1 in A. fumigatus ΔgliK following exposure to gliotoxin (10 µg/ml), relative to the
solvent control. Protein identification was achieved by 2D-PAGE and LC-MS/MS.
Protein name Fold Change2 Sequence
coverage %
tMr (Da) CADRE ID.
(AFUA_)
Spot No.
Proteins Upregulated following Gliotoxin Addition:
Translation elongation factor eEF-3 ↑ 5.6 8 117768.4 7G05660 297
Alanyl-tRNA synthetase ↑ 3.0 4 113714.5 8G03880 368
Eukaryotic translation initiation factor 3 subunit EifCb ↑ 2.7 5 85065.4 1G02030 542
Translation elongation factor G1 ↑ 2.5 19 87877.7 4G08110 575
Heat shock protein Hsp98/Hsp104/ClpA ↑ 2.2 13 111096.9 1G15270 370
Glycine dehydrogenase ↑ 2.2 18 115203.5 4G03760 389
Cobalamin-independent methionine synthase MetH/D ↑ 2.2 5 87736.8 4G07360 607
Vesicular-fusion protein Sec17 ↑ 2.0 31 32840.9 2G12870 1699
CTP synthase ↑ 2.0 27 64869.3 7G05210 794
Cobalamin-independent methionine synthase MetH/D ↑ 1.9 14 87736.8 4G07360 600
Aminopeptidase ↑ 1.9 35 106227.3 4G09030 479
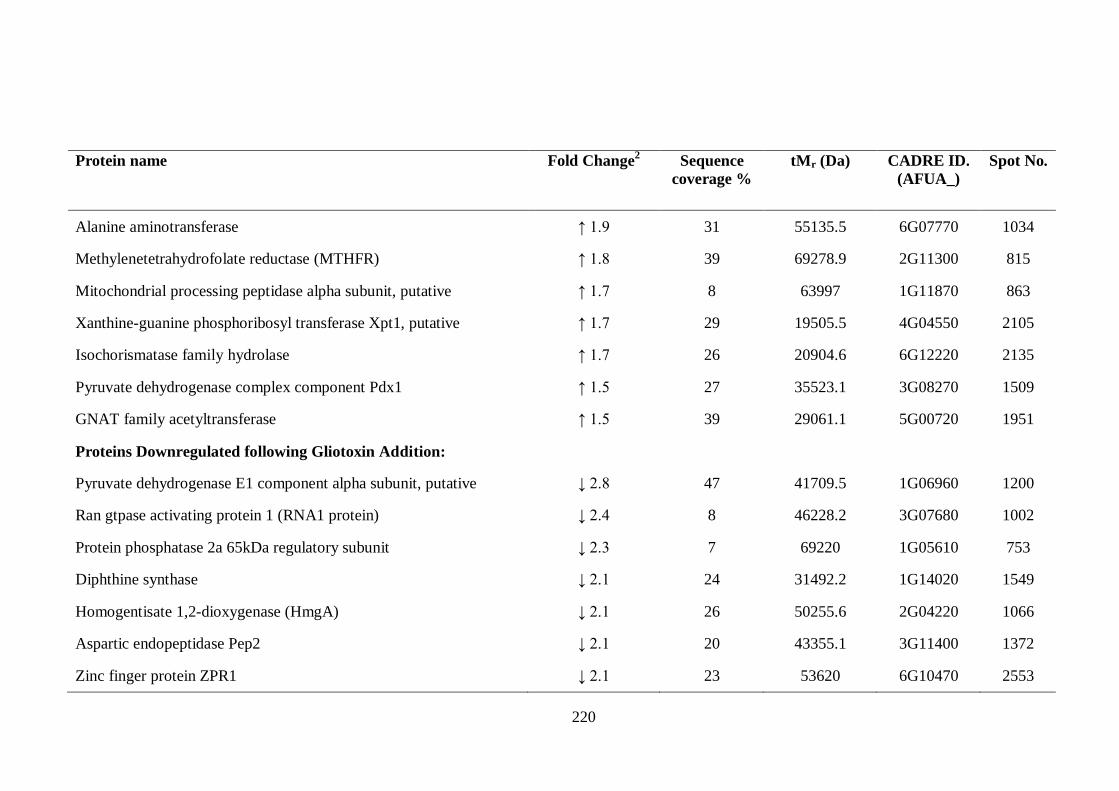
220
Protein name Fold Change2 Sequence
coverage %
tMr (Da) CADRE ID.
(AFUA_)
Spot No.
Alanine aminotransferase ↑ 1.9 31 55135.5 6G07770 1034
Methylenetetrahydrofolate reductase (MTHFR) ↑ 1.8 39 69278.9 2G11300 815
Mitochondrial processing peptidase alpha subunit, putative ↑ 1.7 8 63997 1G11870 863
Xanthine-guanine phosphoribosyl transferase Xpt1, putative ↑ 1.7 29 19505.5 4G04550 2105
Isochorismatase family hydrolase ↑ 1.7 26 20904.6 6G12220 2135
Pyruvate dehydrogenase complex component Pdx1 ↑ 1.5 27 35523.1 3G08270 1509
GNAT family acetyltransferase ↑ 1.5 39 29061.1 5G00720 1951
Proteins Downregulated following Gliotoxin Addition:
Pyruvate dehydrogenase E1 component alpha subunit, putative ↓ 2.8 47 41709.5 1G06960 1200
Ran gtpase activating protein 1 (RNA1 protein) ↓ 2.4 8 46228.2 3G07680 1002
Protein phosphatase 2a 65kDa regulatory subunit ↓ 2.3 7 69220 1G05610 753
Diphthine synthase ↓ 2.1 24 31492.2 1G14020 1549
Homogentisate 1,2-dioxygenase (HmgA) ↓ 2.1 26 50255.6 2G04220 1066
Aspartic endopeptidase Pep2 ↓ 2.1 20 43355.1 3G11400 1372
Zinc finger protein ZPR1 ↓ 2.1 23 53620 6G10470 2553
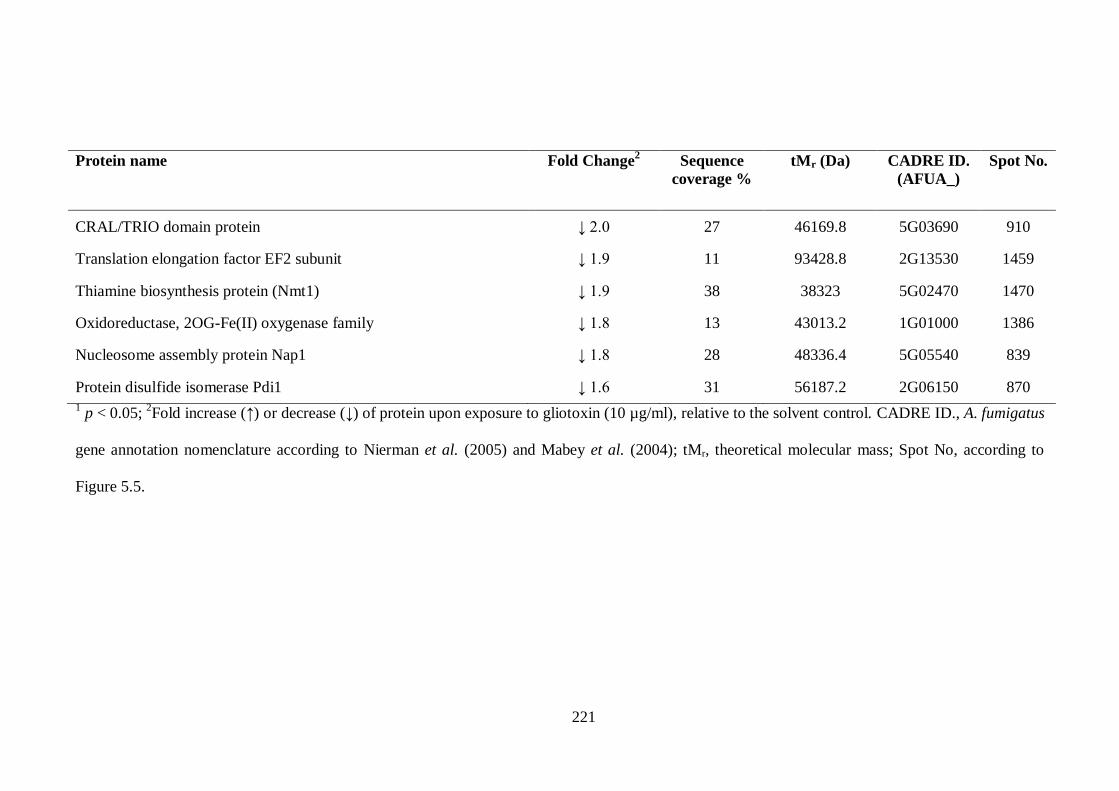
221
Protein name Fold Change2 Sequence
coverage %
tMr (Da) CADRE ID.
(AFUA_)
Spot No.
CRAL/TRIO domain protein ↓ 2.0 27 46169.8 5G03690 910
Translation elongation factor EF2 subunit ↓ 1.9 11 93428.8 2G13530 1459
Thiamine biosynthesis protein (Nmt1) ↓ 1.9 38 38323 5G02470 1470
Oxidoreductase, 2OG-Fe(II) oxygenase family ↓ 1.8 13 43013.2 1G01000 1386
Nucleosome assembly protein Nap1 ↓ 1.8 28 48336.4 5G05540 839
Protein disulfide isomerase Pdi1 ↓ 1.6 31 56187.2 2G06150 870
1 p < 0.05;
2Fold increase (↑) or decrease (↓) of protein upon exposure to gliotoxin (10 µg/ml), relative to the solvent control. CADRE ID., A. fumigatus
gene annotation nomenclature according to Nierman et al. (2005) and Mabey et al. (2004); tMr, theoretical molecular mass; Spot No, according to
Figure 5.5.

222
5.3 Discussion
Exposure of mammalian cells to gliotoxin has been shown to increase the
production of ROS, while H2O2 induces oxidative stress (Pardo et al., 2006). Both
conditions also result in numerous alterations to the proteome of A. fumigatus (Lessing
et al., 2007; Schrettl et al., 2010; Carberry et al., 2012). Co-addition of gliotoxin and
H2O2 to A. fumigatus was expected to result in an additive or synergistic effect, due to
the combination of two inducers of oxidative stress. Paradoxically, phenotypic analysis
described in this Chapter revealed an alternate effect of the co-exposure of A. fumigatus
ATCC26933 and ΔgliK to gliotoxin and H2O2. While A. fumigatus ΔgliK exhibited
significant growth inhibition upon exposure to gliotoxin or H2O2 individually, gliotoxin
was observed to relieve H2O2-induced inhibition in a concentration-dependent manner.
This relief of H2O2-induced stress was also observed in A. fumigatus ATCC26933
indicating that the mechanism involved was not dependent on the disruption of the gliK
gene. Comparative 2D-PAGE identified changes in protein expression associated with
gliotoxin-mediated relief of H2O2-induced stress. Differential expression of 29 protein
spots was observed, upon comparison of the conditions tested (Figure 5.3),
corresponding to 28 unique A. fumigatus proteins (Tables 5.2 and 5.3). Proteins (n = 13)
were differentially regulated following exposure to a combination of H2O2 (2 mM) and
gliotoxin (10 µg/ml), relative to H2O2 (2 mM) alone, and may aid in the elucidation of
the mechanisms involved in gliotoxin-mediated relief of H2O2-induced stress. These
proteins (n = 13) were extracted from Table 5.3 and presented in Table 5.5 for clarity
(Comparison set (v)). Of these, seven proteins showed increased expression and six
showed decreased expression in response to the co-addition of gliotoxin and H2O2,
relative to H2O2 alone. The increased expression of proteins with predicted or
demonstrated oxidoreductase activity in response to gliotoxin and H2O2 in combination,
relative to H2O2 alone, was observed. These proteins included the gliotoxin

223
oxidoreductase GliT, NADH-quinone oxidoreductase (23 kDa subunit) and NADH-
ubiquinone dehydrogenase (24 kDa subunit), with 5.0, 1.8 and 1.5 fold increase in
expression, respectively. Proteins exhibiting a decrease in expression included the
stress-response proteins, Hsp90 and oxidative stress protein Svf1. Proteins (n = 30)
differentially expressed in A. fumigatus ΔgliK following exposure to gliotoxin were
identified, in an effort to characterise the increased sensitivity of the deletion strain to
gliotoxin. Increased expression of 17 unique proteins and decreased expression of 13
proteins was observed in A. fumigatus ΔgliK following incubation with gliotoxin (10
µg/ml) for 4 h (Table 5.4).
The combined effects of gliotoxin and H2O2 were investigated to determine the
effects of co-addition on A. fumigatus. Phenotypic analysis of A. fumigatus ATCC26933
and ΔgliK, grown in the presence of gliotoxin (0 - 10 µg/ml) and H2O2 (0 - 1 mM), was
carried out. While at 1 mM H2O2, growth of A. fumigatus ATCC26933 and ΔgliK were
both significantly inhibited (p < 0.001, respectively), relief of this inhibition was
observed upon growth on a combination of gliotoxin and H2O2. Relief of H2O2-
mediated stress was achieved by gliotoxin in a concentration-dependent manner, with
growth on gliotoxin (10 µg/ml) plus H2O2 (1 mM) exhibiting no significant difference
to growth on gliotoxin (10 µg/ml) alone (Figures 5.1c and 5.2c and d). Choi et al.
(2007) noted that gliotoxin catalysed H2O2 reduction, mediated by the thioredoxin redox
system. The authors proposed that gliotoxin replaces 2-cys peroxiredoxin as an electron
acceptor, in the reduction of H2O2 to H2O in mammalian cells (Figure 5.7). The
inhibition by gliotoxin of H2O2-induced human umbilical vein endothelial cell
(HUVEC) angiogenesis, in a dose-dependent manner, was also observed (Choi et al.,
2007).

224
Figure 5.7: Schematic representation of thioredoxin-dependent H2O2-reducing activity
of gliotoxin. Gliotoxin disulfide can be reduced by thioredoxin-SH groups. From Choi
et al. (2007).

225
Alterations in protein expression after exposure of A. fumigatus ATCC26933 to
a combination of gliotoxin (10 µg/ml) and H2O2 (2 mM) were investigated, relative to
exposure to H2O2 (2 mM) alone (Figure 5.8). The increase in expression of three
proteins involved in oxido-reduction processes was noted, with a fold increase of 5.0,
1.5 and 1.8 observed for the gliotoxin oxidoreductase GliT (AFUA_6G09740), NADH-
ubiquinone dehydrogenase (24 kDa subunit) (AFUA_2G09130) and NADH-quinone
oxidoreductase (23 kDa subunit) (AFUA_1G06610), respectively. The gliotoxin
oxidoreductase GliT is encoded by a member of the gliotoxin biosynthetic cluster (gli)
(Gardiner and Howlett, 2005) and is responsible for the oxidation and reduction of the
disulphide bridge of gliotoxin (Scharf et al., 2010; Schrettl et al., 2010). In addition to a
key role in the gliotoxin biosynthetic process, this action also mediates self-protection
against the harmful effects of gliotoxin (Scharf et al., 2010; Schrettl et al., 2010).
Expression of GliT is induced by the presence of exogenous gliotoxin (Schrettl et al.,
2010; Carberry et al., 2012) and this induction was also observed in this study (Tables
5.2 and 5.3). Increased expression of GliT was detected following exposure to gliotoxin
alone (4.6 fold) and combined with H2O2 (4.7 fold) relative to the solvent control
(Figure 5.4 and 5.5). There was no significant alteration to expression of GliT in
response to H2O2 alone (p > 0.05) and this demonstrates that GliT expression is not
regulated by H2O2 and up-regulation in the co-addition condition is solely a result of
gliotoxin presence. GliT may be involved in the protection of A. fumigatus against
H2O2-induced stress, as induction of expression by gliotoxin, correlates with relief of
H2O2 sensitivity (Figure 5.10). While A. fumigatus ΔgliT is not significantly sensitive to
H2O2, relative to the parent strain (Schrettl et al., 2010), the substantial increase in GliT
expression, as induced by exogenous gliotoxin, may provide a protective mechanism
against H2O2.

226
Table 5.5: Proteins (n = 13) exhibiting significant differential expression1 in A. fumigatus ATCC26933 following the co-addition of gliotoxin and
H2O2, relative to H2O2 alone. Data extracted from Table 5.3 and re-charted for clarity.
Protein Name Co-addition
v Control
(iii)
Co-addition
v Gliotoxin
(iv)
Co-addition
v H2O2
(v)
CADRE ID.
(AFUA_)
Spot No.
Proteins Up-regulated in Co-addition v H2O2
Thioredoxin reductase GliT ↑ 4.7 - ↑ 5.0 6G09740 634
Proliferating cell nuclear antigen (PCNA) ↑ 7.5 ↑ 7.9 ↑ 2.3 1G04900 700
Ran-specific GTPase-activating protein 1 - - ↑ 2.0 5G12180 759
NADH-quinone oxidoreductase (23 kDa subunit) - - ↑ 1.8 1G06610 920
HAD superfamily hydrolase - ↑ 2.4 ↑ 1.6 5G08270 911
Isochorismatase family hydrolase ↑ 1.6 ↑ 1.7 ↑ 1.5 6G12220 821
NADH-ubiquinone dehydrogenase (24 kDa subunit) ↑ 1.8 ↑ 1.8 ↑ 1.5 2G09130 897
Proteins Down-regulated in Co-addition v H2O2
Unknown function protein - - ↓ 2.7 6G03460 887
Molecular chaperone and allergen Mod-E/Hsp90/Hsp1 - - ↓ 2.1 5G04170 924
Oxidative stress protein Svf1 - - ↓ 1.7 5G11820 530
Glutamine amidotransferase:cyclase ↓ 2.0 - ↓ 1.6 2G06230 899
Methylenetetrahydrofolate reductase ↓ 1.6 - ↓ 1.6 2G11300 273
Class V chitinase - - ↓ 1.5 3G11280 548

227
1p < 0.05; Fold increase (↑) or decrease (↓) of protein in the co-additive condition, relative to the solvent control, gliotoxin alone or H2O2 alone. Co-
addition: incubation with both gliotoxin and H2O2. CADRE ID., A. fumigatus gene annotation nomenclature according to Nierman et al. (2005) and
Mabey et al. (2004); Spot No, according to Figure 5.4. Red border indicates proteins (n = 13) differentially regulated in the co-addition, relative to
H2O2 alone.

228
The expression of two additional proteins, involved in the oxidation-reduction
process, was increased in the combined treatment of gliotoxin and H2O2, relative to
H2O2 alone. The NADH ubiquinone dehydrogenase (24 kDa subunit) displayed an
increase in expression during H2O2 and gliotoxin co-addition, relative to the solvent
control (1.8 fold), gliotoxin alone (1.8 fold) and H2O2 alone (1.5 fold) (Table 5.5). This
indicates that expression of this protein is affected by the combination of gliotoxin and
H2O2, but not by the individual treatments. Increased expression of NADH-quinone
oxidoreductase (23 kDa subunit) was also observed following exposure of A. fumigatus
to a combination of gliotoxin and H2O2, relative to H2O2 alone (1.8 fold). Up-regulation
of transcripts of both of these proteins has previously been demonstrated in A. fumigatus
in response to the anti-malarial agent, artemisinin (Gautam et al., 2011). Artemisinins
contain an endoperoxide bridge, essential for mediation of anti-malarial activity
(O’Neill et al., 2010). These up-regulated proteins form part of complex I of the
mitochondrially-located electron transport chain (ETC) and are involved in the
oxidation of NADH from the citric acid cycle to NAD+ (Lin and Guarente, 2003).
Although complex I is actually a source of ROS in the electron transport chain
(Voulgaris et al., 2012), components of the ETP, including the alternative oxidase
AoxA, are involved in fungal resistance to oxidative stress (Grahl et al., 2012).
Additionally, generation of low-levels of ROS can elicit a signalling mechanism that
promotes survival (Trachootham et al., 2008). Alternatively, increased expression of
components of the ETC could be indicative of increased energy requirement due to
recovery of growth in the co-exposure condition (Figure 5.10).
The proliferating cell nuclear antigen (PCNA) exhibited a 2.3 fold increase in
expression following incubation with a combination of gliotoxin and H2O2, relative to
H2O2 alone. Moreover, expression of this protein was also dramatically up-regulated in
the co-addition condition, relative to gliotoxin alone (7.9 fold) and the solvent control

229
(7.5 fold) (Figure 5.8, Table 5.5). This suggests that PCNA is induced by H2O2
(approximately 5 fold) and not by exposure to gliotoxin alone. Clearly, a combination of
H2O2 with gliotoxin leads to further induction of this protein. The PCNA protein forms
a complex around the DNA strand and has a role in the regulation of DNA replication
and repair. Indeed, PCNA is involved in the process of DNA-repair following H2O2-
mediated damage (Burkovics et al., 2009) and acts as an anchor to the DNA template
for binding partners (Zamir et al., 2012). The increase in PCNA expression observed in
response to H2O2, alone or coupled with gliotoxin, may therefore be indicative of H2O2-
induced DNA damage in these conditions. Furthermore, additional induction of PCNA
expression in the co-addition condition relative to H2O2, alone, may account for the
recovery of growth, due to enhanced DNA repair capacity (Figure 5.10). Detection of
DNA damage in each of the conditions tested could deduce whether further induction of
this repair mechanism contributes to the gliotoxin mediated recovery from H2O2-
induced growth inhibition.
Figure 5.8: Fold expression of the proliferating cell nuclear antigen (PCNA) upon
exposure to gliotoxin alone, H2O2 alone and co-addition of gliotoxin and H2O2, relative
to the control.
Control Gliotoxin H2O2 Co-addition

230
The Ran-specific GTPase-activating protein 1 (AFUA_5G12180) is also
significantly induced by growth in gliotoxin combined with H2O2, relative to H2O2
alone (2.0 fold, p < 0.05). This protein did not demonstrate any differential regulation
relative to either the solvent control or gliotoxin treatment alone which may indicate
that expression of this protein is down-regulated in the presence of H2O2 alone, and
expression returns to a basal level upon co-addition of gliotoxin. The Ran-specific
GTPase-activating-protein 1 is involved in the up-regulation of protein degradation
through ubiquitination and also functions in the regulation of nuclear import/export
(Baumer et al., 2000). Depletion of the S. cerevisiae ortholog of this protein, Yrb1,
correlates with cell-cycle arrest, underlining the importance of this protein during
mitosis (Baumer et al., 2000). The level of Ran GTPase-activating protein 1 may
account for the growth inhibition observed in the presence of H2O2 alone, relative to a
combination of gliotoxin and H2O2 (Figure 5.1). The subsequent increase in expression
of this protein upon incubation with gliotoxin and H2O2 in combination coincides with
the recovery from H2O2-induced stress. Thus, the control of factors involved in cell-
cycle regulation may be critical in the gliotoxin-mediated relief of H2O2-induced growth
inhibition.
The increased expression of two hydrolases was also observed in the presence of
gliotoxin and H2O2, relative to H2O2 alone. The isochorismatase family hydrolase was
observed to increase 1.5 fold and the HAD superfamily hydrolase increased 1.6 fold in
this comparison. Additionally, the HAD superfamily hydrolase exhibited increased
expression in the co-addition condition, relative to gliotoxin alone (2.4 fold) (Table 5.5),
indicating that regulation of expression of this protein is affected by both gliotoxin and
H2O2. Isochorismatase family hydrolase catalyses the production of pyruvate and 2,3-
dihydroxybenzoate from isochorismate (Soanes et al., 2008), and orthologs of this
protein were up-regulated in A. niger in response to DTT and in A. oryzae and A.

231
nidulans in response to hypoxia (Guillemette et al., 2007; Terabayashi et al., 2012).
Conversely, the HAD superfamily hydrolase is observed to be down-regulated in A.
fumigatus in response to hypoxic conditions (Vödisch et al., 2011). While no defined
metabolic role has been determined for the HAD superfamily hydrolase in Aspergillus
species, an orthologous protein in Penicillium brasiliensis is necessary for adherence to
host cells and the transcript was up-regulated in the transition from conidia to mycelial
growth phases (Hernández et al., 2010; Ndez et al., 2012). The up-regulation of these
hydrolases, in addition to the other proteins discussed, may mediate the relief of H2O2-
induced stress, and could be further investigated by targeted deletion of the respective
genes.
Proteins involved in the response to cellular stress were observed to undergo a
decrease in expression in the co-addition condition, relative to H2O2 alone. A decrease
in expression of Hsp90 (2.1 fold) and the oxidative stress protein Svf1 (1.7 fold) was
noted. Hsp90 displayed up-regulation in the presence of H2O2 alone, relative to the
solvent control (2.0 fold), with this response reversing upon co-incubation with
gliotoxin. In line with these observations at the proteomic level, the transcript of Hsp90
was also reported to be up-regulated in A. fumigatus in response to exogenous H2O2
(Fraczek et al., 2010). Hsp90 is a stress-induced protein involved in the refolding of
denatured proteins and signal transduction (Fraczek et al., 2010; Franzosa et al., 2011).
The decrease in expression of the Hsp90 may be a result of a decrease in oxidative
stress, correlating with the relief of growth inhibition observed. However Hsp90
transcripts were also noted to decrease during A. fumigatus biofilm growth in a time-
dependent manner (Bruns et al., 2010b). This decrease in expression coincided with an
increase in gliotoxin production by the biofilm and may point to Hsp90 regulation
directly by gliotoxin itself. Quantitative RT-PCR or western blot analysis could be
employed, respectively, to determine if expression or translation of Hsp90, are regulated

232
by gliotoxin. The decreased expression of the Svf1 protein, with a nuclear localisation
and a role in the response to oxidative stress (Brace et al., 2005; Teutschbein et al.,
2010), is also indicative of the attenuation of oxidative stress in the co-addition
condition relative to H2O2 alone (Figure 5.10).
A decrease in expression of the class V chitinase in the presence of a
combination of gliotoxin and H2O2 (1.5 fold) was observed, relative H2O2 alone. This
protein belongs to subgroup A of fungal/bacterial chitinases which are associated with
fungal growth and autolysis (Alcazar-Fuoli et al., 2011; Hartl et al., 2012). The
orthologous A. nidulans protein, ChiB, has demonstrated involvement in the autolysis of
the fungal mycelia in response to stress (Yamazaki et al., 2007). A higher level of
expression of this protein, in the presence of H2O2 alone, may indicate the occurrence of
mycelial autolysis, which could have been stimulated by the presence of oxidative
stress. This autolysis could also account for the growth-inhibited phenotype observed in
the presence of H2O2 alone (Figure 5.1).
Proteins involved in amino acid and nucleotide metabolism underwent a
decrease in expression in the presence of gliotoxin and H2O2 combined, relative to H2O2
alone. Glutamine amidotransferase:cyclase and methylenetetrahydrofolate reductase
both underwent a 1.6 fold decrease in expression, relative to H2O2 alone. Additionally,
expression of these proteins were down-regulated, 2.0 fold and 1.6 fold respectively, in
the co-addition condition, relative to the solvent control. Considering these
observations, H2O2 does not appear to be involved in the regulation of these proteins.
Instead, gliotoxin, either independently or in combination with H2O2, is responsible for
the decrease in expression of these proteins. Glutamine amidotransferase:cyclase
catalyses two steps in the biosynthesis of histidine, producing both a histidine precursor
and 5-aminoimidazole-4-carboxamide ribonucleotide (AICAR), an intermediate of the
purine biosynthetic process, thus linking these pathways (Valerius et al., 2001).

233
Interestingly, a bifunctional purine biosynthetic protein Ade1 was observed to be down-
regulated in the presence of gliotoxin relative to the solvent control (1.7 fold) (Figure
5.9). Conversely, xanthine-guanine phosphoribosyl transferase Xpt1, was observed to
be up-regulated in the presence of gliotoxin and H2O2 combined, relative to the solvent
control (1.9 fold) and gliotoxin alone (1.7 fold), indicating expression of this protein is
influenced by H2O2. Indeed, Lessing et al. (2007) observed an increase in expression of
this protein following exposure to H2O2 for 45 min. The Xpt1 protein is involved in the
salvage pathway of purine nucleotide biosynthesis, whereby XMP and GMP are formed
from their precursors, xanthine and guanine, respectively (Guetsova et al., 1999)
(Figure 5.9). Additionally, Carberry et al. (2012) noted the up-regulation of another
component of the purine salvage pathway, adenine phosphoribosyltransferase, in
response to exogenous gliotoxin. These observations indicate that de novo purine
biosynthesis is down-regulated in the presence of gliotoxin and the alternative salvage
pathway is utilised in its place (Figure 5.9). Methylenetetrahydrofolate reductase forms
part of the methionine biosynthesis pathway, and catalyses the conversion of 5,10-
methylenetetrahydrofolate (THF) to 5,-methylTHF (Sieńko et al., 2007). This provides
a co-substrate for the production of methionine from homocysteine. Together, these
observations underline the influence of gliotoxin and H2O2, either alone or in
combination, on amino acid and nucleotide biosynthesis in A. fumigatus. Furthermore,
while no definitive functions have been demonstrated for the unknown function protein
(AFUA_6G03460), computational analysis has assigned the function of D-alanine-D-
alanine ligase to this protein (www.Aspergillusgenome.org). This protein is observed to
be up-regulated in the presence of H2O2 (2.3 fold), relative to the solvent control, with
expression returned to basal level upon the co-addition of gliotoxin. This extends the
influence of gliotoxin and H2O2 to include alanine metabolism.

234
Figure 5.9: (a) Overview of the regulation of the purine metabolic pathway by gliotoxin
and H2O2, either alone or in combination. Enzymes and pathways undergoing an
increase in expression, relative to the solvent control, are indicated in red and decreased
expression is indicated in green. Metabolites are indicated in black. Ade1, bifunctional
purine biosynthetic protein; Xpt1, xanthine-guanine phosphoribosyltransferase; Apt1,
adenine phosphoribosyltransferase. Enzymes of the histidine and de novo purine
a.
b.

235
biosythesis converging pathways, glutamine amidotransferase:cyclase and Ade1, are
down-regulated in response to gliotoxin. Expression of enzymes involved in the purine
salvage pathways, Xpt1 and Apt1, is up-regulated in the presence of H2O2 and
gliotoxin, repsectively, relative to a solvent control (Lessing et al., 2007; Carberry et al.,
2012). Figure adapted from pathway.yeastgenome.org. (b) Structures of intermediate
molecules in the purine and histidine biosynthesis pathway; 5-aminoimidazole
ribonucleotide (AIR), N-succinyl-5-aminoimidazole-4-carboxamide ribonucleotide
(SAICAR), 5-aminoimidazole-4-carboxamide ribonucleotide (AICAR) and inosine
monophosphate (IMP).

236
Figure 5.10: Outline of factors possibly contributing to the relief of H2O2-induced stress by gliotoxin (cause) and proteins differentially regulated
which reflect the associated relief of stress (effect).

237
Gliotoxin (1-10 µg/ml) significantly inhibited the growth of A. fumigatus ΔgliK,
relative to ATCC26933 wild-type (p < 0.001) (Figures 5.1a and 5.2a). As a member of
the gliotoxin biosynthetic cluster on Chromosome 6 (Gardiner and Howlett, 2005), the
function of the gliK-encoded protein has not yet been definitively reported. Results that
will be discussed in Chapter 6 reveal GliK to be essential for the production of gliotoxin
and disruption of this gene results in impaired efflux of exogenously applied gliotoxin
(Gallagher, 2010; Gallagher et al., 2012). The changes in protein expression in A.
fumigatus ΔgliK, exposed to gliotoxin (10 µg/ml), relative to a solvent control, were
analysed (Table 5.4). Proteins (n = 30) were differentially expressed in A. fumigatus
ΔgliK following incubation with gliotoxin for 4 h. Expression of proteins involved in
translation and amino acid metabolism were altered in the presence of exogenous
gliotoxin, in addition to proteins associated with the endoplasmic reticulum. Regulatory
proteins also displayed significant changes in expression in A. fumigatus ΔgliK
following exposure to gliotoxin, relative to the solvent control (p < 0.05).
Cellular translation appears to be significantly affected by the application of
exogenous gliotoxin to A. fumigatus ΔgliK. The translation elongation factors eEF3 and
G1 displayed a 5.6 and 2.5 fold increase in expression, respectively, following exposure
to gliotoxin, along with the eukaryotic translation initiation factor 3 subunit EifCb (2.7
fold increase). Conversely, the translation elongation factor EF2 subunit was observed
to decrease in expression (1.9 fold), relative to the control. This is an opposing effect to
that observed in the wild-type strain, whereby application of exogenous gliotoxin
resulted in a 1.6 fold increase in expression of EF2, relative to the solvent control. The
contrasting regulation of EF2 in response to exogenous gliotoxin could account for the
differences in sensitivity observed between the growth of A. fumigatus wild-type and
ΔgliK (Figure 5.1). The process of eukaryotic translation begins with the formation of
the 80S ribosome complex at the start codon of mRNA and requires a number of

238
translation initiation factors (Jackson et al., 2010). EifCb is a subunit of eIF3, which in
co-ordination with eIF1, eIF1A and eIF3j, mediates the dissociation of ribosome
complexes following termination of translation. This allows the ribosome subunits to be
recycled for future translation events. The 40S ribosomal subunit retains the bound
initiation factors and forms the 43S pre-initiation complex, which can attach to mRNA
and commence scanning for the start codon (Jackson et al., 2010). This protein is
essential for translation and upon disruption of the ortholog in A. nidulans, sgdA,
germination was impaired (Osherov and May, 2000). The initiation stage of translation
is believed to be the rate-limiting step of the entire process due to its complexity (Arava
et al., 2003). Consequently, the up-regulation of the EifCb protein is indicative of the
escalation of protein synthesis in A. fumigatus ΔgliK in response to exogenous
gliotoxin.
Following translation initiation, aminoacyl-tRNAs (aa-tRNA) are recruited to
the mRNA:80S ribosome complex and the polypeptide chain is extended. The cytosolic
eukaryotic translation elongation factors eEF3 and EF2 were observed to be
alternatively regulated in A. fumigatus ΔgliK in the presence of exogenous gliotoxin,
with a 5.6 fold increase and 1.9 fold decrease in expression noted respectively. The
eEF3 protein is a fungal-specific member of the tranlation elongation process and is
required for the binding of aa-tRNA to the A site and detachment of deacetylated-tRNA
from the E site of ribosomes (Triana-Alonso et al., 1995; Kapp and Lorsch, 2004). This
action is mediated through an interaction with the aa-tRNA transporter, eEF1A, at the
ribosome A site, and ATP hydrolysis activity for the reciprocal control of the E site
(Anand et al., 2003). As eEF1A also exhibits a role in actin binding and bundling, up-
regulation of the eEF3 protein may promote the protein synthesis activity of eEF1A, in
lieu of cytosketeton assembly (Gross and Kinzy, 2005; Anand et al., 2006). While
eEF1A was not observed to be differentially expressed in A. fumigatus ΔgliK following

239
exposure to gliotoxin, a zinc finger protein ZPR1 underwent a decrease in expression
(2.1 fold). The ZPR1 protein binds to eEF1A and regulates transcription and the cell
cycle (Yanaka et al., 2009). ZPR1 competes with eEF1Bα for binding to eEF1A and can
consequently regulate translation elongation in response to growth stimuli (Mishra et
al., 2007). Interestingly, expression of eEF1B is induced in A. fumigatus ATCC26933 in
response to exogenous gliotoxin (Carberry et al., 2012). Reduction in the levels of
ZPR1 in mammalian cells has been shown to negatively affect DNA replication and
transcription, and ultimately leads to cell-cycle arrest (Gangwani, 2006). The ZPR1
transcript is highly induced during A. fumigatus conidial germination (Lamarre et al.,
2008) and down-regulation of this protein may account for the significant growth
inhibition observed in the ΔgliK strain in response to gliotoxin.
Contrary to the up-regulation of eEF3 in response to gliotoxin, a second
elongation factor EF2 was down-regulated in this condition (1.9 fold). EF2 facilitates
the translocation of the tRNA-mRNA complex from the ribosomal A to the P-site and
the P to the E-site, through GTP hydrolysis (Taylor et al., 2007). This action allows
incoming cognate aa-tRNA to occupy the A-site and the process repeats to extend the
polypeptide chain (Figure 5.11). The EF2 transcript has been reported to be down-
regulated during biofilm growth, in a time-dependent manner and correlating with an
increase in gliotoxin production (Bruns et al., 2010b). This may be indicative of the
regulation, either directly or indirectly, by gliotoxin of EF2 expression. The observed
decrease in EF2 expression in gliotoxin exposed-ΔgliK may correlate with a reduced
rate of translation due to disruption of the polypeptide elongation process.
Correspondingly, the down-regulation of two EF2-associated proteins, diphthine
synthase (2.1 fold) and protein phosphatase 2a (PP2A) (65kDa regulatory subunit) (2.3
fold), was also observed in A. fumigatus ΔgliK in the presence of exogenous gliotoxin.
EF2 possesses a unique post-translationally modified histidine residue, diphthamide,

240
which has been shown to be the target of the diphtheria toxin in inactivating eukaryotic
EF2 (Liu et al., 2004). While diphthamide modification of EF2 is not essential for
translational elongation, disruption of this residue has been linked to an increase in
frame-shifting and so is important in maintaining translational fidelity (Ortiz et al.,
2006). The observed reduction in expression of diphthine synthase may be a direct
result of the down-regulation of EF2 as diphthamide is a post-translational modification
(PTM) exclusively found on the EF2 protein (Greganova et al., 2011). A subunit of the
PP2A protein, involved in regulation of EF2 activity was also down-regulated in A.
fumigatus ΔgliK in the presence of gliotoxin. Regulation of EF2 activity is achieved
through phosphorylation, a process mediated by the EF2 kinase and PP2A.
Phosphorylation of EF2 by EF2 kinase results in inactivation of the elogation factor,
while de-phosphorylation, and consequently re-activation, is achieved through the
action of PP2A (Kaul et al., 2011). The presence of PP2A has been demonstrated
previously to be important in S. cerevisiae for resistance to the reducing agent, DTT,
with a null mutant exhibiting increased sensitivity to the dithiol-containing agent (Rand
and Grant, 2006). Decrease in the the amount of PP2A in gliotoxin-treated ΔgliK may
result in negative regulation of EF2 activity and subsequently, a reduction in the rate of
translational elongation. Despite up-regulation of other members of the translational
machinery, decreased copy numbers, activity and fidelity of the EF2 protein could
reduce the overall rate of translation through disruption of the elongation stage. No such
inhibition of translation was noted in the wild-type upon exposure to gliotoxin (Table
5.3) (Carberry et al., 2012), and in fact, up-regulation of EF2 was noted instead. This
may account for the significant growth inhibition noted in A. fumigatus ΔgliK relative to
the wild-type, following exposure to gliotoxin. (Figures 5.1 and 5.2).

241
Figure 5.11: Overview of fungal translation elongation. EF1A and EF3 interact to
deliver aa-tRNA to the A-site of the ribosome and subsequently remove deacetylated-
tRNA from the E-site. Translocation of tRNA-mRNA complexes, from the A and P
sites to the P and E sites respectively, is mediated by EF2. Proteins up-regulated in A.
fumigatus ΔgliK in response to gliotoxin are shown in red, with down-regulated proteins
shown in green. Adapted from Chakraburtty (2001).

242
In addition to translation factors, enzymes involved in the wider protein
synthesis and processing mechanisms were also differentially regulated in A. fumigatus
ΔgliK upon exposure to gliotoxin. An increase in the presence of two independant
protein spots, both identified as cobalamin-independent methionine synthase MetH/D,
was noted (1.9 and 2.2 fold, respectively). MetH/D has been shown to be a target of the
transcriptional activator yap1 in A. fumigatus and expression of this protein is induced
in the presence of oxidative stress (Lessing et al., 2007). In fungi, the production of
methionine from homocysteine is catalysed by MetH/D and in C. albicans this enzyme
has been shown to be essential for cell viability (Suliman et al., 2007). Homocysteine
induces up-regulation of A. nidulans methionine synthase (Kacprzak et al., 2003), in
addition to positive regulation of methylenetetrahydrofolate reductase expression
(MTHFR) (Sieńko et al., 2007). Additionally, significantly increased expression of
MTHFR was observed in gliotoxin-exposed ΔgliK (1.8 fold; p < 0.05) (Figure 5.12).
This is a contrasting scenario to that observed in A. fumigatus wild-type, whereby
down-regulation of MTHFR was noted in response to gliotoxin and H2O2 combined,
relative to the solvent control. These observations may be indicative of elevated
homocysteine levels in A. fumigatus ΔgliK, but not in the wild-type, following exposure
to gliotoxin. High levels of homocysteine can be toxic to the cell, and must be
metabolised to either methionine or cysteine to prevent its detrimental effects (Kacprzak
et al., 2003).
Methionine produced from homocysteine can either be used in protein synthesis
or alternatively enter the methionine cycle, whereby it is metabolised to form S-
adenosylmethionine (SAM) (Suliman et al., 2007). SAM is a ubiquitous cellular methyl
donor and is utilised by methyltransferases for DNA, protein and metabolite
methylation reactions (Grillo and Colombatto, 2008). Indeed, as discussed earlier, SAM
is required for the production of diphthamide though utilisation by diphthine synthase.

243
Figure 5.12: Overview of methionine biosynthesis, coupled with the methyl cycle, in
fungi. Proteins increased in expression in gliotoxin-exposed A. fumigatus ΔgliK are
denoted in red font. GDC, glycine decarboxylase complex; THF, tetrahydrofolate; CH2-
THF, 5,10-methyleneTHF; CH3-THF, 5-methylTHF; MTHFR,
methylenetetrahydrofolate reductase; MetH/D, cobalamin-independent methionine
synthase. Adapted from Suliman et al. (2007).

244
Methionine synthase couples the methyl cycle and the methionine biosynthesis
cycle through the methylation of homocysteine and the subsequent regeneration of
tetrahydrofolate (THF) (Figure 5.12). An additional step in the methyl cycle, involving
the conversion of THF to 5,10-methyleneTHF, is usually catalysed by serine
hydroxymethyltransferase, with the simultaneous metabolism of serine and formation of
glycine (MacFarlane et al., 2008). However, in the presence of excess glycine or a
limited pool of 5,10-methyleneTHF, this step can be catalysed by the mitochondrial
glycine decarboxylase complex (GDC) (Piper et al., 2000). A subunit of this complex,
glycine dehydrogenase, was also noted to increase in expression in A. fumigatus ΔgliK
following incubation with gliotoxin (2.2 fold) and suggests the overall up-regulation of
the methyl cycle in this condition (Figure 5.12).
Alanine aminotransferase catalyses the conversion of pyruvate and L-glutamate
to 2-oxoglutarate and L-alanine in a reversible reaction (Garcia-Campusano et al.,
2009). Subsequently, alanine is ligated to tRNA by alanyl-tRNA synthetase, for use in
translation. Both alanine aminotransferase and alanyl-tRNA synthetase were increased
in expression in A. fumigatus ΔgliK following exposure to gliotoxin (1.9 and 3.0 fold,
respectively), further demonstrating the influence of exogenous gliotoxin on protein
synthesis in A. fumigatus ΔgliK.
Proteins involved in response to stress induced by disulphide bond reducing
agents were also differentially expressed in A. fumigatus ΔgliK following incubation
with gliotoxin. Protein disulphide isomerase Pdi1 and protein phosphatase PP2A
undergo a decrease in expression in A. fumigatus ΔgliK upon exposure to gliotoxin, 1.6
fold and 2.3 fold, respectively. Isochorismatase family hydrolase, also associated with
reductive stress, increased in expression (1.7 fold), in gliotoxin-exposed A. fumigatus
ΔgliK. The reducing agent, dithiothreitol (DTT) efficiently reduces target disulphide
bonds, with the concurrent formation of a stable internal disulphide bond. DTT is often

245
utilised to induce endoplasmic reticulum (ER)-stress in in vitro studies as it elicits the
unfolded protein response (UPR) (Perrone et al., 2005; Rand and Grant, 2006;
Guillemette et al., 2007). Expression of protein disulphide isomerase Pdi1 and
isochorismatase family hydrolase has previously been shown to be increased in A. niger
in the presence of DTT (Guillemette et al., 2007). Additionally, the presence of a point
mutation in the pdi1 gene in S.cerevisiae correlated with a decrease in resistance to
DTT, demonstrating the involvement of Pdi1 in the protection against redox stress
(Gauss et al., 2011). PP2A also has a role in protection against-DTT induced stress as
disruption of the orthologous gene in S. cerevisiae resulted in increased DTT sensitivity
(Rand and Grant, 2006). The regulatory role of PP2A was discussed earlier with regard
to elongation factor 2 EF2. An additional target of PP2A is the anti-apoptotic BCL-2
protein located in the endoplasmic reticulum. Phosphorylated BCL-2 is targeted for
degradation and lower levels of the BCL-2 protein correlate with an increase in
apoptosis associated with ER-stress (Lin et al., 2006) (Figure 5.13a). PP2A regulates
the anti-apoptotic activity of BCL-2 by dephosphorylating it and thus preventing
targeted degradation of this protein (Lin et al., 2006) (Figure 5.13a). These authors also
demonstrated an increase in H2O2-induced apoptosis following disruption of PP2A
expression, and down-regulation of this protein may explain the increased H2O2
sensitivity observed in A. fumigatus ΔgliK. As discussed in Chapter 1, a pro-apoptotic
member of the Bcl-2 family, Bak, is involved in gliotoxin mediated apoptosis of
mammalian cells (Figure 1.8) (Pardo et al., 2006), and points to further involvement of
this group of apoptosis regulators in gliotoxin sensitivity. Protein disulphide isomerase
Pdi1 is associated with the endoplasmic reticulum (ER) and functions in reduction,
oxidation or disulphide-dithiol interchange (Stolf et al., 2011) (Figure 5.13b). Through
these functions, Pdi1 acts as a molecular chaperone and executes the re-folding of
mispaired disulphide containing proteins, forming an integral part of the unfolded

246
protein response (UPR) to ER-stress (Xiao et al., 2004). Consequently, down-regulation
of the Pdi1 and PP2A proteins in gliotoxin-exposed ΔgliK may account for the observed
increase in sensitivity to the redox molecule due to ineffective activation of the UPR.
The UPR is a signalling pathway that is activated upon the detection of an accumulation
of misfolded proteins in the ER, which may elicit toxic effects if not removed (Richie et
al., 2009). A transmembrane protein Ire1p, is responsible for triggering the translation
of a transcription factor Hac1 that regulates the expression of UPR-related genes
involved in folding and secretion (Back et al., 2005). Interestingly, the Ran GTPase
activating protein 1 RNA1 is required for the Ire1p nuclear import and subsequent Hac1
translation (Goffin et al., 2006). The RNA1 protein was reduced in expression in
gliotoxin exposed- ΔgliK which could result in an attenuated UPR in response to ER-
stress.

247
Figure 5.13: Proteins involved in response to ER-stress, downregulated in A. fumigatus
ΔgliK upon exposure to gliotoxin. (a) BCL-2 can be dephosphorylated by PP2A (green)
in the ER and provides anti-apoptotic activity (i). Loss of PP2A activity results in
degradation of phosphorylated BCL-2 (ii) and an associated increase in apoptosis
susceptibility in the presence of death stimuli (e.g. H2O2). (b) Protein disulphide
isomerase (PDI) carries out oxidation, reduction and isomerase reactions to facilitate
correct folding of proteins containing free sulphydrals in the ER. Downregulation of
both PP2A and protein disulphide isomerase is observed in A. fumigatus ΔgliK
following incubation with gliotoxin. Image from Okada et al. (2010).
a.
b.

248
Differential regulation of other ER associated proteins was detected in A.
fumigatus ΔgliK following incubation with gliotoxin. This includes CRAL/TRIO
domain protein and aspartic endopeptidase Pep2, which are down-regulated, and the
vesicular-fusion protein Sec17, which is up-regulated in A. fumigatus ΔgliK in response
to gliotoxin. The CRAL/TRIO domain protein exhibits homology with the S. cerevisiae
Sfh5 protein, which is involved in phosphatidyinositol transfer and is localised in the
peripheral endoplasmic reticulum (Schnabl et al., 2003). Aspartic endopeptidase Pep2 is
enriched in the conidia of A. fumigatus and expression of this protein is further induced
in response to hypoxia and neutrophil exposure (Asif et al., 2006; Sugui et al., 2008;
Teutschbein et al., 2010; Vödisch et al., 2011). The orthologous protein in S.cerevisiae,
Pep4, is processed through the ER and Golgi before maturation and localisation in the
vacuole, where it elicits the maturation of various other hydrolases (Parr et al., 2007).
S.cerevisiae Pep4 is involved in protein degradation following stress and is important
for protein turnover after oxidative damage (Marques et al., 2006). Mutants deficient in
this protein exhibit an increase in ROS accumulation correlating with a higher rate of
apoptosis, underlining the significance of this protein for the maintenance of cellular
homeostasis following the induction of stress (Carmona-Gutiérrez et al., 2011).
Accordingly, the reduction in Pep2 expression, as observed in gliotoxin-exposed ΔgliK,
may potentiate the harmful effects of exogenous gliotoxin. The vesicular fusion protein
Sec17, involved in vesicle-mediated protein transport between the ER and Golgi (Perry
et al., 2009), was up-regulated in A. fumigatus ΔgliK in the presence of gliotoxin. This
may be suggestive of additional protein trafficking, either within the cell or for
secretion, following A. fumigatus ΔgliK exposure to gliotoxin. Overall, these
observations point to the altered systems biology within the ER in A. fumigatus ΔgliK,
following gliotoxin-induced stress. Interestingly, Carberry et al. (2012) noted the up-
regulation of the Cu, Zn superoxide dismutase SOD1, in A. fumigatus in response to
249
exogenous gliotoxin. In yeast, sod1 expression is induced in response to ER stress and,
along with maintenance of NADP(H) levels, is critical for cell survival in this condition
(Tan et al., 2009). No differential expression of SOD1 was noted in gliotoxin-treated
ΔgliK and, in the presence of ER-stress, might be required to reduce levels of
superoxide anions. Elevated superoxide anions, in the absence of SOD1, negatively
affect UPR induction and exacerbate ER-stress (Tan et al., 2009).
A subset of proteins demonstrated altered expression in both A. fumigatus wild-
type and ΔgliK, in response to gliotoxin. Isochorismatase family hydrolase and the
aminopeptidase (AFUA_4G09030) were both observed to undergo an increase in
expression in A. fumigatus wild-type and ΔgliK, exposed to gliotoxin (Tables 5.2 and
5.4) (Carberry et al., 2012). Additionally Carberry et al. (2012) noted the up-regulation
of the β subunit of the mitochondrial processing peptidase (MPP) in gliotoxin-exposed
A. fumigatus wild-type, while increased expression of the MPP α subunit was observed
following A. fumigatus ΔgliK incubation with gliotoxin. Due to the analogous
regulation of these proteins in both wild-type and ΔgliK, in response to gliotoxin, it is
unlikely that they contribute to the change in gliotoxin-sensitivity. Interestingly, some
proteins detected in both A. fumigatus wild-type and ΔgliK following gliotoxin
exposure, were regulated in opposite directions. Differential regulation of these proteins
may account for the altered gliotoxin-sensitivity observed between the wild-type and
ΔgliK strains of A. fumigatus. Methylenetetrahydrofolate reductase (MTHFR), thiamine
biosynthesis protein Nmt1 and elongation factor 2 EF2 displayed differential regulation
in A. fumigatus wild-type compared to ΔgliK in response to gliotoxin. As discussed
earlier expression of MTHFR, involved in the methyl cycle, can be regulated by
homocysteine (Sieńko et al., 2007) and this may suggest higher levels of homocysteine
in A. fumigatus ΔgliK relative to wild-type following exposure to gliotoxin. The activity
of EF2 can be controlled by PP2A, whereby lower levels of this regulatory protein in

250
gliotoxin-exposed ΔgliK could result in a higher amount of phosphorylated, and so
inactive, EF2 (Kaul et al., 2011). In contrast expression of EF2 is increased in A.
fumigatus wild-type in response to gliotoxin. Disruption of translation elongation in
gliotoxin exposed-ΔgliK could explain the respective growth inhibition, relative to the
wild-type. The thiamine biosynthesis protein Nmt1 was up-regulated in A. fumigatus
ATCC26933 in response to gliotoxin (Carberry et al., 2012), while it was down-
regulated in this condition in ΔgliK. Thiamine biosynthesis is self-regulating, with the
presence of excess thiamine eliciting the activation of a riboswitch and consequently
inhibiting the translation of the biosynthesis enzyme (Wachter, 2010). The differential
regulation of this gene in A. fumigatus wild-type compared to ΔgliK, could be an
indirect result of the presence of the pyrithiamine resistance gene (ptrA) in ΔgliK,
incorporated as a selection marker during the generation of the mutant strain (Gallagher,
2010). The ptrA gene codes for an enzyme involved in thiamine biosynthesis, with a
riboswitch that is resistant to the antagonist action of pyrithiamine (Kubodera et al.,
2000). As a result, differential regulation of this protein may result from the
transformation process instead of gliK loss.
Finally, expression of the gliotoxin oxidoreductase GliT was not detected by
comparative 2D-PAGE to be differentially regulated in A. fumigatus ΔgliK in the
presence of gliotoxin. As discussed previously, GliT is involved in protection from
exogenous gliotoxin and the expression of this protein is induced in the presence of the
toxin (Figure 5.4) (Schrettl et al., 2010; Carberry et al., 2012). Furthermore, an increase
in the expression of the gliT transcript was observed in A. fumigatus ΔgliK following
gliotoxin exposure, as was observed for the wild-type strain (Dr. Grainne O’ Keeffe,
personal communication). While transcriptional up-regulation of a gene does not always
correlate with translation, we postulate that this is not the case here. Absence of GliT in
A. fumigatus ATCC26933 has been shown to result in complete growth inhibition in the

251
presence of exogenous gliotoxin (10 µg/ml) (Schrettl et al., 2010). While exogenous
gliotoxin (10 µg/ml) also significantly inhibited the growth of A. fumigatus ΔgliK (p <
0.001), growth was still evident at 63.3 ± 1.67 % (n = 3) of the control. Considering
this, the enhanced sensitivity of A. fumigatus ΔgliK to gliotoxin does not appear to be
caused by the absence of GliT protein. Alternatively, we propose that GliT may be
secreted from the cell in gliotoxin-exposed ΔgliK. Numerous studies, mainly
immunological in nature, have detected GliT in the culture supernatants of A. fumigatus
and antibodies directed against GliT have been proposed for use as an immunological
biomarker of A. fumigatus infection (Kumar et al., 2011; Shi et al., 2012a, 2012b). In
fact, an increase in expression of the vesicular-fusion protein Sec17, in gliotoxin-treated
ΔgliK, could be indictive of this altered secretion. Enhanced secretion of GliT from A.
fumigatus ΔgliK could also account for the observed increase in sensitivity of the A.
fumigatus gliK deletion strain to gliotoxin. Exogenous gliotoxin could be reduced
externally by secreted GliT and mediate some protection from the oxidised molecule.
With lower concentrations of internal GliT than the wild-type, A. fumigatus ΔgliK
would be more susceptible to the cytotoxic effects of any gliotoxin that may be taken up
by the cell. While further analysis on the secretome of A. fumigatus ΔgliK would be
required to prove this hypothesis definitively, this nevertheless represents a positive step
in the characterisation of gliotoxin-induced sensitivity in the gliK mutant.
In summary, the work described in this Chapter illustrates the alteration of A.
fumigatus wild-type and ΔgliK growth in response to the combined stresses of gliotoxin
and H2O2, with the complementary analysis of the resultant proteomic changes.
Gliotoxin was observed to relieve H2O2-induced growth inhibition in both A. fumigatus
wild-type and ΔgliK, in a dose-dependent manner, suggesting a common relief
mechanism in both strains. Comparative proteomic analysis of A. fumigatus wild-type
revealed the up-regulation (n = 7) and down-regulation (n = 6) of proteins upon co-

252
addition of gliotoxin and H2O2, relative to growth on H2O2 alone (≥ 1.5 fold difference,
p < 0.05). Additionally, proteomic analysis of A. fumigatus ΔgliK revealed proteins
undergoing an increase (n = 17) or a decrease (n = 13) in expression upon exposure to
gliotoxin (≥ 1.5 fold difference, p < 0.05). Proteins involved in oxidation-reduction,
DNA repair and cell-cycle regulation were expressed at a higher level in A. fumigatus
wild-type under co-addition conditions, compared to growth in the presence of H2O2
alone. Down-regulated proteins included those typically induced in response to
oxidative stress and an autolysis-associated protein. An increase in selected
oxidoreductase expression in response to gliotoxin, including GliT, may account for the
relief of H2O2-associated oxidative stress. In turn, the observed decrease in stress-
induced proteins is reflective of the absence of oxidative stress in the co-addition
condition. The proteomic response of A. fumigatus ΔgliK following gliotoxin exposure,
revealed the perturbation of translation, amino acid metabolism and proteins associated
with the endoplasmic reticulum (ER). This points to the induction of ER-stress by
gliotoxin in the absence of GliK.
Overall, these proteomic profiles provide an insight into the pathways and
mechanisms involved in the interaction of A. fumigatus with gliotoxin. The systems
altered in response to a combination of gliotoxin and H2O2 have been identified and this
can be utilised to direct future investigations. Targeted gene deletion could elucidate
whether the proteins identified in this study were essential for the gliotoxin-mediated
relief of H2O2-induced growth inhibition (cause), or if their differential regulation was a
down-stream effect of growth recovery (effect). Additionally, the unknown function
protein GliK, has been explored for its role in the interaction of gliotoxin with A.
fumigatus. Mechanisms altered in reposnse to exogenous gliotoxin were identified in
the gliotoxin-sensitive mutant ΔgliK, and may point to the mode of action of gliotoxin
in cells lacking the gliotoxin biosynthetic cluster or GliK orthologs. In Chapter 6, the

253
contribution of GliK to gliotoxin biosynthesis will be investigated and the effect that
deletion of gliK has on the metabolome of A. fumigatus will be determined.

CHAPTER 6
Metabolomic investigation of
A. fumigatus ΔgliK
254
6 Chapter 6
6.1 Introduction
Subsequent to proteomic characterisation of A. fumigatus, comparative profiling
of low molecular mass metabolites can also be used in functional analyses to elucidate
the impact of gene deletion from an organism. As discussed in Chapter 5, deletion of
gliK from A. fumigatus results in increased sensitivity to exogenous gliotoxin and to
H2O2. In order to determine the effect of GliK absence on the metabolite profile, namely
gliotoxin production, a comparative metabolite investigation was carried out. Utilising
RP-HPLC, MALDI-ToF, LC-MS/MS analysis, in addition to chemical modification of
metabolites for enhanced detection and functional group identification, the metabolite
profiles of A. fumigatus ATCC26933 and ΔgliK were analysed and compared.
Culture conditions and sample preparation utilised for metabolite analysis
present a wide opportunity for differential expression and profiling of compounds.
Optimisation of culture media, incubation time, temperature and level of culture
agitation can be used for efficient targeted production of specific metabolites or
alternatively, to profile a range of compounds simultaneously (Dombrink-Kmizman and
Blackburn, 2005; Atalla et al., 2008). A number of groups have optimised production of
secondary metabolites (SM), including mycotoxins and pharmaceutical compounds,
from microorganisms (Feng and Leonard, 1998; Casas López et al., 2003; Dombrink-
Kmizman and Blackburn, 2005; Atalla et al., 2008). Mevinolin and lovastatin, utilised
as competitive inhibitors of cholesterol biosynthetic enzymes, have been effectively
isolated from A. terreus, through selection of appropriate carbon and nitrogen sources
(Casas López et al., 2003; Atalla et al., 2008). The mycotoxin patulin was most
efficiently produced from Penicillium species when cultured in potato dextrose broth
(PDB) supplemented with manganese (Dombrink-Kmizman and Blackburn, 2005). The

255
production of sterigmatocystin by A. nidulans is supported on nitrate as a nitrogen
source while these conditions repress aflatoxin production in A. parasiticus (Feng and
Leonard, 1998; Price et al., 2005), highlighting the importance of culture condition
optimisation for SM analysis. Similarly, sample preparation prior to analysis can also
affect the range of metabolites characterised. Aqueous or organic extractions can target
compounds with varying polarity. While methanol-water mixtures can be utilised for
the extraction of polar compounds, chloroform partitions non-polar (hydrophobic)
compounds for subsequent analysis (Villas-Bôas et al., 2005).
Metabolite analysis methods include RP-HPLC, MS-based methods and thin-
layer chromatography (TLC) (Kosalec et al., 2005; Dettmer et al., 2007; Lee et al.,
2009a; Davis et al., 2011a; Willmann et al., 2011). TLC was traditionally utilised for
separation of metabolites from a range of organisms and can be used analytically or
preparatively, as a purification technique for additional targeted analysis (Frisvad et al.,
2008). RP-HPLC is the favoured chromatography practice for metabolite analysis and
can be used independently or coupled with MS for characterisation of compounds (Lei
et al., 2011). RP-HPLC involves separation of compounds based on their relative
partitioning between a stationary phase (e.g. C18) and a mobile phase (Kazakevich and
LoBrutto, 2007). Optimisation of separation gradients can enable efficient resolution of
multiple metabolites using a single analysis (Sulyok et al., 2007). Bouligand et al.
(2006) utilised an optimised RP-HPLC gradient program for the separation of
glutathione and the main associated precursor molecules, with subsequent confirmation
of identity by MS/MS analysis. MS analysis can be conducted in positive ion or
negative ion mode, with use of both amenable to extended metabolite identification (Lei
et al., 2011). Ion-trap instruments are capable of performing multiple rounds of MS on
selected precursor ions to generate fragmentation patterns, in addition to measuring the

256
mass of the relevant molecule (Dettmer et al., 2007). Neutral losses from the precursor
ions provide information about putative functional groups and may allude to the identity
of the ion (Dettmer et al., 2007). Interpretation of the mass of molecules of interest can
be complicated by the presence of adducts of the ion. Common adducts detected include
H+, Na
+, K
+ and H2O, which alter the observed mass of the molecular ion by a value of
1.003, 21.982, 37.957. or 18.01, respectively (Brown et al., 2009b). Additionally, the
presence of isotopes of elements can augment the observed size of the molecular ion
and correct identification of the monoisotopic peak is essential for accurate mass
determination (Varghese et al., 2012). Another factor for consideration in molecular ion
mass determination is the presence of multiply charged species. Mass spectrometry
measures the mass-to-charge ratio (m/z), and multiplicity of charge can be determined
by analysing the corresponding isotopic peaks. For example, presence of a C13 isotope
in a singly charged molecule will result in an isotopic peak of M + 1, whereas the same
peak on a doubly charged molecule will give M + 0.5 (Brown et al., 2009b). The
phenomenon of dimer formation (2M+H)+ can also result during MS analysis, which
can aid in the validation of correct mass assignment to the molecular ion (Muschik and
Veenstra, 2009). Once a molecular mass has been deduced for the metabolite of interest,
the respective fragmentation pattern generated during electrospray ionisation (ESI) can
be used as a fingerprint for future comparisons with a standard to confirm the assigned
identification (Brown et al., 2009b).
Chemical derivatisation can be used to enhance the characterisation of the
metabolome. Methods utilised include metabolic labelling (e.g., feeding experiments
with labelled precursor metabolites) or chemical labelling (e.g., conjugation of
fluorescent compound) (Halket et al., 2005; Feldberg et al., 2009). Chemical labelling
of the ETP-type toxin, gliotoxin, carried out by Davis et al. (2011b) enabled accurate

257
identification of gliotoxin by RP-HPLC and MS, with increased sensitivity. Reduction
of the disulphide bond of gliotoxin, followed by alkylation of the free sulphydral groups
using 5’-iodoacetamidofluorescein (5’-IAF), produced a di-acetamidofluorescein
derivative (GT-(AF)2) (Davis et al., 2011b) (Figure 6.1). This strategy also effectively
labelled another ETP, sporidesmin A, and resulted in an increase sensitivity of detection
by RP-HPLC, in addition to confirmation of identity through MALDI-ToF analysis.
Additionally, chemical labelling of metabolites can alter the hydrophobicity of
compounds, consequently modifying their retention profile on RP-HPLC analysis. This
process can enable the characterisation and purification of hydrophilic molecules that
are incompatible with RP-HPLC in their native state (Ruhaak et al., 2010).
To date, elucidation of the gliotoxin biosynthetic mechanism has involved the
use of functional genomics, whereby effects of disruption of genes in the gli cluster
have been monitored (Balibar and Walsh, 2006; Bok et al., 2006; Kupfahl et al., 2006;
Scharf et al., 2010, 2011; Schrettl et al., 2010; Davis et al., 2011a). Deletion of a gene
involved in secondary metabolite (SM) biosynthesis could result in accumulation of
intermediates and offer insight into the role of the respective protein in the biosynthetic
pathway (Sanchez et al., 2012). Disruption of the gliG gene, encoding a glutathione-S-
transferase (GST) in A. fumigatus, resulted in the loss of gliotoxin production and the
coincident appearance of an alternative metabolite with m/z 263 (Davis et al., 2011a;
Scharf et al., 2011). These authors independently verified this molecule as an off-
pathway shunt metabolite and identified GliG as the enzyme responsible for thiolation
of the gliotoxin precursor. Similarly, following the deletion of gliT, absence of gliotoxin
production was noted, with the appearance of a molecule corresponding to the m/z of a
monothiol form gliotoxin (Schrettl et al., 2010).

258
Figure 6.1: Chemical structures of (a) gliotoxin, (b) sporidesmin A and (c) proposed
structure of di-acetamidofluorescein gliotoxin (GT-(AF)2).
a.
b.
c.

259
Forseth et al. (2011) subsequently performed comparative metabolomic
profiling of A. fumigatus following the deletion of the transcriptional regulator gliZ,
with the identification of 19 gliZ-dependent metabolites (Figure 6.2). Identification of
gliZ-dependent compounds with varying structural motifs, revealed the extent to which
the gli cluster contributes to the metabolome of A. fumigatus (Figure 6.2).
Our hypothesis was that investigation of the metabolome of the gliK deletion
strain may reveal whether GliK has a role in gliotoxin biosynthesis. Additionally,
alterations to the metabolite profile following deletion of gliK may allude to the
mechanisms associated with the altered phenotypes observed in A. fumigatus ΔgliK
relative to the wild-type. Consequently, the aims of the work presented in this Chapter
were (i) to identify optimal culture conditions for gliotoxin production in A. fumigatus
ATCC26933, (ii) to determine the effect of gliK deletion on gliotoxin production, (iii) to
characterise changes to the intracellular and extracellular metabolome of A. fumigatus
ATCC26933 following deletion of gliK.

260
Figure 6.2: GliZ-dependent metabolites identified from A. fumigatus, demonstrating
intermediate polarity. Novel metabolites are indicated in red. From Forseth et al.
(2011).

261
6.2 Results
6.2.1 Identification of Culture Conditions for Enhanced Gliotoxin Production by
A. fumigatus ATCC26933
In order to comprehensively characterise the effect of deletion of gliK on
gliotoxin production in A. fumigatus, optimal conditions for gliotoxin production were
investigated using A. fumigatus ATCC26933 (wild-type). A. fumigatus wild-type was
inoculated into each of the following media (i - iv) and incubated at 37 °C in the dark at
200 rpm:
(i) YES (Section 2.1.5.11)
(ii) RPMI (Section 2.1.5.12)
(iii) AMM (Section 2.1.5.5)
(iv) Czapek-Dox Broth (Section 2.1.5.9)
Culture supernatants were harvested at 48 and 72 h, and chloroform was used to
perform organic extractions on the supernatants (Section 2.2.4.11). The dried organic
extracts (Section 2.2.4.12) were resuspended in a minimal volume of HPLC-grade
methanol and analysed by RP-HPLC using a 5 to 95 % acetonitrile gradient (Section
2.2.5.1; Table 2.7, Gradient 1). A reference standard of commercially produced
gliotoxin was analysed in tandem.
Gliotoxin was observed to be optimally produced in Czapek-Dox medium
following a culture time of 72 h. Standard gliotoxin was detected at a retention time
(RT) of 13.390 min by RP-HPLC analysis (Figure 6.3a). Equivalent peaks, at retention
times of 13.424 and 13.404 min, were detected from the organic extracts of culture
supernatants collected from Czapek-Dox cultures at 48 h and 72 h respectively (Figure
6.3, b and c). This equates to gliotoxin concentration levels of 5.61 and 11.20 µg/ml, in
culture supernatants collected from Czapek-Dox cultures at 48 h and 72 h respectively.

262
Figure 6.3: RP-HPLC analysis of gliotoxin production by A. fumigatus wild-type in
Czapek-Dox medium. Organic extracts of culture supernatants (48 h and 72 h; 37 °C)
were subjected to RP-HPLC analysis and absorbance was monitored at 254 nm. (a)
Gliotoxin standard (2 µg) elutes at RT = 13.390 min. (b) A. fumigatus ATCC26933
wild-type strain at 48 h secreted gliotoxin (RT = 13.424 min). (c) A. fumigatus
ATCC26933 wild-type strain at 72 h secreted gliotoxin (RT = 13.402 min).
a.
b.
c.

263
6.2.2 Comparative analysis of A. fumigatus ATCC26933, wild-type and ΔgliK,
extracellular metabolites
Organic extracts from A. fumigatus ATCC26933, wild-type and ΔgliK, culture
supernatants were compared by RP-HPLC, MALDI-ToF MS and LC-MS/MS to
determine whether deletion of gliK resulted in an alteration of the extracellular
metabolome. The culture conditions identified in Section 6.2.1, as optimal for gliotoxin
production, were used for extracellular metabolite comparisons.
6.2.2.1 RP-HPLC analysis of organic extracts from A. fumigatus ATCC26933,
wild-type and ΔgliK, culture supernatants
Comparative RP-HPLC analyses were performed on organic extracts from A.
fumigatus ATCC26933, wild-type and ΔgliK,
culture supernatants (37 °C; 72 h;
Czapek-Dox broth). Gliotoxin standards (2 µg; 20 µl) were analysed alongside these
samples and absorbance was monitored at 254 nm (Figure 6.4).
Gliotoxin standard eluted at a retention time of 13.516 min with a peak area of
1423.42. Organic extracts from wild-type supernatants yielded an absorbance (RT =
13.50 ± 0.0044 min) with peak area range of 6433 ± 119.7. This correlated with the
retention time of gliotoxin as deduced by comparison with the commercial standard.
Gliotoxin was not detectable in organic extracts from A. fumigatus ΔgliK culture
supernatants by RP-HPLC (Figure 6.4). A number of peaks were observed to increase in
intensity in culture supernatants from ΔgliK, relative to the wild-type (RT = 13.236,
14.257, 15.207 and 15.676 min) (Figure 6.4). Further analyses were required to
characterise these differentially produced compounds and to confirm the absence of
gliotoxin from ΔgliK culure supernatants.

264
Figure 6.4: Comparative RP-HPLC analysis of organic extracts from A. fumigatus
ATCC26933 wild-type and ΔgliK culture supernatants. Organic extracts of culture
supernatants (72 h; 37 °C, Czapek-Dox broth) were subjected to RP-HPLC analysis and
absorbance was monitored at 254 nm. (a) Gliotoxin standard (2 µg) elutes at RT =
13.516 min with a peak area of 1423.42. (b) A. fumigatus ATCC26933 wild-type strain
secretes gliotoxin with a peak area of 6433 ± 119.7 (RT = 13.502 min). (c) Gliotoxin is
not detectable in culture supernatants of A. fumigatus ΔgliK. An increase in the presence
and intensity of a number of peaks is evident in A. fumigatus ΔgliK (indicated by red
asterix), relative to wild-type.
c.
b.
a.

265
6.2.2.2 Reduction and alkylation of organic extracts from A. fumigatus, wild-type
and ΔgliK, culture supernatants
Further investigation was carried out to determine if gliotoxin was produced by
ΔgliK. Reduction of the disulphide bond of gliotoxin and subsequent alkylation of the
thiol groups with 5’-IAF results in formation of diacetamidofluorescein-gliotoxin (GT-
(AF)2) (Figure 6.1) (Davis et al., 2011b). This compound exhibits a shift in retention
time upon analysis by RP-HPLC, in addition to an increased molar absorptivity relative
to gliotoxin. Reduction of organic extracts of A. fumigatus ATCC26933, wild-type and
ΔgliK, culture supernatants (37 °C; 72 h; Czapek-Dox broth) was carried out using
sodium borohydride (NaBH4) as described in Section 2.2.5.2. Control samples were
prepared in tandem, which omitted the NaBH4-mediated reduction of gliotoxin (non-
reduced (NR) + 5’-IAF). Following 5’-IAF labelling, RP-HPLC analysis was carried
out for the detection of GT-(AF)2 using gradient 2 (Table 2.8) (Figure 6.5).
Gliotoxin displayed an additional peak at retention time of 5.261 min following
NaBH4 reduction and 5’-IAF alkylation (R + 5’-IAF). This represents
diacetamidofluorescein-gliotoxin (GT-(AF)2). An equivalent labelled species was
observed in organic extracts from wild-type culture supernatants (RT = 5.134 ± 0.01325
min) indicating the presence of GT-(AF)2 following reduction and alkylation. No GT-
(AF)2 peak was detected in organic extracts from ΔgliK culture supernatants following
reduction and alkylation, further confirming the absence of gliotoxin from A. fumigatus
ΔgliK.
In addition to RP-HPLC analysis, MALDI-ToF MS was used to determine if
GT-(AF)2 was present in ΔgliK samples (Section 2.2.5.4). MALDI-ToF MS detected a
compound with a molecular mass of 1102.9 Da ((M + H)+), equating to the molecular
mass of GT-(AF)2, in organic extracts from wild-type culture supernatants (Figure

266
6.6a). No equivalent compound was detected in organic extracts from ΔgliK culture
supernatants using this method (Figure 6.6b). Based on RP-HPLC and MALDI-ToF MS
analysis, GT-(AF)2 was not detectable in organic extracts from ΔgliK culture
supernatants, leading to the conclusion that gliotoxin biosynthesis is abolished
following deletion of gliK.

267
Figure 6.5: RP-HPLC analysis of reduced and alkylated organic extracts of A.
fumigatus ATCC26933, wild-type and ΔgliK, culture supernatants. Absorbance
detection at 254 nm is shown for all samples. (a) Gliotoxin standard (2 µg). GT-(AF)2
was detected at RT = 5.261 min. (b) A. fumigatus wild-type. GT-(AF)2 was detected at
RT = 5.160 min. (c) A. fumigatus ΔgliK. No GT-(AF)2 was detected (indicated by the
asterix). R + 5’-IAF, Reduced with NaBH4 and alkylated with 5’-IAF; NR + 5’-IAF,
non-reduced and alkylated with 5’-IAF.
a.
b.
c.

268
Figure 6.6: (a) MALDI-ToF analysis reveals diacetamidofluorescein-gliotoxin (GT-
(AF)2) (m/z 1102.9) (Davis et al., 2011b) following reduction and alkylation of organic
extracts from A. fumigatus ATCC26933 wild-type (b) GT-(AF)2 is not present in
organic extracts of A. fumigatus ΔgliK.
a.
b.

269
6.2.2.3 Analysis of A. fumigatus ATCC26933, wild-type and ΔgliK, metabolite
profiles by LC-MS/MS
Comparative analyses of organic extracts from A. fumigatus ATCC26933, wild-
type and ΔgliK, culture supernatants were carried out by LC-MS/MS (Section 2.2.6.4).
Alignment of total ion chromatographs (TIC) of wild-type and ΔgliK organic extracts
was performed (Figure 6.7) and revealed distinct differences in the relevant metabolite
profiles.
Singly charged ions were not excluded from ESI LC-MS/MS analyses. Organic
extracts of A. fumigatus wild-type and ΔgliK culture supernatants yielded two distinct
spectra on LC-MS/MS analysis (Figure 6.7). Wild-type extracts produced spectra with
dominant peaks between retention times 6.7 and 6.9 min. These peaks are attributable to
the elution of gliotoxin, confirmed by the presence of the precursor ion ((M + H)+ =
327.2) and characteristic product ions ((M + H)+ = 263, 245, 227) (Figure 6.8b)
(Schrettl et al., 2010). LC-MS/MS analysis confirmed the absence of gliotoxin
production, and revealed the presence of metabolites, of (M+H)+ = 394 and 396, which
were significantly more abundant in culture supernatants of A. fumigatus ΔgliK (p =
0.0024, fold difference = 24.1; p = 0.0003, fold difference = 9.6, respectively). These
species ((M+H)+ = 394 and 396) were targeted for MS
2 (Figure 6.8, c and d) and appear
to be related compounds that differ by 2 Da. This relationship is evident by the same
difference between their relative product ion base peaks ((M + H) + = 338 and 340,
respectively). The presence of dimers of these compounds is also noted ((2M + H) + =
787 and 791 respectively. These ions are all singly charged as deduced by interrogating
the isotopic peaks of each compound. This analysis confirms the abolition of gliotoxin
biosynthesis in A. fumigatus following deletion of gliK, and coincides with the
substantial increase in production of two extracellular compounds with (M+H)+ = 394

270
and 396. These compounds may represent stable intermediates of the gliotoxin
biosynthetic process, which accumulate consequent to gliK deletion. Alternatively,
these molecules may be shunt metabolites, formed as a result of the relative instability
of on-pathway intermediates as observed in A. fumigatus ΔgliG (Davis et al., 2011a).

271
Figure 6.7: Total ion chromatographs (TIC) of organic extracts from culture
supernatants of A. fumigatus wild type (black) and ΔgliK (red) cultures as analysed by
LC-MS/MS, (a) in list view and (b) overlaid.
a.
b.

272
(M+H)+ 394.3
(M+H)+ 396.3
(M+H)+ 394.3
(M+H)+ 394.3
6.6 6.8 7.0 7.2 7.4 7.6 7.8 8.0 Time [min]0
2
4
6
7x10
Intens.
Wild-type1 : TIC +All MSn gliK1 : TIC +All MSn
316.2356.3
394.3
732.2 823.3
412.3
8.
+MS, 6.7min #357
310.1356.1
394.2
8.
+MS2(412.9), 6.7min #354
316.2356.3
412.3
732.2 823.3
394.3
9.
+MS, 6.7min #357
224.0 259.0
310.1
336.2 366.2
9.+MS2(394.9), 6.7min #355
0
2
4
6x10
Intens.
0
2
4
6x10
0
2
4
6x10
0
1
2
6x10
200 300 400 500 600 700 800 m/z
263.3
245.3227.4
327.2
263.0
245.0227.0
MS 6.8 min
MS2 (327.6)
Intens
x107
(M+H)+(2M+H)+
MS2 (394.9)
MS 7.1 min
787.3
366.2
338.1
(2M+H)+
MS2 (396.3)
(M+H)+
(2M+H)+
MS2 (396.3)
MS 6.9 min
791.2
340.1
396.3
m/z
394.3
m/z
m/z
327.2
394.3
396.3
Figure 6.8: (a) Total ion chromatograph (TIC) of organic extracts from wild-type
(black) and ΔgliK (red) culture supernatants, overlaid. (b) Gliotoxin (m/z = 327.2) was
identified in the mass spectra from the wild-type culture supernatant but was not found
in the ΔgliK culture supernatants. Comparative profiling identified compounds (m/z =
394.3; 396.3) that were present at higher amounts in organic extracts of ΔgliK, relative
a.
b.
c.
d.

273
to wild-type culture supernatants. Mass spectra from the molecular species (c) m/z =
394.3 and (d) m/z = 396.3 are shown. Selected precursor ions from MS are indicated in
red text, with resultant MS2 spectra included directly below.

274
6.2.3 Comparative analysis of A. fumigatus ATCC26933, wild-type and ΔgliK,
intracellular metabolites
Following on from the observation in Section 6.2.2, that deletion of gliK results
in the loss of gliotoxin production from A. fumigatus, comparative analysis of the
intracellular metabolome was undertaken. Lysates from A. fumigatus ATCC26933,
wild-type and ΔgliK mycelia were analysed by RP-HPLC and LC-MS/MS to determine
whether ΔgliK exhibited an altered intracellular metabolome. The culture conditions
identified in Section 6.2.1, as optimal for gliotoxin production, were used for
extracellular metabolite comparisons.
6.2.3.1 Analysis of intracellular A. fumigatus ATCC26933, wild-type and ΔgliK,
metabolite profiles by RP-HPLC
Mycelia from A. fumigatus ATCC26933, wild-type and ΔgliK, were harvested at
72 h, following growth in Czapek-Dox broth at 37 °C (Section 2.1.5.9). Protein extracts
were prepared using non-reducing lysis buffer (Section 2.1.5.18, 2.2.2.1). Small-scale
organic extractions were performed in the protein lysates and comparative RP-HPLC
analyses were carried out on the resultant organic extracts from A. fumigatus
ATCC26933 and ΔgliK (Figure 6.9). RP-HPLC analysis revealed no substantial
differences between the metabolic profile of the organic extracts from wild-type and
ΔgliK mycelial lysates (Figure 6.9). Consequently, additional investigation was required
to determine any differences between the intracellular metabolome of ΔgliK relative to
wild-type.

275
Figure 6.9: Comparative RP-HPLC analysis of organic extracts from A. fumigatus
ATCC26933 (a) wild-type and (b) ΔgliK mycelial lysates. Absorbance was monitored at
254 nm.
a.
b.

276
6.2.3.2 Quantitation of free sulphydrals present in lysates from A. fumigatus,
wild-type and ΔgliK, mycelia
The quantity of free sulphydral groups present in mycelial lysates of A.
fumigatus wild-type and ΔgliK, was measured using an Aldithiol-4® titration (Section
2.2.5.4). Aldithiol-4® measures the concentration of free thiols in a sample, but does
not distinguish between thiols from proteins or small molecular mass metabolites.
Control samples, consisting of the non-reducing lysis buffer (Section 2.1.5.18) were
subjected to titration with Aldrithiol-4®, and used to determine baseline absorbance
changes. The concentration of total free sulphydrals (of proteinaceous or non-
proteinaceous origin) per mg of protein was significantly higher in the A. fumigatus
ΔgliK lysates compared to the wild-type (p = 0.0028; n = 3; fold difference = 2.2)
(Figure 6.10). This result signifies the presence of elevated intracellular thiols in ΔgliK,
which may be related GliK absence.
Figure 6.10: Relative concentration of free sulphydral groups per unit of protein
(SH/mg protein). Concentration of free sulphydral groups, relative to protein
concentration, in lysates of A. fumigatus ΔgliK (grey) is significantly higher than wild-
type (black) (p = 0.0028; n = 3; fold difference = 2.2).
**

277
6.2.3.3 Alkylation of lysates from A. fumigatus, wild-type and ΔgliK, mycelia
Based on the observation of a significantly higher concentration of sulphydrals
in mycelial lysates of A. fumigatus ΔgliK, relative to wild-type, further investigation
was carried out. Mycelial lysates, were examined for the presence of free sulphydrals or
disulphide bonds, using reduction and alkylation as described in Section 2.2.5.2 (Davis
et al., 2011b). Non-reduced samples were prepared concurrently, without NaBH4-
mediated reduction prior to alkylation with 5’-IAF (NR + 5’-IAF). RP-HPLC analysis
was carried out to assess any differential alkylation that occurs as a result of the deletion
of gliK.
Reduction and subsequent alkylation of protein lysates with 5’-IAF (R + 5’-
IAF), revealed two peaks in each sample at RT = 12.07 ± 0.001732 (n = 3) and 14.07 ±
0.002186 (n = 3) min (Figure 6.11). These peaks were attributable to un-reacted 5’-IAF,
as deduced by comparison with the control sample. An additional peak, not present in
the control sample, was detected in both wild-type and ΔgliK at RT = 11.71 ± 0.003 min
(n = 6) and was indicative of a 5’-IAF labelled compound (Figure 6.11). An equivalent
absorbance was observed in the non-reduced A. fumigatus lysates, following 5’-IAF
labelling (NR + 5’-IAF) at RT = 11.72 ± 0.0115 min (n = 6) (Figure 6.12). This signifies
that the 5’-IAF labelled compound contains at least one free sulphydral group as
reduction was not required prior to alkylation with 5’-IAF. This 5’-IAF labelled
intracellular compound, termed AF11.7, was present at significantly higher levels in
ΔgliK compared to wild-type (p = 0.0343; n = 6; 5.7 fold difference) based on the
relative peak areas from RP-HPLC analysis. An increase in the intracellular
concentration of this sulphydral containing metabolite in ΔgliK, correlates with the
observations from Aldrithiol-4® titrations (Section 6.2.3.2). Fractionation was utilised

278
to purify the 5’-IAF labelled compound, from both wild-type and ΔgliK for further
characterisation by LC-MS/MS.
Figure 6.11: RP-HPLC analysis of A. fumigatus ATCC26933, wild-type and ΔgliK,
mycelial lysates, with NaBH4-mediated reduction prior to 5’-IAF labelling (R + 5’-
IAF). Absorbance detection at 254 nm is shown for all samples. (a) Lysis buffer control
R + 5’-IAF. Unreacted 5’-IAF was detected at RT = 12.067; 14.069 min. (b) A.
fumigatus wild-type R + 5’-IAF. A 5’-IAF labelled metabolite (AF11.7) eluted at RT =
11.714 min (red arrow). (c) A. fumigatus ΔgliK R + 5’-IAF. A 5’-IAF labelled
metabolite (AF11.7) eluted at RT = 11.708 min (red arrow), with a substantially higher
intensity than observed in wild-type. R + 5’-IAF, Reduced with NaBH4 and alkylated
with 5’-IAF.
a.
b.
c.

279
Figure 6.12: Overlaid RP-HPLC analysis of A. fumigatus ATCC26933 wild-type
(black) and ΔgliK (red) mycelial lysates, with no reduction prior to 5’-IAF labeling (NR
+ 5’-IAF). A 5’-IAF labelled metabolite, eluted at RT = 11.706 min (AF11.7; red
arrow), and was present at significantly higher amounts in A. fumigatus ΔgliK than in
wild-type (p = 0.0343). Unreacted 5’-IAF was detected at RT = 12.068; 14.074 min
(indicated by asterix). Absorbance detection is shown at 254 nm. NR + 5’-IAF; non-
reduced and alkylated with 5’-IAF.
a.
AF11.7

280
6.2.3.4 LC-MS/MS analysis of 5’-IAF labelled intracellular metabolite
In order to ascertain the molecular mass of the 5’-IAF labelled metabolite
purified from A. fumigatus wild-type and ΔgliK mycelial lysates in Section 6.2.3.3, LC-
MS/MS was carried out. To facilitate LC-MS/MS analysis, fractions corresponding to
AF11.7 were collected following RP-HPLC of alkylated mycelial lysates (Section
6.2.3.3). Fractions were dried to completion and resuspended in 10 % (v/v) methanol,
0.1 % (v/v) formic acid (Section 2.1.3.9). A control sample, consisting of the equivalent
fraction from alkylation of the lysis buffer was also analysed. The ubiquitous
monothiol, glutathione (GSH), was also subjected to alkylation with 5’-IAF and the
resultant labelled molecule was also fractionated and analysed by LC-MS/MS.
Total ion current (TIC) chromatographs of the fractions from wild-type and
ΔgliK 5’-IAF labelled lysates, each display two peaks at retention times between 5.9
and 6.0 min (Figure 6.13a). These peaks are both attributable to a compound with
(M+H)+ = 617.3 (Figure 6.13b). This compound is present at significantly higher levels
in the ΔgliK (NR + 5’-IAF) relative to the wild-type lysates (p < 0.001; n = 6; fold
difference = 4.96), as observed previously by RP-HPLC (Figure 6.12). No equivalent
compound was detected in the control samples. A number of doubly charged molecular
species were detected ((M+2H)2+
= 309.2, 287.2), formed as a result of double
protonation of the molecular ion ((M+H)+ = 617. 3) or of product ions ((M+H)
+ =
573.3) respectively (Figure 6.13b). MS2 fragmentation of selected precursor ions is
shown (Figure 6.13c). Notably, alkylation of GSH with 5’-IAF produces a compound
with (M+H)+ = 695.3 (Figure 6.13d), as would be predicted based on the theoretical
molecular mass of acetamidofluorescein-glutathione (GS-AF). Importantly, this
excludes GSH as a candidate for the elevated, monothiol, intracellular metabolite.

281
CONTROL LYSIS BUFFER 11_12 MIN 1_10.D: TIC +All MSn
GLIK LYSATE 11MIN 1_10.D: TIC +All MSn
WT LYSATE 11MIN 1_10.D: TIC +All MSn
0
1
2
3
4
7x10
Intens.
8
0
2
4
6
x10
0
1
2
8x10
4.0 4.5 5.0 5.5 6.0 6.5 7.0 7.5 8.0 8.5Time [min]
ΔgliK lysate NR 5’ IAF: TIC +All MSn
GSH NR 5’IAF: TIC +All MSn
0
2
4
6
8
8x10
Intens.
0
1
2
3
4
5
8x10
4.0 4.5 5.0 5.5 6.0 6.5 7.0 7.5 Time [min]
x106
x108
x108
x107
Time [min]4.0 4.5 5.0 5.5 6.0 6.5 7.0 7.5
GSH 5’ IAF: TIC +All MSn
ΔgliK lysate 5’ IAF: TIC +All MSn
WT lysate 5’ IAF: TIC +All MSn
Control lysis buffer 5’ IAF: TIC +All MSn
MS2 (287.5)
MS2 (309.3)
MS2 (617.7)
MS 5.9 min
287.3309.2
617.3
573.3
530.2
558.1
287.2
257.5
257.5
514.3388.1348.2
185.0
m/z
2+
2+
2+2+
1+
MS (6.1 min)
Compound 2
695.3
1+
283.6
348.22+
2+
MS2 (695.7)566.2
422.1
m/z
a.
b.
c.
d.

282
Figure 6.13: (a) Total ion chromatograph (TIC) of the 11-12 min fraction from RP-
HPLC analyses of 5’-IAF labelled mycelia lysates of A. fumigatus ATCC26933 wild-
type (black) and ΔgliK (red). The equivalent fraction from 5’-IAF labelling of GSH
(blue) and lysate buffer (green), are also shown. (b) Mass spectra of the compounds
observed at retention times of 5.9-6.0 min, from each of the A. fumigatus samples,
revealed a singly charged molecule with (M+H)+ = 617.3 along with two doubly
charged molecules with m/z = 309.2 and 287.3 respectively. These compounds were not
found in the mass spectra of the 5’-IAF labelled buffer control or GSH. (c) MS2
analyses of each of these three ions was carried out. (d) Mass spectra of the compound
observed at retention times of 6.0-6.2 min in the 5’-IAF labelled GSH samples revealed
a singly charged molecule with (M+H)+ = 695.3, correlating to acetamidofluorescein-
glutathione, along with two doubly charged molecules with m/z = 348.2 and 283.6.

283
The mass of the 5’IAF labelled precursor ion ((M + H)+ = 617.3; M = 616.3) is
partially attributable to the conjugated fluorophore and this was deducted to determine
the mass of the original metabolite. The molecular mass of the labelled molecule (m/z
617.3) indicates that the metabolite contains a single free thiol group, as each
acetamidofluorescein moiety contributes 388.3 Da to the overall mass. Alkylation with
5’-IAF (Mr = 515.2 Da), results in derivatisation of a thiol group (-SH) with
acetamidofluorescein, and the concurrent loss of hydrogen iodide (HI; Mr = 127.9 Da).
The mass of the intracellular, monothiol metabolite was 229 Da (M229), as deduced by
subtracting the acetamidofluorescein moiety from the precursor mass (616.3 - (515.2 -
127.9)).
The mass of this metabolite, combined with the presence of a single thiol, did
not correlate with any metabolites characterised from A. fumigatus and also did not
yield an identification from any well cited or extensively studied fungal metabolites.
This lack of prior identification in A. fumigatus may have stemmed from the difficulty
associated with purification of the native metabolite due to the hydrophilic nature of the
molecule. Chemical derivatisation of M229 with 5’-IAF was required in order to impart
hydrophobicity to the compound and enable subsequent purification and
characterisation using RP-HPLC. The fragmentation pattern observed for the 5’-IAF
labelled metabolite (AF11.7) included a neutral loss of 44 (617.3 - 573.3), a neutral loss
of 59 (573.3 - 514.3) and a neutral loss of 126.2 (514.3-388.1) (Figure 6.13). Extensive
analysis of the literature lead to the identification of a selenium (Se) -containing
compound, selenoneine, with a m/z of 278 (Yamashita and Yamashita, 2010).
Selenoneine is a selenium analogue of a sulphur-containing molecule, ergothioneine
(EGT). Ergothioneine (C9H15N3O2S) is a hydrophilic molecule which possesses a
molecular mass of 229 Da, and exists as a tautomer of a thiol and thione form (Figure

284
6.14). Additionally, the fragmentation pattern observed for AF11.7 corresponds with
that reported for ergothioneine, upon deduction of the mass of the acetamidofluorescein
moiety (Nikodemus et al., 2011; Tepwong et al., 2012). The identified neutral loss of 44
(617.3 - 573.3) corresponded to the loss of COO-, neutral loss of 59 (573.3 - 514.3)
corresponded to N(CH3)3+ and a neutral loss of 126.2 (514.3-388.1) corresponded to
C5N2H6S (Figure 6.14). The identification of the 5’-IAF labelled metabolite as
ergothioneine was thus confirmed based on: (i) agreement between predicted molecular
mass of 5’-IAF labelled metabolite and ergothioneine (both 229 Da), (ii) presence of a
single thiol group, (iii) hydrophilic nature and (iv) fragmentation pattern evidence
(Yamashita and Yamashita, 2010). To my knowledge this is the first identification of
ergothioneine in A. fumigatus. This analysis confirmed the presence of elevated levels
of ergothioneine in A. fumigatus ATCC26933 following deletion of gliK.

285
Figure 6.14: (a) Chemical structure of (i) acetamidofluorescein ergothioneine (ERG-
AF), and two of the product ions generated fom MS/MS (ii, iii). The
acetamidofluorescein moiety is indicated in red. (b) The thiol (i) and thione (ii)
tautomers of ergothioneine. Image from (Gallagher et al., 2012).
(i) (ii)
a.
b.

286
6.3 Discussion
The work presented in this Chapter involved the characterisation of the
metabolome of A. fumigatus following deletion of gliK from the gli cluster (Gardiner
and Howlett, 2005; Gallagher et al., 2012). Most significantly, deletion of gliK resulted
in the abolition of gliotoxin production. Absence of gliotoxin in ΔgliK coincided with
the significantly elevated levels of two metabolites ((M + H)+ = 394 and 396), which
contained no detectable free sulphydrals or disulphide bonds. These compounds may
represent shunt metabolites or intermediates from the gliotoxin biosynthetic pathway.
Intracellular free sulphydral levels were significantly higher in A. fumigatus ΔgliK,
relative to wild-type. This was attributable to the significantly increased concentration
of intracellular ergothioneine (EGT; C9H15N3O2S) in A. fumigatus ΔgliK, relative to the
parent strain, and represents the first identification of ergothioneine in A. fumigatus.
Alteration in the intracellular ergothioneine levels may provide insight into the role of
GliK in A. fumigatus.
To date, the function of GliK in gliotoxin biosynthesis is unknown. Deletion of
gliP, gliZ, gliI, gliG and gliT, corresponding to an NRPS, a transcription factor, a
carbon-sulphur lyase, a glutathione-S-transferase and a gliotoxin oxidoreductase
respectively, has resulted in the abrogation of gliotoxin production (Bok et al., 2006;
Cramer et al., 2006; Kupfahl et al., 2006; Scharf et al., 2010, 2011, 2012a; Schrettl et
al., 2010; Davis et al., 2011a; Forseth et al., 2011). In order to accurately distinguish
between gliotoxin production in A. fumigatus ATCC26933, wild-type and ΔgliK,
conditions were identified for optimal gliotoxin production in ATCC26933. Culture in
Czapek-Dox broth resulted in high gliotoxin yields at 48 h, with further increase in
gliotoxin detected at 72 h. Gliotoxin, detected by RP-HPLC, was present in 48 h culture
supernatants of ATCC26933 wild-type at a concentration of 5.61 µg/ml and this rose to

287
11.20 µg/ml at 72 h. Based on these observations, gliotoxin production in ΔgliK was
analysed relative to wild-type following culture in Czapek-Dox for 72 h. RP-HPLC of
organic extracts from culture supernatants revealed a dramatically altered metabolite
profile in ΔgliK, compared to wild-type. This profile indicated the absence of gliotoxin
in ΔgliK and also revealed the coincident increase in intensity of a number of other
peaks. Reduction and alkylation with 5’-IAF was employed to increase the sensitivity of
gliotoxin detection by RP-HPLC and MALDI-ToF (Davis et al., 2011b). Overall, no 5’-
IAF labelled gliotoxin (GT-(AF)2) was detected by RP-HPLC or MALDI-ToF in ΔgliK,
while this compound was identified from wild-type (Figures 6.5 and 6.6). Further
confirmation of gliotoxin absence from culture supernatants of ΔgliK, was provided by
LC-MS/MS. Abolition of gliotoxin production following deletion of gliK, implies a role
for GliK in the gliotoxin biosynthesis pathway (Gallagher et al., 2012).
In the absence of gliotoxin production in ΔgliK, two hydrophobic metabolites
were detected by LC-MS/MS with (M + H)+ = 394 and 396. While low levels of these
compounds were detectable in culture supernatants from A. fumigatus wild-type,
significantly higher levels were present in ΔgliK (p = 0.0024, fold difference = 24.1; p =
0.0003, fold difference = 9.6, respectively). These compounds appeared to be related,
based on analogous fragmentation patterns, producing product ions with (M + H)+ =
338 and 340, respectively. This 2 Da difference in compounds can sometimes be
attributable to the presence of an oxidised (S-S) or reduced ((-SH)2) disulphide bond.
However, reduction and alkylation of these samples did not detect the presence of a
disulphide bond or free sulphydrals. Interestingly, organic extracts from ΔgliK culture
supernatants produce no growth inhibitory effects on A. fumigatus wild-type, while
wild-type extracts significantly inhibited radial growth of ΔgliK (Gallagher et al., 2012).
The growth inhibition associated with wild-type extracts, correlates with the enhanced

288
sensitivity of ΔgliK to gliotoxin. The elevated levels of the m/z 394 and 396
extracellular metabolites in ΔgliK did not produce growth inhibitory effects in A.
fumigatus wild-type, indicating these compounds are not auto-toxic. These extracellular
compounds, possessing higher molecular mass(es) than gliotoxin, could represent off-
pathway shunt metabolites of gliotoxin production. Deletion of gliG from A. fumigatus
has been shown to abolish gliotoxin biosynthesis, with the coincident production of a
shunt metabolite, 6-benzyl-6-hydroxy-1-methoxy-3-methylene-piperazine-2,5-dione
(Davis et al., 2011a). Interestingly, these external metabolites (m/z 394-396) were
absent from the culture supernatants of ΔgliG, indicating that production of m/z 394-396
is GliG-dependant (Gallagher et al., 2012). This is indicative of GliK functionality
occurring after GliG in the gliotoxin biosynthetic pathway as evidenced by the
accumulation of these GliG-dependent products in the gliK deletion strain (Figure 6.15).
In order to ascertain whether these extracellular metabolites were shunt metabolites or
on-pathway biosynthetic intermediates, preliminary feeding experiments were carried
out. These consisted of the addition of ΔgliK metabolites (m/z 394-396) to wild-type
lysates, however no conversion of the extracellular metabolites to gliotoxin was
detected. Interestingly, these compounds (m/z 394-396) did not correlate to any of the
masses attributable to gliZ dependent metabolites identified by Forseth et al. (2011).
Differential profiling of the intracellular metabolome of A. fumigatus
ATCC26933, wild-type and ΔgliK¸ was carried out to characterise changes resulting
from the deletion of gliK. Initially, examination of organic extracts from mycelial
lysates presented no substantial changes to the internal metabolite profile, as determined
by RP-HPLC (Figure 6.9). As this analysis was limited to non-polar intracellular
compounds, further investigation was performed using aqueous mycelial extracts of
wild-type and ΔgliK.

289
Figure 6.15: Schematic of the mechanistic positioning of GliG preceding GliK in the
gliotoxin biosynthetic pathway. In A. fumigatus wild-type, the presence of both GliG
and GliK results in the production of gliotoxin. Gliotoxin production is abolished in
ΔgliK, with the concurrent accumulation of m/z 394/396. Deletion of gliG also results in
the loss of gliotoxin production, in addition to the loss of m/z 394/396. This indicates
that the production of m/z 394/396 is dependent on the presence of GliG. It is yet
unclear whether m/z 394/396 are on-pathway intermediates of the gliotoxin biosynthetic
process or shunt metabolites.

290
Aldrithiol-4® titrations, to detect total free thiols, revealed a significant increase
in the concentration of free sulphydral groups in mycelial lysates of ΔgliK compared to
wild-type (p = 0.0028) (Figure 6.10). A fold increase of 2.2 was observed in the total
free sulphydral concentration, relative to protein, in A. fumigatus ΔgliK. The
consequences of elevated levels of free sulphydrals in ΔgliK may alter the cellular redox
potential (Murray et al., 2011). The converse may also be true, with a perturbation in
the redox status of ΔgliK, resulting in the increase in intracellular free thiols. This
disturbance could affect processes such as transcriptional regulation (Murray et al.,
2011), and may account for the distinct proteomic profiles of A. fumigatus wild-type
and ΔgliK following gliotoxin treatment (Chapter 5).
Comparative RP-HPLC analysis of aqueous mycelial extracts from A. fumigatus
wild-type and ΔgliK did not reveal any detectable differences due to relatively large
proportion of hydrophilic compounds present. These hydrophilic molecules were not
retained by the C18 column and eluted prior to the gradient. In order to investigate the
observed variance in sulphydral content between wild-type and ΔgliK mycelial extracts,
alkylation with 5’-IAF was utilised (Davis et al., 2011b). This strategy ultimately
revealed significantly elevated levels of ergothioneine in A. fumigatus ΔgliK (p =
0.0343; n = 6; fold difference = 5.7). The identification of ergothioneine was supported
by multiple factors, outlined in Table 6.1. Significantly, this represents the first
identification of ergothioneine in A. fumigatus.

291
Table 6.1: Factors contributing to the identification of 5’-IAF labelled metabolite (AF11.7) as ergothioneine
5’-IAF labelled metabolite Ergothioneine
Molecular mass: 229 Da 229 Da
Number of free thiol groups 1 1
Exists as a thione-thiol tautomer
Physical properties Hydrophilic Hydrophilic
MS fragmentation pattern: Neutral loss: 44 (COO-)
Neutral loss: 59 (C(NH3)3)
Neutral loss: 126 (C5N2H6S)
Neutral loss: 43.9862 (COO-)
Neutral loss: 59.0733 (C(NH3)3)
Neutral loss: 126.03 (C5N2H6S)
Fragmentation pattern of ergothioneine taken from Tepwong et al. (2012).

292
Ergothioneine is a sulphur-containing derivative of histidine, produced by fungi
and mycobacteria (Figure 6.14) (Paul and Snyder, 2010; Seebeck, 2010; Bello et al.,
2012). Ergothioneine is a tautomer and predominantly exists in the thione at
physiological pH rather than the thiol form (Figure 6.14) (Hand et al., 2005; Paul and
Snyder, 2010). The existence of ergothioneine as a thione imparts additional stability to
the metabolite (Jayaram et al., 2008). Consequently, ergothioneine has a higher redox
potential than glutathione (GSH) and so is less susceptible to oxidation into the
disulphide form (Carlsson et al., 1974; Jayaram et al., 2008). The anti-oxidant
properties of ergothioneine were demonstrated to be more potent than uric acid, GSH or
Trolox® (a water-soluble derivative of Vitamin E), with regard to scavanging capacity
for peroxynitrates, hydroxyl and peroxyl radicals in vitro (Franzoni et al., 2006).
Additionally inhibition of ergothioneine biosynthesis correlates with increased
sensitivity of conidia to peroxides, but not superoxide, in the ascomycete Neurospora
crassa (Bello et al., 2012).
The mechanisms of ergothioneine biosynthesis have been investigated in
mycobacteria with the identification of a cluster of genes involved in production of the
molecule (Figure 6.16a) (Seebeck, 2010). Mycobacterial ergothionine biosynthesis
involves tri-methylation of the histidine via EgtD, with S-adenosylmethionine (SAM) as
the methyl donor. Interestingly, enzymes involved in the biosynthesis of SAM and
modification of histidine were differentially regulated in A. fumigatus ΔgliK in response
to gliotoxin (Chapter 5) and this will be discussed in more detail in Chapter 7.
Incorporation of the sulphydral group into ergothioneine is through conjugation with γ-
glutamyl cysteine and is mediated by EgtB in an iron-dependent manner. Subsequent
cleavage of the glutamate group by EgtC and loss of pyruvate result in the formation of
ergothioneine (Seebeck, 2010). A fungal ergothioneine biosynthesis gene, NcEgt-1, was

293
also identified in the ascomycete Neurospora crassa, with domains analogous to both
EgtB and EgtD (Bello et al., 2012). The ortholog of this gene in A. fumigatus is
DUF323 domain protein (AFUA_2G15650) with 47 % identity and 61 % sequence
similarity to NcEgt-1 (http://blast.ncbi.nlm.nih.gov/Blast.cgi). This may represent a
fusion protein, containing a domain with homology to SAM-dependent
methyltransferases, in addition to a split domain with homology to formylglycine-
generating sulfatase enzyme (Figure 6.16b) (Seebeck, 2010; Bello et al., 2012).
Ergothioneine biosynthesis has been shown to be up-regulated significantly in
the mushroom Ganoderma neo-japonicum following addition of methionine to the
media (Lee et al., 2009b). This may result from conversion of methionine to SAM,
which is subsequently utilised for methylation of histidine in the initial step of
ergothioneine biosynthesis (Figure 6.16). Interestingly, ergothioneine production was
observed to increase upon disruption of mycothiol production in Mycobacterium
smegmatis (Ta et al., 2011). This may indicate cross-talk between secondary metabolite
biosynthesis pathways and may account for the similiar observation in A. fumigatus
upon abrogation of gliotoxin biosynthesis. These authors noted that elevated
ergothioneine did not compensate for the loss of mycothiol with regard to cumene
hydroperoxide (CuOOH) resistance, indicating the redox role of ergothioneine may be
more limited than previously noted.
Ergothioneine, while not synthesised by mammals, is absorbed in the diet and
concentrated in specific tissues in the body via the action of an ergothioneine transporter
(ETT) (Gründemann et al., 2005; Gründemann, 2012). Ergothioneine has been noted to
accumulate in tissues associated with oxidative stress exposure including the kidneys,
liver, erythrocytes, ocular lens and seminal fluid (Hand and Honek, 2005). Paul and
Snyder (2010) demonstrated, using RNAi, that ETT-depleted HeLa cells were more

294
sensitive to oxidative stress and ergothioneine could prevent H2O2-induced apoptosis.
These authors also verified that ergothioneine directly scavenges hydroxyl radicals and
superoxide, protecting proteins from H2O2-induced oxidation and blocking DNA
damage in HeLa cells. Protection against H2O2-induced DNA damage by ergothioneine
was also noted in PC12 neuronal cells (Colognato et al., 2006). Ergothioneine was
found to inhibit the TNF-α or H2O2 -mediated transcription and release of IL-8 and the
transactivation of NFκB in A549 alveolar epithelial cells (Rahman et al., 2003).
Ergothioneine was also observed to indirectly protect against GSH depletion, through
inhibition of NFκB activation (Rahman et al., 2003).

295
Figure 6.16: (a) Biosynthesis of ergothioneine in mycobacteria. The cluster codes for a
γ-glutamyl cysteine synthetase (EgtA), an FGE-like protein (EgtB), a glutamine
amidotransferase (EgtC), a SAM-dependent methyltransferase (EgtD) and a PLP-
binding protein (EgtE). Adapted from Seebeck (2010). (b) Annotation of multiple
conserved domains in N. crassa NcEgt-1, indicating a possible fusion protein that is
essential for ergothioneine production in N. crassa. From Bello et al. (2012).
a.
b.

296
Interestingly sulphurisation of the methylated precursor of ergothionine involves
γ-glutamyl cysteine, while GSH provides the sulphur moieties in gliotoxin biosynthesis
(Figures 6.16 and 6.17b) (Seebeck, 2010; Davis et al., 2011a; Scharf et al., 2011). This
observation may help explain the increased ergothionine levels in A. fumigatus
following deletion of gliK. The GliK protein contains a conserved γ-glutamyl
cyclotransferase (GGCT) -like domain, as determined by blastp analysis of the protein
sequence (http://blast.ncbi.nlm.nih.gov/Blast.cgi). Proteins with GGCT activity catalyse
the production of pyroglutamic acid (5-oxoproline) from γ-glutamyl containing
dipeptides. This enzyme forms part of the γ-glutamyl cycle and is involved in the
catabolism of glutathione (L-γ-glutamyl-L-cysteinyl-glycine; GSH) (Oakley et al.,
2010) (Figure 6.17a). This putative function of GliK is supported by the observation of
elevated ergothioneine levels in ΔgliK compared to wild-type. Expression of a GGCT-
like protein would result in cleavage of γ-glutamyl dipeptides, including γ-glutamyl
cysteine. This enzymatic catabolism of γ-glutamyl cysteine could reduce the amount of
substrate (i.e. γ-glutamyl cysteine) available for sulphurisation of the ergothionine
precursor. Accordingly, absence of the GliK protein, with a GGCT-like domain, could
result in increased availability of γ-glutamyl cysteine leading to enhanced ergothioneine
biosynthesis. While the role of GliK in gliotoxin biosynthesis is yet unclear, GliK may
catalyse the removal of one or both L-glutamate moieties from the di-glutathionylated
product of GliG (Figure 6.17b). This function has putatively been assigned to the
dipeptidase GliJ (Gardiner and Howlett, 2005), however no functional genomic or
biochemical analysis has been performed to confirm this. Alternatively, there may be a
link between the γ-glutamyl cycle and gliotoxin production. As glutathione is essential
in the gliotoxin biosynthetic process (Davis et al., 2011a; Scharf et al., 2011) (Figure
6.17b), disruption of the γ-glutamyl cycle, by deletion of a putative GGCT, may
contribute to the loss of gliotoxin production in ΔgliK.

297
a.
b.
γ-glutamyl cycle
Gliotoxin biosynthesis:
GSH incorporation

298
Figure 6.17: (a) Outline of the γ-glutamyl cycle. 1, γ-glutamyl cysteine synthetase; 2,
glutathione synthetase; 3, γ-glutamyl transpeptidase; 4, γ-glutamylcyclotransferase
(GGCT) 5, 5-oxoprolinase. GGCT (red circle) is involved in the catabolism of
glutathione (GSH). Adapted from Oakley et al. (2008) (b) Sub-section of the proposed
gliotoxin biosynthetic pathway, demonstrating the incorporation of GSH molecules into
the gliotoxin precursor molecule. This thiolation step is catalysed by the glutathione-S-
transferase, GliG. Adapted from Davis et al. (2011a).
299
In summary, RP-HPLC, MALDI-ToF, LC-MS/MS and selective chemical
modification were utilised to comparatively characterise the intracellular and
extracellular metabolome of A. fumigatus ATCC26933 following deletion of gliK.
Analysis of culture supernatants revealed the absence of gliotoxin production in A.
fumigatus ΔgliK, demonstrating for the first time that GliK is essential for gliotoxin
biosynthesis in A. fumigatus. The absence of gliotoxin in A. fumigatus ΔgliK coincided
with significantly increased levels of extracellular metabolites, with m/z 394-396,
relative to the parent strain. These extracellular metabolites (m/z 394-396), may
represent on-pathway intermediates or shunt metabolites of gliotoxin biosynthesis,
accumulating in the absence of GliK. Future work required to characterise these
metabolites will be described in Chapter 7. Investigation of the intracellular
metabolome revealed significantly elevated levels of free thiols in A. fumigatus ΔgliK
compared to wild-type. This phenomenon was attributable to the significant increase in
levels of a monothiol-containing metabolite in A. fumigatus ΔgliK. This metabolite was
subsequently identified as ergothioneine and the work described in this Chapter
represents the first detection of this metabolite in A. fumigatus. The presence of elevated
levels of ergothioneine in ΔgliK, may support the putative function of GliK as a γ-
glutamyl cyclotransferase. Overall, the results presented in this Chapter represent a
progression in the characterisation of an unknown function protein, GliK, highlighting it
as an essential protein in the gliotoxin biosynthetic process, after the GliG step.
Metabolomic profiling, coupled with comparative proteomics analysis carried out in
Chapter 5, provides further insight into the cellular mechanisms affected by deletion of
gliK and these will be discussed in more detail in Chapter 7.

CHAPTER 7
Final Discussion

300
7 Chapter 7: Discussion
7.1 Overview
This discussion will (i) consider the implications of the expansion of the A.
fumigatus proteome and immunoproteome achieved by the present effort and (ii)
contextualise the global effects of gliotoxin-associated biochemistry in A. fumigatus.
The epoch of genome sequencing has facilitated substantial progress in the
characterisation of the transcriptome and proteome of A. fumigatus and related species
(Carberry et al., 2006; Jørgensen et al., 2009; Vödisch et al., 2009; Albrecht et al.,
2011; Pusztahelyi et al., 2011). While technologies utilised for transcriptomics enable
global analysis on a genome-wide scale, proteomics of A. fumigatus is still in its
formative years (Kniemeyer, 2011). Furthermore, despite the advanced capabilities of in
silico genome annotation, the function of many genes, and their resultant products,
remains undetermined (Teutschbein et al., 2010). Targeted gene deletion and
comparative profiling have been employed to determine gene function and to identify
the systems influenced by the presence of the respective protein (Hortschansky et al.,
2007; Lessing et al., 2007; Doyle, 2011b; O’Hanlon et al., 2011; Hagag et al., 2012).
The status of A. fumigatus as the second leading cause of invasive fungal infection
necessitates comprehensive proteomic profiling of this organism, which may facilitate
the identification of mechanisms contributing to pathogenicity (Thornton, 2008;
Kniemeyer, 2011). To this end, the focus of the work presented in this thesis has been
the progression of proteomic and immunoproteomic analysis of A. fumigatus, in
addition to the use of comparative proteomic and metabolic profiling to identify the
biological networks affected by gliotoxin in A. fumigatus. Resultant data has revealed
insights into the phenomenon of gliotoxin-mediated recovery from H2O2-induced
growth inhibition, and use of a gliotoxin sensitive mutant of A. fumigatus, ΔgliK, has

301
identified putative mechanisms by which gliotoxin toxicity is elicited. Furthermore, the
influence of a protein of unknown function, GliK, on the metabolite profile of A.
fumigatus was demonstrated for the first time (Gallagher et al., 2012). Coupled with
comparative proteomic profiling, this presents a multi-dimensional view of the systems
influenced following deletion of gliK from A. fumigatus.
7.2 Global Proteomic and Immunoproteomic Characterisation of A. fumigatus
Implementation of an MS-based proteomics approach lead to the identification
of 427 non-redundant proteins from the mycelia and supernatant of A. fumigatus.
Through use of gel-free preparations, proteins identified spanned a wide molecular mass
and pI range, and included proteins containing multiple transmembrane regions, as well
as hydrophobic proteins. Proteins identified extended from 9 to 434 kDa, with multiple
proteins (n = 10) possessing a molecular mass ≥ 142 kDa. Computational prediction of
the number of transmembrane (TM) regions revealed the identification of proteins with
up to 14 TM helices in addition to detection of hydrophobic proteins. These capabilities
superseded those attainable using the traditional 2D-PAGE approach of proteome
mapping (Carberry et al., 2006; Vödisch et al., 2009; Teutschbein et al., 2010).
Large-scale gel-free proteomics identified a number of proteins (n = 20) encoded
by genomic clusters, with predicted or proven roles in secondary metabolite
biosynthesis. Proteins (n = 14) which form part of a ‘supercluster’ on Chromosome 8
were identified, including proteins involved in the production of pseurotin A (Maiya et
al., 2007) and fumitremorgin B (Grundmann and Li, 2005; Maiya et al., 2006)
metabolism. An additional nine proteins were detected from this ‘supercluster’, which
are predicted to be involved in the biosynthesis of an unidentified metabolite. Detection
of protein expression of multiple members of this predicted secondary metabolite
cluster strongly indicates that this cluster is active under the growth conditions

302
employed. This information may prove essential in prospective studies for identification
of this uncharacterised metabolite. Identification of the gliotoxin oxidoreductase GliT, a
member of the gliotoxin biosynthetic cluster, was achieved using MS-based proteomics
(Gardiner and Howlett, 2005; Scharf et al., 2010; Schrettl et al., 2010). Gliotoxin
production was detected in these conditions following extracellular metabolite analysis,
thus confirming that detection of this protein, GliT, correlated with cluster activity and
metabolite biosynthesis. A putative Zn-dependent hydrolase/oxidoreductase family
protein was also detected from the second ETP cluster in A. fumigatus. This cluster is
positioned on Chromosome 3 (AFUA_3G12870 - AFUA_3G13010) and contains a
partial number of ETP biosynthesis genes relative to the gliotoxin cluster (Patron et al.,
2007). Cross-talk may be essential between these two ETP clusters in order to complete
biosynthesis of distinct products, and co-expression of proteins from both clusters may
support this theory. All cluster proteins identified in this condition are either partially or
fully regulated by the transcription factor LaeA, a global regulator of secondary
metabolism (Bok and Keller, 2004; Bok et al., 2005; Perrin et al., 2007). Thus, LaeA
activity was indirectly determined through a global proteomics investigation.
Methods to reduce sample complexity will continue to expand proteome
characterisation (Millioni et al., 2011; Zhang et al., 2011). Coupling of MS-based
shotgun proteomics with pre-fractionation based on protein size facilitated the
identification of an additional 17 proteins that were not detected using the direct
method. Ion exchange chromatography (SCX) is regularly utilised in MS-based
proteomics, for pre-fractionation of peptides prior to LC-MS/MS, in a bid to expand the
capacity for protein identification (Washburn et al., 2001; Ouyang et al., 2010). Pre-
incubation with gold nanoparticles (AuNPs) represents an alternative, efficient manner
by which to fractionate complex lysates (Cedervall et al., 2007; Keidel et al., 2010). A.

303
fumigatus proteins adhering to the surface of 30 nm AuNPs were predominantly
categorised as proteins with binding function or co-factor requirement according to
FunCat annotation (Ruepp et al., 2004). Compilation of proteomic data from A.
fumigatus studies revealed that this functional category has the highest representation
from all proteins identified (Kniemeyer et al., 2011). Consequently, the ability to
partition, and remove, these proteins could enrich low abundance proteins.
Characterisation of the secretome of A. fumigatus was undertaken and yielded
successful identification of 42 unique proteins. This study on the extracellular fraction
of A. fumigatus expands the number of currently reported secreted proteins, with cross-
validation of the in silico annotation methods, SignalP and SecretomeP. A number of
unknown function proteins (n = 7), were identified from culture supernatants and
knowledge of their secretion could contribute to the functional annotation of these
proteins in future studies. Secreted proteins have long been investigated for their
potential use as biomarkers of infection or as putative virulence factors (Wartenberg et
al., 2011). Thus, extensive characterisation of the secretome of A. fumigatus may
contribute to understanding mechanisms of pathogenicity, or alternatively, identify
enzymes with potential biotechnological applications (Ferreira de Oliveira and De
Graaff, 2011; Kniemeyer, 2011).
The secretome of A. fumigatus has been extensively targeted for the
identification of antigenic and allergenic proteins (Gautam et al., 2007; Singh et al.,
2010a; Shi et al., 2012a, 2012b). Intracellular proteins also represent potential targets of
the immune system, and recent studies have identified immunogenic proteins from
conidia or early germlings of A. fumigatus (Asif et al., 2010; Singh et al., 2010b).
Classically, mycelial lysates were used to identify immunoreactive proteins from A.
fumigatus (Latge, 1999), however, no analogous studies have been completed since the

304
sequencing of the genome. A. fumigatus-related disease is not required for the
development of antibodies, and anti-A. fumigatus antibodies are present in most healthy
individuals, albeit at low levels, as a consequence of routine environmental exposure
(Latge, 1999). Indeed, utilising sera pools from healthy individuals, immunoreactivity
was observed against A. fumigatus mycelial lysates in 93 % of the human sera tested.
The mycelial targets of anti-A. fumigatus IgG (n = 25) were identified following 2D-
PAGE separation and immunoblotting with human sera pools. Antigens identified
included previously characterised immunogenic A. fumigatus proteins (n = 12),
including the molecular chaperones Hsp70, Hsp88 and Hsp90 (Singh et al., 2010b),
providing validation of the detection and identification strategies employed.
Furthermore, expansion of the immunome of A. fumigatus was achieved, by
identification of thirteen additional immunoreactive proteins, with previously
unidentified antigenicity. These included two carboxypeptidases (AFUA_5G07330 and
AFUA_8G04120), 1,3-β-glucanosyltransferase Gel4 (AFUA_2G05340) and a putative
aminopeptidase (AFUA_2G00220). As these aforementioned proteins have not been
detected in either secretome or conidial/early germling proteome maps to date (Gautam
et al., 2007; Neustadt et al., 2009; Singh et al., 2010a, 2010b; Teutschbein et al., 2010;
Cagas et al., 2011b; Wartenberg et al., 2011; Suh et al., 2012), their immunodetection
may have been hampered in previous studies by their localisation exclusively in
mycelia. Thus, targeting mycelial lysates for identification of A. fumigatus antigens
represents a significant development in immunome characterisation.
Identification of antigenic proteins not only serves to present new vaccine
targets or diagnostic markers of infection, but may also provide insight into the
mechanisms of pathogenicity and the in vivo conditions experienced by A. fumigatus in
the host (Tjalsma et al., 2008; Doyle, 2011b; Thornton et al., 2012). The majority of the

305
proteins identified as antigenic in this study have previously demonstrated increased
expression in response to various forms of stress (n = 19/25). These stresses, including
heat shock, hypoxia, oxidative stress and exposure to host cells, are likely encountered
by A. fumigatus in the human lung (Figure 7.1) (Lessing et al., 2007; Sugui et al., 2008;
Albrecht et al., 2010; Morton et al., 2011; Oosthuizen et al., 2011; Vödisch et al.,
2011). Heat-shock was observed to result in up-regulation of seven of the antigens
herein identified, with eleven hypoxia-induced proteins identified as immunogenic
(Figure 7.1). Through H2O2-induced oxidative stress, increased expression of multiple
antigenic and allergic proteins is noted, including Hsp88, Hsp90 and cobalamin-
independent methionine synthase MetH/D. Oxidative stress reflects the exposure of
inhaled conidia and mycelia to ROS generated by macrophages and neutrophils in the
lung (Philippe et al., 2003; Brown et al., 2009a). Furthermore, incubation of A.
fumigatus with neutrophils, airway epithelial cells, dendritic cells and host-associated
factors similarly induces proteins identified here as antigenic (Figure 7.1) (Shen et al.,
2004; Sugui et al., 2008; Morton et al., 2011; Oosthuizen et al., 2011). We postulate
that increased expression of these proteins, following exposure to the host environment,
could indicate a role for these proteins in the pathobiology of A. fumigatus. In addition,
enhanced expression of these proteins could increase the opportunity for presentation to
the immune system and consequently account for development of immunoreactivity.
Based on these observations of stress-induced antigen expression, it is clear that in vitro
conditions that mimic host environments, possibly through combination of stresses,
could enable further characterisation of immunome of A. fumigatus. Moreover the
observation of ubiquitous, low-level immunoreactivity against A. fumigatus antigens
presents the opportunity for purification of anti-Aspergillus antibodies from healthy
individuals which may contribute to diagnostic tool development.

306
Figure 7.1: Summary of proteins, identified in this thesis as antigenic, that have previously been shown to undergo increased expression in
response to various forms of host-associated stress.

307
7.3 Gliotoxin-associated mechanisms in A. fumigatus
Combinatorial stress induction in A. fumigatus was investigated using H2O2 and
gliotoxin, in a bid to uncover any synergistic or additive phenotypic response. In an
unexpected phenomenon, H2O2-induced growth inhibition of A. fumigatus ATCC26933
was actually relieved by gliotoxin, in a dose-dependent manner (0 - 10 µg/ml). This
antagonistic effect was similarly noted using the gliotoxin and H2O2-sensitive mutant A.
fumigatus ΔgliK. Choi et al. (2007) identified gliotoxin as a small molecule targeting
the mammalian thioredoxin redox system, with the concurrent oxidation of NADPH and
reduction of H2O2. These authors postulated that gliotoxin replaced 2-cys-peroxiredoxin
(Prx) as an electron acceptor, consequently eliciting an anti-oxidant function through
elimination of H2O2. Gliotoxin was demonstrated to execute this function in vitro and
additionally was observed to suppress H2O2-induced angiogenesis in a dose-dependent
manner (Choi et al., 2007). We posit that an analogous scenario may occur in A.
fumigatus, whereby gliotoxin redox cycling may serve to reduce H2O2 (Figure 7.2). This
redox cycling may be mediated by the thioredoxin redox system, as observed in the
mammalian model, or alternatively may be facilitated by the gliotoxin oxidoreductase
GliT (Figure 7.2). GliT was observed to be significantly up-regulated in the co-addition
scenario relative to the presence of H2O2 alone (5.0 fold, p < 0.05), with exogenous
gliotoxin exclusively responsible for the induction of expression. Schrettl et al. (2010)
demonstrated that GliT exhibits NADPH-dependent gliotoxin reductase activity and
proposed that gliotoxin may form part of an anti-oxidant defence system within A.
fumigatus. Interestingly, intracellular GliT was not observed to undergo significant
induction in A. fumigatus ΔgliK following exposure to gliotoxin, and this may account
partly for the significantly enhanced sensitivity of this mutant to gliotoxin.

308
Figure 7.2: Model of gliotoxin (GT) replacing 2-cys peroxiredoxin in (a) the thioredoxin redox system, with the reduction of H2O2 and
the oxidation of NADPH or (b) putative model of NADPH-dependent reduction of gliotoxin by the gliotoxin oxidoreductase GliT.
Adapted from Zhu et al. (2012). TrxR, thioredoxin reductase; Trx, thioredoxin.

309
For the proposed model of GliT-gliotoxin mediated reduction of H2O2 to hold
true, basal intracellular levels or extracellular GliT would have to be sufficient to
perform gliotoxin, and consequently H2O2, reduction. In vitro analysis to confirm this
model is required. Many of the proteins undergoing significant differential expression in
the response to co-addition of gliotoxin and H2O2, relative to H2O2 alone, appear to
reflect the relief of both stress and growth inhibition associated with the former
condition. These proteins include Hsp90 and the oxidative stress protein Svf1, which
decreased in expression, coincident with gliotoxin-mediated relief of H2O2-induced
growth inhibition. This indicates the reduction in oxidative stress caused by H2O2 upon
co-application of gliotoxin. The class V chitinase, associated with autolysis in response
to stress (Yamazaki et al., 2007), was observed to decrease in expression in the co-
addition condition. Higher relative levels of this protein, expressed in the presence of
H2O2, may account for the growth inhibition observed, due to elevation of H2O2-
induced cell lysis. Decrease of expression of this chitinase, consequent to gliotoxin co-
addition, may lead to reduction in autolysis, possibly due to relief of the triggering
stress. Similarly the Ran-specific GTPase activating protein 1, involved in cell cycle
regulation (Baumer et al., 2000), is differentially regulated in the co-addition scenario
relative to H2O2 alone. Decreased levels of this protein, as observed in the presence of
H2O2 alone, are associated with cell cycle arrest. An increase in the Ran-specific
GTPase activating protein 1 upon co-addition of gliotoxin and H2O2, correlates with
recovery of growth inhibition and again may be reflective of the relief of H2O2-induced
stress. Increased expression of proteins from the electron transport chain (ETC), namely
NADH quinone oxidoreductase and NADH ubiquinone dehydrogenase, in the co-
addition condition may also be attributable to the relief of growth inhibition, and
indicate an associated increase in cellular energy requirement to support growth (Fernie
et al., 2004). Altogether, these proteins appear to reflect the growth recovery associated

310
with co-addition of gliotoxin and H2O2, and may represent the ‘effect’ rather than the
‘cause’ of this relief.
As discussed previously, GliT may contribute to the gliotoxin-mediated reversal
of H2O2-induced growth inhibition, representing a possible candidate for the ‘cause’ of
this relief. The proliferating cell nuclear antigen PCNA may represent another possible
contributor to this growth recovery. The role of PCNA in DNA replication and repair
has been demonstrated, and this protein is involved in the response to H2O2-induced
DNA damage (Burkovics et al., 2009). While PCNA increases in expression in response
to H2O2 alone, further induction is observed upon co-addition of gliotoxin (2.3 fold, p <
0.05). This may increase the capacity for repair of DNA damage caused by H2O2 and
contribute to the growth recovery associated with the co-addition condition. Up-
regulation of purine salvage was also noted in the combinatorial condition, and this may
further support the increase in DNA repair in this condition with the elevation in
nucleotide recycling. Down-regulation of de novo purine biosynthesis is elicited by
gliotoxin in the co-addition scenario, as indicated by decreased expression of glutamine
amidotransferase:cyclase and the bifunctional purine biosynthetic protein Ade1. Up-
regulation of the purine salvage pathway is demonstrated through increased expression
of adenine and xanthine-guanine phosphoribosyltransferases, Apt1 and Xpt1,
respectively. Combined, these proteomic alterations indicate that gliotoxin-mediated
relief of H2O2-induced growth inhibition may be facilitated by redox cycling of
gliotoxin, possibly involving GliT, and the elevated capacity for DNA damage repair.
Further targeted investigation of these mechanisms, involving in vitro biochemical
analysis and measurement of relative DNA damage, would confirm the hypotheses
revealed by comparative proteomics.

311
The mechanisms of gliotoxin-mediated toxicity were probed using a gliotoxin-
sensitive mutant of A. fumigatus, ΔgliK. Deletion of gliK resulted in the abrogation of
gliotoxin biosynthesis and led to a significant increase in sensitivity to exogenous
gliotoxin, relative to the parent strain (Gallagher et al., 2012). Biological systems
affected by gliotoxin application to A. fumigatus ΔgliK included protein synthesis, the
methyl cycle, regulatory systems (e.g. apoptosis and cell-cycle regulation) and
mechanisms associated with endoplasmic reticulum (ER) stress.
Dysregulation of proteins/enzymes involved in translation was observed in A.
fumigatus ΔgliK upon exposure to gliotoxin, which may have contributed to the
observed growth inhibition associated with this treatment (Figure 7.3). A number of
proteins involved in translation initiation and elongation were observed to increase in
expression, including the translation initiation factor 3 subunit EifCb (2.7 fold), and the
translation elongation factors eEF3 and G1 (5.6 and 2.5 fold, respectively). EifCb is
essential for translation and initiation is deemed as the rate-determining step in this
process (Osherov and May, 2000; Arava et al., 2003). While this observation appears to
indicate that translation is up-regulated in gliotoxin-exposed A. fumigatus ΔgliK,
differential regulation of other translation-associated factors is concurrently observed.
The translation elongation factor EF2 undergoes a decrease in expression (1.6 fold) in
addition to down-regulation of proteins involved in post-translational modification
(PTM) and regulation of EF2, namely diphthine synthase and protein phosphatase 2a
(PP2A), respectively. Diphthine synthase is involved in the incorporation of an EF2
exclusive PTM, consisting of a modified histidine residue (Liu et al., 2004), while
PP2A dephosphorylates EF2, thus re-activating the elongation factor (Kaul et al., 2011).
Decreased levels of EF2, coupled with reduction of EF2 activity may result in
disruption of translation in A. fumigatus ΔgliK, following gliotoxin addition.

312
Conversely, EF2 expression is induced in A. fumigatus ATCC26933 in response to
gliotoxin (Carberry et al., 2012), and this differential expression may account for the
significant growth inhibition associated with gliotoxin-exposed A. fumigatus ΔgliK,
relative to the parent strain.
Gliotoxin was observed to elicit an effect on a number of components of the ER
in A. fumigatus ΔgliK, and this may be suggestive of ER-associated stress as a
mechanism for gliotoxin toxicity (Figure 7.3). Decreased expression of protein
disulphide isomerise Pdi1, with an integral role in the unfolded protein response (UPR)
to ER-stress (Xiao et al., 2004), was observed in A. fumigatus ΔgliK following gliotoxin
exposure. Pdi1 acts as a chaperone and is involved in the oxidation, reduction and
reorganisation of incorrectly paired protein disulphides. Gliotoxin can form mixed
disulphides with proteins, and through redox cycling can mediate mispairing of protein
disulphides (Bertling et al., 2010). Therefore, lower expression of Pdi1 in A. fumigatus
ΔgliK in the presence of gliotoxin could result in an accumulation of misfolded proteins,
and subsequently elicit toxic effects (Richie et al., 2009). In addition to a role in
translation, PP2A also executes a regulatory function in the ER, through de-
phosphorylation of the anti-apoptotic factor BCL-2, thus preserving BCL-2 from
degradation (Lin et al., 2006). Reduction in PP2A levels in gliotoxin-treated A.
fumigatus ΔgliK could correspond with an increase in apoptosis, mediated by BCL-2
degradation. This observation is echoed in the mammalian model, whereby the Bcl-2
family member, Bak, is central to gliotoxin-induced apoptosis (Pardo et al., 2006).
Regulation of the UPR is further affected in A. fumigatus ΔgliK by decreased expression
of the Ran GTPase activating proteins RNA1 in response to gliotoxin. RNA1 is
indirectly required for induction of UPR-related gene expression, by facilitating Ire1p
transport into the nucleus (Back et al., 2005; Goffin et al., 2006). Further observation of

313
differential regulation of ER-associated proteins (CRAL/TRIO protein, aspartic
endopeptidase Pep2 and vesicular fusion protein Sec17) supports the hypothesis that
gliotoxin-mediated toxicity in sensitive organisms involves ER-stress and possibly the
coincident induction of apoptosis. Moreover, attenuation of protein synthesis is induced
by the UPR (Lai et al., 2007), and this may account for the dysregulation of translation
observed in gliotoxin-exposed A. fumigatus ΔgliK.
Expression of enzymes involved in the methyl cycle of A. fumigatus ΔgliK was
also observed to undergo significant induction in the presence of gliotoxin (Figure 7.3).
Increased expression of cobalamin-independent methionine synthase in this condition is
indicative of enhanced methionine production, which may lead to elevated levels of S-
adenosylmethionine (SAM) (Barak et al., 2003). SAM, formed by the adenosylation of
methionine, is a major source of methyl groups for a range of biomolecules including
proteins, nucleic acids and secondary metabolites (Kanai et al., 2012). SAM-mediated
methylation of the sulphydral groups of gliotoxin may represent a potential defence
mechanism against the toxin, as di-methylated gliotoxin does not undergo redox
cycling, and thus exhibits abated activity (Nishida et al., 2005). This may account for
the multiple S-methylated GliZ-dependent molecules, potentially generated via the
gliotoxin biosynthetic process (Forseth et al., 2011).
Observation of significantly elevated levels of ergothioneine in A. fumigatus
ΔgliK may also result from increased availability of methionine and SAM. Biosynthesis
of ergothioneine is intrinsically linked to the methionine biosynthetic cycle, with SAM
responsible for providing the three methyl groups on the α-amino group of the
precursor, histidine (Seebeck, 2010). This relationship is re-inforced by the observation
that supplementation of growth media with methionine, results in the increased
production of ergothioneine in several mushroom species (Lee et al., 2009b, 2009c).

314
Thus, increased synthesis of methionine, and consequently SAM, may account for the
increased levels of ergothioneine in A. fumigatus ΔgliK. Differential regulation of
methylenetetrahydrofolate reductase (MTHFR) in gliotoxin exposed-A. fumigatus wild-
type and ΔgliK could be a consequence of the sensitive phenotype noted in the latter.
Specifically, while MTHFR expression decreases in gliotoxin-exposed A. fumigatus
wild-type, an increase in expression in noted upon exposure of A. fumigatus ΔgliK to
gliotoxin. Indeed, MTHFR transcription and translation is induced by ER-stress
(Leclerc and Rozen, 2008), further underlining the prediction of ER-associated stress in
the gliotoxin sensitive mutant A. fumigatus ΔgliK. This presents a mechanism by which
gliotoxin mediates toxicity in sensitive organisms and further investigation to confirm
the induction of ER-stress by gliotoxin could confirm whether this effect is specific to
A. fumigatus ΔgliK or a universal mode of action.
Deletion of gliK resulted in significantly altered phenotypic and proteomic
responses to gliotoxin, and consequently metabolome analysis of ΔgliK revealed
substantial modification of the intra and extracellular metabolome of A. fumigatus. The
previously uncharacterised protein, GliK, was demonstrated to be essential for gliotoxin
biosynthesis in A. fumigatus. Loss of gliotoxin production in ΔgliK correlated with a
significant increase in levels of extracellular hydrophobic metabolites (m/z 394-396),
representing putative intermediates or shunt metabolites of the gliotoxin biosynthetic
pathway. Absence of these metabolites in A. fumigatus ΔgliG indicates the production
of these molecules is GliG-dependent, and accumulation of m/z 394-396 in ΔgliK
supports the hypothesis that the biological activity of GliG precedes that of GliK in
gliotoxin biosynthesis.

315
a.

316
Figure 7.3: (a) Summary and (b) schematic representation of cellular functions and biosynthetic processes altered in A. fumigatus ΔgliK.
b.

317
Purification and identification of these metabolites (m/z 394-396) would further
inform the model of gliotoxin biosynthesis and could elucidate the specific role played
by GliK in the pathway. This strategy was implemented previously to determine the
roles of GliI and GliG in gliotoxin biosynthesis (Davis et al., 2011a; Scharf et al.,
2012a).
Significantly, this thesis describes the first reported detection of ergothioneine in
A. fumigatus (Gallagher et al., 2012), and GliK absence resulted in significantly
elevated levels of this poorly characterised, but ubiquitous, thione-thiol tautomer. A
conserved gamma-glutamyl cyclotransferase (GGCT)-like domain was recently
annotated in GliK, indicating the function of this protein may be connected to the
cleavage of γ-glutamyl groups from dipeptides. This putative function could point to the
role of GliK in gliotoxin biosynthesis, through removal of one or both γ-glutamyl
moieties from the di-glutathionylated gliotoxin precursor (Figure 1.7). Furthermore,
GGCT activity may explicate the elevation in ergothioneine levels in A. fumigatus
ΔgliK, as the biosynthesis of ergothioneine involves incorporation of a γ-glutamyl
dipeptide (γ-glutamyl cysteine), as deduced in Mycobacterium (Seebeck, 2010).
Therefore, absence of GliK could lead to reduced catabolism of the substrate of
ergothioneine biosynthesis. Biochemical confirmation of GGCT activity in GliK may
aid in the elucidation of the specific role of this protein in gliotoxin biosynthesis. As
ergothioneine has not been examined in A. fumigatus to date, the role of this molecule in
the redox environment has not been taken into consideration. Ergothioneine, could
potentially contribute to the enhanced sensitivity of A. fumigatus ΔgliK to gliotoxin,
through reduction of gliotoxin and consequent disruption of gliotoxin efflux (Gallagher
et al., 2012). Further investigation of this molecule is required to determine the
contribution of ergothioneine levels to the redox status of A. fumigatus and other

318
filamentous fungi. In this regard, it is recommended that determination of ergothioneine
levels should be incorporated into future functional investigations of oxidative stress.
To conclude, this study expands the proteomic characterisation of A. fumigatus
and contributes to the expansion of the immunome. Additionally, mechanisms affected
by gliotoxin in A. fumigatus have been extrapolated, and inform the role of gliotoxin as
both a toxin, in sensitive organisms, and a potential anti-oxidant in A. fumigatus. Finally
cross-talk between the gliotoxin and ergothioneine biosynthesis was identified,
extending our comprehension of the fungal metabolome. Altogether, this study
contributes to the global and targeted characterisation of protein and metabolite systems
operating in A. fumigatus, while revealing many interesting avenues for future
investigations.

CHAPTER 8
Bibliography

319
8 Bibliography
Abad, A., Fernández-Molina, J.V., Bikandi, J., Ramírez, A., Margareto, J., Sendino, J.,
Luis Hernando, F., Pontón, J., Garaizar, J. and Rementeria, A. (2010). What makes
Aspergillus fumigatus a successful pathogen? Genes and molecules involved in invasive
aspergillosis. Rev. Iberoam. Micol. 27: 155–182.
Adav, S.S., Li, A.A., Manavalan, A., Punt, P. and Sze, S.K. (2010). Quantitative
iTRAQ Secretome Analysis of Aspergillus niger Reveals Novel Hydrolytic Enzymes. J.
Proteome Res. 9: 3932–3940.
Aebersold, R. and Mann, M. (2003). Mass spectrometry-based proteomics. Nature 422:
198–207.
Agarwal, R. (2011). Allergic bronchopulmonary aspergillosis: Lessons for the busy
radiologist. World J. Radiol. 3: 178–181.
Agarwal, R., Hazarika, B., Gupta, D., Aggarwal, A.N., Chakrabarti, A. and Jindal, S.K.
(2010). Aspergillus hypersensitivity in patients with chronic obstructive pulmonary
disease: COPD as a risk factor for ABPA? Med. Mycol. 48: 988–994.
Aguirre, J., Hansberg, W. and Navarro, R. (2006). Fungal responses to reactive oxygen
species. Med. Mycol. 44: 101–107.
Aimanianda, V., Bayry, J., Bozza, S., Kniemeyer, O., Perruccio, K., Elluru, S.R.,
Clavaud, C., Paris, S., Brakhage, A.A., Kaveri, S. V, Romani, L. and Latgé, J.-P.
(2009). Surface hydrophobin prevents immune recognition of airborne fungal spores.
Nature 460: 1117–1121.
Albrecht, D., Guthke, R., Brakhage, A.A. and Kniemeyer, O. (2010). Integrative
analysis of the heat shock response in Aspergillus fumigatus. BMC Genomics 11: 32.
Albrecht, D., Kniemeyer, O., Mech, F., Gunzer, M., Brakhage, A.A. and Guthke, R.
(2011). On the way toward systems biology of Aspergillus fumigatus infection.
International Journal of Medical Microbiology 301: 453–459.
Albrethsen, J. (2007). Reproducibility in protein profiling by MALDI-TOF mass
spectrometry. Clinical Chemistry 53: 852–858.
Alcazar-Fuoli, L., Clavaud, C., Lamarre, C., Aimanianda, V., Seidl-Seiboth, V.,
Mellado, E. and Latgé, J.-P. (2011). Functional analysis of the fungal/plant class
chitinase family in Aspergillus fumigatus. Fungal Genetics and Biology 48: 418–429.
Amitani, R., Taylor, G., Elezis, E., Llewellyn-jones, C., Mitchell, J., Kuze, F., Cole, P.J.
and Wilson, R. (1995). Purification and Characterization of Factors Produced by
Aspergillus fumigatus Which Affect Human Ciliated Respiratory Epithelium. Infect.
Immun. 63: 3266–3271.

320
Anand, M., Balar, B., Ulloque, R., Gross, S.R. and Kinzy, T.G. (2006). Domain and
nucleotide dependence of the interaction between Saccharomyces cerevisiae translation
elongation factors 3 and 1A. The Journal of Biological Chemistry 281: 32318–32326.
Anand, M., Chakraburtty, K., Marton, M.J., Hinnebusch, A.G. and Kinzy, T.G. (2003).
Functional interactions between yeast translation eukaryotic elongation factor (eEF) 1A
and eEF3. The Journal of Biological Chemistry 278: 6985–6991.
Andersen, M.R., Nielsen, M.L. and Nielsen, J. (2008). Metabolic model integration of
the bibliome, genome, metabolome and reactome of Aspergillus niger. Molecular
Systems Biology 4: 178.
Antinori, S., Nebuloni, M., Magni, C., Fasan, M., Adorni, F., Viola, A., Corbellino, M.,
Galli, M., Vago, G., Parravicini, C. and Ridolfo, A.L. (2009). Trends in the postmortem
diagnosis of opportunistic invasive fungal infections in patients with AIDS: a
retrospective study of 1,630 autopsies performed between 1984 and 2002. Am. J. Clin.
Pathol. 132: 221–227.
Anzai, K., Mayuzumi, S., Nakashima, T., Sato, H., Inaba, S., Park, J.-Y., Kuwahara, N.,
Suzuki, R., Utsumi, N., Yokoyama, F., Ohfuku, Y. and Ando, K. (2008). Comparison of
Groupings among Members of the Genus Aspergillus Based on Phylogeny and
Production of Bioactive Compounds. Biosci. Biotechnol. Biochem. 72: 2199–2202.
Arava, Y., Wang, Y., Storey, J.D., Liu, C.L., Brown, P.O. and Herschlag, D. (2003).
Genome-wide analysis of mRNA translation profiles in Saccharomyces cerevisiae.
Proc. Natl. Acad. Sci. U. S. A. 100: 3889–3894.
Ashburner, M., Ball, C.A., Blake, J.A., Botstein, D., Butler, H., Cherry, J.M., Davis,
A.P., Dolinski, K., Dwight, S.S., Eppig, J.T., Harris, M.A., Hill, D.P., Issel-tarver, L.,
Kasarskis, A., Lewis, S., Matese, J.C., Richardson, J.E., Rubin, G.M. and Sherlock, G.
(2000). Gene Ontology : tool for the unification of biology. Nat. Genet. 25: 25–29.
Asif, A.R., Oellerich, M., Amstrong, V.W., Gross, U. and Reichard, U. (2010). Analysis
of the cellular Aspergillus fumigatus proteome that reacts with sera from rabbits
developing an acquired immunity after experimental aspergillosis. Electrophoresis 31:
1947–1958.
Asif, A.R., Oellerich, M., Amstrong, V.W., Riemenschneider, B., Monod, M. and
Reichard, U. (2006). Proteome of Conidial Surface Associated Proteins of Aspergillus
fumigatus Reflecting Potential Vaccine Candidates and Allergens. J. Proteome Res. 5:
954–962.
Atalla, M.M., Hamed, E.R. and El-Shami, A.R. (2008). Optimization of a culture
medium for increased mevinolin production by Aspergillus terreus strain. Malaysian
Journal of Microbiology 4: 6–10.

321
Azie, N., Neofytos, D., Pfaller, M., Meier-Kriesche, H.-U., Quan, S.-P. and Horn, D.
(2012). The PATH (Prospective Antifungal Therapy) Alliance® registry and invasive
fungal infections: update 2012. Diagn. Microbiol. Infect. Dis. 73: 293–300.
Back, S.H., Schröder, M., Lee, K., Zhang, K. and Kaufman, R.J. (2005). ER stress
signaling by regulated splicing: IRE1/HAC1/XBP1. Methods 35: 395–416.
Balibar, C.J. and Walsh, C.T. (2006). GliP, a multimodular nonribosomal peptide
synthetase in Aspergillus fumigatus, makes the diketopiperazine scaffold of gliotoxin.
Biochemistry 45: 15029–15038.
Balloy, V., Huerre, M., Latgé, J. and Chignard, M. (2005). Differences in Patterns of
Infection and Inflammation for Corticosteroid Treatment and Chemotherapy in
Experimental Invasive Pulmonary Aspergillosis. Infect. Immun. 73: 494–503.
Barak, A.J., Beckenhauer, H.C., Mailliard, M.E., Kharbanda, K.K. and Tuma, D.J.
(2003). Betaine Lowers Elevated S- Adenosylhomocysteine Levels in Hepatocytes from
Ethanol-Fed Rats. The Journal of Nutrition 133: 2845–2848.
Barker, B.M., Kroll, K., Vödisch, M., Mazurie, A., Kniemeyer, O. and Cramer, R.A.
(2012). Transcriptomic and proteomic analyses of the Aspergillus fumigatus hypoxia
response using an oxygen-controlled fermenter. BMC Genomics 13: 62.
Baumer, M., Kunzler, M., Steigemann, P., Braus, G.H. and Irniger, S. (2000). Yeast
Ran-binding Protein Yrb1p Is Required for Efficient Proteolysis of Cell Cycle
Regulatory Proteins Pds1p and Sic1p. The Journal of Biological Chemistry 275: 38929–
38937.
Bayram, Ö., Krappmann, S., Ni, M., Bok, J.W., Helmstaedt, K., Yu, J. and Braus, G.H.
(2008). VelB/VeA/LaeA Complex Coordinates Light Signal with Fungal Development
and Secondary Metabolism. Science 320: 1504–1506.
Beauvais, A. and Latgé, J.P. (2001). Membrane and cell wall targets in Aspergillus
fumigatus. Drug Resist. Updates 4: 38–49.
Bello, M.H., Barrera-Perez, V., Morin, D. and Epstein, L. (2012). The Neurospora
crassa mutant NcΔEgt-1 identifies an ergothioneine biosynthetic gene and demonstrates
that ergothioneine enhances conidial survival and protects against peroxide toxicity
during conidial germination. Fungal Genetics and Biology 49: 160–172.
Ben-Ami, R., Lewis, R.E. and Kontoyiannis, D.P. (2010). Enemy of the
(immunosuppressed) state: an update on the pathogenesis of Aspergillus fumigatus
infection. Br. J. Haematol. 150: 406–417.
Ben-Ami, R., Lewis, R.E., Leventakos, K. and Kontoyiannis, D.P. (2009). Aspergillus
fumigatus inhibits angiogenesis through the production of gliotoxin and other secondary
metabolites. Blood 114: 5393–5399.

322
Bendtsen, J.D., Jensen, L.J., Blom, N., Von Heijne, G. and Brunak, S. (2004). Feature-
based prediction of non-classical and leaderless protein secretion. Protein Engineering,
Design & Selection 17: 349–356.
Bendtsen, J.D., Kiemer, L., Fausbøll, A. and Brunak, S. (2005). Non-classical protein
secretion in bacteria. BMC Microbiology 5: 58.
Berger, A.C., Vanderford, T.H., Gernert, K.M., Nichols, W., Faundez, V., Corbett, A.H.
and Nichols, J.W. (2005). Saccharomyces cerevisiae Npc2p Is a Functionally
Conserved Homologue of the Human Niemann-Pick Disease Type C 2 Protein, hNPC2.
Eukaryot. Cell 4: 1851–1862.
Bergmann, A., Hartmann, T., Cairns, T., Bignell, E.M. and Krappmann, S. (2009). A
regulator of Aspergillus fumigatus extracellular proteolytic activity is dispensable for
virulence. Infect. Immun. 77: 4041–4050.
Bernardo, P.H., Brasch, N., Chai, C.L.L. and Waring, P. (2003). A Novel Redox
Mechanism for the Glutathione-dependent Reversible Uptake of a Fungal Toxin in
Cells. J. Biol. Chem. 278: 46549–46555.
Bertling, A., Niemann, S., Uekötter, A., Fegeler, W., Lass-Flörl, C., Von Eiff, C. and
Kehrel, B.E. (2010). Candida albicans and its metabolite gliotoxin inhibit platelet
function via interaction with thiols. Thrombosis and Haemostasis 104: 270–278.
Bhabhra, R. and Askew, D.S. (2005). Thermotolerance and virulence of Aspergillus
fumigatus : role of the fungal nucleolus. Med. Mycol. 43: 87–93.
Bhabhra, R., Miley, M.D., Mylonakis, E., Boettner, D., Fortwendel, J., Panepinto, J.C.,
Postow, M., Rhodes, J.C. and Askew, D.S. (2004). Disruption of the Aspergillus
fumigatus Gene Encoding Nucleolar Protein CgrA Impairs Thermotolerant Growth and
Reduces Virulence. Infect. Immun. 72: 4731–4740.
Bhatia, S., Fei, M., Yarlagadda, M., Qi, Z., Akira, S., Saijo, S., Iwakura, Y., Van
Rooijen, N., Gibson, G.A., St Croix, C.M., Ray, A. and Ray, P. (2011). Rapid host
defense against Aspergillus fumigatus involves alveolar macrophages with a
predominance of alternatively activated phenotype. PloS One 6: e15943.
Bok, J.W., Balajee, S.A., Marr, K.A., Andes, D., Nielsen, K.F., Frisvad, J.C. and Keller,
N.P. (2005). LaeA , a Regulator of Morphogenetic Fungal Virulence Factors. Eukaryot.
Cell 4: 1574–1582.
Bok, J.W., Chung, D., Balajee, S.A., Marr, K.A., Andes, D., Nielsen, K.F., Frisvad,
J.C., Kirby, K.A. and Keller, N.P. (2006). GliZ, a transcriptional regulator of gliotoxin
biosynthesis, contributes to Aspergillus fumigatus virulence. Infect. Immun. 74: 6761–
6768.
Bok, J.W. and Keller, N.P. (2004). LaeA , a Regulator of Secondary Metabolism in
Aspergillus spp . Eukaryot. Cell 3: 527–535.

323
Bonnett, C.R., Cornish, E.J., Harmsen, A.G. and Burritt, J.B. (2006). Early neutrophil
recruitment and aggregation in the murine lung inhibit germination of Aspergillus
fumigatus Conidia. Infect. Immun. 74: 6528–6539.
Bouligand, J., Deroussent, A., Paci, A., Morizet, J. and Vassal, G. (2006). Liquid
chromatography-tandem mass spectrometry assay of reduced and oxidized glutathione
and main precursors in mice liver. Journal of Chromatography B 832: 67–74.
Boutboul, F., Alberti, C., Leblanc, T., Sulahian, A., Gluckman, E., Derouin, F. and
Ribaud, P. (2002). Invasive Aspergillosis in Allogeneic Stem Cell Transplant
Recipients : Increasing Antigenemia Is Associated with Progressive Disease. Clin.
Infect. Dis. 34: 939–943.
Brace, J.L., Vanderweele, D.J. and Rudin, C.M. (2005). Svf1 inhibits reactive oxygen
species generation and promotes survival under conditions of oxidative stress in
Saccharomyces cerevisiae. Yeast 22: 641–652.
Brachat, S., Dietrich, F.S., Voegeli, S., Zhang, Z., Stuart, L., Lerch, A., Gates, K.,
Gaffney, T. and Philippsen, P. (2003). Reinvestigation of the Saccharomyces cerevisiae
genome annotation by comparison to the genome of a related fungus: Ashbya gossypii.
Genome Biology 4: R45.
Brakhage, A.A. and Langfelder, K. (2002). Menacing mold: the molecular biology of
Aspergillus fumigatus. Annu. Rev. Microbiol. 56: 433–455.
Brakhage, A.A. and Liebmann, B. (2005). Aspergillus fumigatus conidial pigment and
cAMP signal transduction: significance for virulence. Med. Mycol. 43: 75–82.
Brik, A., Salem, A.M., Kamal, A.R., Abdel-Sadek, M., Essa, M., El Sharawy, M.,
Deebes, A. and Bary, K.A. (2008). Surgical outcome of pulmonary aspergilloma. Eur.
J. Cardiothorac. Surg. 34: 882–885.
Brouard, J., Knauer, N., Boelle, P.-Y., Corvol, H., Henrion-Caude, A., Flamant, C.,
Bremont, F., Delaisi, B., Duhamel, J.-F., Marguet, C., Roussey, M., Miesch, M.-C.,
Chadelat, K., Boule, M., Fauroux, B., Ratjen, F., Grasemann, H. and Clement, A.
(2005). Influence of interleukin-10 on Aspergillus fumigatus infection in patients with
cystic fibrosis. J. Infect. Dis. 191: 1988–1991.
Brown, A.J.P., Haynes, K. and Quinn, J. (2009a). Nitrosative and oxidative stress
responses in fungal pathogenicity. Curr. Opin. Microbiol. 12: 384–391.
Brown, M., Dunn, W.B., Dobson, P., Patel, Y., Winder, C.L., Francis-McIntyre, S.,
Begley, P., Carroll, K., Broadhurst, D., Tseng, a, Swainston, N., Spasic, I., Goodacre, R.
and Kell, D.B. (2009b). Mass spectrometry tools and metabolite-specific databases for
molecular identification in metabolomics. The Analyst 134: 1322–1332.
Bruneau, J.M., Magnin, T., Tagat, E., Legrand, R., Bernard, M., Diaquin, M., Fudali, C.
and Latgé, J.P. (2001). Proteome analysis of Aspergillus fumigatus identifies

324
glycosylphosphatidylinositol-anchored proteins associated to the cell wall biosynthesis.
Electrophoresis 22: 2812–2823.
Bruns, S., Kniemeyer, O., Hasenberg, M., Aimanianda, V., Nietzsche, S., Thywissen,
A., Jeron, A., Latgé, J.-P., Brakhage, A.A. and Gunzer, M. (2010a). Production of
extracellular traps against Aspergillus fumigatus in vitro and in infected lung tissue is
dependent on invading neutrophils and influenced by hydrophobin RodA. PLoS
Pathogens 6: e1000873.
Bruns, S., Seidler, M., Albrecht, D., Salvenmoser, S., Remme, N., Hertweck, C.,
Brakhage, A.A., Kniemeyer, O. and Müller, F.-M.C. (2010b). Functional genomic
profiling of Aspergillus fumigatus biofilm reveals enhanced production of the
mycotoxin gliotoxin. Proteomics 10: 3097–3107.
Burkovics, P., Hajdú, I., Szukacsov, V., Unk, I. and Haracska, L. (2009). Role of
PCNA-dependent stimulation of 3’-phosphodiesterase and 3'-5' exonuclease activities of
human Ape2 in repair of oxidative DNA damage. Nucleic Acids Research 37: 4247–
4255.
Cagas, S.E., Jain, M.R., Li, H. and Perlin, D.S. (2011a). Profiling the Aspergillus
fumigatus proteome in response to caspofungin. Antimicrob. Agents Chemother. 55:
146–154.
Cagas, S.E., Jain, M.R., Li, H. and Perlin, D.S. (2011b). The Proteomic Signature of
Aspergillus fumigatus During Early Development. Molecular & Cellular Proteomics
10: M111.010108.
Calvo, A.M., Wilson, R.A., Bok, J.W. and Keller, N.P. (2002). Relationship between
Secondary Metabolism and Fungal Development Fungal Development. Microbiol. Mol.
Biol. Rev. 66: 447–459.
Camps, S.M.T., Van der Linden, J.W.M., Li, Y., Kuijper, E.J., Van Dissel, J.T.,
Verweij, P.E. and Melchers, W.J.G. (2012). Rapid induction of multiple resistance
mechanisms in Aspergillus fumigatus during azole therapy: a case study and review of
the literature. Antimicrob. Agents Chemother. 56: 10–16.
Carberry, S., Molloy, E., Hammel, S., O’Keeffe, G., Jones, G.W., Kavanagh, K. and
Doyle, S. (2012). Gliotoxin effects on fungal growth: Mechanisms and exploitation.
Fungal Genet. Biol. 49: 302–312.
Carberry, S., Neville, C.M., Kavanagh, K. and Doyle, S. (2006). Analysis of major
intracellular proteins of Aspergillus fumigatus by MALDI mass spectrometry:
identification and characterisation of an elongation factor 1B protein with glutathione
transferase activity. Biochemical and Biophysical Research Communications 341:
1096–1104.

325
Carlsson, J., Kierstant, M.P.J. and Brocklehurst, K. (1974). Reactions of L-
Ergothioneine and Some Other Aminothiones with 2,2’- and 4,4'-Dipyridyl Disulphides
and of L-Ergothioneine with lodoacetamide. Biochem. J. 139: 221–235.
Carmona-Gutiérrez, D., Bauer, M.A., Ring, J., Knauer, H., Eisenberg, T., Büttner, S.,
Ruckenstuhl, C., Reisenbichler, A., Magnes, C., Rechberger, G.N., Birner-Gruenberger,
R., Jungwirth, H., Fröhlich, K.-U., Sinner, F., Kroemer, G. and Madeo, F. (2011). The
propeptide of yeast cathepsin D inhibits programmed necrosis. Cell Death & Disease 2:
e161.
Carvalho, A., Cunha, C., Bistoni, F. and Romani, L. (2012). Immunotherapy of
aspergillosis. Clin. Microbiol. Infect. 18: 120–125.
Casals, E., Pfaller, T., Duschl, A., Oostingh, G.J. and Puntes, V. (2010). Time evolution
of the nanoparticle protein corona. ACS Nano 4: 3623–3632.
Casas López, J.L., Sánchez Pérez, J.A., Fernández Sevilla, J.M., Acién Fernández, F..,
Molina Grima, E. and Chisti, Y. (2003). Production of lovastatin by Aspergillus terreus:
effects of the C:N ratio and the principal nutrients on growth and metabolite production.
Enzyme. Microb. Technol. 33: 270–277.
Cedervall, T., Lynch, I., Lindman, S., Berggård, T., Thulin, E., Nilsson, H., Dawson,
K.A. and Linse, S. (2007). Understanding the nanoparticle-protein corona using
methods to quantify exchange rates and affinities of proteins for nanoparticles. Proc.
Natl. Acad. Sci. U. S. A. 104: 2050–2055.
Chabane, S., Sarfati, J., Ibrahim-granet, O., Du, C., Schmidt, C., Mouyna, I., Prevost,
M., Calderone, R. and Latge, J. (2006). Glycosylphosphatidylinositol-Anchored
Ecm33p Influences Conidial Cell Wall Biosynthesis in Aspergillus fumigatus. Applied
and Environmental Microbiology 72: 3259–3267.
Chai, L.Y.A., Netea, M.G., Sugui, J., Vonk, A.G., Van de Sande, W.J., Warris, A.,
Kwon-chung, K.J. and Jan, B. (2011a). Aspergillus fumigatus Conidial Melanin
Modulates Host Cytokine Response. Immunobiology 215: 915–920.
Chai, L.Y.A., Vonk, A.G., Kullberg, B.J., Verweij, P.E., Verschueren, I., Van der Meer,
J.W.M., Joosten, L.A.B., Latgé, J.-P. and Netea, M.G. (2011b). Aspergillus fumigatus
cell wall components differentially modulate host TLR2 and TLR4 responses. Microbes
Infect. 13: 151–159.
Chakraburtty, K. (2001). Elongation Factor 3 in Fungal Translation. In eLS, (John
Wiley & Sons Ltd.), p. DOI: 10.1038/npg.els.0000686.
Chambers, S.T., Bhandari, S., Scott-Thomas, A. and Syhre, M. (2011). Novel
diagnostics: progress toward a breath test for invasive Aspergillus fumigatus. Med.
Mycol. 49 Suppl 1: S54–61.

326
Chamilos, G., Luna, M., Lewis, R.E., Bodey, G.P., Chemaly, R., Tarrand, J.J., Safdar,
A., Raad, I.I. and Kontoyiannis, D.P. (2006). Invasive fungal infections in patients with
hematologic malignancies in a tertiary care cancer center: an autopsy study over a 15-
year period (1989-2003). Haematologica 91: 986–989.
Chang, Y.C., Tsai, H.-F., Karos, M. and Kwon-Chung, K.J. (2004). THTA, a
thermotolerance gene of Aspergillus fumigatus. Fungal Genet. Biol. 41: 888–896.
Chaudhary, N. and Marr, K.A. (2011). Impact of Aspergillus fumigatus in allergic
airway diseases. Clin. Transl. Allergy 1: 4.
Chiang, L.Y., Sheppard, D.C., Gravelat, F.N., Patterson, T.F. and Filler, S.G. (2008).
Aspergillus fumigatus stimulates leukocyte adhesion molecules and cytokine production
by endothelial cells in vitro and during invasive pulmonary disease. Infect. Immun. 76:
3429–3438.
Choi, H.S., Shim, J.S., Kim, J.-A., Kang, S.W. and Kwon, H.J. (2007). Discovery of
gliotoxin as a new small molecule targeting thioredoxin redox system. Biochem.
Biophys. Res. Commun. 359: 523–528.
Coleman, J.J., Ghosh, S., Okoli, I. and Mylonakis, E. (2011). Antifungal Activity of
Microbial Secondary Metabolites. PLoS ONE 6: e25321.
Colognato, R., Laurenza, I., Fontana, I., Coppedé, F., Siciliano, G., Coecke, S., Aruoma,
O.I., Benzi, L. and Migliore, L. (2006). Modulation of hydrogen peroxide-induced DNA
damage, MAPKs activation and cell death in PC12 by ergothioneine. Clinical Nutrition
25: 135–145.
Coméra, C., André, K., Laffitte, J., Collet, X., Galtier, P. and Maridonneau-Parini, I.
(2007). Gliotoxin from Aspergillus fumigatus affects phagocytosis and the organization
of the actin cytoskeleton by distinct signalling pathways in human neutrophils.
Microbes Infect. 9: 47–54.
Conesa, A., Götz, S., García-Gómez, J.M., Terol, J., Talón, M. and Robles, M. (2005).
Blast2GO: a universal tool for annotation, visualization and analysis in functional
genomics research. Bioinformatics 21: 3674–3676.
Costanzo, M., Baryshnikova, A., Bellay, J., Kim, Y., Spear, E.D., Sevier, C.S., Ding,
H., Koh, J.L.Y., Toufighi, K., Mostafavi, S., Prinz, J., St Onge, R.P., VanderSluis, B., et
al. (2010). The genetic landscape of a cell. Science 327: 425–431.
Coyle, C.M., Kenaley, S.C., Rittenour, W.R. and Panaccione, D.G. (2007). Association
of ergot alkaloids with conidiation in Aspergillus fumigatus. Mycologia 99: 804–811.
Cramer, R.A., Gamcsik, M.P., Brooking, R.M., Najvar, L.K., Kirkpatrick, W.R.,
Patterson, T.F., Balibar, C.J., Graybill, J.R., Perfect, J.R., Abraham, S.N. and Steinbach,
W.J. (2006). Disruption of a nonribosomal peptide synthetase in Aspergillus fumigatus
eliminates gliotoxin production. Eukaryot. Cell 5: 972–980.

327
Crosdale, D.J., Poulton, K. V, Ollier, W.E., Thomson, W. and Denning, D.W. (2001).
Mannose-binding lectin gene polymorphisms as a susceptibility factor for chronic
necrotizing pulmonary aspergillosis. J. Infect. Dis. 184: 653–656.
Dagenais, T.R.T., Giles, S.S., Aimanianda, V., Latgé, J.-P., Hull, C.M. and Keller, N.P.
(2010). Aspergillus fumigatus LaeA-mediated phagocytosis is associated with a
decreased hydrophobin layer. Infect. Immun. 78: 823–829.
Dagenais, T.R.T. and Keller, N.P. (2009). Pathogenesis of Aspergillus fumigatus in
Invasive Aspergillosis. Clin. Microbiol. Rev. 22: 447–465.
Davies, D.H., Liang, X., Hernandez, J.E., Randall, A., Hirst, S., Mu, Y., Romero, K.M.,
Nguyen, T.T., Kalantari-Dehaghi, M., Crotty, S., Baldi, P., Villarreal, L.P. and Felgner,
P.L. (2005). Profiling the humoral immune response to infection by using proteome
microarrays: high-throughput vaccine and diagnostic antigen discovery. Proc. Natl.
Acad. Sci. U. S. A. 102: 547–552.
Davis, C., Carberry, S., Schrettl, M., Singh, I., Stephens, J.C., Barry, S.M., Kavanagh,
K., Challis, G.L., Brougham, D. and Doyle, S. (2011a). The role of glutathione S-
transferase GliG in gliotoxin biosynthesis in Aspergillus fumigatus. Chem. Biol. 18:
542–552.
Davis, C., Gordon, N., Murphy, S., Singh, I., Kavanagh, K., Carberry, S. and Doyle, S.
(2011b). Single-pot derivatisation strategy for enhanced gliotoxin detection by HPLC
and MALDI-ToF mass spectrometry. Analytical and Bioanalytical Chemistry 401:
2519–2529.
Denning, D.W. and Hope, W.W. (2010). Therapy for fungal diseases: opportunities and
priorities. Trends Microbiol. 18: 195–204.
Dettmer, K., Aronov, P.A. and Hammock, B.D. (2007). Mass Spectrometry-based
Metabolomics. Mass Spectrometry Reviews 26: 51–78.
Dewson, G., Kratina, T., Czabotar, P., Day, C.L., Adams, J.M. and Kluck, R.M. (2009).
Bak activation for apoptosis involves oligomerization of dimers via their α6 helices.
Mol. Cell 36: 696–703.
Dichtl, K., Helmschrott, C., Dirr, F. and Wagener, J. (2012). Deciphering cell wall
integrity signalling in Aspergillus fumigatus: identification and functional
characterization of cell wall stress sensors and relevant Rho GTPases. Mol. Microbiol.
83: 506–519.
Dinamarco, T.M., Almeida, R.S., De Castro, P.A., Brown, N.A., Dos Reis, T.F.,
Ramalho, L.N.Z., Savoldi, M., Goldman, M.H.S. and Goldman, G.H. (2012). Molecular
characterization of the putative transcription factor SebA involved in virulence in
Aspergillus fumigatus. Eukaryot. Cell 11: 518–531.

328
Dombrink-Kmizman, M.A. and Blackburn, J.A. (2005). Evaluation of several culture
media for production of patulin by Penicillium species. Int. J. Food Microbiol. 98: 241–
248.
Domingo, M.P., Colmenarejo, C., Martínez-Lostao, L., Müllbacher, A., Jarne, C.,
Revillo, M.J., Delgado, P., Roc, L., Meis, J.F., Rezusta, A., Pardo, J. and Gálvez, E.M.
(2012). Bis (methyl) gliotoxin proves to be a more stable and reliable marker for
invasive aspergillosis than gliotoxin and suitable for use in diagnosis. Diagn. Microbiol.
Infect. Dis. 73: 57–64.
Doyle, S. (2011a). Fungal Proteomics. In Fungi: Biology and Applications, K.
Kavanagh, ed. (Wiley, New York), p. ISBN: 111997769X, 9781119977698.
Doyle, S. (2011b). Fungal proteomics: from identification to function. FEMS
Microbiology Letters 321: 1–9.
Du, C., Sarfati, J., Latge, J.-P. and Calderone, R. (2006). The role of the sakA (Hog1)
and tcsB (sln1) genes in the oxidant adaptation of Aspergillus fumigatus. Med. Mycol.
44: 211–218.
Dyugovskaya, L., Polyakov, A., Ginsberg, D., Lavie, P. and Lavie, L. (2011).
Molecular pathways of spontaneous and TNFalpha-mediated neutrophil apoptosis under
intermittent hypoxia. Am. J. Respir. Cell Mol. Biol. 45: 154–162.
Falagas, M.E., Vardakas, K.Z. and Samonis, G. (2008). Decreasing the incidence and
impact of infections in neutropenic patients: evidence from meta-analyses of
randomized controlled trials. Curr. Med. Res. Opin. 24: 215–235.
Fallon, J.P., Reeves, E.P. and Kavanagh, K. (2010). Inhibition of neutrophil function
following exposure to the Aspergillus fumigatus toxin fumagillin. J. Med. Microbiol.
59: 625–633.
Fedorova, N.D., Khaldi, N., Joardar, V.S., Maiti, R., Amedeo, P., Anderson, M.J.,
Crabtree, J., Silva, J.C., Badger, J.H., Albarraq, A., Angiuoli, S., Bussey, H., Bowyer,
P., Cotty, P.J., Dyer, P.S., Egan, A., Galens, K., Fraser-Liggett, C.M., Haas, B.J.,
Inman, J.M., Kent, R., Lemieux, S., Malavazi, I., Orvis, J., Roemer, T., Ronning, C.M.,
Sundaram, J.P., Sutton, G., Turner, G., Venter, J.C., White, O.R., Whitty, B.R.,
Youngman, P., Wolfe, K.H., Goldman, G.H., Wortman, J.R., Jiang, B., Denning, D.W.
and Nierman, W.C. (2008). Genomic islands in the pathogenic filamentous fungus
Aspergillus fumigatus. PLoS Genetics 4: e1000046.
Feldberg, L., Venger, I., Malitsky, S., Rogachev, I. and Aharoni, A. (2009). Dual
Labeling of Metabolites for Metabolome Analysis ( DLEMMA ): A New Approach for
the Identification and Relative Quantification of Metabolites by Means of Dual Isotope
Labeling and Liquid Chromatography-Mass Spectrometry. Analytical Chemistry 81:
9257–9266.

329
Feldmesser, M. (2006). Role of neutrophils in invasive aspergillosis. Infect. Immun. 74:
6514–6516.
Feng, G.H. and Leonard, T.J. (1998). Culture conditions control expression of the genes
for aflatoxin and sterigmatocystin biosynthesis in Aspergillus parasiticus and A.
nidulans. Applied and Environmental Microbiology 64: 2275–2277.
Fenn, J., Mann, M., Meng, C., Wong, S. and Whitehouse, C. (1989). Electrospray
ionization for mass spectrometry of large biomolecules. Science 246: 64–71.
Fernie, A.R., Carrari, F. and Sweetlove, L.J. (2004). Respiratory metabolism:
glycolysis, the TCA cycle and mitochondrial electron transport. Current Opinion in
Plant Biology 7: 254–261.
Ferreira de Oliveira, J.M.P. and De Graaff, L.H. (2011). Proteomics of industrial fungi:
trends and insights for biotechnology. Applied Microbiology and Biotechnology 89:
225–237.
Ferreira de Oliveira, J.M.P., Van Passel, M.W.J., Schaap, P.J. and De Graaff, L.H.
(2011). Proteomic analysis of the secretory response of Aspergillus niger to D-maltose
and D-xylose. PloS One 6: e20865.
Finoulst, I., Pinkse, M., Van Dongen, W. and Verhaert, P. (2011). Sample preparation
techniques for the untargeted LC-MS-based discovery of peptides in complex biological
matrices. Journal of Biomedicine & Biotechnology 2011: 245291.
Forseth, R.R., Fox, E.M., Chung, D., Howlett, B.J., Keller, N.P., Frank, C. and
Schroeder, F.C. (2011). Identification of cryptic products of the gliotoxin gene cluster
using NMR-based comparative metabolomics and a model for gliotoxin biosynthesis. J.
Am. Chem. Soc. 133: 9678–9681.
Fox, E.M. and Howlett, B.J. (2008). Biosynthetic gene clusters for
epipolythiodioxopiperazines in filamentous fungi. Mycol. Res. 112: 162–169.
Fraczek, M.G., Rashid, R., Denson, M., Denning, D.W. and Bowyer, P. (2010).
Aspergillus fumigatus allergen expression is coordinately regulated in response to
hydrogen peroxide and cyclic AMP. Clinical and Molecular Allergy : CMA 8: 15.
Franzoni, F., Colognato, R., Galetta, F., Laurenza, I., Barsotti, M., Di Stefano, R.,
Bocchetti, R., Regoli, F., Carpi, A., Balbarini, A., Migliore, L. and Santoro, G. (2006).
An in vitro study on the free radical scavenging capacity of ergothioneine: comparison
with reduced glutathione, uric acid and trolox. Biomedicine & Pharmacotherapy 60:
453–457.
Franzosa, E.A., Albanèse, V., Frydman, J., Xia, Y. and McClellan, A.J. (2011).
Heterozygous yeast deletion collection screens reveal essential targets of Hsp90. PloS
One 6: e28211.

330
Frisvad, J.C., Andersen, B. and Thrane, U. (2008). The use of secondary metabolite
profiling in chemotaxonomy of filamentous fungi. Mycological Research 112: 231–240.
Frisvad, J.C., Rank, C., Nielsen, K.F. and Larsen, T.O. (2009). Metabolomics of
Aspergillus fumigatus. Med. Mycol. 47 Suppl 1: S53–71.
Furukawa, K., Hoshi, Y., Maeda, T., Nakajima, T. and Abe, K. (2005). Aspergillus
nidulans HOG pathway is activated only by two-component signalling pathway in
response to osmotic stress. Molecular Microbiology 56: 1246–1261.
Galagan, J.E., Calvo, S.E., Cuomo, C., Ma, L.-J., Wortman, J.R., Batzoglou, S., Lee, S.-
I., Baştürkmen, M., Spevak, C.C., Clutterbuck, J., Kapitonov, V., Jurka, J.,
Scazzocchio, C., Farman, M., Butler, J., Purcell, S., Harris, S., Braus, G.H., Draht, O.,
Busch, S., D’Enfert, C., Bouchier, C., Goldman, G.H., Bell-Pedersen, D., Griffiths-
Jones, S., Doonan, J.H., Yu, J., Vienken, K., Pain, A., Freitag, M., Selker, E.U., Archer,
D.B., Peñalva, M.A., Oakley, B.R., Momany, M., Tanaka, T., Kumagai, T., Asai, K.,
Machida, M., Nierman, W.C., Denning, D.W., Caddick, M., Hynes, M., Paoletti, M.,
Fischer, R., Miller, B., Dyer, P., Sachs, M.S., Osmani, S.A. and Birren, B.W. (2005).
Sequencing of Aspergillus nidulans and comparative analysis with A. fumigatus and A.
oryzae. Nature 438: 1105–1115.
Gallagher, L. (2010). Functional Genomic Analysis of Natural Product Biosynthesis and
Secretion in Aspergillus fumigatus.
Gallagher, L., Owens, R.A., O’ Keeffe, G., Dolan, S.K., Schrettl, M., Kavanagh, K.,
Jones, G. and Doyle, S. (2012). The Aspergillus fumigatus Protein GliK Protects
Against Oxidative Stress and is Essential for Gliotoxin Biosynthesis. Eukaryot. Cell 11:
1226–1238.
Gangneux, J.-P., Camus, C. and Philippe, B. (2010). Epidemiology of invasive
aspergillosis and risk factors in non neutropaenic patients. Rev. Mal. Respir. 27: e34–46.
Gangwani, L. (2006). Deficiency of the zinc finger protein ZPR1 causes defects in
transcription and cell cycle progression. The Journal of Biological Chemistry 281:
40330–40340.
Garbati, M.A., Alasmari, F.A., Al-Tannir, M.A. and Tleyjeh, I.M. (2012). The role of
combination antifungal therapy in the treatment of invasive aspergillosis: a systematic
review. Int. J. Infect. Dis. 16: e76–81.
Garcia-Campusano, F., Anaya, V.-H., Robledo-Arratia, L., Quezada, H., Hernandez, H.,
Riego, L. and Gonzales, A. (2009). ALT1-encoded alanine aminotransferase plays a
central role in the metabolism of alanine in Saccharomyces cerevisiae. Can. J.
Microbiol. 374: 368–374.
Gardiner, D.M. and Howlett, B.J. (2005). Bioinformatic and expression analysis of the
putative gliotoxin biosynthetic gene cluster of Aspergillus fumigatus. FEMS Microbiol.
Lett. 248: 241–248.

331
Gardiner, D.M., Jarvis, R.S. and Howlett, B.J. (2005a). The ABC transporter gene in the
sirodesmin biosynthetic gene cluster of Leptosphaeria maculans is not essential for
sirodesmin production but facilitates self-protection. Fungal Genet. Biol. 42: 257–263.
Gardiner, D.M., Waring, P. and Howlett, B.J. (2005b). The epipolythiodioxopiperazine
(ETP) class of fungal toxins: distribution, mode of action, functions and biosynthesis.
Microbiology 151: 1021–1032.
Gastebois, A., Fontaine, T., Latgé, J.-P. and Mouyna, I. (2010a). beta(1-
3)Glucanosyltransferase Gel4p is essential for Aspergillus fumigatus. Eukaryot. Cell 9:
1294–1298.
Gastebois, A., Mouyna, I., Simenel, C., Clavaud, C., Coddeville, B., Delepierre, M.,
Latgé, J.-P. and Fontaine, T. (2010b). Characterization of a new beta(1-3)-glucan
branching activity of Aspergillus fumigatus. The Journal of Biological Chemistry 285:
2386–2396.
Gauss, R., Kanehara, K., Carvalho, P., Ng, D.T.W. and Aebi, M. (2011). A complex of
Pdi1p and the mannosidase Htm1p initiates clearance of unfolded glycoproteins from
the endoplasmic reticulum. Molecular Cell 42: 782–793.
Gautam, P., Shankar, J., Madan, T., Sirdeshmukh, R., Sundaram, C.S., Gade, W.N.,
Basir, S.F. and Sarma, P.U. (2008). Proteomic and transcriptomic analysis of
Aspergillus fumigatus on exposure to amphotericin B. Antimicrobial Agents and
Chemotherapy 52: 4220–4227.
Gautam, P., Sundaram, C.S., Madan, T., Gade, W.N., Shah, A., Sirdeshmukh, R. and
Sarma, P.U. (2007). Identification of novel allergens of Aspergillus fumigatus using
immunoproteomics approach. Clinical and Experimental Allergy : Journal of the British
Society for Allergy and Clinical Immunology 37: 1239–1249.
Gautam, P., Upadhyay, S.K., Hassan, W., Madan, T., Sirdeshmukh, R., Sundaram, C.S.,
Gade, W.N., Basir, S.F., Singh, Y. and Sarma, P.U. (2011). Transcriptomic and
proteomic profile of Aspergillus fumigatus on exposure to artemisinin. Mycopathologia
172: 331–346.
Gauthier, T., Wang, X., Sifuentes Dos Santos, J., Fysikopoulos, A., Tadrist, S., Canlet,
C., Artigot, M.P., Loiseau, N., Oswald, I.P. and Puel, O. (2012). Trypacidin, a spore-
borne toxin from Aspergillus fumigatus, is cytotoxic to lung cells. PloS One 7: e29906.
Goffin, L., Vodala, S., Fraser, C., Ryan, J., Timms, M., Meusburger, S., Catimel, B.,
Nice, E.C., Silver, P.A., Xiao, C., Jans, D.A. and Gething, M.H. (2006). The Unfolded
Protein Response Transducer Ire1p Contains a Nuclear Localization Sequence
Recognized by Multiple β Importins. Mol. Biol. Cell 17: 5309–5323.
González-Fernández, R., Prats, E. and Jorrín-Novo, J. V (2010). Proteomics of plant
pathogenic fungi. Journal of Biomedicine & Biotechnology 2010: 932527.

332
Gordon, S.M., Deng, J., Lu, L.J. and Davidson, W.S. (2010). Proteomic
Characterization of Human Plasma High Density Lipoprotein Fractionated by Gel
Filtration Chromatography. J. Proteome Res. 9: 5239–5249.
Grahl, N., Dinamarco, T.M., Willger, S.D., Goldman, G.H. and Cramer, R.A. (2012).
Aspergillus fumigatus mitochondrial electron transport chain mediates oxidative stress
homeostasis, hypoxia responses and fungal pathogenesis. Molecular Microbiology 84:
383–399.
Graybill, J.R., Bocanegra, R., Najvar, L.K., Loebenberg, D. and Luther, M.F. (1998).
Granulocyte colony-stimulating factor and azole antifungal therapy in murine
aspergillosis: role of immune suppression. Antimicrob. Agents Chemother. 42: 2467–
2473.
Greganova, E., Altmann, M. and Bütikofer, P. (2011). Unique modifications of
translation elongation factors. The FEBS Journal 278: 2613–2624.
Griffiths, G.J., Dubrez, L., Morgan, C.P., Jones, N.A., Whitehouse, J., Corfe, B.M.,
Dive, C. and Hickman, J.A. (1999). Cell damage-induced conformational changes of the
pro-apoptotic protein Bak in vivo precede the onset of apoptosis. J. Cell Biol. 144: 903–
914.
Griffiths, W.J. and Wang, Y. (2009). Mass spectrometry: from proteomics to
metabolomics and lipidomics. Chem. Soc. Rev. 38: 1882–1896.
Grillo, M.A. and Colombatto, S. (2008). S-adenosylmethionine and its products. Amino
Acids 34: 187–193.
Gross, S.R. and Kinzy, T.G. (2005). Translation elongation factor 1A is essential for
regulation of the actin cytoskeleton and cell morphology. Nature Structural and
Molecular Biology 12: 772–778.
Grundmann, A. and Li, S.-M. (2005). Overproduction, purification and characterization
of FtmPT1, a brevianamide F prenyltransferase from Aspergillus fumigatus.
Microbiology 151: 2199–2207.
Gründemann, D. (2012). The ergothioneine transporter controls and indicates
ergothioneine activity--a review. Preventive Medicine 54 Suppl: S71–4.
Gründemann, D., Harlfinger, S., Golz, S., Geerts, A., Lazar, A., Berkels, R., Jung, N.,
Rubbert, A. and Schömig, E. (2005). Discovery of the ergothioneine transporter. Proc.
Natl. Acad. Sci. U. S. A. 102: 5256–5261.
Gstaiger, M. and Aebersold, R. (2009). Applying mass spectrometry-based proteomics
to genetics, genomics and network biology. Nature Reviews. Genetics 10: 617–627.

333
Guetsova, M.L., Crother, T.R., Taylor, M.W. and Daignan-Fornier, B. (1999). Isolation
and Characterization of the Saccharomyces cerevisiae XPT1 Gene Encoding Xanthine
Phosphoribosyl Transferase. Journal of Bacteriology 181: 2984.
Guillemette, T., Peij, N.N.M.E. Van, Goosen, T., Lanthaler, K., Robson, G.D., Van den
Hondel, C.A., Stam, H. and Archer, D.B. (2007). Genomic analysis of the secretion
stress response in the enzyme-producing cell factory Aspergillus niger. BMC Genomics
8: 158–175.
Guthke, R., Möller, U., Hoffmann, M., Thies, F. and Töpfer, S. (2005). Dynamic
network reconstruction from gene expression data applied to immune response during
bacterial infection. Bioinformatics 21: 1626–1634.
Haas, H. (2012). Iron - A Key Nexus in the Virulence of Aspergillus fumigatus. Front.
Microbiol. 3: 28.
Hafen, G.M., Hartl, D., Regamey, N., Casaulta, C. and Latzin, P. (2009). Allergic
bronchopulmonary aspergillosis: the hunt for a diagnostic serological marker in cystic
fibrosis patients. Expert Review of Molecular Diagnostics 9: 157–164.
Hagag, S., Kubitschek-Barreira, P., Neves, G.W.P., Amar, D., Nierman, W., Shalit, I.,
Shamir, R., Lopes-Bezerra, L. and Osherov, N. (2012). Transcriptional and Proteomic
Analysis of the Aspergillus fumigatus ΔprtT Protease-Deficient Mutant. PLoS ONE 7:
e33604.
Halket, J.M., Waterman, D., Przyborowska, A.M., Patel, R.K.P., Fraser, P.D. and
Bramley, P.M. (2005). Chemical derivatization and mass spectral libraries in metabolic
profiling by GC/MS and LC/MS/MS. Journal of Experimental Botany 56: 219–243.
Hall, T.A. (1999). BioEdit: a user-friendly biological sequence alignment editor and
analysis program for Windows 95/98/NT. Nucleic Acids Symposium Series 41: 95–98.
Han, X., Gross, R.W., Introduction, I. and Marzo, D. (2005). Shotgun Lipidomics :
Electrospray Ionization Mass Spectrometric Analysis and Quantitation of Cellular
Lipidomes Direactly From Crude Extracts of Biological Samples. Mass Spectrometry
Reviews 24: 367–412.
Hand, C.E. and Honek, J.F. (2005). Biological chemistry of naturally occurring thiols of
microbial and marine origin. Journal of Natural Products 68: 293–308.
Hand, C.E., Taylor, N.J. and Honek, J.F. (2005). Ab initio studies of the properties of
intracellular thiols ergothioneine and ovothiol. Bioorganic & Medicinal Chemistry
Letters 15: 1357–1360.
Hao, W., Pan, Y.-X., Ding, Y.-Q., Xiao, S., Yin, K., Wang, Y.-D., Qiu, L.-W., Zhang,
Q.-L., Woo, P.C.Y., Lau, S.K.P., Yuen, K.-Y. and Che, X.-Y. (2008). Well-
characterized monoclonal antibodies against cell wall antigen of Aspergillus species
improve immunoassay specificity and sensitivity. CVI 15: 194–202.

334
Harder, A., Wildgruber, R., Nawrocki, A., Fey, S.J., Larsen, P.M. and Görg, A. (1999).
Comparison of yeast cell protein solubilization procedures for two-dimensional
electrophoresis. Electrophoresis 20: 826–829.
Hartl, L., Zach, S. and Seidl-Seiboth, V. (2012). Fungal chitinases: diversity,
mechanistic properties and biotechnological potential. Applied Microbiology and
Biotechnology 93: 533–543.
Hartmann, T., Cairns, T.C., Olbermann, P., Morschhäuser, J., Bignell, E.M. and
Krappmann, S. (2011). Oligopeptide transport and regulation of extracellular
proteolysis are required for growth of Aspergillus fumigatus on complex substrates but
not for virulence. Molecular Microbiology 82: 917–935.
Henriet, S.S. V, Verweij, P.E. and Warris, A. (2012). Aspergillus nidulans and Chronic
Granulomatous Disease: A Unique Host-Pathogen Interaction. J. Infect. Dis. 206: 1128–
1137.
Herbrecht, R., Denning, D.W., Patterson, T.F., Bennett, J.E., Greene, R.E., Oestmann,
J.-W., Kern, W. V, Marr, K.A., Ribaud, P., Lortholary, O., Sylvester, R., Rubin, R.H.,
Wingard, J.R., Stark, P., Durand, C., Caillot, D., Thiel, E., Chandrasekar, P.H., Hodges,
M.R., Schlamm, H.T., Troke, P.F. and De Pauw, B. (2002). Voriconazole versus
Amphotericin B for Primary Therapy of Invasive Aspergillosis. N. Engl. J. Med. 347:
408–415.
Herbrecht, R., Maertens, J., Baila, L., Aoun, M., Heinz, W., Martino, R., Schwartz, S.,
Ullmann, a J., Meert, L., Paesmans, M., Marchetti, O., Akan, H., Ameye, L.,
Shivaprakash, M. and Viscoli, C. (2010). Caspofungin first-line therapy for invasive
aspergillosis in allogeneic hematopoietic stem cell transplant patients: an European
Organisation for Research and Treatment of Cancer study. Bone Marrow. Transplant.
45: 1227–1233.
Hercus, T.R., Broughton, S.E., Ekert, P.G., Ramshaw, H.S., Perugini, M.,
Grimbaldeston, M., Woodcock, J.M., Thomas, D., Pitson, S., Hughes, T., D’Andrea,
R.J., Parker, M.W. and Lopez, A.F. (2012). The GM-CSF receptor family: mechanism
of activation and implications for disease. Growth Factors 30: 63–75.
Hernández, O., Almeida, A.J., Gonzalez, A., Garcia, A.M., Tamayo, D., Cano, L.E.,
Mcewen, J.G., Herna, O. and Restrepo, A. (2010). A 32-Kilodalton Hydrolase Plays an
Important Role in Paracoccidioides brasiliensis Adherence to Host Cells and Influences
Pathogenicity. Infect. Immun. 78: 5280–5286.
Hohl, T.M., Van Epps, H.L., Rivera, A., Morgan, L. a, Chen, P.L., Feldmesser, M. and
Pamer, E.G. (2005). Aspergillus fumigatus triggers inflammatory responses by stage-
specific beta-glucan display. PLoS Pathogens 1: e30.
Hope, W.W., Walsh, T.J. and Denning, D.W. (2005). Laboratory diagnosis of invasive
aspergillosis. Lancet Infect. Dis. 5: 609–622.

335
Horn, F., Heinekamp, T., Kniemeyer, O., Pollmächer, J., Valiante, V. and Brakhage,
A.A. (2012). Systems biology of fungal infection. Frontiers in Microbiology 3: 108.
Hortschansky, P., Eisendle, M., Al-Abdallah, Q., Schmidt, A.D., Bergmann, S., Thön,
M., Kniemeyer, O., Abt, B., Seeber, B., Werner, E.R., Kato, M., Brakhage, A.A. and
Haas, H. (2007). Interaction of HapX with the CCAAT-binding complex--a novel
mechanism of gene regulation by iron. The EMBO Journal 26: 3157–3168.
Howard, S.J., Webster, I., Moore, C.B., Gardiner, R.E., Park, S., Perlin, D.S. and
Denning, D.W. (2006). Multi-azole resistance in Aspergillus fumigatus. Int. J.
Antimicrob. Agents 28: 450–453.
Hurne, A.M., Chai, C.L.L. and Waring, P. (2000). Inactivation of Rabbit Muscle
Creatine Kinase by Reversible Formation of an Internal Disulfide Bond Induced by the
Fungal Toxin Gliotoxin. J. Biol. Chem. 275: 25202–25206.
Ibrahim-Granet, O., Philippe, B., Boleti, H., Boisvieux-Ulrich, E., Grenet, D., Stern, M.
and Latge, J.P. (2003). Phagocytosis and Intracellular Fate of Aspergillus fumigatus
Conidia in Alveolar Macrophages. Infect. Immun. 71: 891–903.
Ishikawa, M., Ninomiya, T., Akabane, H., Kushida, N., Tsujiuchi, G., Ohyama, M.,
Gomi, S., Shito, K. and Murata, T. (2009). Pseurotin A and its analogues as inhibitors of
immunoglobulin E production. Bioorg. Med. Chem. Lett. 19: 1457–1460.
Jackson, R.J., Hellen, C.U.T. and Pestova, T. V (2010). The mechanism of eukaryotic
translation initiation and principles of its regulation. Nature Reviews. Molecular Cell
Biology 11: 113–127.
Jain, R., Valiante, V., Remme, N., Docimo, T., Heinekamp, T., Hertweck, C.,
Gershenzon, J., Haas, H. and Brakhage, A.A. (2011). The MAP kinase MpkA controls
cell wall integrity, oxidative stress response, gliotoxin production and iron adaptation in
Aspergillus fumigatus. Mol. Microbiol. 82: 39–53.
Jarque, I., Tormo, M., Bello, J.L., Rovira, M., Batlle, M., Julia, A., Tabares, S., Rivas,
C., Capote, F.J. and Sanz, M.A. (2012). Caspofungin for the treatment of invasive
fungal disease in hematological patients (ProCAS Study ). Med. Mycol. 1–5.
Jayaram, P.N., Roy, G. and Mugesh, G. (2008). Effect of thione—thiol tautomerism on
the inhibition of lactoperoxidase by anti-thyroid drugs and their analogues. Journal of
Chemical Sciences 120: 143–154.
Jeans, A.R., Howard, S.J., Al-Nakeeb, Z., Goodwin, J., Gregson, L., Warn, P. a and
Hope, W.W. (2012). Combination of voriconazole and anidulafungin for the treatment
of triazole resistant Aspergillus fumigatus in an in vitro model of invasive pulmonary
aspergillosis. Antimicrob. Agents Chemother. 56: 5180–5185.
Jegorov, A., Hajduch, M., Sulc, M. and Havlicek, V. (2006). Nonribosomal cyclic
peptides : specific markers of fungal infections. J. Mass Spectrom. 41: 563–576.

336
Johnson, G.L., Bibby, D.F., Wong, S., Agrawal, S.G. and Bustin, S.A. (2012). A MIQE-
Compliant Real-Time PCR Assay for Aspergillus Detection. PLoS ONE 7: e40022.
Johnson, L.B. and Kauffman, C.A. (2003). Voriconazole: a new triazole antifungal
agent. Clin. Infect. Dis. 36: 630–637.
Jørgensen, T.R., Goosen, T., Van den Hondel, C.A., Ram, A.F.J. and Iversen, J.J.L.
(2009). Transcriptomic comparison of Aspergillus niger growing on two different
sugars reveals coordinated regulation of the secretory pathway. BMC Genomics 10: 44.
Kacprzak, M.M., Lewandowska, I., Matthews, R.G. and Paszewski, A. (2003).
Transcriptional regulation of methionine synthase by homocysteine and choline in
Aspergillus nidulans. The Biochemical Journal 376: 517–524.
Kall, L., Krogh, A. and Sonnhammer, E.L.L. (2004). A Combined Transmembrane
Topology and Signal Peptide Prediction Method. J. Mol. Biol. 338: 1027–1036.
Kaloriti, D., Tillmann, A., Cook, E., Jacobsen, M., You, T., Lenardon, M., Ames, L.,
Barahona, M., Chandrasekaran, K., Coghill, G., Goodman, D., Gow, N.A.R., Grebogi,
C., Ho, H.-L., Ingram, P., McDonagh, A., Moura, A.P.S. De, Pang, W., Puttnam, M.,
Radmaneshfar, E., Romano, M.C., Silk, D., Stark, J., Stumpf, M., Thiel, M., Thorne, T.,
Usher, J., Yin, Z., Haynes, K. and Brown, A.J.P. (2012). Combinatorial stresses kill
pathogenic Candida species. Medical Mycology 50: 699–709.
Kanai, M., Masuda, M., Takaoka, Y., Ikeda, H., Masaki, K., Fujii, T. and Iefuji, H.
(2012). Adenosine kinase-deficient mutant of Saccharomyces cerevisiae accumulates S-
adenosylmethionine because of an enhanced methionine biosynthesis pathway. Appl.
Microbiol. Biotechnol. 1–8.
Kanehisa, M., Goto, S., Sato, Y., Furumichi, M. and Tanabe, M. (2012). KEGG for
intergration and interpretation of large-scale molecular data sets. Nucleic Acids
Research 40: D109–D114.
Kapp, L.D. and Lorsch, J.R. (2004). The molecular mechanics of eukaryotic translation.
Annual Review of Biochemistry 73: 657–704.
Karas, M., Gluckmann, M. and Schafer, J. (2000). Ionization in matrix-assisted laser
desorption / ionization : singly charged molecular ions are the lucky survivors. J. Mass
Spectrom. 35: 1–12.
Karas, M. and Hillenkamp, F. (1988). Laser Desorption Ionization of Proteins with
Molecular Masses Exceeding 10 000 Daltons. Analytical Chemistry 60: 2299–2301.
Kartsonis, N.A., Saah, A.J., Joy Lipka, C., Taylor, A.F. and Sable, C. a (2005). Salvage
therapy with caspofungin for invasive aspergillosis: results from the caspofungin
compassionate use study. J. Infect. 50: 196–205.

337
Kato, N., Suzuki, H., Takagi, H., Uramoto, M., Takahashi, S. and Osada, H. (2011).
Gene disruption and biochemical characterization of verruculogen synthase of
Aspergillus fumigatus. Chembiochem 12: 711–714.
Kaul, G., Pattan, G. and Rafeequi, T. (2011). Eukaryotic elongation factor-2 (eEF2): its
regulation and peptide chain elongation. Cell Biochemistry and Function 29: 227–234.
Kawamura, S., Maesaki, S., Tomono, K., Tashiro, T. and Kohno, S. (2000). Clinical
evaluation of 61 patients with pulmonary aspergilloma. Internal Medicine 39: 209–212.
Kazakevich, Y. V. and LoBrutto, R. (2007). HPLC for Pharmaceutical Scientists
(Wiley).
Keidel, E.-M., Ribitsch, D. and Lottspeich, F. (2010). Equalizer technology--Equal
rights for disparate beads. Proteomics 10: 2089–2098.
Keller, N., Bok, J., Chung, D., Perrin, R.M. and Keats Shwab, E. (2006). LaeA, a global
regulator of Aspergillus toxins. Med. Mycol. 44: 83–85.
Keller, N.P., Turner, G. and Bennett, J.W. (2005). Fungal secondary metabolism - from
biochemistry to genomics. Nat. Rev. Microbiol. 3: 937–947.
Khaldi, N., Seifuddin, F.T., Turner, G., Haft, D., Nierman, W.C., Wolfe, K.H. and
Fedorova, N.D. (2010). SMURF: genomic mapping of fungal secondary metabolite
clusters. Fungal Genet. Biol. 47: 736–741.
Khoufache, K., Puel, O., Loiseau, N., Delaforge, M., Rivollet, D., Coste, A.,
Cordonnier, C., Escudier, E., Botterel, F. and Bretagne, S. (2007). Verruculogen
associated with Aspergillus fumigatus hyphae and conidia modifies the
electrophysiological properties of human nasal epithelial cells. BMC Microbiology 7: 5.
Kikuchi, K. and Kakeya, H. (2006). A bridge between chemistry and biology. Nature
Chemical Biology 2: 392–394.
Kim, Y., Nandakumar, M.P. and Marten, M.R. (2007). Proteomics of filamentous fungi.
Trends in Biotechnology 25: 395–400.
Kleijn, R.J., Van Winden, W. a, Van Gulik, W.M. and Heijnen, J.J. (2005). Revisiting
the 13
C-label distribution of the non-oxidative branch of the pentose phosphate pathway
based upon kinetic and genetic evidence. The FEBS Journal 272: 4970–4982.
Kleinberg, M. (2006). What is the current and future status of conventional
amphotericin B? Int. J. Antimicrob. Agents 27 Suppl 1: 12–16.
Kniemeyer, O. (2011). Proteomics of eukaryotic microorganisms: The medically and
biotechnologically important fungal genus Aspergillus. Proteomics 11: 1–12.

338
Kniemeyer, O., Lessing, F., Scheibner, O., Hertweck, C. and Brakhage, A.A. (2006).
Optimisation of a 2-D gel electrophoresis protocol for the human-pathogenic fungus
Aspergillus fumigatus. Current Genetics 49: 178–189.
Kniemeyer, O., Schmidt, A.D., Vödisch, M., Wartenberg, D. and Brakhage, A.A.
(2011). Identification of virulence determinants of the human pathogenic fungi
Aspergillus fumigatus and Candida albicans by proteomics. International Journal of
Medical Microbiology 301: 368–377.
Knutsen, A.P. (2006). Genetic and respiratory tract risk factors for aspergillosis: ABPA
and asthma with fungal sensitization. Med. Mycol. 44: 61–70.
Knutsen, A.P. and Slavin, R.G. (2011). Allergic bronchopulmonary aspergillosis in
asthma and cystic fibrosis. Clinical and Developmental Immunology 2011: 843763.
Kontoyiannis, D.P. (2012). Invasive mycoses: strategies for effective management. Am.
J. Med. 125: S25–38.
Kosalec, I., Pepeljnjak, S. and Jandrlic, M. (2005). Influence of Media and Temperature
on Gliotoxin Production in Aspergillus fumigatus Strains. Arhiv Za Higijenu Rada I
Toksikologiju 56: 269–273.
Kradin, R.L. and Mark, E.J. (2008). The pathology of pulmonary disorders due to
Aspergillus spp. Arch. Pathol. Lab. Med. 132: 606–614.
Kraemer, R., Deloséa, N., Ballinari, P., Gallati, S. and Crameri, R. (2006). Effect of
allergic bronchopulmonary aspergillosis on lung function in children with cystic
fibrosis. Am. J. Respir. Crit. Care. Med. 174: 1211–1220.
Krah, A. and Jungblut, P.R. (2004). Immunoproteomics. In Molecular Diagnosis of
Infectious Diseases, J. Decker, and U. Reischl, eds. (Springer), pp. 19–33 ISBN:
1592596797, 9781592596799.
Kremer, A., Westrich, L. and Li, S.-M. (2007). A 7-dimethylallyltryptophan synthase
from Aspergillus fumigatus: overproduction, purification and biochemical
characterization. Microbiology 153: 3409–3416.
Ku, N.S., Han, S.H., Choi, J.Y., Kim, S.B., Kim, H.-W., Jeong, S.J., Kim, C.O., Song,
Y.G. and Kim, J.M. (2012). Diagnostic value of the serum galactomannan assay for
invasive aspergillosis: It is less useful in non-haematological patients. Scand. J. Infect.
Dis. 44: 600–604.
Kubodera, T., Yamashita, N. and Nishimura, A. (2000). Pyrithiamine Resistance Gene
(ptrA) of Aspergillus oryzae: Cloning, Characterization and Application as a Dominant
Selectable Marker for Transformation. Bioscience, Biotechnology, and Biochemistry 64:
1416.

339
Kuge, S., Jones, N. and Nomoto, a (1997). Regulation of yAP-1 nuclear localization in
response to oxidative stress. The EMBO Journal 16: 1710–1720.
Kumar, A., Ahmed, R., Singh, P.K. and Shukla, P.K. (2011). Identification of virulence
factors and diagnostic markers using immunosecretome of Aspergillus fumigatus. J.
Protemics 74: 1104–1112.
Kupfahl, C., Heinekamp, T., Geginat, G., Ruppert, T., Härtl, A., Hof, H. and Brakhage,
A.A. (2006). Deletion of the gliP gene of Aspergillus fumigatus results in loss of
gliotoxin production but has no effect on virulence of the fungus in a low-dose mouse
infection model. Mol. Microbiol. 62: 292–302.
Kurup, V.P., Knutsen, A.P., Moss, R.B. and Bansal, N.K. (2006). Specific antibodies to
recombinant allergens of Aspergillus fumigatus in cystic fibrosis patients with ABPA.
Clinical and Molecular Allergy : CMA 4: 11.
Kwon-Chung, K.J. and Sugui, J.A. (2009). What do we know about the role of gliotoxin
in the pathobiology of Aspergillus fumigatus? Med. Mycol. 47: 1–12.
Lai, E., Teodoro, T. and Volchuk, A. (2007). Endoplasmic reticulum stress: signaling
the unfolded protein response. Physiology 22: 193–201.
Lamarre, C., Sokol, S., Debeaupuis, J.-P., Henry, C., Lacroix, C., Glaser, P., Coppée, J.-
Y., François, J.-M. and Latgé, J.-P. (2008). Transcriptomic analysis of the exit from
dormancy of Aspergillus fumigatus conidia. BMC Genomics 9: 417.
Lara-Rojas, F., Sánchez, O., Kawasaki, L. and Aguirre, J. (2011). Aspergillus nidulans
transcription factor AtfA interacts with the MAPK SakA to regulate general stress
responses, development and spore functions. Mol. Microbiol. 80: 436–454.
Latge, J. (1999). Aspergillus fumigatus and Aspergillosis. Clin. Microbiol. Rev. 12:
310–350.
Latgé, J.P., Kobayashi, H., Debeaupuis, J.P., Diaquin, M., Sarfati, J., Wieruszeski, J.M.,
Parra, E., Bouchara, J.P. and Fournet, B. (1994). Chemical and immunological
characterization of the extracellular galactomannan of Aspergillus fumigatus. Infect.
Immun. 62: 5424–5433.
Leclerc, D. and Rozen, R. (2008). Endoplasmic reticulum stress increases the
expression of methylenetetrahydrofolate reductase through the IRE1 transducer. The
Journal of Biological Chemistry 283: 3151–3160.
Lee, I., Oh, J., Shwab, E.K., Dagenais, T.R.T., Andes, D. and Keller, N.P. (2009a).
HdaA, a class 2 histone deacetylase of Aspergillus fumigatus, affects germination and
secondary metabolite production. Fungal Genet. Biol. 46: 782–790.

340
Lee, W.Y., Park, E.-J. and Ahn, J.K. (2009b). Supplementation of methionine enhanced
the ergothioneine accumulation in the Ganoderma neo-japonicum mycelia. Applied
Biochemistry and Biotechnology 158: 213–221.
Lee, W.Y., Park, E.-J., Ahn, J.K. and Ka, K.-H. (2009c). Ergothioneine Contents in
Fruiting Bodies and Their Enhancement in Mycelial Cultures by the Addition of
Methionine. Mycobiology 37: 43.
Lehrnbecher, T., Tramsen, L., Koehl, U., Schmidt, S., Bochennek, K. and Klingebiel, T.
(2011). Immunotherapy against invasive fungal diseases in stem cell transplant
recipients. Immunol. Investig. 40: 839–852.
Lei, Z., Huhman, D. V and Sumner, L.W. (2011). Mass spectrometry strategies in
metabolomics. The Journal of Biological Chemistry 286: 25435–25442.
Lemke, A., Kiderlen, A.F. and Kayser, O. (2005). Amphotericin B. Appl. Microbiol.
Biotechnol. 68: 151–162.
Lessing, F., Kniemeyer, O., Wozniok, I., Loeffler, J., Kurzai, O., Haertl, A. and
Brakhage, A.A. (2007). The Aspergillus fumigatus transcriptional regulator AfYap1
represents the major regulator for defense against reactive oxygen intermediates but is
dispensable for pathogenicity in an intranasal mouse infection model. Eukaryot. Cell 6:
2290–2302.
Letscher-Bru, V. (2003). Caspofungin: the first representative of a new antifungal class.
J. Antimicrob. Chemother. 51: 513–521.
Levitz, S.M. and Farrell, T.P. (1990). Human neutrophil degranulation stimulated by
Aspergillus fumigatus. J. Leukoc. Biol. 47: 170–175.
Li, B. and Walsh, C.T. (2011). Streptomyces clavuligerus HlmI is an intramolecular
disulfide- forming dithiol oxidase in holomycin biosynthesis. Biochemistry 50: 4615–
4622.
Ligr, M., Velten, I., Fröhlich, E., Madeo, F., Ledig, M., Fröhlich, K.U., Wolf, D.H. and
Hilt, W. (2001). The proteasomal substrate Stm1 participates in apoptosis-like cell death
in yeast. Molecular Biology of the Cell 12: 2422–2432.
Lin, S.-J. and Guarente, L. (2003). Nicotinamide adenine dinucleotide, a metabolic
regulator of transcription, longevity and disease. Curr. Opin. Cell Biol. 15: 241–246.
Lin, S.S., Bassik, M.C., Suh, H., Nishino, M., Arroyo, J.D., Hahn, W.C., Korsmeyer,
S.J. and Roberts, T.M. (2006). PP2A regulates BCL-2 phosphorylation and proteasome-
mediated degradation at the endoplasmic reticulum. The Journal of Biological
Chemistry 281: 23003–23012.

341
Link, A.J., Eng, J., Schieltz, D.M., Carmack, E., Mize, G.J., Morris, D.R., Garvik, B.M.
and Yates, J.R. (1999). Direct analysis of protein complexes using mass spectrometry.
Nature Biotechnology 17: 676–682.
Liu, S., Milne, G.T., Kuremsky, J.G., Fink, G.R. and Leppla, S.H. (2004). Identification
of the Proteins Required for Biosynthesis of Diphthamide , the Target of Bacterial
ADP-Ribosylating Toxins on Translation Elongation Factor 2 †. Mol. Cell. Biol. 24:
9487–9497.
Lodeiro, S., Xiong, Q., Wilson, W.K., Ivanova, Y., Smith, M.L., May, G.S. and
Matsuda, S.P.T. (2009). Protostadienol biosynthesis and metabolism in the pathogenic
fungus Aspergillus fumigatus. Org. Lett. 11: 1241–1244.
Losada, L., Ajayi, O., Frisvad, J.C., Yu, J. and Nierman, W.C. (2009). Effect of
competition on the production and activity of secondary metabolites in Aspergillus
species. Med. Mycol. 47 Suppl 1: S88–96.
Lu, X., Sun, J., Nimtz, M., Wissing, J., Zeng, A.-P. and Rinas, U. (2010). The intra- and
extracellular proteome of Aspergillus niger growing on defined medium with xylose or
maltose as carbon substrate. Microbial Cell Factories 9: 23.
Lubec, G., Afjehi-Sadat, L., Yang, J.-W. and John, J.P.P. (2005). Searching for
hypothetical proteins: theory and practice based upon original data and literature.
Progress in Neurobiology 77: 90–127.
Lundqvist, M., Stigler, J., Elia, G., Lynch, I., Cedervall, T. and Dawson, K.A. (2008).
Nanoparticle size and surface properties determine the protein corona with possible
implications for biological impacts. Proc. Natl. Acad. Sci. U. S. A. 105: 14265–14270.
Ma, J.E., Yun, E.Y., Kim, Y.E., Lee, G.D., Cho, Y.J., Jeong, Y.Y., Jeon, K.-N., Jang,
I.S., Kim, H.C., Lee, J.D. and Hwang, Y.S. (2011). Endobronchial aspergilloma: report
of 10 cases and literature review. Yonsei Medical Journal 52: 787–792.
Maaheimo, H., Fiaux, J., Cakar, P., Bailey, J.E., Sauer, U. and Szyperski, T. (2001).
Central carbon metabolism of Saccharomyces cerevisiae explored by biosyntheric
fractional 13
C labeling of common amino acids. European Journal of Biochemistry /
FEBSr 268: 2464–2479.
Mabey, J.E., Anderson, M.J., Giles, P.F., Miller, C.J., Attwood, T.K., Paton, N.W.,
Bornberg-Bauer, E., Robson, G.D., Oliver, S.G. and Denning, D.W. (2004). CADRE:
the Central Aspergillus Data REpository. Nucleic Acids Research 32: D401–5.
MacFarlane, A.J., Liu, X., Perry, C.A., Flodby, P., Allen, R.H., Stabler, S.P. and Stover,
P.J. (2008). Cytoplasmic Serine Hydroxymethyltransferase Regulates the Metabolic
Partitioning of Methylenetetrahydrofolate but Is Not Essential in Mice. J. Biol. Chem.
283: 25846–25853.

342
Machida, M., Asai, K., Sano, M., Tanaka, T., Kumagai, T., Terai, G., Kusumoto, K.-I.,
Arima, T., Akita, O., Kashiwagi, Y., Abe, K., Gomi, K., Horiuchi, H., et al. (2005).
Genome sequencing and analysis of Aspergillus oryzae. Nature 438: 1157–1161.
Maertens, J., Egerer, G., Shin, W.S., Reichert, D., Stek, M., Chandwani, S.,
Shivaprakash, M. and Viscoli, C. (2010). Caspofungin use in daily clinical practice for
treatment of invasive aspergillosis: results of a prospective observational registry. BMC
Infect. Dis. 10: 182.
Maertens, J., Raad, I., Petrikkos, G., Boogaerts, M., Selleslag, D., Petersen, F.B., Sable,
C.A., Kartsonis, N.A., Ngai, A., Taylor, A., Patterson, T.F., Denning, D.W. and Walsh,
T.J. (2004). Efficacy and safety of caspofungin for treatment of invasive aspergillosis in
patients refractory to or intolerant of conventional antifungal therapy. Clin. Infect. Dis.
39: 1563–1571.
Maertens, J., Theunissen, K. and Boogaerts, M. (2002). Invasive Aspergillosis : Focus
on New Approaches and New Therapeutic Agents. Curr. Med. Chem. 1: 65–81.
Maertens, J., Theunissen, K., Lodewyck, T., Lagrou, K. and Van Eldere, J. (2007).
Advances in the serological diagnosis of invasive Aspergillus infections in patients with
haematological disorders. Mycoses 50 Suppl 1: 2–17.
Maiya, S., Grundmann, A., Li, S.-M. and Turner, G. (2006). The fumitremorgin gene
cluster of Aspergillus fumigatus: identification of a gene encoding brevianamide F
synthetase. Chembiochem : a European Journal of Chemical Biology 7: 1062–1069.
Maiya, S., Grundmann, A., Li, X., Li, S.-M. and Turner, G. (2007). Identification of a
hybrid PKS/NRPS required for pseurotin A biosynthesis in the human pathogen
Aspergillus fumigatus. Chembiochem 8: 1736–1743.
Marques, M., Mojzita, D., Amorim, M.A., Almeida, T., Hohmann, S., Moradas-
Ferreira, P. and Costa, V. (2006). The Pep4p vacuolar proteinase contributes to the
turnover of oxidized proteins but PEP4 overexpression is not sufficient to increase
chronological lifespan in Saccharomyces cerevisiae. Microbiology 152: 3595–3605.
Marr, K. a, Laverdiere, M., Gugel, A. and Leisenring, W. (2005). Antifungal therapy
decreases sensitivity of the Aspergillus galactomannan enzyme immunoassay. Clin.
Infect. Dis. 40: 1762–1769.
Mazandu, G.K. and Mulder, N.J. (2012). Function Prediction and Analysis of
Mycobacterium tuberculosis Hypothetical Proteins. International Journal of Molecular
Sciences 13: 7283–7302.
McCormick, A., Loeffler, J. and Ebel, F. (2010). Aspergillus fumigatus: contours of an
opportunistic human pathogen. Cell. Microbiol. 12: 1535–1543.
McDonagh, A., Fedorova, N.D., Crabtree, J., Yu, Y., Kim, S., Chen, D., Loss, O.,
Cairns, T., Goldman, G., Armstrong-James, D., Haynes, K., Haas, H., Schrettl, M.,

343
May, G., Nierman, W.C. and Bignell, E. (2008). Sub-telomere directed gene expression
during initiation of invasive aspergillosis. PLoS Pathogens 4: e1000154.
Mennink-Kersten, M.A.S.H., Ruegebrink, D., Klont, R.R., Warris, A., Blijlevens,
N.M.A., Donnelly, J.P. and Verweij, P.E. (2008). Improved detection of circulating
Aspergillus antigen by use of a modified pretreatment procedure. Journal of Clinical
Microbiology 46: 1391–1397.
Millioni, R., Tolin, S., Puricelli, L., Sbrignadello, S., Fadini, G.P., Tessari, P. and
Arrigoni, G. (2011). High abundance proteins depletion vs low abundance proteins
enrichment: comparison of methods to reduce the plasma proteome complexity. PloS
One 6: e19603.
Mishra, A.K., Gangwani, L., Davis, R.J. and Lambright, D.G. (2007). Structural
insights into the interaction of the evolutionarily conserved ZPR1 domain tandem with
eukaryotic EF1A, receptors, and SMN complexes. Proc. Natl. Acad. Sci. U. S. A. 104:
13930–13935.
Mitsuguchi, H., Seshime, Y., Fujii, I., Shibuya, M., Ebizuka, Y. and Kushiro, T. (2009).
Biosynthesis of steroidal antibiotic fusidanes: functional analysis of oxidosqualene
cyclase and subsequent tailoring enzymes from Aspergillus fumigatus. J. Am. Chem.
Soc. 131: 6402–6411.
Morton, C.O., Varga, J.J., Hornbach, A., Mezger, M., Sennefelder, H., Kneitz, S.,
Kurzai, O., Krappmann, S., Einsele, H., Nierman, W.C., Rogers, T.R. and Loeffler, J.
(2011). The Temporal Dynamics of Differential Gene Expression in Aspergillus
fumigatus Interacting with Human Immature Dendritic Cells In Vitro. PLoS ONE 6:
e16016.
Murdock, B.J., Shreiner, A.B., McDonald, R. a, Osterholzer, J.J., White, E.S., Toews,
G.B. and Huffnagle, G.B. (2011). Coevolution of TH1, TH2, and TH17 responses
during repeated pulmonary exposure to Aspergillus fumigatus conidia. Infect. Immun.
79: 125–135.
Murray, D.B., Haynes, K. and Tomita, M. (2011). Redox regulation in respiring
Saccharomyces cerevisiae. BBA - General Subjects 1810: 945–958.
Muschik, G.M. and Veenstra, T.D. (2009). Analytical and statistical approaches to
metabolomics research. Journal of Separation Science 32: 2183–2199.
Ndez, O.H.Á., Almeida, A.J., Tamayo, D., Torres, I., Garcia, A.N.A.M., Pez, A.L.Ó.,
Restrepo, A. and Ewen, J.G.M.C. (2012). The hydrolase PbHAD32 participates in the
adherence of Paracoccidioides brasiliensis conidia to epithelial lung cells. Med. Mycol.
50: 533–537.
Neustadt, M., Costina, V., Kupfahl, C., Buchheidt, D., Eckerskorn, C., Neumaier, M.
and Findeisen, P. (2009). Characterization and identification of proteases secreted by

344
Aspergillus fumigatus using free flow electrophoresis and MS. Electrophoresis 30:
2142–2150.
Nierman, W.C., Pain, A., Anderson, M.J., Wortman, J.R., Kim, H.S., Arroyo, J.,
Berriman, M., Abe, K., Archer, D.B., Bermejo, C., Bennett, J., Bowyer, P., Chen, D., et
al. (2005). Genomic sequence of the pathogenic and allergenic filamentous fungus
Aspergillus fumigatus. Nature 438: 1151–1156.
Nikodemus, D., Lazic, D., Bach, M., Bauer, T., Pfeiffer, C., Wiltzer, L., Lain, E.,
Schomig, E. and Grundmann, D. (2011). Paramount Levels of Ergothioneine
Transporter SLC22A4 mRNA in Boar Seminal Vesicles and Cross-Species Analysis of
Ergothioneine and Glutathione in Seminal Plasma. J. Physiol. Pharmacol. 62: 411–419.
Nishida, S., Yoshida, L.S., Shimoyama, T., Nunoi, H., Kobayashi, T. and Tsunawaki, S.
(2005). Fungal Metabolite Gliotoxin Targets Flavocytochrome b 558 in the Activation
of the Human Neutrophil NADPH Oxidase. Infect. Immun. 73: 235–244.
Nivoix, Y., Velten, M., Letscher-Bru, V., Moghaddam, A., Natarajan-Amé, S., Fohrer,
C., Lioure, B., Bilger, K., Lutun, P., Marcellin, L., Launoy, A., Freys, G., Bergerat, J.-P.
and Herbrecht, R. (2008). Factors associated with overall and attributable mortality in
invasive aspergillosis. Clin. Infect. Dis. 47: 1176–1184.
Nosanchuk, J.D. and Casadevall, A. (2006). Impact of melanin on microbial virulence
and clinical resistance to antimicrobial compounds. Antimicrob. Agents Chemother. 50:
3519–3528.
Oakley, A.J., Coggan, M. and Board, P.G. (2010). Identification and characterization of
gamma-glutamylamine cyclotransferase, an enzyme responsible for gamma-glutamyl-
epsilon-lysine catabolism. The Journal of Biological Chemistry 285: 9642–9648.
Oakley, A.J., Yamada, T., Liu, D., Coggan, M., Clark, A.G. and Board, P.G. (2008).
The identification and structural characterization of C7orf24 as gamma-glutamyl
cyclotransferase. An essential enzyme in the gamma-glutamyl cycle. The Journal of
Biological Chemistry 283: 22031–22042.
Okada, K., Hashimoto, S. and Imaoka, S. (2010). Biological Functions of Protein
Disulfide Isomerase as a Target of Phenolic Endocrine-disrupting Chemicals. J. Health
Sci. 56: 1–13.
Old, W.M., Meyer-Arendt, K., Aveline-Wolf, L., Pierce, K.G., Mendoza, A., Sevinsky,
J.R., Resing, K. a and Ahn, N.G. (2005). Comparison of label-free methods for
quantifying human proteins by shotgun proteomics. Molecular & Cellular Proteomics
4: 1487–1502.
Ong, S.-E., Blagoev, B., Kratchmarova, I., Kristensen, D.B., Steen, H., Pandey, A. and
Mann, M. (2002). Stable Isotope Labeling by Amino Acids in Cell Culture, SILAC, as a
Simple and Accurate Approach to Expression Proteomics. Mol. Cell. Proteomics 1:
376–386.

345
Oosthuizen, J.L., Gomez, P., Ruan, J., Hackett, T.L., Moore, M.M., Knight, D.A. and
Tebbutt, S.J. (2011). Dual Organism Transcriptomics of Airway Epithelial Cells
Interacting with Conidia of Aspergillus fumigatus. PLoS ONE 6: e20527.
Orciuolo, E., Stanzani, M., Canestraro, M., Galimberti, S., Carulli, G., Lewis, R.,
Petrini, M. and Komanduri, K. V (2007). Effects of Aspergillus fumigatus gliotoxin and
methylprednisolone on human neutrophils: implications for the pathogenesis of invasive
aspergillosis. J. Leukoc. Biol. 82: 839–848.
Ortiz, P.A., Ulloque, R., Kihara, G.K., Zheng, H. and Kinzy, T.G. (2006). Translation
elongation factor 2 anticodon mimicry domain mutants affect fidelity and diphtheria
toxin resistance. The Journal of Biological Chemistry 281: 32639–32648.
Osherov, N. and May, G. (2000). Conidial germination in Aspergillus nidulans requires
RAS signaling and protein synthesis. Genetics 155: 647–656.
Ouyang, H., Luo, Y., Zhang, L., Li, Y. and Jin, C. (2010). Proteome analysis of
Aspergillus fumigatus total membrane proteins identifies proteins associated with the
glycoconjugates and cell wall biosynthesis using 2D LC-MS/MS. Molecular
Biotechnology 44: 177–189.
O’Brian, G.R., Georgianna, D.R., Wilkinson, J.R., Yu, J., Abbas, H.K., Bhatnagar, D.,
Cleveland, T.E., Nierman, W. and Payne, G.A. (2007). The effect of elevated
temperature on gene transcription and aflatoxin biosynthesis. Mycologia 99: 232–239.
O’Gorman, C.M., Fuller, H.T. and Dyer, P.S. (2009). Discovery of a sexual cycle in the
opportunistic fungal pathogen Aspergillus fumigatus. Nature 457: 471–474.
O’Hanlon, K.A., Cairns, T., Stack, D., Schrettl, M., Bignell, E.M., Kavanagh, K.,
Miggin, S.M., O’Keeffe, G., Larsen, T.O. and Doyle, S. (2011). Targeted Disruption of
Nonribosomal Peptide Synthetase pes3 Augments the Virulence of Aspergillus
fumigatus. Infect. Immun. 79: 3978–3992.
O’Hanlon, K.A., Gallagher, L., Schrettl, M., Jöchl, C., Kavanagh, K., Larsen, T.O.,
Doyle, S. and O’ Hanlon, K.A. (2012). Nonribosomal Peptide Synthetase Genes pesL
and pes1 Are Essential for Fumigaclavine C Production in Aspergillus fumigatus. Appl.
Environ. Microbiol. 78: 3166–3176.
O’Neill, P.M., Barton, V.E. and Ward, S. a (2010). The molecular mechanism of action
of artemisinin--the debate continues. Molecules 15: 1705–1721.
Pagano, L., Caira, M., Candoni, A., Offidani, M., Martino, B., Specchia, G., Pastore, D.,
Stanzani, M., Cattaneo, C., Fanci, R., Caramatti, C., Rossini, F., Luppi, M., Potenza, L.,
Ferrara, F., Mitra, M.E., Fadda, R.M., Invernizzi, R., Aloisi, T., Picardi, M., Bonini, A.,
Vacca, A., Chierichini, A., Melillo, L., De Waure, C., Fianchi, L., Riva, M., Leone, G.,
Aversa, F. and Nosari, A. (2010). Invasive aspergillosis in patients with acute myeloid
leukemia: a SEIFEM-2008 registry study. Haematologica 95: 644–650.

346
Paoletti, M., Rydholm, C., Schwier, E.U., Anderson, M.J., Szakacs, G., Lutzoni, F.,
Debeaupuis, J.-P., Latgé, J.-P., Denning, D.W. and Dyer, P.S. (2005). Evidence for
sexuality in the opportunistic fungal pathogen Aspergillus fumigatus. Curr. Biol. 15:
1242–1248.
Pardo, J., Urban, C., Galvez, E.M., Ekert, P.G., Müller, U., Kwon-Chung, J., Lobigs,
M., Müllbacher, A., Wallich, R., Borner, C. and Simon, M.M. (2006). The
mitochondrial protein Bak is pivotal for gliotoxin-induced apoptosis and a critical host
factor of Aspergillus fumigatus virulence in mice. J. Cell Biol. 174: 509–519.
Park, H.-S., Bayram, Ö., Braus, G.H., Kim, S.C. and Yu, J.-H. (2012). Characterization
of the velvet regulators in Aspergillus fumigatus. Mol. Microbiol. 86: 937–953.
Parr, C.L., Keates, R.A.B., Bryksa, B.C., Ogawa, M. and Yada, R.Y. (2007). The
structure and function of Saccharomyces cerevisiae proteinase A. Yeast 24: 467–480.
Patron, N.J., Waller, R.F., Cozijnsen, A.J., Straney, D.C., Gardiner, D.M., Nierman,
W.C. and Howlett, B.J. (2007). Origin and distribution of epipolythiodioxopiperazine
(ETP) gene clusters in filamentous ascomycetes. BMC Evol. Biol. 7: 174.
Patterson, K. and Strek, M.E. (2010). Allergic bronchopulmonary aspergillosis. Proc.
Am. Thorac. Soc. 7: 237–244.
Paul, B.D. and Snyder, S.H. (2010). The unusual amino acid L-ergothioneine is a
physiologic cytoprotectant. Cell Death and Differentiation 17: 1134–1140.
De Pauw, B., Walsh, T.J., Donnelly, J.P., Stevens, D.A., Edwards, J.E., Calandra, T.,
Pappas, P.G., Maertens, J., Lortholary, O., Kauffman, C.A., Denning, D.W., Patterson,
T.F., Maschmeyer, G., Bille, J., Dismukes, W.E., Herbrecht, R., Hope, W.W., Kibbler,
C.C., Kullberg, B.J., Marr, K.A., Muñoz, P., Odds, F.C., Perfect, J.R., Restrepo, A.,
Ruhnke, M., Segal, B.H., Sobel, J.D., Sorrell, T.C., Viscoli, C., Wingard, J.R., Zaoutis,
T. and Bennett, J.E. (2008). Revised Definitions of Invasive Fungal Disease from the
European Organization for Research and Treatment of Cancer/Invasive Fungal
Infections Cooperative Group and the National Institute of Allergy and Infectious
Diseases Mycoses Study Group (EORTC/ MSG). Clin. Infect. Dis. 46: 1813–1821.
Pel, H.J., De Winde, J.H., Archer, D.B., Dyer, P.S., Hofmann, G., Schaap, P.J., Turner,
G., De Vries, R.P., Albang, R., Albermann, K., Andersen, M.R., Bendtsen, J.D., Benen,
J.A.E., et al. (2007). Genome sequencing and analysis of the versatile cell factory
Aspergillus niger CBS 513.88. Nature Biotechnology 25: 221–231.
Pernemalm, M., Lewensohn, R. and Lehtiö, J. (2009). Affinity prefractionation for MS-
based plasma proteomics. Proteomics 9: 1420–1427.
Perrin, R.M., Fedorova, N.D., Bok, J.W., Cramer, R.A., Wortman, J.R., Kim, H.S.,
Nierman, W.C. and Keller, N.P. (2007). Transcriptional regulation of chemical diversity
in Aspergillus fumigatus by LaeA. PLoS Pathogens 3: e50.

347
Perrone, G.G., Grant, C.M. and Dawes, I.W. (2005). Glutathione Homeostasis in
Saccharomyces cerevisiae. Molecular Biology of the Cell 16: 218–230.
Perry, R.J., Mast, F.D. and Rachubinski, R. a (2009). Endoplasmic reticulum-associated
secretory proteins Sec20p, Sec39p, and Dsl1p are involved in peroxisome biogenesis.
Eukaryot. Cell 8: 830–843.
Petersen, T.N., Brunak, S., Von Heijne, G. and Nielsen, H. (2011). SignalP 4.0:
discriminating signal peptides from transmembrane regions. Nat. Meth. 8: 785–786.
Petrik, M., Haas, H., Dobrozemsky, G., Lass-Flörl, C., Helbok, A., Blatzer, M.,
Dietrich, H. and Decristoforo, C. (2010). 68Ga-siderophores for PET imaging of
invasive pulmonary aspergillosis: proof of principle. J. Nucl. Med. 51: 639–645.
Pfeiffer, C.D., Fine, J.P. and Safdar, N. (2006). Diagnosis of invasive aspergillosis
using a galactomannan assay: a meta-analysis. Clin. Infect. Dis. 42: 1417–1427.
Philippe, B., Ibrahim-Granet, O., Prevost, M.C., Gougerot-Pocidalo, M.A., Sanchez
Perez, M., Van Der Meeren, A. and Latge, J.P. (2003). Killing of Aspergillus fumigatus
by Alveolar Macrophages Is Mediated by Reactive Oxidant Intermediates. Infect.
Immun. 71: 3034–3042.
Pihet, M., Carrere, J., Cimon, B., Chabasse, D., Delhaes, L., Symoens, F. and Bouchara,
J.-P. (2009). Occurrence and relevance of filamentous fungi in respiratory secretions of
patients with cystic fibrosis--a review. Med. Mycol. 47: 387–397.
Piper, M.D., Hong, S.P., Ball, G.E. and Dawes, I.W. (2000). Regulation of the balance
of one-carbon metabolism in Saccharomyces cerevisiae. The Journal of Biological
Chemistry 275: 30987–30995.
Piper, M.D.W., Hong, S.P., Eissing, T., Sealey, P. and Dawes, I.W. (2002). Regulation
of the yeast glycine cleavage genes is responsive to the availability of multiple
nutrients. FEMS Yeast Research 2: 59–71.
Pitarch, A., Abian, J., Carrascal, M., Sánchez, M., Nombela, C. and Gil, C. (2004).
Proteomics-based identification of novel Candida albicans antigens for diagnosis of
systemic candidiasis in patients with underlying hematological malignancies.
Proteomics 4: 3084–3106.
Price, M.S., Conners, S.B., Tachdjian, S., Kelly, R.M. and Payne, G.A. (2005).
Aflatoxin conducive and non-conducive growth conditions reveal new gene associations
with aflatoxin production. Fungal Genetics and Biology 42: 506–518.
Priebe, S., Linde, J., Albrecht, D., Guthke, R. and Brakhage, A.A. (2011). FungiFun: A
web-based application for functional categorization of fungal genes and proteins.
Fungal Genet. Biol. 48: 353–358.

348
Pusztahelyi, T., Klement, E., Szajli, E., Klem, J., Miskei, M., Karányi, Z., Emri, T.,
Kovács, S., Orosz, G., Kovács, K.L., Medzihradszky, K.F., Prade, R. a and Pócsi, I.
(2011). Comparison of transcriptional and translational changes caused by long-term
menadione exposure in Aspergillus nidulans. Fungal Genetics and Biology 48: 92–103.
Rabilloud, T. (2009). Membrane proteins and proteomics: love is possible, but so
difficult. Electrophoresis 30 Suppl 1: S174–80.
Rabilloud, T., Chevallet, M., Luche, S. and Lelong, C. (2010). Two-dimensional gel
electrophoresis in proteomics: Past, present and future. Journal of Proteomics 73: 2064–
2077.
Rahman, I., Gilmour, P.S., Jimenez, L. a, Biswas, S.K., Antonicelli, F. and Aruoma,
O.I. (2003). Ergothioneine inhibits oxidative stress- and TNF-alpha-induced NF-kB
activation and interleukin-8 release in alveolar epithelial cells. Biochem. Biophys. Res.
Commun. 302: 860–864.
Rand, J.D. and Grant, C.M. (2006). The Thioredoxin System Protects Ribosomes
against Stress-induced Aggregation. Molecular Biology of the Cell 17: 387–401.
Reeves, E.P., Reiber, K., Neville, C., Scheibner, O., Kavanagh, K. and Doyle, S. (2006).
A nonribosomal peptide synthetase (Pes1) confers protection against oxidative stress in
Aspergillus fumigatus. The FEBS Journal 273: 3038–3053.
Reid, K.B., Madan, T., Eggleton, P., Kishore, U., Strong, P., Aggrawal, S.S., Sarma,
P.U. and Reid, K.B.M. (1997). Binding of pulmonary surfactant proteins A and D to
Aspergillus fumigatus conidia enhances phagocytosis and killing by human neutrophils
and alveolar macrophages. Infect. Immun. 65: 3171.
Reverberi, M., Ricelli, A., Zjalic, S., Fabbri, A.A. and Fanelli, C. (2010). Natural
functions of mycotoxins and control of their biosynthesis in fungi. Appl. Microbiol.
Biotechnol. 87: 899–911.
Richie, D.L., Hartl, L., Aimanianda, V., Winters, M.S., Fuller, K.K., Miley, M.D.,
White, S., McCarthy, J.W., Latgé, J.-P., Feldmesser, M., Rhodes, J.C. and Askew, D.S.
(2009). A role for the unfolded protein response (UPR) in virulence and antifungal
susceptibility in Aspergillus fumigatus. PLoS Pathogens 5: e1000258.
Rizzetto, L. and Cavalieri, D. (2011). Friend or foe: using systems biology to elucidate
interactions between fungi and their hosts. Trends in Microbiology 19: 509–515.
Rochfort, S. (2005). Metabolomics Reviewed: A New “Omics” Platform Technology
for Systems Biology and Implications for Natural Products Research. Journal of
Natural Products 68: 1813–1820.
Ross, P.L., Huang, Y.N., Marchese, J.N., Williamson, B., Parker, K., Hattan, S.,
Khainovski, N., Pillai, S., Dey, S., Daniels, S., Purkayastha, S., Juhasz, P., Martin, S.,
Bartlet-Jones, M., He, F., Jacobson, A. and Pappin, D.J. (2004). Multiplexed protein

349
quantitation in Saccharomyces cerevisiae using amine-reactive isobaric tagging
reagents. Molecular & Cellular Proteomics 3: 1154–1169.
Ruepp, A., Zollner, A., Maier, D., Albermann, K., Hani, J., Mokrejs, M., Tetko, I.,
Güldener, U., Mannhaupt, G., Münsterkötter, M. and Mewes, H.W. (2004). The
FunCat, a functional annotation scheme for systematic classification of proteins from
whole genomes. Nucleic Acids Research 32: 5539–5545.
Ruhaak, L.R., Zauner, G., Huhn, C., Bruggink, C., Deelder, A.M. and Wuhrer, M.
(2010). Glycan labeling strategies and their use in identification and quantification.
Analytical and Bioanalytical Chemistry 397: 3457–3481.
Rundberget, T. and Wilkins, A.L. (2002). Determination of Penicillium mycotoxins in
foods and feeds using liquid chromatography – mass spectrometry. J. Chromatogr. A
964: 189–197.
Sagan, D. and Goździuk, K. (2010). Surgery for pulmonary aspergilloma in
immunocompetent patients: no benefit from adjuvant antifungal pharmacotherapy. Ann.
Thorac. Surg. 89: 1603–1610.
Sainz, J., Hassan, L., Perez, E., Romero, A., Moratalla, A., López-Fernández, E.,
Oyonarte, S. and Jurado, M. (2007). Interleukin-10 promoter polymorphism as risk
factor to develop invasive pulmonary aspergillosis. Immunol. Lett. 109: 76–82.
Sanchez, J.F., Somoza, A.D., Keller, N.P. and Wang, C.C.C. (2012). Advances in
Aspergillus secondary metabolite research in the post-genomic era. Nat. Prod. Rep. 29:
351–371.
Santamaría, R., Rizzetto, L., Bromley, M., Zelante, T., Lee, W., Cavalieri, D., Romani,
L., Miller, B., Gut, I., Santos, M., Pierre, P., Bowyer, P. and Kapushesky, M. (2011).
Systems biology of infectious diseases: a focus on fungal infections. Immunobiology
216: 1212–1227.
Sarikaya Bayram, O., Bayram, O., Valerius, O., Park, H.S., Irniger, S., Gerke, J., Ni,
M., Han, K.-H., Yu, J.-H. and Braus, G.H. (2010). LaeA control of velvet family
regulatory proteins for light-dependent development and fungal cell-type specificity.
PLoS Genetics 6: e1001226.
Sato, I., Shimizu, M., Hoshino, T. and Takaya, N. (2009). The glutathione system of
Aspergillus nidulans involves a fungus-specific glutathione S-transferase. The Journal
of Biological Chemistry 284: 8042–8053.
Schaaff, I., Hohmann, S. and Zimmermann, F.K. (1990). Molecular analysis of the
structural gene for yeast transaldolase. European Journal of Biochemistry / FEBS 188:
597–603.
Scharf, D.H., Chankhamjon, P., Schlerlach, K., Heinekamp, T., Roth, M., Brakhage,
A.A. and Hertweck, C. (2012a). Epidithiol Formation by an Unprecedented Twin

350
Carbon-Sulfur Lyase in the Gliotoxin Pathway. Agnew. Chem. Int. Edit. 51: 10064–
10068.
Scharf, D.H., Heinekamp, T., Remme, N., Hortschansky, P., Brakhage, A.A. and
Hertweck, C. (2012b). Biosynthesis and function of gliotoxin in Aspergillus fumigatus.
Applied Microbiology and Biotechnology 93: 467–472.
Scharf, D.H., Remme, N., Habel, A., Chankhamjon, P., Scherlach, K., Heinekamp, T.,
Hortschansky, P., Brakhage, A.A. and Hertweck, C. (2011). A dedicated glutathione S-
transferase mediates carbon-sulfur bond formation in gliotoxin biosynthesis. J. Am.
Chem. Soc. 133: 12322–12325.
Scharf, D.H., Remme, N., Heinekamp, T., Hortschansky, P., Brakhage, A.A. and
Hertweck, C. (2010). Transannular Disulfide Formation in Gliotoxin Biosynthesis and
Its Role in Self-Resistance of the Human Pathogen Aspergillus fumigatus. J. Am. Chem.
Soc. 132: 10136–10141.
Schmaler-Ripcke, J., Sugareva, V., Gebhardt, P., Winkler, R., Kniemeyer, O.,
Heinekamp, T. and Brakhage, A.A. (2009). Production of pyomelanin, a second type of
melanin, via the tyrosine degradation pathway in Aspergillus fumigatus. Appl. Environ.
Microbiol. 75: 493–503.
Schnabl, M., Oskolkova, O. V, Holic, R., Brezna, B., Pichler, H., Zagorsek, M.,
Kohlwein, S.D., Paltauf, F., Daum, G. and Griac, P. (2003). Subcellular localization of
yeast Sec14 homologues and their involvement in regulation of phospholipid turnover.
Eur. J. Biochem. 270: 3133–3145.
Schrettl, M., Bignell, E., Kragl, C., Joechl, C., Rogers, T., Arst, H.N., Haynes, K. and
Haas, H. (2004). Siderophore biosynthesis but not reductive iron assimilation is
essential for Aspergillus fumigatus virulence. J. Exp. Med. 200: 1213–1219.
Schrettl, M., Bignell, E., Kragl, C., Sabiha, Y., Loss, O., Eisendle, M., Wallner, A.,
Arst, H.N., Haynes, K. and Haas, H. (2007). Distinct roles for Intra- and Extracellular
Siderophores during Aspergillus fumigatus Infection. PLoS Pathogens 3: 1195–1207.
Schrettl, M., Carberry, S., Kavanagh, K., Haas, H., Jones, G.W., O’Brien, J., Nolan, A.,
Stephens, J., Fenelon, O. and Doyle, S. (2010). Self-protection against gliotoxin-a
component of the gliotoxin biosynthetic cluster, GliT, completely protects Aspergillus
fumigatus against exogenous gliotoxin. PLoS Pathogens 6: e1000952.
Seebeck, F.P. (2010). In vitro reconstitution of Mycobacterial ergothioneine
biosynthesis. J. Am. Chem. Soc. 132: 6632–6633.
Segal, B.H. and Romani, L.R. (2009). Invasive aspergillosis in chronic granulomatous
disease. Med. Mycol. 47 Suppl 1: S282–90.
Segal, B.H. and Walsh, T.J. (2006). Current approaches to diagnosis and treatment of
invasive aspergillosis. Am. J. Respir. Crit. Care. Med. 173: 707–717.

351
Sharon, H., Hagag, S. and Osherov, N. (2009). Transcription factor PrtT controls
expression of multiple secreted proteases in the human pathogenic mold Aspergillus
fumigatus. Infect. Immun. 77: 4051–4060.
Shen, D.-K., Noodeh, A.D., Kazemi, A., Grillot, R., Robson, G. and Brugère, J.-F.
(2004). Characterisation and expression of phospholipases B from the opportunistic
fungus Aspergillus fumigatus. FEMS Microbiology Letters 239: 87–93.
Sheppard, D.C., Doedt, T., Chiang, L.Y., Kim, H.S., Chen, D., Nierman, W.C. and
Filler, S.G. (2005). The Aspergillus fumigatus StuA Protein Governs the Up- Regulation
of a Discrete Transcriptional Program during the Acquisition of Developmental
Competence. Molecular Biology of the Cell 16: 5866–5879.
Shevchenko, A., Tomas, H., Havlis, J., Olsen, J. V and Mann, M. (2007). In-gel
digestion for mass spectrometric characterization of proteins and proteomes. Nature
Protocols 1: 2856–2860.
Shi, L., Li, F., Huang, M., Lu, J., Kong, X., Wang, S. and Shao, H. (2012a).
Immunoproteomics based identification of thioredoxin reductase GliT and novel
Aspergillus fumigatus antigens for serologic diagnosis of invasive aspergillosis. BMC
Microbiology 12: 11.
Shi, L.-N., Li, F.-Q., Lu, J.-F., Kong, X.-X., Wang, S.-Q., Huang, M., Shao, H.-F. and
Shao, S.-H. (2012b). Antibody specific to thioredoxin reductase as a new biomarker for
serodiagnosis of invasive aspergillosis in non-neutropenic patients. Clin. Chim. Acta
413: 938–943.
Shimizu, M., Fujii, T., Masuo, S., Fujita, K. and Takaya, N. (2009). Proteomic analysis
of Aspergillus nidulans cultured under hypoxic conditions. Proteomics 9: 7–19.
Sieńko, M., Natorff, R., Zieliński, Z., Hejduk, A. and Paszewski, A. (2007). Two
Aspergillus nidulans genes encoding methylenetetrahydrofolate reductases are up-
regulated by homocysteine. Fungal Genetics and Biology 44: 691–700.
Da Silva Ferreira, M.E., Malavazi, I., Savoldi, M., Brakhage, A.A., Goldman, M.H.S.,
Kim, H.S., Nierman, W.C. and Goldman, G.H. (2006). Transcriptome analysis of
Aspergillus fumigatus exposed to voriconazole. Current Genetics 50: 32–44.
Silvestris, N., Del Re, M., Azzariti, A., Maiello, E., Lombardi, L., Cinieri, S., Guarini,
A., Brunetti, A.E., Delcuratolo, S., De Vita, F., Pisconti, S., Danesi, R. and Colucci, G.
(2012). Optimized granulocyte colony-stimulating factor prophylaxis in adult cancer
patients: from biological principles to clinical guidelines. Expert Opin. Ther. Targets 16
Suppl 2: S111–7.
Singh, B., Oellerich, M., Kumar, R., Kumar, M., Bhadoria, D.P., Reichard, U., Gupta,
V.K., Sharma, G.L. and Asif, A.R. (2010a). Immuno-reactive molecules identified from
the secreted proteome of Aspergillus fumigatus. J. Proteome Res. 9: 5517–5529.

352
Singh, B., Sharma, G.L., Oellerich, M., Kumar, R., Singh, S., Bhadoria, D.P., Katyal,
A., Reichard, U. and Asif, A.R. (2010b). Novel cytosolic allergens of Aspergillus
fumigatus identified from germinating conidia. Journal of Proteome Research 9: 5530–
5541.
Singh, S., Gupta, S., Singh, B., Sharma, S.K., Gupta, V.K. and Sharma, G.L. (2012).
Proteomic Characterization of Aspergillus fumigatus Treated with an Antifungal
Coumarin for Identification of Novel Target Molecules of Key Pathways. Journal of
Proteome Research 11: 3259–3268.
Sixto, M.L.J., Vareechon, C., Cowden, S., Cobb, B.A., Latgé, J., Momany, M.,
Pearlman, E. and Leal, M.S.J. (2012). Fungal antioxidant pathways promote survival
against neutrophils during infection. The Journal of Clinical Investigation 122: 2482–
2498.
Soanes, D.M., Alam, I., Cornell, M., Wong, H.M., Hedeler, C., Norman, W., Rattray,
M., Hubbard, S.J., Oliver, S.G. and Talbot, N.J. (2008). Comparative Genome Analysis
of Filamentous Fungi Reveals Gene Family Expansions Associated with Fungal
Pathogenesis. PLoS ONE 3: e2300.
Spikes, S., Xu, R., Nguyen, C.K., Chamilos, G., Kontoyiannis, D.P., Jacobson, R.H.,
Ejzykowicz, D.E., Chiang, L.Y., Filler, S.G. and May, G.S. (2008). Gliotoxin
production in Aspergillus fumigatus contributes to host-specific differences in virulence.
J. Infect. Dis. 197: 479–486.
Srinivasan, U., Bala, A., Jao, S., Starke, D.W., Jordan, T.W. and Mieyal, J.J. (2006).
Selective Inactivation of Glutaredoxin by Sporidesmin and Other
Epidithiopiperazinediones. Biochemistry 45: 8978–8987.
Stanimirovic, Z., Stevanovic, J., Bajic, V. and Radovic, I. (2007). Evaluation of
genotoxic effects of fumagillin by cytogenetic tests in vivo. Mutat. Res. 628: 1–10.
Stanzani, M., Orciuolo, E., Lewis, R., Kontoyiannis, D.P., Martins, S.L.R., St John, L.S.
and Komanduri, K. V (2005). Aspergillus fumigatus suppresses the human cellular
immune response via gliotoxin-mediated apoptosis of monocytes. Blood 105: 2258–
2265.
Steele, C., Rapaka, R.R., Metz, A., Pop, S.M., Williams, D.L., Gordon, S., Kolls, J.K.
and Brown, G.D. (2005). The beta-glucan receptor dectin-1 recognizes specific
morphologies of Aspergillus fumigatus. PLoS Pathogens 1: e42.
Steffan, N., Grundmann, A., Afiyatullov, S., Ruan, H. and Li, S. (2009). FtmOx1, a
non-heme Fe(II) and alpha-ketoglutarate-dependent dioxygenase, catalyses the
endoperoxide formation of verruculogen in Aspergillus fumigatus. Organic and
Biomolecular Chemistry 7: 4082–4087.

353
Stincone, A., Daudi, N., Rahman, A.S., Antczak, P., Henderson, I., Cole, J., Johnson,
M.D., Lund, P. and Falciani, F. (2011). A systems biology approach sheds new light on
Escherichia coli acid resistance. Nucleic Acids Research 39: 7512–7528.
Stolf, B.S., Smyrnias, I., Lopes, L.R., Vendramin, A., Goto, H., Laurindo, F.R.M.,
Shah, A.M. and Santos, C.X.C. (2011). Protein disulfide isomerase and host-pathogen
interaction. TheScientificWorldJournal 11: 1749–1761.
Sugui, J. a, Pardo, J., Chang, Y.C., Müllbacher, A., Zarember, K. a, Galvez, E.M.,
Brinster, L., Zerfas, P., Gallin, J.I., Simon, M.M. and Kwon-Chung, K.J. (2007a). Role
of laeA in the Regulation of alb1, gliP, Conidial Morphology, and Virulence in
Aspergillus fumigatus. Eukaryot. Cell 6: 1552–1561.
Sugui, J.A., Kim, H.S., Zarember, K.A., Chang, Y.C., Gallin, J.I., Nierman, W.C. and
Kwon-Chung, K.J. (2008). Genes differentially expressed in conidia and hyphae of
Aspergillus fumigatus upon exposure to human neutrophils. PloS One 3: e2655.
Sugui, J.A., Pardo, J., Chang, Y.C., Zarember, K.A., Nardone, G., Galvez, E.M.,
Müllbacher, A., Gallin, J.I., Simon, M.M. and Kwon-Chung, K.J. (2007b). Gliotoxin is
a virulence factor of Aspergillus fumigatus: gliP deletion attenuates virulence in mice
immunosuppressed with hydrocortisone. Eukaryot. Cell 6: 1562–1569.
Suh, M.-J., Fedorova, N.D., Cagas, S.E., Hastings, S., Fleischmann, R.D., Peterson,
S.N., Perlin, D.S., Nierman, W.C., Pieper, R. and Momany, M. (2012). Development
stage-specific proteomic profiling uncovers small, lineage specific proteins most
abundant in the Aspergillus fumigatus conidial proteome. Proteome Science 10: 30.
Suhadolnik, R.J. and Chenowath, R.G. (1958). Biosynthesis of Gliotoxin. 1.
Incorporation of Phenylalanine-1- and -2-C14
. J. Am. Chem. Soc. 80: 4391–4392.
Suliman, H.S., Appling, D.R. and Robertus, J.D. (2007). The Gene for Cobalamin-
independent Methionine Synthase is Essential in Candida albicans: A Potential
Antifungal Target. Archives of Biochemistry and Biophysics 467: 218–226.
Sulyok, M., Krska, R. and Schuhmacher, R. (2007). A liquid chromatography/tandem
mass spectrometric multi-mycotoxin method for the quantification of 87 analytes and its
application to semi-quantitative screening of moldy food samples. Analytical and
Bioanalytical Chemistry 389: 1505–1523.
Ta, P., Buchmeier, N., Newton, G.L., Rawat, M. and Fahey, R.C. (2011). Organic
hydroperoxide resistance protein and ergothioneine compensate for loss of mycothiol in
Mycobacterium smegmatis mutants. Journal of Bacteriology 193: 1981–1990.
Tan, S., Teo, M., Lam, Y.T., Dawes, I.W. and Perrone, G.G. (2009). Cu, Zn Superoxide
Dismutase and NADP(H) Homeostasis Are Required for Tolerance of Endoplasmic
Reticulum Stress in Saccharomyces cerevisiae. The American Society for Cell Biology
20: 1493–1508.

354
Taylor, D.J., Nilsson, J., Merrill, a R., Andersen, G.R., Nissen, P. and Frank, J. (2007).
Structures of modified eEF2 80S ribosome complexes reveal the role of GTP hydrolysis
in translocation. The EMBO Journal 26: 2421–2431.
Tepwong, P., Giri, A., Sasaki, F., Fukui, R. and Ohshima, T. (2012). Mycobial
enhancement of ergothioneine by submerged cultivation of edible mushroom mycelia
and its application as an antioxidative compound. Food Chem. 131: 247–258.
Terabayashi, Y., Shimizu, M., Kitazume, T., Masuo, S., Fujii, T. and Takaya, N. (2012).
Conserved and specific responses to hypoxia in Aspergillus oryzae and Aspergillus
nidulans determined by comparative transcriptomics. Applied Microbiology and
Biotechnology 93: 305–317.
Teutschbein, J., Albrecht, D., Po, M., Guthke, R., Aimanianda, V., Latge, J. and
Brakhage, A.A. (2010). Proteome Profiling and Functional Classification of
Intracellular Proteins from Conidia of the Human-Pathogenic Mold Aspergillus
fumigatus research articles. J. Proteome Res. 9: 3427–3442.
Thomas, B., Rutman, A., Hirst, R.A., Haldar, P., Wardlaw, A.J., Bankart, J., Brightling,
C.E. and O’Callaghan, C. (2010). Ciliary dysfunction and ultrastructural abnormalities
are features of severe asthma. J. Allergy Clin. Immunol. 126: 722–729.e2.
Thompson, G.R. and Patterson, T.F. (2008). Pulmonary aspergillosis. Sem. Resp. Crit.
Care. M. 29: 103–110.
Thornton, C., Johnson, G. and Agrawal, S. (2012). Detection of invasive pulmonary
aspergillosis in haematological malignancy patients by using lateral-flow technology.
JoVE e3721.
Thornton, C.R. (2008). Development of an immunochromatographic lateral-flow device
for rapid serodiagnosis of invasive aspergillosis. CVI 15: 1095–1105.
Thornton, C.R. (2010). Detection of invasive aspergillosis. Adv. Appl. Microbiol. 70:
187–216.
Thulasiraman, V., Lin, S., Gheorghiu, L., Lathrop, J., Lomas, L., Hammond, D. and
Boschetti, E. (2005). Reduction of the concentration difference of proteins in biological
liquids using a library of combinatorial ligands. Electrophoresis 26: 3561–3571.
Thywißen, A., Heinekamp, T., Dahse, H.-M., Schmaler-Ripcke, J., Nietzsche, S.,
Zipfel, P.F. and Brakhage, A.A. (2011). Conidial Dihydroxynaphthalene Melanin of the
Human Pathogenic Fungus Aspergillus fumigatus Interferes with the Host Endocytosis
Pathway. Front. Microbiol. 2: 96.
Thön, M., Al-Abdallah, Q., Hortschansky, P. and Brakhage, A.A. (2007). The
thioredoxin system of the filamentous fungus Aspergillus nidulans: impact on
development and oxidative stress response. The Journal of Biological Chemistry 282:
27259–27269.

355
Tierney, L., Linde, J., Müller, S., Brunke, S., Molina, J.C., Hube, B., Schöck, U.,
Guthke, R. and Kuchler, K. (2012). An Interspecies Regulatory Network Inferred from
Simultaneous RNA-seq of Candida albicans Invading Innate Immune Cells. Frontiers
in Microbiology 3: 85.
Tillie-Leblond, I. and Tonnel, a-B. (2005). Allergic bronchopulmonary aspergillosis.
Allergy 60: 1004–1013.
Tjalsma, H., Schaeps, R.M.J. and Swinkels, D.W. (2008). Immunoproteomics: From
biomarker discovery to diagnostic applications. Proteomics. Clinical Applications 2:
167–180.
Towpik, J. (2005). Regulation of Mitochondrial Translation in Yeast. Cell. Mol. Biol.
Lett. 10: 571–594.
Trachootham, D., Lu, W., Ogasawara, M. a, Nilsa, R.-D.V. and Huang, P. (2008).
Redox regulation of cell survival. Antioxidants & Redox Signaling 10: 1343–1374.
Traunmüller, F., Popovic, M., Konz, K.-H., Smolle-Jüttner, F.-M. and Joukhadar, C.
(2011). Efficacy and safety of current drug therapies for invasive aspergillosis.
Pharmacology 88: 213–224.
Triana-Alonso, F.J., Chakraburtty, K. and Nierhaus, K.H. (1995). The Elongation
Factor 3 Unique in Higher Fungi and Essential for Protein Biosynthesis Is an E Site
Factor. The Journal of Biological Chemistry 270: 20473–20478.
Trof, R.J., Beishuizen, A., Debets-Ossenkopp, Y.J., Girbes, A.R.J. and Groeneveld,
A.B.J. (2007). Management of invasive pulmonary aspergillosis in non-neutropenic
critically ill patients. Intensive Car Med. 33: 1694–1703.
Tsai, H.F., Chang, Y.C., Washburn, R.G., Wheeler, M.H. and Kwon-Chung, K.J.
(1998). The developmentally regulated alb1 gene of Aspergillus fumigatus: its role in
modulation of conidial morphology and virulence. J. Bacteriol. 180: 3031–3038.
Tsai, H.F., Wheeler, M.H., Chang, Y.C. and Kwon-Chung, K.J. (1999). A
developmentally regulated gene cluster involved in conidial pigment biosynthesis in
Aspergillus fumigatus. J. Bacteriol. 181: 6469–6477.
Tsunawaki, S., Yoshida, L.S., Nishida, S., Kobayashi, T. and Shimoyama, T. (2004).
Fungal Metabolite Gliotoxin Inhibits Assembly of the Human Respiratory Burst
NADPH Oxidase. Infect. Immun. 72: 3373–3382.
Tunger, O., Bayram, H., Degerli, K., Dinc, G. and Cetin, B.C. (2008). Comparison of
the efficacy of combination and monotherapy with caspofungin and liposomal
amphotericin B against invasive candidiasis. Saudi Med. J. 29: 728–733.
Twumasi-Boateng, K., Yu, Y., Chen, D., Gravelat, F.N., Nierman, W.C. and Sheppard,
D.C. (2009). Transcriptional profiling identifies a role for BrlA in the response to

356
nitrogen depletion and for StuA in the regulation of secondary metabolite clusters in
Aspergillus fumigatus. Eukaryot. Cell 8: 104–115.
Ullmann, A.J., Sanz, M.A., Tramarin, A., Barnes, R.A., Wu, W., Gerlach, B. a, Krobot,
K.J. and Gerth, W.C. (2006). Prospective study of amphotericin B formulations in
immunocompromised patients in 4 European countries. Clin. Infect. Dis. 43: e29–38.
Upadhyay, S.K., Gautam, P., Pandit, H., Singh, Y., Basir, S.F. and Madan, T. (2012).
Identification of fibrinogen-binding proteins of Aspergillus fumigatus using proteomic
approach. Mycopathologia 173: 73–82.
Ushio-Fukai, M. and Alexander, R.W. (2004). Reactive oxygen species as mediators of
angiogenesis Signaling Role of NAD(P)H oxidase. Mol. Cell. Biochem. 264: 85–97.
Valerius, O., Draht, O., Kübler, E., Adler, K., Hoffmann, B. and Braus, G.H. (2001).
Regulation of hisHF transcription of Aspergillus nidulans by adenine and amino acid
limitation. Fungal Genetics and Biology 32: 21–31.
Valiante, V., Heinekamp, T., Jain, R., Härtl, A. and Brakhage, A.A. (2008). The
mitogen-activated protein kinase MpkA of Aspergillus fumigatus regulates cell wall
signaling and oxidative stress response. Fungal Genet. Biol. 45: 618–627.
Vandeputte, P., Ferrari, S. and Coste, A.T. (2012). Antifungal resistance and new
strategies to control fungal infections. Int. J. Microbiol. 2012: 713687.
Varghese, R.S., Zhou, B., Nezami Ranjbar, M.R., Zhao, Y. and Ressom, H.W. (2012).
Ion annotation-assisted analysis of LC-MS based metabolomic experiment. Proteome
Science 10 Suppl 1: S8.
Villas-Bôas, S.G., Mas, S., Akesson, M., Smedsgaard, J. and Nielsen, J. (2005). Mass
spectrometry in metabolome analysis. Mass Spectrometry Reviews 24: 613–646.
Volling, K., Thywissen, A., Brakhage, A.A. and Saluz, H.P. (2011). Phagocytosis of
melanized Aspergillus conidia by macrophages exerts cytoprotective effects by
sustained PI3K/Akt signalling. Cell. Microbiol. 13: 1130–1148.
Volpi, I., Perruccio, K., Tosti, A., Capanni, M., Ruggeri, L., Posati, S., Aversa, F.,
Tabilio, A., Romani, L., Martelli, M.F. and Verlardi, A. (2001). Postgrafting
administration of granulocyte colony-stimulating factor impairs functional immune
recovery in recipients of human leukocyte antigen haplotype-mismatched hematopoietic
transplants. Blood 97: 2514–2521.
Voulgaris, I., O’Donnell, A., Harvey, L.M. and McNeil, B. (2012). Inactivating
alternative NADH dehydrogenases: enhancing fungal bioprocesses by improving
growth and biomass yield? Scientific Reports 2: 322.
De Vrankrijker, A.M.M., Van der Ent, C.K., Van Berkhout, F.T., Stellato, R.K.,
Willems, R.J.L., Bonten, M.J.M. and Wolfs, T.F.W. (2011). Aspergillus fumigatus

357
colonization in cystic fibrosis: implications for lung function? Clin. Microbiol. Infect.
17: 1381–1386.
Vödisch, M., Albrecht, D., Lessing, F., Schmidt, A.D., Winkler, R., Guthke, R.,
Brakhage, A.A. and Kniemeyer, O. (2009). Two-dimensional proteome reference maps
for the human pathogenic filamentous fungus Aspergillus fumigatus. Proteomics 9:
1407–1415.
Vödisch, M., Scherlach, K., Winkler, R., Hertweck, C., Braun, H.-P., Roth, M., Haas,
H., Werner, E.R., Brakhage, A.A. and Kniemeyer, O. (2011). Analysis of the
Aspergillus fumigatus proteome reveals metabolic changes and the activation of the
pseurotin A biosynthesis gene cluster in response to hypoxia. J. Proteome Res. 10:
2508–2524.
Wachter, A. (2010). Riboswitch-mediated control of gene expression in eukaryotes.
RNA Biology 7: 67–76.
Wagener, J., Echtenacher, B., Rohde, M., Kotz, A., Krappmann, S., Heesemann, J. and
Ebel, F. (2008). The putative alpha-1,2-mannosyltransferase AfMnt1 of the
opportunistic fungal pathogen Aspergillus fumigatus is required for cell wall stability
and full virulence. Eukaryot. Cell 7: 1661–1673.
Ward, O.P., Qin, W.M., Dhanjoon, J., Ye, J. and Singh, A. (2005). Physiology and
Biotechnology of Aspergillus. Adv. Appl. Microbiol. 58C: 1–75.
Waring, P., Sjaarda, A. and Lin, Q.H. (1995). Gliotoxin Inactivates Alcohol
Dehydrogenase by either Covalent Modification or Free Radical Damage Mediated by
Redox Cycling. Biochem. Pharmacol. 49: 1195–1201.
Warner, J.R. (1999). The economics of ribosome biosynthesis in yeast. Trends in
Biochemical Sciences 24: 437–440.
Wartenberg, D., Lapp, K., Jacobsen, I.D., Dahse, H.-M., Kniemeyer, O., Heinekamp, T.
and Brakhage, A.A. (2011). Secretome analysis of Aspergillus fumigatus reveals Asp-
hemolysin as a major secreted protein. Journal of Clinical Microbiology 301: 602–611.
Wartha, F., Beiter, K., Normark, S. and Henriques-Normark, B. (2007). Neutrophil
extracellular traps: casting the NET over pathogenesis. Curr. Opin. Microbiol. 10: 52–
56.
Washburn, M.P., Wolters, D. and Yates, J.R. (2001). Large-scale analysis of the yeast
proteome by multidimensional protein identification technology. Nature Biotechnology
19: 242–247.
White, P.L., Bretagne, S., Klingspor, L., Melchers, W.J.G., McCulloch, E., Schulz, B.,
Finnstrom, N., Mengoli, C., Barnes, R. a, Donnelly, J.P. and Loeffler, J. (2010).
Aspergillus PCR: one step closer to standardization. Journal of Clinical Microbiology
48: 1231–1240.

358
White, P.L., Mengoli, C., Bretagne, S., Cuenca-Estrella, M., Finnstrom, N., Klingspor,
L., Melchers, W.J.G., McCulloch, E., Barnes, R. a, Donnelly, J.P. and Loeffler, J.
(2011). Evaluation of Aspergillus PCR protocols for testing serum specimens. J. Clin.
Microbiol. 49: 3842–3848.
Wiedner, S.D., Burnum, K.E., Pederson, L.M., Anderson, L.N., Fortuin, S., Chauvigné-
Hines, L.M., Shukla, A.K., Ansong, C., Panisko, E. a, Smith, R.D. and Wright, A.T.
(2012). Multiplexed activity-based protein profiling of the human pathogen Aspergillus
fumigatus reveals large functional changes upon exposure to human serum. J. Biol.
Chem. 10.1074/jbc.M112.394106.
Willger, S.D., Grahl, N. and Cramer Jr, R.A. (2009). Aspergillus fumigatus metabolism:
Clues to mechanisms of in vivo fungal growth and virulence. Med. Mycol. 47: S72–79.
Willger, S.D., Puttikamonkul, S., Kim, K.-H., Burritt, J.B., Grahl, N., Metzler, L.J.,
Barbuch, R., Bard, M., Lawrence, C.B. and Cramer, R.A. (2008). A Sterol-Regulatory
Element Binding Protein Is Required for Cell Polarity, Hypoxia Adaptation, Azole Drug
Resistance, and Virulence in Aspergillus fumigatus. PLoS Pathogens 4: e1000200.
Willmann, J., Thiele, H. and Leibfritz, D. (2011). Combined reversed phase HPLC,
mass spectrometry, and NMR spectroscopy for a fast separation and efficient
identification of phosphatidylcholines. Journal of Biomedicine & Biotechnology 2011:
Wingard, J.R., Kubilis, P., Lee, L., Yee, G., White, M., Walshe, L., Bowden, R.,
Anaissie, E., Hiemenz, J. and Lister, J. (1999). Clinical significance of nephrotoxicity in
patients treated with amphotericin B for suspected or proven aspergillosis. Clin. Infect.
Dis. 29: 1402–1407.
Winstead, J.A. and Suhadolnik, R.J. (1960). Biosynthesis of Gliotoxin . II . Further
Studies on the Incorporation of Carbon-14 and Tritium-labeled Precursors. J. Am.
Chem. Soc. 82: 1644–1647.
Xiao, R., Wilkinson, B., Solovyov, A., Winther, J.R., Holmgren, A., Lundström-Ljung,
J. and Gilbert, H.F. (2004). The contributions of protein disulfide isomerase and its
homologues to oxidative protein folding in the yeast endoplasmic reticulum. The
Journal of Biological Chemistry 279: 49780–49786.
Yamada, A., Kataoka, T. and Nagai, K. (2000). The fungal metabolite gliotoxin :
immunosuppressive activity on CTL-mediated cytotoxicity. Immunol. Lett. 71: 27–32.
Yamashita, Y. and Yamashita, M. (2010). Identification of a novel selenium-containing
compound, selenoneine, as the predominant chemical form of organic selenium in the
blood of bluefin tuna. The Journal of Biological Chemistry 285: 18134–18138.
Yamazaki, H., Yamazaki, D., Takaya, N., Takagi, M. and Ohta, A. (2007). A chitinase
gene, chiB ,involved in the autolytic process of Aspergillus nidulans. Current Genetics
51: 89–91.
359
Yanaka, N., Kaseda, Y., Tanaka, A., Nogusa, Y., Sumiyoshi, N. and Kato, N. (2009).
Generation of a Zinc Finger Protein ZPR1 Mutant That Constitutively Interacted with
Translation Elongation Factor 1α. Bioscience, Biotechnology, and Biochemistry 73:
2809–2811.
Yoshida, S., Ono, M., Shono, T., Izumi, H., Ishibashi, T., Suzuki, H. and Kuwano, M.
(1997). Involvement of Interleukin-8, Vascular Endothelial Growth Factor, and Basic
Fibroblast Growth Factor in Tumor Necrosis Factor Alpha-Dependent Angiogenesis.
Mol. Cell. Biol. 17: 4015–4023.
Zaas, A.K., Liao, G., Chien, J.W., Weinberg, C., Shore, D., Giles, S.S., Marr, K. a,
Usuka, J., Burch, L.H., Perera, L., Perfect, J.R., Peltz, G. and Schwartz, D. a (2008).
Plasminogen alleles influence susceptibility to invasive aspergillosis. PLoS Genetics 4:
e1000101.
Zamir, L., Zaretsky, M., Fridman, Y., Ner-Gaon, H., Rubin, E. and Aharoni, A. (2012).
Tight coevolution of proliferating cell nuclear antigen (PCNA)-partner interaction
networks in fungi leads to interspecies network incompatibility. Proc. Natl. Acad. Sci.
U. S. A. 109: E406–14.
Zhang, L., Feng, D., Fang, W., Ouyang, H., Luo, Y., Du, T. and Jin, C. (2009).
Comparative proteomic analysis of an Aspergillus fumigatus mutant deficient in
glucosidase I (AfCwh41). Microbiology 155: 2157–2167.
Zhang, Q., Faca, V. and Hanash, S. (2011). Mining the plasma proteome for disease
applications across seven logs of protein abundance. Journal of Proteome Research 10:
46–50.
Zhao, Y., Liu, J., Wang, J., Wang, L., Yin, H., Tan, R. and Xu, Q. (2004).
Fumigaclavine C improves concanavalin A-induced liver injury in mice mainly via
inhibiting TNF-alpha production and lymphocyte adhesion to extracellular matrices. J.
Pharm. Pharmacol. 56: 775–782.
Zhou, H., Hu, H., Zhang, L., Li, R., Ouyang, H., Ming, J. and Jin, C. (2007). O-
Mannosyltransferase 1 in Aspergillus fumigatus (AfPmt1p) is crucial for cell wall
integrity and conidium morphology, especially at an elevated temperature. Eukaryot.
Cell 6: 2260–2268.
Zhu, H., Santo, A. and Li, Y. (2012). The antioxidant enzyme peroxiredoxin and its
protective role in neurological disorders. Experimental Biology and Medicine 237: 143–
149.
Zmeili, O.S. and Soubani, A.O. (2007). Pulmonary aspergillosis: a clinical update. QJM
100: 317–334.

CHAPTER 9
Appendix I

360
9 Appendix I
Table: A. fumigatus mycelial proteins (n = 370) identified by shotgun mass spectrometry, described in Section 3.2.1, arranged in order of increasing
CADRE ID.
CADRE ID.
(AFUA_)
Protein name tpI tMr GRAVY
score
TM Coverage
(%)
Unique
peptides
SM
Score
1G00420a Carboxypeptidase S1, putative (EC 3.4.16.-) 5.29 60133.23 -0.36148 0 14 6 89.07
1G00990a Short chain dehydrogenase/reductase family protein (EC 1.-.-) 10.08 29491.36 -0.43065 0 28 6 100.04
1G01000a Oxidoreductase, 2OG-Fe(II) oxygenase family 5.33 42635.58 -0.27273 0 32 9 162.75
1G01010 Polyketide synthase, putative 5.52 231309.97 -0.18823 0 1 2 24.62
1G02070 Cytochrome C1/Cyt1, putative (EC 1.10.2.2) 8.29 35125.88 -0.34796 1 16 3 53.62
1G02290 Unknown function protein 4.37 11774.74 -0.46981 0 29 2 41.04
1G02550a Tubulin alpha-1 subunit 4.98 50025.27 -0.32098 0 40 12 200.92
1G02980 6-phosphogluconolactonase, putative (EC 3.1.1.31) 8.59 93269.00 -0.46791 0 3 2 32.51
1G03100 ATP synthase delta chain, mitochondrial, putative (EC 3.6.3.14) 5.27 17640.15 0.007273 0 12 2 26.07
1G03390a 60S ribosomal protein L12 9.36 25728.56 -0.28312 0 31 4 68.2
1G03510a ATP synthase gamma chain 7.64 31546.83 -0.22276 0 31 5 97.15
1G03610 Unknown function protein 6.93 32100.69 -0.36879 0 11 3 45.96
1G03720 UPF0136 domain protein 10.22 16880.62 0.322785 4 15 1 20.49
1G04070a Eukaryotic translation initiation factor eIF-5A 5.58 21164.02 -0.41146 0 28 4 72.6
1G04150 Tartrate dehydrogenase, putative (EC 1.1.1.93) 6.91 24077.71 -0.23721 0 18 4 55.45
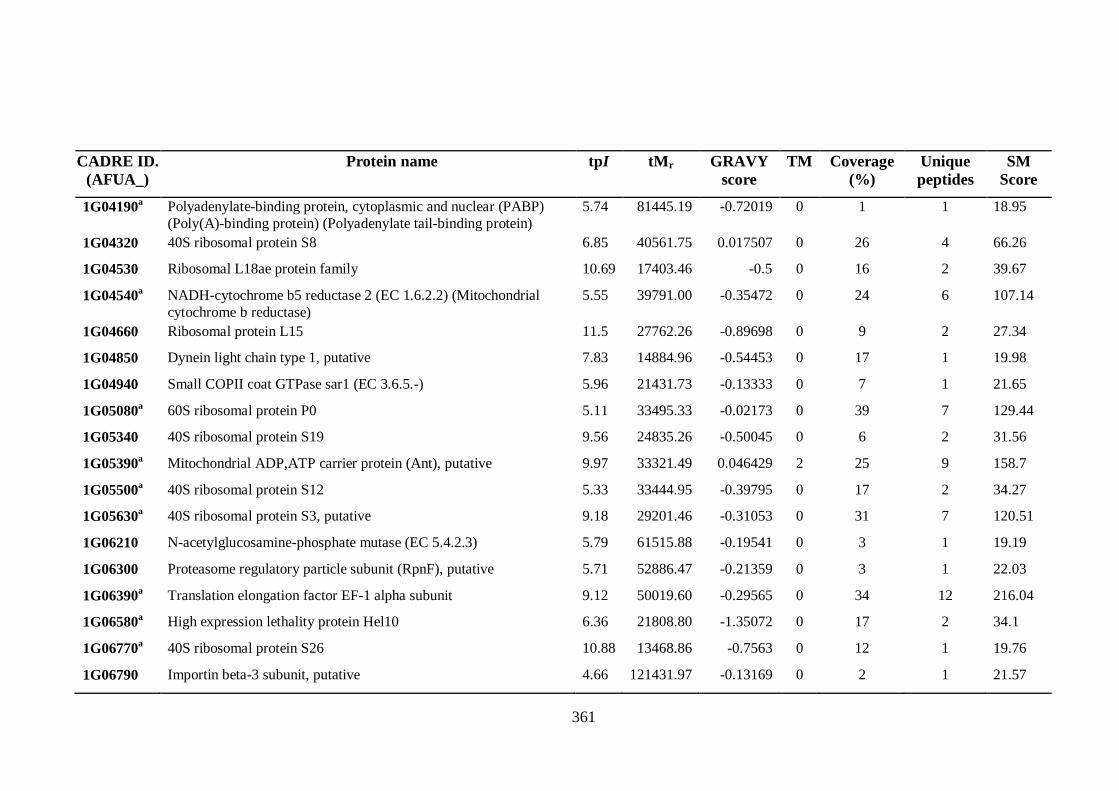
361
CADRE ID.
(AFUA_)
Protein name tpI tMr GRAVY
score
TM Coverage
(%)
Unique
peptides
SM
Score
1G04190a Polyadenylate-binding protein, cytoplasmic and nuclear (PABP)
(Poly(A)-binding protein) (Polyadenylate tail-binding protein)
5.74 81445.19 -0.72019 0 1 1 18.95
1G04320 40S ribosomal protein S8 6.85 40561.75 0.017507 0 26 4 66.26
1G04530 Ribosomal L18ae protein family 10.69 17403.46 -0.5 0 16 2 39.67
1G04540a NADH-cytochrome b5 reductase 2 (EC 1.6.2.2) (Mitochondrial
cytochrome b reductase)
5.55 39791.00 -0.35472 0 24 6 107.14
1G04660 Ribosomal protein L15 11.5 27762.26 -0.89698 0 9 2 27.34
1G04850 Dynein light chain type 1, putative 7.83 14884.96 -0.54453 0 17 1 19.98
1G04940 Small COPII coat GTPase sar1 (EC 3.6.5.-) 5.96 21431.73 -0.13333 0 7 1 21.65
1G05080a 60S ribosomal protein P0 5.11 33495.33 -0.02173 0 39 7 129.44
1G05340 40S ribosomal protein S19 9.56 24835.26 -0.50045 0 6 2 31.56
1G05390a Mitochondrial ADP,ATP carrier protein (Ant), putative 9.97 33321.49 0.046429 2 25 9 158.7
1G05500a 40S ribosomal protein S12 5.33 33444.95 -0.39795 0 17 2 34.27
1G05630a 40S ribosomal protein S3, putative 9.18 29201.46 -0.31053 0 31 7 120.51
1G06210 N-acetylglucosamine-phosphate mutase (EC 5.4.2.3) 5.79 61515.88 -0.19541 0 3 1 19.19
1G06300 Proteasome regulatory particle subunit (RpnF), putative 5.71 52886.47 -0.21359 0 3 1 22.03
1G06390a Translation elongation factor EF-1 alpha subunit 9.12 50019.60 -0.29565 0 34 12 216.04
1G06580a High expression lethality protein Hel10 6.36 21808.80 -1.35072 0 17 2 34.1
1G06770a 40S ribosomal protein S26 10.88 13468.86 -0.7563 0 12 1 19.76
1G06790 Importin beta-3 subunit, putative 4.66 121431.97 -0.13169 0 2 1 21.57

362
CADRE ID.
(AFUA_)
Protein name tpI tMr GRAVY
score
TM Coverage
(%)
Unique
peptides
SM
Score
1G06830a 60S acidic ribosomal protein P1 (AfP1) 4.1 11128.40 0.096396 0 47 3 53.65
1G06960 Pyruvate dehydrogenase E1 component alpha subunit, putative (EC
1.2.4.1)
6.36 41479.04 -0.46432 0 16 5 79.12
1G07380 Glutamate synthase Glt1, putative (EC 1.4.1.13) 5.98 234290.73 -0.28923 0 1 2 27.65
1G07440a Molecular chaperone Hsp70 5.09 69660.29 -0.4105 0 47 21 372.95
1G08810 Glycerol-3-phosphate dehydrogenase, mitochondrial (EC 1.1.99.5) 6.71 76830.19 -0.27745 1 6 3 36.25
1G09100a 60S ribosomal protein L9, putative 9.67 21843.17 -0.31875 0 36 7 111.78
1G09130 Unknown function protein 8.56 76550.12 -0.48047 0 2 1 22.2
1G09330 Eukaryotic translation initiation factor 3 subunit F (eIF3f) 4.81 37198.51 -0.26203 0 6 2 35.8
1G09440 40S ribosomal protein S23 10.46 15900.70 -0.52414 0 18 1 19.9
1G09660 Mitochondrial 2-oxodicarboxylate carrier protein, putative 9.82 33200.53 0.034098 2 6 1 20.8
1G09970 Eukaryotic translation initiation factor 3 subunit H (eIF3h) 5.96 41014.53 -0.36603 0 5 1 19.02
1G10130a Adenosylhomocysteinase (EC 3.3.1.1) 5.82 48490.04 0.060538 0 22 7 121.07
1G10350a Phosphoglycerate kinase (EC 2.7.2.3) 6.31 44761.47 -0.21487 0 44 16 255.96
1G10630a S-adenosylmethionine synthase (EC 2.5.1.6) 5.66 42195.98 -0.21318 0 46 11 180.66
1G10910a Tubulin beta, putative 4.79 51794.00 -0.37876 0 41 11 191.9
1G11120a Unknown function protein 4.47 34722.07 -0.52277 0 6 1 21.39
1G11130 60S ribosomal protein L6 10.15 22453.03 -0.635 0 19 3 47.34
1G11190a Eukaryotic translation elongation factor 1 subunit Eef1-beta,
putative
4.54 30142.49 -0.76353 0 22 4 82.16

363
CADRE ID.
(AFUA_)
Protein name tpI tMr GRAVY
score
TM Coverage
(%)
Unique
peptides
SM
Score
1G11710a Ribosomal protein 9.88 24252.58 -0.31751 0 12 2 39.81
1G11730 ADP-ribosylation factor, putative 5.54 21003.07 -0.27596 0 24 3 48.95
1G12070 Glycine cleavage system H protein 4.75 18626.88 -0.11886 0 18 2 31.79
1G12170a Elongation factor Tu 6.69 48285.99 -0.32227 0 19 5 86.05
1G12610 Heat shock protein Hsp88, putative (Hsp70 chaperone Hsp88) 5.08 80044.81 -0.53796 0 12 6 99.11
1G12800 Isocitrate dehydrogenase, NAD-dependent (EC 1.1.1.41) 8.72 41727.08 -0.12234 0 17 6 81.92
1G12890a 60S ribosomal protein L5, putative 8.59 35482.98 -0.83734 0 41 9 175.12
1G13090 Anthranilate synthase component ii, putative (EC 4.1.1.48) (EC
4.1.3.27) (EC 5.3.1.24) (Anthranilate synthase multifunctional
protein TrpC, putative) (EC 4.1.3.27)
5.93 82231.73 -0.10157 0 4 2 33.66
1G13140 G-protein complex alpha subunit GpaA/FadA 5.04 40769.47 -0.38895 0 12 3 39.34
1G13470 Prohibitin complex subunit Phb1, putative 9 31024.45 -0.21357 0 10 2 24.57
1G13490a Spermidine synthase (EC 2.5.1.16) 5.24 15674.03 -0.12222 0 7 2 34.27
1G13500a Transketolase TktA (EC 2.2.1.1) 6.13 74827.91 -0.2076 0 22 9 166.75
1G14200a Mitochondrial processing peptidase beta subunit, putative (EC
3.4.24.64) 5.9 53269.94 -0.32401 0 15 7 100.66
1G14220 Fibrillarin (Fibrillarin, putative) (Nucleolar protein NopA) 10.29 32572.25 -0.34872 0 6 1 18.36
1G14330 ABC transporter, putative 6.82 168183.61 -0.10995 12 2 3 38.31
1G14410a 60S ribosomal protein L17 10.64 21666.02 -0.53041 0 24 5 85.68
1G14550a Superoxide dismutase [Mn], mitochondrial (EC 1.15.1.1) (allergen
Asp f 6)
7.13 23390.47 -0.49333 0 6 1 19.78

364
CADRE ID.
(AFUA_)
Protein name tpI tMr GRAVY
score
TM Coverage
(%)
Unique
peptides
SM
Score
1G14570 Phosphoribosyl-AMP cyclohydrolase, putative (EC 1.1.1.23) 5.46 92881.52 -0.05883 0 8 3 40.59
1G14780 BAP31 domain protein, putative 9.05 24133.35 0.058019 3 11 2 28.76
1G15020a 40S ribosomal protein S5, putative 6.92 37605.90 -0.11257 0 18 3 68.43
1G15140 Mitochondrial phosphate carrier protein (Mir1), putative 9.38 33849.07 0.263777 0 41 8 145.07
1G15730a 40S ribosomal protein S22 9.67 14674.04 -0.18231 0 26 2 40.26
1G16190 Probable glycosidase crf1 (EC 3.2.-.-) (Crh-like protein 1) (allergen
Asp f 9)
4.6 40283.87 -0.26076 0 6 2 37.68
1G16840a Translationally-controlled tumor protein homolog (TCTP) 11.17 22811.93 -0.89602 0 26 4 64.98
2G02100a Dihydrolipoyl dehydrogenase (EC 1.8.1.4) 8.32 54971.13 -0.13762 0 21 7 113.06
2G02490 Unknown function protein 9.6 42498.89 -0.2381 0 3 1 18.45
2G03010 Cytochrome c subunit Vb, putative 5.28 23916.77 -0.57905 0 12 2 29.4
2G03120 Probable glycosidase crf2 (EC 3.2.-.-) (Crh-like protein 2) 4.67 46710.32 -0.37133 1 5 2 31.92
2G03290a 14-3-3 family protein ArtA, putative 4.79 29101.64 -0.43563 0 49 12 216.68
2G03380 Alkaline serine protease 9.72 13437.77 0.007087 0 28 2 38.99
2G03510a Carboxypeptidase 5 (Pheromone processing carboxypeptidase
(Sxa2), putative) (EC 3.4.16.-)
6.4 40908.96 0.067588 0 14 6 105.6
2G03720a Peptidyl-prolyl cis-trans isomerase (EC 5.2.1.8) 8.76 22290.17 -0.24634 0 28 5 74.93
2G03870 FK506-binding protein 2 (EC 5.2.1.8) (Peptidyl-prolyl cis-trans
isomerase) (PPIase) (Rotamase)
5.35 14637.79 -0.11269 0 11 1 20.69
2G04310 Argininosuccinate synthase (EC 6.3.4.5) 5.49 41670.35 -0.22989 0 8 3 39.2

365
CADRE ID.
(AFUA_)
Protein name tpI tMr GRAVY
score
TM Coverage
(%)
Unique
peptides
SM
Score
2G04620a Hsp70 chaperone BiP/Kar2, putative 4.91 73384.68 -0.37485 0 7 5 77.06
2G04710a Cytochrome b5, putative 5.35 23911.94 -0.23134 2 9 2 32.82
2G04980 Tyrosine decarboxylase, putative (EC 4.1.1.-) 5.58 55059.10 -0.10613 0 2 1 23.71
2G05910a Hexokinase Kxk, putative (EC 2.7.1.1) 5.06 54209.22 -0.22347 0 10 3 52.73
2G06150a Protein disulfide isomerase Pdi1, putative (EC 5.3.4.1) 4.58 56186.92 -0.32998 0 16 5 93.39
2G07380 Ribosomal protein L18 11.81 20853.36 -0.49402 0 25 4 71.97
2G07420 Actin-bundling protein Sac6, putative 5.78 72478.63 -0.31502 0 4 2 37.25
2G07970 60S ribosomal protein L19 11.46 24785.90 -1.01611 0 26 6 84.04
2G08370a Glutathione S-transferase, putative (EC 2.5.1.-) 9.32 16074.71 0.250345 3 15 2 35.13
2G09210 60S ribosomal protein L10 8.96 55206.83 -0.32926 0 23 4 66.97
2G09290a Antigenic mitochondrial protein HSP60, putative 5.53 61949.95 -0.09949 0 25 10 141.07
2G09650a Aspartate transaminase, putative (EC 2.6.1.1) 8.6 51182.79 -0.23262 0 9 3 50.57
2G09790 Glucose-6-phosphate isomerase (EC 5.3.1.9) 5.91 61315.46 -0.26148 0 5 2 41.54
2G09850a Oxidoreductase, 2-nitropropane dioxygenase family, putative (EC
1.-.-.-) 6.52 37702.48 -0.02873 0 8 2 36.28
2G09960a Mitochondrial Hsp70 chaperone (Ssc70), putative 6.02 74465.27 -0.38219 0 18 9 129.38
2G10070 Carbamoyl-phosphate synthase, large subunit (EC 6.3.5.5) 5.87 129214.48 -0.16009 0 7 5 80.49
2G10090 40S ribosomal protein S15, putative 10.38 19849.10 -0.72706 0 20 2 46.39
2G10100a 60S acidic ribosomal protein P2 (AfP2) (allergen Asp f 8) 4.29 11141.34 -0.11712 0 23 2 40.76

366
CADRE ID.
(AFUA_)
Protein name tpI tMr GRAVY
score
TM Coverage
(%)
Unique
peptides
SM
Score
2G10440 40S ribosomal protein S11 8.42 45746.17 -0.3055 0 36 4 59.86
2G10500 40S ribosomal protein Rps16, putative 10.19 15971.55 -0.39231 0 29 5 73.33
2G11060a Acyl CoA binding protein family 5.72 17309.63 -0.29051 0 25 2 38.68
2G11150 Secretory pathway gdp dissociation inhibitor 5.33 52280.27 -0.38803 0 9 3 41.5
2G11260 3-isopropylmalate dehydratase (EC 4.2.1.33) (Alpha-IPM
isomerase) (Isopropylmalate isomerase)
5.62 84076.50 -0.23629 0 3 2 26.4
2G11850a 60S ribosomal protein L3 (allergen Asp f 23) 10.18 44444.67 -0.62959 0 5 2 30.87
2G11940 Adenylosuccinate lyase Ade13, putative (EC 4.3.2.2) 6.22 54739.59 -0.29979 0 3 1 18.15
2G12400 ATP synthase oligomycin sensitivity conferral protein, putative (EC
3.6.3.14)
9.65 24389.11 -0.1674 0 26 6 87.02
2G12870 Vesicular-fusion protein sec17 5.32 32840.78 -0.54589 0 4 1 18.24
2G13110 Cytochrome c 10.06 26271.16 -0.47191 0 10 2 26.5
2G13240 V-type ATPase, B subunit, putative (EC 3.6.3.14) 5.73 56418.17 -0.32411 0 15 5 91.8
2G13290 GYF domain protein 6.7 214986.29 -0.54821 0 1 2 22.08
2G13530a Translation elongation factor EF-2 subunit, putative 6.51 93198.10 -0.23468 0 34 22 400.25
2G13680 Calcium/calmodulin-dependent protein kinase, putative (EC
2.7.11.17)
6.09 48721.50 -0.4341 0 8 2 27.83
2G13860 Histone H4 11.36 11386.34 -0.54369 0 28 3 56.87
2G14990 Tubulin subunit TubB 5.03 50441.50 -0.33659 0 15 5 73.82
2G15240 Small oligopeptide transporter, OPT family 7.64 89268.85 0.276263 14 5 3 46.54

367
CADRE ID.
(AFUA_)
Protein name tpI tMr GRAVY
score
TM Coverage
(%)
Unique
peptides
SM
Score
2G15290a DUF636 domain protein 6.27 14849.09 -0.24338 0 17 1 23.17
2G15760 Ubiquitin-activating enzyme E1 5.11 114685.85 -0.36089 0 1 1 20.67
2G16010a Prolyl-tRNA synthetase (EC 6.1.1.15) 6.23 71010.65 -0.51177 0 3 1 18.01
2G16090 Karyopherin alpha subunit, putative 4.97 60683.84 -0.27917 0 2 1 23.31
2G16200 Uracil phosphoribosyltransferase (EC 2.4.2.9) 5.53 24357.12 0.139648 0 5 1 18.17
2G16370 60S ribosomal protein L32 11.28 14966.79 -0.61374 0 9 1 22.29
2G17000a PT repeat family protein 10.84 27279.81 -0.88819 1 3 4 59.45
2G17110a Cdc48p (Cell division control protein Cdc48) (EC 3.6.1.-) 5.09 90218.23 -0.35946 0 21 13 212.67
3G00270a Probable glucan endo-1,3-beta-glucosidase eglC (EC 3.2.1.39)
(Endo-1,3-beta-glucanase eglC) (Laminarinase eglC)
4.9 44651.21 0.064126 1 24 8 167.1
3G00730a Unknown function protein 5.11 27920.69 -0.27903 0 12 2 40.86
3G00880 UPF0619 GPI-anchored membrane protein 4.68 21605.40 -0.09589 0 11 2 26.79
3G04170 Pyruvate dehydrogenase E1 beta subunit PdbA, putative (EC
1.2.4.1)
5.59 48427.44 -0.33393 0 12 4 66.35
3G04210 Fatty acid synthase alpha subunit FasA 6.09 204599.82 -0.32649 0 2 2 42.03
3G05350a Histone H2B 10.12 14955.22 -0.68 0 10 1 20.61
3G05370a Dihydrolipoamide succinyltransferase, putative (EC 2.3.1.61) 10.33 25586.74 -0.53722 0 9 4 66.76
3G05450 Glutamate carboxypeptidase, putative (EC 3.-.-.-) 5.47 53015.24 -0.32824 0 8 2 31.97
3G05600 60S ribosomal protein L27a, putative 10.44 16761.31 -0.6349 0 26 3 43.92
3G06140 Cytoskeleton assembly control protein Sla2, putative 5.46 118383.10 -0.6418 0 3 2 29.48

368
CADRE ID.
(AFUA_)
Protein name tpI tMr GRAVY
score
TM Coverage
(%)
Unique
peptides
SM
Score
3G06460a Conserved hypothetical protein 9.46 18915.55 -0.61796 1 13 1 22.18
3G06530 Sulfate adenylyltransferase (EC 2.7.7.4) (ATP-sulfurylase) (Sulfate
adenylate transferase) (SAT)
6.57 64333.17 -0.40488 0 9 3 47.43
3G06610 Proteasome regulatory particle subunit (RpnE), putative 6.76 58444.39 -0.41319 1 5 2 25.69
3G06840a 40S ribosomal protein S4, putative 4.77 59751.47 -0.21517 0 28 6 101.54
3G06960 60S ribosomal protein L21, putative 10.23 17980.83 -0.56266 0 14 1 18.16
3G06970 40S ribosomal protein S9 5.56 44846.27 -0.48014 0 14 4 53.53
3G07430a Peptidyl-prolyl cis-trans isomerase (EC 5.2.1.8) 7.75 17741.20 -0.25031 0 39 5 87.1
3G07640a Plasma membrane H+-ATPase Pma1 (EC 3.6.3.6) 5.22 108992.15 0.042206 10 31 26 445.15
3G07810 Succinate dehydrogenase subunit Sdh1, putative 6.5 71148.03 -0.41314 0 10 5 68.73
3G08160a ATP-dependent RNA helicase eIF4A (EC 3.6.4.13) (Eukaryotic
initiation factor 4A)(Translation initiation factor1)
5.46 27670.46 -0.26532 0 15 6 120.92
3G08380a Inorganic diphosphatase, putative (EC 3.6.1.1) 7.62 43623.57 -0.42096 0 39 9 154.09
3G08430 Mitochondrial phosphate carrier protein, putative 9.55 44335.33 -0.11216 2 7 3 38.42
3G08440 Unknown function protein 9.43 14742.25 -1.18175 0 21 2 28.49
3G08580 Glycine-rich RNA-binding protein, putative 5.7 12809.85 -0.91356 0 31 2 29.99
3G08660a Isocitrate dehydrogenase [NADP] (EC 1.1.1.42) 5.61 45768.89 -0.13597 0 7 3 44.53
3G08980 Threonine synthase Thr4, putative (EC 4.2.3.1) 8.18 56129.61 -0.26897 0 6 2 26.51
3G09030a Regulatory protein SUAPRGA1 4.88 40094.88 -0.4661 0 10 2 25.95

369
CADRE ID.
(AFUA_)
Protein name tpI tMr GRAVY
score
TM Coverage
(%)
Unique
peptides
SM
Score
3G09290a Phosphoglycerate mutase, 2,3-bisphosphoglycerate-independent
(EC 5.4.2.1)
5.44 57454.24 -0.41615 0 4 2 39.75
3G09320a Serine hydroxymethyltransferase (EC 2.1.2.1) 7.63 51873.35 -0.28025 0 27 10 162.27
3G10730a 40S ribosomal protein S7e 10.15 22844.25 -0.54677 0 27 3 53.93
3G11070 Pyruvate decarboxylase (EC 4.1.1.1) 4.83 25438.58 -0.3 0 13 4 63.92
3G11400a Vacuolar protease A (EC 3.4.23.25) (Aspartic endopeptidase pep2)
(Aspartic protease pep2)
4.81 43354.87 -0.13894 0 18 4 69.34
3G11610 Non-histone chromosomal protein 6 9.07 12078.37 -1.63173 0 14 2 27.52
3G11690a Fructose-bisphosphate aldolase, class II (EC 4.1.2.13) 6.59 58385.12 -0.25275 0 24 6 107.19
3G11830 Phosphoglucomutase (PGM) (EC 5.4.2.2) (Glucose phosphomutase)
6.29 60501.49 -0.24973 0 6 3 49.52
3G12270a Glutathione peroxidase 9.3 25755.79 -0.22596 0 34 7 98.64
3G12300 60S ribosomal protein L22, putative 5.74 13422.22 -0.41453 0 27 2 36.86
3G12800 Clathrin-coated vesicle protein (Bud7), putative 5.23 80264.62 -0.33792 0 2 1 21.03
3G13010 Zn-dependent hydrolase/oxidoreductase family protein, putative 6.79 46099.30 -0.55553 0 3 1 19.51
3G13320a 40S ribosomal protein S0 4.81 32122.23 -0.16498 0 17 3 55.11
3G13390 Vacuolar ATP synthase subunit d, putative (EC 3.6.3.14) 4.87 40937.45 -0.19146 0 7 1 19.46
3G13400 Nucleolar protein 58 7.13 64562.60 -0.58613 0 6 2 36.06
3G13910 NADH-ubiquinone oxidoreductase B18 subunit, putative 8.38 10797.27 -0.80968 0 10 1 20.14
3G14490a Ketol-acid reductoisomerase (EC 1.1.1.86) 9.32 56353.31 -0.29764 0 22 8 128.12

370
CADRE ID.
(AFUA_)
Protein name tpI tMr GRAVY
score
TM Coverage
(%)
Unique
peptides
SM
Score
3G14665 Unknown function protein 4.26 14579.46 -0.01136 0 11 1 18.24
3G14680a Lysophospholipase 3 (EC 3.1.1.5) (Phospholipase B 3) 5.39 67416.54 -0.12889 1 17 8 146.88
4G00960 6-phosphofructokinase (EC 2.7.1.11) (6PF-1-K)
(Phosphohexokinase)
6.68 88713.03 -0.25111 0 2 2 30.97
4G02790 Carbon-nitrogen family hydrolase, putative 7.04 33796.57 -0.09 0 14 2 32.14
4G03050a Profilin 5.87 14491.32 -0.12574 0 14 1 20.15
4G03320a Membrane bound cation transporter, putative 6.67 110475.71 -0.46454 11 2 2 34
4G03760 Glycine dehydrogenase (EC 1.4.4.2) 6.71 115202.81 -0.1834 0 3 3 32.7
4G03860 Eukaryotic translation initiation factor 3 subunit C (eIF3c) 5.05 97508.60 -0.5884 0 3 2 33.19
4G03880 60S ribosomal protein L7 9.7 34252.62 -0.56869 0 12 3 59.3
4G04460 60S ribosomal protein L13 10.58 24826.73 -0.77078 0 22 5 69.08
4G04520a Succinyl-CoA synthetase beta subunit, putative (EC 6.2.1.4) 6.2 28538.34 -0.17778 0 15 6 99.82
4G04810 Rab GTPase SrgA, putative 6.43 22787.78 -0.28689 0 22 3 41.34
4G05830 Translation initiation factor, putative 5.92 41590.56 0.024031 0 7 2 33.74
4G06620a Glutamate/Leucine/Phenylalanine/Valine dehydrogenase, putative
(EC 1.4.1.4)
5.79 49367.83 -0.17598 0 41 13 218.46
4G06820a Protein ecm33 4.8 41505.47 -0.00879 0 9 3 49.56
4G06910a Outer mitochondrial membrane protein porin 5.51 48017.08 -0.03423 0 17 6 99.11
4G07360a Cobalamin-independent methionine synthase MetH/D (EC 2.1.1.14) 6.33 86894.57 -0.30646 0 28 17 311.27
4G07580 Translation initiation factor EF-2 gamma subunit, putative 6.87 55187.76 -0.15306 0 6 2 25.55

371
CADRE ID.
(AFUA_)
Protein name tpI tMr GRAVY
score
TM Coverage
(%)
Unique
peptides
SM
Score
4G07690 Phosphoribosylaminoimidazolecarboxamide formyltransferase/IMP
cyclohydrolase
6.39 65027.90 -0.24303 0 5 2 28.8
4G07700 Clathrin heavy chain 5.29 192938.13 -0.26255 0 5 5 82.63
4G07710 Pyruvate carboxylase, putative (EC 6.4.1.1) 6.23 131272.97 -0.19899 0 14 12 196.8
4G07730a 60S ribosomal protein L11 10.04 20113.24 -0.6375 0 15 2 38.45
4G08040 RAB GTPase Ypt5, putative 8.72 23729.95 -0.28853 0 10 2 26.02
4G08580a Mitochondrial peroxiredoxin Prx1, putative (EC 1.11.1.7) 5.38 23392.65 -0.20657 0 36 5 81.74
4G08600 Aldehyde dehydrogenase, putative (EC 1.2.1.3) 6.48 60059.63 -0.11127 0 8 3 52.76
4G08720 Lysophospholipase 1 (EC 3.1.1.5) (Phospholipase B 1) 9.75 17880.81 -0.39758 1 7 4 67.87
4G09030 Aminopeptidase (EC 3.4.11.7) 6.31 106226.77 -0.27671 0 2 1 24.11
4G09110 Cytochrome c peroxidase, mitochondrial (CCP) (EC 1.11.1.5) 8.64 40379.25 -0.4571 1 8 2 34.07
4G10050 Calmodulin 4.69 26660.78 -0.60302 0 12 2 26.98
4G10350a Polyubiquitin UbiD/Ubi4, putative 6.48 35199.24 -0.47866 0 7 2 41.19
4G10410 Aspartate aminotransferase, putative (EC 2.6.1.1) 8.94 47892.64 -0.24783 0 19 6 92.91
4G10770 Fatty acid oxygenase PpoA, putative (EC 1.-.-.-) 6.15 121250.04 -0.32243 0 8 7 104.15
4G10800 40S ribosomal protein S6 10.72 15832.19 -0.38667 0 19 4 59.56
4G11050 NADH-ubiquinone oxidoreductase, subunit F, putative (EC 1.6.5.3) 8.44 54560.20 -0.37681 0 6 2 28.74
4G11250 Carbonic anhydrase (EC 4.2.1.1) 8.62 30827.50 -0.04355 0 4 1 21.11
4G11340 Saccharopine dehydrogenase Lys9, putative (EC 1.5.1.7) 5.91 49449.90 -0.14222 0 10 3 49.58

372
CADRE ID.
(AFUA_)
Protein name tpI tMr GRAVY
score
TM Coverage
(%)
Unique
peptides
SM
Score
4G11580 Superoxide dismutase (EC 1.15.1.1) 8.96 25153.31 -0.40568 0 6 1 19.86
4G11650 Alpha-ketoglutarate dehydrogenase complex subunit Kgd1, putative
(EC 1.2.4.2)
3.96 222643.84 -0.66931 0 6 4 59.3
4G11730 Glycerol dehydrogenase (GldB), putative (EC 1.1.1.72) 5.97 36827.82 -0.44923 0 11 2 25.32
4G11980 Anthranilate phosphoribosyltransferase, putative (EC 2.4.2.18) 5.5 45969.53 -0.06014 1 4 1 20.31
4G12450a Conserved lysine-rich protein, putative 5.03 57003.08 -0.78983 0 21 10 156.23
4G12870 Methylmalonate-semialdehyde dehydrogenase, putative (EC 1.2.1.27)
8.27 63864.67 -0.05698 0 5 2 29.36
4G13120a Glutamine synthetase (EC 6.3.1.2) 5.13 35803.15 -0.22048 0 10 4 59.09
4G13170a G-protein comlpex beta subunit CpcB 6.06 34979.37 -0.2943 0 27 7 108.29
4G13500 Aldehyde dehydrogenase, putative (EC 1.2.1.5) 8.44 56426.99 -0.12237 0 4 1 19.53
4G14000 Tripeptidyl-peptidase sed4 (EC 3.4.14.-) (Sedolisin-D) 4.88 63944.64 -0.15202 0 7 2 42.73
4G14380 Glutathione S-transferase, putative 7.69 30012.21 -0.24248 0 10 2 35.69
5G00720 GNAT family acetyltransferase, putative 5.23 29060.93 -0.54395 0 6 1 18.61
5G01030a Glyceraldehyde-3-phosphate dehydrogenase (EC 1.2.1.12) 6.17 36140.02 -0.16837 0 34 10 171.11
5G01440 Allergen, putative (EC 1.-.-.-) 8.44 21950.18 -0.04505 0 19 3 54.01
5G01860 ARP2/3 complex subunit Arc18, putative 6.31 21149.31 -0.19521 0 7 1 20.65
5G01970a Glyceraldehyde-3-phosphate dehydrogenase (EC 1.2.1.12) 6.96 36314.28 -0.11124 0 55 14 246.3
5G02370 Vacuolar ATP synthase catalytic subunit A, putative (EC 3.6.3.14) 5.83 74912.38 -0.25729 0 9 4 80.82
5G02470a Thiamine biosynthesis protein (Nmt1), putative) 6.03 38322.82 -0.27193 0 34 7 113.35

373
CADRE ID.
(AFUA_)
Protein name tpI tMr GRAVY
score
TM Coverage
(%)
Unique
peptides
SM
Score
5G02640 O-methyltransferase, putative (EC 2.1.1.-) 4.95 47749.73 -0.1065 0 20 5 84.57
5G02750a Cytochrome c oxidase subunit Va, putative 5.62 17991.28 -0.41076 0 34 5 80.84
5G03020a 60S ribosomal protein L4, putative 10.96 40503.89 -0.36166 0 31 10 171.21
5G03080 Septin 8.8 44414.55 -0.70286 0 6 2 25.3
5G03490a Nucleoside diphosphate kinase (NDK) (NDP kinase) (EC 2.7.4.6) 7.76 16932.49 -0.14444 0 54 7 112.28
5G03560 Glutamyl-tRNA synthetase (EC 6.1.1.17) 7.17 81424.25 -0.42965 0 6 2 25.37
5G03690 Phosphatidylinositol transfer protein sfh5 (PITP sfh5) 4.79 46169.61 -0.54198 1 5 2 32.95
5G03990 Vacuolar aspartyl aminopeptidase Lap4, putative 6.61 56024.37 -0.2031 0 2 1 19.59
5G04170a Heat shock protein 90 (65 kDa IgE-binding protein) (Heat shock
protein hsp1) (allergen Asp f 12)
4.95 80639.96 -0.62861 0 29 17 281.97
5G04210a Ubiquinol-cytochrome C reductase complex core protein 2, putative
(EC 1.10.2.2)
9.47 36893.97 -0.14029 0 17 6 97.05
5G04220 Mitochondrial DNA replication protein (Yhm2), putative 9.86 32080.36 -0.0396 0 14 2 37.84
5G04230a Citrate synthase 8.69 52111.79 -0.2346 0 23 9 149.08
5G04320 Secretion related GTPase SrgB/Ypt1 6.59 17608.94 -0.40189 0 16 2 29.37
5G04370a NADH-ubiquinone oxidoreductase, subunit G, putative (EC 1.6.5.3) 5.8 73371.09 -0.37988 0 20 9 143.19
5G05450 40S ribosomal protein S1 10.05 29200.85 -0.59258 0 15 3 43.67
5G05500 D-3-phosphoglycerate dehydrogenase (EC 1.1.1.95) 5.98 51483.73 -0.07627 0 2 1 18.34
5G05540a Nucleosome assembly protein Nap1, putative 4.43 48336.20 -0.84374 0 6 2 29.43
5G05630 60S ribosomal protein L23 10.26 16125.92 -0.42083 0 18 2 35.28

374
CADRE ID.
(AFUA_)
Protein name tpI tMr GRAVY
score
TM Coverage
(%)
Unique
peptides
SM
Score
5G06060 E3 ubiquitin ligase complex SCF subunit sconC (Sulfur controller
C) (Sulfur metabolite repression control protein C)
4.35 18141.24 -0.65443 0 15 1 23.91
5G06070 ABC multidrug transporter Mdr1 (EC 3.6.3.-) 6.68 147784.44 0.023573 12 2 2 47.39
5G06130 Succinyl-CoA synthetase alpha subunit, putative (EC 6.2.1.5) 8.83 34573.54 0.000604 0 4 1 19.76
5G06360a 60S ribosomal protein L8, putative 10.97 27485.65 -0.53976 0 14 2 35.87
5G06390 Adenosine kinase, putative (EC 2.7.1.20) 5.02 36858.82 -0.18491 0 6 2 28.88
5G06680 4-aminobutyrate transaminase GatA (EC 2.6.1.19) 4.59 68143.67 -0.16904 0 12 4 67.74
5G06710 DUF89 domain protein 5.13 54146.46 -0.38583 0 7 2 31.79
5G06780 Carbamoyl-phosphate synthase arginine-specific small chain (CPS-
A) (EC 6.3.5.5)
6.65 49336.79 -0.15298 0 3 1 19.87
5G07120a RNP domain protein 9.15 37138.34 -0.79034 0 20 4 74.99
5G07780 Squalene epoxidase-like protein (Squalene monooxygenase Erg1) 8.93 52682.51 0.138462 3 19 5 93.4
5G07890a SsDNA binding protein, putative 10.43 20526.29 -0.3871 0 8 1 18.68
5G08090 Pyridoxine biosynthesis protein 6.04 32736.71 -0.00617 0 4 1 19.42
5G08130 Protein transport protein Sec61 alpha subunit, putative 8.41 52221.60 0.482845 10 4 1 20.06
5G08810 Epoxide hydrolase, putative (EC 3.3.2.9) 5.67 44118.91 -0.22525 0 5 1 18.58
5G08830a Woronin body protein HexA, putative 6.56 49836.57 -0.8046 0 29 8 134.44
5G09210a Autophagic serine protease Alp2 (EC 3.4.21.48) 5.57 41139.99 -0.16676 0 18 6 95.94
5G09230a Transaldolase (EC 2.2.1.2) 6.04 35448.58 -0.13488 0 34 10 166.3
5G09330a CipC-like antibiotic response protein, putative 5.84 15052.55 -1.13462 0 35 5 85.84

375
CADRE ID.
(AFUA_)
Protein name tpI tMr GRAVY
score
TM Coverage
(%)
Unique
peptides
SM
Score
5G10370 Iron-sulfur protein subunit of succinate dehydrogenase Sdh2,
putative (EC 1.3.99.1)
9.15 33915.92 -0.5689 0 7 2 29.61
5G10550a ATP synthase subunit beta (EC 3.6.3.14) 5.3 55620.38 -0.07881 0 62 21 415.78
5G10560 Cytochrome c oxidase subunit V 9.96 22199.62 -0.5398 1 14 3 45.2
5G10570 Cofilin 5.47 17028.14 -0.4474 0 17 2 39.96
5G10610 Ubiquinol-cytochrome c reductase iron-sulfur subunit (EC 1.10.2.2) 9.2 32609.47 -0.18154 0 21 4 82.06
5G10640 Tyrosyl-tRNA synthetase (EC 6.1.1.1) 6.18 43615.23 -0.36113 0 5 1 20.06
5G11230 RAS protein (RAS small monomeric GTPase RasA) (Ras GTPase) 4.97 23901.11 -0.35352 0 11 2 41.52
5G11240a Oxidoreductase, short chain dehydrogenase/reductase family 9.51 29575.22 -0.08022 0 7 1 21.27
5G12180a Ran-specific GTPase-activating protein 1, putative 4.93 27643.55 -1.02955 0 24 5 88.44
5G12260a Disulfide isomerase (TigA), putative (EC 5.3.4.1) 6.12 40253.93 -0.31304 0 14 3 47.75
5G12780 Kelch repeat protein 6.47 118900.04 -0.50643 0 13 4 59.13
5G13450a Triosephosphate isomerase (EC 5.3.1.1) 5.87 28068.18 -0.12266 0 29 4 76.01
5G14680 Unknown function protein 4.82 20247.02 -0.55084 0 24 4 64.68
6G02090a ATP synthase subunit E, putative (EC 3.6.3.14) 8.6 26216.90 -0.51293 0 9 2 26.36
6G02280a Putative peroxiredoxin pmp20 (EC 1.11.1.15) (Peroxisomal
membrane protein pmp20) (Thioredoxin reductase) (allergen Asp f 3)
5.36 18452.98 -0.11607 0 53 9 151.47
6G02470 Fumarate hydratase, putative (EC 4.2.1.2) 9.1 63159.39 -0.21117 0 16 6 87.93
6G02630 ATP-dependent RNA helicase sub2 (EC 3.6.4.13) 5.85 50320.48 -0.33482 0 7 2 31
6G02750a Nascent polypeptide-associated complex subunit beta (NAC-beta) 5.32 20546.17 -0.51183 0 9 1 20.87

376
CADRE ID.
(AFUA_)
Protein name tpI tMr GRAVY
score
TM Coverage
(%)
Unique
peptides
SM
Score
6G03730 2-methylcitrate dehydratase, putative (EC 4.2.1.79) 8.62 62104.99 -0.27437 0 2 1 18.49
6G03810a ATP synthase D chain, mitochondrial, putative (EC 3.6.3.14) 9.11 28696.01 -0.19961 0 23 3 55.59
6G03820a Nascent polypeptide-associated complex subunit alpha (NAC-
alpha)
4.85 21972.24 -0.70392 0 13 2 39.35
6G03830 Ribosomal protein L14 9.95 15885.71 -0.3 0 8 1 21.28
6G04570a Translation elongation factor eEF-1 subunit gamma, putative 7.18 54182.67 -0.35602 0 17 8 142.13
6G04620 NADH-ubiquinone oxidoreductase B14 subunit, putative (EC 1.6.5.3)
8.07 9756.14 -0.54878 0 11 1 19.49
6G04740a Actin Act1 5.87 43893.19 -0.20356 0 33 10 177.3
6G04920 NAD-dependent formate dehydrogenase AciA/Fdh (EC 1.2.1.2) 6.08 62998.59 -0.20351 0 13 4 61.19
6G04970 Phosphoserine aminotransferase (EC 2.6.1.52) 6.36 46893.41 -0.19907 0 7 2 27.15
6G05110 Mitochondrial import receptor subunit (Tom40), putative 5.65 38216.49 -0.02394 0 8 2 24.91
6G05210a Malate dehydrogenase, NAD-dependent (EC 1.1.1.37) 6.77 34810.15 0.062121 0 62 12 217.09
6G06340 Glucosamine-fructose-6-phosphate aminotransferase 6.24 77286.83 -0.14813 0 12 6 94.66
6G06370 NAD(+)-isocitrate dehydrogenase subunit I (EC 1.1.1.41) 8.42 49745.35 -0.06505 0 16 5 69.05
6G06690 CFEM domain protein, putative 5.07 19453.62 0.122222 0 8 1 18.03
6G06750a 14-3-3 family protein 4.74 30103.50 -0.53838 0 37 10 159.51
6G06770a Enolase (EC 4.2.1.11) (2-phospho-D-glycerate hydro-lyase) (2-
phosphoglycerate dehydratase) (allergen Asp f 22)
5.39 47305.37 -0.31598 0 49 15 280.25
6G06780 Proteasome regulatory particle subunit Rpt4, putative (EC 3.4.25.1) 5.67 44112.90 -0.34504 0 3 1 18.82

377
CADRE ID.
(AFUA_)
Protein name tpI tMr GRAVY
score
TM Coverage
(%)
Unique
peptides
SM
Score
6G06870 Casein kinase I homolog, putative 9.62 58779.24 -0.77533 0 4 2 26.48
6G06900 GTPase Rho1 (Rho GTPase Rho1) 6.09 22530.06 -0.1685 0 17 2 36.01
6G07430a Pyruvate kinase (EC 2.7.1.40) 5.06 45778.53 -0.20222 0 17 6 113.47
6G07620 GDP-mannose pyrophosphorylase A (EC 2.7.7.13) 5.92 58445.43 0.000763 0 2 1 18.14
6G07770 Alanine aminotransferase, putative (EC 2.6.1.-) 5.71 55135.21 -0.13653 0 16 5 93.83
6G08050a 6-phosphogluconate dehydrogenase, decarboxylating (EC 1.1.1.44) 5.86 55799.67 -0.16988 0 36 13 240.2
6G08660a M protein repeat protein 5.04 131895.88 -0.63293 0 3 2 39.36
6G08720 5'-methylthioadenosine phosphorylase (Meu1), putative (EC
2.4.2.28)
9.95 26670.60 -0.54768 0 16 4 47.34
6G08810 NADH-ubiquinone oxidoreductase 304 kDa subunit (EC 1.6.5.3) 9.28 38191.46 -0.47395 0 11 3 48.73
6G09740 GliT (Thioredoxin reductase GliT) (EC 1.-.-.-) 5.44 36003.77 -0.10808 0 12 2 42.69
6G10450 Unknown function protein 9.32 26688.25 -0.43952 0 12 2 29.74
6G10650 ATP citrate lyase, subunit 1, putative (EC 2.3.3.8) 8.66 78829.14 -0.06146 0 19 10 163.14
6G10660 ATP citrate lyase subunit (Acl), putatibe (EC 6.2.1.5) 5.88 52917.75 -0.07119 0 16 5 85
6G10700 Chaperonin, putative 7.89 13385.50 0.014754 0 18 2 24.68
6G10990 NADPH cytochrome P450 reductase (CprA), putative (EC 1.6.2.4) 5.38 76782.85 -0.29856 1 5 2 31.2
6G11850a Unknown function protein 8.68 44191.40 -0.29118 0 18 5 81.19
6G12170a FK506-binding protein 1A (FKBP) (EC 5.2.1.8) (Peptidyl-prolyl
cis-trans isomerase) (PPIase) (Rapamycin-binding protein)
6.57 12129.74 -0.38929 0 41 3 49.35
6G12280 NADH-ubiquinone oxidoreductase 213 kDa subunit 9.1 21172.84 -0.27056 0 26 3 49.47

378
CADRE ID.
(AFUA_)
Protein name tpI tMr GRAVY
score
TM Coverage
(%)
Unique
peptides
SM
Score
6G12300 RNP domain protein 9.63 51992.12 -0.81333 0 5 2 29.27
6G12580 Anthranilate synthase component I, putative (EC 4.1.3.27) 5.7 57019.42 -0.16015 0 8 2 34.41
6G12660 40S ribosomal protein S10b 9.74 17860.29 -0.96968 0 13 2 29.04
6G12740a Dienelactone hydrolase family protein (EC 3.1.1.-) 6.16 26942.80 -0.10694 0 28 6 89.17
6G12830 Protein transport protein sec24 6.15 99701.96 -0.14984 3 3 2 24.84
6G12930a Mitochondrial aconitate hydratase, putative (EC 4.2.1.3) 6.26 85529.08 -0.35578 0 21 12 187.53
6G12990 Cytosolic large ribosomal subunit protein L7A 10.21 28877.91 -0.48898 0 18 4 74.86
6G13250 60S ribosomal protein L31e 10.49 14007.26 -0.68293 0 16 2 22.65
6G13300 GTP-binding nuclear protein Ran, putative 5.6 46047.01 -0.37651 0 30 4 55.85
6G13490 Glutamate decarboxylase (EC 4.1.1.15) 5.85 58918.15 -0.40447 0 4 2 29.76
6G13540 Carboxypeptidase 3 (Carboxypeptidase CpyA/Prc1, putative) (EC 3.4.16.5)
5.5 60916.78 -0.39134 0 6 2 29
6G13550 Ribosomal protein S13p/S18e 10.58 14674.93 -0.86457 0 27 3 44.74
6G14090 CFEM domain protein 4.09 26811.00 -0.08984 1 3 1 19.49
7G01460a Ribosomal protein S5 10.54 28304.88 -0.39807 0 27 5 96.66
7G01830 Pyrophosphorylase (UTP-glucose-1-phosphate uridylyltransferase
Ugp1, putative)
6.41 56925.01 -0.25616 0 16 5 83.03
7G02230a MRNA binding post-transcriptional regulator (Csx1), putative 5.55 39564.22 -0.01456 0 9 4 53.55
7G02340 L-PSP endoribonuclease family protein (Hmf1), putative 9.08 18015.73 0.017857 0 6 1 18.29

379
CADRE ID.
(AFUA_)
Protein name tpI tMr GRAVY
score
TM Coverage
(%)
Unique
peptides
SM
Score
7G03740 14-alpha sterol demethylase (14-alpha sterol demethylase Cyp51B)
(EC 1.14.13.-)
7.64 58930.86 -0.12538 1 2 1 21.25
7G04070 Phospho-2-dehydro-3-deoxyheptonate aldolase (EC 2.5.1.54) 6.28 40071.54 -0.31816 0 7 1 19.3
7G04190 Cyclopropane-fatty-acyl-phospholipid synthase, putative (EC
2.1.1.79)
6.4 58957.04 -0.25819 2 9 2 32.5
7G04210a Tropomyosin, putative 4.91 17867.72 -1.18182 0 8 1 25.13
7G04290a Amino acid permease (Gap1), putative 8.47 63262.49 0.415437 12 9 5 74.21
7G05220 Mitochondrial carrier protein, putative 9.06 78228.66 -0.26356 1 10 3 52.38
7G05290a 40S ribosomal protein S13 10.35 16501.34 -0.25946 0 14 2 26.75
7G05370 Septin AspB 5.91 59344.75 -0.68349 0 4 2 23.33
7G05450 SUN domain protein (Uth1), putative (EC 3.2.1.-) 5.24 43504.21 -0.29686 0 6 1 23.16
7G05660a Translation elongation factor eEF-3, putative (EC 3.6.3.-) 5.84 117767.79 -0.2939 0 28 19 313.16
7G05720a Pyruvate dehydrogenase complex, dihydrolipoamide
acetyltransferase component, putative (EC 2.3.1.12) 6.26 52031.59 -0.23711 0 20 8 106.84
7G05740a Malate dehydrogenase (EC 1.1.1.37) 9.08 35898.07 -0.06676 0 40 8 154.27
7G06810 L-amino acid oxidase LaoA (EC 1.4.3.2) 6.04 78562.68 -0.3901 0 9 5 73.45
8G00230 Phytanoyl-CoA dioxygenase family protein FtmF 5.55 32666.51 -0.23093 0 14 3 40.88
8G00370 Polyketide synthase, putative 6.36 266597.78 -0.13712 0 10 12 208.22
8G00380a DltD N-terminal domain protein 4.92 32697.21 -0.19555 0 27 5 96.87
8G00390a O-methyltransferase, putative 5.39 63680.47 0.059578 0 33 6 95.06

380
CADRE ID.
(AFUA_)
Protein name tpI tMr GRAVY
score
TM Coverage
(%)
Unique
peptides
SM
Score
8G00400a Unknown function protein 5.67 16054.54 -0.19167 0 21 2 35.11
8G00430a Unknown function protein 5.13 18142.28 -0.58089 0 62 7 121.78
8G00440a Steroid monooxygenase, putative (EC 1.-.-.-) 5.48 101032.18 -0.30508 0 32 20 363.59
8G00480a Phytanoyl-CoA dioxygenase family protein 8.89 48089.24 -0.02565 0 20 6 95.95
8G00500 Acetate-CoA ligase, putative (EC 6.2.1.1) 6.74 79469.45 -0.21248 0 9 3 55.1
8G00510a Cytochrome P450 oxidoreductase OrdA-like, putative 8.37 60965.12 -0.27481 1 27 11 194.75
8G00530a Alpha/beta hydrolase, putative 5.57 49101.87 -0.18225 0 32 11 183.05
8G00540a Hybrid PKS-NRPS enzyme, putative 5.7 434005.61 -0.11183 2 28 73 1266.12
8G00550a Methyltransferase SirN-like, putative 5.21 29553.68 -0.33395 0 43 11 203.84
8G00580a Glutathione S-transferase, putative 5.17 26804.76 -0.17511 0 17 5 75.65
8G01160a Tartrate dehydrogenase, putative (EC 1.1.1.-) 5.41 39695.25 -0.15328 0 17 4 75.02
8G03880 Alanyl-tRNA synthetase, putative (EC 6.1.1.7) 6.04 113713.99 -0.51147 0 4 3 43.39
8G03930a Hsp70 chaperone (HscA), putative 5.3 66972.99 -0.31564 0 37 14 254.68
8G04000a Acetyl-CoA acetyltransferase, putative (EC 2.3.1.9) 9.09 36173.73 -0.46192 0 26 6 105.74
8G04890 Unknown function protein 4.8 18592.70 -0.08807 1 14 2 41.89
8G05320a ATP synthase subunit alpha 9.14 59932.73 -0.12824 0 33 17 293.44
8G05440 Mitochondrial ATPase subunit ATP4, putative (EC 3.6.3.14) 9.36 29727.04 -0.09562 0 24 5 90.29
8G05580 Acetyl-coA hydrolase Ach1, putative (EC 2.8.3.8) 6.29 58145.20 -0.31543 0 4 1 20.82

381
CADRE ID.
(AFUA_)
Protein name tpI tMr GRAVY
score
TM Coverage
(%)
Unique
peptides
SM
Score
8G05600a Unknown function protein 9.97 9288.14 -0.89157 0 27 2 32.42
8G05610a Probable beta-glucosidase btgE (EC 3.2.1.21) (Beta-D-glucoside
glucohydrolase btgE) (Cellobiase btgE) (Gentiobiase btgE)
5.81 52639.98 -0.20162 0 12 6 95.11
8G07210 Hydroxymethylglutaryl-CoA synthase, putative (EC 2.3.3.10) 8.85 55774.49 -0.35788 0 10 3 44.53
CADRE ID., A. fumigatus gene annotation nomenclature according to Nierman et al. (2005) and Mabey et al. (2004); tpI, theoretical isoelectric point;
tMr, theoretical molecular mass; TM, number of transmembrane regions; GRAVY score, grand average of hydropathy; SM score, Spectrum Mill
protein score. aProtein was also identified by gel filtration coupled shotgun mass spectrometry as outlined in Section 3.2.2.