A global 3-D model analysis using MODIS, MISR, CALIPSO, and AERONET observations David A. Ridley,...
9
North African Dust Export A global 3-D model analysis using MODIS, MISR, CALIPSO, and AERONET observations David A. Ridley, Colette L. Heald We gratefully acknowledge the MODIS team for the data supplied via the NASA Goddard website, and especially Jingfeng Huang for his help, the CALIPSO team for the retrievals used, all the PIs for the AERONET sites we used from across the world, and Joe Prospero for his dust concentration data. idley et al., in prep.)
-
date post
20-Dec-2015 -
Category
Documents
-
view
222 -
download
1
Transcript of A global 3-D model analysis using MODIS, MISR, CALIPSO, and AERONET observations David A. Ridley,...
North African Dust ExportA global 3-D model analysis using MODIS, MISR, CALIPSO, and AERONET observations
David A. Ridley, Colette L. Heald
We gratefully acknowledge the MODIS team for the data supplied via the NASA Goddard website, and especially Jingfeng Huang for his help, the CALIPSO team for the retrievals used, all the PIs for the AERONET sites we used from across the world, and Joe Prospero for his dust concentration data.
(Ridley et al., in prep.)

Mass Partitioning of Sub-Micron Dust
AOD decreased by 10-20%
Due to size dependence of scattering
NB no change in total dust mass
Equal vs realistic partitioning GEOS-Chem Annual AOD (2006)
Dust size distribution from the SHADE campaign (Highwood et al., 2003)
AOD contribution from dust size bins
Original uniform mass partitioningNew dust mass partitioning
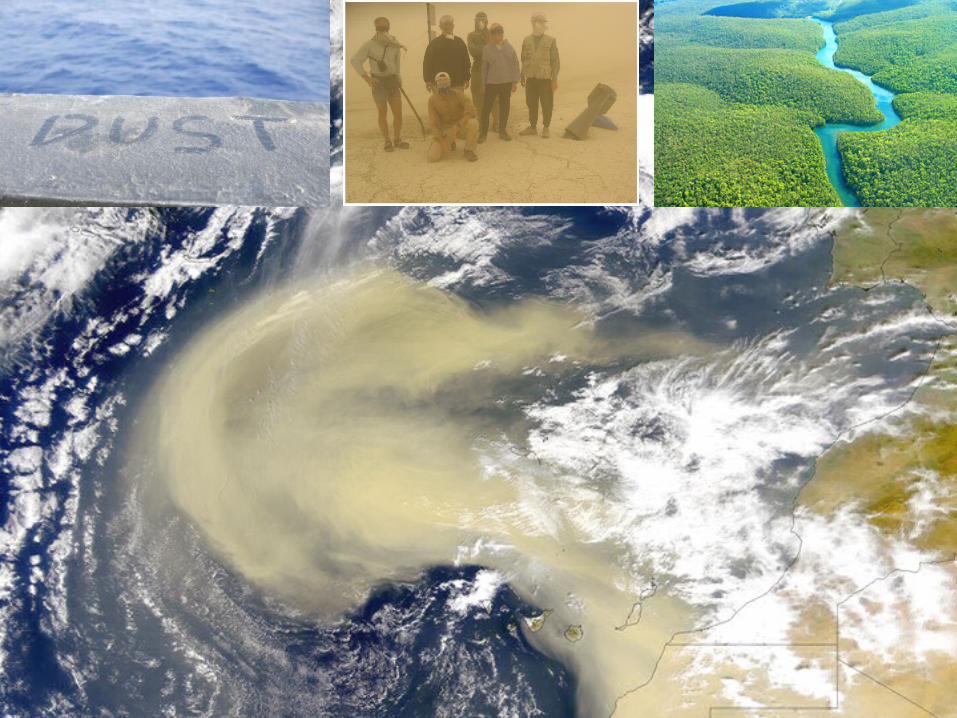
Spatial Distribution of AOD

Spatial Distribution of AOD
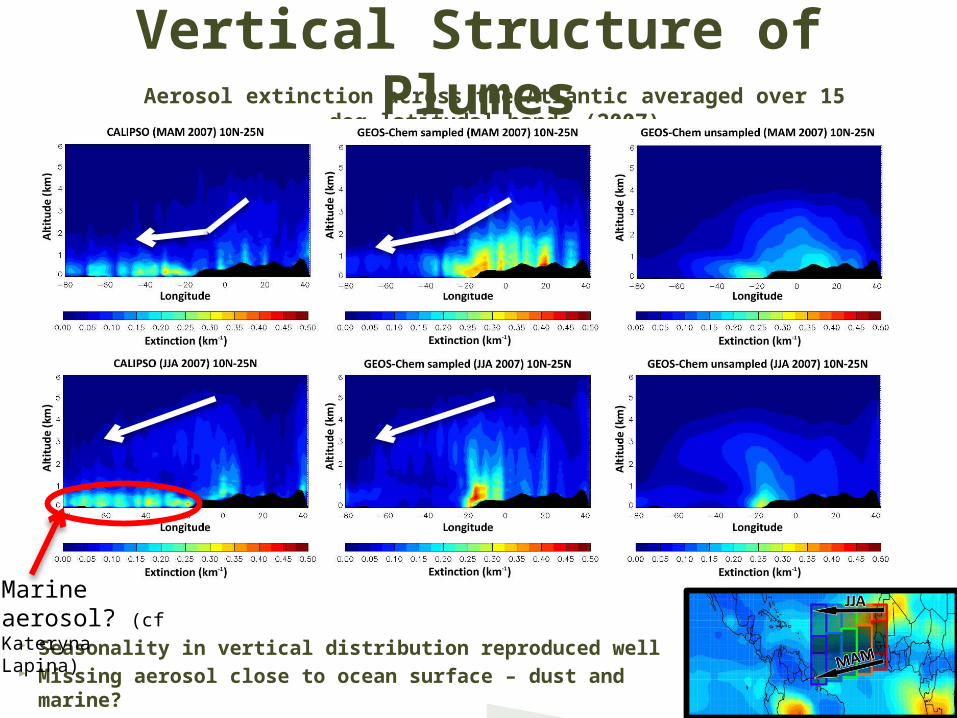
Vertical Structure of PlumesAerosol extinction across the Atlantic averaged over 15 deg latitudal bands (2007)
Seasonality in vertical distribution reproduced well Missing aerosol close to ocean surface – dust and marine?
Marine aerosol? (cf Kateryna Lapina)
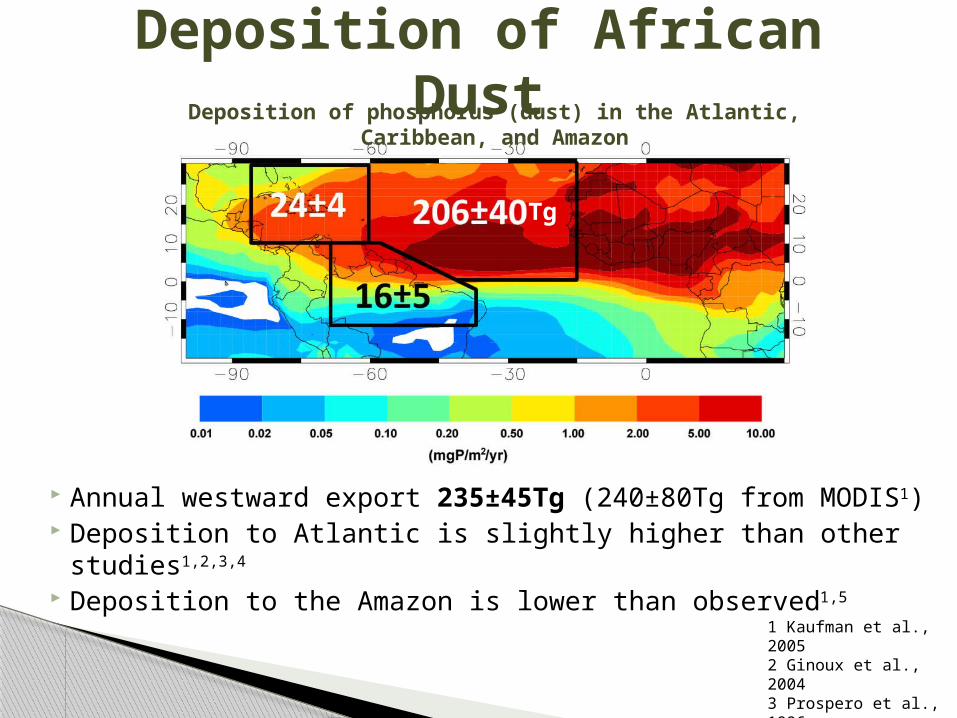
Annual westward export 235±45Tg (240±80Tg from MODIS1) Deposition to Atlantic is slightly higher than other studies1,2,3,4
Deposition to the Amazon is lower than observed1,5
Deposition of African DustDeposition of phosphorus (dust) in the Atlantic, Caribbean, and Amazon
1 Kaufman et al., 20052 Ginoux et al., 20043 Prospero et al., 19964 Fan et al., 20045 Mahowald et al., 2005
Tg
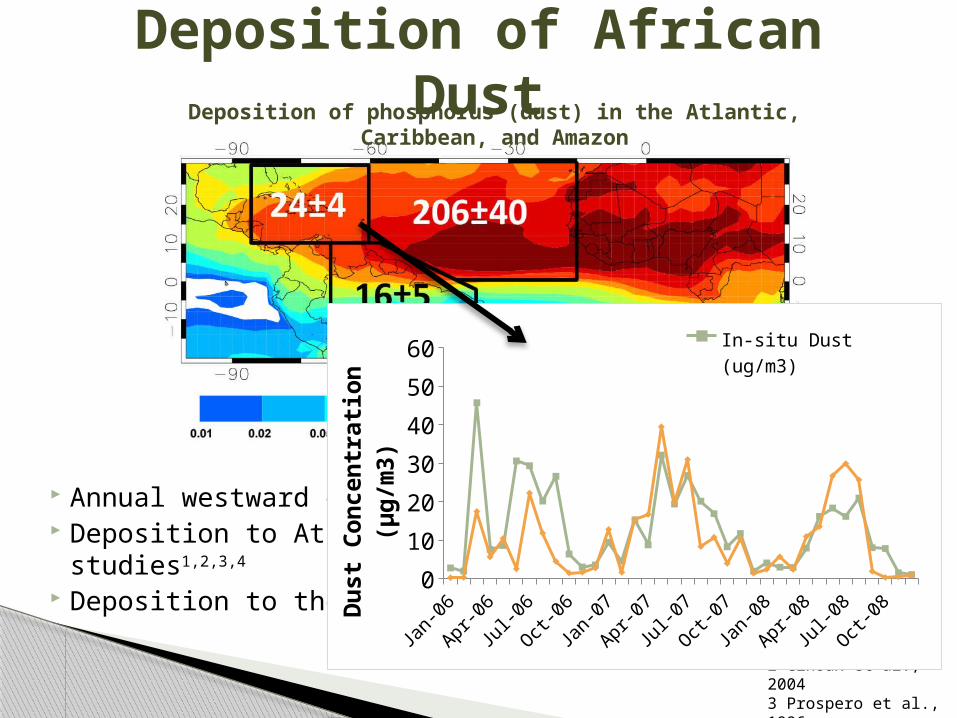
Annual westward export 235±45Tg (240±80Tg from MODIS1) Deposition to Atlantic is slightly higher than other studies1,2,3,4
Deposition to the Amazon is lower than observed1,5
Deposition of African DustDeposition of phosphorus (dust) in the Atlantic, Caribbean, and Amazon
1 Kaufman et al., 20052 Ginoux et al., 20043 Prospero et al., 19964 Fan et al., 20045 Mahowald et al., 2005
Jan-06
Apr-06
Jul-06
Oct-06
Jan-07
Apr-07
Jul-07
Oct-07
Jan-08
Apr-08
Jul-08
Oct-08
0
10
20
30
40
50
60 In-situ Dust (ug/m3)
GEOSchem dust (ug/m3)D
ust C
once
ntra
tion
(µg/
m3)
Seasonality and source regions of dust well reproduced Vertical distribution agrees well with CALIPSO observations Dust concentrations in Caribbean correlate well with
observations (R=0.7-0.9)
GEOS-Chem shows greater inter-annual variability than obs Emissions from Bodele Depression are under represented Dust deposition to Amazon lower than expected
ConclusionsPositives
Not-so Positives