A glass fiber filter technique for studying nutrient uptake by fungi: The technique used on colonies...
10
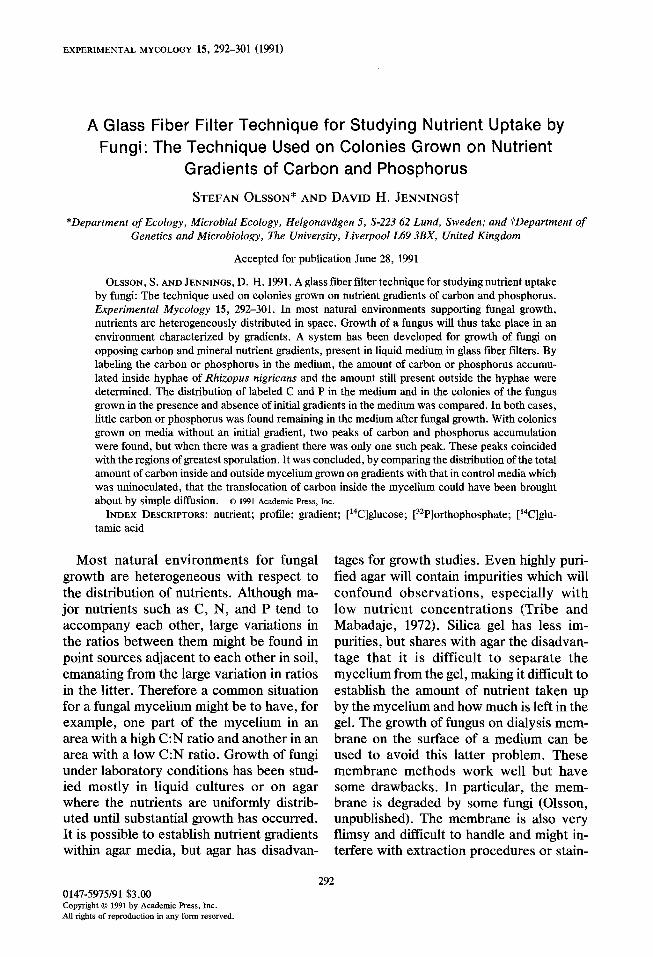
EXPERIMENTAL MYCOLOGY 15, 292-301 (1991) A Glass Fiber Filter Technique for Studying Nutrient Uptake by Fungi: The Technique Used on Colonies Grown on Nutrient Gradients of Carbon and Phosphorus STEFAN OLSSON* AND DAVID H. JENNINGS! *Department of Ecology, Microbial Ecology, Helgonaviigen 5, S-223 62 Lund, Sweden; and fDepartment of Genetics and Microbiology, The University, Liverpool L69 3BX, United Kingdom Accepted for publication June 28, 1991 OLSON, S. AND JENNINGS, D. H. 1991. A glass fiber filter technique for studying nutrient uptake by fungi: The technique used on colonies grown on nutrient gradients of carbon and phosphorus. Experimental Mycology 15, 292-301. In most natural environments supporting fungal growth, nutrients are heterogeneously distributed in space. Growth of a fungus will thus take place in an environment characterized by gradients. A system has been developed for growth of fungi on opposing carbon and mineral nutrient gradients, present in liquid medium in glass fiber filters. By labeling the carbon or phosphorus in the medium, the amount of carbon or phosphorus accumu- lated inside hyphae of Rhizopus nigricans and the amount still present outside the hyphae were determined. The distribution of labeled C and P in the medium and in the colonies of the fungus grown in the presence and absence of initial gradients in the medium was compared. In both cases, little carbon or phosphorus was found remaining in the medium after fungal growth. With colonies grown on media without an initial gradient, two peaks of carbon and phosphorus accumulation were found, but when there was a gradient there was only one such peak. These peaks coincided with the regions of greatest sporulation. It was concluded, by comparing the distribution of the total amount of carbon inside and outside mycelium grown on gradients with that in control media which was uninoculated, that the translocation of carbon inside the mycelium could have been brought about by simple diffusion. Q 1991 Academic press, IIIC. INDEX DESCRIPTORS: nutrient; profile; gradient; [14C]glucose; [32P]orthophosphate; [‘4C]glu- tamic acid Most natural environments for fungal growth are heterogeneous with respect to the distribution of nutrients. Although ma- jor nutrients such as C, N, and P tend to accompany each other, large variations in the ratios between them might be found in point sources adjacent to each other in soil, emanating from the large variation in ratios in the litter. Therefore a common situation for a fungal mycelium might be to have, for example, one part of the mycelium in an area with a high C:N ratio and another in an area with a low C:N ratio. Growth of fungi under laboratory conditions has been stud- ied mostly in liquid cultures or on agar where the nutrients are uniformly distrib- uted until substantial growth has occurred. It is possible to establish nutrient gradients within agar media, but agar has disadvan- tages for growth studies. Even highly puri- fied agar will contain impurities which will confound observations, especially with low nutrient concentrations (Tribe and Mabadaje, 1972). Silica gel has less im- purities, but shares with agar the disadvan- tage that it is difficult to separate the mycelium from the gel, making it difficult to establish the amount of nutrient taken up by the mycelium and how much is left in the gel. The growth of fungus on dialysis mem- brane on the surface of a medium can be used to avoid this latter problem. These membrane methods work well but have some drawbacks. In particular, the mem- brane is degraded by some fungi (Olsson, unpublished). The membrane is also very flimsy and difficult to handle and might in- terfere with extraction procedures or stain- 292 0147-5975/91 $3.00 Copyright 0 1991 by Academic Press, Inc. All rights of reproduction in any form reserved.
-
Upload
stefan-olsson -
Category
Documents
-
view
213 -
download
1
Transcript of A glass fiber filter technique for studying nutrient uptake by fungi: The technique used on colonies...
EXPERIMENTAL MYCOLOGY 15, 292-301 (1991)
A Glass Fiber Filter Technique for Studying Nutrient Uptake by Fungi: The Technique Used on Colonies Grown on Nutrient
Gradients of Carbon and Phosphorus
STEFAN OLSSON* AND DAVID H. JENNINGS!
*Department of Ecology, Microbial Ecology, Helgonaviigen 5, S-223 62 Lund, Sweden; and fDepartment of Genetics and Microbiology, The University, Liverpool L69 3BX, United Kingdom
Accepted for publication June 28, 1991
OLSON, S. AND JENNINGS, D. H. 1991. A glass fiber filter technique for studying nutrient uptake by fungi: The technique used on colonies grown on nutrient gradients of carbon and phosphorus. Experimental Mycology 15, 292-301. In most natural environments supporting fungal growth, nutrients are heterogeneously distributed in space. Growth of a fungus will thus take place in an environment characterized by gradients. A system has been developed for growth of fungi on opposing carbon and mineral nutrient gradients, present in liquid medium in glass fiber filters. By labeling the carbon or phosphorus in the medium, the amount of carbon or phosphorus accumu- lated inside hyphae of Rhizopus nigricans and the amount still present outside the hyphae were determined. The distribution of labeled C and P in the medium and in the colonies of the fungus grown in the presence and absence of initial gradients in the medium was compared. In both cases, little carbon or phosphorus was found remaining in the medium after fungal growth. With colonies grown on media without an initial gradient, two peaks of carbon and phosphorus accumulation were found, but when there was a gradient there was only one such peak. These peaks coincided with the regions of greatest sporulation. It was concluded, by comparing the distribution of the total amount of carbon inside and outside mycelium grown on gradients with that in control media which was uninoculated, that the translocation of carbon inside the mycelium could have been brought about by simple diffusion. Q 1991 Academic press, IIIC.
INDEX DESCRIPTORS: nutrient; profile; gradient; [14C]glucose; [32P]orthophosphate; [‘4C]glu- tamic acid
Most natural environments for fungal growth are heterogeneous with respect to the distribution of nutrients. Although ma- jor nutrients such as C, N, and P tend to accompany each other, large variations in the ratios between them might be found in point sources adjacent to each other in soil, emanating from the large variation in ratios in the litter. Therefore a common situation for a fungal mycelium might be to have, for example, one part of the mycelium in an area with a high C:N ratio and another in an area with a low C:N ratio. Growth of fungi under laboratory conditions has been stud- ied mostly in liquid cultures or on agar where the nutrients are uniformly distrib- uted until substantial growth has occurred. It is possible to establish nutrient gradients within agar media, but agar has disadvan-
tages for growth studies. Even highly puri- fied agar will contain impurities which will confound observations, especially with low nutrient concentrations (Tribe and Mabadaje, 1972). Silica gel has less im- purities, but shares with agar the disadvan- tage that it is difficult to separate the mycelium from the gel, making it difficult to establish the amount of nutrient taken up by the mycelium and how much is left in the gel. The growth of fungus on dialysis mem- brane on the surface of a medium can be used to avoid this latter problem. These membrane methods work well but have some drawbacks. In particular, the mem- brane is degraded by some fungi (Olsson, unpublished). The membrane is also very flimsy and difficult to handle and might in- terfere with extraction procedures or stain-
292 0147-5975/91 $3.00 Copyright 0 1991 by Academic Press, Inc. All rights of reproduction in any form reserved.

A GLASS FIBER FILTER TECHNIQUE 2
ing for microscopy. But even if membranes are used one is left with the problem of pro- duciag nutrient gradients. Here, we de- scribe a new procedure for examining nutrient uptake and translocation in myce- lium. This procedure, growth on liquid me- dium within glass fiber filters, is free of many of the above disadvantages.
The technique was used to investigate whether there was a difference in nutrient accumulation in fungal mycelium grown on a medium established with opposing nutri- ent gradients compared with that on an ini- tially uniform medium.
MATERIAL AND METHODS
Fungus
Rhizopus nigricans Ehrenb. was main- tained on malt agar (2% (w/v) Oxoid malt extract; 1.5% (w/v) Oxoid agar Grade 3). The isolate was obtained from the culture collection at the Department of Genetics and Microbiology, University of Liverpool (isolate code, Z6/2).
Growth System
Strips (32.5 x 1.5 mm) were cut from 9-cm-diameter Whatman GF/A glass fiber filter disks with the aid of a set of 30 razor blades mounted 1.5 mm apart. Two of these strips were placed on top of a 9-cm plastic petri dish lid inside a larger (14 cm diame- ter) plastic petri dish (Fig. 1). The larger dish contained 60 ml sterile distilled water to maintain a high relative humidity in the air. Two filter paper rectangles were posi- tioned on the small dish lid and dipped into the water in the larger dish. These in- creased the wet surface area thus helping to maintain the humidity of the gas phase and prevented the smaller dish from moving. The two strips of glass fiber filter each re- ceived 19 ~1 of a nutrient solution. The strips were then put in end-to-end contact. A small amount of inoculum (mainly spores) was scraped off stock cultures of
A . rl4-cm-diameter dish
B Slit
FIG. 1. System for growing fungi in strips of glass fiber filters as seen from above (A) and from the side (B). The hole and slit in the inner petri dish iid are to give continuity between the gas and the liquid phases inside and outside the inner lid and thus prevent it from floating.
the fungi with a straight platinum wire and used to inoculate the strips at the i~o~~la~ tion point I (Figs. 5 and 6) close to t tact point of the two strips. All material within the larger dish was sterile or been autoclaved. The nutrient soluti were glucose (G; 3.0 g liter acid plus minerals (N + P in g liter-l: glutamic acid 0.10; MCI, 0.05; MgSO, 7H,O, 0.05; an’ Fe(EDTA), 2.4 mg liter-l). Both ~~t~~~~ solutions had their pH adjusted to 6.g prior to autoclaving. [U-14C]glueose, lU-“4C]glu- tamic acid, and [321?]orthophosphate were present as indicated in Table 1. ~lut~rn~~ acid was used as the nitrogen source since nitrate is not assimilated by many Zygo- mycetes and uptake of ammonium from a medium can cause large pH changes, T growth systems were placed in plastic boxes lined with wet tissue paper and incu- bated for 7-9 days at 20°C before analvsis. Loss of i4C02 from labeled glutamic and glucose occurs through respiration ing fungal growth and might be reassimi- lated through anaplerotic fixation during i cubation. The air volume in contact wi the strips was large enough for a diI~ti~~ of

294 OLSSON AND JENNINGS
TABLE 1 Medium Combinations Given to the Two Glass Fiber
Strips in the Growth System That Were Put in Contact to Create Gradients
Experiment type strip 1 strip 2
G* N*+P+M G* N+P+M G N*+P+M 1/2(G* + N* 1/2(G* + N*
+P+M) +P+M) G N+P*+M 1/2(G + N 1/2(G + N
+ P* + M) +P* + M)
Note. G* = [U-‘4C]glucose with a specific activity of 22.40 MBq/mmol glucose or 3.73 MBq/mmol C.
N* = [U-‘4C]glutamic acid with a specific activity of 18.65 MBqlmmol glutamic acid or 3.73 MBq/ mm01 C.
P* = [32P]orthophosphate with a specific activity of 3.39 GBq/mmol orthophosphate.
respired 14C02 with air similation insignificant.
Microscopy
CO2 to make reas-
The emergence of mature sporophores as judged by observations in a dissecting mi- croscope and thus sporulation of R. nigri- CU~ZS correlated well with dark areas on the filter strips. The mycelium in the glass fiber filter could be observed by two means. (1) The filter with mycelium was immersed in fluorescein diacetate solution (5 pg ml- ‘) in 60 mM phosphate buffer (pH 7.5) for 5 min and then excess stain was washed off (mod- ification from Siiderstriim, 1977). The hy- phae were examined with an epifluores- cence microscope. (2) The filter was im- mersed in lactophenol cotton blue diluted with water (1:5) followed by washing off excess stain in the same way as that for label external to the mycelium as described below, drying, and mounting in immersion oil. The immersion oil has a refraction in- dex similar to that of the glass in the glass fiber filter, making it transparent and re-
vealing the stained fungal mycelium, thus enabling observation by light microscopy.
Measurements of Radioactivity in Fungus and Medium
The petri dish lid carrying the filter strips with or without a fungal colony was cov- ered first with a plastic sheet (0.5 mm thick) containing a cut-out window (5 x 75 mm) with a thin Mylar foil membrane (Fig. 2A). The location and amount of radioactivity were recorded by scanning the strips with a 27~ gas flow detector (Berthold, Germany) with a l-mm-wide window. Readings were then taken from the recordings for every 0.5-mm-interval on the strips. Three types of scans were performed on the labeled strips: (i) of wet strips (WCPM); (ii) of washed and wet strips (WWCPM); (iii) of washed and dried strips (DCPM). The strips were washed with an initially dry fil-
A
0.5mm-thick
Slit in the plastic sheet covered with Mylar foil
/
filter strips
9-cm-diameter ‘dish lid
B Advancing front of 9-cm-diameter
washing solution dish lid
paper 2 glass fiber
I
g-cm-diameter dish filter strips with washing solution
Wet filter paper bridge
FIG. 2. Preparation of glass fiber strips for scanning of radioactivity (A) and system for washing the label present outside the mycelium from the strips (B).

A GLASS FIBER FILTER TECHNIQUE
ter paper that drew unlabeled N + P + M solution from a reservoir through the strips (Fig. 2B). Using this procedure, labeled glucose could be washed completely from uninoculated strips in 30 min. WCPM - WWCPM then represents the amount of la- bel present in the medium outside the mycelium (soluble medium cpm, SCPM). Drying of the washed mycelium was achieved by drawing air over the strip. No movement of label could be detected when unwashed filters without mycelium were dried, and it was concluded that the drying did not change the distribution of label along the strips.
Each experiment contained at least four replicates. Since the colony width varied and the addition point was difficult to re- produce exactly, the figures presented are derived from one representative set of scans (WCPM, WWCPM, DCPM) from each experiment.
RESULTS
The Effects of Drying Filter Strips on Radioactivity Counts, and the Correction of Counts Obtained with Wet Strips
Radioactivity counts from strips contain- ing only nutrient solution with labeled glu- cose and glutamic acid were much lower than those obtained in the same strips after drying (unwashed strips). There was a lin- ear relationship with a slope of 2.8 between the values obtained before and after drying (Fig. 3). The lower counts from the strips containing nutrient solution were due to ab- sorption of the weak P-radiation from the *%Z by the water in the glass fiber filter as well as by the filter itself. An equation for such absorbance is given by
Cd = C, eMKd,
where C, represents the counts when there is no absorbance, Cd represents the COUntS after passing through a material with a
800
cpm from wet strips
FIG. 3. The relation between values from scanned wet (WCPM) control strips without fungus a.nd values from the same strips after drying (DCPM).
thickness d, and K is the spec tion coefficient for the material. wet or a dry glass fiber filter cou culated by determining the radiation w and without a filter tween the radiation lead. A dry filter absorbed 86.4% oft diation from 14C-labeled compounds. this it could be cal radiation sent out by a 14C pound, uniformly distributed thickness of the glass fiber filter, reache the surface of the filter. The label appeared evenly distributed throughout the thick~~~ss
were multiplied by this factor
the label had been moved to the upper sur- face of the strips. The difference b~~we~~ WWCPM and DCPM of strips with mycelium was very small, ~ndicat~~~ that the growth was very superficial; hence in this instance no correction for absorbance was required. Total activity was the~~~~~~ the sum of the activity in the dry and the corrected value for the

296 OLSSON AND JENNINGS
There was no difference found between WCPM and DCPM for unwashed controls with [32P~o~hophosphate. Therefore cor- rection was not needed and SCPM for 32P- labeled compounds was equal to WCPM- WWCPM.
The SCPM values presented in the fig- ures are sometimes negative. When both WCPM and WWCPM are high, e.g., at the peak of activity inside the mycelium, ran- dom errors of a few percent in measure- ments create negative or positive SCPM values that are magnified by correction for absorption in water and filter. For this rea- son SCPM values under the peak of accu- mulation will not be commented on further.
distribution of Radioa~ti~i~ in the Glass Fiber Filter Strips
In uninoculated strips gradients devel- oped as seen in Fig, 4. Since the specific activity of the added nutrients was known as well as the amount of labeled substance in a whole strip, the integral of the scanned graph gives the cpm measured for the known addition. The numerical approxima- tion of this integral in cpm was used to cal- culate the cpm measured per mole of la- beled nutrients, This constant was then used to calculate the concentration values presented in Fig. 4. The gradients and the logarithms of the C:N (glucose Cglutamate N) ratio and the C:P (glucose C:o~hophos- phate P) ratio were approximately linear over the whole length of the filters. C:N ratios were between 5 and 200 and C:P ra- tios between SO and 500 along the filters.
When the fungus grew on a medium with- out gradients, carbon and phosphorus ac- cumulated in two peaks (Figs. 5A and 5C). These peaks corresponded to the two dark areas of greatest sporulation. The peaks for phosphorus accumulation were in general much broader than those for carbon and seemed to reflect the extent of the colony to a greater degree. The amount of labeled nu- trients outside the mycelium fell to around
zero at the colony margins as the amount of label inside the mycelium increased.
When the fungus was grown on opposing gradients of glucose and glutamic acid + minerals just one peak of accumulated car- bon or phosphorus was found (Figs. 6A, 6C, 6G), which also corresponded to the one dark area of sporulation. The phospho- rus peak was broader as in the experiment without initial gradients. The distribution of radioactivity originating from only labeled glucose is shown in Fig. 6C. In these cir- cumstances the peak is even more pro- nounced than that in Fig. 6A. Relatively lit- tle carbon was found on the N $ P + M side of the peak in Fig. 6C.
In all cases where there were nutrient gradients, the amount of radioactivity fell to close to zero in the medic under the colony. However, in all instances where a colony margin faced the higher concentra- tion of the labeled nutrients (particular nu- trient in excess) some label was found in the medium for about 10 mm in under the col- ony. When the total amount of radioactivity from 14C-labeled glucose or glucose -+ glu- tamic acid in the strips with mycelium was plotted as a function of distance along the strips (Figs. 6B, 6D, 6H), there was a sim- ilarity with the distribution of carbon in strips without mycelium except in the re- gion of the most sporulation, where there was a distinct accumulation of radioactivity in the strips on which there was mycelium (Fig. 4). There was accumulation of 32P in the whole colony (Fig. 6H) when compared to the distribution of phosphate in uninoc- ulated strips.
DISCUSSION
The major difference between growth of fungi on opposing nutrient gradients and that in media with no initial gradients was the presence of only one peak of accumu- lation instead of two, probably due to the pattern of sporulation in the two situations. The most general condition for induction of sporulation in submerged fimgal cultures is

A GLASS FIBER FILTER TECHNIQUE
0 20 40 60 80 0 20 40 60 80 mm mm
MI / IG Ml 1G
0 20 40 SO 80 mm
MI / IG
FIG. 4. Gradients in strips without fungi after 7 days. (A) Carbon (exp. type 2) gradient (solid line) and nitrogen (exp. type 3) gradient (dotted line). (B) Phosphorus (exp. type 5) gradient. (C) C:N ratio (solid line) and C:P ratio (dotted line) for the two experiments. The box under the graph symbolizes the fiber strips where M, mineral + glutamic acid side; G, glucose side. The line across the box indicate where the two strips meet.
the reduction or exhaustion of assimilable nitrogen while carbohydrate is still avail- able (Smith, 1978). Where there were no gradients, it is presumed that nutrient gra- dients for the different nutrients developed inside the mycelium, with the highest con- centration at the two margins and the low- est at the center of the mycelium. If sporu- lation is at a maximum at a certain nutrient concentration or nutrient ratio within the mycelium, then it is likely that sporulation will occur at two places and this will be seen as two peaks of nutrient accumulation
in the mycelium. n the other han steep gradient has been introduced to the mycelium by the heterogeneity of the exter- nal medium, it is likely that it will one point in the mycelium that centration of nutrients will be su favor extensive sporulation.
In these experiments very little or no dioactivity was found in the rne~iu~ rectly under the colony. This implies that translocation of radioactivity within the mycelium brought about the acc~rn~ati~~ of radioactivity in the more central regions

298 OLSSON AND JENNINGS
1400 I. ', I '. 1 "I I
1200 A
-1200 m 0 20 40
mm ML I I I IG
E I E
3000 I, '. I '. I "I I " I
C 1
2500 :
2000 -
E 1500 y
3 1000 -
500 -
o-
-500Ft , ) , ~ , 1 , ,I
0 20 40 60 80 mm mm
MI ’ I I 1G Mr I I I IG E I E E I E
1500 B 1
L 4
1000 -
g 500 -
O-
-500 - , I , . . I , , r
0 20 40 60 80 mm
MI I I I IG E I E
, I, B, " L. " I 4000 -
D
0 20 40 60 80
FIG. 5. Distribution of carbon and phosphorus in strips with fungal growth but without initial gradients, at 7 days. (A and C) Carbon (exp. type 4) and phosphorus (exp. type 6), respectively, inside the mycelium (DCPM) (solid line) and in the medium (SCPM) (dotted line). (B and D) Total carbon and phosphorus in the strips. The box under the graph symbolizes the fiber strips where M, mineral + glutamic acid side; G, glucose side; E, colony edge; I, inoculation point.
of the colony. The distribution of the total amount of 14C in filter strips containing mycelium (except in the sporulating region) showed a striking similarity to the distribu- tion in uninoculated filter strips. This sug- gests that the translocation of carbon inside the mycelium of R . nigricans was by simple diffusion. The distribution of the total amount of 32P does not show such similarity which might indicate that phosphorus moves by a process other than simple dif- fusion.
Several advantages of growing fungi on glass fiber filters compared to in agar cul- tures can be listed:
1. It is a virtually inert system with high water holding capacity. The spaces between the fibers are large compared to the hyphae and seem not to hinder the growth of even the relatively wide hyphae of R. nigricans.
2. Washing off solution external to the fungal mycelium or even changing nutrient solution is easy. The ion exchange capacity of the glass fiber filter is very low compared

A GLASS FIBER FILTER TECHNIQUE
800
600 E ::
400
0 20 40 60 80 0 20 40 60 80 mm mm
800
600
-200
mm
ML / I I 1G E I E E I E
FIG. 6. Distribution of carbon and phosphorus in strips with initial gradients and fungal growth at 7 days. (A, C, E and G) Label inside the mycelium (DCPM) (solid line) and in the medium @CPM) (dotted line). (B, D, E, and H) Total label in the strips. (A and B) “C-labeled glucose and 14C-labeled glutamic acid (exp. type 1). (C and D) 14C-labeled glucose (exp. type 2). (E and F) ‘%-labeled glutamic acid (exp. type 3). (G and H) 32P-labeled orthophosphate (exp. type 5). The box under the graph symbolizes the fiber strips where M, mineral + glutamic acid side; G, glucose side; E, colony edge; I, inoculation point.
to that of gels like agar, which makes it easy to remove ionic solutions so there is no need for centrifugation or similar separa- tion procedures as with liquid cultures.
3. Glass fiber filters filled with media are easy to manipulate. Pieces of filter contain- ing different media can be brought into con- tact with each other in many different com- binations and arrangements.
4. It should be simple to extract or digest mycelium in the filters followed by chemi- cal analysis since there are few with nonfungal substances.
5. Glass fiber falters are relat (less than 0.5 mm>, making it p scan directly for radioactivity pre filter. Repetitive scans can also be made on growing mycelium.

300 OLSON AND JENNINGS
0 20 40 60 80 0 20 40 60 80 mm mm
MI I I I fG / / I I I E I E E I E
I , ” I ” I ” I ” 1 I ” I ‘, I ” I
3500 - G : 3000 -
: H 3ooor . ^_^^ h
-5oo~,,,,,,,,,,,,,,,,,~ 01, , ( , ,j
0 20 40 60 80 0 20 40 60 80 mm mm
MI I I I IG Ml I I , IG E- l E E I E
FIG. 6-Continued
There are, however, two major disadvan- tages with growing fungi on glass fiber fd- ters compared to agar. First it may be dif- ficult to keep the moisture content in the filter strips since the medium content can be rather low. By always keeping the cul- tures in a saturated atmosphere and by avoiding large temperature fluctuations this problem can be minimized. Second, it is difficult to observe the progress of growth since the filters are opaque and it is not possible to visualize the hyphae without se- rious disturbance. This can be overcome partially by observing where in relation to
the hyphal front (determined after staining and clearing, see Materials and Methods) a structure like conidiophore, sclerotium, etc. appears visible under the microscope.
We have presented a system for growing fungi on glass fiber filters which can be used in many kinds of studies. It should be es- pecially useful for measuring amounts of substances in different parts of the myce- lium by chemical analysis or by radiolabel- ing as described here. The notion that translocation of carbon inside the mycelium might be a case of simple diffusion seems to disagree with other studies (Girvin and

A GLASS FIBER FILTER TECHNIQUE 301
Thain, 1987; Thain and Girvin, 1987). Fur- ther evidence that translocation in the mycelium of a mold can be by simple diffu- sion is reported in the companion paper.
ACKNOWLEDGMENTS
This work was supported by a postdoctorial grant given to S. Olsson from the Swedish Natural Science Research Council and was carried out at the Depart- ment of Genetics and Microbiology, Liverpool, UK.
REFERENCES
GIRVIN, I)., AND THAIN, J. F. 1987. Growth of and translocation in mycelium of Neurospora crassa on
a nutrient deficient medium. Trans. 88: 237-246.
SMITH, 9. E. 1978. Asexual sporulation in ~~e~t~ns fungi. In The Filamentous Fungi (J. E. Smith and D. R. Berry, Eds.), Vol. 3, pp. 214-239. Arnold, London.
S~DERSTR~M, B. E. 1977. Vital staining of pure culture and soil with fluorescein diacet Biol. Biochem. 9: 59-63.
THAIN, J. F., AND GIRVIN, D. 1987. Tramlocation through established mycelium of Neuro on a nutrient-free substrate. Trans. Br. 89: 45-49.
TRIBE, H. T., AND MABADAJE, S. A. Growth of moulds on media prepared without organic nutri- ents. Trans. Br. Mycol. Sot. 58: 127437.