A glance at Akava 2011
44
1
description
overview of Akava and its members, 2011
Transcript of A glance at Akava 2011

1

Contents
2
Akava 2011 3
E l t t 4Employment prospects 4
Extending working careers 10
Wellbeing at work 16
Salaries 20
Taxation of salary earners 25
Education 29Education 29
Entrepreneurship 34
Organisation 37
This publication can be found on the Internet at www.akava.fi/en/.Printing house: Kirjapaino Uusimaa, 2011ISBN: 978-952-5628-42-5
A Glance at Akava 2011

Akava 2011
3
Akava, the Confederation of Unions for Professional and Managerial Staff in Finland, is one of the three independent trade union confederations in Finland
Akava’s 34 affiliates have a total membership of 553,000 including approx. 102,000 student members
Akava’s unionisation rate is about 70 per cent. 27 per cent of trade union members in Finland are Akava members.
Akava represents the interests of professionals and managerial staff and others with a high level of education.
Akava oversees its members’ economic, professional and other common interests.
A Glance at Akava 2011

Employment prospects
4
p y p p
Unemployment among those with a master’s degree or equivalent is higher than ever before.
A high level of education and unemployment in highly educated individuals is concentrated in the younger age groups. The recent decrease in unemployment has, however, focused mainl on those ho ha e j st grad atedmainly on those who have just graduated.
The biggest single reason for graduate unemployment is that student intakes are too high in some fields.
Better anticipation of educational needs is crucial for reducing unemployment in the future.
Public sector employment and training services should also serve the needs of highly educated people.
Fixed term employment remains common in public administration jobs and among young women.
Fixed term employment contracts should not be used without justification. p y j
A Glance at Akava 2011

Unemployment rate 1990–2009 by educational level, %
5
p y y ,
2122
2122
% %
1617181920
1617181920
1213141516
1213141516
Basic education only (62,000)
7891011
789
1011 Upper secondary
Lowest level of tertiary d ti d l
All
(115,000)
34567
34567 education and lower
degree level
Higher degree level of t ti d ti &
(221,000)
(31,000)
(13,000)
012
012
1990 1991 1992 1993 1994 1995 1996 1997 1998 1999 2000 2001 2002 2003 2004 2005 2006 2007 2008 2009 2010
tertiary education & doctorate
A Glance at Akava 2011
Source: Statistics Finland, Labour force statistics; Akava’s own estimation

Unemployed Akava members in selected fields January 2011
6
Bachelor of Engineering
Decrease Increase
Unemployed Akava members in selected fields, January 2011January
2011
Change per previous 12
months4 661 -572
Bachelor of Business AdministrationMaster of EngineeringMaster of Humanities
Master of BusinessMaster of Natural Sciences
2 075 -251
1 816 134
1 737 -111
1 320 -108
1 260 -81Master of Social Sciences
Master of ArtsBachelor of Social Services
Bachelor of EconomicsMaster of Education
1 260 81
988 -27
646 -26
620 -60
597 -16
567 80Master of EducationDoctorate
Bachelor of HumanitiesMaster of Law
LicentiateBachelor of Nursing
567 -80
470 32
436 -60
315 -3
280 -11Bachelor of Nursing
Bachelor of Natural SciencesMaster of Agriculture
Master of TheologyArchitect
240 -42
219 -17
189 -10
141 7
111 -15
-1 000 0 1 000 2 000 3 000 4 000 5 000
PharmacistMaster of MedicineMaster of Dentistry
74 -9
72 -2
22 -4
A Glance at Akava 2011
Excluding persons laid off, situation 31.1.2011Source: Statistics of Ministry of Employment and the Economy

Employment rate by age, 2009
7
100100
%
p y y g
80
90
80
90 Highly educated
All wage and salary
60
70
60
70All wage and salary
earners
40
50
40
50
AllHighly
educated
10
20
30
10
20
30 Employment rate, % 68.2 85.9
Unemployment rate, % 8.4 4.1
Outside labour force, % 25.6 10.4
0
10
0
10
Under 20 20–29 30–39 40–49 50–59 60–64Age group
A Glance at Akava 2011
Persons with at least a master’s degreeSource: Statistics Finland, Labour Force Statistics 2009

Employment rate among older age groups, 2000–2009
8
100%
All Hi hl d t d 100%
All Highly educated
p y g g g p ,
55–59 years of age 60–64 years of age
86 8588 88
80
90
100 All Highly educated
80
90
100 All Highly educated
5963 65 66 66 65 67 68
71 71
60
70
80
56 5760 5760
70
40
50
2934
37 39 41 3940
50
20
30 23 25 26 27 29
20
30
0
10
00 01 02 03 04 05 06 07 08 090
10
00 01 02 03 04 05 06 07 08 09
A Glance at Akava 2011
Persons with at least a master’s degreeSource: Statistics Finland, Labour Force Statistics 2009

Employment relationships in Finland in 2009, %
9
p y p
6 %
Akava members
13 %
All wage and salary earners
12 %
Permanent full-time work11 % Permanent full-time
workFixed term full-time workPart-time work
Fixed term full-time workPart-time work
82 %76 %
A Glance at Akava 2011
Source: Statistics Finland, Labour Force Statistics 2009
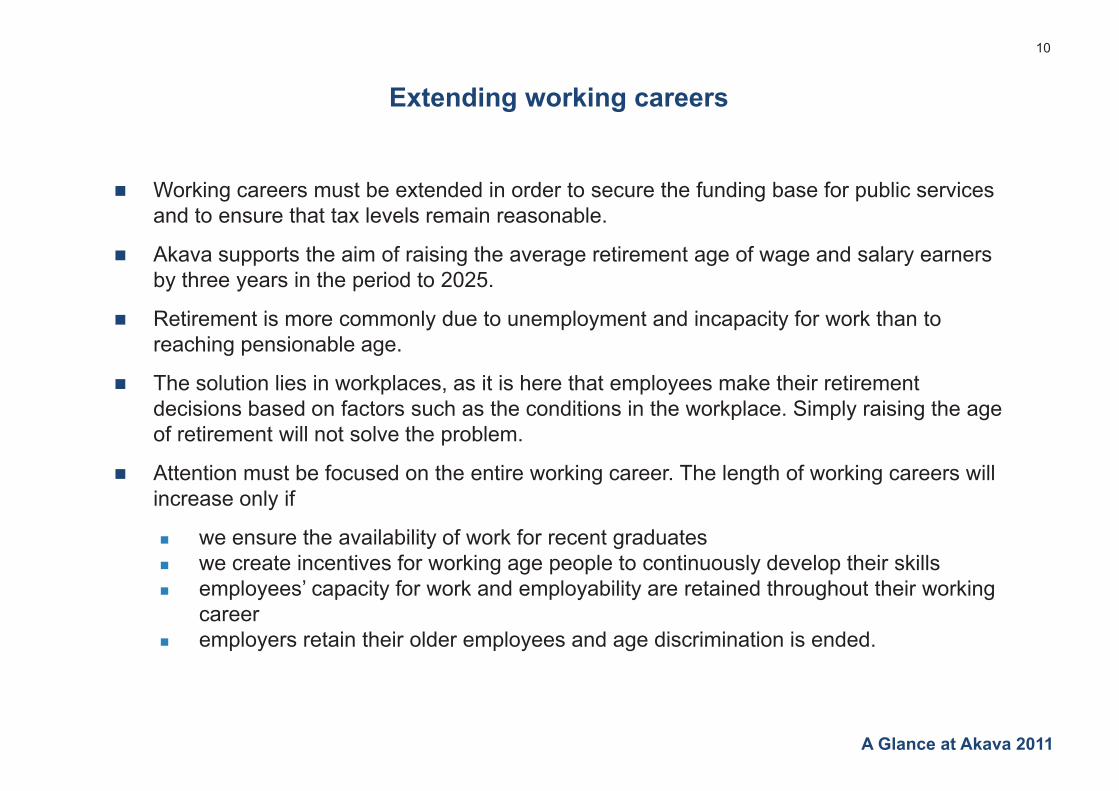
Extending working careers
10
Working careers must be extended in order to secure the funding base for public servicesand to ensure that tax levels remain reasonable.
Akava supports the aim of raising the average retirement age of wage and salary earnersby three years in the period to 2025.
Retirement is more commonly due to unemployment and incapacity for work than to reaching pensionable age.
The solution lies in workplaces, as it is here that employees make their retirementdecisions based on factors such as the conditions in the workplace. Simply raising the ageof retirement will not solve the problem.
Attention must be focused on the entire working career. The length of working careers willincrease only if
we ensure the availability of work for recent graduates we create incentives for working age people to continuously develop their skills
l ’ it f k d l bilit t i d th h t th i ki employees’ capacity for work and employability are retained throughout their workingcareer
employers retain their older employees and age discrimination is ended.
A Glance at Akava 2011
11
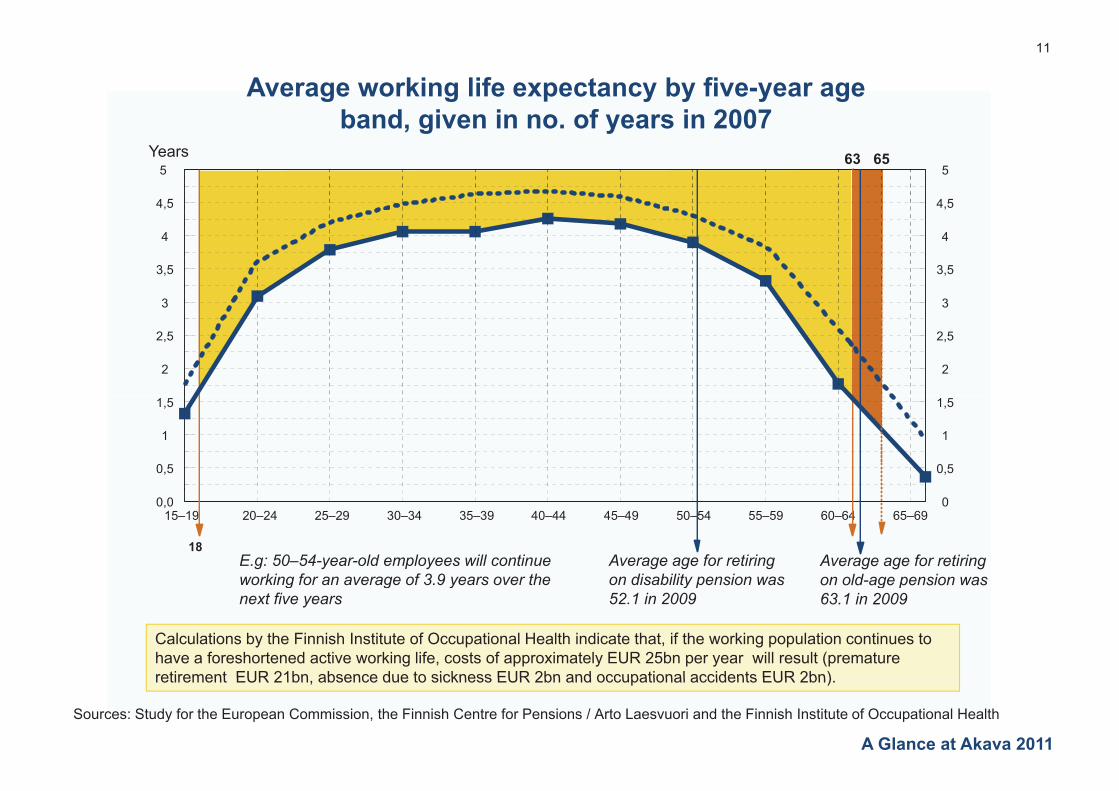
Average working life expectancy by five-year age b d i i f i 2007
4,5
5
4,5
563 65
band, given in no. of years in 2007Years
3
3,5
4
4,5
3
3,5
4
4,5
2
2,5
3
2
2,5
3
0,5
1
1,5
0,5
1
1,5
0,0 015–19 20–24 25–29 30–34 35–39 40–44 45–49 50–54 55–59 60–64 65–69
18E.g: 50–54-year-old employees will continue working for an average of 3.9 years over the
Average age for retiring on disability pension was
Average age for retiring on old-age pension was
Calculations by the Finnish Institute of Occupational Health indicate that, if the working population continues to have a foreshortened active working life, costs of approximately EUR 25bn per year will result (premature retirement EUR 21bn absence due to sickness EUR 2bn and occupational accidents EUR 2bn)
working for an average of 3.9 years over the next five years
on disability pension was 52.1 in 2009
on old age pension was 63.1 in 2009
A Glance at Akava 2011
Sources: Study for the European Commission, the Finnish Centre for Pensions / Arto Laesvuori and the Finnish Institute of Occupational Health
retirement EUR 21bn, absence due to sickness EUR 2bn and occupational accidents EUR 2bn).

Persons retiring in 2009 and 2010 with a pension based on their own
12
work history by pension benefit
59N l ld i
32
51
30
Normal old-age pension
Disability pension
5
4
14Unemployment pension
4
1
4
1
Early old-age pension
Special pension for farmers
2010; total 70,700 persons
2009; total 79,600 persons
• In 2009 for the first time more people retired on a normal old-age pension than on a disabilit or an nemplo ment pension
1
0 10 20 30 40 50 60
p p
%
a disability or an unemployment pension.• Average age of those retiring, years: 2009 2010
• Old-age pension 63.4 63.5• Unemployment pension 60.3 60.9• Disability pension 52.1 52.0
A Glance at Akava 2011Source: Statistics of Finnish Centre of Pensions
Disability pension 52.1 52.0• All 59.5 59.6

Persons retiring on disability pension in 2000 and 2010,
13
2010 2000
by main diagnosisShare
2010, %
7,781
7,078Diseases of the musculoskeletal system 34 %
6,589
6,571Mental disorders 29 %
1,739
6 789
2,463Diseases ot the circulatory system 7 %
6,789
6,727
0 2000 4000 6000 8000 10000
Other diseases
persons
30 %
persons
Both in 2000 and in 2010 approx. 23,000 persons retired on a disability pension. In 2010 almost one in three of these was due to a mental disorder.
A Glance at Akava 2011
Disability pensions based on person’s own work historySource: Statistics of Finnish Centre of Pensions

Average intended age of retirement of Akava members
14
g g
61.21997*
61.32001*
62.02004*
62.82008**
2010*** 63.2
58 59 60 61 62 63 64
2010***
Years
Three in four persons think they will stay in working life at least until the age of 63.The employee pension scheme reform of 2005 has achieved the desired results.
A Glance at Akava 2011
Sources: *) Akava Member Opinion Polls **) Statistics Finland, Quality of Work life Survey ***) Survey by TNS Finland commissioned by Akava, autumn 2010

Factors enabling Akava members to remain longer in working life
15
g g g
80 16 4Job certainty
Important Not very important Meaningless
Job certainty
69
62
61
27
30
32
4
7
7
Reduction in pace of work
Improvement of leadership skills
Improvementof working environment
Reduction in pace of work
Improvement of leadership skills
Improvement of working environment 61
59
49
32
31
41
7
10
10
Improvement of working environment
More flexible working hours
Improvement of occupational health care services
Improvement of working environment
More flexible working hours
Improvement of occupational health care services
48
47
47
36
40
47
16
13
7
Job alternation or sabbatical leave
Part-time pension
Reduction of work load
Job alternation or sabbatical leave
Part-time pension
Reduction of work load
45
41
38
46
49
47
9
9
15
Rise in salary
Improvement of rehabilitation possibilities
Increased education & training possibilities
Rise in pay
Improvement of rehabilitation possibilities
I d d ti & t i i ibiliti 38
35
47
52
15
12
0 10 20 30 40 50 60 70 80 90 100
Increased education & training possibilities
Change in work assignments
%
Increased education & training possibilities
Change in work assignments
A Glance at Akava 2011
Total number of respondents: 1,094Source: survey by TNS Finland commissioned by Akava, autumn 2009
Wellbeing at work
16
Akava members work long hours and do more overtime than other salary earners, and often without compensation. Regular long working hours cause stress among employees and therefore have an impact on their health and wellbeing.
The risk of burnout is higher among the highly educated than among other salary earner gro ps Mental stress can occ r e g hen ork is demanding and has a high le el ofgroups. Mental stress can occur e.g. when work is demanding and has a high level of responsibility, when working hours are long, and when there is a lack of support from a superior.
Wellbeing at work is also adversely affected by the presence of violence harassment or other Wellbeing at work is also adversely affected by the presence of violence, harassment or other inappropriate behaviour or treatment in the workplace.
The right balance must be made between work and the level of human resources.
Working hours monitoring and time sheets must keep track of the actual number of hours worked, whether at the workplace, remotely or during business trips.
Training and orientation for managers and supervisors must include more health and safety d th l b t ti i th i tl thand other labour protection issues than is currently the case.
A Glance at Akava 2011

Risk of burnout or mental health disorder
17
All WomenMenSerious burnout
57
50
63
56
Upper-level employees
Lower-level employees
50
42
56
46
Upper-level employees
Lower-level employees
53
47
59
54
Upper-level employees
Lower-level employees
19972008
19972008
19972008
49
56
53Manual workers42
46
40Manual workers
44
54
44Manual workers
3037
Upper-level employees2327
Upper-level employees26
32Upper-level employees
Mental health disorder
24
19
31Lower-level employees
Manual workers
23
18
25Lower-level employees
Manual workers
24
18
30Lower-level employees
Manual workers29
0 20 40 60 80
Manual workers%17
0 20 40 60 80
Manual workers%20
0 20 40 60 80
Manual workers%
A Glance at Akava 2011
Refers to those who experience obvious risk or think about it sometimes; wage and salary earners working full timeSource: Statistics Finland, Quality of Work Life Surveys

Overtime work in 2009
18
7 14 1
Without compensation With compensation Both
Akava members
Overtime hours/ week
7.87
9
5
14
14
14
1
1
2
Men
Women
Akava members8.5
6.8
9
5
16
9
2
2
Private
State
Employer8.0
7.4
4
3
12
14
0
1
Municipality
All wage and salary earners
7.1
7.3
7
1
15
14
1
0
Upper-level employees
Lower-level employees
Socio-economic groups
7.8
5 71
0
14
14
0
0
0 5 10 15 20 25 30
Lower level employees
Manual workers
%
5.7
8.2
A Glance at Akava 2011
Wage and salary earners working full time; overtime compensation in money or free timeSource: Statistics Finland, Labour Force Statistics 2009

Persons who worked at least 48 hours/week, 2009
19
Estimated number of
11All d l
persons who worked at least 48
hours/week, 1,000 persons
10611
12
15
All wage and salary earners
AllMen
106
23
15
Akava members:
15
9
15
MenWomen
Private
15
7
16
Employer:15
11
7
PrivateState
Municipality
16
2
4
Position in organisation:22
11
9
Legislators, senior officials and managersProfessionals
Technicians and associate professionals
10
7
2
Position in organisation:
7
6
0 5 10 15 20
pOthers
Teaching professionals
%
1
3
A Glance at Akava 2011
Wage and salary earners in full-time workSource: Statistics Finland, Labour Force Statistics 2009

Salaries
20
A person’s salary must appropriately reflect the job’s educational requirement and responsibilities and the results achieved.
Differences in pay between men and women in the same or comparable jobs must be eliminated.
Women’s career progression must be accelerated.
In female-dominated fields where women are underpaid in relation to level of education and job responsibilities this shortfall in pay must be redressed.
The purchasing power of highly educated people must be on the same level as other developed countries. In addition to salaries, purchasing power is also affected by taxation and the price level.
In overall terms, salary trends must support the purchasing power and employment of salary earners.
Earnings-related unemployment or sickness allowances should be defined in the same way g p y yas they are when the payments are collected, i.e. the kinks in defining the allowances should be ironed out.
A Glance at Akava 2011

21
Total earnings in 2009g
Akava membersAll wage and salary earners in Finland
mean, euros/month mean, euros/monthEmployer sector:State (incl. universities)* 3,930 3,330Municipalities 3,600 2,730Private enterprises 4 230 3 100Private enterprises 4,230 3,100Men 4,430 3,360Women 3,510 2,690
All 3,960 3,020
Distribution of total earnings(without bonuses)
All 3,960 3,020
Akava members F102,380
F905,800
1400 1900 2400 2900 3400 3900 4400 4900 5400 5900
All wage and salaryearners in Finland
F101,900
F904,410
A Glance at Akava 2011
Wage and salary earners working full time; total earnings in table include bonuses*) From the beginning of 2010 the university sector is included in the private sector (private enterprises)Source: Statistics Finland, Structure of Earnings, 2009
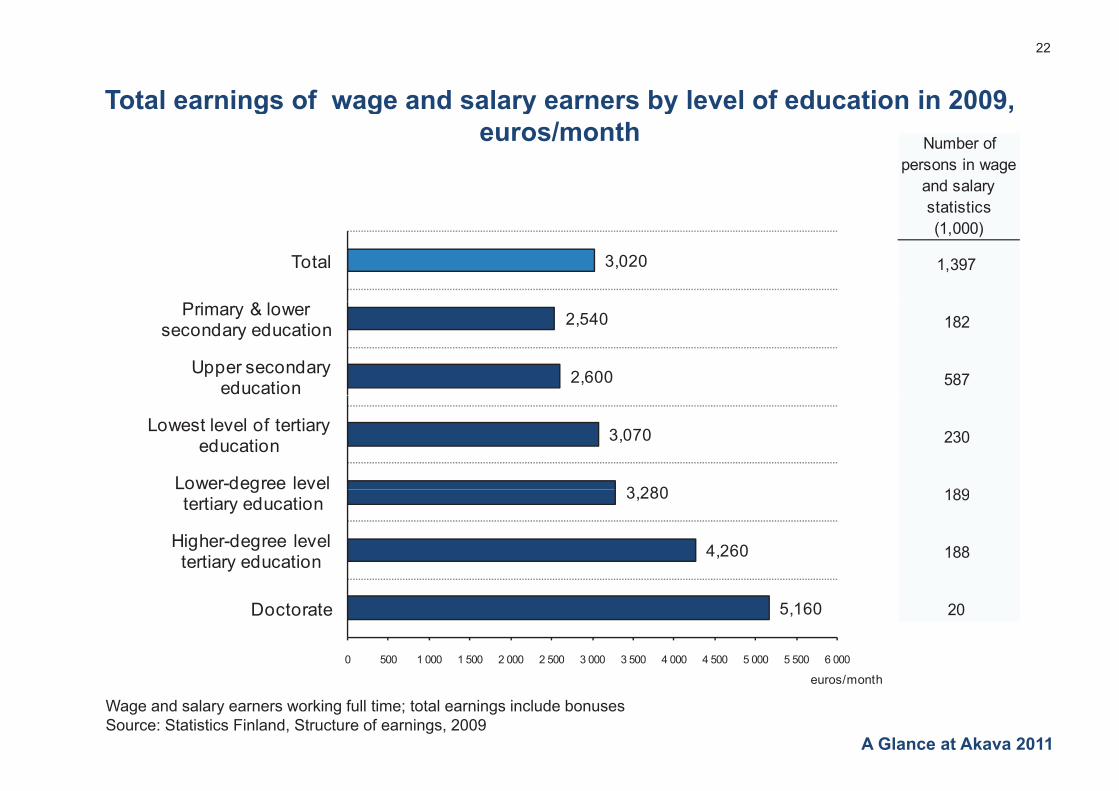
Total earnings of wage and salary earners by level of education in 2009,
22
g g y y ,euros/month Number of
persons in wage and salary statistics
3,020Total
statistics (1,000)
1,397
2,540
2,600
Primary & lower secondary education
Upper secondary education
182
587
3,070
3 280
Lowest level of tertiary education
Lower-degree level
230
1893,280
4,260
gtertiary education
Higher-degree level tertiary education
189
188
5,160
0 500 1 000 1 500 2 000 2 500 3 000 3 500 4 000 4 500 5 000 5 500 6 000
Doctorate
euros/month
20
A Glance at Akava 2011
Wage and salary earners working full time; total earnings include bonusesSource: Statistics Finland, Structure of earnings, 2009
euros/month

Gross earnings per year in private sector 2010
23
g p y pWestern Europe = 100
Clerical/Technicians 1)
152Switzerland
Middle management and professionals2)
170129
123120
SwitzerlandDenmark
LuxembourgNorway
152122119
112106
SwitzerlandLuxembourg
GermanyDenmark
N119107105
100
GermanyBelgium
AustriaWestern Europe
106103103100
NorwayAustria
BelgiumWestern Europe
N th l d97928986
NetherlandsFinlandIreland
Sweden
9897
9388
NetherlandsIreland
ItalyFrance
80767574
FranceItaly
SpainUnited Kingdom
87858483
United KingdomFinland
SpainSweden
57
0 50 100 150 200
Portugal
Western Europe = 100
68
0 50 100 150 200
Portugal
Western Europe = 100
A Glance at Akava 2011
1) Comparable to Finnish employees with salaries of approx. 2,900 euros/month; Grade 8 = Graduate/Administrator in Global job value framework of Watson Wyatt2) Comparable to Finnish employees with salaries of approx. 5,300 euros/month. Grade 14 = Middle Managers Source: 2010/2011 WWDS Global 50 Remuneration Planning Report
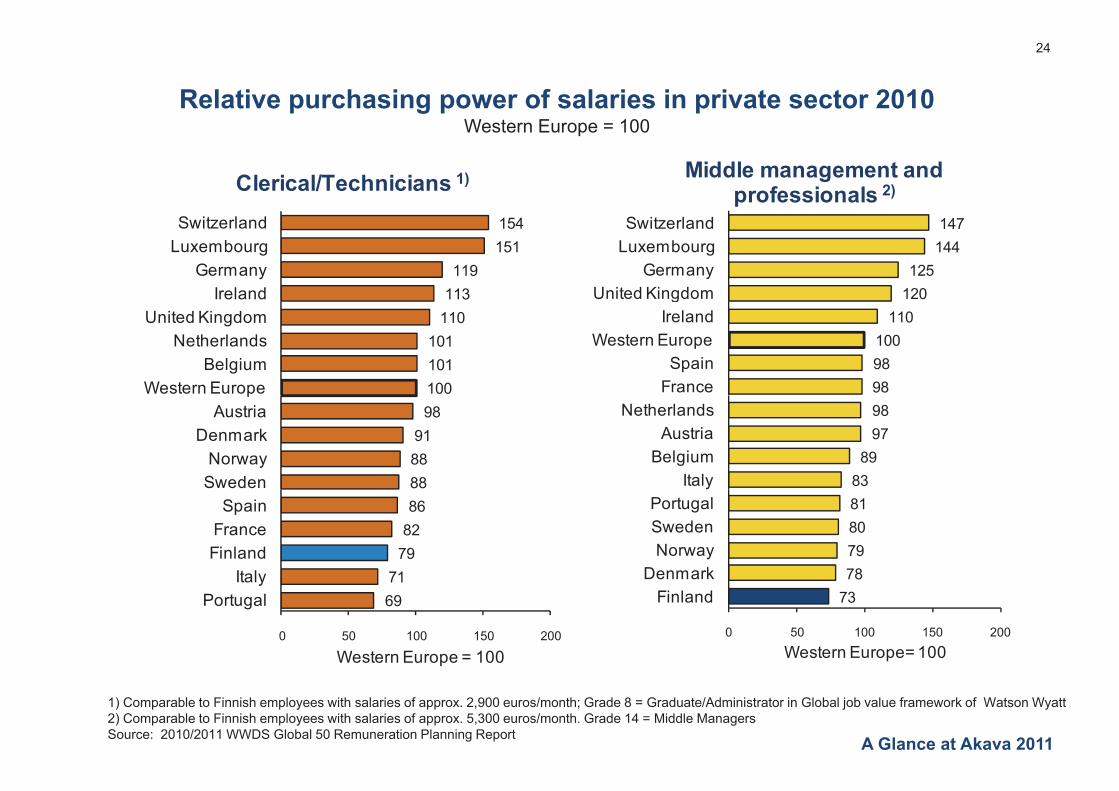
Relative purchasing power of salaries in private sector 2010
24
p g p pWestern Europe = 100
Clerical/Technicians 1) Middle management and professionals 2)
154151
119113
SwitzerlandLuxembourg
GermanyIreland
147144
125120
SwitzerlandLuxembourg
GermanyUnited Kingdom
110101101100
United KingdomNetherlands
BelgiumWestern Europe
1101009898
gIreland
Western EuropeSpain
France98
918888
pAustria
DenmarkNorway
Sweden
9897
8983
NetherlandsAustria
BelgiumItaly
8682
7971
SpainFranceFinland
Italy
81807978
PortugalSwedenNorway
Denmark69
0 50 100 150 200
yPortugal
Western Europe = 100
73
0 50 100 150 200
Finland
Western Europe= 100
A Glance at Akava 2011
1) Comparable to Finnish employees with salaries of approx. 2,900 euros/month; Grade 8 = Graduate/Administrator in Global job value framework of Watson Wyatt2) Comparable to Finnish employees with salaries of approx. 5,300 euros/month. Grade 14 = Middle Managers Source: 2010/2011 WWDS Global 50 Remuneration Planning Report

Taxation of salary earners
25
Employees’ taxation must not be increased at any salary level. Taxes on wages should be reduced where possible, with the aim of achieving the EU 15 level in all income groups. The highest tax rate must be limited to 50%.
In the future, economic growth will be almost entirely dependent on productivity.
The driver for development in productivity is currently competence.
The results of work achieved through competence should receive sufficient rewards.
A large percentage of the increase in the profitability and productivity of work currently A large percentage of the increase in the profitability and productivity of work currently goes into taxes.
A Glance at Akava 2011

26
Pay and taxes: Akava members and other wage and salary earnersy g y
Akava members Other wage and salary earners
18 82Wage and salary earners (1,8 million)
W d l i bill (62 5 billi )
g y
25
30
75
70
Wages and salaries bill (62,5 billion euros)
Taxes and payments (16,2 billion euros)
39 61
By type of tax:
State income taxes (4,7 billion euros)
27
25
73
75
Municipal tax (9,6 billion euros)
Pension and unemployment insurance contributions (2,9 billion euros)
0 10 20 30 40 50 60 70 80 90 100 %
A Glance at Akava 2011
Employees who have worked at least 6 months full time with income over 11,765 euros per yearSource: Statistics Finland, Income Distribution Statistics 2008
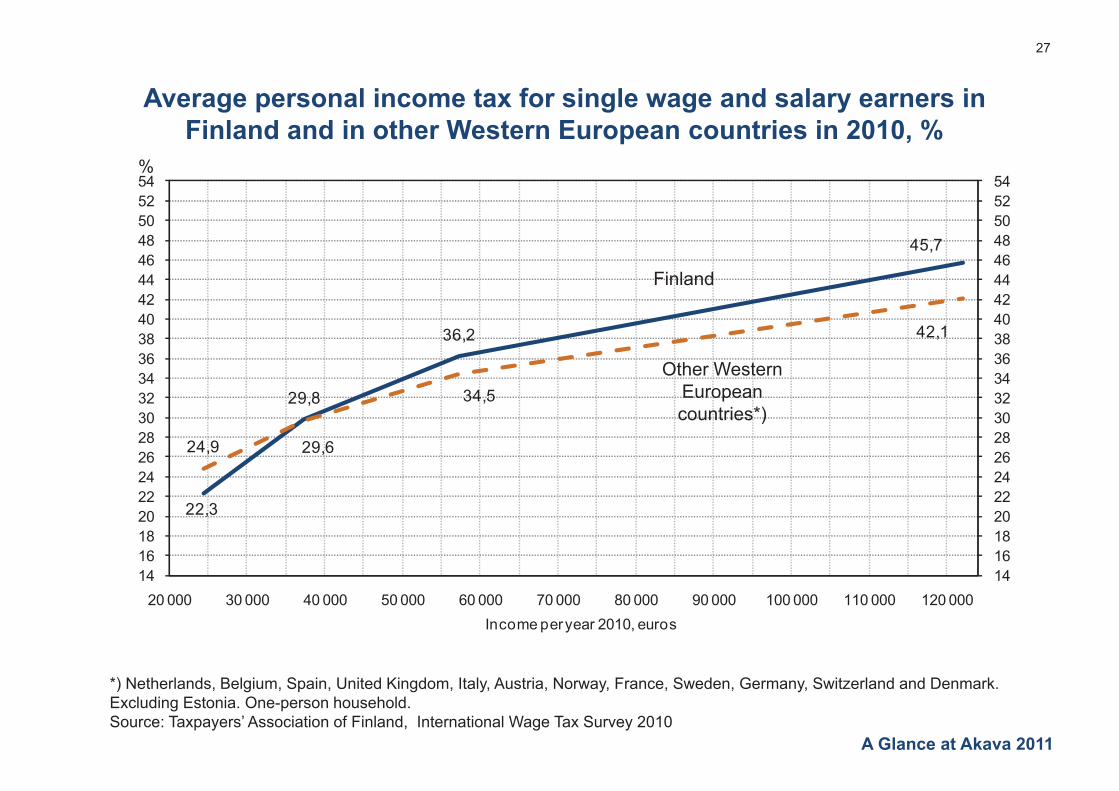
Average personal income tax for single wage and salary earners in
27
5254
5254%
Finland and in other Western European countries in 2010, %
45,7
4244464850
4244464850
Finland
29 8
36,2
34 5
42,1
323436384042
323436384042
Other WesternEuropean29,8
24,9 29,6
34,5
2426283032
2426283032 European
countries*)
22,3
1416182022
1416182022
20 000 30 000 40 000 50 000 60 000 70 000 80 000 90 000 100 000 110 000 120 000Income per year 2010, euros
*) N th l d B l i S i U it d Ki d It l A t i N F S d G S it l d d D k
A Glance at Akava 2011
*) Netherlands, Belgium, Spain, United Kingdom, Italy, Austria, Norway, France, Sweden, Germany, Switzerland and Denmark. Excluding Estonia. One-person household.Source: Taxpayers’ Association of Finland, International Wage Tax Survey 2010

Average personal income tax rate in 2010 for income
28
of 4,580 euros/month
46,6Belgium
42,3
40,1
38,2
Germany
Italy
Austria
37,7
36,2
35,9
Denmark
Finland
Holland ,
34,9
33,7
29,4
Sweden
France
Spain 29,4
29,0
28,6
27 5
Spain
Norway
USA
United Kingdom 27,5
23,1
0 5 10 15 20 25 30 35 40 45 50
United Kingdom
Estonia%
A Glance at Akava 2011
One-person household with income of 57,300 euros per yearSource: Taxpayers’ Association of Finland, International Wage Tax Survey 2010

Education
29
Higher education funding should be based on quality.
One criteria in the assessment of productivity should be quality of employment One criteria in the assessment of productivity should be quality of employment.
The employment perspective must extend to all education.
The competence targets in academic degrees should include working life skills, working ability d i t kand coping at work.
In anticipating education, we must move away from rigidly anticipating number of degrees to anticipating competence needs and the flexibility of degree contents.
Less money is spent on education in Finland per student than in the OECD countries on average, and as a result the ratio of students to teachers in institutes of higher education is too high.
Research shows that the period after graduation affects a person's career path long into the future.
Persons who became unemployed upon graduation during the recession of the 1990s ti t h l t t th th i i th b k tcontinue to have poorer employment prospects than their peers in the same age bracket
and younger people.
It is therefore important that people find jobs that match their educational level soon after graduation
A Glance at Akava 2011
graduation.

Population by level of education, 1975–2017
30
p y
100% Tertiary education *** Secondary education ** Primary education *
20
11 15 21 23 25 273580
90
100
3034 36 38 3950
60
70
6955
45 41 37
46
20
30
40
41 37 3419
0
10
20
1975 1985 1995 2000 2005 2009 Estimation 2017
Population aged 15 and older*) No educational qualification beyond compulsory education
1975 1985 1995 2000 2005 2009 Estimation 2017
A Glance at Akava 2011
) o educa o a qua ca o beyo d co pu so y educa o**) Matriculation examination or lowest level tertiary education qualification***) Lower or higher degree in tertiary educationSource: Statistics Finland, Educational Institutions

Akava members and total labour force in 2009
31
by educational level, %
Doctorate 7
50
1Doctorate
Highest level academic degrees of licentiate anddoctorate (scientific post-graduate degrees)
Higher-degree level tertiary educationM i l hi h i it d ( t ’ l l)
24
12
11 Akava membersLower-degree level tertiary education
Mainly polytechnic degrees and lower university degrees
Mainly higher university degrees (master’s level),specialist’s degrees in medicine, graduate engineers
11
11
18
Akava members
Total labour forceLowest level tertiary education
Vocational college education. Examples of vocational collegequalifications include Technician Engineer, Diploma in Business
and Administration and Diploma in Nursing
6
2
43Upper secondary education
Gives general eligibility for tertiary education
215
0 20 40 60
Primary & lower secondary education
A Glance at Akava 2011
0 20 40 60Source: Statistics Finland, Labour Force Statistics 2009
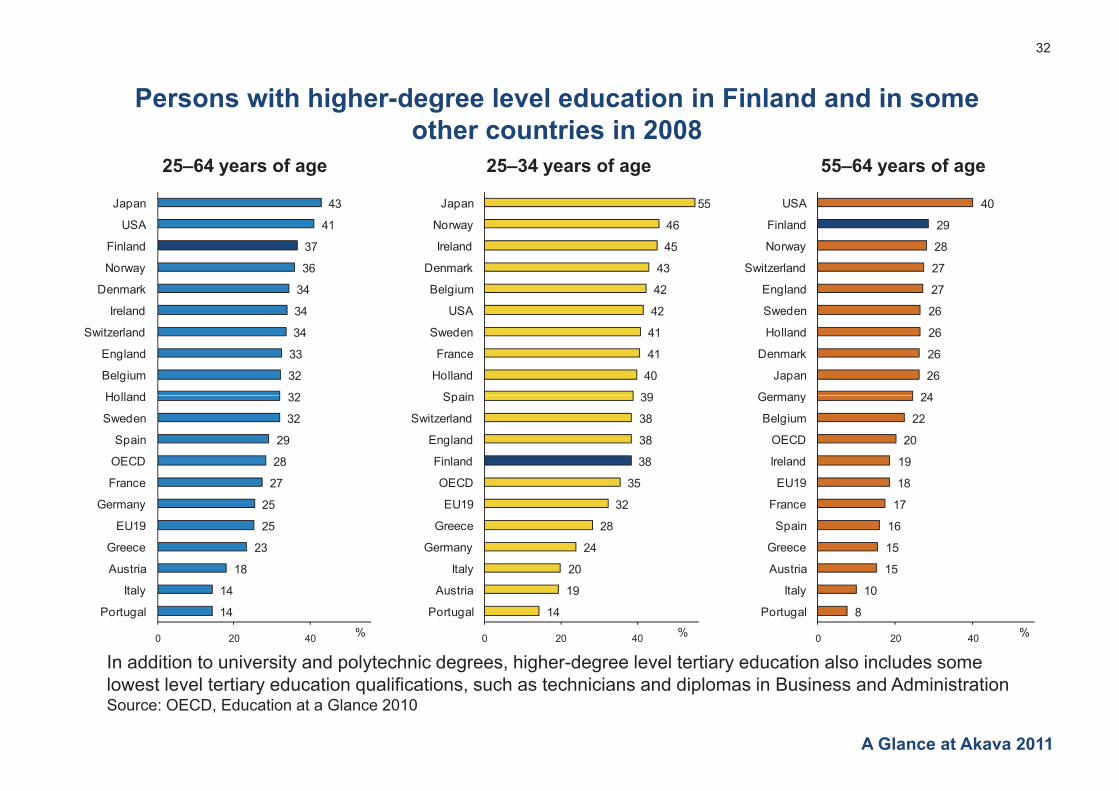
Persons with higher-degree level education in Finland and in some
32
other countries in 2008
43Japan 55Japan 40USA
25–64 years of age 25–34 years of age 55–64 years of age
43
41
37
36
34
Japan
USA
Finland
Norway
Denmark
55
46
45
43
42
Japan
Norway
Ireland
Denmark
Belgium
40
29
28
27
27
USA
Finland
Norway
Switzerland
England
34
34
33
32
32
Ireland
Switzerland
England
Belgium
Holland
42
41
41
40
39
USA
Sweden
France
Holland
Spain
26
26
26
26
24
Sweden
Holland
Denmark
Japan
Germany32
32
29
28
27
Holland
Sweden
Spain
OECD
France
39
38
38
38
35
Spain
Switzerland
England
Finland
OECD
24
22
20
19
18
Germany
Belgium
OECD
Ireland
EU19
25
25
23
18
Germany
EU19
Greece
Austria
32
28
24
20
EU19
Greece
Germany
Italy
17
16
15
15
France
Spain
Greece
Austria
In addition to university and polytechnic degrees, higher-degree level tertiary education also includes somel t l l t ti d ti lifi ti h t h i i d di l i B i d Ad i i t ti
14
14
0 20 40
Italy
Portugal
%
19
14
0 20 40
Austria
Portugal
%
10
8
0 20 40
Italy
Portugal
%
A Glance at Akava 2011
lowest level tertiary education qualifications, such as technicians and diplomas in Business and AdministrationSource: OECD, Education at a Glance 2010

Education costs per student in Finland and in OECD countries, 2007
33
p
4,7905,450Pre-primary education Finland
OECD countries
6,230
7,830
6,740Primary & lower secondary
education
U d d ti 7,830
13,570
8,270
12 910
Upper secondary education
Tertiary education
12,910
12,910
8,970
y
Tertiary education
incl. research & development
excl research & development
0 2000 4000 6000 8000 10000 12000 14000 USD
excl. research & development
A Glance at Akava 2011
Figures are purchasing power adjustedSource: OECD Education at a Glance 2010

Entrepreneurship
34
Akava membership includes about 25,000 self-employed persons and entrepreneurs. Akava is one of Finland’s largest entrepreneurial organisations.
62 per cent of these persons are full-time and 38 per cent part-time.
More than half operate in the field of social services and health. p
The highly educated make up a large percentage of the group of entrepreneurs who are planning to increase the size of their business in the next few years.
Academically educated people have great entrepreneurial potential Academically educated people have great entrepreneurial potential.
Akava aims to increase entrepreneurial training at all educational levels.
The key challenge faced by highly educated entrepreneurs is to secure the same social security benefits as salary earners.
A Glance at Akava 2011

Akava’s entrepreneurial/self-employed members, 2010
35
p p y
Agriculture, forestry and environment4 %Social services and 4 %Social services and
health care9 %
Technology andnatural sciences
16 %16 %
Medical doctors in all
Social sciences
Medical doctors in allspecialisations45 %
Social sciences26 %
Among Akava’s membership there are approx. 25,000 full- or part-time entrepreneurs and self-employed persons.
A Glance at Akava 2011
Source: Akava’s affiliates

Entrepreneurs and self-employed persons by level of education
36
in Finland, 1997 and 2008
% 1997 2008
4244
40
45
50
32
2425
30
35
2022
24
1015
20
25
710
0
5
10
Primary & lower secondary education
Upper secondary education
Lower-degree level tertiary education
Higher-degree level tertiary education
A Glance at Akava 2011
Primary production excludedSource: Statistics Finland, Labour Force Statistics; Ministry of Employment and the Economy, The Entrepreneurship Review 2010

Organisation
37
The Akava confederation is strong, with a uniform purpose and impact.
Akava promotes the success and security of its members.
Members receive quality representation throughout their membership period.
O i i th t 80 t f ll th t ti l b i ffili t ill j i Ak Our aim is that 80 per cent of all the potential members in our affiliates will join Akava.
Akava membership is continuously growing. New affiliate unions and individuals are joining all the time.
Akava members work in demanding professions that significantly contribute to Finland’s success.
Students play an important role in the Akava community.
A Glance at Akava 2011

38
Number of Akava members
600600
1,000 members
523
500
375
300
400
162
265
200
300
42100
01970 1980 1990 2000 2011 Aim 2015
A Glance at Akava 2011
Source: Akava’s affiliates
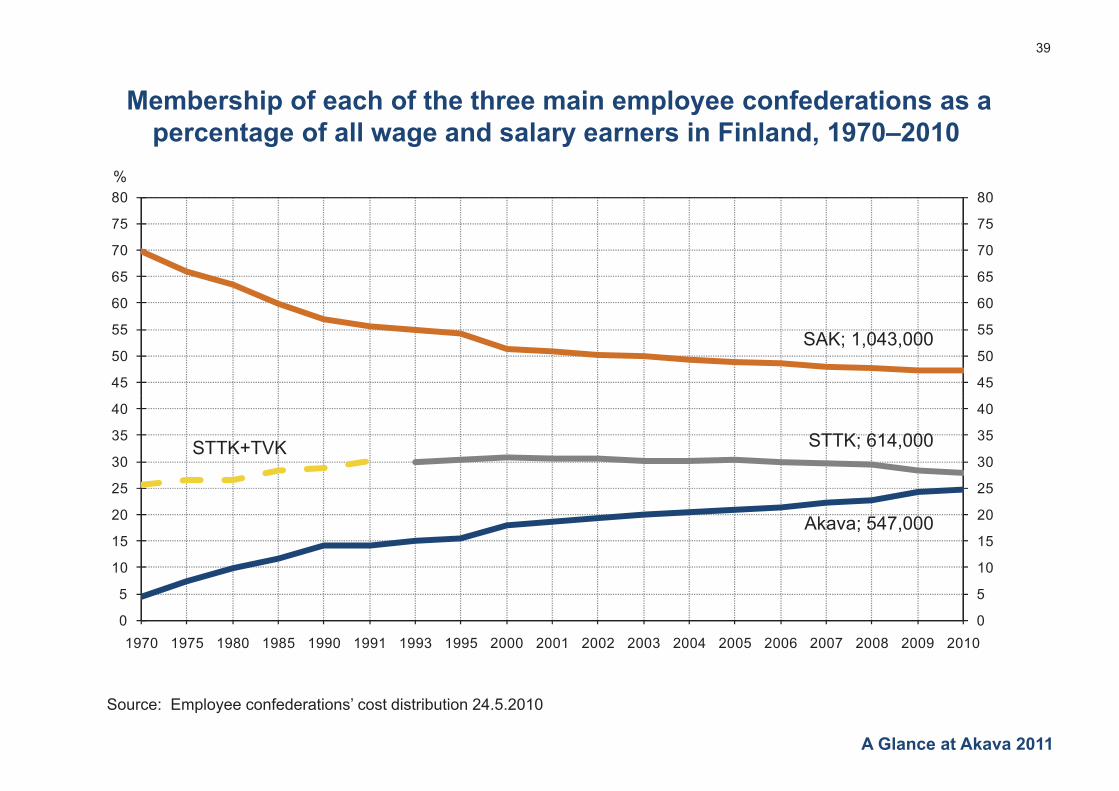
39
Membership of each of the three main employee confederations as ap p ypercentage of all wage and salary earners in Finland, 1970–2010
8080%
60
65
70
75
60
65
70
75
45
50
55
60
45
50
55
60
SAK; 1,043,000
25
30
35
40
25
30
35
40
STTK; 614,000STTK+TVK
10
15
20
25
10
15
20
25
Akava; 547,000
0
5
0
5
1970 1975 1980 1985 1990 1991 1993 1995 2000 2001 2002 2003 2004 2005 2006 2007 2008 2009 2010
A Glance at Akava 2011
Source: Employee confederations’ cost distribution 24.5.2010

40
Number of student members in Akava
101,950100 000
110 000
91,200
80 000
90 000
100 000
64,100
60 000
70 000
49,000
40 000
50 000
20 000
30 000
0
10 000
1996 2000 2005 2011
A Glance at Akava 2011
Source: Akava’s affiliates

41
Reasons for membership in an Akava member organisation, %g
Of some significance Very important
17
28
73
61
Pay related benefits in case of unemployment
Security in pay and employment conditions
36
39
49
34
Membership provides general security
Well-educated should stick together 39
51
34
21
Well educated should stick together
Services and allowances for members
34
42
30
20
At present it is customary to be a member
Professional development
34 11
0 10 20 30 40 50 60 70 80 90 100
Professional activities in the organisation%
A Glance at Akava 2011
Source: Akava Member Opinion Poll 2011

Akava’s organisation for negotiations
42
Akava Employersand governmentCentral organisation
agreements
Akava’s Public SectorNegotiation Commission
JUKO
g
Office for Government as EmployerCommission for Local Authority
Employers
gTripartite agreements
Coordination
CollectiveAgreementsJUKO
The Delegation of Professionaland Managerial Employees
EmployersChurch
Confederation of Finnish Industries
Agreements(public sector)
Collectiveand Managerial EmployeesYTN EK and its affiliates
CollectiveAgreements
Employees in Technical and Commission for LocalC ll ti
Organisations’ collective E l i ti
Employees in Technical andBasic Service Professions KTN
Commission for LocalAuthority EmployersCollective
Agreements(public sector)
Organisations collectiveagreements
Entrepreneurs and Parliament, Ministries,
Employer organisationsCollectiveAgreements
A Glance at Akava 2011
pself-employed persons
Parliament, Ministries, Local AuthoritiesInfluencing
legislation

Akava’s affiliates and number of members 1.1.2011
43
Trade Union of Education in Finland 119 564 Finnish Psychological Association 6 105
The Finnish Association of Graduate Engineers TEK 73 438 Finnish Association of Academic Agronomists 5 933
Union of Professional Engineers in Finland UIL 61 810 The Officers Union 5 838SEFE - The Finnish Association of Business School Graduates 47 200 The Union of Church Professionals within Akava AKI 5 686
Finnish Business Polytechnic Graduates Association 26 394The Institute Officers Union of the Finnish Defence Forces and the Border Guard 4 566Finnish Business Polytechnic Graduates Association 26 394 Forces and the Border Guard 4 566
Sales and Marketing Professionals SMKJ 26 202 Finnish Union of Environmental Professionals 4 531
Akava Special Branches 25 761 Union of Swedish-speaking Engineers in Finland 3 220
Finnish Medical Association 23 154 The Finnish Association of Architects 2 692Finnish Medical Association 23 154 The Finnish Association of Architects 2 692
Union of Professional Social Workers 21 657 Society of Finnish Professional Foresters 2 621
Association of Finnish Lawyers 15 423 Union of Finnish University Professors 2 306
Finnish Association of Political Scientists 10 843 Finnish Veterinary Association 2 251y
Union of Technical Professionals, KTK 9 929 The Union of Diaconal Workers in Finland 1 905
Finnish Pharmacists' Association 8 524 The Finnish Association of Occupational Health Nurses 1 882Managers and Specialists in the Private Sector YTY & Professional Coaches of Finland 8 271 Union of Finnish Speech Therapists 1 332Professional Coaches of Finland 8 271 Union of Finnish Speech Therapists 1 332
Finnish Union of Experts in Science 7 397 Kirkon Nuorisotyöntekijöiden Liitto KNT 1 030
Finnish Union of University Researchers and Teachers 6 755 Health Science Academic Leaders and Experts 1 024Finnish Dental Association 6 732 AKAVA's General Group 837
A Glance at Akava 2011
Total 552 813

Statistical information on Akava members
44
Number of Akava members 1.1.2011 552 813 Proportion of women 51 %
Main occupation: Average age 42 years
Full-time work 87 % Age distribution 1.1.2011:
Part-time work 6 % under 30 10 %
Unemployed 3 % 30–39 28 %
Entrepreneur 3 % 40–49 28 %
Employer 1.1.2011: 50–59 24 %
Private enterprise 55 % over 60 10 %
Municipality 33 % Lower tertiary or a higher level qualification 81 %
State 7 % Living in Helsinki Metropolitan Area 32 %
Self-employed professionals 3 % Members in full-time work:
Ch h 2 % Fi d t k 12 %Church 2 % Fixed term work 12 %
Position in organisation: Average years in service in current employment 9
Professionals 34 % Average gross income 2010, euros/month 4 100
Teaching professionals 26 % Average working hours/week 40 7Teaching professionals 26 % Average working hours/week 40,7 Legislators, senior officials and managers 22 % Persons working overtime 22 %
Technical and associate professionals 13 % Persons working over 48 hours/week 12 %
A Glance at Akava 2011
Others 5 % Persons working overtime without compensation 38 %Sources: Statistics Finland, Labour force statistics; Akava's affiliates