GIS based tools for marine habitat determination and marine spatial planning
Upload
meity-mayaCategory
view
27download
1description

Landscape and Urban Planning 68 (2004) 77–94
A GIS site-selection process for habitat creation:estimating connectivity of habitat patches
Pantoula Nikolakaki∗Environmental Services, Oxfordshire County Council, Speedwell House, Speedwell Street, Oxford OX1 1NE, UK
Received 15 October 2002; received in revised form 23 June 2003; accepted 2 July 2003
Abstract
The paper presents a method that addresses the problem of site-selection for habitat creation involving spatial processes onthe landscape scale. It interprets landscape ecological principles, with focus on population dynamics, to specific informationrequired to support a particular decision at each stage of the process. The approach focuses on deciduous woodland withthe redstartPhoenicurous phoenicurousas an umbrella species for woodland birds and is illustrated within the fragmentedlandscape of the east midlands area of England. The method requires the use of a Geographic Information System (GIS) toestimate the connectivity of habitat patches. Each patch is assigned a “cost” value that represents the cost of dispersal over afriction surface. The sites are ranked accordingly and, in combination with the spatial context and size, are prioritised in termsof their potential for forming cores for habitat creation. Habitat patches with low cost values, a large area of surrounding habitatand small size were identified as potential sites for expansion in order to satisfy the minimum requirements of the species.The approach is generic, applicable to any species, and despite its limitations it can be a useful aid in conservation planning.© 2003 Elsevier B.V. All rights reserved.
Keywords:Birds; Conservation planning; Connectivity; GIS; Habitat fragmentation; Population dynamics
1. Introduction
Human activities such as agricultural development,commercial conifer afforestation and urbanisationhave led to habitat fragmentation, namely loss ofthe original habitat, reduction in habitat patch sizeand increasing isolation of habitat patches (Andrén,1994). These processes result in heterogeneous land-scapes, which are composed of more or less isolated,smaller patches of suitable habitat within a matrix ofless suitable habitat for reproduction or for providingfood and shelter for species confined to the original
∗ Present address: 9 Beauchamp Place, Cowley, Oxford OX43NE, UK. Tel.: +44-1865-773262.E-mail address:[email protected] (P. Nikolakaki).
habitat. The process of landscape change as a result ofhabitat fragmentation has far-reaching consequencesfor species survival. In particular, for area-sensitivespecies, the patches of suitable habitat may be toosmall to support a breeding pair or a functional so-cial group (Lambeck, 1997), whereas species withlow dispersal capacity are unable to recolonize thehabitat patches following the extinction of their localpopulations (Collinge, 1996).
Empirical evidence suggests that the populationdynamics for a wide range of organisms living infragmented landscapes, and particularly for smallmammals, invertebrates and birds, follow a pattern ofstochastic local extinctions and recolonisations, thusoccurring as metapopulations (Opdam et al., 1985;Opdam, 1991; Hanski, 1994). Landscape ecology
0169-2046/$20.00 © 2003 Elsevier B.V. All rights reserved.doi:10.1016/S0169-2046(03)00167-1
78 P. Nikolakaki / Landscape and Urban Planning 68 (2004) 77–94
provides the context for studying the effects of themodified landscape pattern on species’ populationdynamics and hence the distribution and survival oforganisms. It considers the crucial role that movementplays in the dynamics of many populations and theimportance of habitat connectivity as a determinantof conservation value. The degree to which local pop-ulations are functionally connected (connectivity) hasan influence on the persistence of the metapopulation(Fahrig and Merriam, 1985).
Forest fragmentation is regarded as one of the mostserious threats to birds today (Willson et al., 1994).The majority of the investigations on specialisedwoodland birds show lower frequency of occurrencein the smallest and most isolated woods. This paperpresents a methodological spatial approach based ona Geographic Information System (GIS) that (1) iden-tifies the optimal habitat patches that have a greaterprobability of occupancy and (2) identifies the most
Fig. 1. The Sherwood Forest study area within the boundaries of the County of Nottinghamshire.
effective sites for woodland creation, by selectingthe least isolated patches with a greater probabilityof colonisation. Within this context, the method usesthe dispersal model COST and estimates the degreeof isolation or inversely the degree of connectivity ofhabitat patches in the landscape. Sites that are locatedin a high-connectivity landscape are most suited forspecies occupation and therefore are given prioritystatus for habitat creation. The method interprets land-scape ecological principles, with focus on populationdynamics, to specific information required to supporta particular decision at each stage of the process. Thespatial requirements of a locally threatened woodlandbird formed the criteria that informed the procedure.The approach can be an effective tool in conservationplanning aimed at enhancing habitat for area-sensitivewoodland birds.
There has so far been a plethora of advice for newplanting at the level of the individual site (Forestry

P. Nikolakaki / Landscape and Urban Planning 68 (2004) 77–94 79
Authority, 1994). Little or no account has been taken,in woodland planting schemes in England (e.g. FarmWoodland Premium Scheme), of the wider landscapeand spatial parameters such as patch size, differing dis-persal distances of species and habitat density in theneighbourhood. This approach employs a large-scaleview where habitat patches are not regarded as inde-pendent and individual sites, but rather as units con-nected functionally by spatial processes in a landscape.Site-based physical factors as well as socio-economicconstraints were not involved within the remit of thiswork.
The methodology is discussed using the SherwoodForest area in England as a case study (Fig. 1).The study area is 101,227 km2 and much of its na-tive oak-birch woodland is on Sherwood sandstoneand acidic sandy soils. Intensification of agriculture,large-scale conifer planting and urban growth havecaused fragmentation of the ancient and semi-naturalwoodland, reducing its total area to 8.7% and leav-ing 45.5% of the study area entirely as arable land.Although the approach refers to a chosen landscapeand to the group of woodland birds, it has generalapplicability and is flexible. Furthermore, it does notfocus on the creation of new patches, but on targetingexisting, potential woodland sites for expansion con-verting arable cropping to deciduous woodland. Thiswould give greater opportunities for local speciesto disperse into the new woodland and for existingpopulations to increase.
2. Aspects of population dynamics infragmented landscapes
The study is largely based on an extensive literaturereview of theoretical and empirical landscape eco-logical studies, which examined the impact of patchsize, habitat quality and isolation on the survival offragmented populations, and of woodland birds inparticular. The results of these studies guided decisionmaking during the process of site-selection.
Decreasing rate of recolonization with increasingisolation and decreasing rate of extinction with in-creasing patch area are very robust findings applying tothe population dynamics of the vast majority of speciesin fragmented landscapes (Hanski, 1994). With respectto avian populations, it is acknowledged from the
literature that the assemblages of woodland birds andthe dynamics of local populations of many bird speciesin these woodland fragments are affected by the size ofthe fragments and their degree of isolation or their de-gree of connectivity. The two latter attributes are oftendemonstrated as the distance to other woodland frag-ments or as their spatial configuration (e.g. the num-ber of corridors and/or the amount of habitat around apatch) (Komdeur and Gabrielsen, 1995; Bellamy et al.,1996a). In particular, the probability of occurrence ofmany woodland birds is shown to be positively corre-lated with the distance to an extensive woodland areaand with the area of the surrounding suitable habi-tat, often measured within a 2 or 3 kmradius of theboundaries of a woodland patch (Opdam et al., 1985;Harms and Opdam, 1990; Hinsley et al., 1994a,b).Immigration from the surrounding landscape mayalso benefit local populations by reducing the risk ofextinction, known as the “rescue effect” (Brown andKodric-Brown, 1977; Bellamy et al., 1996b).
Moreover, the number of breeding pairs and wood-land area are strongly correlated, and the probabilityof extinction shows a strong negative relationshipwith both for most woodland interior birds (Verboomet al., 1991; Bellamy et al., 1996b). In particular,the chance of a local population becoming extinctincreases rapidly below a population size of about3–5 breeding pairs (Bellamy et al., 1996b). The oc-currence of most woodland birds is dependent upona minimal area of critical habitat available in order tosatisfy foraging needs and territory size requirements(Moore and Hooper, 1975; Lynch and Whigham,1984; Opdam et al., 1985). It has been suggestedthat lack of resources and increased level of preda-tion in small patches may cause high mortality ofwoodland specialists, whereas poor breeding successwould further result in high extinction rates (Sparkset al., 1994). In particular, it is shown that for manyarea-sensitive woodland species the probability ofbreeding is strongly positively related to woodlandarea, approaching 100% when 10 ha or more (Hinsleyet al., 1994a,b). McIntyre (1995) also found thatthere is a threshold of 10 ha, above which inte-rior species are present and avian diversity is highand indistinguishable from that in larger contiguouswoodland.
Large habitat patches support large populationsthat have a very low probability of extinction and

80 P. Nikolakaki / Landscape and Urban Planning 68 (2004) 77–94
can persist for long periods of time, provided thereis an exchange of at least a few individuals pergeneration with other populations (Franklin, 1980;Verboom et al., 1993). These large populations mayact as sources of dispersing individuals that coloniseneighbouring patches, and thus have a stabilising rolefor other smaller local populations (Verboom et al.,1993). Source populations should comprise at least20–50 breeding pairs to have a good chance of sur-viving any kind of stochastic events in the long term(Franklin, 1980).
3. Selection of an umbrella species
Although the approach aimed at the conservationof a range of woodland birds, in-depth literaturereview has emphasised the need for a single-speciesapproach to address the problem of site-selection.Species differ in their territory size, their dispersalability and their perception of the landscape pattern.Consequently, they respond differently to the struc-ture of the landscape even within the same taxonomicgroup (Wiens et al., 1997). Species whose popula-tions are limited by the pattern of landscape attributessuch as habitat area or connectivity are most vulner-able to habitat fragmentation. Therefore, species withthe most demanding requirements for these attributes,known as umbrella species, may be selected to definethe minimum acceptable value for each landscape pa-rameter (Simberloff, 1998). The umbrella species thatwas selected has such habitat requirements that manyother species with lesser or similar requirements andautecological behaviour were also assumed to benefitfrom the selected sites.
The migratory passerine redstart (Phoenicurusphoenicurus), characteristic of the avian fauna of Sher-wood Forest, was chosen. The species favours mature,deciduous woodland but has been experiencing apopulation decline in recent years as a result of habi-tat change and loss in the breeding grounds (Carter,1995). Research shows that populations of redstartsare affected by fragmentation, showing strong effectsof area and isolation (Opdam et al., 1985; Cramp,1988). Loss of woodland habitat has led to the re-striction of the species in smaller fragments, wherecompetition for the available tree holes for nesting ishigher.
3.1. Habitat requirements of the redstart
In addition to the information about spatialprocesses in avian populations, scientific literaturefindings and consultation with experts about the be-haviour of the species provided the framework for thesite-selection procedure.Moore and Hooper (1975),in their study of British woods, found that there wasa minimum area of about 2.5 ha, below which therewas no likelihood of finding a breeding pair of red-starts. However, the greatest occurrence of redstartswas found between 10 and 100 ha (Winspear, 1991).Furthermore, empirical studies have shown that thespatial structure of the surrounding landscape signif-icantly affects patch occupancy and colonisation byredstarts. In particular, the probability of occurrenceof the species increased with an increase in the areaof woodland within a 3 km radius of the target wood’sperimeter (Opdam et al., 1985). It has also been sug-gested that the redstart has a short dispersal distance(Wilson, British Trust for Ornithology, personal com-munication). Taking into account issues of populationdynamics in fragmented landscapes and the habitatrequirements of the redstart, with regard to area andisolation parameters, a series of decision rules wereformulated:
• Provided the predecline population density inBritish woods is approximately 0.6–0.8 pairs/ha(Cramp, 1988), a minimum size of 5 ha was as-sumed to be sufficient to support a local populationof 3–5 breeding pairs.
• Likewise, habitat patches of 50 ha and over consist-ing of mature deciduous woodland could support apopulation of 30–50 pairs that would be viable inthe longer term.
• The area of woodland within a 3 km radius ofthe target wood’s perimeter is found to be a goodpredictor of the degree of isolation.
• During the breeding period, daily movements acrossarable land for feeding and breeding purposes rangefrom only a few hundred metres up to approximately700 m.
Identification of suitable sites for habitat expan-sion on the basis of the above spatial criteria wouldfavour the population persistence of threatened red-starts and prevent them from further decline. Other

P. Nikolakaki / Landscape and Urban Planning 68 (2004) 77–94 81
area-sensitive and sedentary species would alsobenefit from the suggested sites.
4. Site-selection process
There were three stages involved in the site-selectionprocess. These were based not only on aspects ofpopulation dynamics but also on the functionalities ofGIS.
1. Identification of the source populations: The paperdevelops a method for identifying the best po-tentially suitable habitat patches that can supportbreeding populations of redstarts and other species,and function as permanent sources of dispersal.It translates a considerable amount of literatureto clearly articulated selection criteria. Habitatsuitability was determined by incorporating thefactors of patch size, habitat quality and spatialcontext. Each of these factors was converted toa GIS map layer. The overlay of the layers com-posed the feasible area of those habitat patches thatmet the necessary conditions for the occurrenceof the species. The results were also validated byobservations of biologists familiar with the area.
2. Estimation of connectivity: The model COST wasused to simulate dispersal from the set of sourcesand estimate the potential connectivity of any sitein the landscape. It took into account not only thedistance from the sources but also barriers and theunderlying heterogeneity of the landscape, quanti-fying their effect on dispersal.
3. Prioritisation of sites for habitat creation: The rela-tive patch connectivity formed the basis from whichto infer how accessible a woodland patch was fromthe set of the source populations. The effect of patchsize on the extinction probability of local popula-tions as well as the role of dispersal from surround-ing suitable habitat were further taken into accountto predict the occupancy state of patches, and pri-oritise them accordingly for habitat creation.
In the face of limited scientific information, partic-ularly about distribution of species, it is essential toprovide a rational, explicit basis on which to makedecisions in a planning procedure. The strategy inthis paper was to incorporate as much credible sci-entific information as possible to create a model of
spatial habitat value in a GIS format. The resultingmaps of each stage can support decision-making in lo-cal land-use planning. Besides the model COST, GISoverlay and classification operations were the back-bone of the analysis. In particular, classifications basedon Boolean logic were widely used; areas not fulfill-ing the required conditions were excluded from furtherconsideration, while the remaining areas that satisfiedcertain criteria established the suitable locations. In ad-dition, operations for describing the landscape patternsuch as estimation of the area of individual patches andmeasurement of the spatial context were carried out.
IDRISI for Windows (version 1.0), a raster-basedsoftware, was used and a 20 m resolution wasdefined. Digital data of the land uses, ancient wood-land and County Wildlife Sites were provided byNottinghamshire County Council. Of the land usesdata, the layer of deciduous woodland was isolatedfor the purposes of the analysis.
4.1. Identification of the sources
4.1.1. Patch size and isolationWoodland patches of at least 50 ha were the first to
be identified, as they would have a greater likelihoodof being occupied by viable breeding populations ofredstart and would provide a large number of dis-persing colonists for local recolonizations (Urbanand Shugart, 1986; Knaapen et al., 1992). Such largewoods would most likely support breeding popula-tions of other woodland specialists (e.g. nuthatch,treecreeper, marsh tit and long-tailed tit) that requirelarge patch sizes of woodland habitat (Fuller et al.,1995). Moreover, patches large enough to sustain aviable population of a given specialist species shouldalso have large populations of generalist species (e.g.chaffinch, blackbird and blue-tit) which are less de-manding in habitat patch size (Fuller and Warren,1991). These woods were also assumed to comprise agood habitat, since large patches generally tend to havea greater diversity of habitats (Bellamy et al., 1997).
Although a larger area is less affected by isola-tion (Harms and Knaapen, 1988), immigration fromthe surrounding landscape to the sources would stillremain important in order to greatly minimise rarecases of local extinctions (Harms and Opdam, 1990).Hence, the area of deciduous woodland within a rangeof 3 km of the identified large woods was estimated

82 P. Nikolakaki / Landscape and Urban Planning 68 (2004) 77–94
as a variable that determined their degree of isolation.The probability of persistence of these populations wastaken proportional to the amount of the surroundingwoodland.
4.1.2. Habitat quality and isolationIt has been found that good habitat quality can also
improve the chances of population persistence throughfavouring greater reproductive success, reducing mor-tality, and/or improving the chance of successful settle-ment by immigrants (Bellamy et al., 1996b). Researchhas also shown that habitat quality and area are to acertain degree compensatory in their effects on birdoccurrence (Whitcomb et al., 1981). Moreover, thenegative impact of a small patch can be offset by goodhabitat quality and the total area of suitable woodlandin the region, providing that the patch size is above a
Fig. 2. Steps of the GIS analysis for the identification of the sources.
minimum critical area (Lynch and Whigham, 1984).Hence, remnants of ancient oak-birch woodland ac-quiring a minimum patch size of 10 ha that would en-sure a high probability of occurrence of redstarts werealso identified as potential sources. Likewise, maturedeciduous woods designated as County Wildlife Sites(CWS), due to their structural and floristic character-istics, of minimum 10 ha were also chosen.
Because of the smaller size of these patches, greaterimportance was given to the spatial context as a com-pensatory factor. Thus, only CWS and ancient wood-land with an amount of surrounding habitat higherthan that estimated for the large woods were regardedas sources. A larger amount of neighbouring wood-land would further enhance recolonization, ensuring agood prospect for these sites to sustain viable redstartpopulations.
P. Nikolakaki / Landscape and Urban Planning 68 (2004) 77–94 83
4.1.3. GIS approach to the identification of thesources
4.1.3.1. Area measures.The GROUP model wasused for the layers of deciduous woodland, ancientwoodland and CWS in order to estimate the area ofindividual habitat patches. GROUP finds polygonsin a layer by identifying contiguous groups of cellsholding the same value, and assigns a unique valueto each group. Area analysis gave the size of eachwoodland patch by measuring the number of cells ofeach of these groups. Polygons with an area smallerthan 50 ha (or 1250 cells) regarding the layer of de-ciduous woodland, and polygons smaller than 10 haregarding the layers of ancient woodland and CWS,respectively were eliminated (Fig. 2).
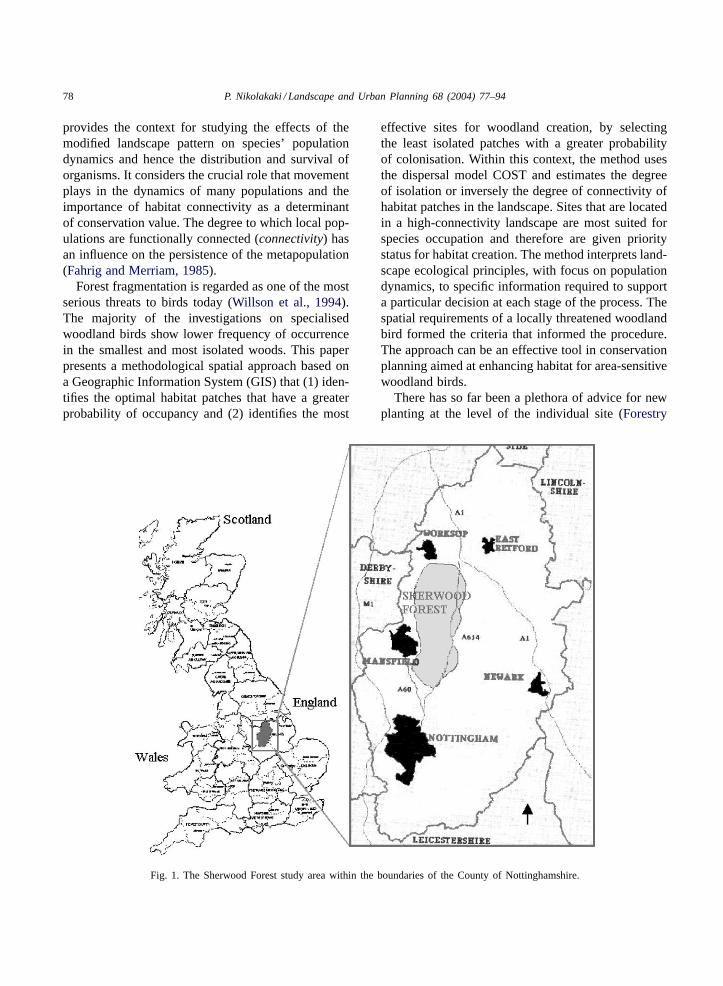
4.1.3.2. Spatial context measures.In order to esti-mate the amount of woodland within a 3 km radius,the DISTANCE model was initially applied for eachof the selected potential sources. DISTANCE calcu-lates the Euclidean distance of each cell to the nearestof a set of target cells as specified in a separate layer.A buffer zone of a 3 km radius was produced aroundthe selected patch in order to measure the area of thesurrounding woodland (Fig. 3a–c). In estimating thespatial context, the Euclidean distance was appliedrather than a distance operator that integrates frictionaleffects, because relevant studies used the metric dis-tance in demonstrating the significance of the wood-land area within 3 km as a good predictor of isolation.
A range of values of woodland area in the 3 kmbuffer was found for each of the three groups ofsources falling into three categories of low, mediumand high values. In order to ensure a high chance ofcolonisation, only sites greater than 50 ha and sur-rounded by a comparatively larger amount of wood-land within the 3 km radius, larger than 4000 cells or160.52 ha, were selected and the rest were rejectedthrough a Boolean classification. The threshold valueis not an absolute figure, established in the literature,so it was considered necessary to employ a relativelyhigh value of woodland area to further secure thechoice of woods as the appropriate ones. The areavalue of 4000 cells (at 36% of the maximum value)was adopted from a wide range of values with a min-imum of 587 cells up to 11,079 cells. However, ahigher threshold value, of 5000 cells or 200 ha, was
Fig. 3. Stages of estimating the spatial context. (a) Calculationof the distance of all pixels of the image; distance values areestimated radially from the edges of the target wood, shown inblack. The rings join areas with the same distance; (b) productionof a buffer of a 3 km radius; (c) production of the buffer zonecontaining the deciduous woodland.
chosen for the smaller patches of the County WildlifeSites and ancient woodland.
The layers depicting the three kinds of source woodsthat satisfied the criteria of patch size, habitat qualityand spatial context, respectively, were overlaid to pro-duce the final map representing all deciduous woodswhich could function potentially as permanent sourcesof dispersing colonists to the surrounding woodlandpatches (Fig. 4). The potential occupancy of thesepatches is partly or entirely dependent on the distancefrom the sources and on the presence of immigratingindividuals (Brown and Kodric-Brown, 1977).
4.2. Estimation of connectivity
Landscape ecological research has shown that land-scape connectivity should not be expressed solely in

84 P. Nikolakaki / Landscape and Urban Planning 68 (2004) 77–94
Fig. 4. Deciduous woods of large size and good habitat quality (ancient woods and County Wildlife Sites) were identified as “source”populations of redstart.
terms of physical distance or spatial configuration, butshould also incorporate the effect of the landscape ma-trix on the dispersal of species (Forman and Godron,1986; Hof and Flather, 1996). This derives from thefact that landscapes are heterogeneous, thus encom-passing various types of landscape elements that posedifferent resistance to the dispersal flow. Thus, theconcept of landscape resistance is introduced, whichrepresents the difficulty of crossing a landscape ele-ment or land use type for the individuals of a species.In this perspective, connectivity constitutes the degree
of ease with which a species moves through the land-scape (Taylor, 1997).
Habitats that are less suitable for dispersal havea higher resistance value. Birds hesitate to fly overnon-habitat, and dispersal mortality can be higher inopen landscapes (Verboom et al., 1991). Opdam et al.(1984)argued that a small stretch of open land couldrestrict the immigration rates of woodland dependentbirds far below the actual distance that they couldcover according to their flying abilities. Regarding lin-ear landscape elements,Willis (1974) also suggested

P. Nikolakaki / Landscape and Urban Planning 68 (2004) 77–94 85
that the width of a major river could be a barrier tobirds; some birds cannot fly even across a small wa-ter gap. With respect to roads,Bennett (1991)in hisreview claimed that a broad highway could constitutea functional barrier to sedentary woodland birds.
The classification of the different types of landscapeelements according to their impedance to dispersal wascarried out on the basis of existing studies (Knaapenet al., 1992) and knowledge of the ecological require-ments and behaviour of the redstart. Thus, the suitabil-ity of each land use and the degree of its resemblanceto the optimal habitat of redstarts provided the contextfor assigning landscape resistance values (Table 1).Hence, deciduous woodland, being the most suitableand preferred habitat of the redstart and other wood-land birds, was assigned the least resistance value 1,while mixed and conifer woodland were attributed thevalues 2 and 3, respectively. Arable land was assigned
Table 1Classification of the landscape elements according to expectedlandscape resistance value
Landscape elements Landscaperesistance value
Deciduous woodland 1Mixed woodland 2Conifer woodland 3New plantations 3Bracken/grass heath with mature trees 4Rough grassland with mature trees 4Permanent pasture/meadow with mature trees 4Amenity grassland 5Bracken/grass heath with scrub 5Bracken/grass heath with heather 5Bracken and/or grass heathland 5Rough grassland with scrub 5Rough grassland including marshland 5Permanent pasture/meadow with scrub 5Permanent pasture and meadow 5New and/or improved grassland 5Cultivated arable land 10Allotments 10Permanent horticultural crops 10Urban 20Mineral workings, active pits, tips and
spoil heaps20
Relative barriersOpen water—lakes, ponds 25Rivers 25Roads 25Rail 25
a high resistance value of 10, and urban together withderelict areas, a high resistance value of 20. Theselandscape elements comprise a significantly more in-hospitable habitat for the redstart, thereby impedingits dispersal. Rivers, lakes, roads and railways were re-garded as relative barriers to dispersal, i.e. movementsbetween populations on either side of the barrier areinfrequent but do occur, and thus they were given thehighest resistance value of 25 (Dawson, 1994).
4.2.1. GIS approach to estimating connectivityThe land use map was reclassified by assigning a
new value to each land use according to its suitabi-lity as habitat for redstarts and other birds of maturedeciduous woodland. In this manner, the original 25categories were reduced to 8, and the resulting maprepresented the landscape as a mosaic of varioustypes of landscape resistance, with greatest resistancein areas of inhospitable habitat which also reflectedthe occurrence of barriers (Fig. 5).
The model COST (Cost Grow) produces a graphicaldisplay of the ecological distance between the sourcepopulations and the local populations. It requires amap of the core areas “sources” and a friction surfacemap (Fig. 6). The operational result of COST is togenerate a distance/proximity surface (also referred toas a cost surface) where distance is measured as theleast cost distance or the least effort in moving overa friction surface. COST uses a growth algorithm thatcan accommodate complex friction surfaces as well asabsolute barriers to movement. The output of COSTattributed a value to each cell and in effect to eachwood representing the cost of dispersal of an individ-ual to reach that wood. The unit of measurement is“grid cell equivalents” (gce). A grid cell equivalent of1 indicates the cost of moving through a grid cell whenthe friction equals 1. A cost of five gce’s might arisefrom a movement through five cells with a friction of1, or one cell with a friction of 5.
Fig. 7 shows the output of a radial dispersal simu-lation from each source patch throughout the frictionsurface. The colour gradation from black to dark andlight grey represents a range of cost values from 0(black) to 1166 (light grey), where the value 0 corre-sponds to the sources. The cost of a dispersal routeincreases with the distance travelled and in landscapeswith high resistance value. The light grey areas in thesouth and north-east of the study area have cost values

86 P. Nikolakaki / Landscape and Urban Planning 68 (2004) 77–94
Fig. 5. Friction surface image. The variation in the grey colour shades indicates the different groups of landscape elements with acorresponding landscape resistance value (for the classification of the landscape elements seeTable 1).
Sources(distance from the sources)
Sources(distance from the sources)
Landscape element type(friction surface)
Landscape element type(friction surface)
COSTDistance from the sources+Landscape resistance
COSTDistance from the sources+Landscape resistance
Fig. 6. The cost of each patch is estimated as the sum of the distance from the set of the source patches and of the landscape resistanceof the cells in the intervening matrix.

P. Nikolakaki / Landscape and Urban Planning 68 (2004) 77–94 87
Fig. 7. Cost surface image. Cost values are defined radially from the sources and are demonstrated as concentric rings that enclose thesources (black areas in the centre of the rings). The gradation of the shading from black to dark and light grey indicates the range of costvalues from low to high, and the potential of patch occupancy from high to low respectively. Non-source deciduous woods are illustratedas small, distinct, black patches with well-defined boundaries, scattered throughout the cost surface.
greater than 1000. The location in the south, which isdominated by large expanses of treeless arable land-scape and built-up areas represents a considerable re-sistance to species dispersal. This is also shown inthe friction surface map where this area correspondsto types of landscape elements with resistance values10 and 20. The chances of a successful dispersal and
subsequently of patch occupancy are expected to beparticularly low in this part of the study area.
Fig. 7 also shows the groups of woodland patchesconnected by areas of similar cost. The difference be-tween ecological and real distance was verified by thefact that some woods, although they were located atthe same distance from the sources, were found to
88 P. Nikolakaki / Landscape and Urban Planning 68 (2004) 77–94
have different cost values and vice versa because ofthe landscape effect (e.g. patches at 40 m distance hadcost values 2 and 45, respectively, whereas on the otherhand woods with cost value 84 were situated at 720and 220 m distance from the set of sources).
4.3. Prioritisation of sites for habitat creation
The ranking of all sites by COST determined theirdegree of connectivity, guiding their prioritisationfor woodland creation. Woods with low cost values,being characterised by high connectivity, would behighly accessible to the source populations and there-fore would have a high chance of being colonised.Yet, a cost threshold value was considered necessaryto be drawn among the lower cost values, in orderto identify the least isolated woods and prioritise thesites of the study area accordingly. Connectivity of thepotential target woods would also be accomplished bybeing within the dispersal distance of the redstart fromthe sources. Therefore, two values were estimated foreach site: the cost of the dispersal of an individual toreach that wood and its distance from the sources.
The comparison of the cost and distance valuesindicated that the physical distance alone could notaccount for the functional isolation of the habitatpatches. Therefore, suitable sites for habitat creationshould be identified primarily by their low cost values,and their selection could then be refined by taking intoaccount their metric distance from the sources. It wassuggested that woods with small cost values but alsowith corresponding distance values less than 700 mcould be regarded as the least isolated. It was foundthat all woods with low cost up to the value of (100)were also located within an approximate distance of700 m from the sources, whereas sites with cost valuesjust above (100) were situated at long distances farbeyond the dispersal distance. As a result of employ-ing a threshold cost value rather than a distance valueas a primary determinant for isolation, some sites withdistance less than 700 m were not selected because oftheir high cost. The use of the metric distance abovewas only made to help define the threshold value asopposed to being used as a predictor of isolation on itsown right.
After having determined the threshold cost value,two zones of low and high cost for the dispersal ofredstarts could be clearly distinguished (Fig. 8). All
the sites in the low cost zone, because of their closeproximity to the sources and relative low landscaperesistance, would be easily accessible to dispersingindividuals and thus would mostly benefit from ex-pansion. Therefore, they were targeted as first prioritysites for habitat creation. On the other hand, the sitesin the high cost zone are characterised by a greaterdegree of isolation and would thus support local pop-ulations with a lower probability of recolonization.These woods were regarded as second priority sites.However, their degree of isolation would still vary de-pending on the cost values, allowing further refiningof their priority status.
4.3.1. High priority sitesPatches of the low cost zone, larger than 5 ha and
managed for good habitat quality, may support localpopulations of sufficient size (of at least 3–5 breed-ing pairs) that have low extinction rate. Thus, furtherenlargement of these sites was not regarded as nec-essary for the persistence of these populations. Onthe other hand, patches less than 5 ha can accom-modate only small local populations of redstarts andother woodland birds that have a high extinction ratedue to stochastic events (Urban and Shugart, 1986;Verboom et al., 1991). The survival of these pop-ulations is highly dependent on dispersal from thesurrounding habitat and therefore the need to enhancethese vulnerable populations is much greater. There-fore, among patches with low cost only those smallerthan 5 ha were selected for expansion at an initialstage.
Because the colonisation probability and the oc-currence of woodland birds and redstarts is positivelyrelated to the spatial configuration of habitat patches,the amount of deciduous woodland within a 3 kmradius of the selected woods shaped the next rule inthe selection process. The application of this crite-rion would further reinforce the assumption that theidentified woods which fulfilled all the above criteria,being also located in a high-value neighbourhood,would support local populations that have a greaterchance of recolonization. Immigration of individualsto these target populations could take place not onlyfrom the identified permanent sources but also fromneighbouring populations. Thus, once the species hassettled in these woods, enhanced species recruitmentthrough frequent recolonization into the sites, would

P. Nikolakaki / Landscape and Urban Planning 68 (2004) 77–94 89
Fig. 8. Prioritization of sites for new planting. Sources are shown in black; the grey area around the sources indicates the low cost zoneand the white area the high cost zone. The darker grey patches within the low cost zone are the first priority sites for habitat creation;those in circles represent the high priority sites. The patches within the high cost zone are the second priority sites.
buffer possible local extinctions (“rescue effect”). Thegreater the area of suitable woodland within the 3 kmbuffer, the lower the probability of local redstart pop-ulations becoming extinct. Those patches, which werefound to be surrounded by a large amount of deciduouswoodland (larger than 4000 cells) were finally selectedand were identified as high priority sites for habitatcreation. It is expected that by enlarging these sites tothe minimum size required maximum benefits mightbe gained for the persistence of the local populations.
5. Discussion
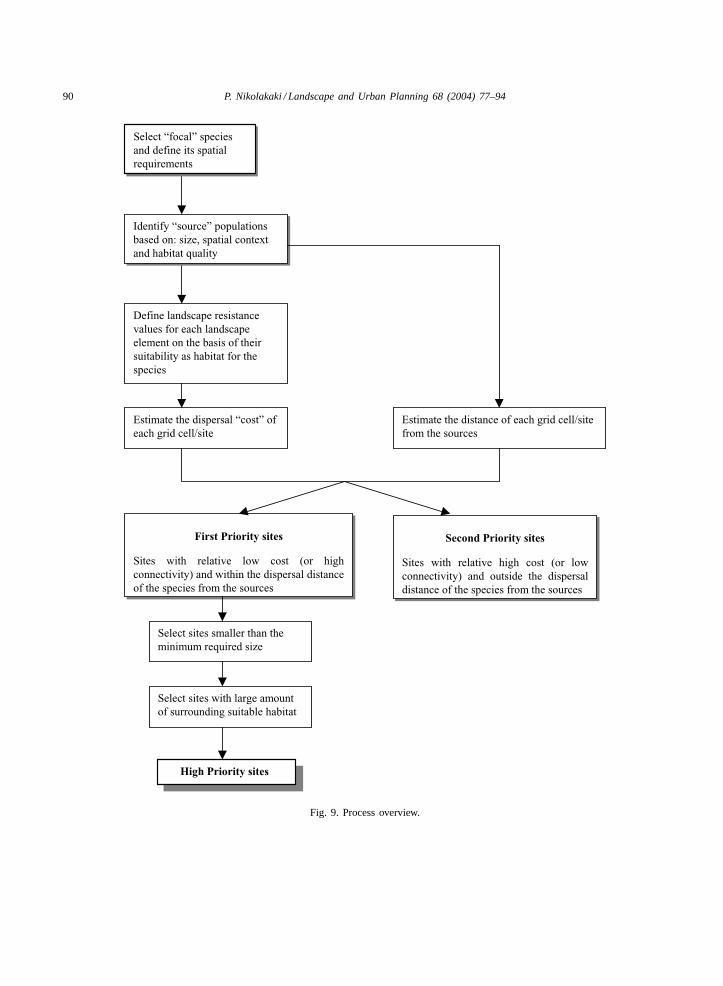
This paper presents the development of a metho-dology for identifying and prioritising potential sitesfor habitat creation, using GIS technology (Fig. 9).It describes a system that can support local land-usedecision making by structuring the best availableknowledge about habitat processes and species re-sponse in a fragmented landscape into the quantifi-cation of spatial parameters. The method identifies
90 P. Nikolakaki / Landscape and Urban Planning 68 (2004) 77–94
Select “focal” species
and define its spatial
requirements
Select “focal” species
and define its spatial
requirements
Define landscape resistance
values for each landscape
element on the basis of their
suitability as habitat for the
species
Estimate the dispersal “cost” of
each grid cell/site
Estimate the distance of each grid cell/site
from the sources
Identify “source” populations
based on: size, spatial context
and habitat quality
Identify “source” populations
based on: size, spatial context
and habitat quality
First Priority sites
Sites with relative low cost (or high
connectivity) and within the dispersal distance
of the species from the sources
First Priority sites
Sites with relative low cost (or high
connectivity) and within the dispersal distance
of the species from the sources
Second Priority sites
Sites with relative high cost (or low
connectivity) and outside the dispersal
distance of the species from the sources
Second Priority sites
Sites with relative high cost (or low
connectivity) and outside the dispersal
distance of the species from the sources
Select sites smaller than the
minimum required size
Select sites with large amount
of surrounding suitable habitat
High Priority sitesHigh Priority sites
Fig. 9. Process overview.

P. Nikolakaki / Landscape and Urban Planning 68 (2004) 77–94 91
the best potential habitats (“sources”) and also sitesfor new habitat considering ecological guidelines ofminimum patch, maximum threshold distance, cer-tain landscape configuration and the suitability ofthe landscape to species dispersal. It adopts a tar-get species with well-known requirements since theabove issues can only be addressed with the availableknowledge as a single-species approach. Populationdynamics were introduced by the spatial requirementsof the redstart and were translated into specific con-servation objectives that governed the selection of thesites.
Estimating connectivity is an important part ofthe site-selection process. In viewing landscape con-nectivity in either empirical or theoretical studies,the effect of the distance between populations ondispersal as well as the amount of habitat around apatch (or number of corridors) is usually taken intoaccount but rarely the effect of the landscape mo-saic on the dispersal of individuals. The strength ofthis approach in estimating connectivity lies in thepremise that the landscape is heterogeneous; namely,it is not regarded as a binary mosaic where habitatpatches are embedded within an ecologically neu-tral matrix but comprises a variety of habitats andbarriers of varying degrees of suitability to differ-ent species. The concept of landscape resistance re-flects the heterogeneity of a landscape and is appliedas a friction parameter that decreases or enhancesconnectivity.
New planting at the suggested sites as well asenhancing breeding populations of redstarts bydecreasing the rate of extinction, would also favourother area-sensitive woodland interior birds that maysomeday be at risk. Woodland generalist species,not typically confined to the edges of small woods,would also benefit. Moreover, enlargement of thewoodland sites that are located at a short distancefrom the species pool should also increase the prob-ability of initial colonisation in the establishmentphase of a range of woodland specialists which haverelatively short dispersal distances (Opdam et al.,1985).
The method can also be applied to species otherthan woodland birds. Sufficient existing knowledgeof the autecological characteristics of an umbrellaspecies will be necessary. It should also be possible toformulate its spatial requirements in terms of thresh-
old distances and minimum area. Generalisation of itsspatial requirements into guidelines for site-selectiondepends on the spatial scale and on the species groupthat can be represented by the species concerned. Theapproach can be applied to each scale level dependingon the species; the grid size must be selected accord-ing to its dispersal distance. The flexibility of theGIS system enables precisely such a change to takeplace.
5.1. The role of GIS in site-selection
The process applied is systematic, flexible and re-producible. Moreover, the study has demonstrated theutility and feasibility of using GIS for addressing theissue of site-selection for habitat creation. The use ofGIS enhanced the capability to view woodland con-servation within a broader landscape context, ratherthan just on individual sites (Nikolakaki and Dunnett,1998). The easy and quick implementation of overlayand Boolean operations made it a very useful toolin the process. Landscape and habitat requirementswere fed in as GIS layers and were overlaid accord-ingly. GIS was also capable of calculating attributesby means of spatial analysis, such as area of individ-ual patches and their distance from other woodlandpatches.
One of the major advantages of using GIS was theapplication of the model COST for estimating land-scape connectivity without relying explicitly on thephysical distance. Moreover, COST, by estimatingthe potential cost of dispersal for each cell, producesa wide range of values, and the outcome map rep-resents the potential connectivity of any site in thelandscape. This gradation of COST values allowsthe comparison among sites, and thus ranks the po-tential suitability of all sites for woodland creationwithin the study area prioritising them accordingly.Moreover, the spatial context constitutes an additionalcriterion for identifying the most potentially suitablesites among those fulfilling the criteria. In this way,the approach does not adopt a classification based onthe classical Boolean logic, where an area is either ac-cepted or rejected given a threshold value. Regardingthe second priority sites, they could constitute partof an ecological network where creation of corridorscould reduce their isolation. The exploration of thisscenario formed part of a later work.

92 P. Nikolakaki / Landscape and Urban Planning 68 (2004) 77–94
In relation to the threshold cost value, althoughthere was a clear distinction in this study, with costvalues below 100 also corresponding to very low dis-tance values (<700 m), this might not have been thecase for a different cost outcome. In such a case, theamount of available funding for implementing sucha project could determine the threshold value, abovewhich sites could be disregarded. Habitat creationcould start at the sites with the lowest cost values con-tinuing at patches with relatively higher cost valuesin ascending order, until the full expenditure of thefunding.
A point that should also be made is that extendinghabitat patches alters the mosaic around the wood-lands resulting in changing values of the variables(such as area of woodland within 3 km). These alter-ations should be included in the modelling and thecomputation should ideally be an iterative process.With regard to landscape resistance, because it is atheoretical variable, which thus far has not been stud-ied or measured as such, its estimation was basedon sensible assumptions and literature findings forwoodland birds. Given that the difficulty to cross alandscape element depends on the species concerned,it is possible to modify the landscape resistance val-ues. A more precise definition of the resistances re-quires collecting field data on the dispersal rate of thestudied species between habitat patches. However, itwould be beneficial if the results could be generalisedand applied to “ecological groups” of organisms witha common ecological profile.
Though the approach is based on assumptions, itallows the selection of the core areas that can repre-sent the backbone of a strategic ecological networkas well as the identification of those patches that aremore likely to receive colonists from the sources. Theidentification of these areas could direct mitigationconservation funds. The method can be used as aninitial step in the process of site-selection on a largescale that can then guide more detailed field-basedassessments. Adding other factors as a series of over-lays such as soils, soil moisture or aspect constraintscould further refine the prioritisation procedure. More-over, overlay with data layers of zoning and pendingprojects could be used to assess future threats for theidentified habitats. In general, the model provides asimple approach that can be a useful tool in natureconservation and landscape planning, integrating pop-
ulation dynamics and spatial relations in GIS facilitiesfor site-selection endeavours.
Acknowledgements
The study was conducted as part of my doctoralthesis, which was financially supported by the Hel-lenic Foundation of Scholarships and the Departmentof Landscape of the University of Sheffield. I wouldlike to thank Nigel Dunnett for his supervision, Not-tinghamshire County Council for the provision of thedigital land use data, Duncan Westbury for his helpfulcomments, Andrew Moran and John Nisbet for theirimprovements on the english.
References
Andrén, H., 1994. Effects of habitat fragmentation on birds andmammals in landscapes with different proportions of suitablehabitat: a review. Oikos 71, 355–366.
Bellamy, P.E., Hinsley, S.A., Newton, I., 1996a. Factors influencingbird species numbers in small woods in south-east England. J.Appl. Ecol. 33, 249–262.
Bellamy, P.E., Hinsley, S.A., Newton, I., 1996b. Local extinctionsand recolonizations of passerine bird populations in smallwoods. Oecologia 108, 64–71.
Bellamy, P.E., Brown, N.J., Enoksson, B., Firbank, L., et al.,1997. The role of landscape structure and dispersal inlimiting nuthatch distribution. In: Cooper, A., Power, J. (Eds.),Proceedings of the Sixth Annual Conference of the InternationalAssociation for Landscape Ecology (UK) on Species Dispersaland Land Use Processes. University of Ulster, IALE, UK.
Bennett, A.F., 1991. What types of organism will use the corridor?In: Saunders, D.A., Hobbs, R.J. (Eds.), Nature Conservation. 2.The Role of Corridors. Surrey Beaty & Sons, Chipping Norton,NSW, pp. 407–408.
Brown, J.H., Kodric-Brown, A., 1977. Turnover rates in insularbiogeography: effect of immigration on extinction. Ecology 58,445–449.
Carter, S. (Ed.), 1995. Britain’s Birds in 1991–1992: The Conser-vation and Monitoring Review. British Trust for Ornithology,Thetford Joint Nature Conservation Committee, Peterborough.
Collinge, S.K., 1996. Ecological consequences of habitat frag-mentation: implications for landscape architecture and planning.Landscape Urban Plann. 36, 59–77.
Cramp, S. (Ed.), 1988. Handbook of the Birds of Europe, theMiddle East and North Africa. The Birds of the WesternPalearctic, Tyrant Flycatchers to Thrushes, vol. V. OxfordUniversity Press, Oxford.
Dawson, D.G., 1994. Narrow is the way. In: Dover, J.W. (Ed.),Proceedings of the Third Annual Conference of the InternationalAssociation for Landscape Ecology (UK) on Fragmentation in
P. Nikolakaki / Landscape and Urban Planning 68 (2004) 77–94 93
Agricultural Landscapes. Myerscough College, Preston, IALE,UK.
Fahrig, L., Merriam, G., 1985. Habitat patch connectivity andpopulation survival. Ecology 66 (6), 1762–1768.
Forestry Authority, 1994. Creating New Native Woodlands.Bulletin 112. Forestry Commission, Edinburgh.
Forman, R.T.T., Godron, M., 1986. Landscape Ecology. Wiley,New York.
Franklin, I.R., 1980. Evolutionary change in small populations.In: Soulé, M.E., Wilcox, B.A. (Eds.), Conservation Biology:An Evolutionary Ecological Perspective. Sinauer Associates,Sunderland, MA, pp. 135–149.
Fuller, R.J., Warren, M.S., 1991. Conservation management inancient and modern woodlands: responses of fauna to edgesand rotations. In: British Ecological Society Symposium No. 31(Ed.), The Scientific Management of Temperate Communitiesfor Conservation. Blackwell Scientific Publications, Oxford,pp. 445–471.
Fuller, R.J., Gough, S.J., Marchant, J.H., 1995. Bird populationsin new lowland woods: landscape, design and managementperspectives. In: Ferris-Kaan, R. (Ed.), The Ecology ofWoodland Creation. Wiley, Chichester, pp. 163–182.
Hanski, I., 1994. Patch-occupancy dynamics in fragmentedlandscapes. Tree 9 (4), 131–135.
Harms, W.B., Knaapen, J.P., 1988. Landscape planning andecological infrastructure: the Randstad study. In: Schreiber, K.F.(Ed.), Connectivity in Landscape Ecology, Proceedings of theSecond International Seminar of the International Associationfor Landscape Ecology. Munstersche Geographische Arbeiten,Munster, 1987.
Harms, W.B., Opdam P., 1990. Woods as habitat patches forbirds: application in landscape planning in The Netherlands. In:Zonneveld, I.S., Forman, R.T.T. (Eds.), Changing Landscapes:An Ecological Perspective. Springer-Verlag, New York,pp. 73–97.
Hinsley, S.A., Bellamy, P.E., Newton, I., Sparks, T.H., 1994a.Factors Influencing the Presence of Individual Breeding BirdSpecies in Woodland Fragments. Research Report 99, EnglishNature, Peterborough.
Hinsley, S.A., Bellamy, P.E., Newton, I., 1994b. HabitatFragmentation and the Occurrence of Breeding Birds in SmallWoods. Annual Report 1993–1994. Institute of TerrestrialEcology, Monks Wood.
Hof, J., Flather, C.H., 1996. Accounting for connectivity and spatialcorrelation in the optimal placement of wildlife habitat. Ecol.Model. 88, 143–155.
Knaapen, J.P., Scheffer, M., Harms, W.B., 1992. Estimating habitatisolation in landscape planning. Landscape Urban Plann. 23,1–16.
Komdeur, J., Gabrielsen, L., 1995. Effects of forest fragmentationon breeding bird populations in Denmark. In: Skov, F.,Komdeur, J., Fry, G., Knudsen, J. (Eds.), Proceedings of thesecond Connect Workshop on Landscape Ecology, Principlesand Tools for The Study of Landscape Ecology-Potentials andLimitations, 1993. Technical Report No. 131, Fuglocentret,Danish National Environmental Research Institute.
Lambeck, R.J., 1997. Focal species: a multi-species umbrella fornature conservation. Conserv. Biol. 11 (4), 849–856.
Lynch, J.F., Whigham, D.F., 1984. Effects of forest fragmentationon breeding bird communities in Maryland USA. Biol. Conserv.28, 287–324.
McIntyre, N.E., 1995. Effects of forest patch size. Landscape Ecol.10 (2), 85–99.
Moore, N.W., Hooper, M.D., 1975. On the number of bird speciesin British woods. Biol. Conserv. 8, 239–250.
Nikolakaki, P., Dunnett, N., 1998. Strategy for woodland creationin Sherwood Forest: the use of GIS to produce a landscapeplan. In: Katsifarakis, K., Korfiatis, G., Mylopoulos, Y.,Demetracopoulos, A.C. (Eds.), Proceedings of the FourthInternational Conference on Protection and Restoration of theEnvironment, Protection and Restoration of the Environment.Aristotle University of Thessaloniki, Macedonia.
Opdam, P., 1991. Metapopulation theory and habitat fragmentation:a review of holarctic breeding bird studies. Landscape Ecol.5 (2), 93–106.
Opdam, P., van-Dorp, D., ter-Braak, C.J.F., 1984. The effect ofisolation on the number of woodland birds in small woods inThe Netherlands. J. Biogeograph. 11, 473–478.
Opdam, P., Rijsdijk, G., Hustings, F., 1985. Bird communities insmall woods in an agricultural landscape: effects of area andisolation. Biol. Conserv. 34, 333–352.
Simberloff, D., 1998. Flagships, umbrellas, and keystones: issingle-species management passé in the landscape era? Biol.Conserv. 83 (3), 247–257.
Sparks, T.H., Hinsley, S.A., Mountford, J.O., Veitch, N., Bellamy,P.E., deNooijer, D.S., 1994. Landscape design: preliminary esti-mates of the effects of landscape permutations on wildlife. In:Dover, J.W. (Ed.), Proceedings of the Third Annual Conferenceof the International Association for Landscape Ecologyon Fragmentation in Agricultural Landscapes. MyerscoughCollege, Preston, IALE, UK.
Taylor, P.D., 1997. Empirical explorations of landscape connec-tivity. In: Cooper, A., Power, J. (Eds.), Proceedings of theSixth Annual Conference of the International Associationfor Landscape Ecology on Species Dispersal and Land UseProcesses. University of Ulster, IALE, UK.
Urban, D.L., Shugart, J.H.H., 1986. Avian demography in mosaiclandscapes: modeling paradigm and preliminary results. In:Verner, J., Morrison, M.L., Ralph, C.J. (Eds.), Wildlife 2000.Modelling Habitat Relationships of Terrestrial Vertebrates.University of Wisconsin Press, London, pp. 273–280.
Verboom, J., Schotman, A., Opdam, P., Metz, J.A.J., 1991.European nuthatch metapopulations in a fragmented agriculturallandscape. Oikos 61, 149–156.
Verboom, J., Metz, J.A.J., Meelis, E., 1993. Metapopulation modelsfor impact assessment of fragmentation. In: Vos, C.C., Opdam,P. (Eds.), Landscape Ecology of a Stressed Environment.Chapman & Hall, London, pp. 172–191.
Whitcomb, R.F., Robbins, C.S., Lynch, T.F., Whitcomb, B.L.,Klimkiewicz, M.I.C., Bystrak, D., 1981. Effects of forestfragmentation on avifauna of the eastern deciduous forest. In:Burgess, R.L., Sharpe, D.M. (Eds.), Forest Island Dynamics inMan-Dominated Landscapes. Springer, New York, pp. 125–205.
Wiens, J.A., Schooley, R.L., Weeks, R.D.J., 1997. Patchylandscapes and animals movements: do beetles percolate? Oikos78, 257–264.

94 P. Nikolakaki / Landscape and Urban Planning 68 (2004) 77–94
Willis, E.O., 1974. Populations and local extinctions of birds onBarro Colorado Island. Panama Ecol. Monogr. 44, 153–169.
Willson, M.F., de Santo, T.L., Sabag, C., Armesto, J.J., 1994.Avian communities of fragmented south-temperature rainforestsin Chile. Conserv. Biol. 8 (2), 508–520.
Winspear R.J., 1991. A Study of the Distribution of Bird Speciesin Fragmented Woodland. Ph.D. Thesis, University of Leeds,Leeds.
Pantoula Nikolakaki serves at present as the landscape and bio-diversity officer at Oxfordshire County Council. Her work focuses
on developing a methodology to assess biodiversity on a largescale and on exploring the relationship between landscape charac-ter and biodiversity using GIS, in order to assist decision makingin landscape planning. She received her PhD in landscape ecol-ogy from the University of Sheffield, in 2000. In addition, shereceived her master of landscape architecture from the Universityof Edinburgh, in 1995 and her diploma in agriculture from theAristotle University of Thessaloniki, in 1988. Her areas of interestinclude conservation landscape ecology with emphasis on habitatfragmentation issues and metapopulation dynamics, and develop-ment of spatial decision support systems for landscape conserva-tion planning utilising the capabilities of GIS.