A GIS approach to electrification planning in Afghanistan · Monday, July 9, 2018 OnSSET –The...
44
KTH Department of Energy Technology Division of Energy Systems Analysis A GIS approach to electrification planning in Afghanistan Prepared by: KTH-dESA 12 July 2017
Transcript of A GIS approach to electrification planning in Afghanistan · Monday, July 9, 2018 OnSSET –The...
KTH Department of Energy Technology
Division of EnergySystems Analysis
A GIS approach to electrification planning in Afghanistan
Prepared by: KTH-dESA
12 July 2017

Background and scope
Monday, July 9, 2018
Universal access to affordable and reliable electricity is part and parcel to the success of any economic growth strategy in the country
Yet, 70% of Afghan population does not have access to affordable and reliable electricity services. Access to grid electricity reaches:
• 89% in urban centers (Kabul, Herat, Mazar-e-Sharif, Kandahar)
• But roughly 11% in rural areas (Ghor, Langman)
This study aims to develop an electrification model based on the ONSSET methodology that will:
Ø Capture the dynamics in the power sector of Afghanistan.
ØProvide a sense of the investment and capacity requirements for full electrification of Afghanistan under certain targets.

Monday, July 9, 2018
OnSSET – The Open Source Spatial Electrification Tool
ü GIS datasets developed for Afghanistanü Customized inputs according to study specifications
• Social indicators (population growth, urbanization level, different demand patterns etc.)
• Energy Access Goals
• Technical factors (T&D losses for national grid, alternative technologies available etc.)
• Cost elements (Investment cost – O&M – Fuel etc.)
ü Quantification of Capacity – Investment requirements for electrification
ü Visualization of key outputs in graphs & maps of high spatial resolution (1 sq.km)ü Support electrification efforts on a national and subnational level

A GIS environment (e.g. ArcGIS, QGIS) is required
1. Administrative boundaries
2. Population distribution & density
3. Power plants (existing and planned)
4. Transmission network (existing and planned)5. Sub-stations (existing and planned)
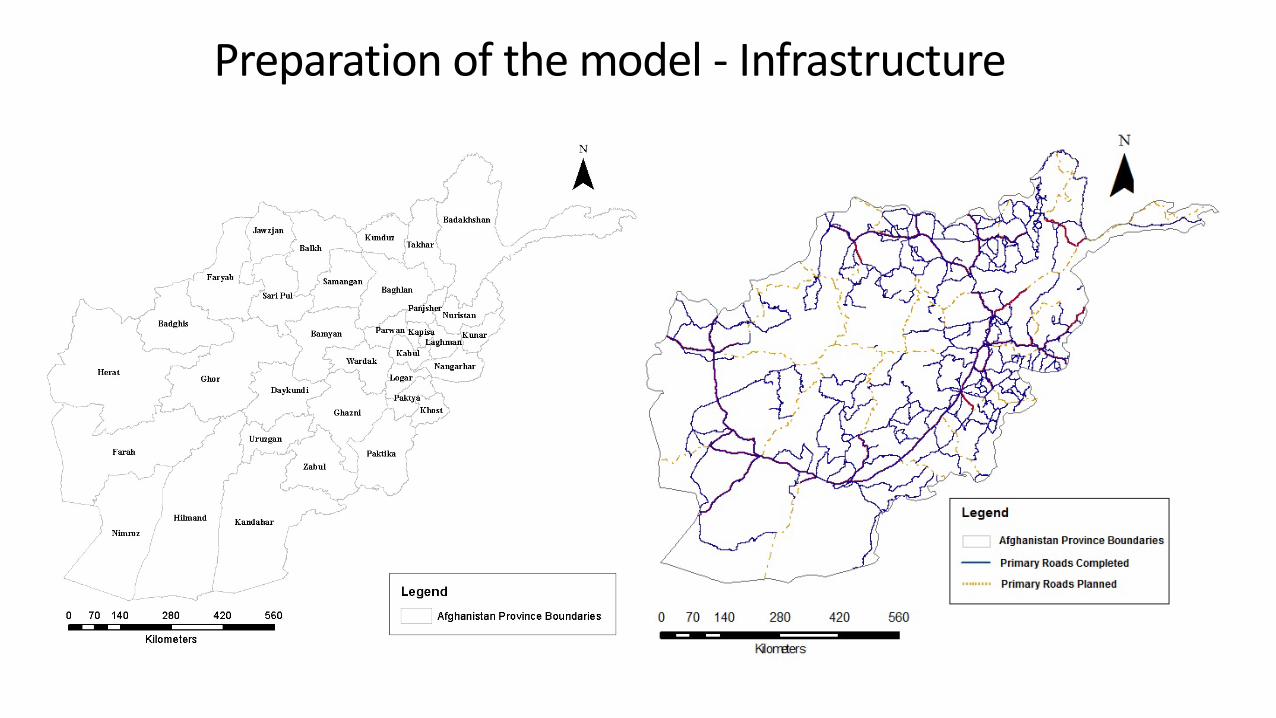
6. Road network (existing and planned)
7. Quarries and Mines
8. Nighttime light maps
9. Land Cover
10. DEM (Digital Elevation Map)
11. Travel time to nearest town12. Solar irradiation (with restrictions)
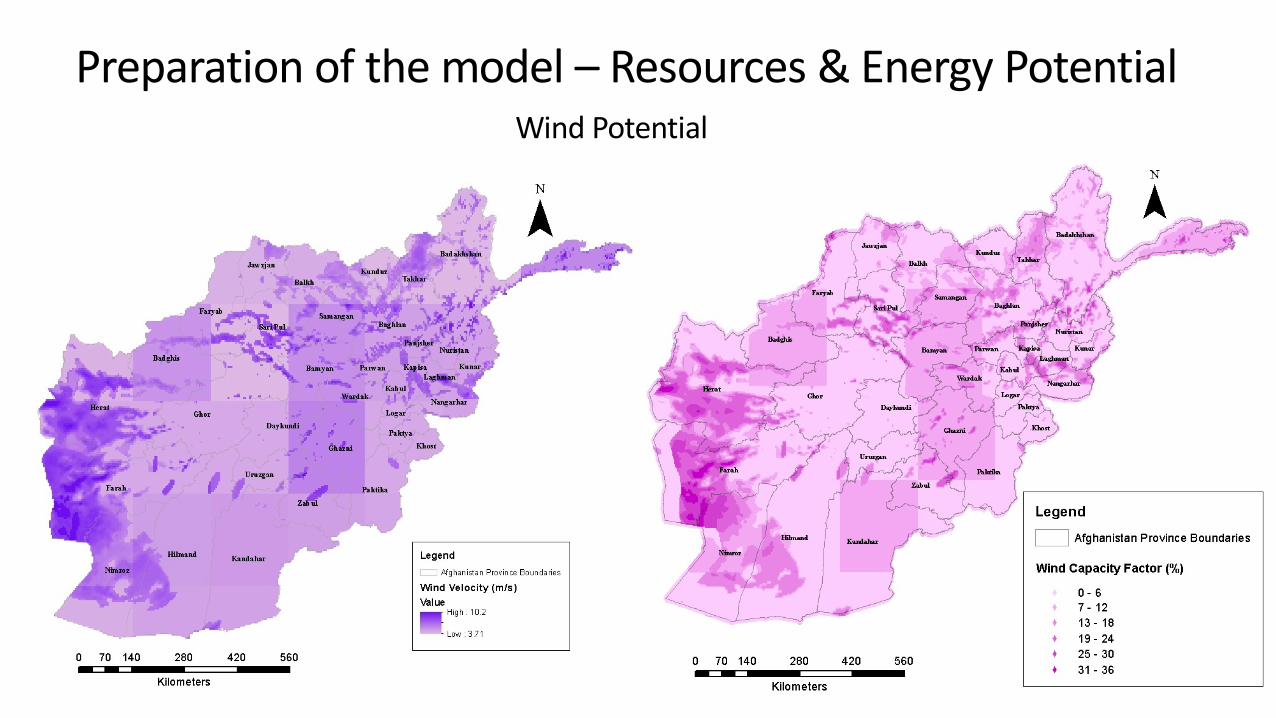
13. Wind velocity
14.Mini/Small hydropower potential
Dynamic datasets(Current – projected/planned)
Static datasets (Resources Potential)
Preparation of the model - Infrastructure
Monday, July 9, 2018
Preparation of the model - Infrastructure

Monday, July 9, 2018
Preparation of the model - Infrastructure
53 power plants532 MW
9 “island” power grids

Monday, July 9, 2018
Preparation of the model - Infrastructure
17 power plants
HajigakAynak

Monday, July 9, 2018
Preparation of the model - Infrastructure

Monday, July 9, 2018
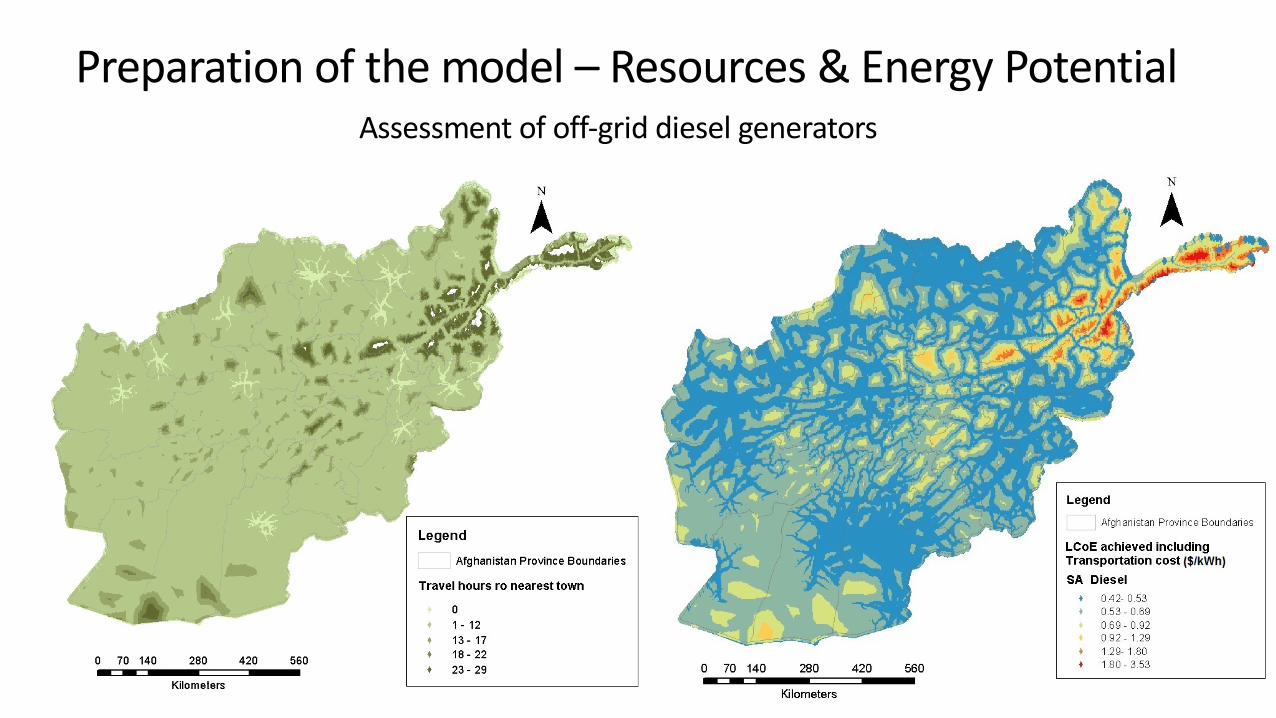
List of restrictions zones used for the solar PV assessment in Afghanistan.
Preparation of the model – Resources & Energy PotentialSolar Potential – Photovoltaic Systems
Layer Type Source
Protected areas
Strict Nature Reserves, Wilderness areas, National Parks, Natural Monument,
Habitat/Species Management, Protected Landscape, Managed Resource protected
areas
(1)
Croplands Cultivated areas (2)
Slope gradient Exclude areas with more than 45 degrees terrain slope (3)
Inland water Lakes, Wetlands, Stagnant waters (2) (4)Permanent
snow High elevated, remote areas (2)
1. IUCN and UNEP-WCMC. The World Database on Protected Areas (WDPA). [Online] UNEP-WCMC, 2014,www.protectedplanet.net.
2. NASA MODIS. Land Cover Type Yearly L3 Global 0.05Deg CMG. [Online] USGS Earth Resources Observation and Science (EROS) Center, Sioux Falls, South Dakota, https://lpdaac.usgs.gov/dataset_discovery/modis/modis_products_table/mcd12c1.
3. Jarvis, A., H.I. Reuter, A. Nelson, E. Guevara. Hole-filled SRTM for the globe Version 4. [Online] CGIAR-CSI SRTM 90m Database, 2008, http://srtm.csi.cgiar.org.
4. New global hydrography derived from spaceborne elevation data. Lehner, B., Verdin, K., Jarvis, A. 10, 2008, Eos, Transactions, AGU, Vol. 89, pp. 93-94.

Monday, July 9, 2018
List of restrictions zones used for the solar PV assessment in Afghanistan.
Preparation of the model – Resources & Energy PotentialSolar Potential – Photovoltaic Systems
Layer Type Source
Protected areas
Strict Nature Reserves, Wilderness areas, National Parks, Natural Monument,
Habitat/Species Management, Protected Landscape, Managed Resource protected
areas
(1)
Croplands Cultivated areas (2)
Slope gradient Exclude areas with more than 45 degrees terrain slope (3)
Inland water Lakes, Wetlands, Stagnant waters (2) (4)Permanent
snow High elevated, remote areas (2)
1. IUCN and UNEP-WCMC. The World Database on Protected Areas (WDPA). [Online] UNEP-WCMC, 2014,www.protectedplanet.net.
2. NASA MODIS. Land Cover Type Yearly L3 Global 0.05Deg CMG. [Online] USGS Earth Resources Observation and Science (EROS) Center, Sioux Falls, South Dakota, https://lpdaac.usgs.gov/dataset_discovery/modis/modis_products_table/mcd12c1.
3. Jarvis, A., H.I. Reuter, A. Nelson, E. Guevara. Hole-filled SRTM for the globe Version 4. [Online] CGIAR-CSI SRTM 90m Database, 2008, http://srtm.csi.cgiar.org.
4. New global hydrography derived from spaceborne elevation data. Lehner, B., Verdin, K., Jarvis, A. 10, 2008, Eos, Transactions, AGU, Vol. 89, pp. 93-94.
Monday, July 9, 2018
Preparation of the model – Resources & Energy PotentialWind Potential
Monday, July 9, 2018
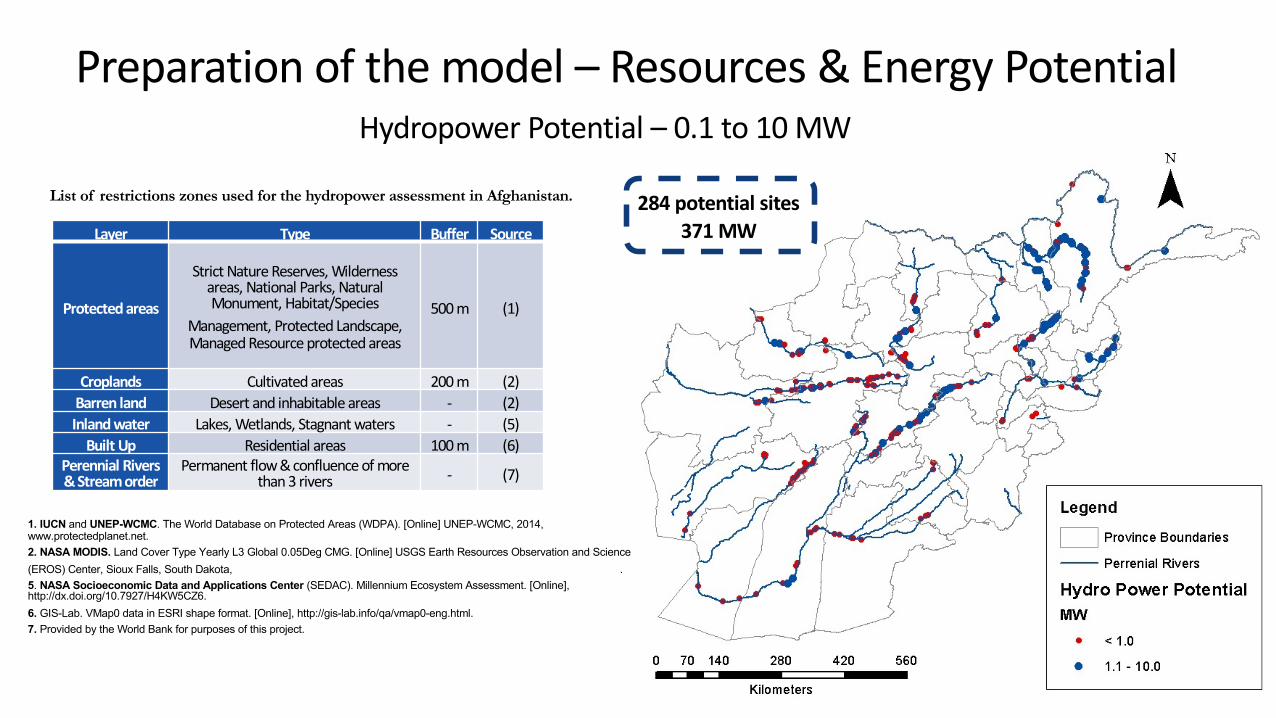
Preparation of the model – Resources & Energy PotentialHydropower Potential – 0.1 to 10 MW
Layer Type Buffer Source
Protected areas
Strict Nature Reserves, Wilderness areas, National Parks, Natural Monument, Habitat/Species
Management, Protected Landscape, Managed Resource protected areas
500 m (1)
Croplands Cultivated areas 200 m (2)Barren land Desert and inhabitable areas - (2)Inland water Lakes, Wetlands, Stagnant waters - (5)
Built Up Residential areas 100 m (6)Perennial Rivers& Stream order
Permanent flow & confluence of more than 3 rivers - (7)
List of restrictions zones used for the hydropower assessment in Afghanistan.
1. IUCN and UNEP-WCMC. The World Database on Protected Areas (WDPA). [Online] UNEP-WCMC, 2014, www.protectedplanet.net.2. NASA MODIS. Land Cover Type Yearly L3 Global 0.05Deg CMG. [Online] USGS Earth Resources Observation and Science
(EROS) Center, Sioux Falls, South Dakota, https://lpdaac.usgs.gov/dataset_discovery/modis/modis_products_table/mcd12c1.5. NASA Socioeconomic Data and Applications Center (SEDAC). Millennium Ecosystem Assessment. [Online], http://dx.doi.org/10.7927/H4KW5CZ6.
6. GIS-Lab. VMap0 data in ESRI shape format. [Online], http://gis-lab.info/qa/vmap0-eng.html.7. Provided by the World Bank for purposes of this project.
284 potential sites371 MW
Monday, July 9, 2018
Preparation of the model – Resources & Energy PotentialAssessment of off-grid diesel generators

Monday, July 9, 2018
Preparation of the model – Social IndicatorsCalibration and projection of key input datasets
Parameter Metric Value 2015 Value 2030
Population, total Million Persons 32.527 844.310 (estimated based on
growth rates below)
Urban population Percent of total population 26.3 % 935.8% (estimated based on
growth rates below)
Rural population Percent of total population 73.7% 964.2% (estimated based on
growth rates below)
Urban growth Percent growth per year 3.96% 93.49% (average value used in the
model as 3.65% per year)9
Rural growth Percent growth per year 1.85% 91.12% (average value used in the
model as 1.35% per year)2
Electricity access Percent of total population30% 10,11 (access to the national grid)
100%
Electricity access, urban Percent of urban population89% 11 (access to the
national grid)100%
Electricity access, rural Percent of rural population11% 11 (access to the
national grid)100%
People per household, urban
People per household 7.4 11,12 7 (assuming 5% decrease over the 15 year period) 13
People per household, rural People per household 8.5 11,12 8.1 (assuming 5% decrease over
the 15 year period) 13
8. The W orld Bank O pen D ata, 2015 (http://data.w orldbank.org/indicator/SP.PO P.TO TL?locations=AF)
9. U nited N ations, D epartm ent of Econom ic and Socia l A ffa irs, Population D iv is ion, 2015
https://esa.un.org/unpd/w pp/D ow nload/Probabilis tic /Population/https://esa.un.org/unpd/w up/C D -R O M /
10. N ational Energy Supply P rogram (N ESP – 2012)
11. A fghanistan Liv ing C ondition Survey 2013 – 2014: N ational R isk and Vulnerability
Assessm ent (http://w w w .af.undp.org/content/dam /afghanistan/docs/M D G s/N R VA% 20R EPO R T
-rev-5% 202013.pdf)
12. A survey of A fghan People, The Asian Foundation (2015).
13. Leveraging urbanization in south Asia. M anaging spatia l transform ation for prosperity and livability (2015).
https://openknow ledge.w orldbank.org/b itstream /handle/10986/22549/9781464806629.pdf?sequence=17& isA llow ed=y

Monday, July 9, 2018
Preparation of the model – Social IndicatorsCalibration and projection of key input datasets

Monday, July 9, 2018
Preparation of the model – Social IndicatorsCalibration and projection of key input datasets
Identify current Electrification status:
• Night Lights index: >5• Population: >500 people• Distance from roads: <10 km• Distance from grid: <10 km
The electrification rate under theseassumptions is 30%

Monday, July 9, 2018
Preparation of the model – Technology InputsTechnical and Economic parameters of the technologies used
Plant typePlant
capacity (kW)
Investment cost
($/kW)
O&M costs (% of
investment cost/year)
Fuel cost $/liter
(future)Efficiency Capacity factor Life
(years)
Diesel Genset Mini Grid 100 1,200 [14] 10%
0.69(1.00) 37% 0.7 15
Small HydroMini Grid 1000 2,500 [15] 2%
-- 0.5 30
Solar PVMini Grid 100
2,600
[14], [15]1.8% - -
Obtained for each grid point
depending on
solar availability
20
Wind Turbines Mini Grid
1002,300
[14], [15]3.5% - -
Obtained for each grid point
depending on
wind availability
20
Diesel GensetStand Alone 1 2,000 [14] 10%
0.69(1.00) 28% 0.5 10
Solar PVStand Alone 0.4
5,500 [4]
Including BoS
1.8% - -
Obtained for each grid point
depending on
solar availability
15
Parameter Cost unitHV lines (>110kV) 120,000 $/km [14]
MV lines (20 kV) 9,000 $/km [14]
LV lines (220 V) 5,000 $/km [14]
MV/LV transformer 3,500 $ per unit (50 kVA) [14]
Transmission loses 18.3% [14]
Connection cost per HH $122 [14]
Cost of producing electricity ??
14. Is lam ic R epublic of A fghanistan M inistry of Energy and W ater, "Pow er Sector M aster P lan," Asian D evelopm ent Bank - F ichtner, 2013.
15. IR EN A, "R enew able Pow er G eneration C osts in 2014," IR EN A, January 2015.16. International Energy Agency, "W orld Energy O utlook 2015," IEA, Paris, 2015.

Running the model – Scenario DevelopmentImportant parameters and sensitivity
ØEnergy Access Target
ØDiesel Price
ØGrid cost of electricity
How many kWh will each household consume each year?
How is diesel price expected to fluctuate over the next years?
What will be the production cost of electricity for the national grid over the next years?

Monday, July 9, 2018
Running the model – Scenario DevelopmentEnergy Access Target
Access Level Tier 1 Tier 2 Tier 3 Tier 4 Tier 5
Indicative appliances powered
Task lighting + phone charging or radio
General lighting + fan + television
Tier 2 + medium power appliances (i.e. general food
processing, refrigeration)
Tier 3 + Medium or continuous appliances (i.e. water
heating, ironing, water pumping, rice cooking,
micro wave)
Tier 4 + High power and
continuous appliances (i.e. air
conditioning)
Consumption per capita & year (kWh)
7.7 43.8 160.6 423.4 598.6
Consumption per
urban household & year in Afghanistan
(based on average household size: 7)
54 307 1,124 2,964 4,190
Consumption per rural household & year in
Afghanistan
(based on average household size: 8.1)
62 355 1,301 3,430 4,849
Adapted from Global Tracking Framework, 2015
What should be the electricity consumption
level per household?

Monday, July 9, 2018
Running the model – Scenario DevelopmentDiesel Price
Low price High price
Based on exchange rate equal to 1 USD = 66.5 AFN
1 USD/liter (66.5 afn/liter) 0.69 USD/liter (45.9 afn/liter)

Monday, July 9, 2018
Running the model – Scenario DevelopmentGrid Cost – Current situation
Power System in Afghanistan Base year 2015
MW GW h (%) USD/kW hInvestment (USD/kW )
Imports 3500 76.2% 0.049 -
Turkmenistan up to 90 595.0 17.0% 0.028 -
Uzbekistan up to 300 1995.0 57.0% 0.060 -
Tajikistan up to 300 140.0 4.0% 0.035 -
Iran up to 150 770.0 22.0% 0.040 -
Indigenous Generation 1093 23.8% 0.104Hydro 254.0 711.9 65.1% 0.091 2200
Oil 199.6 131.1 12.0% 0.300 500
Gas 67.0 249.4 22.8% 0.037 1000Coal 0.0 0.0 0.0% 0.055 1500
Solar 0.1 0.3 0.0% 0.060 1953
Wind 0.0 0.0 0.0% 0.065 1750
Total 520.7 4592.8 100.0% 0.062 1722.01
What is the cost of electricity production at
the moment?
0.062 USD/kWh
1722 USD/kW
What is the estimated investment cost per kW

Monday, July 9, 2018
Running the model – Scenario DevelopmentGrid cost – Reference scenario according to government’s plans
What is the cost of electricity production at
the moment?
0.077 USD/kWh
1970 USD/kW
What is the estimated investment cost per kW
Power System in Afghanistan End year 2030 – Reference scenario
MW GW h (%) USD/kW hInvestment (USD/kW )
Imports 3500 24.3% 0.066 -
Turkmenistan up to 90 595.0 17.0% 0.038 -
Uzbekistan up to 300 1995.0 57.0% 0.081 -Tajikistan up to 300 140.0 4.0% 0.047 -
Iran up to 150 770.0 22.0% 0.054 -
Indigenous Generation 10898 75.7% 0.080
Hydro 2767.5 7757.8 71.2% 0.091 2230
Oil 66.0 43.4 0.4% 0.300 500Gas 267.0 994.0 9.1% 0.037 1000Coal 400.0 2102.4 19.3% 0.055 1500
Solar 0.1 0.3 0.0% 0.060 1130Wind 0.0 0.0 0.0% 0.065 1600Total 3500.6 14397.8 100.0% 0.077 1970.07

Running the model – Scenario DevelopmentGrid cost – Higher renewable energy penetration scenario
What is the cost of electricity production at
the moment?
0.075 USD/kWh
1989 USD/kW
What is the estimated investment cost per kW
Power System in Afghanistan End year 2030 - Renewables scenario
MW GW h (%) USD/kW hInvestment
(USD/kW )
Imports 3500 24.1% 0.066 -
Turkmenistan up to 90 595.0 17.0% 0.038 -
Uzbekistan up to 300 1995.0 57.0% 0.081 -
Tajikistan up to 300 140.0 4.0% 0.047 -
Iran up to 150 770.0 22.0% 0.054 -
Indigenous Generation 11028 75.9% 0.078
Hydro 2767.5 7757.8 71.2% 0.091 2230
Oil 0.0 0.0 0.0% 0.300 500Gas 267.0 994.0 9.1% 0.037 1000
Coal 400.0 2102.4 19.3% 0.055 1500
Solar 40.0 105.1 1.0% 0.060 1130Wind 26.0 68.3 0.6% 0.065 1600
Total 3500.6 14527.7 100.0% 0.075 1988.98
Monday, July 9, 2018
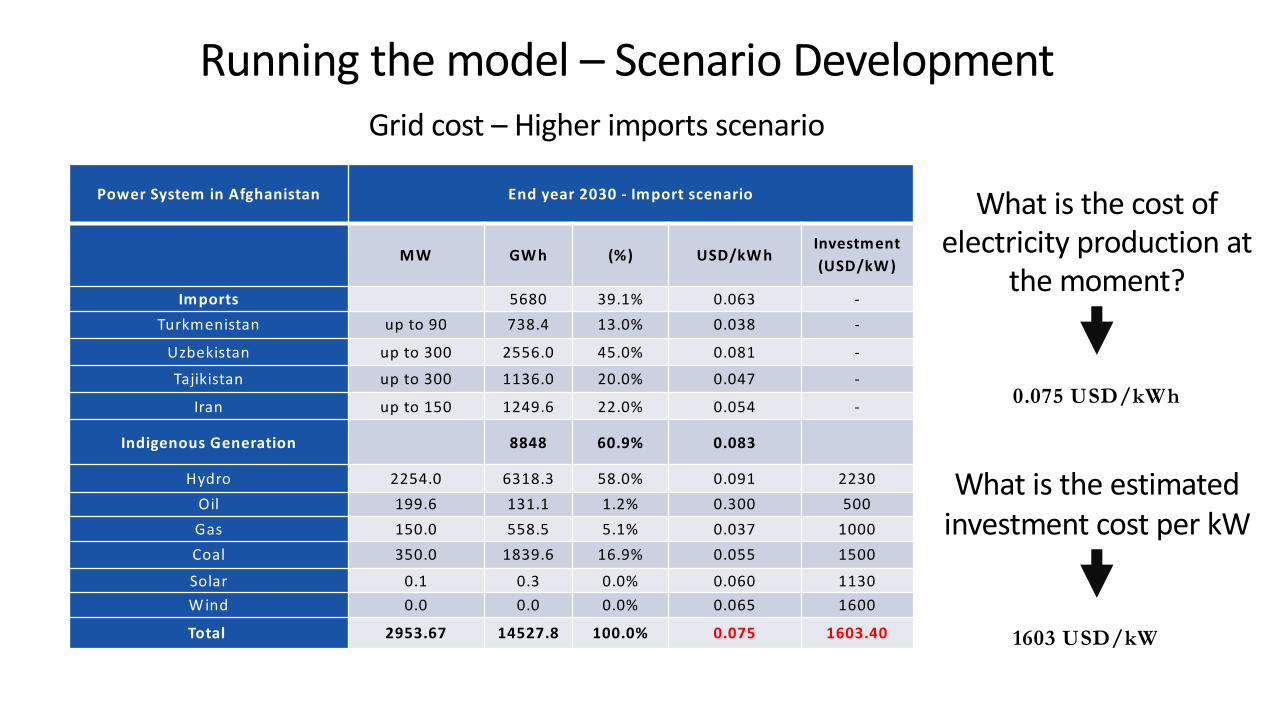
Running the model – Scenario DevelopmentGrid cost – Higher imports scenario
What is the cost of electricity production at
the moment?
0.075 USD/kWh
1603 USD/kW
What is the estimated investment cost per kW
Power System in Afghanistan End year 2030 - Import scenario
MW GW h (%) USD/kW hInvestment (USD/kW )
Imports 5680 39.1% 0.063 -Turkmenistan up to 90 738.4 13.0% 0.038 -
Uzbekistan up to 300 2556.0 45.0% 0.081 -
Tajikistan up to 300 1136.0 20.0% 0.047 -
Iran up to 150 1249.6 22.0% 0.054 -
Indigenous Generation 8848 60.9% 0.083
Hydro 2254.0 6318.3 58.0% 0.091 2230Oil 199.6 131.1 1.2% 0.300 500Gas 150.0 558.5 5.1% 0.037 1000Coal 350.0 1839.6 16.9% 0.055 1500
Solar 0.1 0.3 0.0% 0.060 1130Wind 0.0 0.0 0.0% 0.065 1600
Total 2953.67 14527.8 100.0% 0.075 1603.40

Monday, July 9, 2018
Running the model – Scenario DevelopmentImportant parameters and sensitivity
U5 - R3 U4 - R4 U4 - R2 U3 - R3 (2657 kWh/hh/year) (2964 kWh/hh/year) (1635 kWh/hh/year) (1124 kWh/hh/year)
LD - 0.69 $/L 0.062 0.062 0.062 0.062LD - 0.69 $/L 0.077 0.077 0.077 0.077LD - 0.69 $/L 0.075 RE 0.075 RE 0.075 RE 0.075 RELD - 0.69 $/L 0.075 IM 0.075 IM 0.075 IM 0.075 IMHD - 1.00 $/L 0.062 0.062 0.062 0.062HD - 1.00 $/L 0.077 0.077 0.077 0.077HD - 1.00 $/L 0.075 RE 0.075 RE 0.075 RE 0.075 REHD - 1.00 $/L 0.075 IM 0.075 IM 0.075 IM 0.075 IM
Scenarios
Electricity consumption level per household
Diesel price
RE: Refers to the scenario with increased penetration of renewable based technologies (solar – wind)IM: Refers to the scenario with increased imports from neighboring countries

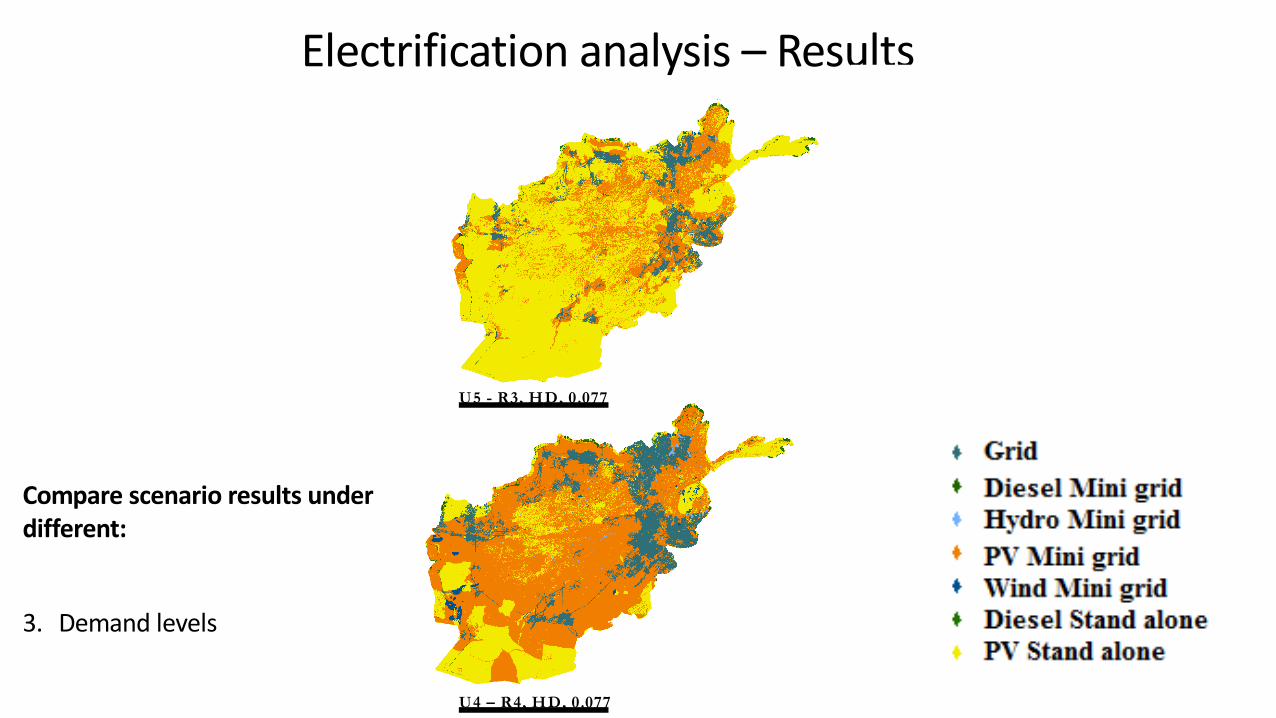
Electrification analysis – Results
U5 - R3, HD, 0.077
U4 – R4, HD, 0.077
U5 - R3, LD, 0.077U5 - R3, HD, 0.075IM
Compare scenario results under different:1. Diesel prices2. Grid electricity cost3. Demand levels

Electrification analysis – Results
U5 - R3, HD, 0.077
U4 – R4, HD, 0.077
U5 - R3, LD, 0.077U5 - R3, HD, 0.075IM
Compare scenario results under different:1. Diesel prices2. Grid electricity cost3. Demand levels
Electrification analysis – Results
U5 - R3, HD, 0.077
U4 – R4, HD, 0.077
U5 - R3, LD, 0.077 U5 - R3, HD, 0.075IM
Compare scenario results under different:1. Diesel prices2. Grid electricity cost3. Demand levels
0
5,000,000
10,000,000
15,000,000
20,000 ,00 0
25,000 ,00 0
30,000 ,00 0
35,000 ,00 0
U5 - R3, LD,0.077
U5 – R3, HD, 0.077
U5 – R3, HD, 0.075RE
U5 – R3, HD, 0.075IM
U4 – R4, HD, 0.077
U4 – R2, HD, 0.077
U3 – R3, HD, 0.077
U4 – R4, LD, 0.075RE
U3 – R3, LD, 0.075RE
U4 – R2, LD, 0.075IM
U4 – R2, HD, 0.075IM
U3 – R3, HD, 0.075IM
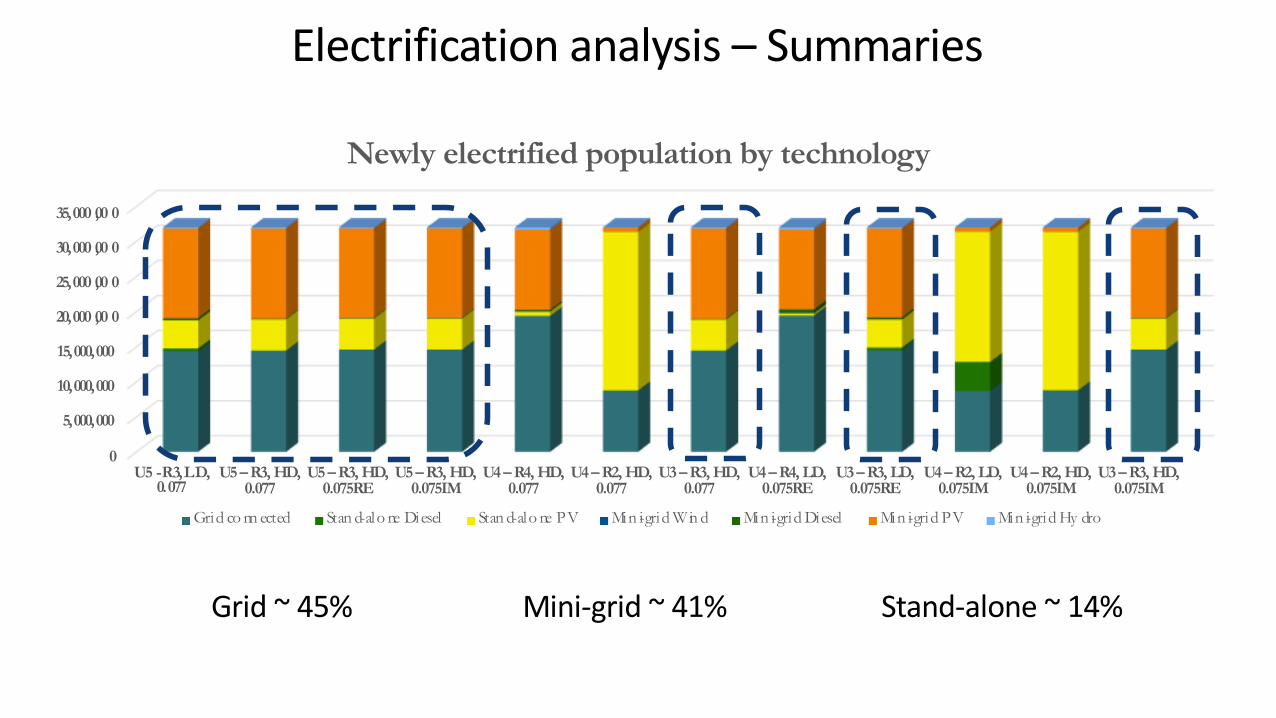
Newly electrified population by technology
Grid co nn ected Stan d-alo ne Diesel Stan d-alo ne PV Min i-grid Win d Min i-grid Diesel Min i-grid PV Min i-grid Hy dro
Electrification analysis – Summaries
Grid ~ 45% Mini-grid ~ 41% Stand-alone ~ 14%
0
5,000,000
10,000,000
15,000,000
20,000 ,00 0
25,000 ,00 0
30,000 ,00 0
35,000 ,00 0
U5 - R3, LD,0.077
U5 – R3, HD, 0.077
U5 – R3, HD, 0.075RE
U5 – R3, HD, 0.075IM
U4 – R4, HD, 0.077
U4 – R2, HD, 0.077
U3 – R3, HD, 0.077
U4 – R4, LD, 0.075RE
U3 – R3, LD, 0.075RE
U4 – R2, LD, 0.075IM
U4 – R2, HD, 0.075IM
U3 – R3, HD, 0.075IM
Newly electrified population by technology
Grid co nn ected Stan d-alo ne Diesel Stan d-alo ne PV Min i-grid Win d Min i-grid Diesel Min i-grid PV Min i-grid Hy dro
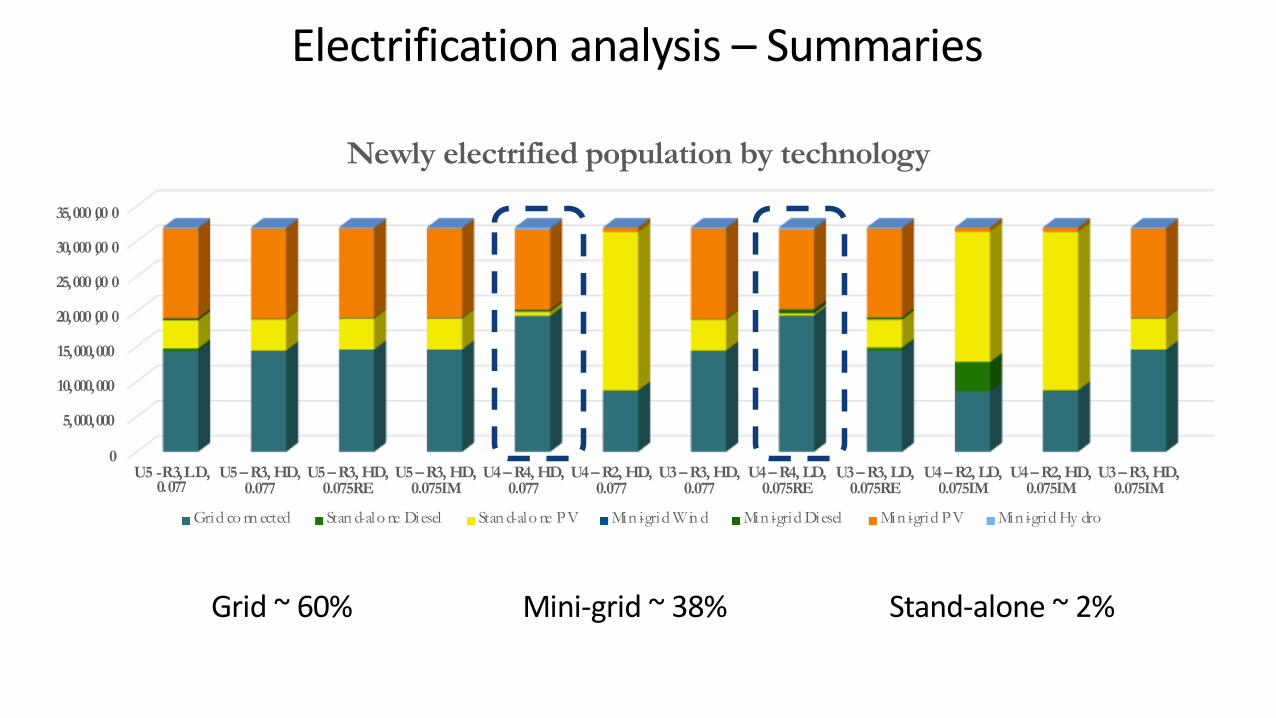
Electrification analysis – Summaries
Grid ~ 60% Mini-grid ~ 38% Stand-alone ~ 2%

0
5,000,000
10,000,000
15,000,000
20,000 ,00 0
25,000 ,00 0
30,000 ,00 0
35,000 ,00 0
U5 - R3, LD,0.077
U5 – R3, HD, 0.077
U5 – R3, HD, 0.075RE
U5 – R3, HD, 0.075IM
U4 – R4, HD, 0.077
U4 – R2, HD, 0.077
U3 – R3, HD, 0.077
U4 – R4, LD, 0.075RE
U3 – R3, LD, 0.075RE
U4 – R2, LD, 0.075IM
U4 – R2, HD, 0.075IM
U3 – R3, HD, 0.075IM
Newly electrified population by technology
Grid co nn ected Stan d-alo ne Diesel Stan d-alo ne PV Min i-grid Win d Min i-grid Diesel Min i-grid PV Min i-grid Hy dro
Electrification analysis – Summaries
Grid ~ 27% Mini-grid ~ 2% Stand-alone ~ 71%

0500
1 , 0001 , 5002, 0002, 5003, 0003, 5004, 0004, 5005, 000
U 5 - R 3, LD ,0. 077
U5 – R3, HD, 0.077
U5 – R3, HD,
0.075RE
U5 – R3, HD,
0.075IM
U4 – R4, HD, 0.077
U4 – R2, HD, 0.077
U3 – R3, HD, 0.077
U4 – R4, LD, 0.075RE
U3 – R3, LD, 0.075RE
U4 – R2, LD, 0.075IM
U4 – R2, HD,
0.075IM
U3 – R3, HD,
0.075IM
MW
New Capacity required per type of system
Grid Mini-g rids Stand-alone
0. 00
5. 00
10. 00
15. 00
20. 00
25. 00
30. 00
U 5 - R 3,L D, 0.0 77
U 5 – R 3, H D , 0.077
U 5 – R 3, H D ,
0.075R E
U 5 – R 3, H D ,
0.075IM
U 4 – R 4, H D , 0.077
U 4 – R 2, H D , 0.077
U 3 – R 3, H D , 0.077
U 4 – R 4, L D ,
0.075R E
U 3 – R 3, L D ,
0.075R E
U 4 – R 2, L D ,
0.075IM
U 4 – R 2, H D ,
0.075IM
U 3 – R 3, H D ,
0.075IM
Bil
lion
USD
Investment required per type of system
Grid Mini-grids Stand-alone
Electrification analysis – Summaries

Electrification analysis – U5 R3 LD 0.077
People to receive electricity by 2030:
31,999,487
Technology split out
Share (%) Capacity (MW)Investment
(billion USD)
Grid extension 44.9 1,225 9.84Mini grids 41.4 1,252 5.7
Diesel genset 0.8 12.8 0.052PV system 40.0 1,228 5.6Wind turbines 0.1 4.8 0.021
Mini – Small Hydro
0.5 6.6 0.055
Stand alone 13.7 383 2.1
Diesel genset 1.2 20.6 0.06PV systems 12.5 362.3 2.0
Total 100 2,860 17.58
Results per technology type

Monday, July 9, 2018
Electrification analysis – U5 R3 LD 0.077
People to receive electricity by 2030:
31,999,487
Technology split out
Share (%) Capacity (MW)Investment
(billion USD)
Grid extension 44.9 1,225 9.84Mini grids 41.4 1,252 5.7
Diesel genset 0.8 12.8 0.052PV system 40.0 1,228 5.6Wind turbines 0.1 4.8 0.021
Mini – Small Hydro
0.5 6.6 0.055
Stand alone 13.7 383 2.1
Diesel genset 1.2 20.6 0.06PV systems 12.5 362.3 2.0
Total 100 2,860 17.58
Lowest LCoE achieved per location

Monday, July 9, 2018
Electrification analysis – U5 R3 LD 0.077New capacity per location
Monday, July 9, 2018
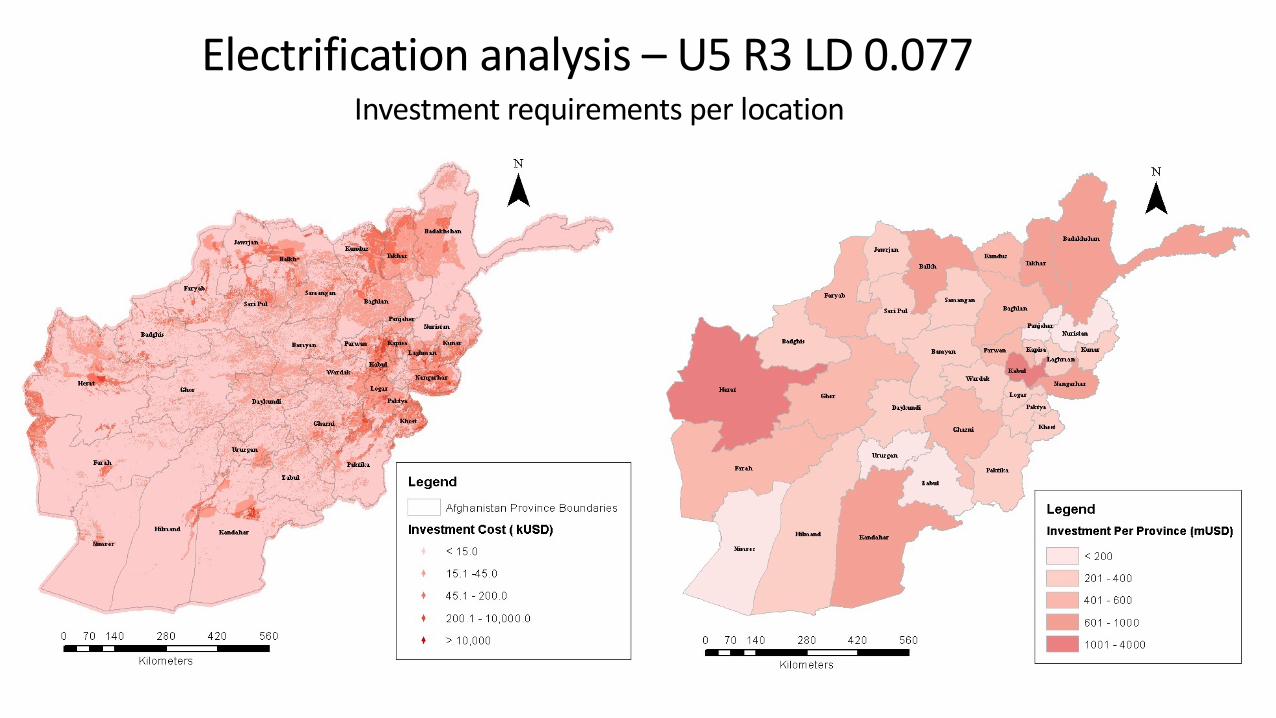
Electrification analysis – U5 R3 LD 0.077Investment requirements per location

By 2030…
Ø ~ 32 million Afghans will be getting access to modern, reliable and affordable electricity services.
Ø Grid extension is the least cost solution in densely populated areas which are close to the grid network
Ø Low diesel prices allows a small penetration (1-2%) of diesel gensets in the electrification mix. Increased diesel prices on the other hand, give a competitive advantage to solar PV systems.
Ø Other renewables (Wind, Hydro) penetrate in areas where these resources are available and signify decent potential.
Ø Higher electricity demand levels move the favorable electrification option from stand-alone systems to mini-grids to the grid.
Ø The investment requirements for full electrification can vary between 7.82 – 26.04 billion USD depending on target capital and O&M costs per technology, actualization of future plans etc.
Ø The share of renewable energy sources in total electricity generation can reach more than 60% by 2030.
Monday, July 9, 2018 33
Electrification Pathways for Afghanistan

Monday, July 9, 2018 33
Additional Slides

Electrification analysis – Summaries
0. 0500. 0
1000.01500.02000. 02500. 03000. 03500. 04000. 04500. 05000. 0
U 5 - R 3, LD ,0. 077
U5 – R3, HD, 0.077
U5 – R3, HD, 0.075RE
U5 – R3, HD, 0.075IM
U4 – R4, HD, 0.077
U4 – R2, HD, 0.077
U3 – R3, HD, 0.077
U4 – R4, LD, 0.075RE
U3 – R3, LD, 0.075RE
U4 – R2, LD, 0.075IM
U4 – R2, HD, 0.075IM
U3 – R3, HD, 0.075IM
New Capacity to be added per technology (in MW)
Grid co nnected Stand -alone Diesel Stand -alone PV Mini -grid Wind Mini -grid Diesel Mini -grid PV Mini -grid Hydro
0
5, 000
10, 000
15, 000
20, 000
25, 000
30, 000
U 5 - R 3, LD ,0. 077
U5 – R3, HD, 0.077
U5 – R3, HD, 0.075RE
U5 – R3, HD, 0.075IM
U4 – R4, HD, 0.077
U4 – R2, HD, 0.077
U3 – R3, HD, 0.077
U4 – R4, LD, 0.075RE
U3 – R3, LD, 0.075RE
U4 – R2, LD, 0.075IM
U4 – R2, HD, 0.075IM
U3 – R3, HD, 0.075IM
Mill
ion
USD
Investment requirements per technology
Grid co nnected Stand -alone Diesel Stand -alone PV Mini -grid Wind Mini -grid Diesel Mini -grid PV Mini -grid Hydro

Electrification analysis – Results
U5 - R3, HD, 0.077 U4 – R4, HD, 0.077U5 - R3, LD, 0.077
U5 - R3, HD, 0.075RE U5 - R3, HD, 0.075IM U4 – R4, LD, 0.075RE
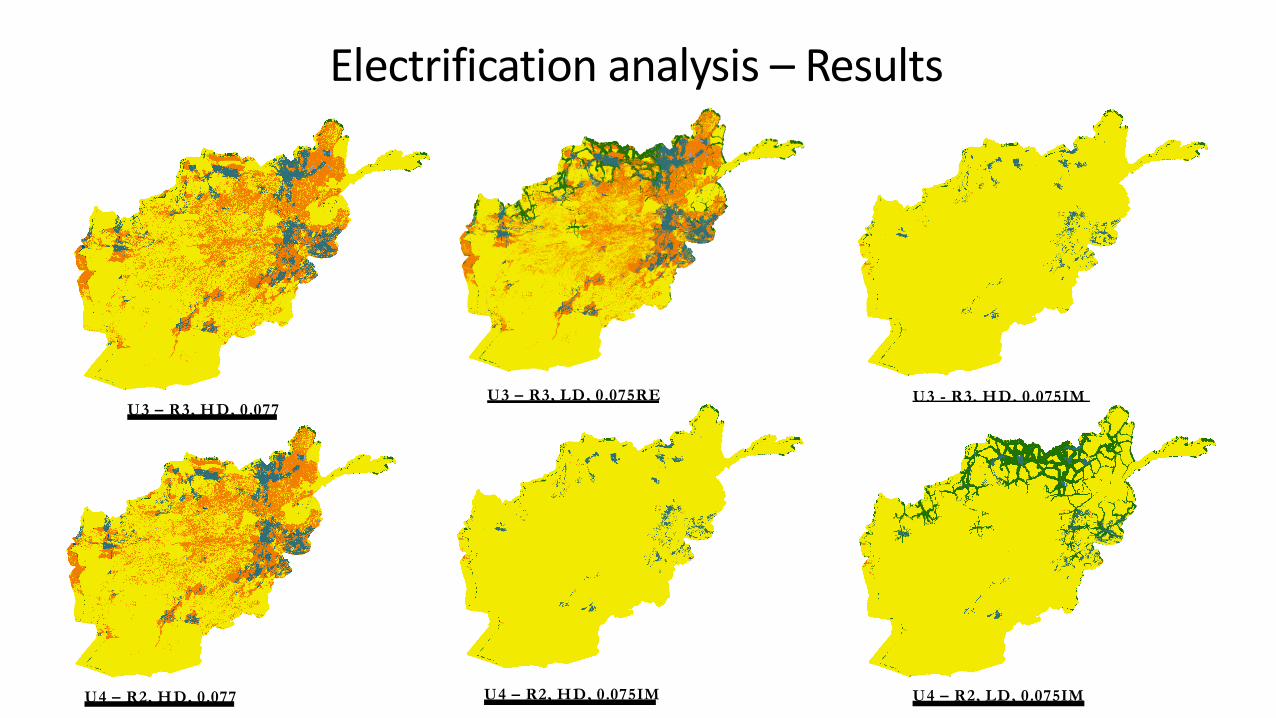
Electrification analysis – Results
U3 - R3, HD, 0.075IM U3 – R3, LD, 0.075REU3 – R3, HD, 0.077
U4 – R2, HD, 0.077 U4 – R2, HD, 0.075IM U4 – R2, LD, 0.075IM

0
5, 000,00010,000, 000
15,000, 00020, 000,000
25, 000,00030, 000,000
35, 000,00040, 000,000
45, 000,000
U 5 - R 3, LD ,0. 077
U5 – R3, HD, 0.077
U5 – R3, HD, 0.075RE
U5 – R3, HD, 0.075IM
U4 – R4, HD, 0.077
U4 – R2, HD, 0.077
U3 – R3, HD, 0.077
U4 – R4, LD, 0.075RE
U3 – R3, LD, 0.075RE
U4 – R2, LD, 0.075IM
U4 – R2, HD, 0.075IM
U3 – R3, HD, 0.075IM
Total population electrified by technology
Grid co nnected Stand -alone Diesel Stand -alone PV Mini -grid Wind Mini -grid Diesel Mini -grid PV Mini -grid Hydro
0
5, 000,000
10,000, 000
15,000, 000
20, 000,000
25, 000,000
30, 000,000
35, 000,000
U 5 - R 3, LD ,0. 077
U5 – R3, HD, 0.077
U5 – R3, HD, 0.075RE
U5 – R3, HD, 0.075IM
U4 – R4, HD, 0.077
U4 – R2, HD, 0.077
U3 – R3, HD, 0.077
U4 – R4, LD, 0.075RE
U3 – R3, LD, 0.075RE
U4 – R2, LD, 0.075IM
U4 – R2, HD, 0.075IM
U3 – R3, HD, 0.075IM
Newly electrified population by technology
Grid co nnected Stand -alone Diesel Stand -alone PV Mini -grid Wind Mini -grid Diesel Mini -grid PV Mini -grid Hydro
Electrification analysis – Summaries