A geophysical study of the southern continental margin of Australia: Great Australian Bight and...
16
Geological Society of America Bulletin doi: 10.1130/0016-7606(1977)88<1000:AGSOTS>2.0.CO;2 1977;88, no. 7;1000-1014 Geological Society of America Bulletin MICHAEL KÖNIG and MANIK TALWANI Australian Bight and western sections A geophysical study of the southern continental margin of Australia: Great Email alerting services cite this article to receive free e-mail alerts when new articles www.gsapubs.org/cgi/alerts click Subscribe America Bulletin to subscribe to Geological Society of www.gsapubs.org/subscriptions/ click Permission request to contact GSA http://www.geosociety.org/pubs/copyrt.htm#gsa click viewpoint. Opinions presented in this publication do not reflect official positions of the Society. positions by scientists worldwide, regardless of their race, citizenship, gender, religion, or political article's full citation. GSA provides this and other forums for the presentation of diverse opinions and articles on their own or their organization's Web site providing the posting includes a reference to the science. This file may not be posted to any Web site, but authors may post the abstracts only of their unlimited copies of items in GSA's journals for noncommercial use in classrooms to further education and to use a single figure, a single table, and/or a brief paragraph of text in subsequent works and to make GSA, employment. Individual scientists are hereby granted permission, without fees or further requests to Copyright not claimed on content prepared wholly by U.S. government employees within scope of their Notes Geological Society of America on September 3, 2014 gsabulletin.gsapubs.org Downloaded from on September 3, 2014 gsabulletin.gsapubs.org Downloaded from
Transcript of A geophysical study of the southern continental margin of Australia: Great Australian Bight and...

Geological Society of America Bulletin
doi: 10.1130/0016-7606(1977)88<1000:AGSOTS>2.0.CO;2 1977;88, no. 7;1000-1014Geological Society of America Bulletin
MICHAEL KÖNIG and MANIK TALWANI Australian Bight and western sectionsA geophysical study of the southern continental margin of Australia: Great
Email alerting servicescite this article
to receive free e-mail alerts when new articleswww.gsapubs.org/cgi/alertsclick
SubscribeAmerica Bulletin
to subscribe to Geological Society ofwww.gsapubs.org/subscriptions/click
Permission request to contact GSAhttp://www.geosociety.org/pubs/copyrt.htm#gsaclick
viewpoint. Opinions presented in this publication do not reflect official positions of the Society.positions by scientists worldwide, regardless of their race, citizenship, gender, religion, or politicalarticle's full citation. GSA provides this and other forums for the presentation of diverse opinions and articles on their own or their organization's Web site providing the posting includes a reference to thescience. This file may not be posted to any Web site, but authors may post the abstracts only of their unlimited copies of items in GSA's journals for noncommercial use in classrooms to further education andto use a single figure, a single table, and/or a brief paragraph of text in subsequent works and to make
GSA,employment. Individual scientists are hereby granted permission, without fees or further requests to Copyright not claimed on content prepared wholly by U.S. government employees within scope of their
Notes
Geological Society of America
on September 3, 2014gsabulletin.gsapubs.orgDownloaded from on September 3, 2014gsabulletin.gsapubs.orgDownloaded from

A geophysical study of the southern continental margin of Australia: Great Australian Bight and western sections
MICHAEL KÖNIG 1 Lamont-Doherty Geological Observatory of Columbia University, Palisades, New York 10964 and MANIK TALWANI J Department of Geological Sciences, Columbia University, New York, New York 10027
ABSTRACT
Marine gravity, magnetic, bathymetric, and seismic reflection and refraction measurements, most of them made aboard U.S.N.S. Eltanin, were used to study the western and central sections of the southern continental margin of Australia. The data are presented as profiles across the margin.
A magnetic quiet zone extends from west of Tasmania to the western border of the Great Australian Bight. In the Great Austra-lian Bight area, the seaward quiet-zone boundary parallels the old-est marine magnetic lineation south of Australia, anomaly 22. An isostatic gravity high very nearly coincides with this isochron. There are no corresponding anomalous topographic features, but seismic profiler records generally show basement peaks occurring in the vicinity and seaward of anomaly 22. A conspicuous magnetic low is located near the landward boundary of the quiet zone; it separates the subdued signature of the magnetic quiet zone proper from high-amplitude, short-wavelength magnetic anomalies of shallow origin on its continentward side. It is associated with an isostatic gravity high and a significant topographic break of the continental slope. Most seismic profiler records show probable shallow basement corresponding to the rough magnetic signature landward of the prominent magnetic low. Seismic profiler and lim-ited refraction data indicate greater depths to basement underlying the magnetic quiet zone than on either side.
To the west of the Great Australian Bight, the magnetic linea-tions older than anomaly 19 are not well defined. The prominent magnetic low is continuous along the western and central margin, as are the isostatic gravity high and the topographic break in the slope associated with it. The area immediately seaward of the magnetic low is occupied by irregular, noncorrelatable magnetic anomalies. Available seismic data indicate a greater thickness of sediments for this zone than for the adjacent seaward area.
We have examined several magnetics and gravity models to ex-plain the geophysical anomalies of the Great Australian Bight area. One possible model assumes that non-oceanic subsided basement underlies the magnetic quiet zone, that the seaward quiet-zone boundary marks the juxtaposition of shallow oceanic and deeper non-oceanic basement, and the landward boundary represents a structural discontinuity, probably a normal fault, within continental-type basement. In this model, the basement subsidence of the magnetic quiet zone is isostatically compensated by a lateral change in density. It is not possible to eliminate all other models for the origin of the area occupied by the magnetic quiet zone.
INTRODUCTION
Several recent studies of continental margins have demonstrated the existence of marginal magnetic quiet zones and distinct patterns of geophysical anomalies associated with them (Talwani and
Eldholm, 1972, 1973; Luyendyk and Bunce, 1973; Rabinowitz, 1974). These anomalies frequently show a persistent relation to geological structure and sedimentary deposits. Despite a certain degree of similarity between the geophysical anomalies of different margins, no generally applicable scheme has yet emerged to explain the formation of passive continental margins.
The southern continental margin of Australia appears to be par-ticularly suited for geological and geophysical investigations for several reasons. It is a young margin which resulted from the breakup of Antarctica and Australia; oceanic crust between the continents began to form in the Paleocene, but the onset of rifting occurred long before that time (Weissel and Hayes, 1972), proba-bly in the Upper Cretaceous (Deighton and others, 1976). Because of its youthfulness, structural details would be expected to be well preserved and to manifest themselves as geophysical anomalies. Any anomaly pattern on the margin off southern Australia should be matched by similar features on the opposing Antarctic continen-tal margin, thus providing constraints for the construction of models of continental separation. Furthermore, enough geophysi-cal data have recently been gathered in this area to make useful investigations feasible.
Previous reports on the southern continental margin of Australia were either based on few widely spaced ships' tracks or, for the most part, they only emphasized marine geological data. Conolly and von der Borch (1967) presented an account of the sedimenta-tion and physiography of the sea floor in this area; von der Borch (1967) studied two marginal plateaus in greater detail. A section of the margin to the southeast of the area considered in this paper was studied by von der Borch and others (1970), and an investigation of the continental margin of the Great Australian Bight (Conolly and others, 1970) concentrated on seismic-reflection data but included gravity- and magnetic-anomaly profiles as well as aeromagnetic data collected by petroleum exploration companies. In a recent study of the southern margin of Australia, Boeuf and Doust (1975) examined marine seismic-exploration data. Hawkins and others (1965) reported the results of two-ship seismic refraction work done to the southwest of Kangaroo Island and off the south coast of the extreme southwestern margin of Australia.
Geological, geophysical, and oceanographic data have been gathered systematically by U.S.N.S. Eltanin in the Southeast Indian Ocean from mid-1968 to late 1972. Tracks are oriented mostly north-south and spaced at intervals of 5° longitude or less. Part of these and additional data from Lamont-Doherty ships have been published previously by Hayes and Conolly (1972), Houtz and Markl (1972), and Weissel and Hayes (1971, 1972, 1974). The Commonwealth Bureau of Mineral Resources, Geology and Geophysics recently (1973) completed a geophysical survey of the Australian continental margin which included part of the area con-sidered in this paper. Data and reports of that survey are presently being published.
Geological Society of America Bulletin, v. 88, p. 1 0 0 0 - 1 0 1 4 , 8 figs., July 1977, Doc. no. 70709.
1000
on September 3, 2014gsabulletin.gsapubs.orgDownloaded from
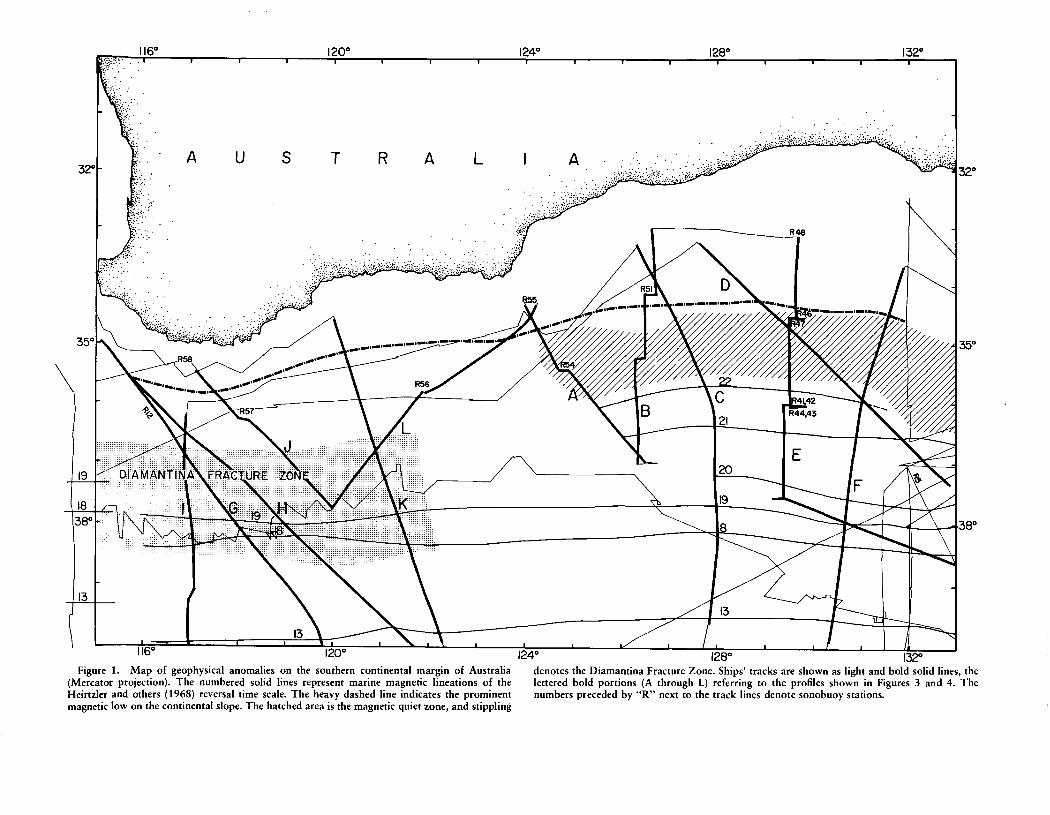
Figure 1. Map of geophysical anomalies on the southern continental margin of Australia (Mercator projection). The numbered solid lines represent marine magnetic lineations of the Heirtzler and others (1968) reversal time scale. The heavy dashed line indicates the prominent magnetic low on the continental slope. The hatched area is the magnetic quiet zone, and stippling
P 128° 132° denotes the Diamantina Fracture Zone. Ships' tracks are shown as light and bold solid lines, the lettered bold portions (A through L) referring to the profiles shown in Figures 3 and 4. The numbers preceded by "R" next to the track lines denote sonobuoy stations.
on September 3, 2014gsabulletin.gsapubs.orgDownloaded from

1 0 0 2 KÖNIG AND TALWANI
1 1 6 *
PERTH BASIN
31
W / / / / / / / / A
GAWLER BLOCK I l\ A A A A A AAj 1 k A A * * A * A|
1 0
EUCLA BASIN
1 8 - 1 — i — i -
1 7 — f —
16-rr i r - rr —i—i—i—i
1 4
13 IO 200 — Ifc 1000—
Figure 2. Generalized tectonic map of southwestern and south-central Australia (Lambert conformal conic projection); modified from "Tectonic Map of Australia and New Guinea," scale 1:5,300,000, 1971 edition, published by the Geological Society of Australia, Sydney. The index map shows the location of the map area. Legend: 1 = late Precambrian rocks (1 Ga to 700 Ma, or 700 Ma to beginning middle Cambrian?)1; 2 = Naturaliste Block crystalline rocks (granulites, 670 Ma); 3 = Mesozoic platform cover (Permian to Triassic; Jurassic to mid-Cretaceous); 4 = Mesozoic-Cenozoic platform cover (Permian to Triassic; Jurassic to mid-Cretaceous; mid-Cretaceous to Miocene; Miocene to Holocene); 5 = Western Australian shield crystalline rocks [undifferentiated granite and gneiss, high- and low-grade metasedimentary rocks; Archean-Proterozoic (>2.8 to 2.2 Ga)]; 6 = Albany-Fraser
1 1 Ga = 1 gigayear = 109 yr; 1 Ma = 1 megayear = 10" yr.
This study is based primarily on the available Eltanin and other Lamont-Doherty data. Figure 1 shows the area studied and the tracks along which data were collected. Seismic refraction (sonobuoy) stations are indicated by numbers preceded by "R." In general, gravity, magnetics, topography, and seismic-reflection (profiler) data were obtained along the tracks shown.
GEOLOGIC SETTING
Australia is one of the most stable of the continents. Its average elevation is less than 300 m, it posseses no active volcanoes (David, 1950), and large earthquakes are rare (Jaeger and Browne, 1958). Periods of major diastrophism were restricted to pre-Mesozoic
time, and the rocks affected by them occur in elongate orogenic belts occupying the eastern third of the continent (Weeks and Hop-kins, 1967).
The area of study (Fig. 2) is located to the west of the area occupied by these mobile belts. Physiographically, the entire region is a vast expanse of low-lying arid country whose nucleus is the Western Australian Precambrian shield. It is bounded by faults to the west and gently downwarped to the east, with younger sedimentary rocks occupying both marginal depressions.
Four major structural units make up the area under considera-tion; they are the Perth Basin in the extreme west, the Yilgarn Block east of it, the Eucla Basin landward of the Great Australian Bight, and the Gawler Block adjoining the Eucla Basin to the east (Fig. 2).
on September 3, 2014gsabulletin.gsapubs.orgDownloaded from
SOUTHERN CONTINENTAL MARGIN OF AUSTRALIA
1 2 8 ° 1 3 2 °
1003
110° 120° 130° 140° 150° 160°
crystalline rocks (granulites, 1.4 to 1.2 Ga; granite, 1.2 to 1 Ga); 7 = Paleozoic platform cover (Permian); 8 and 9 = Mesozoic-Cenozoic platform cover (Jurassic to mid-Cretaceous; mid-Cretaceous to Miocene); 10 = Precambrian metamorphic rocks (metasediments, 1.9 to 1.6 Ga); 11 = Precambrian igneous rocks (mainly felsic extrusives, 1.6 to 1.4 Ga); 12 = bathymetric contours, depth in meters; 13 = geological and tectonic boundary; 14 = fault, type unknown (dashed where approximate); 15 = high-angle fault, normal or reverse (dashed where approximate); ticks denote downthrown block; 16 = flexure, concealed by younger platform cover; teeth denote downwarped side; 17 = anticline, inferred; 18 = main structural trends in crystalline rocks.
Perth Basin
The Perth Basin is a long, narrow trough of sedimentary rocks extending from the south coast northward; it is bounded on the east by the Darling Fault, one of the major structural features of the Earth's crust. The sedimentary sequence rests unconformably on crystalline Archean basement and includes rocks of Proterozoic and Phanerozoic (Permian and younger) age (Brown and others, 1968).
Yilgarn Block
The Yilgarn Block is the nucleus of the "Western Australian shield and for the most part consists of Archean high-grade metamorphic
rocks. Locally small intracratonic basins contain younger sedimen-tary beds (McWhae and others, 1958). Seaward of the crystalline shield, the continental shelf is narrow and studded with islands, and the continental slope is steep (Conolly and others, 1970).
Eucla Basin
The Eucla Basin is a broad, shallow embayment in Precambrian shield rocks (Archean metamorphic rocks and Proterozoic sedimentary beds). It contains Tertiary sedimentary strata overly-ing Cretaceous basal terrigenous and marine deposits (Glaessner and Parkin, 1958). The sedimentary sequence is undeformed and does not exceed 600 m in thickness. It extends seaward to form the bulk of the continental slope and rise (Conolly and others, 1970).
on September 3, 2014gsabulletin.gsapubs.orgDownloaded from

MAGNETIC ANOMALIES
ISOSTATIC GRAVITY ANOMALES
22 i
F EL 3 5 -
1 -4000
0 5 0 100
FREE-AIR GRAVITY ANOMALIES
22
F EL35-
E EL53
Q VI8I2
C EL35
B EL53
A EL53
lOO-i
5 0 - g
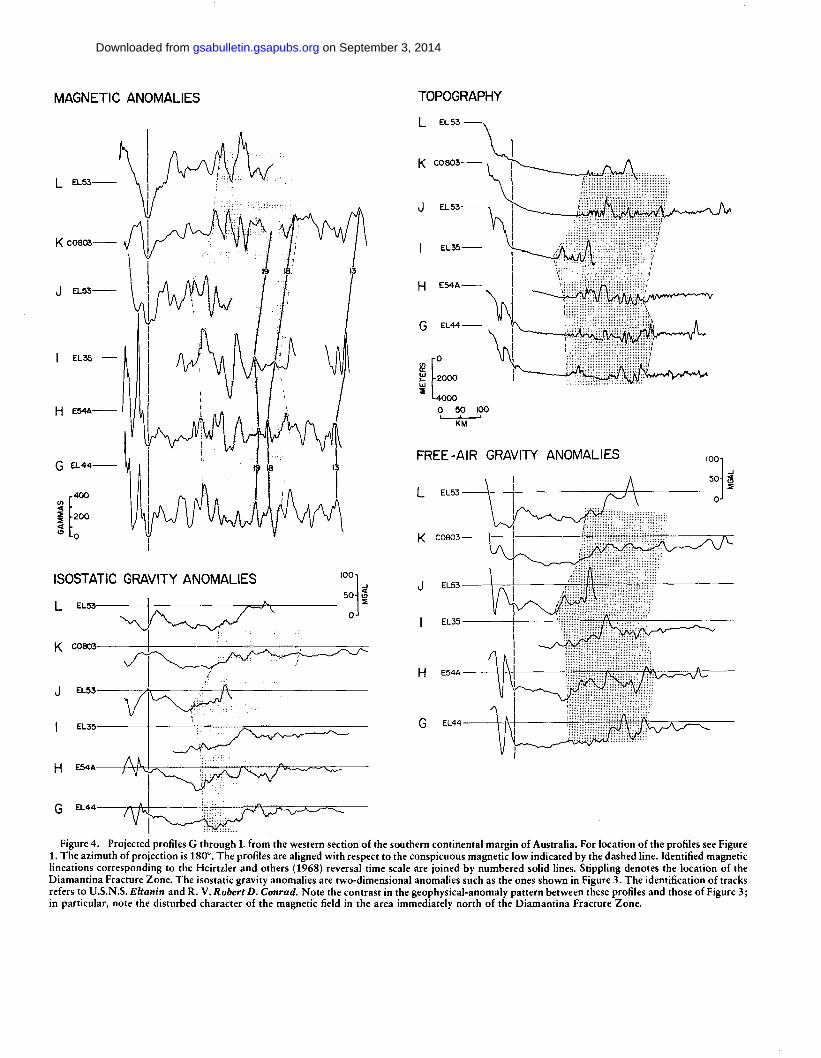
0-Figure 3. Projected profiles A through F from the Great Australian Bight area. For location of profiles see Figure 1. The azimuth of projection is 180°.
The profiles are aligned with respect to anomaly 22 shown as a numbered solid line. The location of the conspicuous magnetic low is indicated by the dashed line. Correlated marine magnetic anomalies are joined by numbered solid lines; the numbers refer to the Heirtzler and others (1968) time scale of magnetic reversals. The isostatic gravity anomalies shown are two-dimensional anomalies based on the Airy-Heiskanen scheme of isostatic compensation (see text for further details). The dotted curve of profile A represents the isostatic gravity anomaly by assuming a Pratt isostatic-compensation model. The identification of tracks refers to U.S.N.S. Eltanin and R. V. Vema. Note the change in magnetic character just landward of anomaly 22, which characterizes the magnetic quiet zone, and the correlation of the different geophysical anomalies with the quiet-zone boundaries.
on September 3, 2014gsabulletin.gsapubs.orgDownloaded from
MAGNETIC ANOMALIES
|_ EL53
K C08CS
J EL 53
ISOSTATIC GRAVITY ANOMALIES
L EL53-
100-1
TOPOGRAPHY
L EL 53
K CO 803
J EL 53
I EL35
0
-2000
L 4 0 0 0 0 50 100
KM
FREE-AIR GRAVITY ANOMALIES
L EL53
K C0803
J EL53
I EL35
H E54A
G EL44
K C0803
J EL53
EL35
H E54A
EL44
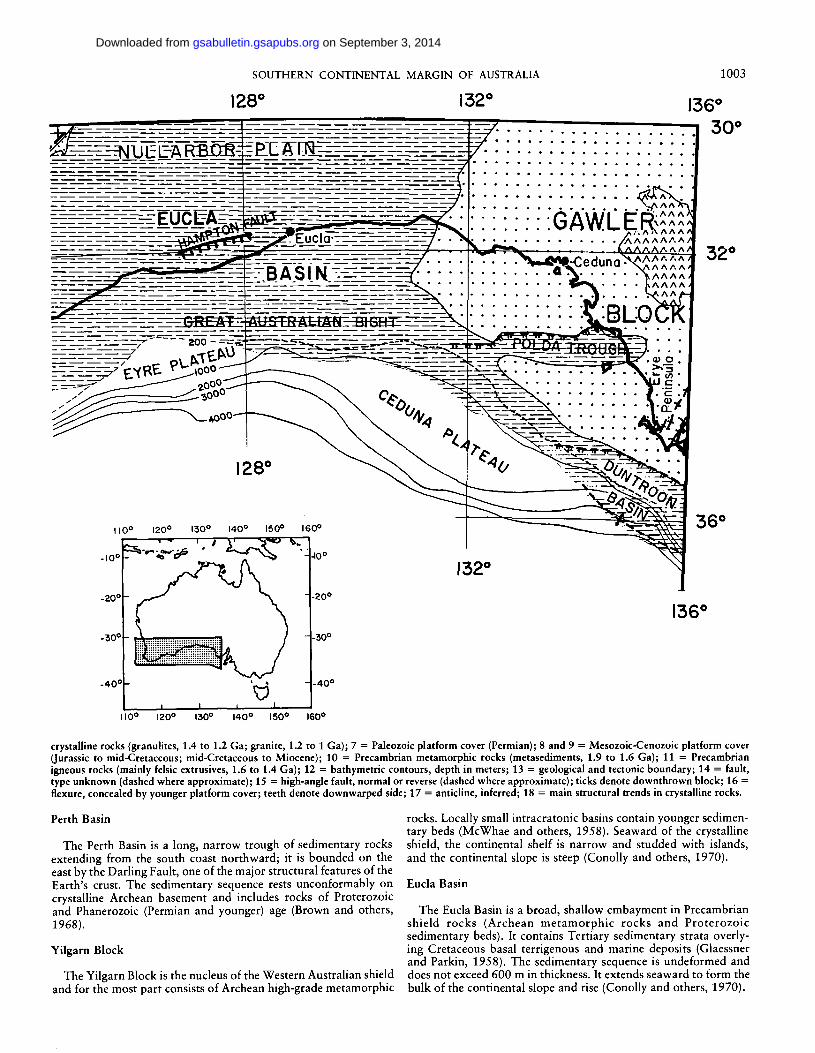
Figure 4. Projected profiles G through L from the western section of the southern continental margin of Australia. For location of the profiles see Figure 1. The azimuth of projection is 180°. The profiles are aligned with respect to the conspicuous magnetic low indicated by the dashed line. Identified magnetic lineations corresponding to the Heirtzler and others (1968) reversal time scale are joined by numbered solid lines. Stippling denotes the location of the Diamantina Fracture Zone. The isostatic gravity anomalies are two-dimensional anomalies such as the ones shown in Figure 3. The identification of tracks refers to U.S.N.S. Eltanin and R. V. Robert D. Conrad. Note the contrast in the geophysical-anomaly pattern between these profiles and those of Figure 3; in particular, note the disturbed character of the magnetic field in the area immediately north of the Diamantina Fracture Zone.
on September 3, 2014gsabulletin.gsapubs.orgDownloaded from

1006 KÖNIG AND TALWANI
Gawler Block PRESENTATION OF DATA
The Gawler Block constitutes the stable platform west of the Adelaide mobile belt ("Adelaide Gcosyncline") and is part of the Australian shield. It consists of intrusive and extrusive igneous rocks and of Proterozoic metamorphic rocks as much as 10 km thick (Brown and others, 1968). Pleistocene and Holocene sedi-ments extensively cover these basement rocks.
The Polda Trough and the Duntroon Basin are partially fault bounded depressions in crystalline basement that reach several kilometers in depth and contain sedimentary sequences of upper Mesozoic—Tertiary age (Smith and Kamerling, 1969). The basal deposits are terrigenous sedimentary rocks.
The data presented in Figures 3 and 4 consist of topography, magnetics, and gravity profiles. The magnetic anomalies are total-intensity data with either Cain and others' (1964) or the Interna-tional Geomagnetic Reference Field (IGRF) of Cain and others (1968) removed. The gravity data are free-air and " two-dimensional isostatic" anomalies of the Airy type (T = 30 km). For the computation of the isostatic anomalies, the effects of topog-raphy (2.60 — 1.03 g/cm3 = 1.57 g/cm3) and compensation (3.10 — 2.60 g/cm3 = 0.50 g/cm3) were computed with a two-dimensional approximation. While it is usually assumed that an Airy-type com-pensation is valid for the continental margin, this assumption has
Figure 5. Seismic profiler section (bottom) in relation to magnetic and isostatic gravity anomalies (top) of profile B. Local time is indicated above the profiler section together with the location of two sonobuoy stations. One hour of steaming approximately equals a distance of 9.6 nautical miles (17.8 km) on the average. Each vertical partition of the profiler record denotes 1 s of two-way reflection time corresponding to about 750 m of water depth. Identified magnetic anomalies are numbered; the relation between gravity and magnetic anomalies at the quiet-zone boundaries is indicated by vertical solid (isochron 22) and dashed (magnetic low) lines. The faint dashed curve rising toward anomaly 22 from the magnetic low represents the idealized smooth magnetic signature of the quiet zone (see text for discussion). Note the first appearance of oceanic basement peaks between the 3-h and 4-h marks and the presence of a rough reflector, probably representing basement, between approximately 9h00 and 13h30 (2 June).
on September 3, 2014gsabulletin.gsapubs.orgDownloaded from
SOUTHERN CONTINENTAL MARGIN OF AUSTRALIA 1007
not been substantiated because of the generally poor seismic data in margin areas. However, we have satisfied ourselves that the as-sumption of a Pratt-type equilibrium does not, in this area, sub-stantially alter the isostatic-anomaly curve (see dotted curve in Fig. 3, profile A). Hence, regardless of the exact nature and details of the isostatic balance, it is valid in the analysis of gravity data to use the approximate Airy type of curves for the computation of iso-static gravity anomalies.
At the continental margin off southern Australia, a magnetic quiet zone extends from west of Tasmania to the western border of the Great Australian Bight (Weissel and Hayes, 1972). Although the magnetic field is not entirely smooth within it, the quiet zone is indicated on all profiles of Figure 3 by a prominent change in magnetic character. On its seaward side, the marine magnetic-anomaly sequence is well defined; the anomalies have previously been identified and analyzed by Weissel and Hayes (1971). In the Great Australian Bight area, the oldest magnetic lineation (anom-aly 22 of the reversal time scale of Heirtzler and others, 1968) is situated at the seaward boundary of the magnetic quiet zone (Fig. 1). This isochron, as well as the younger magnetic anomalies, trends in a direction parallel to the seaward quiet-zone boundary which runs approximately east-west. An isostatic gravity high very nearly coincides with anomaly 22 (Fig. 3); despite variations in amplitude along its trend, it can be clearly recognized in the Great Australian Bight. Although anomaly 22 is consistently located at the foot of the continental rise, there is no anomalous topographic feature associated with it. Seismic-profiler records show, however, that oceanic basement peaks blanketed by sediments are generally situated in the vicinity of anomaly 22. Whereas basement is not visible in the magnetic quiet zone itself, basement peaks gradually rise to form the sea floor farther seaward of the quiet zone. This is demonstrated in Figure 5 which shows isostatic-gravity and magnetic-anomaly profiles in relation to the corresponding seismic-profiler section.
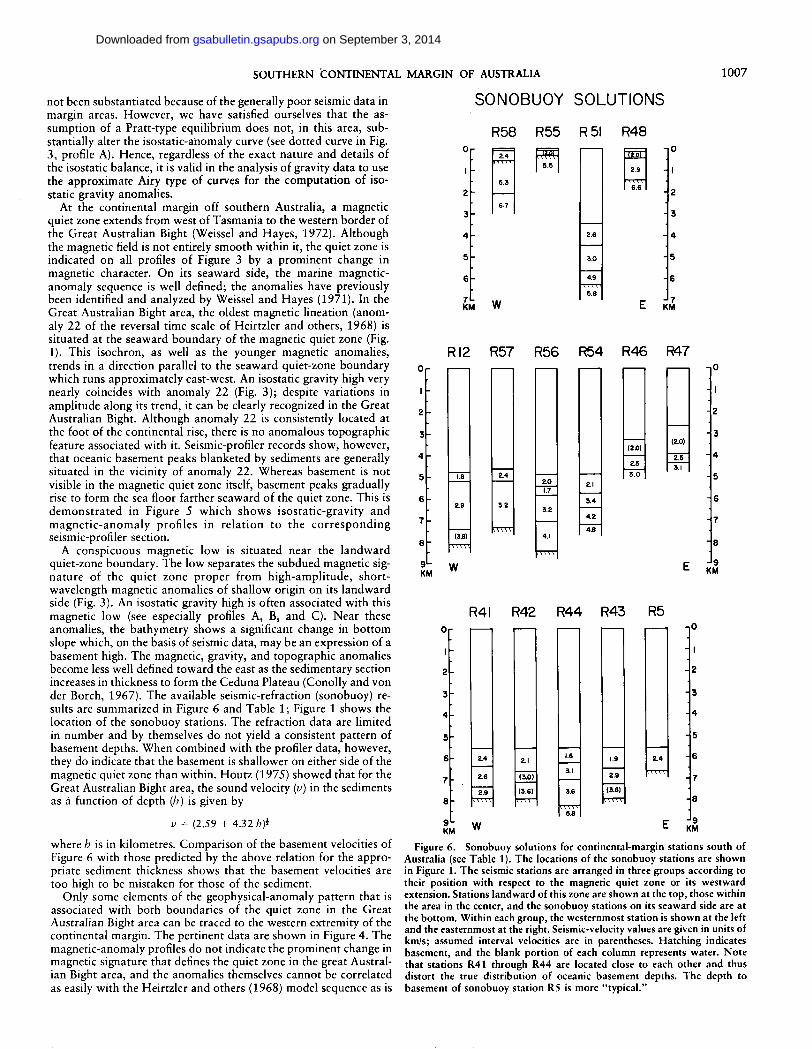
A conspicuous magnetic low is situated near the landward quiet-zone boundary. The low separates the subdued magnetic sig-nature of the quiet zone proper from high-amplitude, short-wavelength magnetic anomalies of shallow origin on its landward side (Fig. 3). An isostatic gravity high is often associated with this magnetic low (see especially profiles A, B, and C). Near these anomalies, the bathymetry shows a significant change in bottom slope which, on the basis of seismic data, may be an expression of a basement high. The magnetic, gravity, and topographic anomalies become less well defined toward the east as the sedimentary section increases in thickness to form the Ceduna Plateau (Conolly and von der Borch, 1967). The available seismic-refraction (sonobuoy) re-sults are summarized in Figure 6 and Table 1; Figure 1 shows the location of the sonobuoy stations. The refraction data are limited in number and by themselves do not yield a consistent pattern of basement depths. When combined with the profiler data, however, they do indicate that the basement is shallower on either side of the magnetic quiet zone than within. Houtz (1975) showed that for the Great Australian Bight area, the sound velocity (v) in the sediments as a function of depth (b) is given by
v = (2.59 + 4.32 h)i
where h is in kilometres. Comparison of the basement velocities of Figure 6 with those predicted by the above relation for the appro-priate sediment thickness shows that the basement velocities are too high to be mistaken for those of the sediment.
Only some elements of the geophysical-anomaly pattern that is associated with both boundaries of the quiet zone in the Great Australian Bight area can be traced to the western extremity of the continental margin. The pertinent data are shown in Figure 4. The magnetic-anomaly profiles do not indicate the prominent change in magnetic signature that defines the quiet zone in the great Austral-ian Bight area, and the anomalies themselves cannot be correlated as easily with the Heirtzler and others (1968) model sequence as is
SONOBUOY SOLUTIONS
R58 R55 R 51 R48
7 l -KM W
4.9 TTTT
5.6
mz
J 7 KM
R12 R57 R56 R54 R46 R47
9 U
KM
(3.8) TTTT
4.1
TTTT
(2.0) (2j0)
(2.0)
2.5 2.3
2.5 3.1
3.0 3.1
w J 9 KM
R4I R42 R44 R43 R5
9 KM
2.9 TTTT
2.1
(IOÌ (3.6) tTTT
(3.6) rOTT
w 9 KM
Figure 6. Sonobuoy solutions for continental-margin stations south of Australia (see Table 1). The locations of the sonobuoy stations are shown in Figure 1. The seismic stations are arranged in three groups according to their position with respect to the magnetic quiet zone or its westward extension. Stations landward of this zone are shown at the top, those within the area in the center, and the sonobuoy stations on its seaward side are at the bottom. Within each group, the westernmost station is shown at the left and the easternmost at the right. Seismic-velocity values are given in units of km/s; assumed interval velocities are in parentheses. Hatching indicates basement, and the blank portion of each column represents water. Note that stations R41 through R44 are located close to each other and thus distort the true distribution of oceanic basement depths. The depth to basement of sonobuoy station R5 is more "typical."
on September 3, 2014gsabulletin.gsapubs.orgDownloaded from

1008 KONIG AND TALWANI
TABLE 1. ELTANIN SONOBUOY SOLUTIONS
Sonobuoy station
Water depth (km)
"t (km/s)
Cl (km/s) (km)
v2 (km/s)
0-2 (km/s)
h2 (km)
"3 (km/s)
°3 (km/s)
h3 (km) (km/s)
cr4 (km/s)
h< (km)
Latitude (S)
Longitude (E)
R5 E41A 5.54 2.43 0.28 1.12 37°20' 132°12' R12 EL44 4.78 1.82 0.18 0.41 2.88 0.14 2.21 (3.80) 0.72 36°11' 116°15' R41 EL53 5.55 2.44 0.13 0.84 2.56 0.13 0.98 2.90 0.23 0.52 3 6 W 129°26' R42 EL53 5.55 2.10 0.16 1.09 (3.00) 0.50 (3.60) 0.78 36°00' 129°41' R43 EL53 5.55 1.87 0.15 D.96 2.86 0.15 0.76 (3.60) 0.64 36°01' 129°56' R44 EL53 5.55 1.63 0.05 0.72 3.10 0.13 0.76 3.60 1.22 5.80 36°02' 129°48' R46 EL53 3.29 (2.00) 0.73 2.45 0.65 3.00 34°32' 129°40' R47 EL53 2.64 (2.00) 1.28 2.45 0.43 3.13 34°32' 129°53' R48 EL53 0.13 (2.00) 0.30 2.90 1.04 6.60 33°09' 129°41' R51 EL53 3.46 2.58 0.10 0.99 3.00 1.18 4.90 0.63 5.80 34°07' 126°44' R54 EL53 4.86 2.10 0.88 3.40 0.66 4.20 0.78 4.80 35°25' 124°56' R55 EL53 0.09 (2.00) 0.22 5.50 34°17' 124°03' R56 EL53 4.87 2.00 0.16 0.55 1.73 0.16 0.41 3.18 0.13 1.22 4.07 0.36 1.38 35°46' 122°06' R57 EL53 4.60 2.37 0.12 0.58 3.18 0.06 2.12 36°16' 118°15' R58 EL53 0.09 2.40 0.46 5.28 1.54 6.70 35°19' 116°56'
Note: Except for assumed interval velocities (in parentheses), seismic velocities not followed by standard deviations were obtained from refractions. v = seismic velocity cr = standard deviation of interval velocity h — thickness of layer
possible farther east. Anomalies 13 through 19 are sufficiently well defined to be identified with confidence on the longer profiles, whereas the recognition of anomalies 20 through 22 cannot be made unambiguously.
As is the case in the Great Australian Bight area, a prominent magnetic low also exists farther west along the entire continental margin, marking the contrast between high-amplitude, short-wavelength magnetic anomalies on its landward side and irregular anomalies of smaller amplitude and longer wavelength on its sea-ward side. An isostatic gravity high is generally associated with the magnetic low. The gravity anomaly appears to vary strongly along its trend in shape and amplitude as well as in position relative to the magnetic low. Most topographic profiles show a change in slope near the location of the magnetic low and, as in the case of the gravity anomalies, these anomalous topographic features are dis-placed toward the seaward side of the low. On seismic-profiler records, basement is not visible on the seaward side of the magnetic low until the Diamantina Fracture Zone (Heezen and Tharp, 1965) is reached. The seismic-refraction data (Fig. 6 and Table 1) also generally show a greater thickness of sediments in this area com-pared to the region seaward of it.
The geophysical anomalies of the southern continental margin of Australia are summarized in Figure 1, which shows the observed quiet zone in the Great Australian Bight area, the magnetic iso-chrons, and the prominent magnetic low on the landward side of the magnetic quiet zone. It will be noted that toward the eastern part of the area shown in Figure 1, anomaly 22 disappears and the magnetic quiet zone lies close to anomaly 21. Still farther to the east (east of approximately 138°E long), additional structural com-plications arise where the fracture zones which offset the ridge crest to the south (Hayes and Conolly, 1972) extend onto the Australian margin, converging as they approach it (Weissel and Hayes, 1972).
MAGNETICS AND GRAVITY MODELING
One of the characteristic anomalies of the magnetic field on the southern continental margin of Australia is the prominent low de-scribed above. The two features of this anomaly common to all magnetic profiles of the margin (Figs. 3 and 4) are a fairly sharp low and a gradual rise on its seaward side to form a broad, smooth shoulder. This can be most clearly seen on profile F (Fig. 3), where the quiet zone is magnetically nearly undisturbed. In general, how-ever, shorter-wavelength anomalies are superimposed on the long-wavelength shoulder. This is shown in Figure 5 where the
dashed curve indicates the idealized anomaly, and the solid curve indicates the observed magnetic anomalies.
We have examined a simple model to investigate the possible causes of this characteristic anomaly. We do not expect magnetic modeling to yield a unique solution to the observed anomalies. However, for any given causative body, it can be employed suc-cessfully to eliminate a great number of solutions that are not compatible with the observed data. One of the simplest assump-tions is that of a uniformly magnetized body. Figure 7 shows the two-dimensional magnetic anomaly that is caused by the edge of a uniformly magnetized infinite half-plate. The computations are based on Talwani and Heirtzler's (1964) method. Top and bottom of the plate are at depths of 4 km and 8.4 km, respectively, which appear to be reasonable values compatible with the available seis-mic data. The effects of varying steepness of the edge and of dif-ferent directions of magnetization are demonstrated in Figures 7 A and 7B, respectively. It is evident that this very simple model can reproduce the gross character of the prominent low if the edge is sufficiently steep and the direction of magnetization is somewhere in the vicinity of the inclination of the present field (—68° for this region south of Australia).
We realize that our model represents only one of many possible solutions. A more complicated, composite body with varying magnetic properties of the constituent parts can undoubtedly re-produce the general features of the magnetic low equally well, but it is questionable whether the available data make such a body geologically more reasonable than our simple model.
The gravity profiles of the Great Australian Bight area show a distinct pattern of isostatic and free-air anomalies, the most sig-nificant features of which are two highs, one associated with the prominent magnetic low, the other located at the seaward bound-ary of the quiet zone. Between these highs, a relative gravity low coincides with the magnetic quiet zone.
In Figure 8A, a structural model is shown whose gravity anomaly matches most of the observed anomaly and which is compatible with seismic and magnetic data. One feature of this model is the nature of the compensation which is of the Pratt type, employing a change mostly in density rather than in crustal thickness. This by no means excludes the validity of other models but simply demon-strates that a Pratt-type isostatic compensation at continental mar-gins can satisfy the gravity data just as well as the commonly used Airy-type models. The bottom slope shown is that of profile A. The basement configuration is in part controlled by seismic data; in the shelf region, for example, basement depths are known to be shal-
on September 3, 2014gsabulletin.gsapubs.orgDownloaded from

SOUTHERN CONTINENTAL MARGIN OF AUSTRALIA 1 0 0 9
A INDUCED MAGNETIZATION VARYING SHAPE OF MAGNETIZED BODY
B TOTAL/REMANENT MAGNETIZATION
VARYING INCLINATION OF MAGNETIZATION VECTOR
•150 -100 - 5 0 0 5 0 I 1 I 1 I
100 150 k m
X m = 0 . 0 0 3 :
X m = 0 . 0 0 3 :
N
h i 3
5
- 7
- 9
100 150 k m
-3
-5
-7
•9
l oo 150 k m
b3
5
7
9
D r = l 8 0 I r = l 8 0
200g
Dr=0° \ /
\ V
D r = l 8 0 ° V /
/ —
I r » - 1 2 0 ° /
-150 -100 -150 0 5 0 100 150 k m I I I 1 —J 1
IJI =0 .002 « e.m.u./cm
N
h i 3
5
7 l 9
S Figure 7. Simple magnetics models. The azimuth of projection of the profiles is 180°. The parameters of the geomagnetic field vector are: field strength,
F = 0.605F; declination, D = 0°; inclination, I = —68°. A. Induced magnetization; varying shape of magnetized body. The susceptibility of the uniformly magnetized body is Xm = 0.003. B. Total/remanent magnetization; varying dip of magnetization vector. The strength of magnetization of the uniformly magnetized body is f" TI = 0.002 e.m.u./cm3; the declination Dr and inclination/, vary as indicated. Dr = 0 ° , I r = —68° corresponds to the direction of the present geomagnetic field vector just south of southwest Australia (period 1966).
low (Conolly and others, 1970; also see Fig. 6, station R55). Where only limited control exists, the basement was chosen somewhat arbitrarily but in a manner consistent with the available data. As is apparent from the figure, the depth to basement is greatest beneath the central portion of the section which coincides in position with
the gravity low and the magnetic quiet zone. Above the structural section, the observed free-air gravity anomaly of profile A and the calculated free-air anomaly are shown, the latter being the two-dimensional gravity effect of the model section relative to that of a standard with a density of 2.80 g/cm3. The upper solid curve indi-
on September 3, 2014gsabulletin.gsapubs.orgDownloaded from

1 0 1 0
c o 3 0 0
^ 200
< co
OBSERVED MAGNETIC ANOMALY (PROFILE A )
MODEL MAGNETIC ANOMALIES
KÖNIG AND TALWANI
MAGNETICS
so
60
4 0
20
É °H S - 2 0 j
- 4 0 -
-60
-80
GRAVITY
MODEL F R E E - A I R / GRAVITY ANOMALY/
OBSERVED F R E E - A I R GRAVITY ANOMALY ( P R O F I L E A )
R E S I D U A L A N O M A L Y ( O B S . " M O D E L )
2 5 0 KM 0
2 . 4 0
3
2 . 8 0
2 . 8 0 /
- / 3 . 2 0
- J
3 . 3 0 -
-20
Figure 8A. Preliminary gravity and magnetics model for the Great Australian Bight section of the southern continental margin of Australia. The azimuth of projection is 180°. The topog-raphy shown is that of profile A (Fig. 3). The densities as indicated are in units of g/cm3. Shaded basement areas indicate zones of induced magnetization (diagonal ruling; susceptibility Xm = 0.0035) and remanent magnetization (black layer; intensity of magnetization | J*| = 0.009 e.m.u./cm3). The lower boundary of the magnetic basement was determined from heat-flow data south of Australia (Langseth and Von Herzen, 1970) assuming a Curie temperature of 600°C (Lindsley and others, 1966). Computed and ob-served gravity- and magnetic-anomaly curves are shown above the structural section and labeled correspondingly. Note the large residual (and ob-served free-air) gravity high at the zero-kilometre mark and the strong seaward gradient in both free-air and model gravity anomalies near 135 km. Note further the mismatch of the magnetics curves in the range —35 to —15 km.
cates the residual gravity anomaly. Above the gravity profiles, the observed magnetic anomalies are shown in comparison with a cal-culated anomaly profile caused by induced and remanent magneti-zation of the shaded portions of the basement. The lower boundary of the non-oceanic magnetic basemen : was determined from heat-flow data south of Australia (Langseth and Von Herzen, 1970), assuming a Curie temperature of 600°C. The oceanic magnetic basement is a strongly magnetized thin layer (layer 2A).
The two significant gravity highs referred to above and their causes as they relate to the model will now be examined more closely. The existence of the (free-air and isostatic) gravity high at the foot of the continental slope appears independent of the isosta-tic system used; that is, an Airy-type model would not eliminate the anomaly or reduce it substantially. At the position of the residual
gravity high, the section shown in Figure 8 A is completely balanced isostatically; this implies that additional, uncompensated mass is required to account for this anomaly. A possible body of high density which is capable of reproducing much of the residual high is shown in Figure 8B. The differential densities as indicated (in parentheses) refer to the density contrast (g/cm3) between the bodies and the adjacent basement. In addition, the residual gravity minimum over the continental slope and shelf has been modeled by altering the southern boundary of the 2.80-g/cm3 crustal layer. Above the structural section, the residual anomaly of Figure 8A is shown in comparison with the two-dimensional gravity effect of the bodies. The profiles at the top of Figure 8B are the residual magnetic anomaly (difference between observed and computed anomalies of Fig. 8 A with added constant) and the magnetic effect
on September 3, 2014gsabulletin.gsapubs.orgDownloaded from

SOUTHERN CONTINENTAL MARGIN OF AUSTRALIA 1 0 1 1
MAGNETICS
3 0 0 - ]
(O 2 0 0 -< 2 1 0 0 -S -
< 0 -CO
- 1 0 0 -
RESIDUAL ANOMALY
4 0 1
2 0 -
3 o - l
- 2 0 -
- 4 0 -
MAGNETIC EFFECT OF BODY
GRAVITY
RESIDUAL ANOMALY
-100 0 •
10 -
20
2 5 -
30
GRAVITY E F F E C T OF BODIES
-50 0 50 _ J —i i i 1 i i i ' i
loo K M • o
0 . 0 0 3
(3 .30-2 .80) —
(3.30 -3 .20 )
- ( 2 . 8 0 - 3 . 2 0 )
- 1 0
15
- 2 0
- 2 5
30
Figure 8B. Gravity and magnetic effects of several bodies. The model bodies are shown in relation to the structural section of Figure 8A. The differential densities (in parentheses and units of g/cm3) denote the mass excess or deficiency relative to the adjacent basement. The shaded area indicates a body of induced magnetization (susceptibility Xm = 0.003), which partly overlaps the heavy body of differential density + 0 . 5 0 g/cm3. Above the structure section, the residual gravity anomaly of Figure 8A (solid curve) and the computed gravity effect due to the bodies (dashed curve) are shown. The residual magnetic anomaly is the differential curve between the observed and computed magnetic anomalies of Figure 8A within a constant value of 390-y (that is, 390y were added to each observed anomaly value).The residual anomaly is shown in comparison with the magnetic effect due to the shaded body of induced magnetization.
of the magnetized body within the basement as indicated by shad-ing. The number shown is the value of the magnetic susceptibility (induced magnetization has been assumed for the body).
The steep seaward gravity gradient which is located at the edge of the oceanic basement (Fig. 8A) and leads to the second gravity high has no topographic expression just as the high at the foot of the continental slope cannot be explained by a corresponding bathymetric feature. The gradient seems to be at least in part due to the gravity effect of the uncompensated basement topography. However, there appears to exist an additional deep-seated density contrast which in Figures 8A and 8C we have modeled by assuming a generally lighter section under the magnetic quiet zone than under the ocean basin farther seaward.
As a synthesis of our modeling of geophysical anomalies, we present in Figure 8C a combined gravity-magnetics and structural model which includes the bodies of Figure 8B and their gravity and magnetic effects. The rest of the gravity-anomaly curve is identical to that of Figure 8A, whereas the calculated magnetic anomaly of Figure 8C also includes the effect of alternate strips of normal and reversed remanent magnetization in the topmost part of the oceanic basement. Immediately above the structural section, its mass anom-aly is shown. The large deviations from the zero level indicate a lack of local compensation.
DISCUSSION
Several authors (Poehls and others, 1973, for example) have summarized the various hypotheses given for the origin of marginal magnetic quiet zones.
The hypothesis of lack of magnetic reversals does not appear to be applicable to the Australian margin, as reversals have been re-corded in the early Tertiary immediately prior to anomaly 22 (Heirtzler and others, 1968). While the depth to basement is large in the magnetic quiet zone, it can be shown that the magnetic anomalies associated with magnetized strips of reversed polarity would still be observable at the surface, but they are not. The conclusion, therefore, seems unavoidable that the rocks below the magnetic quiet zone are not typical oceanic rocks of large magneti-zation. If the basement is oceanic, either the rocks were never strongly magnetized because of a process of emplacement such as envisaged by Vogt and others (1970) in which rocks are intruded into a thick pile of very mobile sediments; or the magnetization was initially large but subsequently destroyed by some process such as regional metamorphism (Taylor and others, 1968; Vogt and others, 1970). On the other hand, the magnetic quiet zone could represent an area of subsided continental basement with a low intensity of magnetization.
Seismic-profiler and refraction data indicate a large difference in the depths to basement at anomaly 22 and in the magnetic quiet zone. If the crust under the latter is continental, anomaly 22 repre-sents the initiation of spreading; otherwise, it marks a renewal or reorganization of sea-floor generation after a hiatus in spreading.
We list some arguments for and against the hypothesis that the quiet zone is a subsided continental block.
In Figure 3, the magnetic character of the quiet zone is more disturbed in the western profiles A, B, and C where both gravity and topographic data indicate a thinner cover of sediments, since the Ceduna Plateau, which is clearly expressed as bathymetric bulges on profiles D and F, is also reflected in the free-air gravity anomaly. If this area to the west were underlain by oceanic crust, the anomalies would be expected to be lineated; however, they appear to be more irregular and characteristic of a continental crust.
It is known from geological and geophysical evidence that local offshore sedimentary basins occur along the southern continental margin of Australia. The basins of the Bass Strait (Weeks and Hopkins, 1967), the Otway Basin (von derBorch and others, 1970; Griffiths, 1971), the Duntroon Basin, and the Polda Trough (Smith and Kamerling, 1969) are characterized by sedimentary sections
on September 3, 2014gsabulletin.gsapubs.orgDownloaded from

1012 KÖNIG AND TALWANI
MAGNETICS
co 300-1 < íj 200 -2 100-< O o->
G R A V I T Y
< O
40-1
20
0-
- 2 0 -
-40-
- 6 0 -
- 8 0 -
M0DEL FREE-AIR GRAVITY ANOMALY- -^
"OBSERVED FREE-AIR GRAVITY ANOMALY (PROFILE A) *
RESIDUAL ANOMALY (OBS. - MODEL)
MASS ANOMALY
Figure 8C. Integrated structural and geophys-ical model for the Great Australian Bight section of the southern continental margin of Australia. The azimuth of projection is 180°. The structure section is that of Figure 8A except for the addi-tion of the uncompensated gravity bodies and the magnetized body of Figure 8B. The numbers de-note densities in units of g/cm3. Note that the simple structural model shown should not be in-terpreted to imply that the M discontinuity di-rectly underlies the sedimentary section in the magnetic quiet zone. Almost certainly, basement material of density less than 3.20 g/cm3 exists beneath the sediments.
Boundaries and types of basement magnetiza-tion are indicated by shading; the magnetic parameters used in the computations are as fol-lows: present geomagnetic field direction and strength, D = 0°, I = - 6 8 ° , F = 0.6051"; induced magnetization ( < - 1 5 0 to +135 km), suscep-tibilities, Xm = 0.0035 (diagonal ruling), Xm = 0.0065 (cross-hatching); remanent magnetiza-tion, intensity, |T| = 0.009 e.m.u./cm3 (for both normally and reversely magnetized stripes); rem-anent magnetization, directions: normal polarity (black: 135.0 to 177.5 km, 195.0 to 215.0 km, 232.5 to 242.5 km), Dr = 0°, Ir = - 7 4 ° (Weissel and Hayes, 1972); reversed polarity (white: 177.5 to 195.0 km, 215.0 to 232.5 km, >242.5 km), Dr = 180°, Ir = 106°.
Above the structural section, the correspond-ing mass-anomaly, gravity, and magnetics curves are shown as indicated. Note the correspondence of the free-air anomalies with the large-amplitude mass anomalies between —35 and + 2 0 km. Note further the disappearance of the residual gravity high due to the addition of un-compensated mass, and the oscillation of the re-sidual gravity-anomaly curve about the zero line. Also note the good agreement of observed and calculated magnetic anomalies.
that for the most part are as much as 6 km thick, the oldest sedi-ments being late Mesozoic in age. In general, the basal deposits are terrigenous sedimentary rocks and, from the available seismic evi-dence, the underlying basement appears to be continental crust. It seems reasonable to suggest that the seaward continuation of these thick basin deposits of age much greater than that of the oldest observed magnetic lineation also overlie continental crust (Boeuf and Doust, 1975); however, a Jurassic rifting with attendant sea-
floor generation but much earlier than the time of initiation of steady sea-floor spreading (Sproll and Dietz, 1969; Griffiths, 1971) cannot be ruled out.
East of about 131°E long, anomaly 22 is not observed, and the seaward boundary of the magnetic quiet zone turns south in this area, cutting across the trend of this isochron as it does so (Fig. 1). However, east of approximately 132°E, the magnetic quiet zone parallels anomaly 21 and appears to continue in this fashion east-
on September 3, 2014gsabulletin.gsapubs.orgDownloaded from

SOUTHERN CONTINENTAL MARGIN OF AUSTRALIA 1013
ward to the area northwest of Tasmania. It appears, then, that near 131°E long the magnetic quiet-zone boundary is time-transgressive and not an isochron. This observation has been cited by earlier authors as proving that the quiet zone is underlain by oceanic crust which was later demagnetized. However, it is possible that when Australia and Antarctica commenced to separate, there was an initial period of stretching and necking of the continental crust which lasted longer in the east than in the west. Geological evi-dence of marine transgressions from west to east along the margin (Griffiths, 1971) is compatible with such a rifting history.
Site 282 of Leg 29 of the Deep Sea Drilling Project is located in the magnetic quiet zone off the west coast of Tasmania, and appar-ently normal pillow basalt was drilled and sampled there beneath about 300 m of clay and ooze that ranged in age from late Eocene to late Miocene (Kennett and others, 1973). The segment of the continental margin from the Great Australian Bight to southwest of Tasmania, however, is more complex than the sections considered in this study, mainly because of the existence of the major fracture zones which offset the ridge to the south (Hayes and Conolly, 1972) and approach the margin in this region. The magnetic quiet zone off western Tasmania appears to be poorly defined; we have examined recently acquired magnetic data in this area and believe it is possible that site 282 actually lies outside the magnetic quiet zone. Alternatively, the basalt may not represent oceanic floor but volcanic material of continental affiliation (Boeuf and Doust, 1975) in accordance with geological evidence for widespread Tertiary to Holocene volcanic activity along this section of the Australian con-tinental margin (von der Borch and others, 1970; Robinson, 1974).
It could be argued that if the magnetic quiet zone is underlain by continental crust and because the water depth is large, negative isostatic anomalies several hundred milligals in amplitude must exist. It has been argued in the literature about other similar areas that the crust cannot be continental because no such large negative anomalies are actually observed. However, in our opinion, the data do not necessarily prove that the crust has been created by sea-floor spreading but that since the area is now in approximate isostatic equilibrium it is possible that the continental crust has been "oceanized" (Beloussov, 1968), perhaps by massive intrusions in a manner such that its density has been increased. In the model of Figures 8A and 8C, the material of density 3.20 g/cm3 is simply a crude way to represent the final result of this conversion of conti-nental crust with an initial density of 2.80 g/cm3. Almost certainly, basement material of density less than 3.20 g/cm3 underlies the sediment in the magnetic quiet zone, and a corresponding model to satisfy the observed gravity data can be easily constructed. Our results should not be interpreted to imply that the Mohorovicic discontinuity directly underlies the sedimentary section. Extensive seismic-refraction measurements in the quiet-zone area are neces-sary in order to obtain more details about the real nature of the crust in this region.
CONCLUSIONS
The distinct pattern of geophysical anomalies associated with the magnetic quiet zone and its boundaries in the Great Australian Bight on the continental margin off southern Australia can be in-terpreted in terms of several models which are all compatible with the data. The salient feature of the model presented here is a zone of anomalous density, whose value falls between typical crustal and mantle values, that underlies the magnetic quiet zone. The seaward boundary of the quiet zone marks the continentward limit of oceanic crust, and the landward quiet-zone boundary consists of a normal fault, downthrown to the south, within continental-type basement.
Other hypotheses postulating that oceanic basement underlies the magnetic quiet zone are considered less likely to apply to the
continental margin off southern Australia. However, they cannot be ruled out altogether on the basis of the available geophysical and geological data.
ACKNOWLEDGMENTS
We acknowledge the cooperation of the officers, crews, and sci-entific personnel aboard U.S.N.S. Eltanin, R. V. Vema, and R. V. Robert D. Conrad during the cruises in the Southeast Indian Ocean. It is due to their efforts that the collection of geophysical data on the southern continental margin of Australia could be carried out successfully. We express our thanks to N. H. Fisher, Director of the Bureau of Mineral Resources, Geology and Geophysics (Commonwealth of Australia), for making available preliminary publications of the BMR continental-margin survey data. R. E. Houtz and P. D. Rabinowitz critically reviewed the manuscript and offered valuable suggestions for its improvement. R. E. Houtz kindly provided the sonobuoy solutions.
This work was supported under National Science Foundation Grants G-22260, GA-894, GA-1523, GA-1121, GA-27281, GV-12825, GV-23334, GV-27472, GV-40896, OPP74-02238, DES-71-00214-A08; and Office of Naval Research Contracts NOBSR-85077, NONR 266(48), NONR 266(79), and N00014-67-A-0108-0004.
REFERENCES CITED
Beloussov, V. V., 1968, Some problems of development of the earth's crust and upper mantle of oceans, in Knopoff, L., Drake, C. L., and Hart, P. J., eds., The crust and upper mantle of the Pacific area: Washington, D.C., Am. Geophys. Union Geophys. Mon. 12, p. 4 4 9 - 4 5 9 .
Boeuf, M. G., and Doust, H., 1975, Structure and development of the southern margin of Australia: Australian Petroleum Exploration As-soc. Jour., v. 15, p. 3 3 - 4 3 .
Borch, C. C. von der, 1967, Marginal plateaus: Their relationship to continental-shelf sedimentary basins in southern Australia: Geol. Soc. Australia Jour., v. 14, p. 3 0 9 - 3 1 6 .
Borch, C. C. von der, Conolly, J. R., and Dietz, R. S., 1970, Sedimentation and structure of the continental margin in the vicinity of the Otway Basin, southern Australia: Marine Geology, v. 8, p. 5 9 - 8 3 .
Brown, D. A., Campbell, K.S.W., and Crook, K.A.W., 1968, The geological evolution of Australia and New Zealand: Oxford, Pergamon Press, 409 p.
Cain, J. C., Daniels, W. E., Hendricks, S. J., and Jensen, D. C., 1964, NASA Rept. X-612-65-72.
Cain, J. C., Hendricks, S. J., Daniels, W. E., and Jensen, D. C., 1968, Computation of the main geomagnetic field from spherical harmonic expansions: Greenbelt, Md., National Space Science Data Center, Data Users' Note NSSDC 68-11.
Conolly, J. R., and von der Borch, C. C., 1967, Sedimentation and physiog-raphy of the sea floor south of Australia: Sed. Geology, v. 1, p. 181 — 220.
Conolly, J. R., Flavelle, A., and Dietz, R. S., 1970, Continental margin of the Great Australian Bight: Marine Geology, v. 8, p. 3 1 - 5 8 .
David, T.W.E., 1950, The geology of the Commonwealth of Australia, Vol. 2 (edited by W. R. Browne): London, Edward Arnold & Co., 618 p.
Deighton, I., Falvey, D. A., and Taylor, D. J., 1976, Depositional environ-ments and geotectonic framework: Southern Australian continental margin: Australian Petroleum Exploration Assoc. Jour., v. 16, p. 2 5 - 3 6 .
Glaessner, M. F., and Parkin, L. W., eds., 1958, The geology of South Australia: Geol. Soc. Australia Jour., v. 5 (1957), pt. 2, 163 p.
Griffiths, J. R., 1971, Continental-margin tectonics and the evolution of southeast Australia: Australian Petroleum Exploration Assoc. Jour., v. 11, p. 7 5 - 7 9 .
Hawkins, L. V., Hennion, J. F., Nafe, J. E., and Doyle, H. A., 1965, Marine seismic-refraction studies on the continental margin to the south of Australia: Deep-Sea Research, v. 12, p. 4 7 9 - 4 9 5 .
Hayes, D. E., and Conolly, J. R., 1972, Morphology of the Southeast Indian Ocean, in Hayes, D. E., ed., Antarctic oceanology II: The
on September 3, 2014gsabulletin.gsapubs.orgDownloaded from

1014 KÖNIG AND TALWANI
Australian-New Zealand sector: Am. Geophys. Union Antarctic Re-search Ser., v. 19, p. 125-145.
Heezen, B. C., and Tharp, M., 1965, Descriptive sheet to accompany physiographic diagram of the Indian Ocean: New York, Geol. Soc. America.
Heirtzler, J. R., Dickson, G. O., Herron, E. M., Pitman, W. C., III, and Le Pichon, X., 1968, Marine magnetic anomalies, geomagnetic field re-versals, and motions of the ocean floor and continents: Jour. Geophys. Research, v. 73, p. 2119-2136.
Houtz, R. E., 1975, Comparison of sonobuoy and sonic-probe mea-surements with drilling results, in Kennett, J. P., Houtz, R. E., and others, Initial reports of the Deep Sea Drilling Project, Vol. 29: Wash-ington, D. C., U.S. Gov. Printing Office, p. 1123-1131.
Houtz, R. E., and Markl, R. G., 1972, Seismic profiler data between Ant-arctica and Australia, in Hayes, D. E., ed., Antarctic oceanology II: The Australian-New Zealand sector: Am. Geophys. Union Antarctic Research Ser., v. 19, p. 147-164 .
Jaeger, J. C., and Browne, W. R., 1958, Earth tremors in Australia and their geological importance: Australian Jour. Sci., v. 20, p. 225-228 .
Kennett, J. P., Houtz, R. E., and others, 1973, Deep-sea drilling in the roaring 40s: Geotimes, v. 18, no. 7, p. 14 -17 .
Langseth, M. G., Jr., and Von Herzen, R. P., 1970, Heat flow through the floor of the world oceans, in Maxwell, A. E., ed., The sea, Vol. 4, pt. 1: New York, John Wiley & Sons, Inc., p. 299-352 .
Lindsley, D. H., Andreasen, G. E., and Balsley, J. R., 1966, Magnetic properties of rocks and minerals, in Clark, S. P., Jr., ed., Handbook of physical constants: New York, Geol. Soc. America Mem. 97, p. 543-552 .
Luyendyk, B. P., and Bunce, E. T., 1973, Geophysical study of the north-west African margin off Morocco: Deep-Sea Research, v. 20, p. 537-549 .
McWhae, J.R.H., Playford, P. E., Lindner, A. W., Glenister, B. F., and Balme, B. E., 1958, The stratigraphy of Western Australia: Geol. Soc. Australia Jour., v. 4 (1956), pt. 2, 161 p.
Poehls, K. A., Luyendyk, B. P., and Heirtzler, J. R., 1973, Magnetic smooth zones in the world's oceans: Jour. Geophys. Research, v. 78, p. 6985-6997.
Rabinowitz, P. D., 1974, The boundary between oceanic and continental crust in the western North Atlantic, in Burk, C. A., and Drake, C. L.,
eds., The geology of continental margins: New York, Springer-Verlag, Inc., p. 6 7 - 8 4 .
Robinson, V. A., 1974, Geologic history of the Bass Basin: Australian Petroleum Exploration Assoc. Jour., v. 14, p. 4 5 - 4 9 .
Smith, R., and Kamerling, P., 1969, Geological framework of the Great Australian Bight: Australian Petroleum Exploration Assoc. Jour., v. 9, p. 6 0 - 6 6 .
Sproll, W. P., and Dietz, R. S., 1969, Morphological continental-drift fit of Australia and Antarctica: Nature, v. 222, p. 345-348 .
Talwani, M., and Eldholm, O., 1972, Continental margin off Norway: A geophysical study: Geol. Soc. America Bull., v. 83, p. 3575—3606. 1973, Boundary between continental and oceanic crust at the margin of rifted continents: Nature, v. 241, p. 325-330 .
Talwani, M., and Heirtzler, J. R., 1964, Computation of magnetic anomalies caused by two-dimensional structures of arbitrary shape, in Parks, G. A., ed., Computers in the mineral industries: Palo Alto, Calif., Stanford Univ., p. 464-480 .
Taylor, P. T., Zietz, I., and Dennis, L. S., 1968, Geological implications of aeromagnetic data for the eastern continental margin of the United States: Geophysics, v. 33, p. 755-780 .
Vogt, P. R., Anderson, C. N., Bracey, D. R., and Schneider, E. D., 1970, North Atlantic magnetic smooth zones: Jour. Geophys. Research, v. 75, p. 3955-3968.
Weeks, L. G., and Hopkins, B. M., 1967, Geology and exploration of three Bass Strait basins, Australia: Am. Assoc. Petroleum Geologists Bull., v. 51, p. 742-760 .
Weissel, J. K., and Hayes, D. E., 1971, Asymmetric sea-floor spreading south of Australia: Nature, v. 231, p. 518-522 . 1972, Magnetic anomalies in the Southeast Indian Ocean, in Hayes, D. E., ed., Antarctic oceanology II: The Australian-New Zealand sector: Am. Geophys. Union Antarctic Research Ser., v. 19, p. 165-196. 1974, The Australian-Antarctic discordance: New results and implica-tions: Jour. Geophys. Research, v. 79, p. 2579-2587.
M A N U S C R I P T RECEIVED BY THE SOCIETY N O V E M B E R 3 , 1 9 7 5 REVISED M A N U S C R I P T RECEIVED OCTOBER 8 , 1 9 7 6 M A N U S C R I P T ACCEPTED N O V E M B E R 2 3 , 1 9 7 6
L A M O N T - D O H E R T Y GEOLOGICAL OBSERVATORY CONTRIBUTION N o . 2 4 7 0
on September 3, 2014gsabulletin.gsapubs.orgDownloaded from