A Genomewide Admixture Map for Latino...
13
1024 The American Journal of Human Genetics Volume 80 June 2007 www.ajhg.org ARTICLE A Genomewide Admixture Map for Latino Populations Alkes L. Price, Nick Patterson, Fuli Yu, David R. Cox, Alicja Waliszewska, Gavin J. McDonald, Arti Tandon, Christine Schirmer, Julie Neubauer, Gabriel Bedoya, Constanza Duque, Alberto Villegas, Maria Catira Bortolini, Francisco M. Salzano, Carla Gallo, Guido Mazzotti, Marcela Tello-Ruiz, Laura Riba, Carlos A. Aguilar-Salinas, Samuel Canizales-Quinteros, Marta Menjivar, William Klitz, Brian Henderson, Christopher A. Haiman, Cheryl Winkler, Teresa Tusie-Luna, Andre ´s Ruiz-Linares, and David Reich Admixture mapping is an economical and powerful approach for localizing disease genes in populations of recently mixed ancestry and has proven successful in African Americans. The method holds equal promise for Latinos, who typically inherit a mix of European, Native American, and African ancestry. However, admixture mapping in Latinos has not been practical because of the lack of a map of ancestry-informative markers validated in Native American and other populations. To address this, we screened multiple databases, containing millions of markers, to identify 4,186 markers that were putatively informative for determining the ancestry of chromosomal segments in Latino populations. We experimentally validated each of these markers in at least 232 new Latino, European, Native American, and African samples, and we selected a subset of 1,649 markers to form an admixture map. An advantage of our strategy is that we focused our map on markers distinguishing Native American from other ancestries and restricted it to markers with very similar frequencies in Europeans and Africans, which decreased the number of markers needed and minimized the possibility of false disease associations. We evaluated the effectiveness of our map for localizing disease genes in four Latino populations from both North and South America. From the Department of Genetics, Harvard Medical School, Boston (A.L.P.; F.Y.; A.W.; G.J.M.; A.T.; C.S.; J.N.; D.R.); Medical and PopulationGenetics Group, Broad Institute of Massachusetts Institute of Technology and Harvard, Cambridge, MA (A.L.P.; N.P.; F.Y.; A.W.; G.J.M.; A.T.; C.S.; J.N.; D.R.); Perlegen Sciences, Mountain View, CA (D.R.C.); Laboratorio de Gene ´tica Molecular, Universidad de Antioquia, Medellı ´n, Colombia (G.B.; C.D.; A.V.; A.R.-L.); Departamento de Genetica, Universidade Federal do Rio Grande do Sul, Porto Alegre, Brazil (M.C.B.; F.M.S.); Laboratorios de Investigacio ´n y Desarrollo, Falcultad de Ciencias y Filosofı ´a, Universidad Peruana Cayetano Heredia, Lima (C.G.; G.M.); Cold Spring Harbor Laboratory, Cold Spring Harbor, NY (M.T.-R.); Unit of Molecular Biology and Genomic Medicine, Instituto de Investigaciones Biomedicas (L.R.; S.C.-Q.; T.T.-L.), and Biology Department, Facultad de Quı ´mica (M.M.), Universidad Nacional Auto ´noma de Me ´xico, and Departament de Endocrinology y Metabolism, Instituto Nacional de Ciencias Medicas y Nutricion Salvador Zubiran (C.A.A.-S.), Mexico City; School of Public Health, University of California, Berkeley (W.K.); Public Health Institute, Oakland (W.K.); Department of Preventive Medicine, Keck School of Medicine, University of Southern California, Los Angeles (B.H.; C.A.H.); Laboratory of Genomic Diversity, SAIC-Frederick, National Cancer Institute, Frederick, MD (C.W.); and The Galton Laboratory,Department of Biology, University College London, London (A.R.-L.) Received January 16, 2007; accepted for publication March 12, 2007; electronically published April 13, 2007. Address for correspondence and reprints: Dr. David Reich, Department of Genetics, Harvard Medical School, 77 Avenue Louis Pasteur, Boston, MA 02115. E-mail: [email protected] Am. J. Hum. Genet. 2007;80:1024–1036. 2007 by The American Society of Human Genetics. All rights reserved. 0002-9297/2007/8006-0004$15.00 DOI: 10.1086/518313 Admixture mapping is an economical and theoretically powerful approach for localizing disease genes in popula- tions of recently mixed ancestry in which the ancestral populations have differing genetic risk. 1–3 The develop- ment of African American admixture maps has already led to several admixture scans of that population. 4–8 For ex- ample, admixture mapping identified a 3.8-Mb risk locus on chromosome 8q24 at which African Americans with prostate cancer (MIM 176807) have increased African an- cestry relative to their genomewide average, 7 which led to the discovery of multiple risk alleles for the disease. 9 Latino populations provide an equally promising oppor- tunity for admixture mapping, because of their mixture of ancestry from different continents as well as their large population size: there are 140 million Latinos in the United States and hundreds of millions more in Latin America. 10 “Latino” can have a wide range of meanings, but, here, we refer to individuals of Latin American ancestry in the Americas who do not identify themselves as Native Am- erican, African American, or European American. Latinos defined in this way have a mix of European, Native Amer- ican, and West African ancestry because of a history of population mixture initiated at the time of European co- lonial rule (15th–19th centuries). The ancestry of Latino populations varies across regions, depending on local fac- tors, such as the Native American population density at the time when immigrants arrived and the amount of Eu- ropean and African immigration in specific regions. 11,12 Dis- ease incidence in Native American and Latino populations compared with populations of European ancestry is much higher for type 2 diabetes (MIM 125853), obesity (MIM 601665), gallbladder disease (MIM 600803), and rheuma- toid arthritis (MIM 180300) and is lower for asthma (MIM 600807) and prostate cancer, which makes all these phe- notypes promising candidates for admixture mapping in Latino populations. 13–18 The main barrier to admixture mapping in Latinos has been the lack of a practical Latino admixture map for in- ferring the ancestry of chromosomal segments at each lo- cation in the genome. A previous study characterized a
Transcript of A Genomewide Admixture Map for Latino...

1024 The American Journal of Human Genetics Volume 80 June 2007 www.ajhg.org
ARTICLE
A Genomewide Admixture Map for Latino PopulationsAlkes L. Price, Nick Patterson, Fuli Yu, David R. Cox, Alicja Waliszewska, Gavin J. McDonald,Arti Tandon, Christine Schirmer, Julie Neubauer, Gabriel Bedoya, Constanza Duque,Alberto Villegas, Maria Catira Bortolini, Francisco M. Salzano, Carla Gallo, Guido Mazzotti,Marcela Tello-Ruiz, Laura Riba, Carlos A. Aguilar-Salinas, Samuel Canizales-Quinteros,Marta Menjivar, William Klitz, Brian Henderson, Christopher A. Haiman, Cheryl Winkler,Teresa Tusie-Luna, Andres Ruiz-Linares, and David Reich
Admixture mapping is an economical and powerful approach for localizing disease genes in populations of recentlymixed ancestry and has proven successful in African Americans. The method holds equal promise for Latinos, whotypically inherit a mix of European, Native American, and African ancestry. However, admixture mapping in Latinos hasnot been practical because of the lack of a map of ancestry-informative markers validated in Native American and otherpopulations. To address this, we screened multiple databases, containing millions of markers, to identify 4,186 markersthat were putatively informative for determining the ancestry of chromosomal segments in Latino populations. Weexperimentally validated each of these markers in at least 232 new Latino, European, Native American, and Africansamples, and we selected a subset of 1,649 markers to form an admixture map. An advantage of our strategy is that wefocused our map on markers distinguishing Native American from other ancestries and restricted it to markers with verysimilar frequencies in Europeans and Africans, which decreased the number of markers needed and minimized thepossibility of false disease associations. We evaluated the effectiveness of our map for localizing disease genes in fourLatino populations from both North and South America.
From the Department of Genetics, Harvard Medical School, Boston (A.L.P.; F.Y.; A.W.; G.J.M.; A.T.; C.S.; J.N.; D.R.); Medical and Population GeneticsGroup, Broad Institute of Massachusetts Institute of Technology and Harvard, Cambridge, MA (A.L.P.; N.P.; F.Y.; A.W.; G.J.M.; A.T.; C.S.; J.N.; D.R.);Perlegen Sciences, Mountain View, CA (D.R.C.); Laboratorio de Genetica Molecular, Universidad de Antioquia, Medellın, Colombia (G.B.; C.D.; A.V.;A.R.-L.); Departamento de Genetica, Universidade Federal do Rio Grande do Sul, Porto Alegre, Brazil (M.C.B.; F.M.S.); Laboratorios de Investigacion yDesarrollo, Falcultad de Ciencias y Filosofıa, Universidad Peruana Cayetano Heredia, Lima (C.G.; G.M.); Cold Spring Harbor Laboratory, Cold SpringHarbor, NY (M.T.-R.); Unit of Molecular Biology and Genomic Medicine, Instituto de Investigaciones Biomedicas (L.R.; S.C.-Q.; T.T.-L.), and BiologyDepartment, Facultad de Quımica (M.M.), Universidad Nacional Autonoma de Mexico, and Departament de Endocrinology y Metabolism, InstitutoNacional de Ciencias Medicas y Nutricion Salvador Zubiran (C.A.A.-S.), Mexico City; School of Public Health, University of California, Berkeley (W.K.);Public Health Institute, Oakland (W.K.); Department of Preventive Medicine, Keck School of Medicine, University of Southern California, Los Angeles(B.H.; C.A.H.); Laboratory of Genomic Diversity, SAIC-Frederick, National Cancer Institute, Frederick, MD (C.W.); and The Galton Laboratory, Departmentof Biology, University College London, London (A.R.-L.)
Received January 16, 2007; accepted for publication March 12, 2007; electronically published April 13, 2007.Address for correspondence and reprints: Dr. David Reich, Department of Genetics, Harvard Medical School, 77 Avenue Louis Pasteur, Boston, MA
02115. E-mail: [email protected]. J. Hum. Genet. 2007;80:1024–1036. � 2007 by The American Society of Human Genetics. All rights reserved. 0002-9297/2007/8006-0004$15.00DOI: 10.1086/518313
Admixture mapping is an economical and theoreticallypowerful approach for localizing disease genes in popula-tions of recently mixed ancestry in which the ancestralpopulations have differing genetic risk.1–3 The develop-ment of African American admixture maps has already ledto several admixture scans of that population.4–8 For ex-ample, admixture mapping identified a 3.8-Mb risk locuson chromosome 8q24 at which African Americans withprostate cancer (MIM 176807) have increased African an-cestry relative to their genomewide average,7 which led tothe discovery of multiple risk alleles for the disease.9
Latino populations provide an equally promising oppor-tunity for admixture mapping, because of their mixtureof ancestry from different continents as well as their largepopulation size: there are 140 million Latinos in the UnitedStates and hundreds of millions more in Latin America.10
“Latino” can have a wide range of meanings, but, here,we refer to individuals of Latin American ancestry in theAmericas who do not identify themselves as Native Am-erican, African American, or European American. Latinos
defined in this way have a mix of European, Native Amer-ican, and West African ancestry because of a history ofpopulation mixture initiated at the time of European co-lonial rule (15th–19th centuries). The ancestry of Latinopopulations varies across regions, depending on local fac-tors, such as the Native American population density atthe time when immigrants arrived and the amount of Eu-ropean and African immigration in specific regions.11,12 Dis-ease incidence in Native American and Latino populationscompared with populations of European ancestry is muchhigher for type 2 diabetes (MIM 125853), obesity (MIM601665), gallbladder disease (MIM 600803), and rheuma-toid arthritis (MIM 180300) and is lower for asthma (MIM600807) and prostate cancer, which makes all these phe-notypes promising candidates for admixture mapping inLatino populations.13–18
The main barrier to admixture mapping in Latinos hasbeen the lack of a practical Latino admixture map for in-ferring the ancestry of chromosomal segments at each lo-cation in the genome. A previous study characterized a

www.ajhg.org The American Journal of Human Genetics Volume 80 June 2007 1025
set of microsatellite markers for potential use in admixturemapping and predicted that SNP markers would soon leadto a practical Latino admixture map.19 Four technical chal-lenges needed to be overcome before a practical admixturemap for Latinos could be built:
1. The first challenge is the lack of a large database ofmarkers with frequencies known in Native Ameri-cans. (By contrast, large databases of markers withfrequencies known in European and African pop-ulations have been available for several years.20) Weaddressed this by mining multiple databases, par-ticularly a proprietary database of 1.5 million mark-ers with frequencies known in European and Mex-ican populations. Marker selection was performedunder the assumption that allele-frequency differ-ences in Europeans and Mexicans are due primarilyto the Native American–ancestry contribution inMexicans. The usefulness of all markers was assessedby new genotyping in 4 Latino and 15 putative an-cestral populations.
2. The second challenge is the history of three-waymixture in Latinos.11,12,21,22 To build an appropriateadmixture map, one can identify markers that dis-tinguish among all three ancestral populations,3 butthis requires a very high density of markers andcomplex statistical machinery and is inefficient,since African ancestry in Latinos is usually small(!10%), and such a small proportion is not expectedto contribute power to an admixture scan.1 We in-stead favor performing an admixture scan in whichone distinguishes between Native American and Eu-ropean/African ancestry. This requires special careto avoid false-positive disease associations; for ex-ample, if a marker in the map has an allele fre-quency of 10% in Europeans, 70% in Native Amer-icans, and 90% in Africans, then genomic segmentsof African ancestry could erroneously be assignedto Native American ancestry, which would producean apparent increase in Native American ancestryin disease cases at this locus. We were careful tobuild a map that contains only markers that havevery similar allele frequencies in Europeans and Af-ricans. Although this eliminated many potentiallyinformative markers from the map, the panel thatwe produced is more robust, allowing us to use Eu-ropeans as a reliable ancestral population to esti-mate the European/African segments and to avoidfalse-positive results.
3. The third challenge is the genetic heterogeneityacross Native American populations, in contrast tothe relative homogeneity across European or acrossWest African populations.4,23,24 This can lead to false-positive associations in admixture scans if markerswith different frequencies across Native Americanpopulations are used. We addressed this by sampling12 diverse Native American populations, choosing
a subset of 4 Native American populations that bestrepresent the Native American–ancestry contribu-tion of Latinos, and by eliminating markers that aresubstantially different in frequency across these pop-ulations. We show that, for markers in our admix-ture map, these four Native American populationsprovide a suitable ancestral population for the Na-tive American segments of Latino chromosomes.
4. The fourth challenge is the considerably greater link-age disequilibrium (LD) in Native American popu-lations compared with that in other populations.25
The inclusion, in a map construction, of markersthat are in LD in the ancestral populations can leadto false-positive associations in admixture scans ifnonindependent signals are treated as independent.1
We addressed this during map construction by ex-cluding pairs of markers found to be in LD in theNative American samples we genotyped (with a sim-ilar LD exclusion for European and African samples).
For the construction of our admixture map, we ascer-tained 4,186 markers from databases containing millionsof markers and validated these markers by genotypingthem in at least 232 samples from Latino, European, Na-tive American, and African populations. We used resultsof this validation genotyping to select a final set of 1,649markers for a 1st-generation Latino admixture map. Weevaluated the robustness of this map for disease mappingin representative Latino populations from across the Amer-icas and showed that its informativeness is comparable tothe first African American admixture map.4
Material and MethodsPopulation Samples for Validating Ancestry-InformativeMarkers
We analyzed 142 Latino individuals: 38 self-identified LatinoAmericans from Los Angeles (whom we call “LA Latinos”), 37from Mexico City (whom we call “Mexicans”), 37 from RioGrande do Sul, Brazil (Gauchos collected in the cities of Bage andAlegrete, whom we call “Brazilians”), and 30 from Antioquia,Colombia (collected in the city of Medellın, whom we call “Col-ombians”). We also analyzed 327 samples from putative ancestralpopulations: 57 samples of European ancestry (31 from Valencia,Spain, and 26 from Baltimore), 28 Africans from Ghana, 147 Na-tive North Americans, and 95 Native South Americans. The 147Native North Americans included 31 Zapotec, 29 Mixe, and 23Mixtec from the central region of the State of Oaxaca, 21 Mayafrom the Yucatan, 22 Mazahuas from central Mexico, and 21Purepechas from Michoacan. The 95 Native South Americans in-cluded 24 Kogi, 16 Ticuna, 9 Embera, 8 Quechua, 9 Waunana,and 29 Zenu. Informed consent was obtained from all humansubjects by the investigators who collected the samples. The an-onymized samples were all genotyped at the Broad Institute ofthe Massachusetts Institute of Technology and Harvard.
SNP Databases
The most important source of ancestry-informative markers wasa database of ∼1.5 million markers genotyped in pooled European
1026 The American Journal of Human Genetics Volume 80 June 2007 www.ajhg.org
and pooled Mexican samples,26 part of a disease-mapping studyperformed by Perlegen Sciences (“POOLED”). Other sources in-cluded 1100,000 Affymetrix 100K markers genotyped in Euro-pean, Japanese, African American, Latino, and native Hawaiianpopulations in the Multiethnic Cohort27 (“MEC”); ∼3.8 millionmarkers whose frequencies in European, East Asian, and Africanpopulations were reported by The International HapMap Con-sortium28 (“HAPMAP”); ∼1.6 million markers whose frequenciesin European American, Asian American, and African Americanpopulations were reported by Hinds et al.29 (“HINDS”); 238,000markers that we genotyped in 19 Native Americans (11 Zapotecand 8 Mixe) on the Affymetrix Sty 250K chip (“250K”); and smallsets of ancestry-informative markers whose frequencies in Eu-ropean, African, and Native American populations were pub-lished by Smith et al.4 (“SMITH”), Parra et al.30 (“PARRA”), Collins-Schramm et al.31 (“COLLINS”), Sawyer et al.32 (“SAWYER”), andMartinez-Marignac et al.15 (“MARTINEZ”). There was no overlapbetween the samples used to build these databases of SNP fre-quencies and the samples we used for validation genotyping.
Ascertainment of Candidate Ancestry-Informative Markers
A total of 4,186 markers were selected in three successive stages:1,536 markers in each of the first two stages and 1,114 in thethird stage. Expected Shannon information content (SIC) be-tween European and Native American populations was computedfor each marker on the basis of observed frequencies in Europeanand Latino, Native American, or East Asian populations.4 (In theabsence of frequencies from Latino or Native American popula-tions, East Asians provide a useful surrogate for Native Americans,because they diverged from Native Americans more recently thanthe divergence of both populations from Europeans.30) Markerswere chosen by an algorithm that iteratively selected the can-didate marker that was most incrementally informative, on thebasis of the SIC prediction, after taking into account informationalready captured by markers selected elsewhere.4 (For the secondand third ascertainment stages, markers from earlier stages wereincluded in the input to the algorithm, with SIC computed fromvalidation genotyping results.) To minimize the likelihood ofchoosing markers in LD in Native American or other populations,we selected only markers with a genetic distance at least 0.3 cMfrom each previously selected marker, according to the Oxfordgenetic map.33
Validation of Candidate Ancestry-Informative Markers
The first set of 1,536 markers was genotyped in all available sam-ples from Latino populations and their putative ancestral pop-ulations (a total of 142 and 327 samples, respectively). For vali-dation of the second and third stages, we genotyped a subset ofDNA samples: 68 Latinos (29 LA Latinos, 24 Brazilians, and 15Colombians), 54 Europeans (31 from Spain and 23 from Balti-more), 84 Native North Americans (22 Zapotec, 28 Mixe, 21 Mix-tec, and 13 Mazahuas), and 26 Africans from Ghana. A total of23 Zenu samples from South America were also genotyped butwere not used in construction of our admixture map. To studysamples with maximum informativeness for admixture mapping,Latino samples with 120% African ancestry or !10% European orNative American ancestry were excluded from the second andthird stages, and Native American samples with 110% non–NativeAmerican admixture were also excluded. Genotyping was per-formed using the Illumina GoldenGate platform for the first two
stages and the iPLEX assay of the Sequenom MassARRAY platformfor the third stage.34,35
Genomewide Ancestry Inference with Useof Mixture-of-Binomials Model
Given a Latino population with counts and of twoa N � ai0 i0 i0
alleles at marker i, and given M ancestral populations with countsand at marker i in population j ( ), we inferreda N � a l � j � Mij ij ij
the underlying frequencies aij, together with ancestry proportionsyj. We used a mixture-of-binomials model in which the likelihoodis proportional to
Ma N �ai0 i0 i0 a N �aij ij ijy a 1 � y a a (1 � a )� � � �[ ]j ij j ij ij ij( ) ( )
i jp1j j
for each admixed population, and we estimated the parametersof this model by a Markov Chain–Monte Carlo algorithm.36 Theaccuracy of these estimates is limited by the fact that we do not,in fact, know the true ancestral populations. This model naturallygeneralizes to simultaneous inference of ancestry proportions ofmultiple Latino populations. Ancestry of individual Latino sam-ples can also be inferred by viewing each Latino sample as aseparate population.
Calculation of the Number of Samples Needed to Detectan Admixture Association
Suppose that there exists a disease locus at which 0, 1, or 2 chro-mosomal segments with Native American ancestry confer relativerisks of 1, R, or R2, respectively. If we define v as the percentageof Native American ancestry, the probability of 0, 1, or 2 segmentswith Native American ancestry at the disease locus is equal to
, , or , respectively, for con-2 2p p (1 � v) p p 2v(1 � v) p p vv,0 v,1 v,2
trols and , , or , re-2 2 2q p (1 � v) /j q p 2v(1 � v)R/j q p v R /jv,0 v,1 v,2
spectively, for disease cases, where 2j p (1 � v) � 2v(1 � v)R �
. The contribution of each disease sample to the overall LOD2 2v Rscore is then equal to , where k is the actual numberlog (q /p )10 v,k v,k
of chromosomal segments with Native American ancestry. GivenN disease samples with genomewide ancestries v1,…,vN, the ex-pected LOD score is
N 2
q log (q /p ) .� �[ ]v ,k 10 v ,k v ,kj j jjp1 kp0
To compute the power of an admixture scan for a populationdistribution of v values, we calculate the number of disease sam-ples needed, so that the expected LOD score is at least 5, whichis significant genomewide. (For real disease scans involving a mapwith imperfect information, the number of samples required toachieve significance needs to be scaled by relative informativenessat the locus.)
Selection of Markers for the Admixture Map
Marker selection was performed in several steps. (i) First, we ex-cluded markers with an SIC 10.05 between Europeans and Afri-cans and excluded markers with an SIC 10.05 between Zapotec(the Native American population of highest utility; see below)and other Native Americans. (ii) Second, we excluded pairs ofmarkers in LD in the ancestral populations, on the basis of the

www.ajhg.org The American Journal of Human Genetics Volume 80 June 2007 1027
Table 1. Sources of Markers Included inValidation Genotyping and in the Final AdmixtureMap
MarkerCategory
No. of Markers from Included Source
Stage1
Stage2
Stage3
AdmixtureMap
POOLED 1,223 125 544 858SMITH 276 0 0 0PARRA 8 0 0 0COLLINS 29 0 0 6HAPMAP 0 1,021 49 347HINDS 0 92 0 21MEC 0 297 45 151SAWYER 0 1 0 0250K 0 0 469 259MARTINEZ 0 0 7 5
Total 1,536 1,536 1,114 1,649
validation genotyping data for Native Americans, Europeans, andAfricans. In each population, we determined whether a pair ofmarkers was in LD, using a threshold of , for markers lo-P ! .01cated 1 cM apart, with a changing threshold inversely proportionalto genetic distance. (iii) Third, marker selection for the map wasbased on the SIC between Europeans and Native Americans, asdetermined by validation genotyping in 54 Europeans and 84Native North Americans. With use of these SIC values, 1,649markers were selected by an algorithm that iteratively chose themarker (not in LD with a previously selected marker) that wasmost incrementally informative after taking into account infor-mation already captured by previously selected markers. This issimilar to the algorithm we described elsewhere for building anAfrican American admixture map.4 We imposed a minimum cut-off of 0.05 for incremental information content, after which noadditional markers were chosen for the map. Sources of markersin the final admixture map are listed in table 1.
Percentage of Maximum-Informativeness Computation
We used Shannon entropy as a measure of the uncertainty ingenomewide ancestry or ancestry at a given locus. For a givenlocus i and individual j, we define Gj as the entropy of the ge-nomewide ancestry estimate of individual j and let Xij be theentropy of the ancestry estimate of individual j at locus i. Wedefine the relative power at locus i as . For ex-r p 1 � S X /S Gi j ij j j
ample, if for all j, then there is no information aboutX p Gij j
local ancestry (except for what is known about genomewide an-cestry), so . On the other hand, if for all j, then therer p 0 X p 0i ij
is perfect information about local ancestry, so . We definer p 1i
ravg as the average of ri across loci. A rough interpretation of ravg
is that times as many samples must be genotyped, relative1/ravg
to a study with perfect information about local ancestry (r pavg
), to achieve comparable power. The computation of ravg ac-1counts for uncertainty in the frequencies of the alleles in theancestral populations and thus corresponds to the estimate of∼50% of maximum informativeness reported in the first AfricanAmerican admixture map.4 The computation of ravg is now partof ANCESTRYMAP software1 (D.R. Lab Web site). We excludedone LA Latino and two Colombian individuals with 110% missingdata from our computation of ravg, since such individuals wouldtypically be dropped from a disease scan.
Simulated Disease Studies
We simulated Mexican, Colombian, and Puerto Rican popula-tions, using European, Native American, and African ancestry pro-portions described in the present study and elsewhere.21,22 Chro-mosomal segments were created under the assumption of l p
generations since admixture and were assigned ancestries by9use of those proportions. Genotypes were sampled from the 54European, 84 Native American, and 26 African samples used tobuild our admixture map. We also simulated Latino populationswith Native American genotypes sampled from only 22 Zapotecsamples or 23 Zenu samples. We call these Latino populations“LAT-ZAPO” and “LAT-ZENU,” respectively. To simulate diseasecases, we chose 10 disease loci at which our ravg statistic mostclosely matched its genomewide average (0.47 for LA Latinos and0.50 for Brazilians and Colombians), and we used one of thesedisease loci in each of 10 simulations. We assumed increased dis-ease risk of 1.5 for each chromosome with Native American an-cestry at the disease locus, thus raising the proportion of Native
American ancestry at that locus and chromosomal segments con-taining it. In control-only runs, controls were used to generateboth 1,000 “case” samples and 1,000 “control” samples. In case-control runs, 1,000 cases and 1,000 controls were used. Simula-tions were run using ANCESTRYMAP software1 (D.R. Lab Website), which produces a local LOD (log10 odds) score and a ge-nomewide LOD score on the basis of a locus-genome statistic thatcompares ancestry of cases at a candidate locus with genomewideancestry of cases. In this computation, controls are used onlyto improve allele-frequency estimates of ancestral populations,which aids inference of local ancestry in disease cases.
ResultsAncestry Proportions of Four Latino Populations
To evaluate the likely performance of Latino admixturemapping, we characterized the ancestry proportions andadmixture history of the four Latino populations exam-ined here. For this analysis, we analyzed data only fromthe first set of 1,536 markers, which were genotyped inthe largest number of populations (see the “Material andMethods” section). We focused primarily on autosomalmarkers. Analyses were performed using (i) the EIGEN-SOFT principal components analysis software package37
(D.R. Lab Web site), which also computes analysis of var-iance (ANOVA) and FST statistics; (ii) a mixture-of-bino-mials model (see the “Material and Methods” section); and(iii) the ANCESTRYMAP software package1 (D.R. Lab Website). Native American ancestries reported by each of thesemethods and by the STRUCTURE program38 were highlyconcordant with pairwise correlations 199% across sam-ples (data not shown).
The top two axes of variation from principal compo-nents analysis are displayed in figure 1. The top axis dis-tinguishes European/African from Native American ances-try, and the second axis distinguishes African from non-African ancestry. There is a wide variation in Native Amer-ican ancestry among Latino individuals. There is a rela-tively small contribution of African ancestry in all Latinopopulations, except for a small number of outlying sam-ples (also see mixture-of-binomials results in table 2). In

1028 The American Journal of Human Genetics Volume 80 June 2007 www.ajhg.org
Table 2. Ancestry Estimates of Four Latino Populations
Ancestry
Ancestry by Population(%)
LALatino Mexican Brazilian Colombian
European 48 52 71 71Native North American 40 43 10 7Native South American 4 2 8 12African 8 4 11 10
NOTE.—Estimates are conditioned on data from the European, NativeNorth American, Native South American, and African populations thatwe sampled, with the assumption that these are the correct ancestralpopulations. For each Latino population analyzed, SEs of populationancestries are !1% for European, total Native American, and Africanancestry and are !2% for Native North American and Native South Amer-ican ancestry. African ancestry estimates decrease to 5% for LA Latinosand to 8% for Brazilians if one LA Latino outlier and three Brazilianoutliers with unusually high African ancestry are omitted (fig. 1).
Figure 1. Top two axes of variation of Latinos, Europeans, Native Americans, and Africans. Coordinates along the top two axes ofvariation (eigenvectors) are dimensionless but roughly correspond to percentage of Native American ancestry for the first axis andpercentage of African ancestry for the second axis. LA Latino ( ), MEXpMexican ( ), BRApBrazilian ( ), COL-n p 38 n p 37 n p 37pColombian ( ), EURpEuropean ( ), NAMpNative North American ( ), SAMpNative South American ( ),n p 30 n p 57 n p 147 n p 95and AFRpAfrican ( ).n p 28
addition, there was clear evidence of admixture in manyNative American samples. ANOVA found no significantpopulation differences between LA Latinos and Mexicansor between Brazilians and Colombians along the top 10axes (P values 1.10). Differences between Native NorthAmericans and Native South Americans were marginalalong the top two axes (P values 1.03) but were highlysignificant along the third axis (P value ! ).�121 # 10
We used the mixture-of-binomials model to infer Latinoancestry proportions from European, Native North Amer-ican, Native South American, and African ancestral pop-ulations; this computation approximates each Latino pop-ulation as entirely descended from the ancestral popula-tions we sampled. Results are reported in table 2 and in-dicate higher total Native American ancestry for LA La-tinos and Mexicans (45% and 44%, respectively) than forBrazilians and Colombians (18% and 19%, respectively),which is in line with previous studies.21,22 We also observeduniformly higher Native American ancestry on the X chro-mosome (57% for LA Latinos, 54% for Mexicans, 33% forBrazilians, and 27% for Colombians), which is consistentwith evidence of predominantly European patrilineal andNative American matrilineal ancestry in Latino popula-tions.22 As expected, LA Latinos and Mexicans are wellmodeled as having all their Native American ancestryfrom North America (table 2). Interestingly, the NativeAmerican ancestry of Brazilians and Colombians is mod-eled equally well by Native North American and NativeSouth American populations. We hypothesize that this isbecause of the higher levels of genetic drift that occurredin Native South American populations23,39—consistentwith
their migration from North to South America and relativeisolation within South America—so that none of the Na-tive South American populations we sampled provides agood match for the true Native American ancestral pop-ulations of Brazilians and Colombians. In support of thisview, values of FST (measuring genetic drift) reported byEIGENSOFT (D.R. Lab Web site) averaged 0.09 among thesix Native South American populations but only 0.03among the six Native North American populations andonly 0.06 between Native North American and NativeSouth American populations (table 3). All of the sampledpopulations had African ancestry percentages between 4%and 11% (table 2). Because markers with large frequency

www.ajhg.org The American Journal of Human Genetics Volume 80 June 2007 1029
Table 3. FST Estimates for Each Pair of Native American Populations
FST Estimate
Mixe Mixtec Maya Mazahuas Purepechas Kogi Ticuna Embera Quechua Waunana Zenu
Zapotec .02 .03 .03 .03 .03 .09 .07 .07 .03 .07 .05Mixe .05 .06 .05 .06 .10 .07 .08 .05 .10 .07Mixtec .04 .03 .04 .11 .08 .07 .04 .08 .05Maya .02 .02 .10 .08 .05 .03 .04 .03Mazahuas .02 .10 .08 .06 .03 .06 .04Purepechas .11 .08 .06 .03 .06 .04Kogi .13 .11 .11 .13 .10Ticuna .09 .08 .11 .08Embera .06 .07 .05Quechua .05 .04Waunana .07
NOTE.—FST estimates are based on data from 147 Native North American samples (31 Zapotec, 29 Mixe, 23 Mixtec, 21 Maya,22 Mazahuas, and 21 Purepechas) and 95 Native South American samples (24 Kogi, 16 Ticuna, 9 Embera, 8 Quechua, 9 Waunana,and 29 Zenu). For each pair of populations, the SE of the FST estimate is !0.01. These results are intended to provide a qualitativepicture of allele-frequency differentiation among populations, but we caution that the markers used in this analysis were chosento be highly differentiated between Native American and European populations, which may lead to bias compared with analysisof randomly chosen markers.
differences between Europe and Africa were included inthis analysis, there is little uncertainty in the estimates ofancestry proportions (table 2).
We repeated this calculation, using 15 distinct ancestralpopulations, instead of grouping ancestral populationsinto four continents (table 4). Among European-derivedpopulations, the Spanish appear more closely related tothe European ancestors of all the Latino populations thanself-identified European Americans, who are likely to beprimarily of northern European descent. This is consistentwith the history of Spanish and Portuguese colonizationin Latin America. Among Native American populations,the Zapotec from Oaxaca in southern Mexico provide thebest predictor for the Native American ancestry of LA La-tinos (19%) and Mexicans (18%). The Mixe also providea substantial contribution to LA Latinos (9%) and Mexi-cans (7%), which is not surprising, since they are genet-ically close to the Zapotec (table 3). None of the NativeAmerican populations we sampled contributed 13% toBrazilian or Colombian ancestry. On the basis of theseresults, we favored Native North American populations formodeling the Native American ancestry of each Latinopopulation in subsequent analyses, with the Zapotec asthe single most useful population for the purpose of build-ing a map. From a historical point of view, it is importantto recognize that these results do not mean the Zapotecare the true ancestors of these Latino populations. Oursampling of Native American populations is incomplete(e.g., there are many unsampled Native American popu-lations in northern Mexico), and it could easily be thecase that an unsampled population is a better match tothe true ancestors of each Latino population.
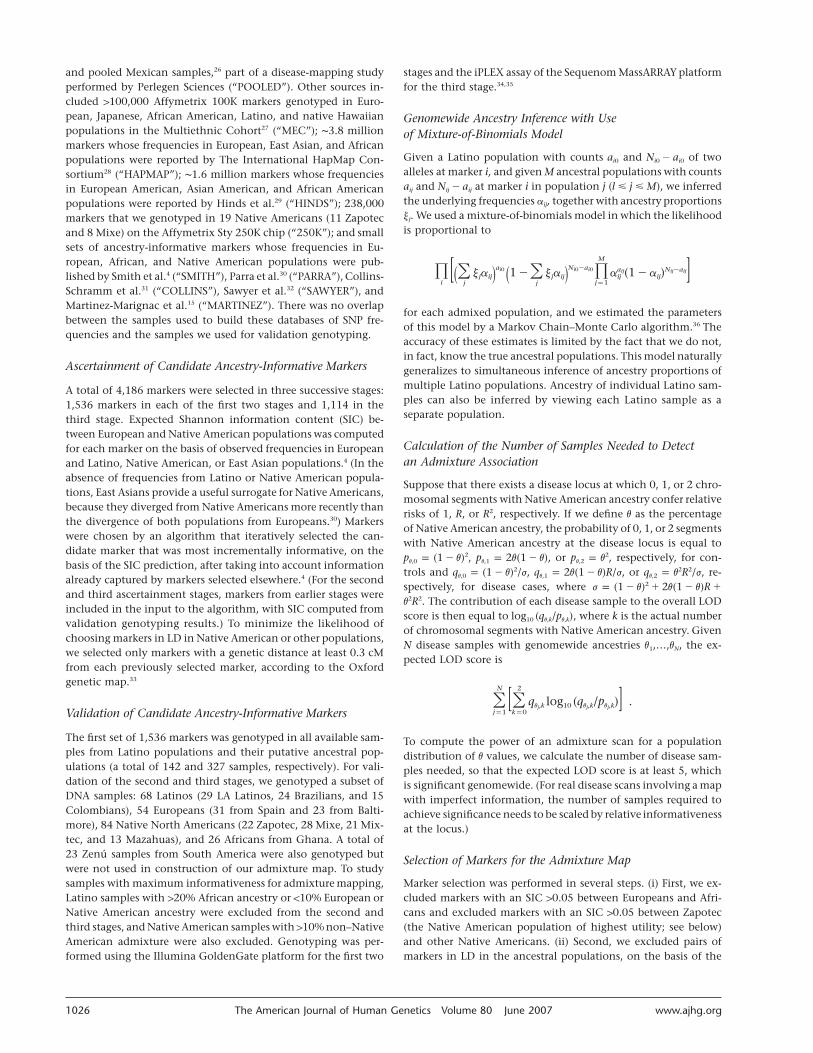
We next used the ANCESTRYMAP (D.R. Lab Web site)admixture-mapping software to infer the percentage ofNative American ancestry (v) and average number of gen-erations since admixture (l) of each Latino sample. Werestricted our analysis to SNPs genotyped in the first stage,
which we genotyped in all 142 Latinos. For the ancestralpopulations, we used 54 samples of European ancestry and84 Native North Americans (see the “Map Construction”section). The distribution of v for samples from each La-tino population is displayed in figure 2. Percentage of Na-tive American ancestry varies widely across populationsand individuals within populations: average estimates ofindividual ancestry (�SD) are for LA La-v p 43% � 20%tinos, for Mexicans, forv p 42% � 22% v p 19% � 10%Brazilians, and for Colombians. The an-v p 21% � 13%cestry estimates are concordant with those obtained byother methods (fig. 1 and table 2), despite the differentset of ancestral samples. Our estimates of the average num-ber of generations since admixture are forl p 8.5 � 0.9LA Latinos, for Mexicans, forl p 8.8 � 1.2 l p 8.4 � 1.0Brazilians, and for Colombians. These val-l p 9.2 � 0.9ues are somewhat higher than the we re-l p 6.3 � 1.1ported elsewhere for African Americans,4 which implies thatsegments of ancestry in Latinos will be shorter on averagethan in African Americans and that admixture genomescans for Latinos will require more markers than for AfricanAmericans to achieve a similar level of informativeness.
Expected Power of Admixture Mapping in Four LatinoPopulations
To estimate the number of cases that would be needed todetect an admixture association in the Latino populationsexamined here, we used the distribution of ancestries ofindividual samples and assumed perfect information aboutancestry at each locus in the genome (see the “Materialand Methods” section). For this analysis, LA Latinos weremerged with Mexicans, and Brazilians were merged withColombians, because of their similar ancestry distribu-tions within the limits of our resolution (fig. 2). We in-cluded in this analysis our previous results for AfricanAmericans.4 Figure 3 shows that LA Latinos and Mexicans

1030 The American Journal of Human Genetics Volume 80 June 2007 www.ajhg.org
Table 4. Ancestry Estimates of 4 Latino Populationsfrom 15 Ancestral Populations Sampled
AncestralPopulation
Ancestry by Population(%)
LALatino Mexican Brazilian Colombian
EUR: Spanish 34 36 35 48EUR: Baltimore 15 17 37 24NAM: Zapotec 19 18 2 2NAM: Mixe 9 7 1 1NAM: Mixtec 2 2 1 1NAM: Maya 1 4 2 2NAM: Mazahuas 3 4 0 1NAM: Purepechas 3 4 1 1SAM: Kogi 3 2 2 3SAM: Ticuna 2 2 1 1SAM: Embera 1 0 1 2SAM: Quechua 1 1 3 1SAM: Waunana 1 1 1 1SAM: Zenu 1 0 1 3AFR: Ghana 7 4 11 10
NOTE.—For each Latino population analyzed, SEs are !1% for totalEuropean, total Native American, and African ancestry; !4% for an-cestry from each European population; and !2% for ancestry fromeach Native American population. African ancestry estimates de-crease to 5% for LA Latinos and 8% for Brazilians when one LA Latinooutlier and three Brazilian outliers with unusually high African an-cestry are omitted (fig. 1).
provide the highest statistical power per sample for ad-mixture mapping (fewest samples needed), because of thelarge proportions of both European and Native Americanancestry in these populations. In contrast, Brazilians andColombians provide the lowest power, because of theirlow percentage of Native American ancestry. To illustratethe difference in power across populations because of vary-ing Native American ancestry proportion, we calculatethat, to detect a locus with 50% of the maximum infor-mation content where Native American ancestry on av-erage confers 1.5-fold increased risk for disease, 724 casesare needed for detection in LA Latinos and Mexicans, and846 cases are needed for detection in Brazilians and Col-ombians (these numbers are obtained by dividing the val-ues in fig. 3 by 50%).
Map Construction
On the basis of our empirical observations about popu-lation structure from the first stage of validation genotyp-ing, we made several decisions for subsequent map con-struction. First, we decided to focus on distinguishing onlybetween European/African ancestry and Native Americanancestry and thus eliminated all markers with an SIC 10.05between Europeans and Africans. Second, we decided tomodel the Native American ancestry component of Lati-nos by using Native North Americans only. Third, we re-stricted the second and third stages of validation geno-typing to a subset of samples that we believed would mostefficiently provide information relevant to assessing thequality of the admixture map. We analyzed 54 European
and 26 African samples. For Native North Americans, weexcluded samples with 110% non–Native American admix-ture. Because roughly half of Maya and Purepechas sam-ples showed significant admixture, we restricted sampleselection to the Zapotec, Mixe, Mixtec, and Mazahuas pop-ulations, which yielded 84 samples. For Latinos, we didnot include Mexicans, because the LA Latinos appearedto have similar admixture history. We also excluded sam-ples that had been estimated in the first stage to have highAfrican ancestry (120%) or low European or Native Amer-ican ancestry (!10%). Fourth, to exclude markers with het-erogeneous allele frequencies across populations, we elim-inated all markers with an SIC 10.05 between the Zapotec(the most useful Native American ancestral population inpractice) and the remaining Native American populations(Mixe, Mixtec, and Mazahuas).
Of the 4,186 markers genotyped in three stages, 3,130markers were genotyped successfully in all populationsand had an SIC !0.05 between Europeans and Africansand an SIC !0.05 between Zapotec and the remaining Na-tive American populations. We used the genotyping re-sults to construct a map of 1,649 markers (see the “Ma-terial and Methods” section). As shown in table 1, thePOOLED database contributed the greatest number ofmarkers to the map, because of its large number of markersand directly relevant populations (Europeans and Mexi-cans). We note that no markers from our African Americanadmixture map (SMITH) were chosen, because of the de-cision to exclude markers that are substantially differentin frequency between Europeans and Africans. A scatterplot of frequencies of the 1,649 markers in Europeans andNative Americans, as determined by validation genotyp-ing, is displayed in figure 4. Because most markers wereascertained from data sets that included European but notNative American ancestral populations, more markers arefixed (or nearly fixed) in Europeans than in Native Am-ericans. A complete list of markers and their frequenciesin Europeans and Native Americans is available online(see the Latino admixture map Web site). The average fre-quency difference between Europeans and Native Amer-icans in validation genotyping was 52%, yielding an FST
between these populations of 0.50 for this set of markers.In contrast, the FST between Europeans and Africans was!0.05, and the average FST between the Zapotec and theother three Native American populations we retained was!0.01.
Assessment of Possible Overfitting
Because the same set of samples was used to select a subsetof 1,649 markers (from the 4,186 candidate markers) forour admixture map and to subsequently evaluate the map,there exists the possibility of overfitting. We assessed theextent of overfitting by splitting the samples into fourquartiles. For each quartile, we built an admixture map of1,649 markers, using only samples from the other threequartiles to prioritize markers. We compared the informa-
www.ajhg.org The American Journal of Human Genetics Volume 80 June 2007 1031
Figure 2. Histogram of percentage of Native American ancestry in samples from four Latino populations
tiveness of these markers in each of three in-sample quar-tiles and in one out-of-sample quartile. When we averagedacross four choices of the out-of-sample quartile, the fre-quency difference between Europeans and Native Amer-icans averaged 52.4% for in-sample quartiles and 51.5%for out-of-sample quartiles, an extremely small difference.Thus, there is no substantial overestimation of the infor-mativeness of our map due to overfitting.
Informativeness of Our Admixture Map
We computed a percentage of maximum-informativenessstatistic (ravg) that evaluates the informativeness of the ad-mixture map for inferring ancestry of chromosomal seg-ments in Latino populations (see the “Material and Meth-ods” section). We modeled the ancestral populations with54 European and 84 Native American samples (see the

1032 The American Journal of Human Genetics Volume 80 June 2007 www.ajhg.org
Figure 3. Number of samples needed to detect a disease locuswith use of admixture mapping. For each population, this quantityis computed under the ideal assumption of perfect informationabout ancestry, as a function of the relative disease risk conferredby each copy of a particular ancestry at the disease locus. Toconvert from this to the actual number of samples required fordetecting a disease locus with the map, it is necessary to multiplyby ; that is, the reciprocal of the information extraction at1/ravg
the locus (estimated in fig. 5).
Figure 4. European and Native American allele frequencies forthe 1,649 markers in the final map, which are based on the resultsof validation genotyping.
“Map Construction” section). We obtained forr p 0.47avg
LA Latinos and for a combined analysis of Bra-r p 0.50avg
zilians and Colombians. The computation of ravg fully ac-counts for uncertainty in the frequencies of ancestral pop-ulations; thus, these results are comparable to the estimateof ∼50% of maximum informativeness for admixture map-ping reported in the first African American admixture map,as well as in the Marshfield microsatellite-based maps forlinkage mapping.4 The lower ravg for LA Latinos (vs. Bra-zilians and Colombians or vs. the first African Americanadmixture map) is more than offset by the higher theo-retical power of LA Latinos for admixture mapping (fig.3). For each population, the informativeness at each locusin the genome is displayed in figure 5.
Empirical Evaluation of How Well Ancestral PopulationsApproximate Latino-Ancestry Segments
We evaluated whether the 54 Europeans and 84 NativeAmericans provide suitable ancestral populations for seg-ments of European/African and Native American ancestryin the Latino samples we analyzed. This was assessed usingthe parameter t reported by ANCESTRYMAP (D.R. LabWeb site), which is asymptotically equal to for large0.5/FST
t.1 For each Latino population, we estimated that t 1 500( ) for European/African segments andF ! 0.001 t 1 100ST
( ) for Native American segments. These resultsF ! 0.005ST
are encouraging: they imply that European samples pro-vide an accurate proxy for European/African ancestry seg-ments, because our construction of a map includes onlymarkers with low differentiation between European andAfrican populations (and because of the fact that only a
small proportion of segments of European/African ances-try are actually African). The 84 Native American samplesfrom four populations provide a somewhat less accurateancestral population, reflecting the underlying populationhistory of population fragmentation and drift in the Amer-icas. Nevertheless, is practical for admixture scans.4t 1 100
Simulated Disease Studies
To evaluate how our admixture map would perform in anactual disease study, we simulated samples from five hy-pothetical Latino populations with various European, Na-tive American, and African ancestry proportions and var-ious choices of the population contributing Native Amer-ican ancestry (see the “Material and Methods” section).In control-only runs, 1,000 “case” samples and 1,000 “con-trol” samples were drawn from simulated Latino controls,to check that no false-positive results were reported. Asexpected, ANCESTRYMAP reported maximum local LODscores !3 and genomewide LOD scores !0, indicating nodisease association (table 5). In case-control runs, 1,000cases and 1,000 controls were used, with cases simulatedon the basis of Native American ancestry risk of 1.5 at thedisease locus (see the “Material and Methods” section).For each Latino population simulated, ANCESTRYMAP re-ported local LOD scores at the disease locus 15 and ge-nomewide LOD scores 12, correctly identifying the diseaselocus (table 5). We particularly emphasize the success ofthe simulations in a simulated Latino population (LAT-ZENU) in which Native American ancestry was modeledusing data from the Zenu population, which was not usedto choose markers or generate counts for our admixturemap and which is substantially different from the Zapotec,

Figure 5. Informativeness of the Latino admixture map as a percentage of the maximum, assessed empirically by the ravg statistic inLA Latinos (dark blue) and in Colombians and Brazilians (light blue). The X-axis gives genetic position, with each of 1,649 markersshown using hash marks. Informativeness of the map is slightly less at the edge of chromosomes, since we cannot use markers fromboth sides to infer ancestry. For comparison, in gray, we also show the power of our 1st-generation African American admixture map(1,166 markers used in a multiple sclerosis study6). chrpChromosome.

1034 The American Journal of Human Genetics Volume 80 June 2007 www.ajhg.org
Table 5. Results of Simulated Disease Studies in FiveSimulated Latino Populations
Population
EUR/NA/AFRAncestry
(%)
Control-OnlyLOD
Case-ControlLOD
Local Global Local Global
MEX 50/45/5 .5 �2.3 8.0 4.9COL 70/20/10 .9 �1.8 7.0 4.0PR 60/20/20 1.3 �1.5 6.4 3.4LAT-ZAPO 50/45/5 .4 �2.3 10.4 7.3LAT-ZENU 50/45/5 1.1 �1.7 6.7 3.7
NOTE.—We list the ancestry proportions used to simulate eachpopulation and the local and global LOD scores averaged across10 control-only simulations and 10 case-control simulations. MEXpMexican; COLpColumbian; PRpPuerto Rican. LAT-ZAPO and LAT-ZENU differ from MEX in that Native American ancestry was simulatedusing only 22 Zapotec samples and 23 Zenu samples, respectively.
Table 6. Accuracy of Local-AncestryAssignments in Simulated Latinos
Ancestries
Probability ofLoci withTrue NA
Probability1.5
0NA
1NA
2NA
EUR/EUR .71 .27 .02 .77EUR/AFR .70 .28 .02 .76AFR/AFR .70 .28 .02 .76EUR/NA .17 .70 .13 .81AFR/NA .17 .69 .14 .81NA/NA .03 .33 .64 .67
NOTE.—For each possible pair of ancestries rep-resented on a pair of chromosomes, we report theaverage estimated probability of 0, 1, or 2 NativeAmerican (NA) chromosomes at this locus, withthe probability corresponding to the true numberof Native American chromosomes shown in bold.We also report the proportion of loci at which thetrue number of Native American chromosomes wascorrectly assigned a probability of at least 50%.Results are reported only for Mexican control-onlysimulations. EURpEuropean; AFRpAfrican.
Mixe, Mixtec, and Mazahuas populations used to buildour map (table 3). We also note the success of the simu-lations in a simulated Puerto Rican population with 20%African ancestry. Together, these results imply that ourmap will be useful in a wide range of Latino populations.
To evaluate the local ancestry estimates produced byANCESTRYMAP, for each possible pair of ancestries (Eu-ropean, Native American, or African) represented on a pairof chromosomes, we computed the average estimated prob-ability of 0, 1, or 2 Native American chromosomes at thatlocus and the proportion of loci at which the true numberof Native American chromosomes was correctly assigneda probability of at least 50%. Results for Mexican control-only simulations are reported in table 6. (Other simula-tions produced similar results; data not shown). Overall,ancestry assignments were correct for 77% of all loci, withEuropean versus African ancestry having little effect onaccuracy.
Discussion
We have constructed a Latino admixture map whosepower for inferring ancestry of chromosomal segments inLatino samples is comparable to the power of the firstAfrican American admixture map4 and thus constitutes apractical resource for admixture mapping in Latinos. Al-though there are a few gaps in the map and the infor-mation extraction is only 47%–50% of the maximum, thequality of panels for admixture mapping can be improvedfurther by genotyping populations with Native Americanancestry on whole-genome scanning arrays that are com-plementary to the data sources we used here. We empha-size that validation of all the markers in new samples ofEuropean, Native American, and African ancestry is crucialfor construction of a practical map. Of the 4,186 markerswe ascertained, only 1,649 markers survived all our filtersand proved incrementally informative for disease map-ping. We expect that similar reductions will occur withany marker-ascertainment strategy used to generate a ro-bust resource for disease mapping in Latinos, because of
the complex admixture history of these populations, whichgenerates many potential pitfalls for disease mapping.
An advantage of our map-building strategy is that wehave reduced the complexities inherent in admixture map-ping in Latinos. Because we eliminated markers with verydifferent frequencies between European and African pop-ulations, the data from this map can be usefully analyzedby existing admixture-mapping software for mapping intwo ancestral populations.1,2 As a consequence, our mapcan be applied to identify risk loci for any disease in whichNative American ancestry increases or reduces genetic risk,but it is not able to detect loci with different risks forEuropeans versus African ancestry; such loci can be morepowerfully mapped in African Americans. We have alsoimproved the robustness of the map by removing markersfor which there is evidence of frequency heterogeneityacross Native American populations and by restrictingthe map to markers that are not in LD in the ancestralpopulations.
Our results also reveal substantial variability in the pro-portion of Native American ancestry across Latino popula-tions.11,12,21,22 Native American ancestry is close to 50% inLA Latinos and in Mexicans; despite the wide variabilitywithin a population (fig. 2), this means that admixturemapping should be 15%–30% more powerful per samplein these populations than in Colombians or Brazilians,who have lower proportions of Native American ancestry(fig. 3). We emphasize that our empirical assessment ofLatino populations is by no means comprehensive; thereare many Latino populations that have substantially dif-ferent histories from the populations we studied, includ-ing multiple populations in each of the four countriesfrom which our Latino populations were drawn. None-theless, our simulations indicate that our admixture mapwill be useful across a wide range of Latino populations,

www.ajhg.org The American Journal of Human Genetics Volume 80 June 2007 1035
including Latino populations whose Native American an-cestry is substantially different from the Native Americanpopulations used to build our map and including Latinopopulations with up to 20% African ancestry. A caveat isthat there exist many Latino populations with a largercontribution of African ancestry, for which our map is notwell suited.
An important question is whether admixture mappingwill be a useful methodology in the age of dense whole-genome scans with hundreds of thousands of markers. Theadvantages of admixture mapping include (i) the poten-tially much lower genotyping cost, which we estimate re-mains ∼5 times lower per sample for genotyping the ∼1,600markers in our map, compared with the cost of a densewhole-genome scan; (ii) the use of a locus-genome statis-tic that considers local ancestry estimates of disease casesonly, with no noise introduced from controls, leading toan improvement in power1 by a factor of 2; and (iii) thecoarse granularity of the admixture signal, which reducesthe number of hypotheses tested (or, in Bayesian terms,increases the prior probability of each causal hypothesis)versus the hundreds of thousands of hypotheses tested indense whole-genome scans. Disadvantages of admixturemapping include (i) the imperfect proxy that local ances-try will provide for a disease allele, even in the case of adisease allele that differs substantially between ancestralpopulations; (ii) the imperfect power to estimate local an-cestry, which, for our map, is 47%–50%; and (iii) the needfor additional fine mapping of !1% of the genome in thefraction of admixture scans that successfully identify adisease locus. Weighing these advantages and disadvan-tages, we believe that admixture mapping will continueto be a useful methodology for disease mapping, partic-ularly because of the reduction in the number of hypoth-eses tested and the increase in power that results from notintroducing noise from controls.
Acknowledgments
We thank Itsik Peer for assistance with the MEC 100K data, TheBroad Institute Center for Genotyping and Analysis, George Ay-odo and Courtney Montague for assistance with genotyping, An-drew Kirby for assistance with figure 5, and Maribel Rodriguez,Phabiola Herrera, Giovanni Poletti, Sijia Wang, and David E. Ruizfor assistance with DNA samples. A.L.P. is supported by a RuthKirschstein K-08 award from the National Institutes of Health(NIH). A.V. is supported by Colciencias grant 111504012986.M.C.B. and F.M.S. are supported by the Institutos do Milenio andApoio a Nucleos de Excelencia Programs, Conselho Nacional deDesenvolvimento Cientifico e Tecnologico, and Fundacao de Am-paro a Pesquisa do Estado do Rio Grande do Sul. D.R. is supportedby a Burroughs Wellcome Career Development Award in the Bio-medical Sciences. Support for this project was provided by theBroad-Novartis-Lund Type 2 Diabetes Initiative, discretionaryfunding from Harvard Medical School (to D.R.), NIH grantsNS043538 (to A.R.-L.) and DK073818 (to D.R.), and federal fundsfrom the National Cancer Institute, NIH, under contract N01-CO-12400. C.W. is supported by the Intramural Research Program
of the Center for Cancer Research, National Cancer Institute, NIH,but the content of this publication does not necessarily reflectthe views or policies of the Department of Health and HumanServices, nor does mention of trade names, commercial products,or organizations imply endorsement by the U.S. Government.The Broad Institute Center for Genotyping and Analysis is sup-ported by National Center for Research Resources grant U54RR020278-01.
Web Resources
The URLs for data presented herein are as follows:
D.R. Lab Web site, http://genepath.med.harvard.edu/˜reich/Software.htm (for ANCESTRYMAP and EIGENSOFT software)
Latino admixture map, http://genepath.med.harvard.edu/˜reich/Latinomap.htm (for the list of 1,649 markers)
Online Mendelian Inheritance in Man (OMIM), http://www.ncbi.nlm.nih.gov/Omim/ (for prostate cancer, type 2 diabetes, obe-sity, gallbladder disease, rheumatoid arthritis, and asthma)
References
1. Patterson N, Hattangadi N, Lane B, Lohmueller KE, HaflerDA, Oksenberg JR, Hauser SL, Smith MW, O’Brien SJ, AltshulerD, et al (2004) Methods for high-density admixture mappingof disease genes. Am J Hum Genet 74:979–1000
2. Hoggart CJ, Shriver MD, Kittles RA, Clayton DG, McKeiguePM (2004) Design and analysis of admixture mapping studies.Am J Hum Genet 74:965–978
3. Montana G, Pritchard JK (2004) Statistical tests for admixturemapping with case-control and cases-only data. Am J HumGenet 75:771–789
4. Smith MW, Patterson N, Lautenberger JA, Truelove AL, Mc-Donald GJ, Waliszewska A, Kessing BD, Malasky MJ, Scafe C,Le E, et al (2004) A high-density admixture map for diseasegene discovery in African Americans. Am J Hum Genet 74:1001–1013
5. Zhu X, Luke A, Cooper RS, Quertermous T, Hanis C, MosleyT, Gu CC, Tang H, Rao DC, Risch N, et al (2005) Admixturemapping for hypertension loci with genome-scan markers.Nat Genet 37:177–181
6. Reich D, Patterson N, De Jager PL, McDonald GJ, WaliszewskaA, Tandon A, Lincoln RR, DeLoa C, Fruhan SA, Cabre P, et al(2005) A whole-genome admixture scan finds a candidatelocus for multiple sclerosis susceptibility. Nat Genet 37:1113–1118
7. Freedman ML, Haiman CA, Patterson N, McDonald GJ, Tan-don A, Waliszewska A, Penney K, Steen RG, Ardlie K, JohnEM, et al (2006) Admixture mapping identifies 8q24 as a pros-tate cancer risk locus in African-American men. Proc NatlAcad Sci USA 103:14068–14073
8. Tian C, Hinds DA, Shigeta R, Kittles R, Ballinger DG, SeldinMF (2006) A genomewide single-nucleotide–polymorphismpanel with high ancestry information for African Americanadmixture mapping. Am J Hum Genet 79:640–649
9. Haiman CA, Patterson N, Freedman ML, Myers SR, Pike MC,Waliszewska A, Neubauer J, Tandon A, Schirmer C, McDonaldGJ, et al (2007) Multiple regions within 8q24 independentlyaffect risk for prostate cancer. Nat Genet (electronically pub-lished ahead of print April 1, 2007; accessed April 11, 2007)
10. Gonzalez Burchard E, Borrell LN, Choudhry S, Naqvi M, TsaiHJ, Rodriguez-Santana JR, Chapela R, Rogers SD, Mei R, Rod-
1036 The American Journal of Human Genetics Volume 80 June 2007 www.ajhg.org
riguez-Cintron W, et al (2005) Latino populations: a uniqueopportunity for the study of race, genetics, and social envi-ronment in epidemiological research. Am J Public Health 95:2161–2168
11. Sans M (2000) Admixture studies in Latin America: from the20th to the 21st century. Hum Biol 72:155–177
12. Salzano FM, Bortolini MC (2002) The evolution and geneticsof Latin American populations. Cambridge University Press,Cambridge, United Kingdom
13. Weiss KM, Ferrell RE, Hanis CL (1984) A new world syndromeof metabolic diseases with a genetic and evolutionary basis.Am J Phys Anthropol Suppl S5 27:153–178
14. Williams RC, Long JC, Hanson RL, Sievers ML, Knowler WC(2000) Individual estimates of European genetic admixtureassociated with lower body-mass index, plasma glucose, andprevalence of type 2 diabetes in Pima Indians. Am J HumGenet 66:527–538
15. Martinez-Marignac VL, Valladares A, Cameron E, Chan A,Perera A, Globus-Goldberg R, Wacher N, Kumate J, McKeigueP, O’Donnell D, et al (2007) Admixture in Mexico City: im-plications for admixture mapping of type 2 diabetes geneticrisk factors. Hum Genet 120:807–819
16. Silman AJ, Pearson JE (2002) Epidemiology and genetics ofrheumatoid arthritis. Arthritis Res Suppl 3 4:S265–S272
17. Salari K, Choudhry S, Tang H, Naqvi M, Lind D, Avila PC,Coyle NE, Ung N, Nazario S, Casal J, et al (2005) Geneticadmixture and asthma-related phenotypes in Mexican Amer-ican and Puerto Rican asthmatics. Genet Epidemiol 29:76–86
18. Crawford ED (2003) Epidemiology of prostate cancer. UrologySuppl 6A 62:3–12
19. Smith MW, Lautenberger JA, Shin HD, Chretien J-P, ShresthaS, Gilbert DA, O’Brien SJ (2001) Markers for mapping by ad-mixture linkage disequilibrium in African American and His-panic populations. Am J Hum Genet 69:1080–1094
20. The International HapMap Consortium (2003) The Interna-tional HapMap Project. Nature 426:789–796
21. Choudhry S, Coyle NE, Tang H, Salari K, Lind D, Clark SL,Tsai HJ, Naqvi M, Phong A, Ung N, et al (2006) Genetics ofasthma in Latino Americans GALA Study: population strat-ification confounds genetic association studies among Lati-nos. Hum Genet 118:652–664
22. Bedoya G, Montoya P, Garcia J, Soto I, Bourgeois S, CarvajalL, Labuda D, Alvarez V, Ospina J, Hedrick PW, et al (2006)Admixture dynamics in Hispanics: a shift in the nuclear ge-netic ancestry of a South American population isolate. ProcNatl Acad Sci USA 103:7234–7239
23. Cavalli-Sforza LL, Menozzi P, Piazza A (1994) The history andgeography of human genes. Princeton University Press, Prince-ton, NJ
24. Collins-Schramm HE, Chima B, Operario DJ, Criswell LA, Sel-din MF (2003) Markers informative for ancestry demonstrateconsistent megabase-length linkage disequilibrium in the Af-rican American population. Hum Genet 113:211–219
25. Conrad DF, Jakobsson M, Coop G, Wen X, Wall JD, RosenbergNA, Pritchard JK (2006) A worldwide survey of haplotypevariation and linkage disequilibrium in the human genome.Nat Genet 38:1251–1260
26. Hinds DA, Stokowski RP, Patil N, Konvicka K, KershenobichD, Cox DR, Ballinger DG (2004) Matching strategies for ge-netic association studies in structured populations. Am J HumGenet 74:317–325
27. Haiman CA, Stram DO, Pike MC, Kolonel LN, Burtt NP, Al-tshuler D, Hirschhorn J, Henderson BE (2003) A comprehen-sive haplotype analysis of CYP19 and breast cancer risk: theMultiethnic Cohort. Hum Mol Genet 12:2679–2692
28. The International HapMap Consortium (2005) A haplotypemap of the human genome. Nature 437:1299–1320
29. Hinds DA, Stuve LL, Nilsen GB, Halperin E, Eskin E, BallingerDG, Frazer KA, Cox DR (2005) Whole-genome patterns ofcommon DNA variation in three human populations. Science307:1072–1079
30. Parra EJ, Marcini A, Akey J, Martinson J, Batzer MA, CooperR, Forrester T, Allison DB, Deka R, Ferrell RE, et al (1998)Estimating African American admixture proportions by useof population-specific alleles. Am J Hum Genet 63:1839–1851
31. Collins-Schramm HE, Chima B, Morii T, Wah K, Figueroa Y,Criswell LA, Hanson RL, Knowler WC, Silva G, Belmont JW,et al (2004) Mexican American ancestry-informative markers:examination of population structure and marker character-istics in European Americans, Mexican Americans, Amerin-dians and Asians. Hum Genet 114:263–271
32. Sawyer SL, Mukherjee N, Pakstis AJ, Feuk L, Kidd JR, BrookesAJ, Kidd KK (2005) Linkage disequilibrium patterns vary sub-stantially among populations. Eur J Hum Genet 13:677–686
33. Myers S, Bottolo L, Freeman C, McVean G, Donnelly P (2005)A fine-scale map of recombination rates and hotspots acrossthe human genome. Science 310:321–324
34. Fan JB, Oliphant A, Shen R, Kermani BG, Garcia F, GundersonKL, Hansen M, Steemers F, Butler SL, Deloukas P, et al (2003)Highly parallel SNP genotyping. Cold Spring Harb Symp QuantBiol 68:69–78
35. Tang K, Fu D, Julien D, Braun A, Cantor CR, Koster H (1999)Chip-based genotyping by mass spectrometry. Proc Natl AcadSci USA 96:10016–10020
36. Chen M, Shao Q, Ibrahim JG (2000) Monte Carlo methodsin Bayesian computation. Springer, New York
37. Patterson N, Price AL, Reich D (2006) Population structureand eigenanalysis. PLoS Genet 2:e190
38. Pritchard JK, Stephens M, Donnelly P (2000) Inference ofpopulation structure using multilocus genotype data. Genet-ics 155:945–999
39. Bortolini MC, Salzano FM, Bau CH, Layrisse Z, Petzl-Erler ML,Tsuneto LT, Hill K, Hurtado AM, Castro-De-Guerra D, BedoyaG, et al (2002) Y-chromosome biallelic polymorphisms andNative American population structure. Ann Hum Genet 66:255–259