A Genome-Scale Model of Shewanella piezotolerans Simulates ...
19
University of Rhode Island DigitalCommons@URI Cell and Molecular Biology Faculty Publications Cell and Molecular Biology 2017 A Genome-Scale Model of Shewanella piezotolerans Simulates Mechanisms of Metabolic Diversity and Energy Conservation Keith Dufault-ompson University of Rhode Island Huahua Jian See next page for additional authors Creative Commons License is work is licensed under a Creative Commons Aribution 4.0 License. Follow this and additional works at: hps://digitalcommons.uri.edu/cmb_facpubs is Article is brought to you for free and open access by the Cell and Molecular Biology at DigitalCommons@URI. It has been accepted for inclusion in Cell and Molecular Biology Faculty Publications by an authorized administrator of DigitalCommons@URI. For more information, please contact [email protected]. Citation/Publisher Aribution Dufault-ompson K, Jian H, Cheng R, Li J, Wang F, Zhang Y. 2017. A genome-scale model of Shewanella piezotolerans simulates mechanisms of metabolic diversity and energy conservation. mSystems 2:e00165-16. hps://doi.org/10.1128/mSystems 2:e00165-16 Available at: hps://doi.org/10.1128/mSystems 2:e00165-16
Transcript of A Genome-Scale Model of Shewanella piezotolerans Simulates ...

University of Rhode IslandDigitalCommons@URI
Cell and Molecular Biology Faculty Publications Cell and Molecular Biology
2017
A Genome-Scale Model of Shewanella piezotoleransSimulates Mechanisms of Metabolic Diversity andEnergy ConservationKeith Dufault-ThompsonUniversity of Rhode Island
Huahua Jian
See next page for additional authors
Creative Commons License
This work is licensed under a Creative Commons Attribution 4.0 License.
Follow this and additional works at: https://digitalcommons.uri.edu/cmb_facpubs
This Article is brought to you for free and open access by the Cell and Molecular Biology at DigitalCommons@URI. It has been accepted for inclusionin Cell and Molecular Biology Faculty Publications by an authorized administrator of DigitalCommons@URI. For more information, please [email protected].
Citation/Publisher AttributionDufault-Thompson K, Jian H, Cheng R, Li J, Wang F, Zhang Y. 2017. A genome-scale model of Shewanella piezotolerans simulatesmechanisms of metabolic diversity and energy conservation. mSystems 2:e00165-16. https://doi.org/10.1128/mSystems2:e00165-16Available at: https://doi.org/10.1128/mSystems 2:e00165-16

AuthorsKeith Dufault-Thompson, Huahua Jian, Ruxue Cheng, Jiefu Li, Fengping Wang, and Ying Zhang
This article is available at DigitalCommons@URI: https://digitalcommons.uri.edu/cmb_facpubs/83

A Genome-Scale Model of Shewanellapiezotolerans Simulates Mechanisms ofMetabolic Diversity and EnergyConservation
Keith Dufault-Thompson,a,b Huahua Jian,c Ruixue Cheng,c Jiefu Li,c*Fengping Wang,c Ying Zhanga
Department of Cell and Molecular Biologya and Graduate School of Biological and Environmental Sciences,b
College of the Environment and Life Sciences, University of Rhode Island, Kingston, Rhode Island, USA; StateKey Laboratory of Microbial Metabolism, School of Life Sciences and Biotechnology, Shanghai Jiao TongUniversity, Shanghai, People’s Republic of Chinac
ABSTRACT Shewanella piezotolerans strain WP3 belongs to the group 1 branch ofthe Shewanella genus and is a piezotolerant and psychrotolerant species isolatedfrom the deep sea. In this study, a genome-scale model was constructed for WP3 us-ing a combination of genome annotation, ortholog mapping, and physiological veri-fication. The metabolic reconstruction contained 806 genes, 653 metabolites, and922 reactions, including central metabolic functions that represented nonhomolo-gous replacements between the group 1 and group 2 Shewanella species. Metabolicsimulations with the WP3 model demonstrated consistency with existing knowledgeabout the physiology of the organism. A comparison of model simulations with ex-perimental measurements verified the predicted growth profiles under increasingconcentrations of carbon sources. The WP3 model was applied to study mechanismsof anaerobic respiration through investigating energy conservation, redox balancing,and the generation of proton motive force. Despite being an obligate respiratory or-ganism, WP3 was predicted to use substrate-level phosphorylation as the primarysource of energy conservation under anaerobic conditions, a trait previously identi-fied in other Shewanella species. Further investigation of the ATP synthase activityrevealed a positive correlation between the availability of reducing equivalents inthe cell and the directionality of the ATP synthase reaction flux. Comparison of the WP3model with an existing model of a group 2 species, Shewanella oneidensis MR-1, re-vealed that the WP3 model demonstrated greater flexibility in ATP production under theanaerobic conditions. Such flexibility could be advantageous to WP3 for its adaptationto fluctuating availability of organic carbon sources in the deep sea.
IMPORTANCE The well-studied nature of the metabolic diversity of Shewanella bac-teria makes species from this genus a promising platform for investigating the evo-lution of carbon metabolism and energy conservation. The Shewanella phylogeny isdiverged into two major branches, referred to as group 1 and group 2. While thegenotype-phenotype connections of group 2 species have been extensively studiedwith metabolic modeling, a genome-scale model has been missing for the group 1species. The metabolic reconstruction of Shewanella piezotolerans strain WP3 repre-sented the first model for Shewanella group 1 and the first model among piezotoler-ant and psychrotolerant deep-sea bacteria. The model brought insights into themechanisms of energy conservation in WP3 under anaerobic conditions and high-lighted its metabolic flexibility in using diverse carbon sources. Overall, the modelopens up new opportunities for investigating energy conservation and metabolicadaptation, and it provides a prototype for systems-level modeling of other deep-sea microorganisms.
Received 26 October 2016 Accepted 4 March2017 Published 28 March 2017
Citation Dufault-Thompson K, Jian H, Cheng R,Li J, Wang F, Zhang Y. 2017. A genome-scalemodel of Shewanella piezotolerans simulatesmechanisms of metabolic diversity and energyconservation. mSystems 2:e00165-16. https://doi.org/10.1128/mSystems.00165-16.
Editor Paul Wilmes, Luxembourg Centre forSystems Biomedicine
Copyright © 2017 Dufault-Thompson et al.This is an open-access article distributed underthe terms of the Creative Commons Attribution4.0 International license.
Address correspondence to Ying Zhang,[email protected].
* Present address: Jiefu Li, Department ofBiology, Stanford University, Stanford,California, USA.
Metabolic reconstruction of the deep seaorganism Shewanella piezotolerans WP3simulates energy conservation using diversecarbon sources.
RESEARCH ARTICLEMolecular Biology and Physiology
crossm
March/April 2017 Volume 2 Issue 2 e00165-16 msystems.asm.org 1
on January 23, 2019 by guesthttp://m
systems.asm
.org/D
ownloaded from

KEYWORDS Shewanella, metabolic modeling
Members of the Shewanella genus are present in a wide range of environments,including fresh and salt waters, food products, sewage systems, and deep-sea
sediments (1–3). The Shewanella genus is known to utilize diverse carbon sources andelectron acceptors, leading to its broad adaptation to various environmental conditions(3–6). A 16S rRNA gene-based phylogenetic reconstruction has revealed two majorgroups in the Shewanella genus (7). Generally, group 1 includes species that are capableof producing eicosapentaenoic acid (EPA) and are piezotolerant and psychrotolerant,such as Shewanella benthica and Shewanella violacea, which have been isolated fromthe deep sea. Group 2 species are generally pressure sensitive and mesophilic andinclude Shewanella oneidensis, Shewanella baltica, and Shewanella putreficans, whichhave been isolated from a variety of environments, including fresh water lakes andspoiled meat products.
The ability of Shewanella species to utilize a broad range of electron acceptorsmakes this genus a target for studying metabolic energy conservation and anaerobicrespiration. Several recent studies have focused on identifying the relative contribu-tions of two distinct ATP-producing mechanisms (8–10), oxidative phosphorylation andsubstrate-level phosphorylation. Oxidative phosphorylation is typically associated withrespiration, where the reduction of terminal electron acceptors is coupled to protonmotive force (PMF) generation, and the PMF subsequently contributes to ATP synthesisvia ATP synthase (ATPase). Substrate-level phosphorylation is associated with theproduction of ATP through direct transfer of a phosphoryl group to ADP through theaction of enzymes like phosphotransacetylase (Pta) and acetate kinase (AckA). InS. oneidensis strain MR-1, substrate-level phosphorylation is the primary source of ATPduring anaerobic growth, while ATPase has either minor contributions to ATP produc-tion or acts as an ATP-driven proton pump that generates PMF (8). This is surprising,given that Shewanella bacteria are obligated to utilize terminal electron acceptors whengrowing under anaerobic conditions. An understudied aspect of these features ofmetabolism is how ATP production, PMF generation, and redox reactions interact andjointly contribute to the utilization of metabolic pathways and energy conservationstrategies in Shewanella bacteria.
Shewanella piezotolerans strain WP3, hereinafter referred to as WP3, has beenisolated from western-Pacific sediment at a depth of 1,914 m. It is piezotolerant andpsychrotolerant, reflecting its adaptations to the deep-sea environment (11). A 16S-based phylogeny suggests this organism belongs to group 1 of the Shewanella genus(12). The ability of WP3 to utilize diverse carbon sources and electron acceptorsdemonstrates a metabolic flexibility that is comparable with that of other Shewanellaspecies (11, 13). The full genome of WP3 includes diverse c-type cytochrome genes,which support anaerobic respiration using various terminal electron acceptors, such asnitrate, iron, trimethylamine-N-oxide (TMAO), and dimethyl sulfoxide (DMSO) (13). WP3is also known to produce EPA and alter its lipid content to contain more unsaturatedand branched-chain fatty acids in low-temperature and high-pressure environments(14). These features enlist WP3 as a good representative of the group 1 Shewanellaspecies.
Genome-scale models (GEMs) of metabolic networks have broad applications inphenotype prediction, evolutionary reconstruction, functional analysis, and metabolicengineering (15). By connecting a set of biochemical reactions with the enzymaticfunctions encoded in a genome, GEMs provide a framework for simulating the asso-ciations between genotypes and phenotypes (16–19). The reconstruction of genome-scale models can be challenging due to the complexity in managing diverse data setsand maintaining model consistency through iterative manual curations. These chal-lenges have been addressed with the recent releases of tools and automated pipelinesto facilitate the modeling process (20–23). GEMs are available for four group 2 She-wanella species, including S. oneidensis MR-1, S. denitrificans, Shewanella sp. strain MR-4,
Dufault-Thompson et al.
March/April 2017 Volume 2 Issue 2 e00165-16 msystems.asm.org 2
on January 23, 2019 by guesthttp://m
systems.asm
.org/D
ownloaded from

and Shewanella sp. strain W3-18-1 (24, 25), while currently no GEM is available for anygroup 1 species.
This study focuses on WP3 as a prototype for metabolic modeling among group 1Shewanella. WP3 presents the conserved features of the group 1 Shewanella (e.g.,piezotolerance, psychrotolerance, EPA production, etc.) and is a well-studied species inthis group. Previous studies have provided detailed evidence related to the functionand annotation of multiple key metabolic pathways in WP3, including nitrate utilization(26), DMSO respiration (27), iron reduction and biomineralization (28–30), and fatty acidsynthesis (14). In addition to functional annotations, extensive data are available on theexpression of key metabolic genes, connecting individual pathways with their func-tional roles under changing environmental conditions (31–36). These studies provide abroad knowledge base for constructing the WP3 GEM. Furthermore, WP3 has estab-lished protocols for genetic manipulations (37–40). The experimental accessibility ofthis organism would enable the verification of modeling outcomes and support futureresearch on molecular adaptations through combined GEM simulation and experimen-tal verification. Overall, WP3 serves as an ideal organism for modeling the metabolismof group 1 species in the Shewanella genus.
In this study, a GEM of WP3 was constructed and applied in simulating the carbonmetabolism and energy conservation under both aerobic and anaerobic conditions.The model was verified based on the known physiology of the organism and newexperimental data. Evolutionary analysis of the central metabolic genes revealednonhomologous replacements between WP3 (and other group 1 species) and thegroup 2 Shewanella species. Comparing the WP3 model with the model of a group 2representative, S. oneidensis strain MR-1 (hereinafter referred to as MR-1), revealedsimilarities and differences between the two organisms in their aerobic growth andanaerobic energy conservation.
RESULTSPhylogenetic position of Shewanella piezotolerans WP3. The phylogenetic posi-
tioning of S. piezotolerans WP3 was confirmed following a phylogenomic analysis usingthe protein sequences of 661 conserved single-copy genes (CSCGs) in the full genomesof 24 Shewanella species and 5 closely related Gammaproteobacteria species thatserved as the outgroup to the Shewanella genus (see Materials and Methods). Thephylogenomic reconstruction demonstrated the differentiation of the group 1 andgroup 2 Shewanella species into distinct evolutionary branches (Fig. 1) and concurredwith a previously published 16S rRNA gene-based phylogeny (7). An exception to thisconcurrence was with the positioning of Shewanella amazonensis, where the 16S rRNAgene-based phylogeny located S. amazonensis in the group 2 taxa (7), while thegenome-based phylogeny positioned S. amazonensis as one of the deepest-branchingspecies among all of the Shewanella species analyzed. According to the genome-widephylogeny, WP3 was located in the group 1 branch, with Shewanella pealeana andShewanella halifaxensis as its closest neighbors. In the phylogenetic tree shown in Fig. 1,the four previously modeled Shewanella species are marked with blue stars to indicatetheir position in the phylogeny, while WP3 is marked with a red star.
Genome-scale metabolic reconstruction of Shewanella piezotolerans WP3. Thecomplete metabolic reconstruction of WP3, GEM-iWP3, was released in a public Gitrepository at https://github.com/zhanglab/GEM-iWP3. It contained 806 genes, 653metabolites, and 922 metabolic reactions. The reconstruction was achieved in threesteps. First, gene-protein-reaction (GPR) associations were incorporated through map-ping orthologous genes to the existing Shewanella reconstructions (24, 25) (see Mate-rials and Methods). This identified 596 genes (619 reactions) that were conservedbetween WP3 and all four of the other Shewanella species modeled, as well as 130genes (131 reactions) that were conserved between WP3 and some (but not all) of thefour previously modeled species, leading to the inclusion of 726 genes associated with750 reactions in the WP3 reconstruction.
Genome-Scale Model of Shewanella piezotolerans
March/April 2017 Volume 2 Issue 2 e00165-16 msystems.asm.org 3
on January 23, 2019 by guesthttp://m
systems.asm
.org/D
ownloaded from

Next, the WP3 metabolic reconstruction was expanded through manual curation ofthe WP3 genome using information from published literature (12, 14, 41), proteindomain conservation, and evidence from the genomic and functional context of themetabolic genes (42). This expansion led to the inclusion of another 137 reactionsassociated with new gene annotations and the addition of a periplasmic compartmentto account for cellular localizations of nutrient transporters and electron transportreactions. For example, the carbohydrate utilization pathways were annotated basedon prior study of sugar catabolism in Shewanella (41) and further verified based onpredictions of protein localization in the cell (Fig. 2) (43–45). The reduction of solubleelectron acceptors, such as nitrate, nitrite, thiosulfate, and TMAO, was represented asperiplasmic reactions, while the reduction of DMSO and oxidized metals, such as Fe(III),Mn(IV), uranium(VI), and chromium(VI), was represented as extracellular processesfollowing existing knowledge of the cellular compartmentalization of the differentelectron transport processes in Shewanella species (46–55). Putative outer membranetransporters were identified and curated to identify what genes were responsible fornutrient exchange between the extracellular space and the periplasm. A number ofnonspecific porins were identified, including distant homologs to the Escherichia coliOmpC and OmpF proteins (56), as well as a homolog to the OprF protein in Pseudomo-nas aeruginosa (57, 58). This analysis also identified functionally specific outer mem-brane proteins that were responsible for the uptake of carbohydrates (e.g., LamB and
Shewanella amazonensis SB2BShewanella loihica PV-4
Shewanella piezotolerans WP3Shewanella pealeana ATCC 700345Shewanella halifaxensis HAW-EB4100
100
Shewanella violacea DSS12Shewanella sediminis HAW-EB3Shewanella woodyi ATCC 5190895
100
100
100
Shewanella denitrificans OS217Shewanella frigidimarina NCIMB 400100
Shewanella putrefaciens 200Shewanella putrefaciens CN-32
83
Shewanella sp. W3-18-1100
Shewanella baltica OS223Shewanella baltica BA175Shewanella baltica OS117Shewanella baltica OS155
100
99
Shewanella baltica OS185Shewanella baltica OS678Shewanella baltica OS195
100
100
100
Shewanella oneidensis MR-1Shewanella sp. ANA-3Shewanella sp. MR-7Shewanella sp. MR-4100
100
100
100
100
100
100
Colwellia psychrerythraea 34HPseudoalteromonas haloplanktis TAC125100
Photobacterium profundum SS9Psychromonas ingrahamii 37
Moritella viscosa MVIS1100100
100
0.1
Group 1
Group 2
FIG 1 Phylogenetic reconstruction of the Shewanella genus based on the concatenated sequences of 661conserved single-copy genes identified in the full genomes of Shewanella and five outgroup species. Supportvalues based on 100 iterations of bootstrapping are indicated at the internal nodes. Only support values above 80are shown. The four Shewanella species with available GEMs are marked with blue stars, and WP3 is marked witha red star.
Dufault-Thompson et al.
March/April 2017 Volume 2 Issue 2 e00165-16 msystems.asm.org 4
on January 23, 2019 by guesthttp://m
systems.asm
.org/D
ownloaded from

DAd-2
Laminarin
Glc-D
G6P
swp_1638
swp_2676
swp_1640
Maltodex
Malt
Malt Cellobiose
swp_1637
swp_3411 orswp_2682
Cellobiose
DUri
DCyt
DCmp
DAd-2
DUri
DCytG3P
2dr1P
swp_3037
swp_2845
2dr5P
swp_0461 orswp_1232
swp_1231
swp_1229
swp_1227 orswp_4436
swp_1227 orswp_4436
swp_1227 orswp_4436swp_1228
swp_1228
swp_1228
swp_1228
Thr-L
Leu-L
Ile-L
Thr-L
Leu-L
Ile-L
AcCoA
swp_4229 swp_3448
HmGCoA
swp_4229
swp_2261
2MaACoAswp_0034
Omp
Omp
Omp
Asp-L
Asp-L
Oaa
swp_2486 orswp_2586
swp_4402 or swp_1739
Omp
Akgswp_2811
swp_4160
Glu-L
Glu-L
swp_1739
Omp
Ptrc
Ptrc
swp_4154 andswp_4156 andswp_4157 andswp_4158
GGluABT
Omp
Cytd
Adn
Uri
Cytd
Adn
UriR5P
swp_1227 orswp_4436
swp_4702R1P
swp_1231
swp_0461 orswp_1232
swp_1227 orswp_4436
swp_1227 orswp_4436swp_3037
swp_1228
swp_1228
swp_1228
Gal
Gal
UDP-Glc
G1P
swp_4525
swp_1649
swp_3660
Galactan
swp_3660
swp_4524
Galactan Gal
GlcNac GlcNac
F6P
swp_3698
Gam6P
swp_4289
swp_3712
Chitob
swp_3705
swp_3712
Chitob
Chitin
swp_0647
Ser-L
Lac
Ala-L
Ser-L
Lac
Ala-L
Pyr
swp_1813
swp_4263
swp_0003 or swp_0530 or swp_3737 or swp_4361
swp_1748 orswp_4262
swp_2619
swp_3635 andswp_3636 andswp_3637
PyrPyr???
Omp
Omp
Omp
Omp
2PG GlycerateGlycerateswp_3291 swp_3660swp_3292
DHAP GlycerolGlycerolswp_3846
Glycerol 3Pswp_3660swp_2219swp_4318
G1P
F6P
G3P
2PG
Pyr
AcCoA
Akg
Succ
DHAP
Oaa
R5P
G6P
Val-LVal-Lswp_4229
MiCit
swp_2428
PyrOmp
2A3Oxobut
swp_5067
Periplasm
Cytoplasm
swp_1631
swp_1634Cellobiose
swp_1633
Glc-Dswp_1636 orswp_2669
Glc-D
swp_2671 swp_2671 orswp_3412
swp_3660
Maltodex swp_2675swp_2674
Malt
swp_2681
swp_2670
swp_1230
GlcNac
DCmp
DCyt
DUri
DAd-2
Val-L
Ile-L
Leu-L
Thr-L
Asp-L Glu-L Ptrc
Pyr
Ala-L
Ser-L
Lac
Glycerate
Glycerol
Adn
Uri
Cytd
FIG 2 A schematic representation of the carbon utilization pathways for various carbohydrates and their derivatives (blue), amino acids (orange), nucleic acids(red), and small carbon molecules (green) as well as their links to the central carbon metabolism (red arrows). Metabolites are represented as ovals, andmetabolic and transport reactions are represented as links between metabolites. Triple arrows linking two compounds indicate that multiple reactions areinvolved in the conversion of one compound to the other. Genes coding for the main metabolic steps of the carbon uptake pathways are indicated as labelsabove the links. Abbreviations: 2A3Oxobut, L-2-amino-3-oxobutanoate; 2dr1P, 2-deoxy-D-ribose 1-phosphate; 2dr5P, 2-deoxy-D-ribose 5-phosphate; 2MaACoA,2-methylacetoacetyl-CoA; 2PG, D-glycerate 2-phosphate; AcCoA, acetyl-CoA; Adn, adenosine; Akg, 2-oxoglutarate; Ala-L, L-alanine; Asp-L, L-aspartate; Chitob,chitobiose; Cytd, cytidine; DAd-2, deoxyadenosine; DCmp, deoxycytidine monophosphate; DCyt, deoxycytidine; DHAP, dihydroxyacetone phosphate; DUri,
(Continued on next page)
Genome-Scale Model of Shewanella piezotolerans
March/April 2017 Volume 2 Issue 2 e00165-16 msystems.asm.org 5
on January 23, 2019 by guesthttp://m
systems.asm
.org/D
ownloaded from
OprB), phosphate (OprP), cobalamin (BtuB), long-chain fatty acids (FadL), and nucleo-sides (Tsx) (41, 59–63).
The assembly of cell components in WP3 was represented with the addition of 8synthesis reactions. The biomass equation was introduced to represent the composi-tion of cell mass, including carbohydrates, proteins, RNA, DNA, lipids, vitamins, andcofactors (see Table S1 in the supplemental material). The stoichiometry of the biomassequation was normalized to reflect the millimole concentrations of individual compo-nents in 1 g of cell dry weight (gDW) (see Materials and Methods). The composition ofmacromolecules, such as lipids, proteins, DNA, and RNA, was represented using equa-tions that defined the composition of basic building blocks, such as fatty acids, aminoacids, and nucleotides. The stoichiometries of these biosynthesis equations weredetermined according to existing Shewanella reconstructions and experimental mea-surements performed on WP3. Specifically, the stoichiometry of the lipid biosynthesisequation (see Table S2) was calibrated based on experimentally measured concentra-tions of saturated, unsaturated, and branched-chain fatty acids in WP3 (14).
The WP3 metabolic reconstruction also included three reactions for the diffusion ofO2, CO2, and urea across the cell membrane and 24 gap-filling reactions for unblockingthe production of biomass components. These gap-filling reactions reflected knowl-edge gaps in the synthesis of biomass compounds, where the metabolic mechanismswere either unknown or not yet associated with any annotated genes in the WP3genome. These gap-filling reactions included dihydroneopterin mono- and triphosphatedephosphorylases, which were involved in the synthesis of the cofactor tetrahydrobiop-terin, as well as glycolaldehyde dehydrogenase and 5,10-methylenetetrahydrofolate reduc-tase, which were involved in folate metabolism. Three gap-filling reactions were compoundsinks that allowed for the removal of metabolic side products whose metabolic pathwaysare currently unknown and that are not involved in other reactions in the metabolicnetwork. These included sinks for the compound S-adenosyl-4-methylthio-2-oxobutanoate,a side product in the synthesis of biotin.
Finally, 109 exchange reactions were defined to represent the exchange of nutrientsand metabolic products in the simulated environment (see Table S3 in the supplemen-tal material). These included reactions for the uptake of carbon sources, electronacceptors, trace metals, and vitamin precursors, as well as the diffusion of metabolicby-products. These exchange reactions were set to represent the basal constraintsspecified in Table S3 and were subsequently modified during metabolic simulations torepresent different environmental conditions (see Materials and Methods).
Evolution of central metabolic genes. During manual curation of the WP3 meta-bolic reconstruction, genes for carrying out central metabolic functions that werenonhomologous between WP3 and the previously modeled Shewanella species wereidentified. These included acetylornithine deacetylase (argE), which is essential for thebiosynthesis of arginine, and glucosamine-6-phosphate deaminase (nagB), which isessential for utilizing N-acetyl-D-glucosamine (GlcNac). Both genes were experimentallyidentified in MR-1 and were found to be nonhomologous to the canonical genes inE. coli (64, 65). A broader comparison of the group 1 and group 2 Shewanella speciessuggested that they were conserved within each group but had diverged between thetwo groups (see Fig. S1 in the supplemental material). Exceptions were found for theargE gene in S. amazonensis, Shewanella loihica, and Shewanella frigidimarina, wherethe deep-branching S. amazonensis and S. loihica carried both nonhomologous copiesof argE and the group 2 species S. frigidimarina carried a single argE of the group 1 type.The genomic contexts of argE and nagB were well conserved among the group 1
FIG 2 Legend (Continued)deoxyuridine; F6P, D-fructose 6-phosphate; G1P, D-glucose 1-phosphate; G3P, glyceraldehyde 3-phosphate; G6P, D-glucose 6-phosphate; Gal, D-galactose;Gam6P, D-glucosamine 6-phosphate; GGluABT, gammaglutamyl-gamma-aminobutyrate; Glc-D, D-glucose; Glu-L, L-glutamate; HmGCoA, hydroxymethylglutaryl-CoA; Ile-L, L-isoleucine; Lac, lactate; Leu-L, L-leucine; Malt, maltose; Maltodex, maltodextrin; MiCit, methylisocitrate; Oaa, oxaloacetate; Ptrc, putrescine; Pyr,pyruvate; R1P, alpha-D-ribose 1-phosphate; R5P, alpha-D-ribose 5-phosphate; Ser-L, L-serine; Succ, succinate; Thr-L, L-threonine; UDP-Glc, UDP-glucose; Uri,uridine.; Val-L, L-valine.
Dufault-Thompson et al.
March/April 2017 Volume 2 Issue 2 e00165-16 msystems.asm.org 6
on January 23, 2019 by guesthttp://m
systems.asm
.org/D
ownloaded from

species, while they were variable among the group 2 species. Consistent with theobserved variability of the genomic contexts, genetic elements were found in proximityto argE and nagB in MR-1, as well as an argE in S. loihica that is homologous to thegroup 2 type. The group 2 genes had diverse origins, with the argE being homologousto genes in Klebsiella species and a limited subset of host-associated Enterobacteriaceaeand the nagB homologous to genes in the deep-branching bacteria and archaea (65).In contrast, the group 1 genes were conserved with those of genera evolutionarilyrelated to Shewanella, such as Marinomonas, Colwellia, and Pseudoalteromonas. Takentogether, the central metabolic genes argE and nagB evolved from distinct originsamong Shewanella groups 1 and 2. The WP3 genome carried the gene copies that wereconserved in the group 1 species.
Metabolic simulations match experimental growth measurements. Simulationsof biomass production with the WP3 metabolic model were consistent with the knownphysiology of this organism. This included utilizing glucose, lactate, maltose, andGlcNac as carbon sources and using Fe(III), nitrate, nitrite, thiosulfate, TMAO, and DMSOas terminal electron acceptors for anaerobic respiration (13). From the metabolicsimulations, 53 sole carbon sources supported biomass production of the WP3 modelunder aerobic conditions, including various carbohydrates, amino acids, nucleotides,and fatty acids (Fig. 2; see also Table S3 in the supplemental material).
To quantitatively evaluate the prediction of biomass concentrations by the WP3metabolic model, batch cultures were set up using a minimal medium developed in thisstudy to experimentally measure the growth of WP3 with sole carbon sources (seeText S1 in the supplemental material). The sole carbon sources examined in this studywere pyruvate, glucose, maltose, and an amino sugar (GlcNac), and the experimentswere carried out under aerobic conditions using oxygen as the sole terminal electronacceptor. The concentrations of carbon sources ranged between 2 mM and 40 mM inthe experimental medium. Cell growth was measured in three independent replicatesand converted to biomass concentrations (see Materials and Methods). Metabolicsimulations were performed with the WP3 model to predict the biomass fluxes underthe conditions defined by the experimental medium. This was achieved by modifyingthe flux bounds of the exchange reactions in the model. The lower bounds of exchangereactions for carbon, nitrogen, sulfur, and phosphorus sources were specifically cali-brated to reflect their concentrations in the minimal medium (see Table 1), theexchange of oxygen was unlimited to simulate aerobic respiration, and the lower andupper bounds of other exchange reactions were assigned based on default settings inthe basal constraints (see Materials and Methods; see also Table S3 in the supplementalmaterial).
The biomass fluxes predicted by the model demonstrated overall consistency withexperimentally measured biomass concentrations at the stationary phase (Fig. 3). The
TABLE 1 Exchange reaction constraints representing the concentrations of carbon, nitrogen, sulfur, and phosphorus sources in theminimal medium of WP3 batch culturesa
Nutrient Source Concn
Flux bound of exchangereaction
Lower Upper
Carbon Glucose, maltose, GlcNac, or pyruvate 2 mM �2.00 1,000.005 mM �5.00 1,000.0010 mM �10.00 1,000.0020 mM �20.00 1,000.0040 mM �40.00 1,000.00
Sulfur SO4 9.8 mM �9.80 1,000.00Phosphorus PO4 0.7 mM �0.70 1,000.00Nitrogen NH4 5.6 mM �5.60 1,000.00aAll other exchange reactions in the WP3 model were defined with settings in the basal constraints. The compounds pyruvate, glucose, maltose, and GlcNac wereused as sole carbon sources. The lower and upper bounds of exchange reaction fluxes are shown; negative values indicate that uptake of the nutrient waspermitted. The concentrations of the sole carbon sources varied from 2 mM to 40 mM; the concentrations of the sulfur, phosphorus, and nitrogen sources were setaccording to their concentration in the experimental medium.
Genome-Scale Model of Shewanella piezotolerans
March/April 2017 Volume 2 Issue 2 e00165-16 msystems.asm.org 7
on January 23, 2019 by guesthttp://m
systems.asm
.org/D
ownloaded from

quantitative values deviated slightly from the experimental measurements at relativelylow (i.e., 2 mM of pyruvate or glucose) or high carbon source concentrations. Experi-mental measurements showed that the biomass production stopped increasing whenthe concentration of sole carbon sources increased beyond 60 mM in the count ofcarbon elements (i.e., 20 mM, 10 mM, or 5 mM of pyruvate [3 carbons], glucose [6carbons], or maltose [12 carbons], respectively). This trend was also seen in the WP3model simulations. Furthermore, under high concentrations of pyruvate, glucose, andmaltose, metabolic simulations identified NH4
� as the limiting factor of biomassproduction. This was because the uptake of these carbon sources was limited by theuptake bound of the NH4
� exchange flux, which corresponded to its concentration inthe experimental medium. Allowing for higher uptake of NH4
� by the model led tohigher biomass production and higher uptake of these carbon sources. In contrast, themodel was not limited by the availability of NH4
� when an amino sugar, GlcNac, wasused as a sole carbon source. This was because each molecule of GlcNac produced onemolecule of NH4
� during its utilization, providing additional nitrogen that could beused during growth. As a result, higher biomass was observed with GlcNac as a carbonsource, and this trend was seen in both the experimental measurements and the modelsimulations (Fig. 3).
The aerobic growth of WP3 was also compared with that of MR-1 (model iMR1_799[25]), based on simulations of growth on 28 sole carbon sources that have beenexperimentally confirmed to support growth in either WP3 (13) or MR-1 (24, 25) (seeFig. S2 in the supplemental material). The MR-1 model was able to utilize almost all thecarbon sources examined, except for maltose. The WP3 model, in contrast, was viablein maltose but was not able to utilize six carbon sources, including the amino acidsasparagine and glutamine, the nucleic acids inosine and thymidine, and the smallmolecules ethanol and 2-oxoglutarate. Simulations of biomass production using thetwo models revealed that WP3 had slightly higher biomass yields than MR-1 on most
FIG 3 Comparison of experimentally measured and computationally simulated biomass production levels of WP3 grown with differentcarbon sources. Error bars represent the standard deviations of the experimentally measured biomass concentrations (gDW/liter) fromthree independent replicates.
Dufault-Thompson et al.
March/April 2017 Volume 2 Issue 2 e00165-16 msystems.asm.org 8
on January 23, 2019 by guesthttp://m
systems.asm
.org/D
ownloaded from

of the growth-supporting carbon sources, including carbohydrates, small carbon mol-ecules, and amino acids, while MR-1 had a slightly higher biomass yield when malate,adenosine, or deoxyadenosine was used as the sole carbon source.
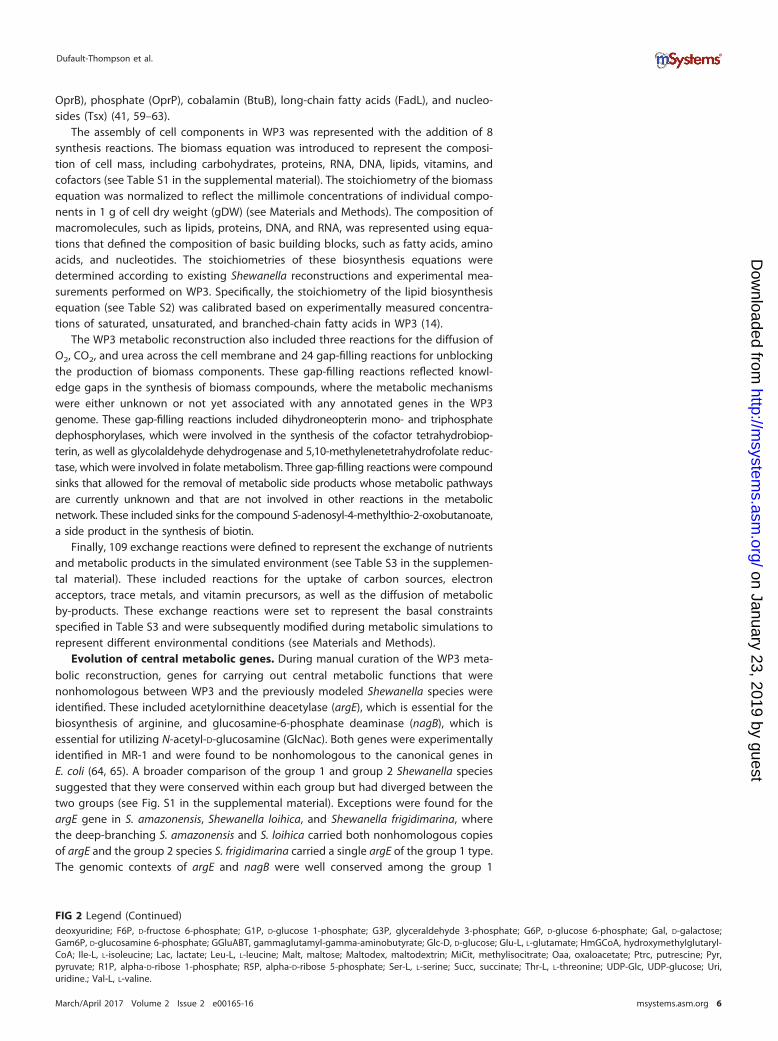
Metabolic energy conservation of WP3. The relative roles of oxidative andsubstrate-level phosphorylation were examined by simulating mutant models withreactions from each of the two pathways blocked (Fig. 4 and Materials and Methods).For measuring the role of oxidative phosphorylation, the levels of biomass productionof the wild-type (WT) model and an ATP synthase deletion mutant (�atp mutant) weresimulated using flux balance analysis (FBA) under both aerobic (O2) and anaerobic(fumarate) conditions using either GlcNac or lactate as the sole carbon source. Underaerobic conditions, the �atp mutant produced less than half of the WT biomass,indicating that oxidative phosphorylation played an important role in the aerobicgrowth of WP3. Under anaerobic conditions, however, the biomass production levelswere comparable between the WT and �atp models, demonstrating that oxidativephosphorylation had only a minor role in supporting anaerobic growth (Fig. 4B).
For measuring the role of substrate-level phosphorylation, FBA was performed withthe WP3 WT model and three mutant models that represent the single deletion of thephosphotransacetylase (�pta mutant) or the acetate kinase (�ackA mutant) gene or thedouble deletion of both genes (�pta �ackA mutant). When lactate was used as a solecarbon source, the WT model was able to produce nonzero biomass flux, while the�pta, �ackA, and �pta �ackA models had a maximum biomass flux of zero, indicatingthat these mutants are not viable in the lactate medium. When GlcNac was used as asole carbon source, both the WT and mutant models were viable in the anaerobicmedium. Compared to the WT, the �pta mutant had a slight decrease in biomassproduction (97% of the WT flux), and the �ackA and �pta �ackA mutants resulted ingreater reductions of the biomass, to less than 50% of the WT level (Fig. 4C). Thedecrease or inhibition of biomass production in the �ackA and �pta �ackA mutants
(2) H(2) H+
(3) H(3) H+
NADH + HNADH + H+ NADNAD+ ATP + HATP + H2OADP + PiADP + Pi
Acetyl-PhosphateAcetyl-Phosphate AcetateAcetate
ATPATPADPADP
PEPPEP PyruvatePyruvate
ATPATPADPADP
AckAAckA
PykPyk
ATPaseATPaseNdhNdh
A)
PeriplasmPeriplasm
Inner InnerMembraneMembrane
CytoplasmCytoplasm
FormateFormateCoA CoA
PflPflAcetyl-CoAAcetyl-CoA
PtaPta
PiPi
CoACoA
(2) H(2) H+
FormateFormate COCO2 2 + H + H+
Xylulose-5-PXylulose-5-P
PiPi
XpkXpk
Glyceraldehyde-3-PGlyceraldehyde-3-P+ H+ H2O
MKHMKH2
MKMK
B)
D)
MKMKMKHMKH2
Electron Electron accepteraccepter
ReducedReducedelectron accepterelectron accepter
(2) H(2) H+
e-
e-
CymACymA
e-FdhFdh
C)WP3WP3ΔptaWP3ΔackAWP3ΔptaΔackA
ATPase Fdh Ndh AckA Pta Pyk Xpk
WP3WP3ΔptaWP3ΔackAWP3ΔptaΔackA
Rea
ctio
n F
lux
/ Bio
mas
s F
lux
0
5
10
15
20
25
30
35
O2 Fumarate
WTΔatp
GlcNac
Bio
mas
s F
lux
0.0
0.2
0.4
0.6
0.8
1.0
1.2
O2 Fumarate
WTΔatp
Lactate
Bio
mas
s F
lux
0.0
0.1
0.2
0.3
0.4
GlcNac Lactate
Bio
mas
s F
lux
0.0
0.1
0.2
0.3
0.4
0.5
FIG 4 (A) A schematic representation of key reactions involved in the production of ATP and PMF in WP3. (B) Comparison of biomass fluxes in the wild-typeand �atp mutant models of WP3 with GlcNac or lactate as a sole carbon source under aerobic and anaerobic conditions. (C) Biomass fluxes from anaerobicgrowth simulations of the WP3 wild-type model and the �ackA, �pta, and �pta �ackA mutant models using GlcNac or lactate as a sole carbon source andfumarate as a sole electron acceptor. (D) Internal reaction fluxes of the WP3 and mutant models from the simulations whose results are shown in panel C, usingGlcNac as a sole carbon source. MK, menaquinone; CymA, tetraheme c-type cytochrome; ATPase, ATP synthase; Fdh, formate dehydrogenase; Ndh, NADHdehydrogenase; AckA, acetate kinase; Pra, phosphotransacetylase; Pyk, pyruvate kinase; Xpk, xylulose-5-phosphate phosphoketolase.
Genome-Scale Model of Shewanella piezotolerans
March/April 2017 Volume 2 Issue 2 e00165-16 msystems.asm.org 9
on January 23, 2019 by guesthttp://m
systems.asm
.org/D
ownloaded from

indicated an important role of substrate-level phosphorylation in supporting anaerobicgrowth of WP3.
Additional examination of the internal fluxes obtained from FBA revealed changesin ATP production, PMF generation, and redox functions in the WT and mutant models(Fig. 4D). In the WT model, substrate-level phosphorylation mediated by AckA was usedfor ATP production, while oxidative phosphorylation via ATP synthase (ATPase) playeda minor role in this process. The activity of formate dehydrogenase (Fdh) was coupledwith terminal electron acceptor reduction to generate PMF, and NADH dehydrogenase(Ndh) was used for reducing the quinone pool. In the �pta model, reaction fluxes wereredirected to xylulose-5-phosphate phosphoketolase (Xpk) from the pentose phos-phate pathway so that substrate-level phosphorylation through AckA was maintained.This redirection resulted in reduced Fdh flux, potentially due to decreases in formateproduction, and increased Ndh flux, potentially for maintaining the redox activities inthe electron transport chain. In the �ackA and �pta �ackA models, more significantshifts were observed in the distribution of metabolic fluxes. The inhibition of AckA ledto blockage of the upstream fluxes through Pta and Xpk and increased flux throughpyruvate kinase (Pyk) to partially compensate for the loss of AckA-mediated ATPproduction.
The variability of the internal fluxes was further examined using flux variabilityanalysis (FVA) with biomass production constrained to its maximum under eachsimulation condition (see Table S4 in the supplemental material). This revealed consis-tent flux values for all of the above-mentioned reactions in the WT and �pta modelsand for the ATPase, AckA, Pta, and Xpk reactions in the �ackA and �pta �ackA models.However, the Pyk, Fdh, and Ndh reactions had various flux values in the �ackA and�pta �ackA mutants, indicating that these mutants had alternative strategies forbalancing the ATP production, PMF generation, and redox activities in the cell.
ATPase activity and anaerobic growth of Shewanella. One surprising feature ofthe Shewanella anaerobic growth was the lack of oxidative phosphorylation via ATPasedespite the obligate requirement for respiration through terminal electron acceptors(8). To further investigate how the ATPase activity (i.e., in either the ATP production orPMF generation direction) was related to the redox balancing of Shewanella duringanaerobic respiration, the NAD�/NADH homeostasis was modeled with a robustnessanalysis to simulate the connections between redox state (as measured by the differ-ences in NAD� and NADH concentrations) and the activity of ATPase in both the WP3and the MR-1 model (see Materials and Methods). The simulation demonstrated apositive correlation between the availability of reducing equivalents and the flux of theATPase reaction for both WP3 and MR-1 (see Fig. S3 and S4 in the supplementalmaterial). This indicated that when the system was provided with more reducingequivalents, the ATPase flux would increase and activity would be shifted toward theATP-producing direction. In contrast, when the system had less reducing equivalents,the ATPase flux would decrease and activity would be flipped to the proton-pumpingand PMF-generating direction.
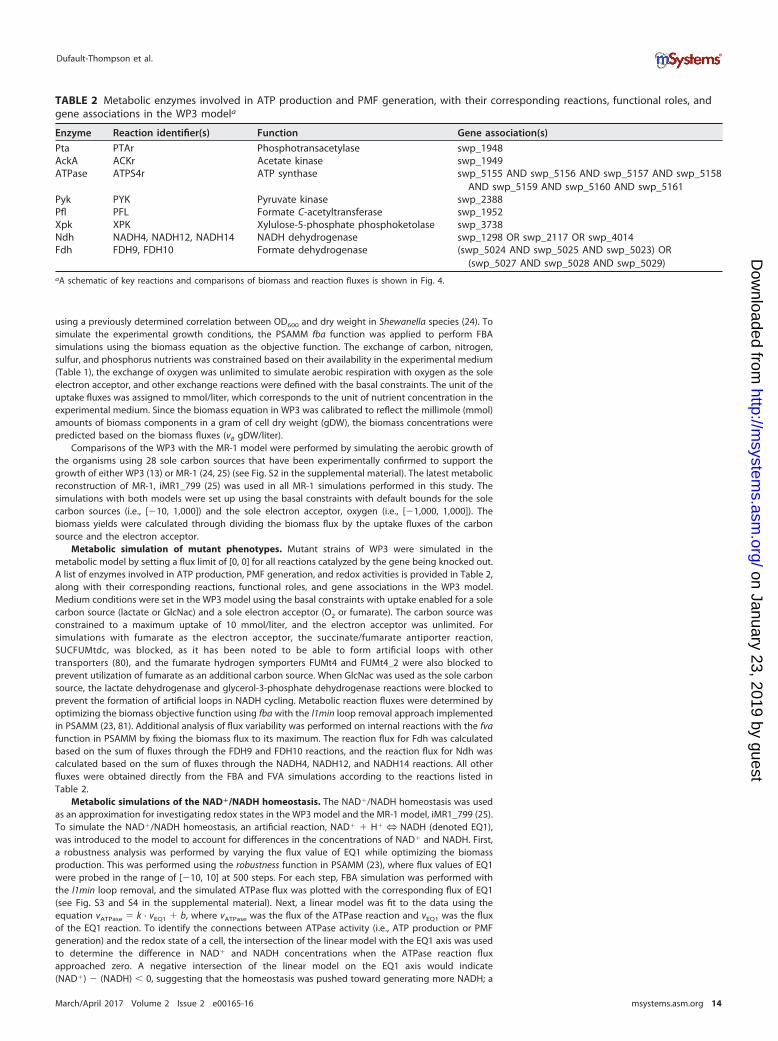
The comparison of redox states in the WP3 and MR-1 models when the ATPasereaction flux approached zero revealed metabolic differences between these twoorganisms across diverse carbon sources when using fumarate as the sole electronacceptor (Fig. 5). The WP3 model produced excess reducing equivalents with a widerange of carbon sources, including amino sugars, small carbon compounds, aminoacids, and nucleotides (Fig. 5A). Considering the positive correlation of the redox stateand the ATPase flux (see Fig. S3 and S4 in the supplemental material), the excessreducing equivalents in WP3 could potentially enable the production of additional ATPvia ATPase. The MR-1 model, in contrast, produced excess reducing equivalents onlywhen specific carbon sources were provided, such as malate, aspartate, and serine.Thus, the ATPase could have little contribution to the ATP production but may insteadbe used for PMF generation in MR-1. Overall, the two representatives of group 1 andgroup 2 Shewanella species, WP3 and MR-1, demonstrated complex interactions of ATP
Dufault-Thompson et al.
March/April 2017 Volume 2 Issue 2 e00165-16 msystems.asm.org 10
on January 23, 2019 by guesthttp://m
systems.asm
.org/D
ownloaded from

generation, PMF generation, and redox-balancing processes under anaerobic growthconditions. The WP3 model displayed higher capacity than MR-1 in producing excessreducing equivalents with most of the examined carbon sources. This may provideadditional advantages to WP3 in its natural environment by enabling additional ATPproduction when using a diverse range of carbon sources.
DISCUSSION
In this study, a genome-scale model was constructed for WP3, a piezotolerant andpsychrotolerant representative of the group 1 Shewanella species (Fig. 1). Extensiveannotations of the WP3 genome were incorporated into the metabolic reconstruction,and the carbon utilization reactions were curated based on the current literatureavailable (Fig. 2). A periplasmic compartment was introduced to the WP3 reconstruc-tion to account for the cellular localization of carbon utilization and electron transportreactions. This represented a new component not previously included by other meta-bolic reconstructions of Shewanella species.
Evolutionary analysis of central metabolic genes in WP3 revealed instances ofnonhomologous replacements among the group 1 and group 2 Shewanella species.The argE and nagB in WP3 and other group 1 species were conserved within bacterialspecies closely related to Shewanella. Hence, they could represent the ancestral genesconserved during early differentiation of the Shewanella genus. The group 2 copies ofthese genes were adjacent to mobile genetic elements, suggesting a possible acqui-sition of these genes through horizontal gene transfer. Furthermore, the conservationof these acquired genes across group 2 species and their presence in a few group 1species suggested they could have been introduced to the genome during earlydifferentiation of the group 2 Shewanella.
The WP3 model represented the known physiology of this organism, including itsgrowth with a wide variety of carbon sources and electron acceptors. A comparison ofbiomass production from model simulations and experimental measurements revealedthat the WP3 model represented growth trends consistent with what was observed inexperimental cultures using the sole carbon sources pyruvate, glucose, GlcNac, andmaltose (Fig. 3). The slight deviations from the experimental results under low or excesscarbon concentrations could be attributed to the differential regulation of geneexpressions but were beyond the scope of this study. Additional confidence in the WP3model was established when it was applied for the prediction of growth-limiting
Glc
Nac
Glc
−D
Pyr
uvat
e
Lac−
L
Mal
−L
Adn
Dad
−2
Urid
ine
Asp
−L
Thr
−L
Leu−
L
Ser
−L
WP3
Red
ox S
tate
,[NA
D+
]−[N
AD
H]
−10
−5
0
5
10
Glc
Nac
Glc
−D
Pyr
uvat
e
Lac−
L
Mal
−L
Adn
Dad
−2
Urid
ine
Asp
−L
Thr
−L
Leu−
L
Ser
−L
MR-1
Red
ox S
tate
,[NA
D+
]−[N
AD
H]
−10
−5
0
5
10
FIG 5 Comparison of NAD�/NADH homeostasis between WP3 (A) and MR-1 (B). The differences in NAD� and NADH concentrations werecalculated from simulations under anaerobic conditions with fumarate as the terminal electron acceptor for each of the carbon sourcesshown (x axis).
Genome-Scale Model of Shewanella piezotolerans
March/April 2017 Volume 2 Issue 2 e00165-16 msystems.asm.org 11
on January 23, 2019 by guesthttp://m
systems.asm
.org/D
ownloaded from

nutrients. The prediction of NH4� as the limiting nutrient when an excess carbon source
was provided was corroborated by the fact that the amide molecule, GlcNac, was ableto overcome this growth limit by serving as both a carbon and a nitrogen source.
A comparison of the WP3 model with an existing model of a group 2 representative,S. oneidensis MR-1, revealed similarities and differences in carbon utilization and energyconservation of these two organisms. While MR-1 lacked enzymes for utilizing maltose,WP3 lacked identified transporters that are required for utilizing six carbon sources,including the amino acids asparagine and glutamine, the nucleic acids inosine andthymidine, and the small molecules ethanol and 2-oxoglutarate (see Fig. S2 in thesupplemental material). The anaerobic energy conservation strategies of WP3 wereexplored by simulating the deletion of genes responsible for oxidative (�atp) andsubstrate-level (�ackA, �pta, and �pta �ackA) phosphorylation (Fig. 4). Using GlcNacand lactate as sole carbon sources and fumarate as the sole electron acceptor, thebiomass production and reaction flux distributions of the WP3 wild-type and mutantmodels revealed that substrate-level phosphorylation was the primary source of an-aerobic energy conservation, a trait that has been noted in MR-1 (8, 10). This indicatesthat the primary usage of substrate-level phosphorylation could be a conserved featurein the anaerobic respiration of both group 1 and group 2 species and suggests that thisfeature could have evolved during the early differentiation of Shewanella.
Internal redox balancing has been shown to play a critical role in the ability of otherorganisms to utilize nutrients and is a major driver of changes in metabolic strategy(66–68). Simulation of the NAD�/NADH homeostasis and its connections to the ATPaseactivity in WP3 and MR-1 provided insights into the complex interactions of ATPproduction, PMF generation, and redox-balancing processes in Shewanella bacteria.While both the WP3 and MR-1 models presented a positive correlation between theavailability of reducing equivalents and the reaction flux of ATPase (see Fig. S3 and S4in the supplemental material), the two models demonstrated distinct redox states whendifferent carbon sources were utilized (Fig. 5). The production of excess reducingequivalents was supported by a wide range of carbon sources in WP3 but was restrictedto only a few carbon sources in MR-1. This suggested a capacity for WP3 to produceadditional ATP via the ATPase activity and could potentially have enabled the adapta-tion of WP3 to the fluctuating availability of carbon sources in the deep sea bymaintaining ATP production when different carbon sources became available.
Overall, the WP3 model represents the first genome-scale model of the group 1Shewanella species and the first model of a piezotolerant and psychrotolerant deep-seaspecies. It opens up new opportunities for future studies of environmental adaptationand metabolic pathway utilization, for example, through incorporating environment-specific features like the altered fatty acid compositions in different temperatures andpressures (14) or the differential expression of key metabolic genes under differentenvironmental conditions (31, 33, 36). The WP3 model also provides a framework forintegrating additional parameters, such as enzyme thermostability (69) or context-specific information (70) during the study of temperature and pressure adaptations. Theexperimental accessibility of WP3 would make it possible to verify extensions to themodel. Finally, future studies combining molecular evolution and metabolic simulationof the group 1 and group 2 Shewanella species could lead to a better understanding ofbacterial adaptations to low-temperature and high-pressure environments and permitthe exploration of metabolic potentials in the deep sea.
MATERIALS AND METHODSOrtholog mapping and phylogenomic reconstruction of the Shewanella genus. An updated
phylogeny of the Shewanella genus was constructed based on conserved single-copy genes (CSCGs). Adata set of 24 Shewanella genomes was downloaded from the KEGG database (71). Five additionalgenomes were used as the outgroup for rooting the Shewanella phylogeny, including Pseudoalteromonashaloplanktis, Colwellia psychrerythraea, Psychromonas ingrahamii, Photobacterium profundum, and Mori-tella viscosa. An initial ortholog mapping among these species was identified using a bidirectional besthit BLAST analysis as defined in a previous study (72). The ortholog mapping was further refined basedon a consensus of additional evidence from other sources, including a published ortholog table of theShewanella genus (25), the KEGG Orthology database (71), and automated predictions by OrthoMCL (73).
Dufault-Thompson et al.
March/April 2017 Volume 2 Issue 2 e00165-16 msystems.asm.org 12
on January 23, 2019 by guesthttp://m
systems.asm
.org/D
ownloaded from

From analyzing ortholog groups that were consistently defined by all of the above-mentioned ap-proaches, CSCGs were identified as the orthologs that occurred once and only once in each of thegenomes analyzed. Individual alignments were constructed on the protein sequences of each CSCGusing MUSCLE version 3.8.31 (74). The alignments were then concatenated to create a master alignmentof the CSCGs in Shewanella and the outgroups. RAxML version 8.2.3 (75) was used for reconstructing amaximum-likelihood protein phylogeny using the JTT substitution model with the GAMMA model of rateheterogeneity. Branch support values were estimated by performing bootstrapping with 100 replica-tions.
Development of the genome-scale metabolic reconstruction. The WP3 metabolic reconstructionwas developed using version 0.27 of the PSAMM software package (23). The reconstruction wasrepresented in a YAML format that is designed to represent variable model definitions and simulationconditions. Simulations with the model were performed in PSAMM using the IBM ILOG CPLEX Optimizerversion 12.6.2 linear programming solver. An initial reconstruction was first developed based on orthologmapping to the existing metabolic reconstructions of S. oneidensis MR-1, Shewanella sp. MR-4, S. deni-trificans strain OS217, and Shewanella sp. W3-18-1 (25). The orthologs were identified according to aglobal mapping of ortholog clusters among all Shewanella species (described in the paragraph above).Gene-protein-reaction (GPR) associations in the initial WP3 reconstruction were mapped from conservedgenes in the modeled species, following logic expressions that represent the “AND” and “OR” relation-ships of enzyme-coding genes. The “AND” logic was used to indicate multiple subunits of an enzymecomplex, and the “OR” logic was used to indicate alternative enzymes. A GPR association was introducedfrom existing reconstructions only if orthologs were identified in the WP3 genome for all subunits of atleast one alternative enzyme. The WP3 reconstruction was further expanded through manual curation byreferencing existing annotations in the KEGG (71), SEED (42), and BioCyc (76) databases. Additionalconsiderations in the manual curation process included examining genomic context using the SEEDviewer tool (77), searching for conserved sequence domains (78), and reviewing current literature (12, 14,41, 79). Finally, metabolic gaps in the production of biomass components were identified using thePSAMM gapfill function (23). A number of gap-filling reactions were included to enable biomassproduction with experimentally confirmed carbon sources and electron acceptors (13). These gapreactions were further scrutinized through manual inspection of the biosynthetic pathways leadingto the various biomass components and were reviewed with the fluxcheck function using the “--unrestricted” option in PSAMM to confirm their flux consistency. Stoichiometric consistency of the modelwas validated by using the masscheck function in PSAMM. Additional verification of the formula andcharge balance was performed with the formulacheck and chargecheck functions. By default, theexchange reactions, compound sources or sinks (e.g., 4HBASink, 5DRIB_Sink, and AMOB_Sink), macro-molecular synthesis equations (e.g., Core_Biomass, Growth, and PASYN_WP3_20C), and reactions involv-ing the acyl carrier protein (ACP) or its apo form (e.g., ACPS1, ACPSc, and AGPEPHOS) were excluded fromformula and charge checks due to the presence of undefined R or X groups in the metabolites.
Formulating the biomass objective function. A biomass equation was formulated in the WP3reconstruction to simulate the production of components required for cell growth. The biomass equationincorporates the cellular composition of the total cellular carbohydrates, proteins, RNA, DNA, lipids,vitamins, and cofactors (see Table S1 in the supplemental material). Biomass compositions from exper-imental measurements of WP3 and evolutionarily related species were used as references for formulatingthe stoichiometry of the biomass equation. First, the composition of carbohydrates, proteins, DNA, RNA,and lipids was estimated using approximations from S. oneidensis MR-1 (24, 25). The addition of vitaminsand cofactors into the WP3 biomass was achieved by using an approximation of the experimentalmeasurements from E. coli as a representation of Gram-negative bacteria (80). Further calibration of thebiomass composition in WP3 involved formulating the stoichiometry of the phosphatidic acid synthasereactions according to experimental measurements of branched-chain, unsaturated, and saturated fattyacids in this organism (14) (see Table S2). The overall biomass equation was scaled so that thestoichiometry of biomass components corresponds to their millimole (mmol) amounts in a gram of celldry weight (gDW). This calibration enabled the comparison of computationally simulated biomassproduction levels with experimental measurements.
Formulating the basal constraints of metabolic simulations. A list of basal constraints wasdefined for exchange reactions in the model using the lower and upper bounds specified in Table S3 inthe supplemental material. The basal constraints were used to set default bounds for the uptake ofnutrient sources and the removal of metabolic by-products. For trace elements, vitamin precursors, andsalts, the default bounds were unlimited in both directions, and for metabolic by-products, the lowerbounds were set to zero while the upper bounds were unlimited, indicating that they can be freelyreleased from the system. The basal constraints also defined the exchange reactions for 71 potentialcarbon sources and 13 electron acceptors in the model. The uptake of carbon sources and electronacceptors was blocked in the basal constraints and was defined during individual simulations. Unlessotherwise specified (e.g., as defined in Table 1), the lower bound of the sole carbon source was set to�10 to limit its uptake to 10 mmol/liter, and the uptake of the sole electron acceptor was unlimited.
Comparing WP3 metabolic simulations with experimental results and the MR-1 model. Thegrowth of WP3 when utilizing a variety of sole carbon sources was examined in aerobic batch culturesusing 50 ml of LMO-812 minimal medium (see Text S1 in the supplemental material) supplemented withalternative sole carbon sources at different concentrations (2 mM, 5 mM, 10 mM, 20 mM, or 40 mM).Cultures were grown in triplicate at 20°C and were continuously shaken at 200 rpm. The growth curveof WP3 was determined using turbidity measurements at an optical density of 600 nm (OD600). Thegrowth measurements at early stationary phase were converted to gDW/liter of biomass concentration
Genome-Scale Model of Shewanella piezotolerans
March/April 2017 Volume 2 Issue 2 e00165-16 msystems.asm.org 13
on January 23, 2019 by guesthttp://m
systems.asm
.org/D
ownloaded from
using a previously determined correlation between OD600 and dry weight in Shewanella species (24). Tosimulate the experimental growth conditions, the PSAMM fba function was applied to perform FBAsimulations using the biomass equation as the objective function. The exchange of carbon, nitrogen,sulfur, and phosphorus nutrients was constrained based on their availability in the experimental medium(Table 1), the exchange of oxygen was unlimited to simulate aerobic respiration with oxygen as the soleelectron acceptor, and other exchange reactions were defined with the basal constraints. The unit of theuptake fluxes was assigned to mmol/liter, which corresponds to the unit of nutrient concentration in theexperimental medium. Since the biomass equation in WP3 was calibrated to reflect the millimole (mmol)amounts of biomass components in a gram of cell dry weight (gDW), the biomass concentrations werepredicted based on the biomass fluxes (vB gDW/liter).
Comparisons of the WP3 with the MR-1 model were performed by simulating the aerobic growth ofthe organisms using 28 sole carbon sources that have been experimentally confirmed to support thegrowth of either WP3 (13) or MR-1 (24, 25) (see Fig. S2 in the supplemental material). The latest metabolicreconstruction of MR-1, iMR1_799 (25) was used in all MR-1 simulations performed in this study. Thesimulations with both models were set up using the basal constraints with default bounds for the solecarbon sources (i.e., [�10, 1,000]) and the sole electron acceptor, oxygen (i.e., [�1,000, 1,000]). Thebiomass yields were calculated through dividing the biomass flux by the uptake fluxes of the carbonsource and the electron acceptor.
Metabolic simulation of mutant phenotypes. Mutant strains of WP3 were simulated in themetabolic model by setting a flux limit of [0, 0] for all reactions catalyzed by the gene being knocked out.A list of enzymes involved in ATP production, PMF generation, and redox activities is provided in Table 2,along with their corresponding reactions, functional roles, and gene associations in the WP3 model.Medium conditions were set in the WP3 model using the basal constraints with uptake enabled for a solecarbon source (lactate or GlcNac) and a sole electron acceptor (O2 or fumarate). The carbon source wasconstrained to a maximum uptake of 10 mmol/liter, and the electron acceptor was unlimited. Forsimulations with fumarate as the electron acceptor, the succinate/fumarate antiporter reaction,SUCFUMtdc, was blocked, as it has been noted to be able to form artificial loops with othertransporters (80), and the fumarate hydrogen symporters FUMt4 and FUMt4_2 were also blocked toprevent utilization of fumarate as an additional carbon source. When GlcNac was used as the sole carbonsource, the lactate dehydrogenase and glycerol-3-phosphate dehydrogenase reactions were blocked toprevent the formation of artificial loops in NADH cycling. Metabolic reaction fluxes were determined byoptimizing the biomass objective function using fba with the l1min loop removal approach implementedin PSAMM (23, 81). Additional analysis of flux variability was performed on internal reactions with the fvafunction in PSAMM by fixing the biomass flux to its maximum. The reaction flux for Fdh was calculatedbased on the sum of fluxes through the FDH9 and FDH10 reactions, and the reaction flux for Ndh wascalculated based on the sum of fluxes through the NADH4, NADH12, and NADH14 reactions. All otherfluxes were obtained directly from the FBA and FVA simulations according to the reactions listed inTable 2.
Metabolic simulations of the NAD�/NADH homeostasis. The NAD�/NADH homeostasis was usedas an approximation for investigating redox states in the WP3 model and the MR-1 model, iMR1_799 (25).To simulate the NAD�/NADH homeostasis, an artificial reaction, NAD� � H� N NADH (denoted EQ1),was introduced to the model to account for differences in the concentrations of NAD� and NADH. First,a robustness analysis was performed by varying the flux value of EQ1 while optimizing the biomassproduction. This was performed using the robustness function in PSAMM (23), where flux values of EQ1were probed in the range of [�10, 10] at 500 steps. For each step, FBA simulation was performed withthe l1min loop removal, and the simulated ATPase flux was plotted with the corresponding flux of EQ1(see Fig. S3 and S4 in the supplemental material). Next, a linear model was fit to the data using theequation vATPase � k · vEQ1 � b, where vATPase was the flux of the ATPase reaction and vEQ1 was the fluxof the EQ1 reaction. To identify the connections between ATPase activity (i.e., ATP production or PMFgeneration) and the redox state of a cell, the intersection of the linear model with the EQ1 axis was usedto determine the difference in NAD� and NADH concentrations when the ATPase reaction fluxapproached zero. A negative intersection of the linear model on the EQ1 axis would indicate(NAD�) � (NADH) � 0, suggesting that the homeostasis was pushed toward generating more NADH; a
TABLE 2 Metabolic enzymes involved in ATP production and PMF generation, with their corresponding reactions, functional roles, andgene associations in the WP3 modela
Enzyme Reaction identifier(s) Function Gene association(s)
Pta PTAr Phosphotransacetylase swp_1948AckA ACKr Acetate kinase swp_1949ATPase ATPS4r ATP synthase swp_5155 AND swp_5156 AND swp_5157 AND swp_5158
AND swp_5159 AND swp_5160 AND swp_5161Pyk PYK Pyruvate kinase swp_2388Pfl PFL Formate C-acetyltransferase swp_1952Xpk XPK Xylulose-5-phosphate phosphoketolase swp_3738Ndh NADH4, NADH12, NADH14 NADH dehydrogenase swp_1298 OR swp_2117 OR swp_4014Fdh FDH9, FDH10 Formate dehydrogenase (swp_5024 AND swp_5025 AND swp_5023) OR
(swp_5027 AND swp_5028 AND swp_5029)aA schematic of key reactions and comparisons of biomass and reaction fluxes is shown in Fig. 4.
Dufault-Thompson et al.
March/April 2017 Volume 2 Issue 2 e00165-16 msystems.asm.org 14
on January 23, 2019 by guesthttp://m
systems.asm
.org/D
ownloaded from

positive intersection would indicate (NAD�) � (NADH) � 0, suggesting that the homeostasis was pushedtoward generating more NAD�. Both the WP3 and MR-1 models were simulated using basal constraints,with the addition of fumarate as the anaerobic electron acceptor paired with one of 12 sole carbonsources that are growth supporting in both models (Fig. 5; see also Fig. S3 and S4). The exchange fluxof the sole carbon source was constrained to [�10, 1,000], and the exchange of the electron acceptor wasunlimited. The fumarate transport reactions SUCFUMtdc, FUMt4, and FUMt4_2 were blocked as men-tioned above to avoid artificial loops and prevent the utilization of fumarate as an additional carbonsource. The proton-pumping NADH dehydrogenase in MR-1 was blocked due to the lack of evidence ofits participation in energy metabolism (8, 24, 25). All other internal reactions in the WP3 and MR-1 modelswere constrained based on the reaction reversibility using default settings in PSAMM.
SUPPLEMENTAL MATERIALSupplemental material for this article may be found at https://doi.org/10.1128/
mSystems.00165-16.FIG S1, PDF file, 0.4 MB.FIG S2, PDF file, 0.1 MB.FIG S3, PDF file, 0.04 MB.FIG S4, PDF file, 0.04 MB.TABLE S1, PDF file, 0.02 MB.TABLE S2, PDF file, 0.01 MB.TABLE S3, PDF file, 0.03 MB.TABLE S4, PDF file, 0.02 MB.TEXT S1, PDF file, 0.1 MB.
ACKNOWLEDGMENTSWe thank Chao Liu for the comparative analysis of Shewanella full genomes and Jon
Steffensen for the technical support in the operation of PSAMM software package. Wethank Margrethe H. Serres for constructive comments on the manuscript and fordiscussions about genome annotation of the Shewanella genus.
The metabolic modeling was supported by the National Science Foundation undergrant no. 1553211, a summer fellowship to K.D.-T. from the RI NSF EPSCoR undercooperative agreement no. EPS-1004057, and the USDA National Institute of Food andAgriculture, Hatch fund, RI0015-H002, accession no. 1007170. The experimental workwas supported by the National Natural Science Foundation of China (grant no.31290232). Any opinions, findings, and conclusions or recommendations expressed inthis material are those of the author(s) and do not necessarily reflect the views of thefunders.
REFERENCES1. Chilukuri LN, Bartlett DH. 1997. Isolation and characterization of the
gene encoding single-stranded-DNA-binding protein (SSB) from fourmarine Shewanella strains that differ in their temperature and pressureoptima for growth. Microbiology 143:1163–1174. https://doi.org/10.1099/00221287-143-4-1163.
2. Konstantinidis KT, Serres MH, Romine MF, Rodrigues JLM, Auchtung J,McCue LA, Lipton MS, Obraztsova A, Giometti CS, Nealson KH, Fredrick-son JK, Tiedje JM. 2009. Comparative systems biology across an evolu-tionary gradient within the Shewanella genus. Proc Natl Acad Sci U S A106:15909 –15914. https://doi.org/10.1073/pnas.0902000106.
3. Hau HH, Gralnick JA. 2007. Ecology and biotechnology of the genusShewanella. Annu Rev Microbiol 61:237–258. https://doi.org/10.1146/annurev.micro.61.080706.093257.
4. Fredrickson JK, Romine MF, Beliaev AS, Auchtung JM, Driscoll ME,Gardner TS, Nealson KH, Osterman AL, Pinchuk G, Reed JL, RodionovDA, Rodrigues JLM, Saffarini DA, Serres MH, Spormann AM, Zhulin IB,Tiedje JM. 2008. Towards environmental systems biology of She-wanella. Nat Rev Microbiol 6:592– 603. https://doi.org/10.1038/nrmicro1947.
5. Nealson KH, Scott J. 2006. Ecophysiology of the genus Shewanella, p1133–1151. In Dworkin M, Falkow S, Rosenberg E, Schleifer K-H, Stacke-brandt E (ed), The Prokaryotes, vol 6. Springer, New York, NY.
6. Beliaev AS, Klingeman DM, Klappenbach JA, Wu L, Romine MF, Tiedje JM,Nealson KH, Fredrickson JK, Zhou J. 2005. Global transcriptome analysis
of Shewanella oneidensis MR-1 exposed to different terminal electronacceptors. J Bacteriol 187:7138 –7145. https://doi.org/10.1128/JB.187.20.7138-7145.2005.
7. Kato C, Nogi Y. 2001. Correlation between phylogenetic structure andfunction: examples from deep-sea Shewanella. FEMS Microbiol Ecol35:223–230. https://doi.org/10.1111/j.1574-6941.2001.tb00807.x.
8. Hunt KA, Flynn JM, Naranjo B, Shikhare ID, Gralnick JA. 2010. Substrate-level phosphorylation is the primary source of energy conservationduring anaerobic respiration of Shewanella oneidensis strain MR-1. JBacteriol 192:3345–3351. https://doi.org/10.1128/JB.00090-10.
9. Pinchuk GE, Geydebrekht OV, Hill EA, Reed JL, Konopka AE, Beliaev AS,Fredrickson JK. 2011. Pyruvate and lactate metabolism by Shewanellaoneidensis MR-1 under fermentation, oxygen limitation, and fumaraterespiration conditions. Appl Environ Microbiol 77:8234 – 8240. https://doi.org/10.1128/AEM.05382-11.
10. Kane AL, Brutinel ED, Joo H, Maysonet R, VanDrisse CM, Kotloski NJ, GralnickJA. 2016. Formate metabolism in Shewanella oneidensis generates protonmotive force and prevents growth without an electron acceptor. J Bacteriol198:1337–1346. https://doi.org/10.1128/JB.00927-15.
11. Wang F, Wang P, Chen M, Xiao X. 2004. Isolation of extremophiles withthe detection and retrieval of Shewanella strains in deep-sea sedimentsfrom the west Pacific. Extremophiles 8:165–168. https://doi.org/10.1007/s00792-003-0365-0.
12. Wang F, Wang J, Jian H, Zhang B, Li S, Wang F, Zeng X, Gao L, Bartlett
Genome-Scale Model of Shewanella piezotolerans
March/April 2017 Volume 2 Issue 2 e00165-16 msystems.asm.org 15
on January 23, 2019 by guesthttp://m
systems.asm
.org/D
ownloaded from

DH, Yu J, Hu S, Xiao X. 2008. Environmental adaptation: genomic analysisof the piezotolerant and psychrotolerant deep-sea iron reducing bacte-rium Shewanella piezotolerans WP3. PLoS One 3:e1937. https://doi.org/10.1371/journal.pone.0001937.
13. Xiao X, Wang P, Zeng X, Bartlett DH, Wang F. 2007. Shewanella psychro-phila sp. nov. and Shewanella piezotolerans sp. nov., isolated from westPacific deep-sea sediment. Int J Syst Evol Microbiol 57:60 – 65. https://doi.org/10.1099/ijs.0.64500-0.
14. Wang F, Xiao X, Ou HY, Gai Y, Wang F. 2009. Role and regulation of fattyacid biosynthesis in the response of Shewanella piezotolerans WP3 todifferent temperatures and pressures. J Bacteriol 191:2574 –2584.https://doi.org/10.1128/JB.00498-08.
15. Bordbar A, Monk JM, King ZA, Palsson BO. 2014. Constraint-basedmodels predict metabolic and associated cellular functions. Nat RevGenet 15:107–120. https://doi.org/10.1038/nrg3643.
16. Orth JD, Thiele I, Palsson BØ. 2010. What is flux balance analysis? NatBiotechnol 28:245–248. https://doi.org/10.1038/nbt.1614.
17. Burgard AP, Pharkya P, Maranas CD. 2003. OptKnock: a bilevel program-ming framework for identifying gene knockout strategies for microbialstrain optimization. Biotechnol Bioeng 84:647– 657. https://doi.org/10.1002/bit.10803.
18. Zomorrodi AR, Suthers PF, Ranganathan S, Maranas CD. 2012. Mathe-matical optimization applications in metabolic networks. Metab Eng14:672– 686. https://doi.org/10.1016/j.ymben.2012.09.005.
19. Casey JR, Mardinoglu A, Nielsen J, Karl DM. 2016. Adaptive evolution ofphosphorus metabolism in Prochlorococcus. mSystems 1:e00065-16.https://doi.org/10.1128/mSystems.00065-16.
20. Henry CS, DeJongh M, Best AA, Frybarger PM, Linsay B, Stevens RL. 2010.High-throughput generation, optimization and analysis of genome-scalemetabolic models. Nat Biotechnol 28:977–982. https://doi.org/10.1038/nbt.1672.
21. Schellenberger J, Que R, Fleming RMT, Thiele I, Orth JD, Feist AM,Zielinski DC, Bordbar A, Lewis NE, Rahmanian S, Kang J, Hyduke DR,Palsson BØ. 2011. Quantitative prediction of cellular metabolism withconstraint-based models: the COBRA Toolbox v2.0. Nat Protoc6:1290 –1307. https://doi.org/10.1038/nprot.2011.308.
22. Agren R, Liu L, Shoaie S, Vongsangnak W, Nookaew I, Nielsen J. 2013. TheRAVEN Toolbox and its use for generating a genome-scale metabolicmodel for Penicillium chrysogenum. PLoS Comput Biol 9:e1002980.https://doi.org/10.1371/journal.pcbi.1002980.
23. Steffensen JL, Dufault-Thompson K, Zhang Y. 2016. PSAMM: a portablesystem for the analysis of metabolic models. PLoS Comput Biol 12:e1004732. https://doi.org/10.1371/journal.pcbi.1004732.
24. Pinchuk GE, Hill EA, Geydebrekht OV, de Ingeniis J, Zhang X, OstermanA, Scott JH, Reed SB, Romine MF, Konopka AE, Beliaev AS, Fredrickson JK,Reed JL. 2010. Constraint-based model of Shewanella oneidensis MR-1metabolism: a tool for data analysis and hypothesis generation. PLoSComput Biol 6:e100822. https://doi.org/10.1371/journal.pcbi.1000822.
25. Ong WK, Vu TT, Lovendahl KN, Llull JM, Serres MH, Romine MF, Reed JL.2014. Comparisons of Shewanella strains based on genome annotations,modeling, and experiments. BMC Syst Biol 8:31. https://doi.org/10.1186/1752-0509-8-31.
26. Chen Y, Wang F, Xu J, Mehmood MA, Xiao X. 2011. Physiological andevolutionary studies of NAP systems in Shewanella piezotolerans WP3.ISME J 5:843– 855. https://doi.org/10.1038/ismej.2010.182.
27. Xiong L, Jian H, Zhang Y, Xiao X. 2016. The two sets of DMSO respiratorysystems of Shewanella piezotolerans WP3 are involved in deep seaenvironmental adaptation. Front Microbiol 7:1418. https://doi.org/10.3389/fmicb.2016.01418.
28. Yang XW, He Y, Xu J, Xiao X, Wang FP. 2013. The regulatory role of ferricuptake regulator (Fur) during anaerobic respiration of Shewanella piezo-tolerans WP3. PLoS One 8:e75588. https://doi.org/10.1371/journal.pone.0075588.
29. Wu W, Li B, Hu J, Li J, Wang F, Pan Y. 2011. Iron reduction and magnetitebiomineralization mediated by a deep-sea iron-reducing bacterium She-wanella piezotolerans WP3. J Geophys Res Biogeosci 116:G04034. https://doi.org/10.1029/2011JG001728.
30. Wu WF, Wang FP, Li JH, Yang XW, Xiao X, Pan YX. 2013. Iron reductionand mineralization of deep-sea iron reducing bacterium Shewanellapiezotolerans WP3 at elevated hydrostatic pressures. Geobiology 11:593– 601. https://doi.org/10.1111/gbi.12061.
31. Li S, Xiao X, Sun P, Wang F. 2008. Screening of genes regulated by coldshock in Shewanella piezotolerans WP3 and time course expression of
cold-regulated genes. Arch Microbiol 189:549 –556. https://doi.org/10.1007/s00203-007-0347-1.
32. Li S, Xiao X, Li J, Luo J, Wang F. 2006. Identification of genes regulatedby changing salinity in the deep-sea bacterium Shewanella sp. WP3using RNA arbitrarily primed PCR. Extremophiles 10:97–104. https://doi.org/10.1007/s00792-005-0476-x.
33. Jian H, Li S, Feng X, Xiao X. 2016. Global transcriptome analysis of theheat shock response of the deep-sea bacterium Shewanella piezotoleransWP3. Mar Genomics 30:81– 85. https://doi.org/10.1016/j.margen.2016.08.002.
34. Jian H, Hu J, Xiao X. 2015. Transcriptional profiling of CRP-regulatedgenes in deep-sea bacterium Shewanella piezotolerans WP3. GenomicsData 5:51–53. https://doi.org/10.1016/j.gdata.2015.04.019.
35. Jian H, Wang F. 2015. Microarray analysis of lexA gene deletion mutantof deep-sea bacterium Shewanella piezotolerans WP3 at low-temperature and high-pressure. Genomics Data 4:130 –132. https://doi.org/10.1016/j.gdata.2015.03.013.
36. Jian H, Xiong L, He Y, Xiao X. 2015. The regulatory function of LexA istemperature-dependent in the deep-sea bacterium Shewanella piezotol-erans WP3. Front Microbiol 6:627. https://doi.org/10.3389/fmicb.2015.00627.
37. Wang F, Wang F, Li Q, Xiao X. 2007. A novel filamentous phage from thedeep-sea bacterium Shewanella piezotolerans WP3 is induced at lowtemperature. J Bacteriol 189:7151–7153. https://doi.org/10.1128/JB.00569-07.
38. Jian H, Xiao X, Wang F. 2013. Role of filamentous phage SW1 in regu-lating the lateral flagella of Shewanella piezotolerans strain WP3 at lowtemperatures. Appl Environ Microbiol 79:7101–7109. https://doi.org/10.1128/AEM.01675-13.
39. Yang XW, Jian HH, Wang FP. 2015. pSW2, a novel low-temperature-inducible gene expression vector based on a filamentous phage of thedeep-sea bacterium Shewanella piezotolerans WP3. Appl Environ Micro-biol 81:5519 –5526. https://doi.org/10.1128/AEM.00906-15.
40. Jian H, Xiong L, Xu G, Xiao X. 2016. Filamentous phage SW1 is active andinfluences the transcriptome of the host at high-pressure and low-temperature. Environ Microbiol Rep 8:358 –362. https://doi.org/10.1111/1758-2229.12388.
41. Rodionov DA, Yang C, Li X, Rodionova IA, Wang Y, Obraztsova AY,Zagnitko OP, Overbeek R, Romine MF, Reed S, Fredrickson JK, NealsonKH, Osterman AL. 2010. Genomic encyclopedia of sugar utilization path-ways in the Shewanella genus. BMC Genomics 11:494. https://doi.org/10.1186/1471-2164-11-494.
42. Overbeek R, Begley T, Butler RM, Choudhuri JV, Chuang HY, Cohoon M,de Crécy-Lagard V, Diaz N, Disz T, Edwards R, Fonstein M, Frank ED,Gerdes S, Glass EM, Goesmann A, Hanson A, Iwata-Reuyl D, Jensen R,Jamshidi N, Krause L, Kubal M, Larsen N, Linke B, McHardy AC, Meyer F,Neuweger H, Olsen G, Olson R, Osterman A, Portnoy V, Pusch GD,Rodionov DA, Rückert C, Steiner J, Stevens R, Thiele I, Vassieva O, Ye Y,Zagnitko O, Vonstein V. 2005. The subsystems approach to genomeannotation and its use in the project to annotate 1000 genomes. NucleicAcids Res 33:5691–5702. https://doi.org/10.1093/nar/gki866.
43. Imai K, Asakawa N, Tsuji T, Akazawa F, Ino A, Sonoyama M, Mitaku S.2008. SOSUI-GramN: high performance prediction for sub-cellular local-ization of proteins in gram-negative bacteria. Bioinformation 2:417– 421.https://doi.org/10.6026/97320630002417.
44. Yu NY, Wagner JR, Laird MR, Melli G, Rey S, Lo R, Dao P, Sahinalp SC, EsterM, Foster LJ, Brinkman FSL. 2010. PSORTb 3.0: improved protein subcel-lular localization prediction with refined localization subcategories andpredictive capabilities for all prokaryotes. Bioinformatics 26:1608 –1615.https://doi.org/10.1093/bioinformatics/btq249.
45. Petersen TN, Brunak S, von Heijne G, Nielsen H. 2011. SignalP 4.0:discriminating signal peptides from transmembrane regions. Nat Meth-ods 8:785–786. https://doi.org/10.1038/nmeth.1701.
46. Cruz-García C, Murray AE, Klappenbach JA, Stewart V, Tiedje JM. 2007.Respiratory nitrate ammonification by Shewanella oneidensis MR-1. JBacteriol 189:656 – 662. https://doi.org/10.1128/JB.01194-06.
47. Gon S, Patte JC, Dos Santos JP, Méjean V. 2002. Reconstitution of thetrimethylamine oxide reductase regulatory elements of Shewanella one-idensis in Escherichia coli. J Bacteriol 184:1262–1269. https://doi.org/10.1128/JB.184.5.1262-1269.2002.
48. Simpson PJL, Richardson DJ, Codd R. 2010. The periplasmic nitratereductase in Shewanella: the resolution, distribution and functional im-plications of two NAP isoforms, NapEDABC and NapDAGHB. Microbiol-ogy 156:302–312. https://doi.org/10.1099/mic.0.034421-0.
Dufault-Thompson et al.
March/April 2017 Volume 2 Issue 2 e00165-16 msystems.asm.org 16
on January 23, 2019 by guesthttp://m
systems.asm
.org/D
ownloaded from

49. Schuetz B, Schicklberger M, Kuermann J, Spormann AM, Gescher J. 2009.Periplasmic electron transfer via the c-type cytochromes Mtra and Fccaof Shewanella oneidensis Mr-1. Appl Environ Microbiol 75:7789 –7796.https://doi.org/10.1128/AEM.01834-09.
50. Burns JL, Dichristina TJ. 2009. Anaerobic respiration of elemental sulfurand thiosulfate by Shewanella oneidensis MR-1 requires psrA, a phsAhomolog of Salmonella typhimurium LT2. Appl Environ Microbiol 75:5209 –5217. https://doi.org/10.1128/AEM.00888-09.
51. Heidelberg JF, Paulsen IT, Nelson KE, Gaidos EJ, Nelson WC, Read TD,Eisen JA, Seshadri R, Ward N, Methe B, Clayton RA, Meyer T, Tsapin A,Scott J, Beanan M, Brinkac L, Daugherty S, DeBoy RT, Dodson RJ, DurkinAS, Haft DH, Kolonay JF, Madupu R, Peterson JD, Umayam LA, White O,Wolf AM, Vamathevan J, Weidman J, Impraim M, Lee K, Berry K, Lee C,Mueller J, Khouri H, Gill J, Utterback TR, McDonald LA, Feldblyum TV,Smith HO, Venter JC, Nealson KH, Fraser CM. 2002. Genome sequence ofthe dissimilatory metal ion-reducing bacterium Shewanella oneidensis.Nat Biotechnol 20:1118 –1123. https://doi.org/10.1038/nbt749.
52. Gralnick JA, Vali H, Lies DP, Newman DK. 2006. Extracellular respira-tion of dimethyl sulfoxide by Shewanella oneidensis strain MR-1. ProcNatl Acad Sci U S A 103:4669 – 4674. https://doi.org/10.1073/pnas.0505959103.
53. Coursolle D, Baron DB, Bond DR, Gralnick JA. 2010. The Mtr respiratorypathway is essential for reducing flavins and electrodes in Shewanellaoneidensis. J Bacteriol 192:467– 474. https://doi.org/10.1128/JB.00925-09.
54. Shi L, Rosso KM, Zachara JM, Fredrickson JK. 2012. Mtr extracellularelectron-transfer pathways in Fe(III)-reducing or Fe(II)-oxidizing bacteria:a genomic perspective. Biochem Soc Trans 40:1261–1267. https://doi.org/10.1042/BST20120098.
55. Coursolle D, Gralnick JA. 2012. Reconstruction of extracellular respiratorypathways for iron(III) reduction in Shewanella oneidensis strain MR-1.Front Microbiol 3:56. https://doi.org/10.3389/fmicb.2012.00056.
56. Masi M, Pagès JM. 2013. Structure, function and regulation of outermembrane proteins involved in drug transport in Enterobactericeae: theOmpF/C–TolC case. Open Microbiol J 7:22–33. https://doi.org/10.2174/1874285801307010022.
57. Nikaido H. 2003. Molecular basis of bacterial outer membrane permea-bility revisited. Microbiol Mol Biol Rev 67:593– 656. https://doi.org/10.1128/MMBR.67.4.593-656.2003.
58. Nestorovich EM, Sugawara E, Nikaido H, Bezrukov SM. 2006. Pseudomo-nas aeruginosa porin OprF: properties of the channel. J Biol Chem281:16230 –16237. https://doi.org/10.1074/jbc.M600650200.
59. Death A, Notley L, Ferenci T. 1993. Derepression of LamB protein facil-itates outer membrane permeation of carbohydrates into Escherichia coliunder conditions of nutrient stress. J Bacteriol 175:1475–1483. https://doi.org/10.1128/jb.175.5.1475-1483.1993.
60. Wylie JL, Worobec EA. 1995. The OprB porin plays a central role incarbohydrate uptake in Pseudomonas aeruginosa. J Bacteriol 177:3021–3026. https://doi.org/10.1128/jb.177.11.3021-3026.1995.
61. Moraes TF, Bains M, Hancock REW, Strynadka NCJ. 2007. An arginineladder in OprP mediates phosphate-specific transfer across the outermembrane. Nat Struct Mol Biol 14:85– 87. https://doi.org/10.1038/nsmb1189.
62. Nieweg A, Bremer E. 1997. The nucleoside-specific Tsx channel from theouter membrane of Salmonella typhimurium, Klebsiella pneumoniae andEnterobacter aerogenes: functional characterization and DNA sequenceanalysis of the tsx genes. Microbiology 143:603– 615. https://doi.org/10.1099/00221287-143-2-603.
63. Shultis DD, Purdy MD, Banchs CN, Wiener MC. 2006. Outer membraneactive transport: structure of the BtuB:TonB complex. Science 312:1396 –1399. https://doi.org/10.1126/science.1127694.
64. Deutschbauer A, Price MN, Wetmore KM, Shao W, Baumohl JK, Xu Z,Nguyen M, Tamse R, Davis RW, Arkin AP. 2011. Evidence-based annota-tion of gene function in Shewanella oneidensis MR-1 using genome-widefitness profiling across 121 conditions. PLoS Genet 7:e1002385. https://doi.org/10.1371/journal.pgen.1002385.
65. Yang C, Rodionov DA, Li X, Laikova ON, Gelfand MS, Zagnitko OP, RomineMF, Obraztsova AY, Nealson KH, Osterman AL. 2006. Comparative genomicsand experimental characterization of N-acetylglucosamine utilization path-way of Shewanella oneidensis. J Biol Chem 281:29872–29885. https://doi.org/10.1074/jbc.M605052200.
66. Bruinenberg PM, de Bot PHM, van Dijken JP, Scheffers WA. 1983. The roleof redox balances in the anaerobic fermentation of xylose by yeasts. EurJ Appl Microbiol Biotechnol 18:287–292.
67. Berríos-Rivera SJ, Bennett GN, San KY. 2002. Metabolic engineering ofEscherichia coli: increase of NADH availability by overexpressing anNAD�-dependent formate dehydrogenase. Metab Eng 4:217–229.https://doi.org/10.1006/mben.2002.0227.
68. Hasegawa S, Uematsu K, Natsuma Y, Suda M, Hiraga K, Jojima T, Inui M,Yukawa H. 2012. Improvement of the redox balance increases L-valineproduction by Corynebacterium glutamicum under oxygen deprivationconditions. Appl Environ Microbiol 78:865– 875. https://doi.org/10.1128/AEM.07056-11.
69. Chang RL, Andrews K, Kim D, Li Z, Godzik A, Palsson BO. 2013. Structuralsystems biology evaluation of metabolic thermotolerance in Escherichiacoli. Science 340:1220 –1223. https://doi.org/10.1126/science.1234012.
70. Töpfer N, Caldana C, Grimbs S, Willmitzer L, Fernie AR, Nikoloski Z. 2013.Integration of genome-scale modeling and transcript profiling reveals met-abolic pathways underlying light and temperature acclimation in Arabidop-sis. Plant Cell 25:1197–1211. https://doi.org/10.1105/tpc.112.108852.
71. Kanehisa M, Sato Y, Kawashima M, Furumichi M, Tanabe M. 2016. KEGGas a reference resource for gene and protein annotation. Nucleic AcidsRes 44:D457–D462. https://doi.org/10.1093/nar/gkv1070.
72. Zhang Y, Sievert SM. 2014. Pan-genome analyses identify lineage- andniche-specific markers of evolution and adaptation in Epsilonproteobac-teria. Front Microbiol 5:110. https://doi.org/10.3389/fmicb.2014.00110.
73. Li L, Stoeckert CJ, Roos DS. 2003. OrthoMCL: identification of orthologgroups for eukaryotic genomes. Genome Res 13:2178 –2189. https://doi.org/10.1101/gr.1224503.
74. Edgar RC. 2004. MUSCLE: multiple sequence alignment with high accu-racy and high throughput. Nucleic Acids Res 32:1792–1797. https://doi.org/10.1093/nar/gkh340.
75. Stamatakis A. 2014. RAxML version 8: a tool for phylogenetic analysisand post-analysis of large phylogenies. Bioinformatics 30:1312–1313.https://doi.org/10.1093/bioinformatics/btu033.
76. Caspi R, Billington R, Ferrer L, Foerster H, Fulcher CA, Keseler IM, KothariA, Krummenacker M, Latendresse M, Mueller LA, Ong Q, Paley S,Subhraveti P, Weaver DS, Karp PD. 2016. The MetaCyc database ofmetabolic pathways and enzymes and the BioCyc collection of pathway/genome databases. Nucleic Acids Res 44:D471–D480. https://doi.org/10.1093/nar/gkv1164.
77. Overbeek R, Olson R, Pusch GD, Olsen GJ, Davis JJ, Disz T, Edwards RA,Gerdes S, Parrello B, Shukla M, Vonstein V, Wattam AR, Xia F, Stevens R.2014. The SEED and the Rapid annotation of microbial genomes usingsubsystems technology (RAST). Nucleic Acids Res 42:D206 –D214.https://doi.org/10.1093/nar/gkt1226.
78. Finn RD, Coggill P, Eberhardt RY, Eddy SR, Mistry J, Mitchell AL, Potter SC,Punta M, Qureshi M, Sangrador-Vegas A, Salazar GA, Tate J, Bateman A.2016. The Pfam protein families database: towards a more sustainablefuture. Nucleic Acids Res 44:D279 –D285. https://doi.org/10.1093/nar/gkv1344.
79. Serres MH, Riley M. 2006. Genomic analysis of carbon source metabolismof Shewanella oneidensis MR-1: predictions versus experiments. J Bacte-riol 188:4601– 4609. https://doi.org/10.1128/JB.01787-05.
80. Orth JD, Conrad TM, Na J, Lerman JA, Nam H, Feist AM, Palsson BØ. 2011.A comprehensive genome-scale reconstruction of Escherichia coli metabo-lism—2011. Mol Syst Biol 7:535. https://doi.org/10.1038/msb.2011.65.
81. Candès EJ, Wakin MB, Boyd SP. 2008. Enhancing sparsity by reweighted �1minimization. J Fourier Anal Appl 14:877–905. https://doi.org/10.1007/s00041-008-9045-x.
Genome-Scale Model of Shewanella piezotolerans
March/April 2017 Volume 2 Issue 2 e00165-16 msystems.asm.org 17
on January 23, 2019 by guesthttp://m
systems.asm
.org/D
ownloaded from