A generic capture assay for immunogenicity, using - DiVA Portal
42
UPTEC X 13 007 Examensarbete 30 hp April 2013 A generic capture assay for immunogenicity, using Biacore Martin Engqvist
Transcript of A generic capture assay for immunogenicity, using - DiVA Portal

UPTEC X 13 007
Examensarbete 30 hpApril 2013
A generic capture assay for immunogenicity, using Biacore
Martin Engqvist


Molecular Biotechnology Programme Uppsala University School of Engineering
UPTEC X 13 007 Date of issue 2013-04 Author
Martin Engqvist Title (English)
A generic capture assay for immunogenicity, using Biacore
Title (Swedish) -
Abstract The purpose of this investigation was to create and optimise a capture assay for the detection of anti-drug antibodies (ADA) in human plasma, using Biacore. We also dealt with the non-specific plasma binding to mouse-derived anti-biotin which may occur in the capture assay. By paying attention to these things we aimed at reaching as high sensitivity as possible for the ADA detection.
The capture assay also benefited and gained flexibility from using the same regeneration solution irrespective of drug and from having a composition that minimises the risk of damaging drug epitopes. Keywords Immunogenicity, immunoassay, capture assay, Biacore, non-specific binding, anti-drug antibodies (ADA), human plasma, anti-biotin, biotinylation Supervisors
Tanja Jarhede GE Healthcare
Scientific reviewer
Helena Danielsson Uppsala University
Project name
- Sponsors
- Language
English
Security -
ISSN 1401-2138
Classification -
Supplementary bibliographical information -
Pages 35
Biology Education Centre Biomedical Center Husargatan 3 Uppsala Box 592 S-75124 Uppsala Tel +46 (0)18 4710000 Fax +46 (0)18 471 4687


A generic capture assay for immunogenicity, using Biacore
Martin Engqvist
Populärvetenskaplig sammanfattning
Användandet av proteiner som terapeutiska läkemedel har blivit allt vanligare. Kroppens eget immunförsvar utgörs till stor del av proteiner (antikroppar), vars egenskaper även gör dem till idealiska läkemedel. Dock finns det en direkt nödvändighet i att göra dem så lika kroppens egna proteiner som möjligt. Misslyckas det senare finns det viss risk för en allergisk reaktion, men framför allt kan inducering av anti-läkemedelsantikroppar minska eller öka effekten av läkemedlet samt, i värsta fall, riskera att neutralisera endogena proteiner med allvarliga konsekvenser. Det kan därför vara av stor vikt att snabbt kunna detektera och karaktärisera dessa antikroppar.
I dagsläget finns ett flertal immunogenicitetsplattformar, vilket är tekniker och/eller metoder för immunogenicitetsstudier, där Biacore är en av dem. Biacore är ett SPR-baserat (Surface Plasmon Resonance) instrument, vars teknik medför en rad fördelar gentemot andra plattformar; bl.a. realtidsanalyser, detektion av låg affina-, snabbt dissocierande- och samtidigt alla subklasser av antikroppar.
Vid användandet av Biacore, för immunogenicitetsanalyser, immobiliseras läkemedlet normalt sett på en sensoryta. Plasmaprov injiceras över ytan och eventuella anti-läkemedelsantikroppar kan binda och detekteras. Därefter injiceras en regenereringslösning för att tvätta bort eventuella anti-läkemedelsantikroppar, och på så sätt möjliggöra detektion av nytt plasmaprov över samma yta. Immobiliserings- och regenereringsförhållanden är unika för varje läkemedel, vilket därmed kan upplevas som ett besvärligt och tidskrävande assayutvecklingssteg. Dessutom innebär varje regenerering en risk att förstöra epitoper på läkemedlet, vilket skulle kunna innebära en sämre eller helt utebliven detektion.
En lösning på immobiliserings- och regenereringsproblemet skulle kunna vara en ”capture assay”, där läkemedlet biotinyleras och anti-biotin istället kopplas till sensorytan. Anti-biotinet möjliggör nu inbinding av vilket biotinylerat läkemedel som helst, utan någon optimering av immobiliserings- eller regenereringsförhållanden. Ett påvisat riskmoment i metoden, p.g.a anti-biotinet, har visat sig vara en ökad respons i ospecifik inbindning från en del plasmaprover.
Målet med examensarbetet var att pröva olika strategier för att minska den ospecifika inbindningen, och därmed skapa en fullt fungerande och samtidigt fördelaktig assay.
Examensarbete 30 hp Civilingenjörsprogrammet Molekylär bioteknik
Uppsala Universitet, april 2013


Contents 1. Introduction ......................................................................................................................................... 7
1.1 The project .................................................................................................................................... 7
1.2 Aim of the study ............................................................................................................................ 7
2. Background .......................................................................................................................................... 8
2.1 Immunologic response to therapeutic agents .............................................................................. 8
2.2 The antibody ................................................................................................................................. 9
2.3 Non-specific binding ...................................................................................................................... 9
2.4 Immunoassays, immunogenicity and Biacore ............................................................................. 10
2.4.1 Biacore .................................................................................................................................. 10
3. Methods ............................................................................................................................................ 13
3.1 SDS-PAGE and imaging ................................................................................................................ 13
3.2 Isoelectric focusing ...................................................................................................................... 13
3.3 Biotinylation of drug .................................................................................................................... 14
3.4 Fragmentation ............................................................................................................................. 15
3.5 Deglycosylation ........................................................................................................................... 16
3.6 Additon of polyclonal IgG ............................................................................................................ 16
3.7 Biacore run settings ..................................................................................................................... 17
3.8 Merged injections ........................................................................................................................ 18
3.9 Calculations for evaluation .......................................................................................................... 18
4. Results and discussion ....................................................................................................................... 19
4.1 Assay optimization ...................................................................................................................... 19
4.1.1 Scouting of immobilization level of capture reagent and degree of biotinylation of ligand 19
4.1.2 Drug concentration and contact time .................................................................................. 21
4.1.3 Regeneration scouting .......................................................................................................... 22
4.2 Varying salt concentration .......................................................................................................... 24
4.2.1 Increased concentration of NaCl in running buffer .............................................................. 24
4.2.2 Increased concentration of NaCl in sample.......................................................................... 25
4.3 Fragmentation of test-antibody .................................................................................................. 26
4.4 Deglycosylation of anti-biotin ..................................................................................................... 28
4.4.1 Removal of N-linked carbohydrates ..................................................................................... 28
4.4.2 Removal of N and O-linked carbohydrates .......................................................................... 30
4.5 Addition of polyclonal IgG ........................................................................................................... 32
4.6 Merged injections ........................................................................................................................ 36
5. Conclusions ........................................................................................................................................ 38
6. Acknowledgements ........................................................................................................................... 39
7. References ......................................................................................................................................... 39
5

6
1. Introduction
1.1 The project Recombinant proteins, monoclonal antibodies and fusion proteins are all examples of biological agents used in pharmacotherapy. Ever since their introduction in the early 1980s, the subsequent development of therapeutic agents has rapidly increased [1]. Their vast spectrum in treatment of human diseases has truly made them an invaluable asset on the market.
Biological agents are large, protein-based substances derived from living sources. In some cases, subjects tend to experience an adverse reaction using these agents. Additionally, subjects who previously tolerated the agent may, in fact, obtain an adverse immune response due to alterations in manufacture or administration of the agent [1]. The adverse reaction could thereby, beside a possible allergic reaction, trigger an immunologic induction of anti-drug-antibodies (ADA). The induction of ADAs may not only weaken or increase the drug-effect but could also neutralize endogenous substances, with life-threatening consequences.
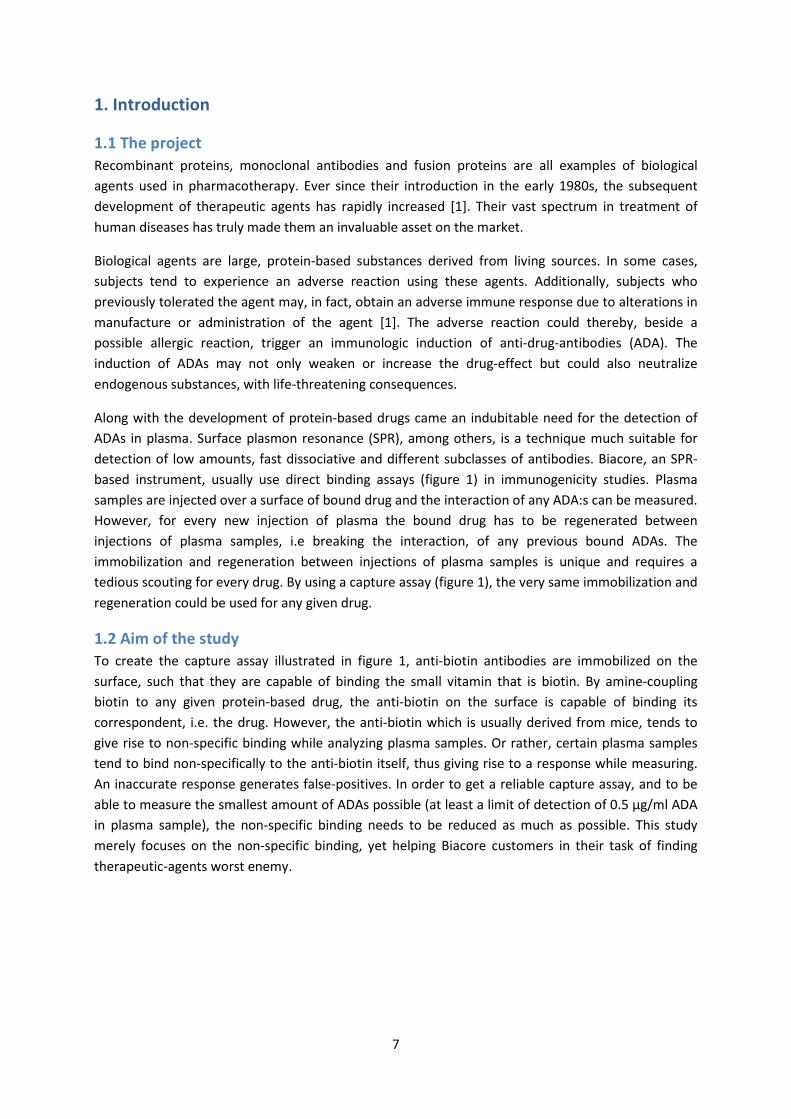
Along with the development of protein-based drugs came an indubitable need for the detection of ADAs in plasma. Surface plasmon resonance (SPR), among others, is a technique much suitable for detection of low amounts, fast dissociative and different subclasses of antibodies. Biacore, an SPR-based instrument, usually use direct binding assays (figure 1) in immunogenicity studies. Plasma samples are injected over a surface of bound drug and the interaction of any ADA:s can be measured. However, for every new injection of plasma the bound drug has to be regenerated between injections of plasma samples, i.e breaking the interaction, of any previous bound ADAs. The immobilization and regeneration between injections of plasma samples is unique and requires a tedious scouting for every drug. By using a capture assay (figure 1), the very same immobilization and regeneration could be used for any given drug.
1.2 Aim of the study To create the capture assay illustrated in figure 1, anti-biotin antibodies are immobilized on the surface, such that they are capable of binding the small vitamin that is biotin. By amine-coupling biotin to any given protein-based drug, the anti-biotin on the surface is capable of binding its correspondent, i.e. the drug. However, the anti-biotin which is usually derived from mice, tends to give rise to non-specific binding while analyzing plasma samples. Or rather, certain plasma samples tend to bind non-specifically to the anti-biotin itself, thus giving rise to a response while measuring. An inaccurate response generates false-positives. In order to get a reliable capture assay, and to be able to measure the smallest amount of ADAs possible (at least a limit of detection of 0.5 µg/ml ADA in plasma sample), the non-specific binding needs to be reduced as much as possible. This study merely focuses on the non-specific binding, yet helping Biacore customers in their task of finding therapeutic-agents worst enemy.
7

Figure 1 Two different assays for measuring ADAs in plasma samples. To the left, a direct binding assay where the protein-based drug is immobilized on the surface. The direct binding assay requires a unique regeneration solution for each drug. To the right, a capture assay with anti-biotin immobilized to the surface and a biotinylated drug subsequently bound to it. The capture assay only requires a single regeneration solution, to break the interaction of anti-biotin and biotin, despite drug.
2. Background
2.1 Immunologic response to therapeutic agents Commonly speaking, an allergic reaction is a type of hypersensitivity within the immune system. Normally harmless substances could cause the reaction; in that case the substance is called “allergen”. An allergic reaction escalates with a sensitization phase, where an IgE (Immunoglobulin E) binds to an allergen [2]. However, immunogenicity in terms of IgE is not very common when it comes to therapeutic agents. The induction of IgG, the most abundant antibody isotype in human sera, is more frequent.
IgE and IgG are controlled and synthesized by B cell-, white blood cells known as lymphocytes. Unlike IgE, whereas the levels could drastically increase due to exposure of antigen, the IgG level is constantly withheld at approximately 75% (of all Igs) [3]. IgG is the most versatile immunoglobulin of them all – able to carry out all Ig-functions. Some of the IgG subclasses bind to cells like macrophages, monocytes, polymorphonuclear leukocytes and lymphocytes through their receptors. By doing so, the cells are able to internalize an antigen better [4]. IgG is therefore an opsonin, able to enhance phagocytosis among many other functions.
If a subject utilizes a non-biologic drug, such as penicillin, the drug itself is not immunogenic, but could still become immunogenic by coupling with a carrier protein. Concerning biological agents, IgE mediated immune response is not that common. In this case, an adverse immune response is rather caused by neutralizing antibodies, preventing the agent from performing its intended function [1]. Apart from neutralizing the agent, a greater set-back is a further neutralization of endogenously produced analogues with, again, fatal outcome. Irrespective of an anti-drug antibody is neutralizing or not, it could also change the pharmacokinetics and effectiveness of the drug.
There are several ways for a biological agent to inflict immunogenicity; route of delivery, degree of exposure, simultaneous use of other immunosuppressive drugs and perhaps the greatest cause – the molecule itself. In theory, the perfect recombinant protein would be a direct replicate of its human image. Emergence of further developed technology, regarding artificially produced proteins, has sufficiently decreased the immunogenicity of drugs. Compared to earlier, bacterial derived
8

recombinant proteins – it has been showed that adverse effects occur less frequently and require longer periods of exposure [1]. In fact, mechanisms underlying an immune response appear to be a loss of immunogenic tolerance, rather than a direct response to a foreign protein [5].
2.2 The Antibody
Antibodies, or immunoglobulin (Ig), are Y-shaped proteins produced by B-cells, secreted by plasma cells and mainly used by the immune system for identification and neutralization of foreign substances. There are five different isotypes of Igs in humans; IgA, IgD, IgE, IgG and IgM. They differ in functional locations, biological properties and in what type of antigen they bind to. IgD, IgE and IgG are all monomers and quite similar in their construction, illustrated in figure 2. The monomer partly consists of a constant region, the Fc (fragment, crystallizable) region, composed of two heavy chains and two parts of the light chain. The Fc region modulates cell activity, triggering potent effector mechanisms for pathogen elimination, by binding to a specific cell receptor or complement proteins [6]. There are two Fab (fragment antigen binding) regions on an Ig-monomer. Each Fab region consists of a two constant- and variable domains from each heavy and light chain of the antibody. The variable region is also recognized as the FV region, and the outmost important antigen-binding part. The area on the antigen, to which the variable region binds, is called an epitope. It is possible to create a fusion protein of both variable regions, by connecting them with a short linker peptide [8]. The fusion will create a minimum functional unit, a single-chain antibody fragment – abbreviated scFV
[8]. The entire antibody is kept together by non-covalent and covalent forces, the latter consisting of disulfide bridges.
Figure 2 An Ig-monomer, consisting of two heavy chains in blue and two light chains in red. The constant region is shaped-filled in blue and the variable region in purple. They yellow connections between light- and heavy chains are disulfide bridges.
2.3 Non-specific binding Human antibodies reactive to animal proteins are often an unsuspected and unrecognized cause to interference in immunological assays. Like the anti-biotin, a major part of mammalian-derived antibodies comes from mice. Diagnostic and pharmaceutical assays frequently encounter interference especially caused by human anti-mouse antibodies (HAMA), but also due to rheumatoid factors (RF), elevated levels of bilirubin, triglycerides and others [7]. Lower affinity antibodies induced by external antigens go under the abbreviation HA (heterophilic antibody). RFs, polyspecific autoantibodies, are an example of HAs and directed against the Fc portion of IgG-molecules, e.g.
9

anti-biotin [8]. A general term including all mammalian derived antibodies is HAAA (human anti-animal antibodies).
Despite type of antibody, i.e. HAMA, HA or all HAAAs, they are usually produced as a result of treatment or exposure to animal immunoglobulin. Blood transfusion, vaccination, maternal transfer and animals as pets are all routes to immunization with animal protein [9].
2.4 Immunoassays, immunogenicity and Biacore Immunoassays are used to detect specific molecules called analytes. The technique relies on the ability of antibodies to bind to epitopes on a target molecule. The molecule of determination is often found in a complex mixture of other macromolecules, requiring a specific recognition of the immunoassay. A variety of assays mean that the analyte does not necessarily need to be an antigen, but rather the opposite – an antibody.
Despite the antibody-antigen interaction, a key assay-feature is the actual detection. The most common way to get a measurable response is to link either of the two interactants with a detectable label, e.g. radioactive isotopes, chemiluminescent tags or enzymes. The latter is perhaps the most popular way of labeling in immunoassays. ELISA, enzyme-linked immunosorbent assays, utilize enzyme labeling, hence the name, and is a widespread format of immunoassays.
Immunogenicity assays do not necessarily mean antibody-antibody interaction, but any protein-ADA interaction. There are several platforms available for ADA detection, including enzyme-linked immunosorbent assays, radioimmunoprecipitation assays, electrochemiluminescence assays and label free techniques such as surface plasmon resonance. It is essential to adopt an appropriate strategy while assessing immunogenicity. There are different assays depending on the objective, for instance; screening assays, analytical immunochemical procedures, specificity and functional bioassays [10]. Screening assay is the type of strategy used in this study.
• Screening assays – used for detecting antibodies induced against a biological agent in a large number of samples/patients. False positives may occur with this type of assay, which is desired to be characterized as sensitive, specific, reproducible and robust [10].
• Assays conforming antibody presence and correspondent specificity – eliminates false positive samples/patients. These assays pinpoint a necessity in limitation and characterization which could somehow differ depending on approach. Overall, while using this assay one provides information about antibody specificity, which contributes to confirmation of immune response specificity [10].
• Neutralization assays – considers the antibodies neutralization capacities, where the neutralization assay is often cell-based. The assay must be especially developed to respond well with the concerning biological agent [10].
2.4.1 Biacore While ELISA directly falls into the description of an immunoassay, a Biacore could be used as the former but is overall considered a biosensor. A biosensor is composed of two elements; a biological recognition unit and a transducer able to convert a change in property into a recordable signal [11]. In contrast to ELISA, Biacore measures an interaction in real-time, meaning a monitoring of each binding step until end-point level. Real-time measurements enables the detection of low affinity- fast dissociating molecules, whereas the results of an ELISA is only seen after the final step and
10

additionally only suitable for slow dissociating molecules, since fast dissociating antibodies may be lost during washing steps. A biosensor, i.e. a Biacore, also provides a label-free detection [12].
Biacore exploits the physical phenomenon that is surface plasmon resonance (SPR). The phenomenon occurs at an interface between media of different refractive index; the sample solution and two thin layers of glass and gold on a sensor chip surface [13]. An incidence of light, at certain energy (wavelength), excites plasmons (electron charge density waves) in the gold film, resulting in an electric field intensity known as evanescent wave field. The wave field penetrates the solution on the sensor chip, whereas the amplitude decreases exponentially with distance from the surface. The solute concentration, and thereby the thickness of solute on the surface, determines the refractive index. A change in reflected light consequently translates into a change in SPR signal [13]. By subsequently comparing signals one could determine any change of mass on the surface, hence any occurring interactions (figure 3).
Figure 3 The SPR principle: an incident of energy (light) excites plasmons in the gold layer. Subsequently, evanescent wave fields penetrate any solute on the surface, dropping in energy depending on the solute concentration. By the energy adsorption, SPR can be seen as a drop in intensity of reflected light and thereby translated to amount of solute on the surface.
The sensor surface provides physical conditions necessary to generate an SPR-signal. By coating the gold layer one provides means necessary for attaching a ligand, which in turn will bind an analyte for measurement. Mainly, it is possible to attach biomolecules in three different approaches; covalent immobilization, high affininty capture or through hydrophobic adsorption. By exploiting common functional groups on the ligand such as amino-, thiol- or aldehydes one could easily attach the ligand to a carboxymethylated dextran-matrix on the surface [13].
11
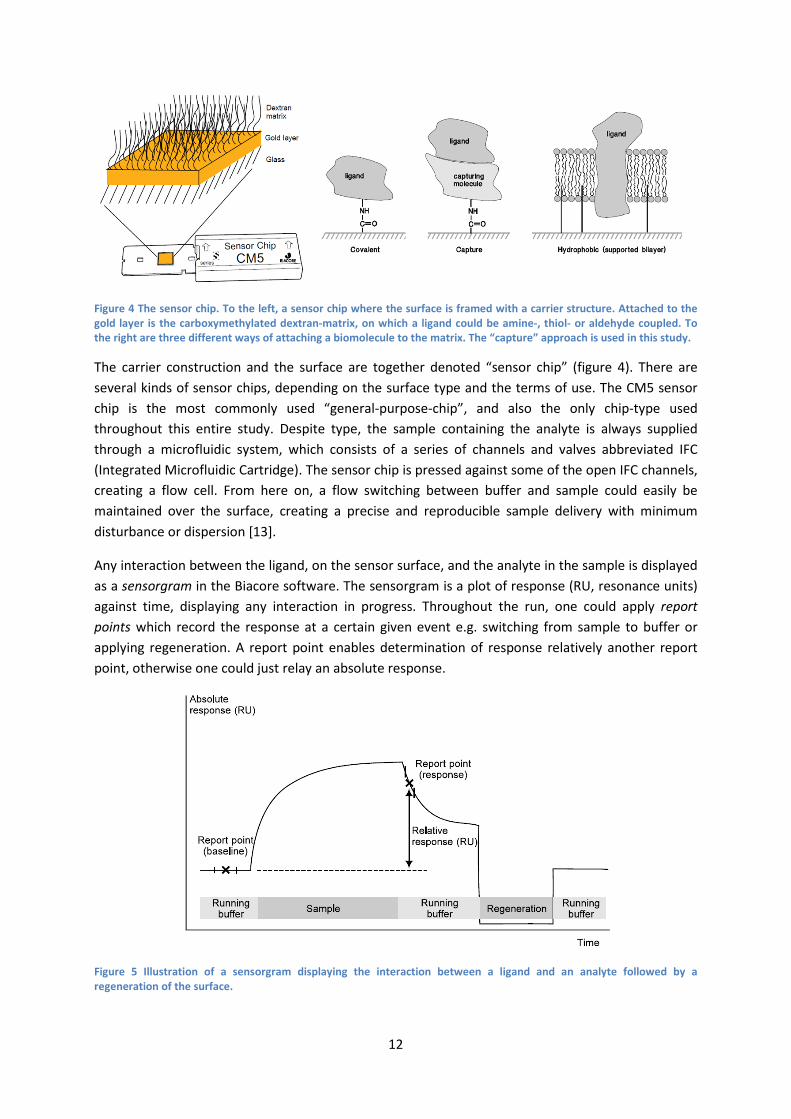
Figure 4 The sensor chip. To the left, a sensor chip where the surface is framed with a carrier structure. Attached to the gold layer is the carboxymethylated dextran-matrix, on which a ligand could be amine-, thiol- or aldehyde coupled. To the right are three different ways of attaching a biomolecule to the matrix. The “capture” approach is used in this study.
The carrier construction and the surface are together denoted “sensor chip” (figure 4). There are several kinds of sensor chips, depending on the surface type and the terms of use. The CM5 sensor chip is the most commonly used “general-purpose-chip”, and also the only chip-type used throughout this entire study. Despite type, the sample containing the analyte is always supplied through a microfluidic system, which consists of a series of channels and valves abbreviated IFC (Integrated Microfluidic Cartridge). The sensor chip is pressed against some of the open IFC channels, creating a flow cell. From here on, a flow switching between buffer and sample could easily be maintained over the surface, creating a precise and reproducible sample delivery with minimum disturbance or dispersion [13].
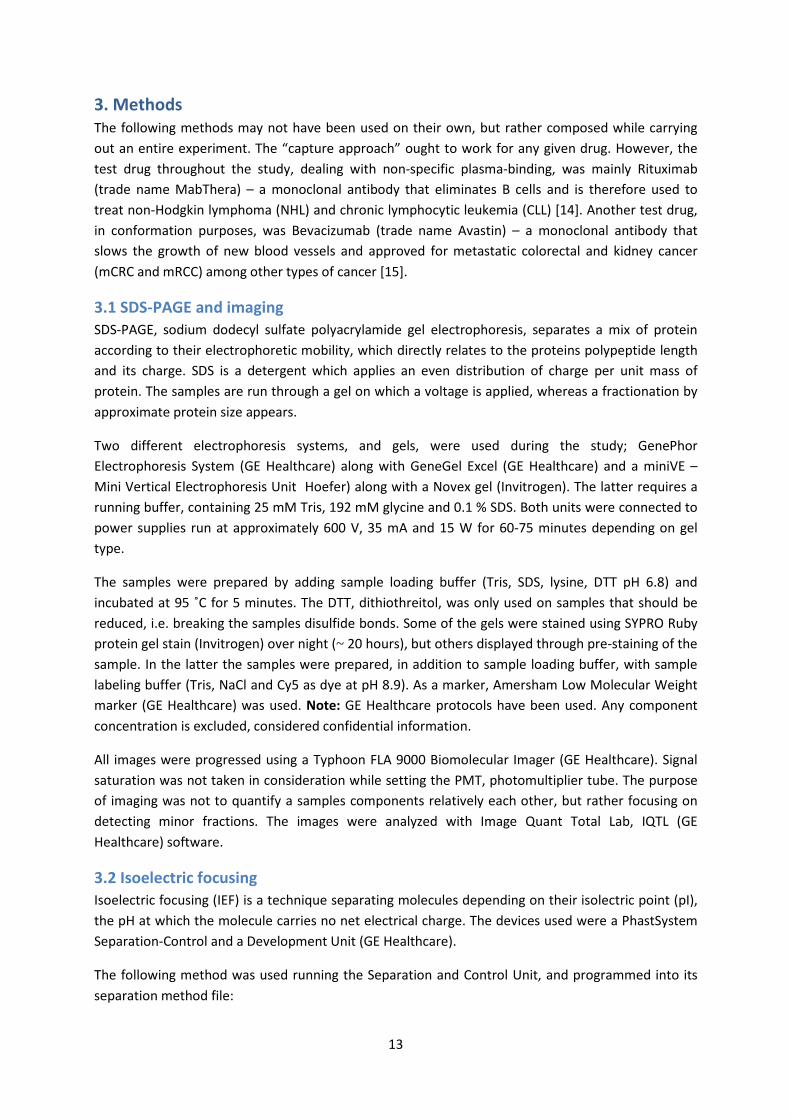
Any interaction between the ligand, on the sensor surface, and the analyte in the sample is displayed as a sensorgram in the Biacore software. The sensorgram is a plot of response (RU, resonance units) against time, displaying any interaction in progress. Throughout the run, one could apply report points which record the response at a certain given event e.g. switching from sample to buffer or applying regeneration. A report point enables determination of response relatively another report point, otherwise one could just relay an absolute response.
Figure 5 Illustration of a sensorgram displaying the interaction between a ligand and an analyte followed by a regeneration of the surface.
12
3. Methods The following methods may not have been used on their own, but rather composed while carrying out an entire experiment. The “capture approach” ought to work for any given drug. However, the test drug throughout the study, dealing with non-specific plasma-binding, was mainly Rituximab (trade name MabThera) – a monoclonal antibody that eliminates B cells and is therefore used to treat non-Hodgkin lymphoma (NHL) and chronic lymphocytic leukemia (CLL) [14]. Another test drug, in conformation purposes, was Bevacizumab (trade name Avastin) – a monoclonal antibody that slows the growth of new blood vessels and approved for metastatic colorectal and kidney cancer (mCRC and mRCC) among other types of cancer [15].
3.1 SDS-PAGE and imaging SDS-PAGE, sodium dodecyl sulfate polyacrylamide gel electrophoresis, separates a mix of protein according to their electrophoretic mobility, which directly relates to the proteins polypeptide length and its charge. SDS is a detergent which applies an even distribution of charge per unit mass of protein. The samples are run through a gel on which a voltage is applied, whereas a fractionation by approximate protein size appears.
Two different electrophoresis systems, and gels, were used during the study; GenePhor Electrophoresis System (GE Healthcare) along with GeneGel Excel (GE Healthcare) and a miniVE – Mini Vertical Electrophoresis Unit Hoefer) along with a Novex gel (Invitrogen). The latter requires a running buffer, containing 25 mM Tris, 192 mM glycine and 0.1 % SDS. Both units were connected to power supplies run at approximately 600 V, 35 mA and 15 W for 60-75 minutes depending on gel type.
The samples were prepared by adding sample loading buffer (Tris, SDS, lysine, DTT pH 6.8) and incubated at 95 ˚C for 5 minutes. The DTT, dithiothreitol, was only used on samples that should be reduced, i.e. breaking the samples disulfide bonds. Some of the gels were stained using SYPRO Ruby protein gel stain (Invitrogen) over night (~ 20 hours), but others displayed through pre-staining of the sample. In the latter the samples were prepared, in addition to sample loading buffer, with sample labeling buffer (Tris, NaCl and Cy5 as dye at pH 8.9). As a marker, Amersham Low Molecular Weight marker (GE Healthcare) was used. Note: GE Healthcare protocols have been used. Any component concentration is excluded, considered confidential information.
All images were progressed using a Typhoon FLA 9000 Biomolecular Imager (GE Healthcare). Signal saturation was not taken in consideration while setting the PMT, photomultiplier tube. The purpose of imaging was not to quantify a samples components relatively each other, but rather focusing on detecting minor fractions. The images were analyzed with Image Quant Total Lab, IQTL (GE Healthcare) software.
3.2 Isoelectric focusing Isoelectric focusing (IEF) is a technique separating molecules depending on their isolectric point (pI), the pH at which the molecule carries no net electrical charge. The devices used were a PhastSystem Separation-Control and a Development Unit (GE Healthcare).
The following method was used running the Separation and Control Unit, and programmed into its separation method file:
13

SAMPLE APPL. DOWN AT 1.2 0 Vh SAMPLE APPL. UP AT 1.3 0 Vh EXTRA ALARM TO SOUND AT 1.1 73 Vh SEP 1.1 2000 V 2.5 mA 3.5 W 15 ˚C 75 Vh SEP 1.2 200 V 2.5 mA 3.5 W 15 ˚C 15 Vh SEP 1.3 2000 V 2.5 mA 3.5 W 15 ˚C 410 Vh
The gel used was a PhastGel IEF 3-9 (GE Healthcare), Coomassie-stained with PhastGel Blue R (GE Healthcare) in 30% methanol and 10% acetic acid in distilled water. The following method was used running the Development Unit, and programed into its development method file:
Step number Solution IN-port OUT-port Time Temperature
1 Fix 1 1 5 min 20 ˚C 2 Wash/Destain 2 0 2 min 20 ˚C 3 Stain 3 0 10 min 50 ˚C 4 Wash/Destain 2 0 10 min 50 ˚C
Gel imaging was performed using an ImageScanner III and corresponding LabScan 6.0 software (both GE Healthcare).
3.3 Biotinylation of drug The biotinylation was an essential step in constructing the capture assay. Biotin, a B-vitamin, is attached to a target molecule through amine-coupling. The ligand, i.e. the drug, was prepared in 0.1 M sodium-borate buffer, whereas boric acid (Fluka) was dissolved in deionized water and pH adjusted to pH 8.5 by adding 1 M NaOH (GE Healthcare). EZ-LinkTM Sulfo-NHS-LC-Biotin (Pierce) was dissolved in deionized water and added to the ligand solution. To determine what volume of biotin solution was supposed to be added to the ligand solution, in terms of molar ratio, the following equation was used:
V𝑤 = 𝑋×𝑀𝑙𝑖𝑔
𝑀𝑤×𝐶1×15 corresponds to a biotin ratio of 1.5 mole/ ligand.
X = amount of NHS-biotin reagent (mg)
Mlig = molecular weight of ligand (Da)
MW = molecular weight of NHS-biotin (Da)
C1 = concentration of ligand in the biotinylation volume (mg/ml)
Different molar excess of biotin were examined during the study. The mixture of biotin and ligand was incubated for 1h at 25°C (room temperature). Protein desalting NAPTM 10 (GE Healthcare) and Zeba Spin Desalting (Thermo Scientific) columns were equilibrated with HBS-EP+ running buffer (GE Healthcare) and used to remove any unbound biotin from the mixture. The removal procedure was repeated 2-3 times depending on the molar excess of biotin; 2 times for a molar excess up to 3 moles biotin/ligand, 3 times subsequently up to 5 moles biotin/ligand.
14
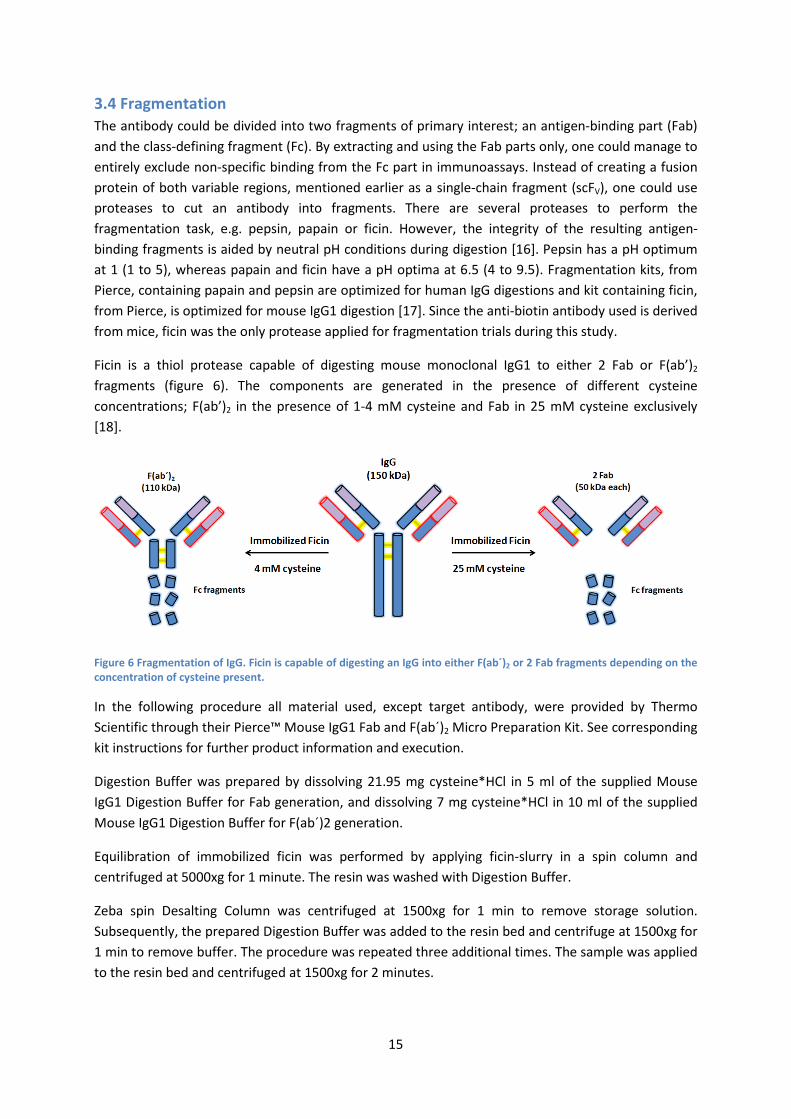
3.4 Fragmentation The antibody could be divided into two fragments of primary interest; an antigen-binding part (Fab) and the class-defining fragment (Fc). By extracting and using the Fab parts only, one could manage to entirely exclude non-specific binding from the Fc part in immunoassays. Instead of creating a fusion protein of both variable regions, mentioned earlier as a single-chain fragment (scFV), one could use proteases to cut an antibody into fragments. There are several proteases to perform the fragmentation task, e.g. pepsin, papain or ficin. However, the integrity of the resulting antigen-binding fragments is aided by neutral pH conditions during digestion [16]. Pepsin has a pH optimum at 1 (1 to 5), whereas papain and ficin have a pH optima at 6.5 (4 to 9.5). Fragmentation kits, from Pierce, containing papain and pepsin are optimized for human IgG digestions and kit containing ficin, from Pierce, is optimized for mouse IgG1 digestion [17]. Since the anti-biotin antibody used is derived from mice, ficin was the only protease applied for fragmentation trials during this study.
Ficin is a thiol protease capable of digesting mouse monoclonal IgG1 to either 2 Fab or F(ab’)2 fragments (figure 6). The components are generated in the presence of different cysteine concentrations; F(ab’)2 in the presence of 1-4 mM cysteine and Fab in 25 mM cysteine exclusively [18].
Figure 6 Fragmentation of IgG. Ficin is capable of digesting an IgG into either F(ab´)2 or 2 Fab fragments depending on the concentration of cysteine present.
In the following procedure all material used, except target antibody, were provided by Thermo Scientific through their Pierce™ Mouse IgG1 Fab and F(ab´)2 Micro Preparation Kit. See corresponding kit instructions for further product information and execution.
Digestion Buffer was prepared by dissolving 21.95 mg cysteine*HCl in 5 ml of the supplied Mouse IgG1 Digestion Buffer for Fab generation, and dissolving 7 mg cysteine*HCl in 10 ml of the supplied Mouse IgG1 Digestion Buffer for F(ab´)2 generation.
Equilibration of immobilized ficin was performed by applying ficin-slurry in a spin column and centrifuged at 5000xg for 1 minute. The resin was washed with Digestion Buffer.
Zeba spin Desalting Column was centrifuged at 1500xg for 1 min to remove storage solution. Subsequently, the prepared Digestion Buffer was added to the resin bed and centrifuge at 1500xg for 1 min to remove buffer. The procedure was repeated three additional times. The sample was applied to the resin bed and centrifuged at 1500xg for 2 minutes.
15

The desalted IgG sample was added to the spin column with immobilized ficin. The column was capped and placed on a tabletop rocker in a 37°C air-oven. Incubation of digestion during 3.5 hours for generation of Fab fragments and 26.5 hours for F(ab´)2.
After incubation, the columns were centrifuged at 5000xg for 1 minute to separate digest from immobilized Ficin. The resin was further washed with Protein A Binding Buffer and centrifuged. The procedure was repeated two additional times and pooled with the first digest elute.
Fab and F(ab´)2 purification; the Protein A Column was centrifuged at 1000xg for 1 minute. The column was equilibrated with Protein A Binding Buffer and centrifuged for 1 minute. The procedure was repeated once. Pooled sample was applied to the column and incubated for 10 minutes while mixing. The column was centrifuged for 1 minute at 1000xg to get hold of the Fab and F(ab´)2 fragments. IgG Elution Buffer was added to the protein A column and centrifuged for 1 minute. The procedure was repeated and both flow-throughs were pooled along with neutralization buffer (the latter elute contained undigested IgG and/or Fc fragments).
3.5 Deglycosylation Carbohydrates in the form of asparagine-linked (N-linked) and serine/threonine-linked (O-linked) oligosaccharides are necessary for some proteins to carry out their biological functions such as immune recognition, receptor binding, pathogenicity and inflammation among others [19]. However, these unique structures also carry the potential of being immunogenic, hence adding to the non-specific plasma binding.
While comparing the two types of carbohydrates, N-linked oligosaccharides are slightly easier to remove using the enzyme N-glycanase (PNGase F). To remove O-linked sugars, one must first remove monosaccharaides by a series of exoglucosidases until only a core of serine and threonine attached oligosaccharides remains. The latter could then be removed by O-glycanase (endo-alfa-N-acetylgalactosaminidase). Any modification, i.e. mono-, di- or tri-sylation, of the core structure will block the action of O-glycanase. The trisialyl structure could efficiently be removed by the enzyme sialidase A.[19] To perform a deglycosylation in this study, only the following enzymes have been acquired: O-glycanase, gialidase A and N-glycanase.
In the following procedure all material used, except target antibody, were provided by ProZyme through their Enzymatic Deglycosylation Kit. See corresponding kit instructions for further product information and execution.
Glycoprotein of choice was dissolved in deionized water to a specific concentration. Incubation buffer, O-glycanase, sialidase A and N-glycanase were all added to the protein sample. The mixture was incubated for 4 days at 37°C on a tabletop rocker in an air-oven.
3.6 Additon of polyclonal IgG NSB reducer (Non-specific binding reducer) is a product frequently used, along with Biacore, for complex samples like plasma, plasma or cell extracts. It contains a carboxymethyl dextran that has a similar structure to the dextran on the sensor surface, and thereby blocks any non-specific binding to the previous.
16

However, another great cause of false-positives, due to non-specific binding, is thought to be non-analyte antibody-binding substances of plasma samples. These substances tend to bind to antibodies at any other site than the antigen-binding site, and accounted for any species-derived antibody [20]. The study has therefore partly focused on a strategy where adding an excess of non-specific IgGs, from appropriate species, to the plasma sample could eliminate or at least suppress the interference. The addressed strategy might, however, not be enough to block the same amount of interference for every sample.
Polyclonal immunoglobulins from three different species – sheep, rat, and goat have been added to several plasma samples (approximately 20 different plasmas). The addition has been of concentrations as high as 400 µg/ml. NSB-reducer has been added to all plasma samples, including those with addition of polyclonal IgG.
3.7 Biacore run settings The following settings have been used if nothing else is stated under “Results”.
The experiments have been executed using a Biacore T100 (ID 12-060) and evaluated using Biacore T100 software (version 2.0.3) and Microsoft Excel 2010. A sensor chip of type CM5 along with HBS-EP+ running buffer (0.01 M Hepes, 0.15 M NaCl, 3 mM EDTA, 0.05 % v/v surfactant P20, pH 7.4, GE Healthcare) have been used. “Biotinylated drug” and “ADA” refers to biotinylated rituximab and its correspondent anti-rituximab if nothing else is stated.
Pure ADA samples were diluted in HBS-EP+ running buffer. Plasma samples were prepared before taken in use: centrifuged at 10000 rpm, 10 °C, during 10 minutes and filtered using a syringe-driven 0.45 µm filter unit (Millex). Before applied to Biacore, plasma samples were diluted in HBS-EP+ running buffer and NSB-reducer to a ratio of 5:4:1 in consecutive order. All plasma samples have been stored in a freezer before taken in use (centrifuged and filtered) and thereafter stored in a freezer up to a week before discarded. Experiments have been executed with 10-20 different plasma samples.
Immobilization of anti-biotin (US Biological) on the surface has been carried out through amine-coupling at 25 °C. The surface was activated by a mixture of EDC/NHS (GE Healthcare). The Anti-biotin was diluted in sodium acetate pH 5.0 (GE Healthcare) to a concentration of 10-12 µg/ml (corresponds to 12 – 18 000 RU) and injected during 10 min at a flow rate of 5 µl/min. Removal of loosely associated molecules, and deactivation of reactive groups, was done by injecting ethanolamine (GE Healthcare).
Methods created in the Biacore software contained at least 5 startup cycles, followed by the actual run incorporated with control cycles at the start, every 10th cycle and at the end. Each cycle consisted of three steps: capture, sample and regeneration in consecutive order. The capture solution contained 5 µg/ml biotinylated drug (Rituximab) run with a contact time of 4 min at a flow rate of 5µl/min. The sample was set on “low sample consumption” and run with a contact time of 10 min, dissociation time of 15 sec and at a flow rate of 5 µl/min. The samples were run in randomized order. The regeneration was performed using a 15 mM NaOH solution with a contact time of 1 min and at a flow rate of 20 µl/min. Biotinylated drug and regeneration solutions were run with predip. Sample compartment temperature was set to 10 °C and analysis temperature to 25 °C. Results were
17

evaluated by taking the response at the report point “stability early” 7 sec after the end of the sample injection.
3.8 Merged injections Even though ADAs might exist in a plasma sample, while run in a Biacore assay a sample would appear negative if there is drug still present in the sample. In this case, all antibodies are already associated with the drug and could not give rise to a response on the sensor surface. To address the problem, sample acidification followed by a merged injection of sample and neutralization solution, immediately before the sample is analyzed is a possible approach. The acidification breaks any association between ADAs and drug in the sample, enabling a possibility for the drug on the sensor surface to bind some of the ADAs once the sample is neutralized.
The method could appear most necessary in any kind of immunoassay, at least while considering measurements of small amounts of ADAs in the presence of drug. However, one might predict the capture itself being a problem with this approach. The acidified sample or the high ionic strength and high pH of the neutralization solution may cause some of the biotinylated drug to dissociate from the anti-biotin on the surface, even though it is just a brief moment in time when the acidification solution is merged together with the neutralization solution over the sensor surface.
While carrying out the method, several plasma samples are tested with and without addition of ADA and with and without addition of drug. The acidification solution used consists of 120 mM HCl (Merck) and 0.1 % P20 (GE Healthcare). The neutralization solution consists of 1.3 M Tris (Merck) and 0.05 % P20 (GE Healthcare) at pH 8.5.
3.9 Calculations for evaluation The overall performance of an assay is determined by multiple parameters like stability, sensitivity, reproducibility, robustness etc. Some of these parameters could be narrowed down to a single value called the Z-value. The Z-value could then be used to asses assay performance, and thereby making it possible to compare assays. A higher Z-value means a better assay. The value is calculated from the standard deviation (SD) and average (Avg) of positive and negative samples:
𝑍. 𝑣𝑎𝑙𝑢𝑒 = 1 −𝑆𝐷(𝑝𝑜𝑠) + 𝑆𝐷(𝑛𝑒𝑔)𝐴𝑣𝑔(𝑝𝑜𝑠) − 𝐴𝑣𝑔(𝑛𝑒𝑔)
Instead of evaluating the assay, one could determine whether a sample is positive, for the presence of ADAs, by calculating the assays cut point. All samples above the calculated cut point could be considered as positives and below as negatives. The cut point of an assay is statically determined by evaluating its negative control samples. The calculation executed to determine cut points through this study follows:
𝐶𝑢𝑡 𝑝𝑜𝑖𝑛𝑡 = 𝐴𝑣𝑔(𝑛𝑒𝑔) + 1,73 × 𝑆𝐷(𝑛𝑒𝑔)
Where 1.73 is obtained through a statistical table (values of tα) [21], corresponding to 5 % of non-specificbinders counted as true positives, in a pool of 20 negative samples. Statistical outliers were removed before calculation of the cut point.
18

4. Results and discussion
4.1 Assay optimization The following optimizations are quite rough. Extensive scouting could be considered necessary, but not performed during this study due to lack of time. It is desirable to lower the non-specific binding, to such a degree, that 0.5 µg/ml ADA could be detected above the cut point.
4.1.1 Scouting of immobilization level of capture reagent and degree of biotinylation of ligand While creating the capture assay, one should consider a balance between amount of anti-biotin immobilized, amount of biotinylated drug and the number of biotin residues attached to the drug. For instance, a larger amount of mole biotin/mol drug might inhibit the binding of ADAs (blocking the binding site) or imply difficulties in regeneration. The aim of this experiment was to search for the capture level giving highest ADA response possible.
To begin with, the level of captured biotinylated rituximab was investigated. Four different molar excesses of biotin/drug (rituximab) were established. Each molar excess of biotin/drug were tested at four different concentrations. In addition, each combination was run on three surfaces differing in amount of immobilized anti-biotin (5600, 11400 and 17500 RU) (figure 7). The contact time of capture solution was set to 4 minutes at a low rate of 5 µl/min.
Figure 7 The response of biotinylated drug. The aim was to search for the capture level giving highest ADA response possible. The figure shows the response generated by biotinylated drug at different molar excesses of biotin, and at different concentrations of biotinylated drug, tested on surfaces differing in amount of immobilized anti-biotin.
While considering the biotinylation, 8 µg/ml of 3 mole excess (on 11400 RU anti-biotin surface), 6 µg/ml of 5 mole excess and 8 µg/ml of 5 mole excess of biotin/drug (on 17500 RU anti-biotin surface) are the top three in terms of giving the highest biotinylated drug responses.
To continue with the previous experiment (figure 7) each combination, on every surface, were tested with two different samples: one sample containing plasma added with 0.5 µg/ml ADA and another sample containing only plasma. By calculating the difference in response of the two, one could
0200400600800
10001200140016001800
Rel.
resp
onse
(RU
)
Biotinylated drug 5600 RU 11400 RU 17500 RU
19
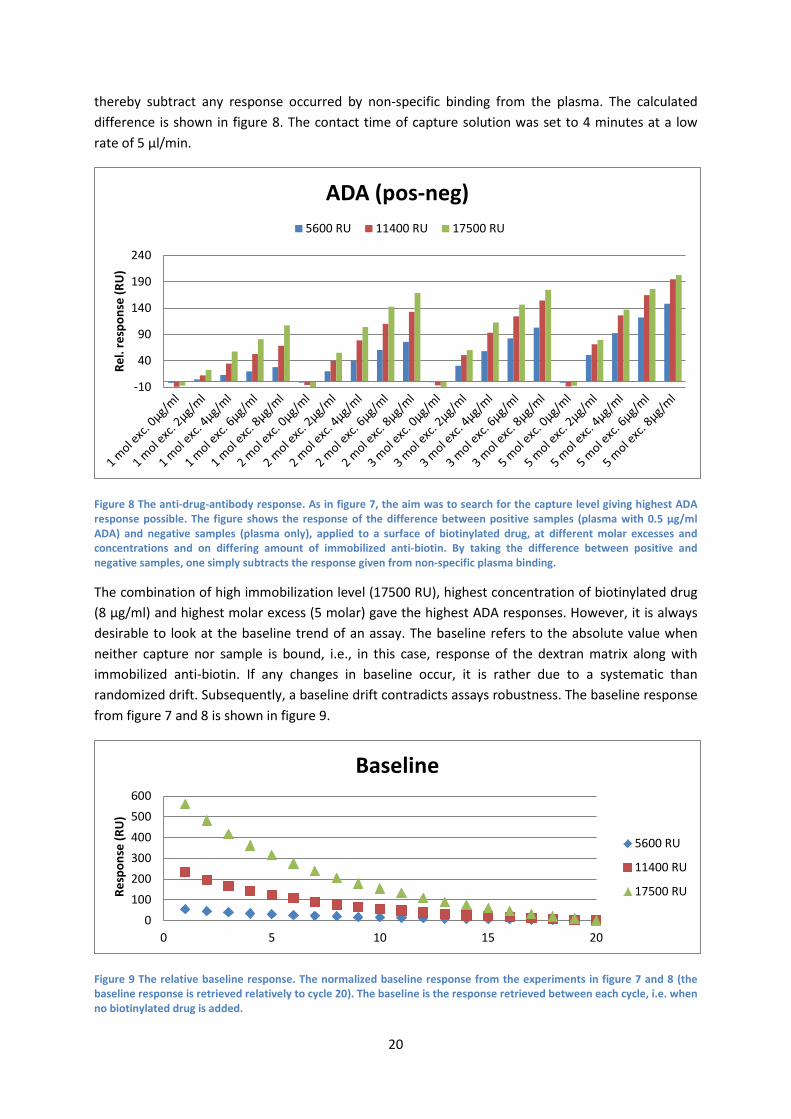
thereby subtract any response occurred by non-specific binding from the plasma. The calculated difference is shown in figure 8. The contact time of capture solution was set to 4 minutes at a low rate of 5 µl/min.
Figure 8 The anti-drug-antibody response. As in figure 7, the aim was to search for the capture level giving highest ADA response possible. The figure shows the response of the difference between positive samples (plasma with 0.5 µg/ml ADA) and negative samples (plasma only), applied to a surface of biotinylated drug, at different molar excesses and concentrations and on differing amount of immobilized anti-biotin. By taking the difference between positive and negative samples, one simply subtracts the response given from non-specific plasma binding.
The combination of high immobilization level (17500 RU), highest concentration of biotinylated drug (8 µg/ml) and highest molar excess (5 molar) gave the highest ADA responses. However, it is always desirable to look at the baseline trend of an assay. The baseline refers to the absolute value when neither capture nor sample is bound, i.e., in this case, response of the dextran matrix along with immobilized anti-biotin. If any changes in baseline occur, it is rather due to a systematic than randomized drift. Subsequently, a baseline drift contradicts assays robustness. The baseline response from figure 7 and 8 is shown in figure 9.
Figure 9 The relative baseline response. The normalized baseline response from the experiments in figure 7 and 8 (the baseline response is retrieved relatively to cycle 20). The baseline is the response retrieved between each cycle, i.e. when no biotinylated drug is added.
-10
40
90
140
190
240
Rel.
resp
onse
(RU
)
ADA (pos-neg) 5600 RU 11400 RU 17500 RU
0100200300400500600
0 5 10 15 20
Res
pons
e (R
U)
Baseline
5600 RU
11400 RU
17500 RU
20
Though, a greater amount of anti-biotin immobilized on the surface corresponds to a greater baseline drift (see figure 9). A slight decrease in baseline is typically seen in a Biacore assay. However, a drop of approximately 550 RU over a total amount of 17500 RU is not considered an issue. The most important parameter is that the response from ADA:s is stable throughout the assay (stability confirmed but not shown in this report).
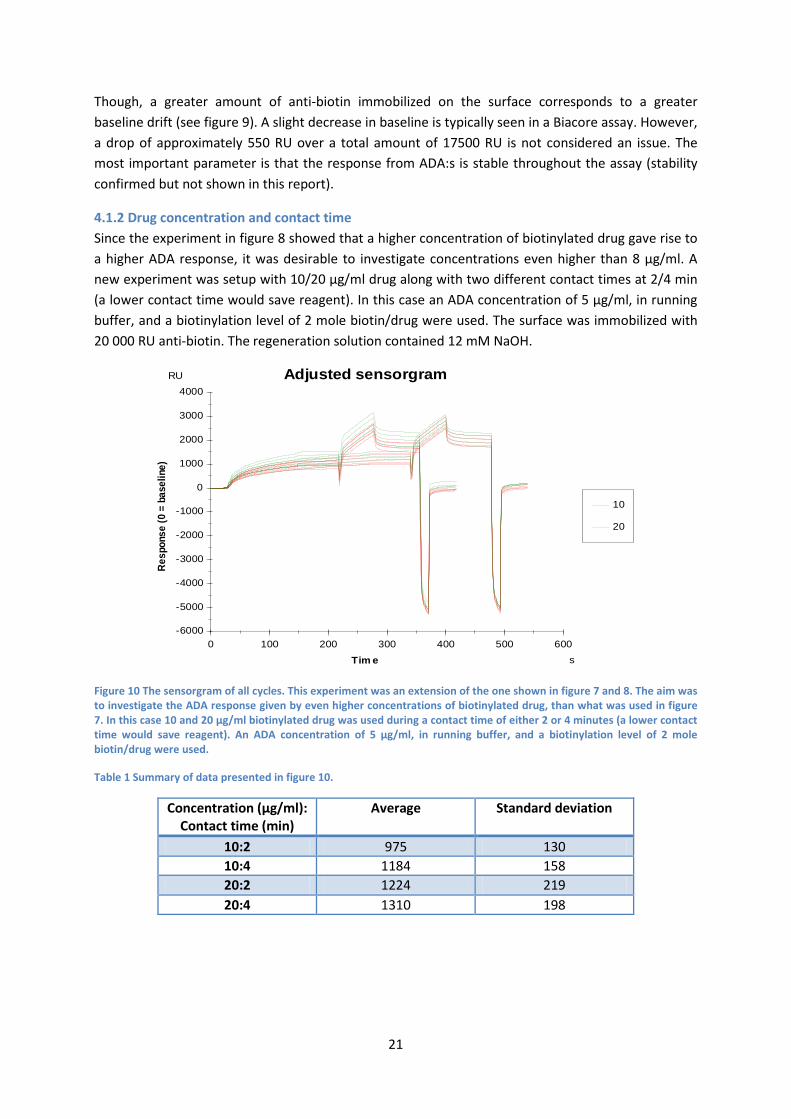
4.1.2 Drug concentration and contact time Since the experiment in figure 8 showed that a higher concentration of biotinylated drug gave rise to a higher ADA response, it was desirable to investigate concentrations even higher than 8 µg/ml. A new experiment was setup with 10/20 µg/ml drug along with two different contact times at 2/4 min (a lower contact time would save reagent). In this case an ADA concentration of 5 µg/ml, in running buffer, and a biotinylation level of 2 mole biotin/drug were used. The surface was immobilized with 20 000 RU anti-biotin. The regeneration solution contained 12 mM NaOH.
Figure 10 The sensorgram of all cycles. This experiment was an extension of the one shown in figure 7 and 8. The aim was to investigate the ADA response given by even higher concentrations of biotinylated drug, than what was used in figure 7. In this case 10 and 20 µg/ml biotinylated drug was used during a contact time of either 2 or 4 minutes (a lower contact time would save reagent). An ADA concentration of 5 µg/ml, in running buffer, and a biotinylation level of 2 mole biotin/drug were used.
Table 1 Summary of data presented in figure 10.
Concentration (µg/ml): Contact time (min)
Average Standard deviation
10:2 975 130 10:4 1184 158 20:2 1224 219 20:4 1310 198
-6000
-5000
-4000
-3000
-2000
-1000
0
1000
2000
3000
4000
0 100 200 300 400 500 600
Adjusted sensorgramRU
Resp
onse
(0 =
bas
elin
e)
sTim e
10
20
21

Figure 11 The absolute baseline response. The baseline of the biotinylated drug from the experiment shown in figure 10. In this case, 12 mM NaOH was used as a regeneration solution.
Judging by table 1, a higher concentration of biotinylated drug corresponds to a slightly higher response of ADA. Yet, there is always a correlation between what amount of ADA a certain amount of biotinylated drug can bind. In theory, that maximum amount would be 1:2 drug:ADA. Presumably, lowering the concentration of ADA one would achieve an equivalent response between the two drug concentrations. Shown in table 1, by retaining concentration and increasing contact time one would get a higher response (for both concentrations observed). Hence, a greater contact time would be to prefer. An increase in baseline response, shown in figure 11, indicates a non-satisfactory regeneration. Some biotinylated drug is still attached to the surface after the regeneration of each cycle. To solve the problem one could lower the molar ratio of biotin/rituximab (easier to detach the biotinylated drug with only one biotin/drug than several biotin/drug, from the anti-biotin). A regeneration scouting, increasing concentration NaOH and/or contact time, could also be taken in consideration.
4.1.3 Regeneration scouting A good regeneration is most important in order to get a reliable, repeatable and robust assay. Again, the most suitable regeneration procedure for each system is unique and requires a tedious optimization for every drug. By using the capture assay the very same regeneration, once established, could in principle be used for any given drug. Since the baseline (figure 11) from the experiment in figure 10 showed a non-satisfactory regeneration, a regeneration scouting was necessary. Regeneration scouting was therefore performed using 15/30/60 seconds of contact time and the concentrations 12/15/20 mM of NaOH. Each combination was repeated five times, i.e. five cycles. The result is shown in figure 12.
5940059600598006000060200604006060060800610006120061400
0 5 10 15 20 25
Baseline: Sample
Abs
olut
e re
spon
se -
base
line
RU
Cycle num ber
22

Figure 12 Adjusted sensorgrams regeneration solutions. The aim of the experiment was to scout for a suitable regeneration. A combination of 15/30/60 seconds of contact time and a concentration of 12/15/20 mM NaOH were tried as regeneration solutions. Each combination was tried during five cycles. The sensorgrams of 20 mM NaOH differ slightly since the ADA was accidently diluted in a buffer with higher [NaCl] than the running buffer, hence the difference in refractive index. The error does not affect the result.
Figure 13 Summarized data from all the sensorgrams from the regenerations scouting shown in figure 12. A combination of 15/30/60 seconds of contact time and a concentration of 12/15/20 mM NaOH were tried as regeneration solutions. Each combination was tried during five cycles. To the left, illustration of the baseline response for each combination of concentration and contact time. To the right, the subsequent response of biotinylated drug bound to the anti-biotin.
52000
53000
54000
55000
56000
57000
58000
59000
1 3 5 7 9 11 13 15
Abso
lute
resp
onse
(RU
)
15 30s 60s
Abs. baseline response
12 mM
15 mM
20 mM
1000120014001600180020002200240026002800
1 3 5 7 9 11 13 15
Rela
tive
resp
onse
(RU
)
15 30 60s
Rel. biotinylated drug response
12 mM
15 mM
20 mM
23
A proper regeneration could be determined by studying the baseline in figure 13, and the response from biotinylated drug. Any combination of contact time and concentration, that gives rise to a linear and horizontal baseline plot over 5 cycles could be considered a good candidate. The most important parameter is that the response from biotinylated drug (right part of figure 13) is high and that repeated injections give similar responses. Fulfilling the latter, 12/15 mM NaOH during 30/60 seconds of contact time are suitable regeneration candidates. 15 mM NaOH during 60 seconds gives the highest biotinylated drug response (figure 13, right part), and also considered giving consistent results, and is thereby chosen to act as regeneration solution during the study.
4.2 Varying salt concentration In all the previous runs, HBS-EP+ containing 0.15 M NaCl has been used as running buffer. Some non-specific binding from plasma is thought to occur as a result of ionic interactions, which could be reduced by increasing salt (NaCl) concentration either in running buffer, plasma samples or both. The running buffer, HBS-EP+, normally contains 0.15 M NaCl but was increased to 0.5 M NaCl during experiment 4.2.1. Plasma samples are partly diluted in running buffer containing 0.15 M NaCl, according to chapter “3.7 Biacore run settings”, but in experiment 4.2.2, the samples were instead diluted in running buffer containing 0.5 M NaCl. A surface with 16 500 RU immobilized anti-biotin was used in both experiments.
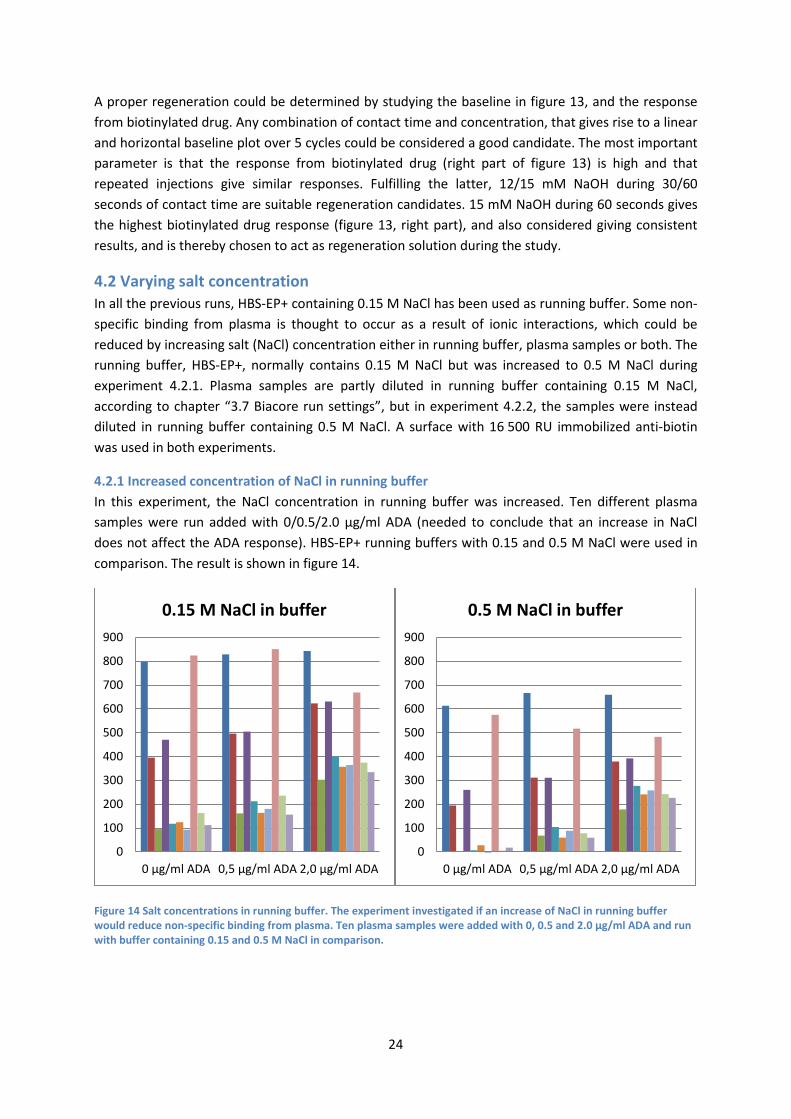
4.2.1 Increased concentration of NaCl in running buffer In this experiment, the NaCl concentration in running buffer was increased. Ten different plasma samples were run added with 0/0.5/2.0 µg/ml ADA (needed to conclude that an increase in NaCl does not affect the ADA response). HBS-EP+ running buffers with 0.15 and 0.5 M NaCl were used in comparison. The result is shown in figure 14.
Figure 14 Salt concentrations in running buffer. The experiment investigated if an increase of NaCl in running buffer would reduce non-specific binding from plasma. Ten plasma samples were added with 0, 0.5 and 2.0 µg/ml ADA and run with buffer containing 0.15 and 0.5 M NaCl in comparison.
0
100
200
300
400
500
600
700
800
900
0 µg/ml ADA 0,5 µg/ml ADA 2,0 µg/ml ADA
0.15 M NaCl in buffer
0
100
200
300
400
500
600
700
800
900
0 µg/ml ADA 0,5 µg/ml ADA 2,0 µg/ml ADA
0.5 M NaCl in buffer
24
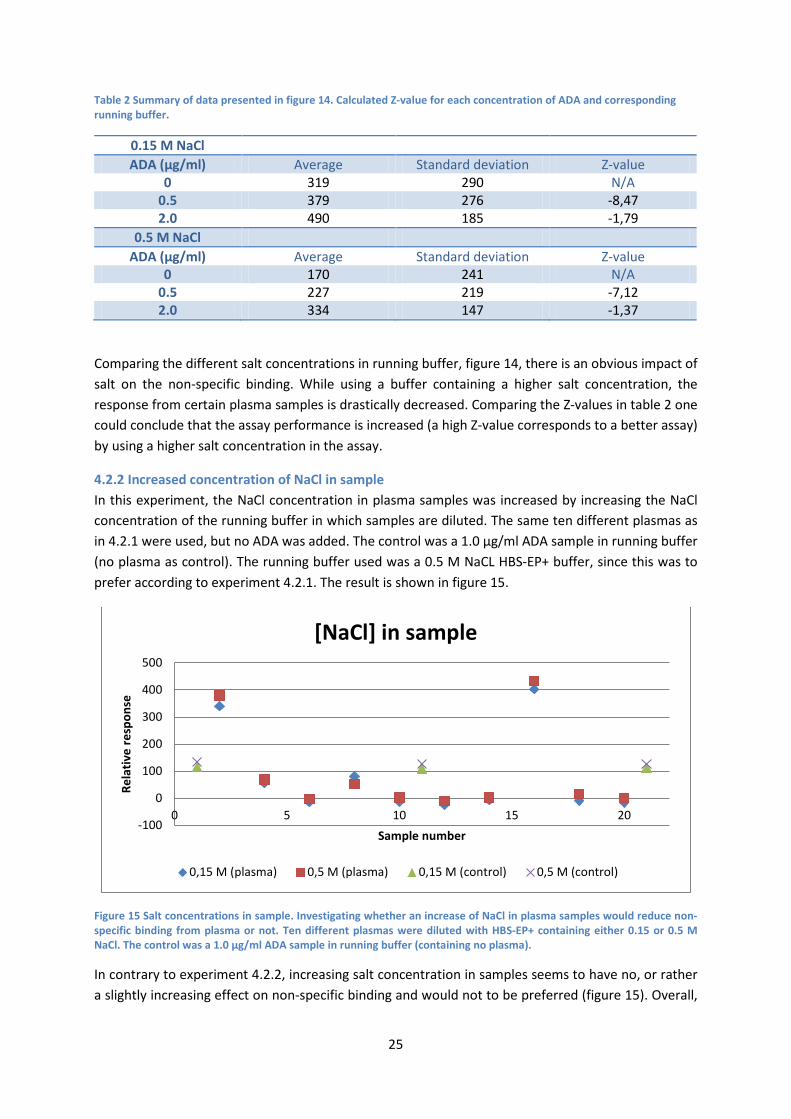
Table 2 Summary of data presented in figure 14. Calculated Z-value for each concentration of ADA and corresponding running buffer.
0.15 M NaCl ADA (µg/ml) Average Standard deviation Z-value
0 319 290 N/A 0.5 379 276 -8,47 2.0 490 185 -1,79
0.5 M NaCl ADA (µg/ml) Average Standard deviation Z-value
0 170 241 N/A 0.5 227 219 -7,12 2.0 334 147 -1,37
Comparing the different salt concentrations in running buffer, figure 14, there is an obvious impact of salt on the non-specific binding. While using a buffer containing a higher salt concentration, the response from certain plasma samples is drastically decreased. Comparing the Z-values in table 2 one could conclude that the assay performance is increased (a high Z-value corresponds to a better assay) by using a higher salt concentration in the assay.
4.2.2 Increased concentration of NaCl in sample In this experiment, the NaCl concentration in plasma samples was increased by increasing the NaCl concentration of the running buffer in which samples are diluted. The same ten different plasmas as in 4.2.1 were used, but no ADA was added. The control was a 1.0 µg/ml ADA sample in running buffer (no plasma as control). The running buffer used was a 0.5 M NaCL HBS-EP+ buffer, since this was to prefer according to experiment 4.2.1. The result is shown in figure 15.
Figure 15 Salt concentrations in sample. Investigating whether an increase of NaCl in plasma samples would reduce non-specific binding from plasma or not. Ten different plasmas were diluted with HBS-EP+ containing either 0.15 or 0.5 M NaCl. The control was a 1.0 µg/ml ADA sample in running buffer (containing no plasma).
In contrary to experiment 4.2.2, increasing salt concentration in samples seems to have no, or rather a slightly increasing effect on non-specific binding and would not to be preferred (figure 15). Overall,
-100
0
100
200
300
400
500
0 5 10 15 20
Rela
tive
resp
onse
Sample number
[NaCl] in sample
0,15 M (plasma) 0,5 M (plasma) 0,15 M (control) 0,5 M (control)
25

the increase in ionic strength could also potentially disrupt low-affinity specific binding and should therefore be used judiciously.
4.3 Fragmentation of test-antibody By extracting, i.e. fragmentizing, and using only the Fab parts of the anti-biotin, one could manage to entirely exclude non-specific binding from the Fc part in the capture assay. The fragmentation was performed on a test-antibody, namely mouse anti-myoglobin (2F9.1). Due to cost and in-house stock limitations, the anti-biotin antibody was spared during this experiment. The fragmentation procedure requires a tedious scouting, especially concerning cysteine concentration (see chapter “3.4 Fragmentation”). Through the fragmentation protocol, one could elute and obtain different components of the antibody at different stages. Samples were collected from each stage, with additional reduction of Fab and F(ab’)2 (see figure 16 for each sample collected), and analyzed on a gel for verification of fragmentation.
Figure 16 Fragmentation schedule. By fragmenting the anti-biotin antibody and using only the Fab parts, one could exclude non-specific binding from the Fc part in the capture assay. While using the fragmentation protocol (see “chapter 3.4 Fragmentation”) samples are collected at different stages of the fragmentation, all to be verified through SDS-PAGE. The abbreviations “Und.” and “Red.” simply refers to Undigested and Reduced.
Ab (2F9.1)
Gel F(ab')2 + FC
Ficin
Gel F(ab')2 Protein A
Gel Red. F(ab')2 DTT + boil
Gel
Und. IgG+FC
Protein A + Elution
Gel
Fab + FC Ficin + cysteine
Fab Protein A
Red. Fab
DTT + boil
Gel
Gel
Und. IgG+FC
Gel
Gel Proten A + Elution
26
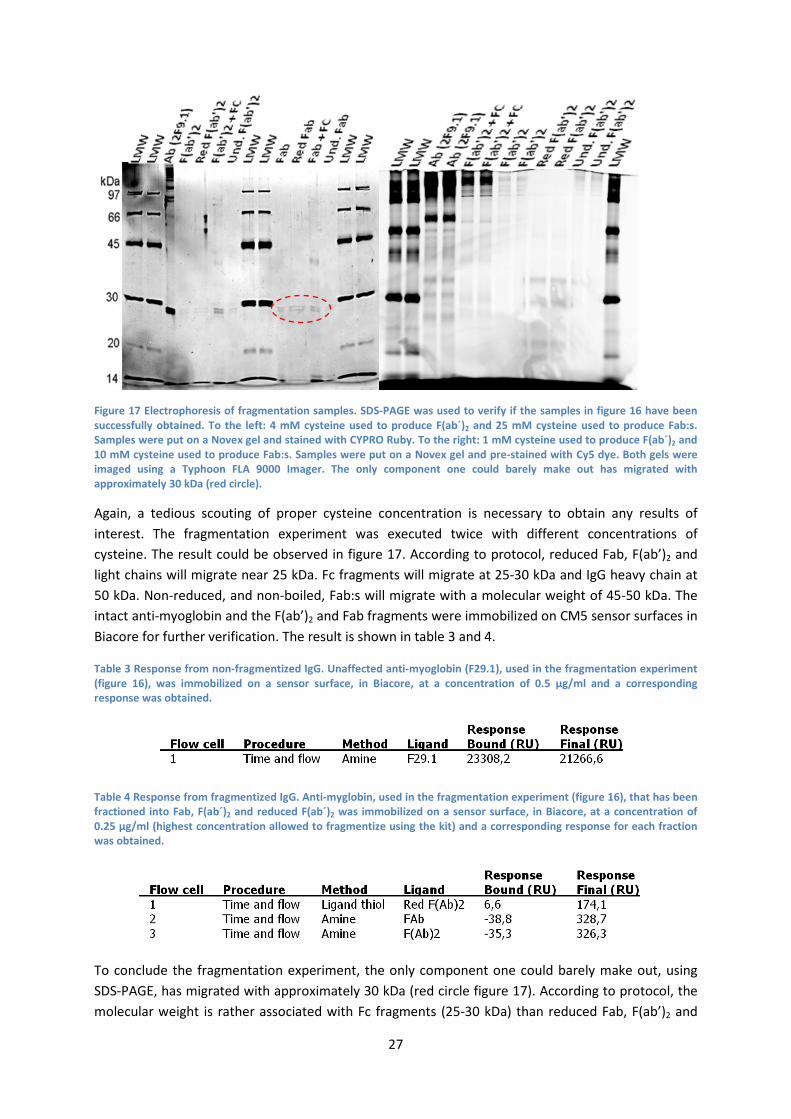
Figure 17 Electrophoresis of fragmentation samples. SDS-PAGE was used to verify if the samples in figure 16 have been successfully obtained. To the left: 4 mM cysteine used to produce F(ab´)2 and 25 mM cysteine used to produce Fab:s. Samples were put on a Novex gel and stained with CYPRO Ruby. To the right: 1 mM cysteine used to produce F(ab´)2 and 10 mM cysteine used to produce Fab:s. Samples were put on a Novex gel and pre-stained with Cy5 dye. Both gels were imaged using a Typhoon FLA 9000 Imager. The only component one could barely make out has migrated with approximately 30 kDa (red circle).
Again, a tedious scouting of proper cysteine concentration is necessary to obtain any results of interest. The fragmentation experiment was executed twice with different concentrations of cysteine. The result could be observed in figure 17. According to protocol, reduced Fab, F(ab’)2 and light chains will migrate near 25 kDa. Fc fragments will migrate at 25-30 kDa and IgG heavy chain at 50 kDa. Non-reduced, and non-boiled, Fab:s will migrate with a molecular weight of 45-50 kDa. The intact anti-myoglobin and the F(ab’)2 and Fab fragments were immobilized on CM5 sensor surfaces in Biacore for further verification. The result is shown in table 3 and 4.
Table 3 Response from non-fragmentized IgG. Unaffected anti-myoglobin (F29.1), used in the fragmentation experiment (figure 16), was immobilized on a sensor surface, in Biacore, at a concentration of 0.5 µg/ml and a corresponding response was obtained.
Table 4 Response from fragmentized IgG. Anti-myglobin, used in the fragmentation experiment (figure 16), that has been fractioned into Fab, F(ab´)2 and reduced F(ab´)2 was immobilized on a sensor surface, in Biacore, at a concentration of 0.25 µg/ml (highest concentration allowed to fragmentize using the kit) and a corresponding response for each fraction was obtained.
To conclude the fragmentation experiment, the only component one could barely make out, using SDS-PAGE, has migrated with approximately 30 kDa (red circle figure 17). According to protocol, the molecular weight is rather associated with Fc fragments (25-30 kDa) than reduced Fab, F(ab’)2 and
27

light chains (near 25 kDa). Since non-reduced and non-boiled Fab:s would migrate with 45-50 kDa, and no such band seems to exist, one could assume that the only fragment present consists of Fc parts. The protease, ficin, digests the monoclonal IgG at a different rate depending on present concentration of cysteine. Despite protocol-instructions, it could be necessary to scout a suitable concentration of cysteine, presumably unique for different antibodies. However, the latter is not only time consuming but also material consuming. During the experiments, the antibody has seemingly been completely digested (no fragments except Fc:s could be shown using SDS-PAGE in figure 17). In addition of wrong cysteine concentration, a probable cause of complete digestion could be a failure in removing all ficin. To completely determine that the fragmentation had failed, Fab, F(ab’)2 and reduced F(ab’)2 were immobilized on the sensor surface (table 4) and compared with an immobilization of the intact antibody (table 3). No fragments of interest seemed to exist or at least the yield was very low while comparing table 3 and 4.
4.4 Deglycosylation of anti-biotin Carbohydrates on the antibody carry the potential of being immunogenic, hence adding to the non-specific plasma binding. By deglycosylating the antibody one could remove the carbohydrates. The deglycosylation was performed twice, removing only N-linked carbohydrates on anti-myoglobin and removing both N- and O-linked carbohydrates on anti-biotin. The former was carried out in a Biacore and on the lab bench, whereas the latter was simply carried out on the lab bench.
4.4.1 Removal of N-linked carbohydrates Regarding removal of N-linked carbohydrates in a Biacore run: anti-myoglobin was first immobilized to approximatley 14 000 RU in flow cell 1 (FC1). A mixture of incubation buffer and N-Glycanase was set to flow over the immobilized anti-biotin at a rate of 2 µl/min, 37°C for 1 hour. A reference flow cell (FC2) was then immobilized with a corresponding amount (13 600 RU) of non-deglycosylated anti-myoglobin. Flow cell 3 was immobilized with anti-myoglobin, deglycosylated outside Biacore (see “3.5 Deglycosylation”), aiming for an equivalent amount to FC1 and FC2 (ended up on 14 500 RU). The last flow cell, FC4, was used as a reference cell to FC3, though with an amount of 12 300 RU non-deglycosylated anti-myoglobin, not perfectly matching the amount in FC3. Every flow cell was then run with the very same 10 plasma samples in duplicate (Note: the “capture-approach” was not used and no ADA was added). The result is presented in figure 18.
28

FC1 FC2 FC3 FC4 Anti-biotin
Immobilized (RU) 13963,4 RU 13583,6 RU 14489,2 RU 12303,0 RU
Figure 18 Response from deglycosylated IgG. Deglycosylation was performed to remove carbohydrates, from the antibody, which may otherwise contribute to the non-specific plasma binding. Deglycosylation of N-linked carbohydrates on anti-myoglobin was preformed out (FC3)-and inside (FC1) the Biacore, with corresponding reference cells. Ten different plasmas were run, in duplicate, in each flow cell. The response retrieved is only due to non-specific plasma binding.
The very same sample as in FC3 (figure 18), i.e. deglycosylation performed on the lab bench, was also verified through SDS-PAGE, on a GeneGel and sample pre-labeled with Cy5 dye. The result is shown in figure 19.
Figure 19 Electrophoresis of deglycosylated IgG (N-linked carbohydrates). Deglycosylation was performed to remove carbohydrates, from the antibody, which may otherwise contribute to the non-specific plasma binding. Any success in the deglycosylation of anti-myoglobin antibody, from FC3 in figure 18, was verified using SDS-PAGE. The sample was run on a GeneGel and pre-labeled with Cy5 dye. The gel was imaged using a Typhoon FLA 9000 Imager. A difference in molecular weight (red circle) was seen between the non-deglycosylated anti-myoglobin (lane 2) and the deglycosylated anti-myoglobin (lane 4).
0
100
200
300
400
0 10 20 30 40 50 60 70 80 90 100
Rel.
resp
.
Cycle number
Enzymatic deglycosylation of N-linked carbohydrates on anti-myoglobin
FC1: Deg.1h in Bia FC2 - reference to FC1 FC3: Deg. 3 days out. Bia FC4 - reference to FC3
29
A successful deglycosylation was somehow verified through SDS-PAGE shown in figure 19. The deglycosylated (and reduced) antibody had migrated slightly longer (lane 4, figure 19), hence less molecular weight, than its non-deglycosylated correspondent (lane 2, figure 19) suggesting that some carbohydrates might have been removed. However, the effect of the deglycosylation, in terms of reducing the non-specific binding from plasma, seemed rather small (Biacore results in figure 18).
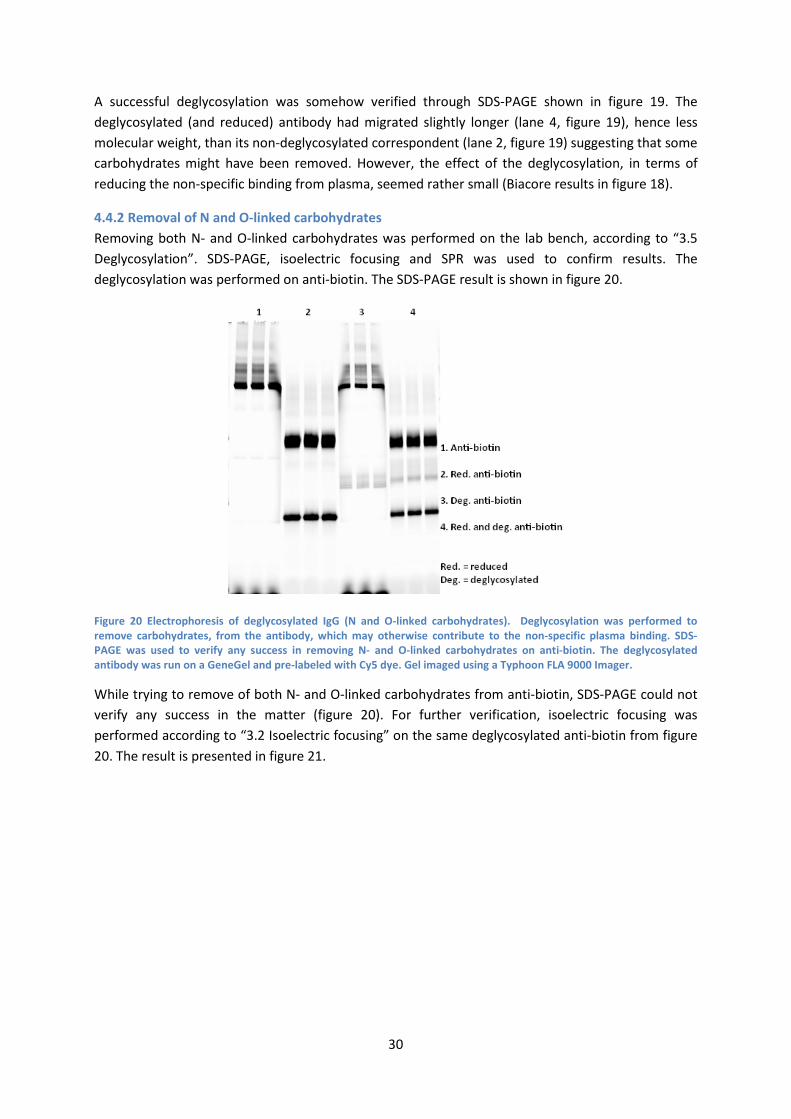
4.4.2 Removal of N and O-linked carbohydrates Removing both N- and O-linked carbohydrates was performed on the lab bench, according to “3.5 Deglycosylation”. SDS-PAGE, isoelectric focusing and SPR was used to confirm results. The deglycosylation was performed on anti-biotin. The SDS-PAGE result is shown in figure 20.
Figure 20 Electrophoresis of deglycosylated IgG (N and O-linked carbohydrates). Deglycosylation was performed to remove carbohydrates, from the antibody, which may otherwise contribute to the non-specific plasma binding. SDS-PAGE was used to verify any success in removing N- and O-linked carbohydrates on anti-biotin. The deglycosylated antibody was run on a GeneGel and pre-labeled with Cy5 dye. Gel imaged using a Typhoon FLA 9000 Imager.
While trying to remove of both N- and O-linked carbohydrates from anti-biotin, SDS-PAGE could not verify any success in the matter (figure 20). For further verification, isoelectric focusing was performed according to “3.2 Isoelectric focusing” on the same deglycosylated anti-biotin from figure 20. The result is presented in figure 21.
30

Figure 21 Isoelectric focusing of deglycosylated IgG (N-linked carbohydrates). Deglycosylation was performed to remove carbohydrates, from the antibody, which may otherwise contribute to the non-specific plasma binding. Isoelectric focusing was used to verify any success in removing N- and O-linked carbohydrates on anti-biotin. The deglycosylated antibody was run on a PhastGel stained with coomassie Blue R. The image to the right is a copy of the image to the left. Two lanes contained deglycosylated anti-biotin (red circle, left image) and two lanes contained non-deglycosylated anti-biotin (blue circle, left image), as shown in the figure. The red arrow (right image) is pointing at a couple of bands on the native antibody, seemingly absent on the deglycosylated antibody. Gel imaged using an ImageScanner III.
By using isoelectric focusing to verify a success in the deglycosylation of anti-biotin, one could distinguish some bands (red arrow, right image, figure 21) on the native antibody which seems to be absent on the deglycosylated sample. These bands are likely to consist of antibodies with carbohydrates, suggesting that the removal of both N- and O-linked carbohydrates has worked at some point.
To investigate the effect of removing carbohydrates, the deglycosylated anti-biotin (used in figure 20 and 21) was immobilized in one flow cell to 13 700 RU and unmodified anti-biotin was immobilized in another flow cell to 13 200 RU (in Biacore). Injection of analyte was the same for both flow cells; same concentration of biotinylated drug and with the very same 20 plasma samples (no ADA was added). HBS-EP+ with 0.5 M NaCl was used as running buffer. The result is presented in figure 22.
31

Figure 22 Response from deglycosylated and non-deglycosylated IgG. Deglycosylation was performed to remove carbohydrates, from the antibody, which may otherwise contribute to the non-specific plasma binding. N- and O-linked carbohydrates were removed from the anti-biotin. The deglycosylated antibody was immobilized on a sensor surface in Biacore and compared against non-deglycosylated antibody. The response in non-specific plasma binding was very similar between the two samples.
Biacore was used to monitor any effect of the deglycosylation (figure 22) but with negative results. Assuming that the deglycosylation has in fact been successful, its effect on reducing non-specific binding from plasma seems rather non-existent.
4.5 Addition of polyclonal IgG To address the issue of non-specific binding, a strategy to add an excess of IgGs from foreign species, to the plasma sample, before being applied to the Biacore was investigated. Polyclonal immunoglobulins from three different species – sheep, rat, and goat were added to 20 different plasma samples (mouse was also tested but due to failure in some of the sample preparations, and the remaining samples exhibiting low affect, results were omitted) 400 µg/ml of polyclonal IgG was added to the plasma samples (no ADA used in this assay). 12 900 RU of anti-biotin was immobilized. HBS-EP+ with 0.5 M NaCl was used as running buffer. The result is shown in figure 23.
-200
0
200
400
600
800
1000
1200
1 2 3 4 5 6 7 8 9 10 11 12 13 14 15 16 17 18 19 20
Resp
onse
(RU
)
Plasma #
Non-specific binding to deglycosylated anti-biotin
Deglycosylatedanti-biotin
Anti-biotin
32

Figure 23 Response from plasma samples added with sheep, rat and goat IgG. By adding an excess of polyclonal IgG from foreign species, to plasma samples not yet applied to the Biacore, it may be possible to reduce non-specific binding from plasma. Twenty plasma samples were added with three different polyclonal antibodies (sheep, rat and goat) and applied in the same order to the Biacore. As reference, the same twenty plasmas without any foreign IgG added was also run in the Biacore (top left of the figure). The response in each plot is only due to non-specific plasma binding.
Addition of polyclonal IgG has been the most successful approach, in terms of reducing non-specific binding from plasma. Among the three polyclonal IgGs tested, sheep and goat were especially useful (figure 23). Goat was decided to continue with, since a large stock was already available in-house.
While adding polyclonal IgG, one has to consider that no interference with ADA will occur. To investigate the matter, a single plasma sample was used along with several concentrations of ADA (0, 0.25, 0.5, 1, 2, 4 µg/ml). Each sample, with a certain concentration of ADA, was tested with and without addition of 400 µg/ml polyclonal goat IgG. The very same setup of ADA concentrations with and without goat IgG was also carried out in running buffer. HBS-EP+ with 0.5 M NaCl was used as running buffer. The result is presented in figure 24.
1
2 3
4 5 6
7
8
9
10
11
12
13
14
15
16
17
18 19
20 -50
0
50
100
150
200
250Re
spon
se (R
U)
Plasma no.
No addition
1 2
3 4
5 6 7 8
9
10 11
12
13
14
15 16
17
18
19
20 -20
0
20
40
60
80
Resp
onse
(RU
)
Plasma no.
Sheep
1
2
3 4
5
6 7 8
9
10 11
12
13
14 15
16
17
18
19
20 -20
0
20
40
60
80
Resp
onse
(RU
)
Plasma no.
Rat
1 2 3
4 5 6 7
8
9
10
11
12 13
14 15
16 18
19 20
-20
0
20
40
60
80
Resp
onse
(RU
)
Plasma no.
Goat
33
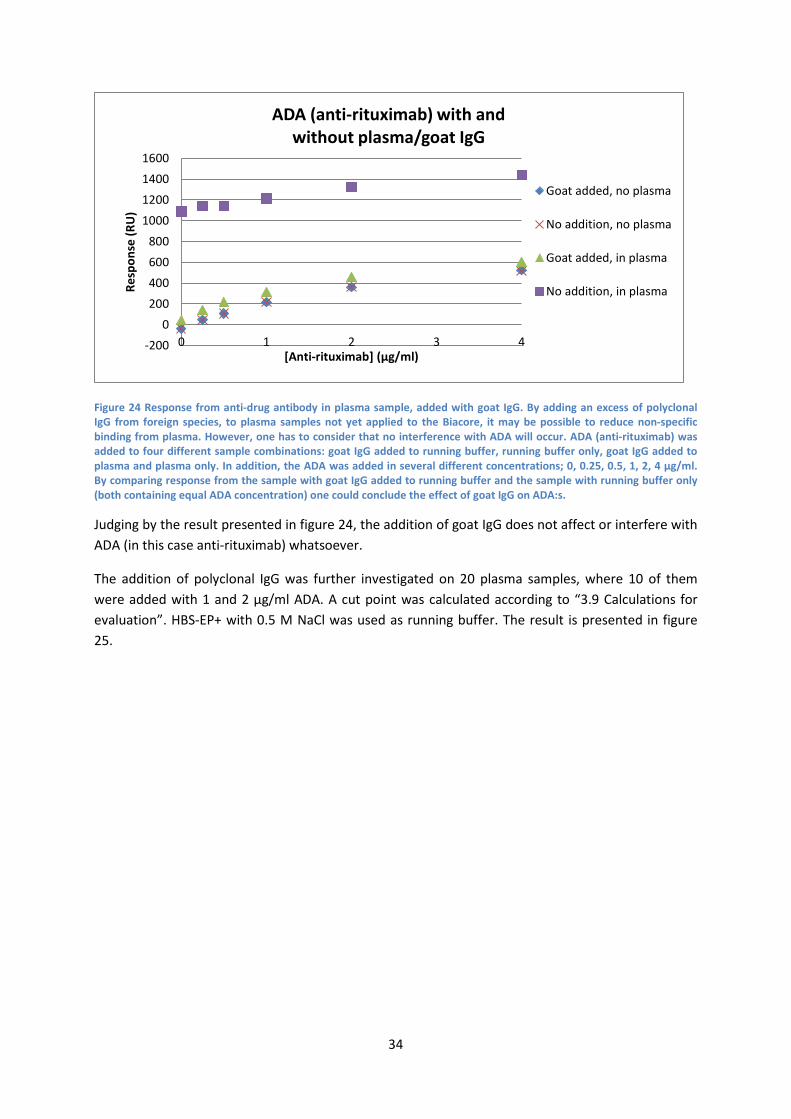
Figure 24 Response from anti-drug antibody in plasma sample, added with goat IgG. By adding an excess of polyclonal IgG from foreign species, to plasma samples not yet applied to the Biacore, it may be possible to reduce non-specific binding from plasma. However, one has to consider that no interference with ADA will occur. ADA (anti-rituximab) was added to four different sample combinations: goat IgG added to running buffer, running buffer only, goat IgG added to plasma and plasma only. In addition, the ADA was added in several different concentrations; 0, 0.25, 0.5, 1, 2, 4 µg/ml. By comparing response from the sample with goat IgG added to running buffer and the sample with running buffer only (both containing equal ADA concentration) one could conclude the effect of goat IgG on ADA:s.
Judging by the result presented in figure 24, the addition of goat IgG does not affect or interfere with ADA (in this case anti-rituximab) whatsoever.
The addition of polyclonal IgG was further investigated on 20 plasma samples, where 10 of them were added with 1 and 2 µg/ml ADA. A cut point was calculated according to “3.9 Calculations for evaluation”. HBS-EP+ with 0.5 M NaCl was used as running buffer. The result is presented in figure 25.
-2000
200400600800
1000120014001600
0 1 2 3 4
Resp
onse
(RU
)
[Anti-rituximab] (µg/ml)
ADA (anti-rituximab) with and without plasma/goat IgG
Goat added, no plasma
No addition, no plasma
Goat added, in plasma
No addition, in plasma
34

Figure 25 Response from plasma samples added with goat IgG (rituximab as biotinylated drug). By adding an excess of polyclonal IgG from foreign species, to plasma samples not yet applied to the Biacore, it may be possible to reduce non-specific binding from plasma. The matter, as in figure 23, was further investigated in this experiment where a cutpoint was calculated according to “3.9 Calculations for evaluation”. Polyclonal goat IgG was added to 20 plasma samples, along with 1 and 2µg/ml ADA (anti-rituximab) in 10 of the plasma samples – lower part of the figure. To compare with, the same 20 plasma samples were applied in the same order, but without any addition of polyclonal goat IgG – upper part of the figure.
While observing twenty random plasma samples (and counting three as outliers), an addition of 400 µg/ml could on average lower up to 90 % of the non-specific binding (figure 25).
To confirm that the capture approach, i.e. biotinylation of drug, is applicable on more drugs than just rituximab, avastin was taken in use along with anti-avastin as ADA. In addition, the new biotinylated drug was run in the very same setup as in figure 25, i.e. with polyclonal goat IgG added. HBS-EP+ with 0.5 M NaCl was used as running buffer. The result is presented in figure 26.
-100
400
900
1400
1 2 3 4 5 6 7 8 9 10 11 12 13 14 15 16 17 18 19 20
Plasma with 0/1/2 µg/ml anti-rituximab
0 µg/ml anti-rituximab1 µg/ml anti-rituximab2 µg/ml anti-rituximab
Cutpoint: 454 RU, 0,82 µg/ml
-100
100
300
500
700
900
1 2 3 4 5 6 7 8 9 10 11 12 13 14 15 16 17 18 19 20
Plasma with 400µg/ml goat IgG and 0/1/2 µg/ml anti-rituximab
0 µg/ml anti-rituximab
1 µg/ml anti-rituximab
2 µg/ml anti-rituximab
Cutpoint: 48 RU, 0,04 µg/ml
35

Figure 26 Response from plasma samples added with goat IgG (Avastin as biotinylated drug). This experiment was carried out in the exact same way as in figure 25, the only difference was the biotinylated drug, in this case avastin. The aim was mainly to confirm that the capture approach is fully functional while biotinylating another drug than rituximab (ought to work for any given drug), and at the same time confirming the effect (in terms of reducing non-specific plasma binding) of adding goat IgG to plasma samples.
The biotinylation of avastin ensures that the capture-approach is reliable for, at least, another drug than rituximab (figure 26). Assuming that the addition of goat IgG does not interfere with this ADA either, one could safely state that the “IgG-addition-approach” in fact does lower the non-specific binding up to ~90 % (figure 26).
4.6 Merged injections For further information about merged injections, see “3.8 Merged injections”. The merged injections were carried out with the capture approach, i.e. biotinylated rituximab and anti-rituximab as ADA. Ten plasma samples were tested, added with the following: 0 µg/ml ADA and 0 µg/ml drug or 2 µg/ml ADA and 0 µg/ml drug or 2 µg/ml ADA and 50 µg/ml drug. The sensor surface was immobilized with 17 300 RU anti-biotin and the amount of biotinylated drug was approximately 2700 RU for each cycle. The binding stability of all plasma samples is presented in figure 27.
-500
0
500
1000
1500
1 2 3 4 5 6 7 8 9 10 11 12 13 14 15 16 17 18 19 20
Plasma with 0/1/2 µg/ml anti-Avastin 0 µg/ml anti-
avastin1 µg/ml anti-avastin2 µg/ml anti-avastin
Cutpoint: 507 RU, 1,27 µg/ml (2/20 outliers)
-300
-100
100
300
500
700
900
1100
1 2 3 4 5 6 7 8 9 10 11 12 13 14 15 16 17 18 19 20
Plasma with 400 µg/ml goat IgG and 0/1/2 µg/ml anti-Avastin
0 µg/ml anti-avastin1 µg/ml anti-avastin2 µg/ml anti-avastin
Cutpoint: 52 RU, 0,20 µg/ml (2/20 outliers)
36
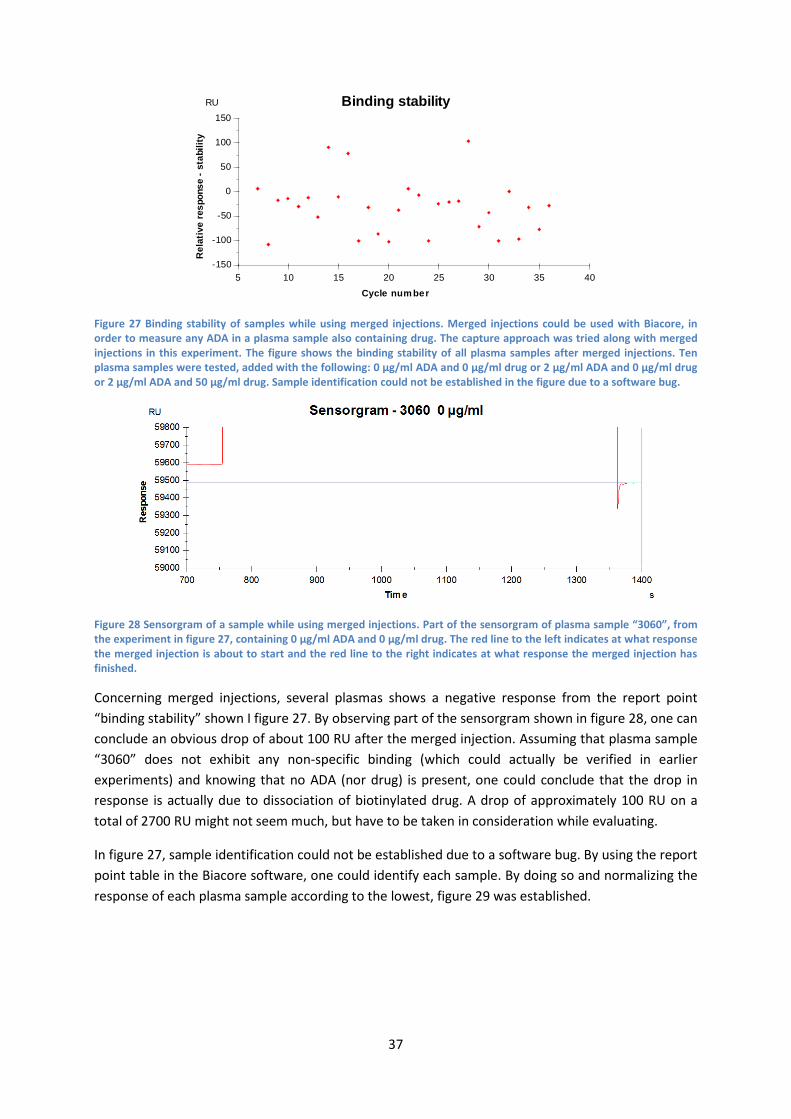
Figure 27 Binding stability of samples while using merged injections. Merged injections could be used with Biacore, in order to measure any ADA in a plasma sample also containing drug. The capture approach was tried along with merged injections in this experiment. The figure shows the binding stability of all plasma samples after merged injections. Ten plasma samples were tested, added with the following: 0 µg/ml ADA and 0 µg/ml drug or 2 µg/ml ADA and 0 µg/ml drug or 2 µg/ml ADA and 50 µg/ml drug. Sample identification could not be established in the figure due to a software bug.
Figure 28 Sensorgram of a sample while using merged injections. Part of the sensorgram of plasma sample “3060”, from the experiment in figure 27, containing 0 µg/ml ADA and 0 µg/ml drug. The red line to the left indicates at what response the merged injection is about to start and the red line to the right indicates at what response the merged injection has finished.
Concerning merged injections, several plasmas shows a negative response from the report point “binding stability” shown I figure 27. By observing part of the sensorgram shown in figure 28, one can conclude an obvious drop of about 100 RU after the merged injection. Assuming that plasma sample “3060” does not exhibit any non-specific binding (which could actually be verified in earlier experiments) and knowing that no ADA (nor drug) is present, one could conclude that the drop in response is actually due to dissociation of biotinylated drug. A drop of approximately 100 RU on a total of 2700 RU might not seem much, but have to be taken in consideration while evaluating.
In figure 27, sample identification could not be established due to a software bug. By using the report point table in the Biacore software, one could identify each sample. By doing so and normalizing the response of each plasma sample according to the lowest, figure 29 was established.
-150
-100
-50
0
50
100
150
5 10 15 20 25 30 35 40
Binding stability
Rel
ativ
e re
spon
se -
stab
ility
RU
Cycle num ber
37

Figure 29 Response from samples while using merged injections. Data summarized from the experiment in figure 27, but in this figure the response has been normalized (lowest sample response set to “0”) and each sample has been identified using the report point table in the Biacore software.
Judging by figure 29 the acidification/neutralization seems to be successful (likewise response despite a presence of drug or not) However, a concentration as high as 2 µg/ml ADA ought to give rise to a much higher response, e.g. comparing with figure 24. A 0.5 µg/ml LOD is presumably not possible through merged injections; hence the “capture-approach” may not be suitable in combination with merged injections. Thus, the capture approach could probably not be used for samples containing ADA in the presence of drug. Further studies are at least required.
5. Conclusions The aim of the study was to create and optimize a capture assay, with the benefits of using the same regeneration solution irrespectively of which drug that is used and having no risk of damaging drug epitopes for each cycle (new biotinylated drug is applied for each cycle). The major issue was to deal with the non-specific plasma binding to the mouse derived anti-biotin, where a limit of ADA detection of at least 0.5 µg/ml had to be reached. Investigating the matter, using a higher salt concentration in running buffer and, particularly, adding polyclonal IgG could drastically lower the non-specific binding for most plasma samples. The two modifications fully satisfy an ADA detection of at least 0.5 µg/ml.
The capture assay is a great approach in order to save time on tedious regeneration scouting. The assay exhibits robustness up to a hundred cycles and probably applicable on most protein based drugs. However, a minor loss of capture during merged injections gave low sensitivity and could be considered an issue for samples with drug present. More studies are needed to investigate if the sensitivity can be increased when the capture approach is used in combination with merged injections. At present, the capture approach is only recommended for samples without any drug present, which are analyzed with ordinary injections.
If the capture approach is to be used the following running settings would be to recommend:
0
50
100
150
200
250
2026 2027 3052 3055 3056 3057 3058 3059 3060 3061Plasma no.
Merged injection
0 µg/ml ADA0 µg/ml Drug2 µg/ml ADA0 µg/ml Drug2 µg/ml ADA50 µg/ml Drug
38

Chip CM5 Anti-biotin immobilized 12-15 000 RU Running buffer HBS-EP+ (0.5 M NaCl) Capture contact time 4 min Capture flow rate 5 µl/min Sample contact time 10 min Sample flow rate 5 µl/min Regeneration 15 mM NaOH Regeneration time 60 sec Regeneration flow rate 20 µl/min Sample compartment temperature 10 °C Analysis temperature 25 °C Biotinylated drug 8-10 µg/ml of 3 mole biotin/drug Plasma: HBS-EP+: NSB-reducer 5:4:1 Non-human polyclonal IgG (in plasma)
~400 µg/ml
6. Acknowledgements First of all, I would like to thank Anita Larsson and, especially, my supervisor Tanja Jarhede for the excellent guidance, expertise and encouragement throughout the entire project. I would also like to say many thanks to all other co-workers, at GE Healthcare, who have assisted me during my experiments. All your help and advice have greatly facilitated my work!
From the University, I would like to thank Lars-Göran Josefsson, as examiner, Filip Karlsson and Nicholas Baltzer, as opponents, and Helena Danielsson, as topic reviewer, for all their proofreading.
7. References [1] RT Purcell, RF Lockey 2008. Immunologic Responses to Therapeutic Biological Agents. J Investig Allergol Clin Immunol 2008; Vol. 18(5): 335-342
[2] Asthma and Allergy Foundation of America. www.aafa.org. Date visited: 25 January 2013
[3] L C Junqueria, Jose Carneiro 2003. Basic Histology. Mc Graw-Hill. University of Sao Paulo
[4] G Mayer. 2009. Immunoglobulins – structure and function. Microbiology and Immunology On-line – University of South Carolina School of Medicine. http://pathmicro.med.sc.edu/mayer/igstruct2000.htm. Date visited: 30 January 2013
[5] H Schellekens 2003. Immunogenicity of therapeutic proteins. Nephrol Dial Transplant 18(7): 1257-1259.
[6] JM Woof, DR Burton 2004. Human antibody-Fc receptor interactions illuminated by crystal structures. Nat Rev Immunol 4 (2): 89-99
39
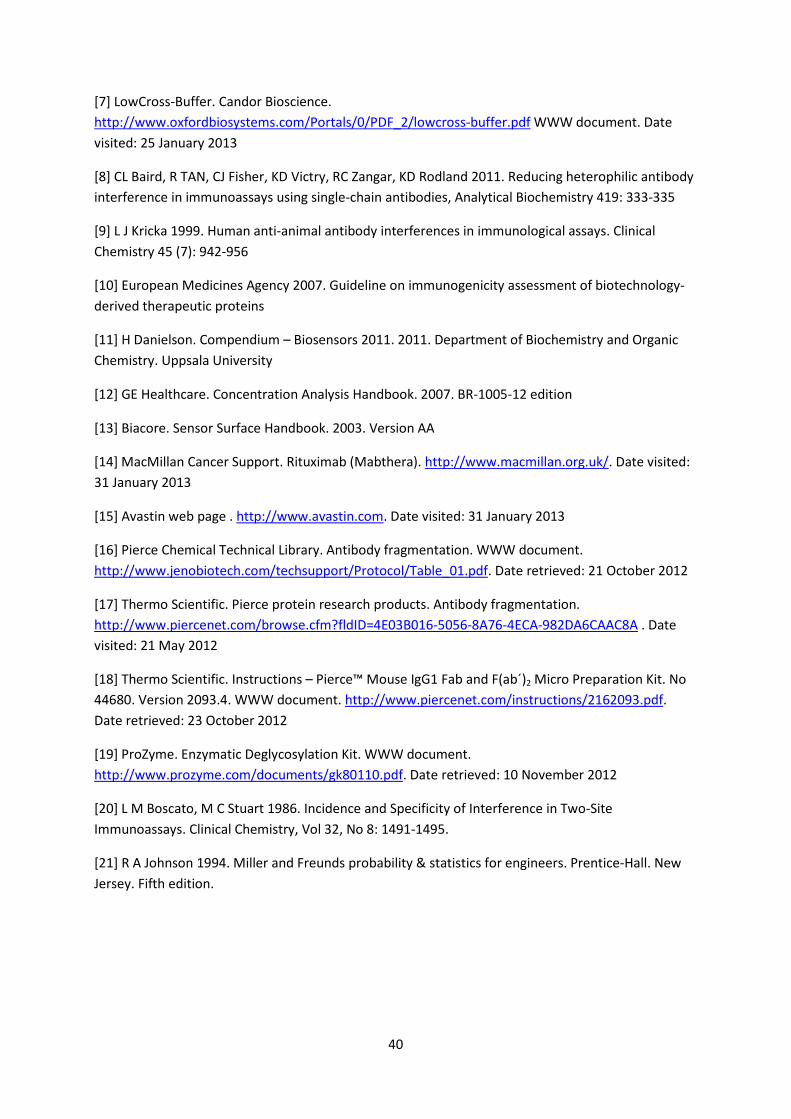
[7] LowCross-Buffer. Candor Bioscience. http://www.oxfordbiosystems.com/Portals/0/PDF_2/lowcross-buffer.pdf WWW document. Date visited: 25 January 2013
[8] CL Baird, R TAN, CJ Fisher, KD Victry, RC Zangar, KD Rodland 2011. Reducing heterophilic antibody interference in immunoassays using single-chain antibodies, Analytical Biochemistry 419: 333-335
[9] L J Kricka 1999. Human anti-animal antibody interferences in immunological assays. Clinical Chemistry 45 (7): 942-956
[10] European Medicines Agency 2007. Guideline on immunogenicity assessment of biotechnology-derived therapeutic proteins
[11] H Danielson. Compendium – Biosensors 2011. 2011. Department of Biochemistry and Organic Chemistry. Uppsala University
[12] GE Healthcare. Concentration Analysis Handbook. 2007. BR-1005-12 edition
[13] Biacore. Sensor Surface Handbook. 2003. Version AA
[14] MacMillan Cancer Support. Rituximab (Mabthera). http://www.macmillan.org.uk/. Date visited: 31 January 2013
[15] Avastin web page . http://www.avastin.com. Date visited: 31 January 2013
[16] Pierce Chemical Technical Library. Antibody fragmentation. WWW document. http://www.jenobiotech.com/techsupport/Protocol/Table_01.pdf. Date retrieved: 21 October 2012
[17] Thermo Scientific. Pierce protein research products. Antibody fragmentation. http://www.piercenet.com/browse.cfm?fldID=4E03B016-5056-8A76-4ECA-982DA6CAAC8A . Date visited: 21 May 2012
[18] Thermo Scientific. Instructions – Pierce™ Mouse IgG1 Fab and F(ab´)2 Micro Preparation Kit. No 44680. Version 2093.4. WWW document. http://www.piercenet.com/instructions/2162093.pdf. Date retrieved: 23 October 2012
[19] ProZyme. Enzymatic Deglycosylation Kit. WWW document. http://www.prozyme.com/documents/gk80110.pdf. Date retrieved: 10 November 2012
[20] L M Boscato, M C Stuart 1986. Incidence and Specificity of Interference in Two-Site Immunoassays. Clinical Chemistry, Vol 32, No 8: 1491-1495.
[21] R A Johnson 1994. Miller and Freunds probability & statistics for engineers. Prentice-Hall. New Jersey. Fifth edition.
40