A Generational Perspective of Teachers' Perceptions of ...
161
Kennesaw State University DigitalCommons@Kennesaw State University Dissertations, eses and Capstone Projects 4-10-2014 A Generational Perspective of Teachers' Perceptions of Principals' Leadership Practices Greg A. Doss Kennesaw State University Follow this and additional works at: hp://digitalcommons.kennesaw.edu/etd Part of the Educational Administration and Supervision Commons is Dissertation is brought to you for free and open access by DigitalCommons@Kennesaw State University. It has been accepted for inclusion in Dissertations, eses and Capstone Projects by an authorized administrator of DigitalCommons@Kennesaw State University. For more information, please contact [email protected]. Recommended Citation Doss, Greg A., "A Generational Perspective of Teachers' Perceptions of Principals' Leadership Practices" (2014). Dissertations, eses and Capstone Projects. Paper 622.
Transcript of A Generational Perspective of Teachers' Perceptions of ...

Kennesaw State UniversityDigitalCommons@Kennesaw State University
Dissertations, Theses and Capstone Projects
4-10-2014
A Generational Perspective of Teachers'Perceptions of Principals' Leadership PracticesGreg A. DossKennesaw State University
Follow this and additional works at: http://digitalcommons.kennesaw.edu/etd
Part of the Educational Administration and Supervision Commons
This Dissertation is brought to you for free and open access by DigitalCommons@Kennesaw State University. It has been accepted for inclusion inDissertations, Theses and Capstone Projects by an authorized administrator of DigitalCommons@Kennesaw State University. For more information,please contact [email protected].
Recommended CitationDoss, Greg A., "A Generational Perspective of Teachers' Perceptions of Principals' Leadership Practices" (2014). Dissertations, Thesesand Capstone Projects. Paper 622.

A GENERATIONAL PERSPECTIVE OF TEACHERS’ PERCEPTIONS OF
PRINCIPALS’ LEADERSHIP PRACTICES
by
Greg A. Doss
A Dissertation
Presented in Partial Fulfillment of the Requirements for the
Degree of
Doctor of Education
In
Leadership for Learning
Educational Leadership
In the
Bagwell College of Education
Kennesaw State University
Kennesaw, GA
May 2014


Copyright by
Greg A. Doss
2014

ii
ACKNOWLEDGMENTS
This task would not have been accomplished without the assistance and sacrifice
of my family: Lisa, my wife; Gage and Reagan, our children. It was their love and
encouragement throughout my lifelong educational journey that gave me the physical and
intellectual strength to reach for new heights. They are my heartbeat in life.
To Dr. Mary Chandler, my dissertation chair, thank you for your dedication,
guidance, and patience throughout this process. To my incredibly talented dissertation
committee, Dr. Bill Swan and Dr. T.C. Chan, thank you for your feedback critique, and
encouragement in developing my skills as a scholar.
To Dr. Mike Dishman, you have my deepest appreciation and gratitude for you
endless endeavors to ensure my completion in the leadership for learning graduate
program.

iii
ABSTRACT
A GENERATIONAL PERSPECTIVE OF TEACHERS’ PERCEPTIONS OF
PRINCIPALS’ LEADERSHIP PRACTICES
by
Greg A. Doss
Kennesaw State University, 2014
The purpose of this quantitative study was to investigate if generational
differences exist among teachers’ perceptions of the leadership practices of Boomer and
Gen X principals. Leadership practices of principals have been studied for decades in
education. This research study analyzed data of eight dimensions of leadership practices
from the 75 item School Improvement Opinion Survey (2006). The critical literature
suggests that generational differences do exist among Boomer, Gen X, and Millennial
teachers and their perception of the leadership practices of Boomer and Gen X principals.
This study found statistically significant differences in the mean scores among the three
generations of teachers depending on the leadership dimension, and whether they were
led by a Boomer or Gen X principal. The dimensions of principals’ leadership practices
analyzed included: assessment, curriculum, instruction, leadership, planning and
organization, professional learning, school-family-community, and school culture. The
pattern that emerged from the data analyses indicated in greater frequency (70 of the 75
items) that there were no statistically significant generational differences of perceptions
among teachers of the leadership practices of Boomer principals. However the data
analyses indicated statistically significant generational differences (5 of the 75 items)
iv
in the leadership dimension of school-family-community and school culture. Statistically
significant generational differences occurred in greater frequency among Boomer and
Millennial teachers, followed by Boomer and Gen X teachers, and only one occurrence
among Boomer and Gen X teachers. The pattern that emerged from the data analyses
indicated a greater frequency (31 of the 75 items) were statistically significant
generational differences of the perceptions among teachers of the leadership practices of
Gen X principals. The data analyses indicted statistically significant generational
differences were in the leadership dimensions of: assessment, curriculum, instruction,
leadership, planning and organization, professional learning, and school culture. The
statistically significant generational differences occurred greater frequently among
Millennial and Gen X teachers (30 of the 75 items), followed by Millennial and Boomer
teachers (7 of the 75 items), and one occurrence among Boomers and Gen X teachers.
Principal leadership practices that are capable of addressing generational contingencies
have the potential of increasing teacher effectiveness. To achieve this goal, principals will
need to adjust their leadership practices to be conducive to collaboration, mutual respect,
diversity, professional growth, innovation, and building relationships among the
generations of teachers.
v
TABLE OF CONTENTS
AKNOWLEDGEMENTS................................................................................................. ii
ABSTRACT ..................................................................................................................... iii
LIST OF TABLES ........................................................................................................ viii
LIST OF FIGURES ....................................................................................................... xii
CHAPTER I: INTRODUCTION ...................................................................................... 1
Statement of the Problem .......................................................................................... 4
Research Questions and Hypotheses ......................................................................... 5
Significance of the Study........................................................................................... 7
Conceptual Framework ............................................................................................. 9
Review of Relevant Terms ...................................................................................... 10
Organization of Study.............................................................................................. 10
CHAPTER II: REVIEW OF LITERATURE .................................................................. 12
Introduction ............................................................................................................. 12
Theoretical Framework ........................................................................................... 12
Review of Critical Literature ................................................................................... 14
Transformational Leadership .............................................................................. 14
Leadership Practices ........................................................................................... 15
Organizational Culture ........................................................................................ 19
Generational Cohort ............................................................................................ 25
Boomers .................................................................................................. 27
Gen X ...................................................................................................... 28
Millennials .............................................................................................. 29
Summary.................................................................................................................. 30
CHAPTER III: METHODOLOGY................................................................................. 32
Research Questions and Hypotheses ....................................................................... 32
Research Design ...................................................................................................... 35
Sample ..................................................................................................................... 35
Instrument ................................................................................................................ 41
Data Collection ........................................................................................................ 42
Data Analysis........................................................................................................... 45
Limitations ............................................................................................................... 46
Ethical Considerations ............................................................................................. 46
Summary.................................................................................................................. 47
vi
CHAPTER IV: FINDINGS ............................................................................................. 48
Data Description ...................................................................................................... 49
Data Analysis of the Sample Participation .............................................................. 52
Data Analysis of Teacher Perception of Boomer Principals .................................. 55
School-Family-Community ........................................................................ 57
School Culture ............................................................................................ 59
Data Analysis of Teacher Perception of Gen X Principals .................................... 60
Assessment ................................................................................................. 64
Curriculum .................................................................................................. 65
Instruction ................................................................................................... 67
Leadership .................................................................................................. 69
Planning and Organization ......................................................................... 71
Professional Learning ................................................................................. 72
School Culture ............................................................................................ 74
Discussion and Interpretation of the Results .......................................................... 76
Perceptions of Leadership Practices of Boomer Principals ........................ 76
School-Family-Community ....................................................... 78
School Culture ........................................................................... 78
Perceptions of Leadership Practices of Gen X Principals .......................... 79
Assessment, Curriculum, and Instruction .................................. 79
Leadership, Planning, and Organization .................................... 81
Professional Learning ................................................................ 81
Perceptions of Leadership Practices of Boomer and Gen X
Principals ............................................................................................... 82
Summary ............................................................................................................... 82
CHAPTER V: CONCLUSIONS, IMPLICATIONS, AND
RECOMENDATIONS ................................................................................................... 85
Context of Findings ............................................................................................... 89
Leadership Practices of Boomer Principals .......................................................... 90
Leadership Practices of Gen X Principals ............................................................ 91
Limitation of Findings .......................................................................................... 92
Implications of Findings ....................................................................................... 92
Recommendations for Future Research ................................................................ 93
Conclusion ............................................................................................................ 94
REFERENCES ............................................................................................................... 96

vii
APPENDICES .............................................................................................................. 108
A. School Improvement Opinion Survey ............................................................ 108
B. Principal Letter ............................................................................................... 115
C. Principal Letter Second Request ..................................................................... 116
D. Teacher Perceptions of Boomer Principals .................................................... 117
E. Teacher Perceptions of Gen X Principals ....................................................... 122

viii
LIST OF TABLES
Table Page
1 Generational Differences .......................................................................................11
2 Perceived Leadership Practices..............................................................................26
3 Boomer Principal School: Teacher Demographics ...............................................37
4 Gen X Principal School: Teacher Demographics ..................................................37
5 Boomer Principal School: Teacher Generation .....................................................38
6 Gen X Principal School: Teacher Generation .......................................................38
7 Boomer Principal School: Student Demographics ...............................................39
8 Gen X Principal School: Student Demographics ..................................................39
9 Survey Items by Dimensions ................................................................................44
10 Total Sample Teacher Participation ......................................................................54
11 Boomer Principal School: Teacher Generation Participation ...............................54
12 Gen X Principal School: Teacher Generation Participation .................................54
13 School-Family-Community Dimension Teacher Cohort of Boomer
Principals Descriptive Statistics ...........................................................................56
14 School Culture Dimension Teacher Cohort of Boomer Principals
Descriptive Statistics ............................................................................................56
15 Dimensions with Statistically Significant Differences Analysis of
Variance of Teacher Perceptions of Boomer Principals .......................................57

ix
16 School-Family-Community Statistically Significant Teacher Differences of
Boomer Principals Tukey Results ........................................................................58
17 School Culture Statistically Significant Teacher Differences of
Boomer Principals Tukey Results ........................................................................60
18 Assessment Dimension Teacher Cohort of Gen X Principals
Descriptive Statistics .............................................................................................61
19 Curriculum Dimension Teacher Cohort of Gen X Principals
Descriptive Statistics .............................................................................................61
20 Instruction Dimension Teacher Cohort of Gen X Principals
Descriptive Statistics .............................................................................................61
21 Leadership Dimension Teacher Cohort of Gen X Principals
Descriptive Statistics .............................................................................................62
22 Planning and Organization Dimension Teacher Cohort of Gen X
Principals Descriptive Statistics ...........................................................................62
23 Professional Learning Dimension Teacher Cohort of Gen X
Principals Descriptive Statistics ...........................................................................62
24 School Culture Dimension Teacher Cohort of Gen X Principals
Descriptive Statistics .............................................................................................63
25 Dimensions with Statistically Significant Differences Analysis of
Variance of Teacher Perceptions of Gen X Principals .........................................64
26 Assessment Statistically Significant Teacher Differences of Gen X
Principals Tukey Results ......................................................................................65
27 Curriculum Statistically Significant Teacher Differences of Gen X
Principals Tukey Results ......................................................................................67
28 Instruction Statistically Significant Teacher Differences of Gen X
Principals Tukey Results .......................................................................................68
29 Leadership Statistically Significant Teacher Differences of Gen X
Principals Tukey Results .......................................................................................70
30 Planning and Organization Statistically Significant Teacher Differences of
Gen X Principals Tukey Results ............................................................................72

x
31 Professional Learning Statistically Significant Teacher Differences of
Gen X Principals Tukey Results ............................................................................74
32 School Culture Statistically Significant Teacher Differences of Gen X
Principals Tukey Results .......................................................................................75
D1 Dimensions Analysis of Variance of Teacher Perceptions of Boomer
Principals..............................................................................................................117
D2 School-Family-Community Analysis of Variance of Teacher Perception of
Boomer Principals ................................................................................................118
D3 School-Family-Community Teacher Mean Differences of Boomer
Principals..............................................................................................................119
D4 School Culture Analysis of Variance of Generational Teacher
Perceptions of Boomer Principals ........................................................................120
D5 School Culture Teacher Mean Differences of Boomer Principals .......................121
E1 Dimension Analysis of Variance of Teacher Perceptions of Gen X
Principals..............................................................................................................122
E2 Assessment Analysis of Variance of Teacher Perceptions of Gen X
Principals..............................................................................................................123
E3 Assessment Teacher Mean Differences of Gen X Principals ..............................125
E4 Curriculum Analysis of Variance of Teacher Perceptions of Gen X
Principals..............................................................................................................126
E5 Curriculum Teacher Mean Differences of Gen X Principals ...............................128
E6 Instruction Analysis of Variance of Teacher Perceptions of Gen X
Principals..............................................................................................................129
E7 Instruction Teacher Mean Differences of Gen X Principals ................................131
E8 Leadership Analysis of Variance of Teacher Perceptions of Gen X
Principals..............................................................................................................133
E9 Leadership Teacher Mean Differences of Gen X Principals ...............................136
xi
E10 Planning and Organization Analysis of Variance of Teacher Perceptions of
Gen X Principals ..................................................................................................138
E11 Planning and Organization Teacher Mean Differences of Gen X
Principals..............................................................................................................140
E12 Professional Learning Analysis of Variance of Teacher Perceptions of
Gen X Principals ..................................................................................................141
E13 Professional Learning Teacher Mean Differences of Gen X
Principals..............................................................................................................143
E14 School Culture Analysis of Variance of Teacher Perceptions of
Gen X Principals ..................................................................................................145
E15 School Culture Teacher Mean Differences of Gen X Principals .........................146

xii
LIST OF FIGURES
Figure Page
1 Research Flow Chart of Teachers’ Perceptions of Boomer and Gen X
Principals’ Leadership Practices .............................................................................8
2 Research Sample Flow Chart of Teachers’ Perceptions of Boomer and
Gen X Principals’ Leadership Practices ...............................................................40
3 Direct and Indirect Principal Leadership Practices ...............................................43
4 Sample Participation Response Flow Chart ...........................................................53
5 Teachers’ Perceptions of Principals’ Leadership Practices Flow Chart ...............77

CHAPTER I: INTRODUCTION
Education in the 21st century is impacted by technology, politics, and the
economy. Preparing students becomes a daunting task for educators including the
teachers who deliver the content and the principals who work with the teachers, students,
parents, and the community. The demands for continuous improvement in American
public schools have increased over the decades.
At the center of school improvement are the principals whose efforts hold the
greatest accountability for the success of their students. One essential component in
maintaining effective schools is with strong principal leadership (Ginsberg & Thompson,
1992). In order to achieve this, principals need to be aware of their leadership practices to
maximize their effectiveness.
Marzano, Waters, and McNulty (2005) noted in their research that the greatest
impact on school success can be determined through the leadership practices of
principals. Based on their meta-analysis of more than 69 studies– that included 2802
schools examining effective school leadership– they synthesized the six most popular
theories on school leadership: transformational, transactional, total quality management,
servant, situational, and instructional. Marzano et al. (2005) derived 21 leadership
responsibilities that can increase principal’s influence on school improvement.
The Interstate School Leaders Licensure Consortium created standards and
responsibilities for school principals to ensure student success including creating a shared

2
vision, promoting a positive school culture, managing the facilities, building
relationships, and behaving in a fair and ethical manner (Educational Leadership Policy
Standards, 2008). There has been much attention and research on what leadership
practices make an effective principal; however little attention has been given to studying
effective ways to evaluate principal practices (Davis, Kearney, Sanders, Thomas, &
Leon, 2011). Longnecker and Nykodym (1996), conducting a private sector study on
evaluation systems, noted that employee evaluations can provide valuable information to
the employer about the employee with feedback on improvement. However, they noted
that employee evaluation systems remain complicated and controversial. These systems
are further complicated in education with evaluating the effective practices of principals.
As with any professional position, feedback and monitoring are one criterion for
improvement of professional performance.
Performance evaluations of principals are valuable to the level that the instrument
assesses their leadership practices, effectiveness, weaknesses, and improved leadership
performance (Studebaker, 2000). An effective performance based system has the
potential to provide principals with feedback on their own leadership practices (Maxwell,
2008). In 2006 the Georgia the Department of Education created an all-encompassing
school improvement plan known as the School Keys (Georgia Department of Education,
n.d.). The School Keys are the foundation for Georgia’s comprehensive school
improvement plan. One component of the School Keys is the 75 question School
Improvement Opinion Survey (2006) that allows school districts to collect data on the
effectiveness of a principal’s leadership practices from feedback of the teachers,
community, parents, and students (School Improvement Opinion Survey, 2006). This
3
study will explore the perceptions of principal’s leadership practices by teachers from a
generational perspective. Principals are searching for continual improvement of
performance of individuals and groups as it is a reflection on their leadership practices.
The workforce demographics of teachers are changing. The demographics are
shifting to a more diverse mix of workers (Dychtwald, Erickson, & Morison, 2006).
According to the Bureau of Labor Statistics in 2011, the Boomer generation comprised
30% of the labor force while Gen X was 35%, and Millennials 34% of the labor force.
Each generation is unique and has varying degrees of experiences and expectations.
Leaders and managers are expected to understand the dynamics of the organization based
on sex, ethnicity, special needs, goals, attitudes, morale, climate, and work experience.
However, there has been limited emphasis placed on awareness of potential generational
differences in teachers. This study uses a sociological construct of generations of
teacher’s– Boomers, Gen X, and Millennials– to identify potential perceptional
differences of principal’s leadership practices.
A generation is a group identity of title (i.e., Boomers, Gen X, and Millennials)
and birth range both of which vary from author to author and researcher to researcher.
Pendergast (2009) contended that there is no consensus on the start and end of any given
generation. Generational names in most cases are derived from popular culture, historic
events, a rapid shift in demographics, or simply from the turn of the calendar (Pew
Research Center, 2010). For the purpose of this study the working generations’ title and
age boundaries that will be adopted are as follow: Baby Boomer (Boomers): 1945-1963;
Generation X (Gen X):1964-1979; and Millennials: 1980-2000.

4
Statement of the Problem
Arsenault’s (2004) research sought to access generational differences and
leadership practices. The study found how leadership characteristics were ranked by each
of the generations˗ Boomers, Gen X, and Millennials. The study concluded that leaders
should recognize the diversity of the generations as important parts of the diversity mix.
Sessa, Kabacoff, Deal, and Brown (2007) conducted research similar to
Arsenault’s study on how the generational cohorts perceived leadership practices. The
first part of their study revealed that each generation’s perceptions of leadership styles
differ. The second part of the study found that leaders in different generational cohorts
have different leadership styles. Zemke, Raines, and Filipczak (2000) stated that the
issues with the workplace are as follow:
There is a problem in the workplace˗ a problem derived not from
downsizing, rightsizing, change, technology, foreign competition, pointy-
haired bosses, bad breath, cubical envy, or greed. It is a problem of values,
ambitions, views, mindsets, demographics, and generations in conflict.
The workplace you and we inhabit today is awash with the conflicting
voices and views of the most age- and value-diverse workforce this
country has known since our great-great grandparents abandoned field and
farm for factory and office. (p. 9)
There is limited research in education on the perceptions of teachers by
generational type ˗ Boomers, Gen X, and Millennials. Research suggests that there are
some distinctions among the three generations and their perceptions of leadership
practices. This study attempted to determine if generational teachers’ ˗ Boomers, Gen X,
and Millennials – perceptions are differentiated between leadership practices of
generational principals – Boomers and Gen X.
5
Research Questions and Hypotheses
Two sets research questions and associated null and alternative hypotheses guided
the research based on the generational groups of teachers’ perception of their principal’s–
Boomer and Gen X– leadership practices.
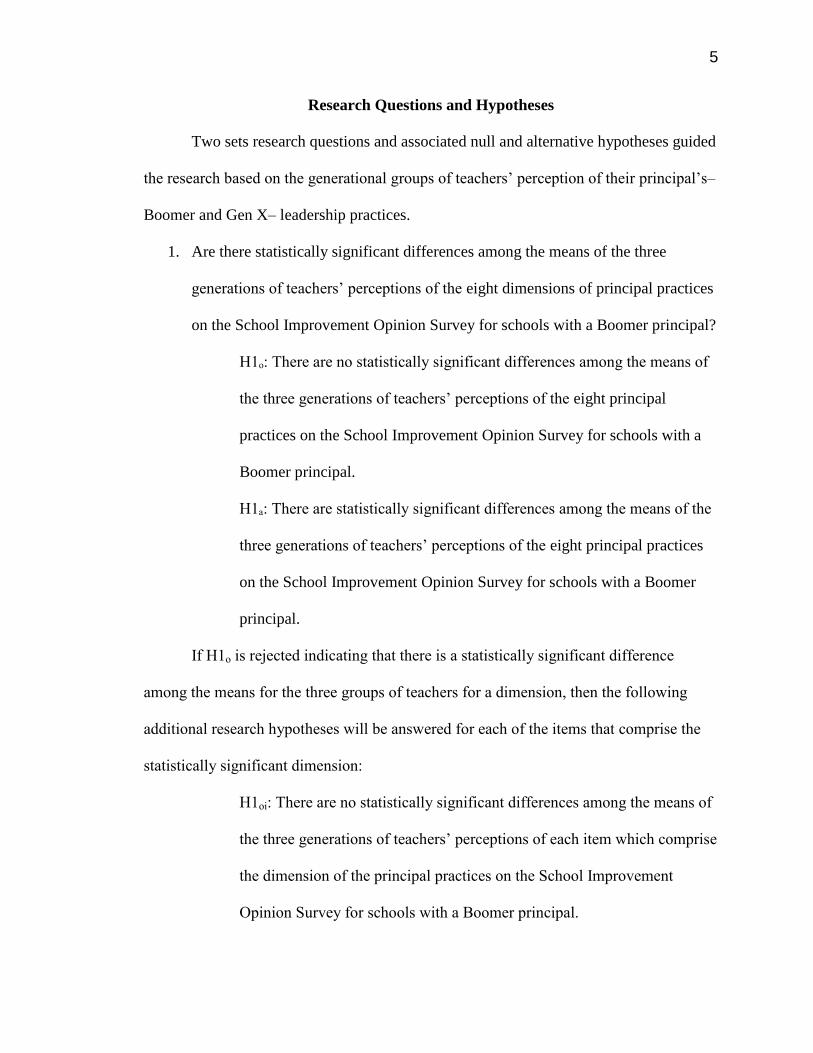
1. Are there statistically significant differences among the means of the three
generations of teachers’ perceptions of the eight dimensions of principal practices
on the School Improvement Opinion Survey for schools with a Boomer principal?
H1ₒ: There are no statistically significant differences among the means of
the three generations of teachers’ perceptions of the eight principal
practices on the School Improvement Opinion Survey for schools with a
Boomer principal.
H1ₐ: There are statistically significant differences among the means of the
three generations of teachers’ perceptions of the eight principal practices
on the School Improvement Opinion Survey for schools with a Boomer
principal.
If H1o is rejected indicating that there is a statistically significant difference
among the means for the three groups of teachers for a dimension, then the following
additional research hypotheses will be answered for each of the items that comprise the
statistically significant dimension:
H1oi: There are no statistically significant differences among the means of
the three generations of teachers’ perceptions of each item which comprise
the dimension of the principal practices on the School Improvement
Opinion Survey for schools with a Boomer principal.
6
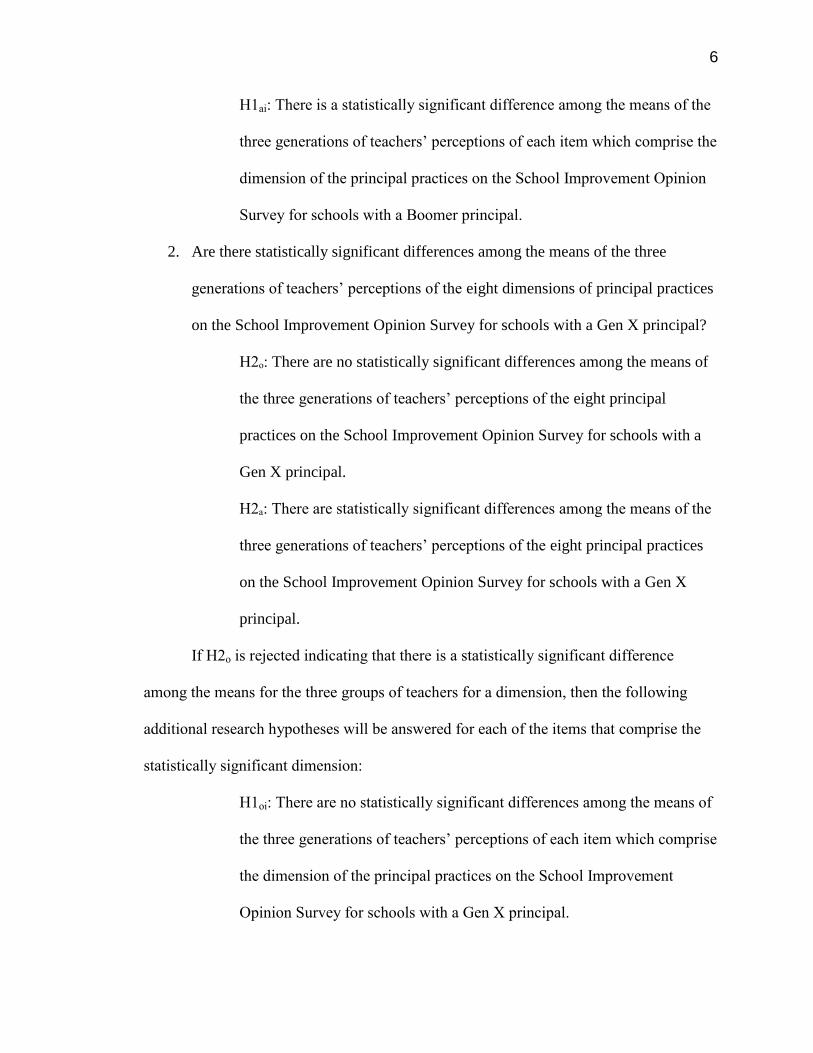
H1ai: There is a statistically significant difference among the means of the
three generations of teachers’ perceptions of each item which comprise the
dimension of the principal practices on the School Improvement Opinion
Survey for schools with a Boomer principal.
2. Are there statistically significant differences among the means of the three
generations of teachers’ perceptions of the eight dimensions of principal practices
on the School Improvement Opinion Survey for schools with a Gen X principal?
H2ₒ: There are no statistically significant differences among the means of
the three generations of teachers’ perceptions of the eight principal
practices on the School Improvement Opinion Survey for schools with a
Gen X principal.
H2ₐ: There are statistically significant differences among the means of the
three generations of teachers’ perceptions of the eight principal practices
on the School Improvement Opinion Survey for schools with a Gen X
principal.
If H2o is rejected indicating that there is a statistically significant difference
among the means for the three groups of teachers for a dimension, then the following
additional research hypotheses will be answered for each of the items that comprise the
statistically significant dimension:
H1oi: There are no statistically significant differences among the means of
the three generations of teachers’ perceptions of each item which comprise
the dimension of the principal practices on the School Improvement
Opinion Survey for schools with a Gen X principal.

7
H1ai: There is a statistically significant difference among the means of the
three generations of teachers’ perceptions of each item which comprise the
dimension of the principal practices on the School Improvement Opinion
Survey for schools with a Gen X principal.
The flow of this research guided by the two sets research questions and associated
null and alternative hypotheses based on the generational groups of teachers’ perception
of their principal’s–Boomer and Gen X– leadership practices are illustrated in Figure 1.
Significance of the Study
The purpose of this study is to determine if there are any statistically significant
differences in teachers’ perception by generation – Boomers, Gen X, Millennials – of the
principal’s leadership practices by generation – Boomers and Gen X. Teachers represent a
multigenerational workforce where the principal’s understanding of their perception can
effectively motivate an age-diverse workforce. Salopek (2006) described that by
understanding each generation’s perception a leader can adapt new competencies to
incorporate the most effective for each generation in the same respect a leader would
adjust for cultural differences.
This quantitative study will improve the understanding of principal’s leadership
practices and how they are perceived by the generational teachers. The investigation of
principal practices as perceived by the differing generations of teachers will add to the
knowledge and skills for the professional development of educational leaders and offer
opportunities for leaders to develop strategies to improve the effectiveness of leadership
of multigenerational employees.

8
Figure 1: Research Flow Chart of Teachers’ Perceptions of Boomer and Gen X
Principals’ Leadership Practices.
Sample
High Schools High Schools
Teachers: Boomers
Gen X Millennials
Teachers: Boomers
Gen X Millennials
Boomer Principals
Gen X Principals
Q1 Q2
Leadership Practices
Dimensions (75 Items)
H1ₒ H1ₐ H2ₐ H2ₒ
Assessment
Curriculum
Instruction
Leadership
Planning & Organization
School-Family-Community
School Culture
Professional Learning

9
Conceptual Framework
Schlesinger (1986) noted that a generation is not an exact unit; it is almost a
metaphor. Early research often defined generations by genealogy or lineage. Mannheim
(1952) postulated that members of a generation experience specific historical or cultural
events that influence their outlook and perception of society. He did not specifically
categorize any generation only referring to them as social phenomenon. This social
phenomenon is now known as generational theory. Ryder (1965) defined a generational
cohort as being more than a span of similar birth years. Rather, it is a group of individuals
that have experienced the same historical and societal events in the same period of time.
Individuals do not choose or may not be aware of their generational affiliation. With the
ebb and flow of each generation, young and old, social change is driven by historical
events that shape society in which Ryder (1965) describes as “demographic metabolism”
(p. 843). Each generation will have a different perspective on the events that unfold
around them. It is these shared experiences at key developmental stages that create the
norms and unique characteristics that define and differentiate each generation (Kowske,
Rasch, & Wiley, 2009). Rosow (1978) identified five components of a social cohort as:
Consisting of people who share given life experiences.
Their experiences are socially or historically structured.
These experiences occur in a common generational framework.
Experimental effects distinguish one generation from another.
These effects are relatively stable over a group’s lifetime (p. 67).
Each individual has a generational location whether it is on the early, late, or in
the middle. The shared historical, social, and economic events shape a generation in
10
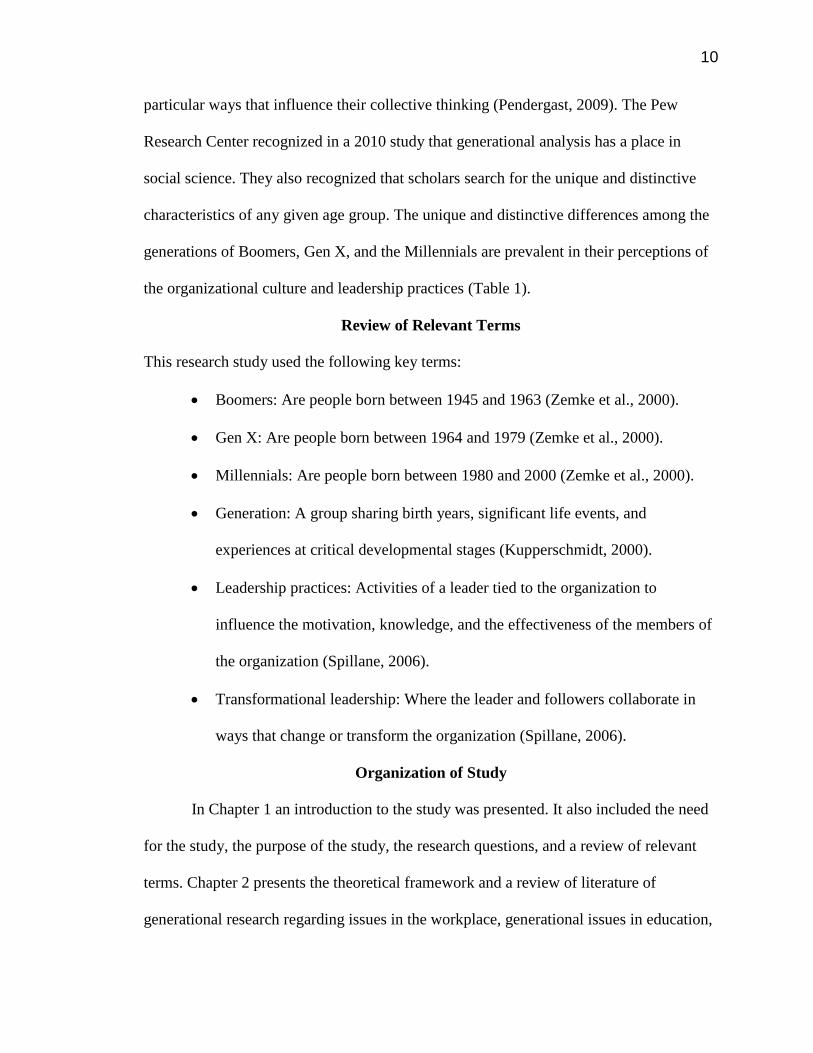
particular ways that influence their collective thinking (Pendergast, 2009). The Pew
Research Center recognized in a 2010 study that generational analysis has a place in
social science. They also recognized that scholars search for the unique and distinctive
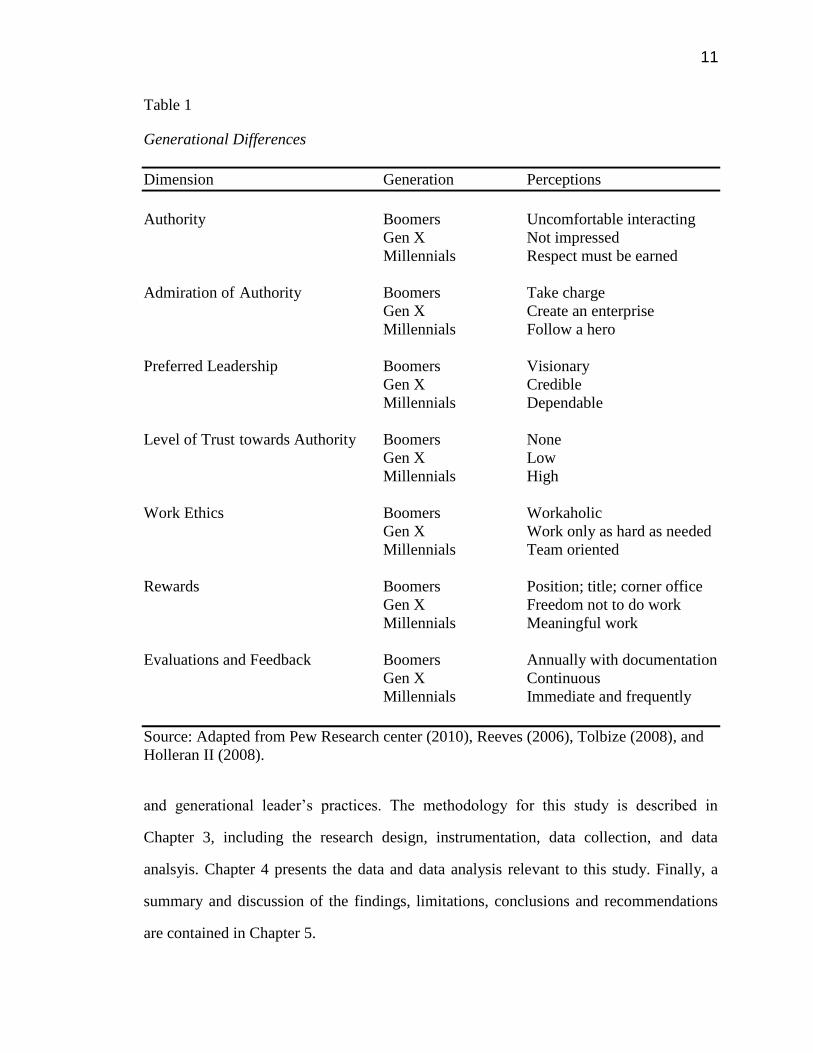
characteristics of any given age group. The unique and distinctive differences among the
generations of Boomers, Gen X, and the Millennials are prevalent in their perceptions of
the organizational culture and leadership practices (Table 1).
Review of Relevant Terms
This research study used the following key terms:
Boomers: Are people born between 1945 and 1963 (Zemke et al., 2000).
Gen X: Are people born between 1964 and 1979 (Zemke et al., 2000).
Millennials: Are people born between 1980 and 2000 (Zemke et al., 2000).
Generation: A group sharing birth years, significant life events, and
experiences at critical developmental stages (Kupperschmidt, 2000).
Leadership practices: Activities of a leader tied to the organization to
influence the motivation, knowledge, and the effectiveness of the members of
the organization (Spillane, 2006).
Transformational leadership: Where the leader and followers collaborate in
ways that change or transform the organization (Spillane, 2006).
Organization of Study
In Chapter 1 an introduction to the study was presented. It also included the need
for the study, the purpose of the study, the research questions, and a review of relevant
terms. Chapter 2 presents the theoretical framework and a review of literature of
generational research regarding issues in the workplace, generational issues in education,
11
Table 1
Generational Differences
Dimension Generation Perceptions
Authority Boomers Uncomfortable interacting
Gen X Not impressed
Millennials Respect must be earned
Admiration of Authority Boomers Take charge
Gen X Create an enterprise
Millennials Follow a hero
Preferred Leadership Boomers Visionary
Gen X Credible
Millennials Dependable
Level of Trust towards Authority Boomers None
Gen X Low
Millennials High
Work Ethics Boomers Workaholic
Gen X Work only as hard as needed
Millennials Team oriented
Rewards Boomers Position; title; corner office
Gen X Freedom not to do work
Millennials Meaningful work
Evaluations and Feedback Boomers Annually with documentation
Gen X Continuous
Millennials Immediate and frequently
Source: Adapted from Pew Research center (2010), Reeves (2006), Tolbize (2008), and
Holleran II (2008).
and generational leader’s practices. The methodology for this study is described in
Chapter 3, including the research design, instrumentation, data collection, and data
analsyis. Chapter 4 presents the data and data analysis relevant to this study. Finally, a
summary and discussion of the findings, limitations, conclusions and recommendations
are contained in Chapter 5.

12
CHAPTER II: REVIEW OF LITERATURE
Introduction
Major challenges exist for educational leaders with increased accountability from
the public and the workforce. Principals are faced with the external pressures of policies
and the community to increase student achievement, as well as the internal expectations
of organizational performance from a multigenerational teacher workforce. With the new
challenges leadership must adapt and construct new models to address the challenges in
today’s and tomorrow’s education system (Rost, 1991).
The purpose of this quantitative study was to examine the generational differences
of organizational culture and leadership practices. A review of current and relevant
literature was conducted. This chapter is sectioned by theoretical framework, review of
literature, and summary.
Theoretical Framework
The theoretical framework for this study is transformational leadership which
encourages organizational members to participate, contribute, and involve the members
in the decision-making process. In transformational theory the leader creates an
empowering environment where the individual fulfills her or his needs as a productive
member of the organization (Guthrie & Schuermann, 2010). There are four generational
cohorts currently working in business and in education which are Traditionalists,
Boomers, Gen X, and Millennials. However, Traditionalists in 2013 comprise less than
2% of the workforce according to the United States Census Bureau. Based on their small

13
cohort size they were excluded from this study. Each generation perceives the approach
to leadership practices in education and business differently, a challenge that cannot be
ignored (Ebenkamp, 1999).
The work characteristics of the three generations play a role in establishing the
culture of an organization, which can be challenging for leaders. Each generation’s
collective thinking is shaped by how they were reared based on socio-economic
conditions, political climate, and culture (Piper, 2008). The effects of these events tend to
be constant across a generation and create a unique personality for each generation
(Smola & Sutton, 2002). Cennamo and Gardner (2008) noted that different generations
have different work values since each generation entered the workforce at different times.
The individuals from different generations will have varying expectations and
perceptions of leadership and preferences as to how they need to be led (McNeese-Smith
& Crook, 2003).
In transformational practice the leader articulates the differences within an
organization by focusing on higher-order intrinsic needs such as trust, support, and
celebrations of accomplishments (Guthrie & Schuermann, 2010). Burns (2010) defined
the most effective transformational leadership as a situation in which the leader and
follower aspire to raise each other to the highest level of morality and innovation.
Transformational leader practice encourages both parties to build a relationship of trust.
Transformational leaders inspire followers with a positive and hopeful outlook,
minimizing the barriers that may exist within an organization. The most challenging
aspect of transformational leaders is influencing followers to set aside their personal
interests for the health and sustainability of the organization. This can depend on the

14
leader’s inspirational qualities such as charisma, motivation, intellectual stimulation, and
relationships.
Review of Critical Literature
The themes of this literature review include the roles and responsibilities of
leadership and organizational culture and how Boomers, Gen X, and Millennials receive
them. Also, with the limited research of generational differences in public education the
related research provides a critical analysis of businesses in the public and private sector.
The themes include transformational leadership, leadership practices, organizational
cultures, and generational cohorts.
Transformational Leadership
Sergiovanni’s (2007) perspective on the principal’s transformational role as a
leadership practice is it should meet the needs of all stakeholders both intrinsically and
extrinsically. This practice of shared leadership involves teachers and administrators
becoming active participants in the decision-making process to develop effective
instructional practices and effective curriculum. Sergiovanni indicated that
transformational leaders empower the organization to take ownership through a
collaborative process. The transformational leaders are concerned more with the process
of how to increase performance in the organization, rather than merely the end result.
This allows teacher’s to focus on the organizational purpose. It creates an organizational
culture where the members are committed to a shared vision providing the opportunity to
identify the best path for the organization to reach its goals. This type of collaborative
approach builds a strong organizational culture among teachers.
15
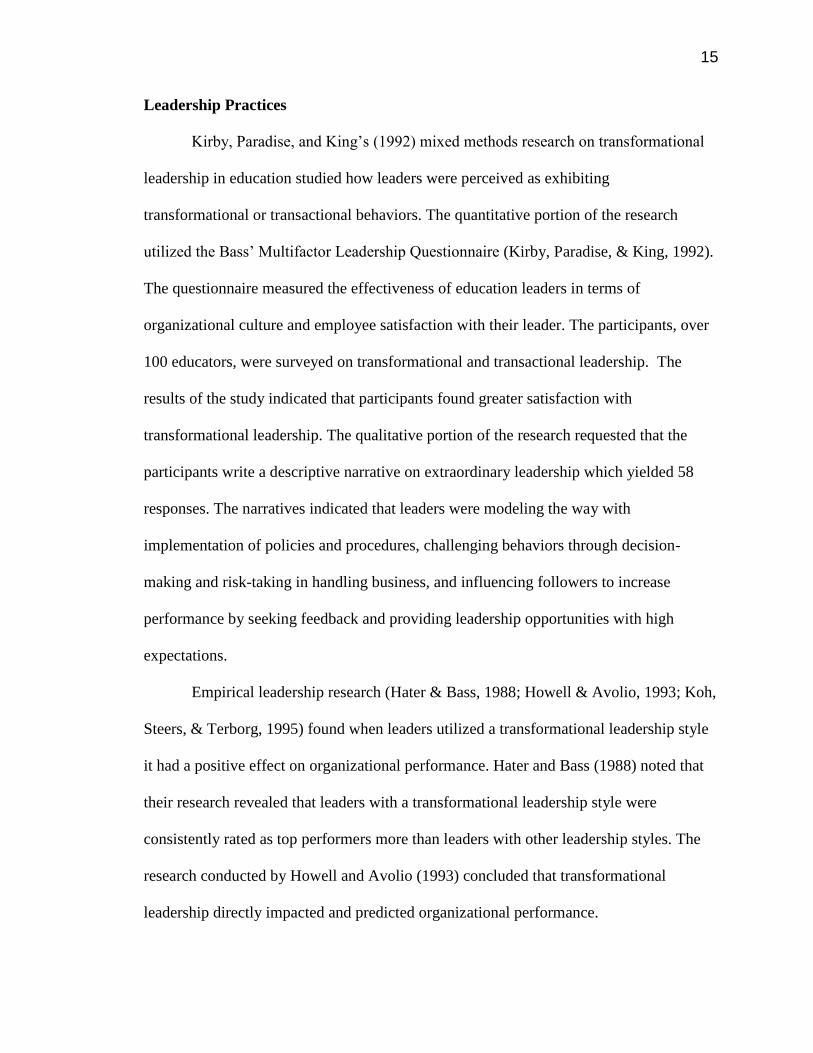
Leadership Practices
Kirby, Paradise, and King’s (1992) mixed methods research on transformational
leadership in education studied how leaders were perceived as exhibiting
transformational or transactional behaviors. The quantitative portion of the research
utilized the Bass’ Multifactor Leadership Questionnaire (Kirby, Paradise, & King, 1992).
The questionnaire measured the effectiveness of education leaders in terms of
organizational culture and employee satisfaction with their leader. The participants, over
100 educators, were surveyed on transformational and transactional leadership. The
results of the study indicated that participants found greater satisfaction with
transformational leadership. The qualitative portion of the research requested that the
participants write a descriptive narrative on extraordinary leadership which yielded 58
responses. The narratives indicated that leaders were modeling the way with
implementation of policies and procedures, challenging behaviors through decision-
making and risk-taking in handling business, and influencing followers to increase
performance by seeking feedback and providing leadership opportunities with high
expectations.
Empirical leadership research (Hater & Bass, 1988; Howell & Avolio, 1993; Koh,
Steers, & Terborg, 1995) found when leaders utilized a transformational leadership style
it had a positive effect on organizational performance. Hater and Bass (1988) noted that
their research revealed that leaders with a transformational leadership style were
consistently rated as top performers more than leaders with other leadership styles. The
research conducted by Howell and Avolio (1993) concluded that transformational
leadership directly impacted and predicted organizational performance.

16
Powell (2003) examined the differences of how Boomers, Gen X, and Millennials
perceived effective leadership. Powell modified the Kouzes and Posner (2002)
framework to a survey format. The most prominent leadership characteristics between the
cohorts were dependability, honesty, fair-mindedness, and ambition. Dependability is
defined as when a leader can be relied upon to perform do his or her duties by creating
policies and building trust within the organization. A leader’s honesty is evident in
organizational cultures that feature a high standard of ethics and mutual trust. Fair-
mindedness is characteristic of leaders who support their followers with unbiased respect.
Ambitious leaders show remarkable persistence, clarity of purpose, and optimism in the
organization. The results indicated Boomers viewed dependability, honesty, and fair-
mindedness as the most important leadership characteristics. Gen X rated dependability,
honesty, and fair-mindedness as the most important characteristic. Millennials rated
ambition of the leader as the most important characteristic.
Welsh (2010) conducted a mixed-method case study that researched the
multigenerational success of Gagliardi – a coach with a track record of winning football
games that stretched over six decades. Welsh’s (2010) intent was to examine and identify
the potential leadership styles, characteristics, and leadership effectiveness of this coach
using standard qualitative research methods, interviewing, and using the Revised
Leadership Scale for Sport survey (Chelladurai & Saleh, 1980). In the multigenerational
research study, the results indicated four leadership themes were utilized by the coaches
which were efficacy, effective communication, professional disposition, and
empowerment. Participants across the generations had similar experiences as a whole
noting it was the coach’s unique ability to connect the dots to solve problems with his

17
team. Welsh (2010) noted that the one leadership trait that changed over the years was
how the coach communicated to the players due to generational differences. Boomers
wanted the respect of the coach where Gen X sought support for learning new skills and
the Millennials desired visibility from the coach. Another finding was the expectation on
feedback – Boomers required little feedback while Gen X and Millennials not only
needed it, they demanded it.
Workplace coaching was a study conducted by Chernoff (2007) where leadership
theory suggested that an organizational culture will increase employee satisfaction. The
qualitative study was divided into manager interviews, focus group interviews, and
human resources recommended interviews. The case study revealed that an
organizational coaching program is effective in changing the work environment. All
participants noted that the needs of the employees were secondary to organizational
success; however, by introducing a coaching culture as part of a transformational
leadership strategy leaders could connect with their employees. With this strategy the
employees would feel supported with the increased visibility of the leader. Chernoff
(2007) concluded that even though the coaching program was effective with managers it
would have sustainability issues with a coaching team within the organization.
In a more recent research study, Michaud (2012) examined the generational
differences of leadership practices of the Society for Public Health Education. The
researcher utilized Kouzes and Posner (2012) Leadership Practices Inventory to measure
generational differences in leadership practices of the Boomers, Gen X, and Millennials.
While Michaud determined that a sample size of 268 participants were needed only 51
responses were returned. Even though the study found generational differences in the

18
perception of leadership practices, the researcher could not draw any conclusions due to
the small sample size.
In 2006 Ranstad commissioned Harris Interactive to explore the workplace
attitudes of leaders and organizational members. The goal of Ranstad’s research program
was to offer leaders insight into organizational issues that help leaders to develop
strategies to deal with professional challenges. The results indicated that employees want
recognition for their work, support through professional growth, new opportunities, and
increased compensation.
The study revealed that while 73% of leaders supported and fostered professional
development, only 49% of employees believed leadership provided development. This is
a matter of perspective in which employees’ ranked professional development by pay
increases, learning new skills, and opportunities to serve in leadership roles. Leaders
ranked development by learning new skills, increased responsibility, and leadership
training. Each generation has preferences in professional development. Gen X and
Millennials are most interested in a career path that will lead to opportunities in
leadership; Boomers are interested in pay increases.
Based on the results of the survey on the effect of leadership practices on
organizational culture, employees of all generations believed that leadership is engaging
in these practices. These practices had a positive impact on the organizational culture
including celebrating and rewarding accomplishments, encouraging an atmosphere of
trust, respecting and seeking employee input through open communication, and leading
by example.

19
Organizational Culture
Wallace (2006) studied the generational differences in the attitudes to work
commitment. The purpose of the study was to see if there was a significant difference
between generations in work commitment or the factors that are related to work
commitment. Wallace’s priority was to empirically document the work attitudes and
experiences of Boomers and Gen X among a professional group of lawyers. The
expectation was that Gen X will begin to fill the open positions of the retiring Boomers.
However, Gen X is a smaller cohort than the Boomers and it is assumed that Gen X is
more concerned about the quality of life with a work-life balance.
The participants in the Wallace research were individuals from independent law
firms, corporations, and federal positions. The variables used in this study were work
commitment, work effort, work flexibility, income, and rewards. The control variables
included sex, marital and parental status, expectations met, work environment, and years
of experience. Wallace concluded that Boomer’s work commitment was based on their
ability to have input into the decision-making process, and Gen X sought more visibility
and support from their colleagues and leaders.
In another study Davis, Pawlowski, and Houston (2006) examined the differences
in work commitment between Boomers and Gen X. Their participants were in the
information technology field employed by state agencies and the university system. The
research examined work involvement, work group attachment, and organizational and
professional commitment. Consistent with Wallace’s (2006) study, the difference
between Boomers and Gen X is that Gen X needed support from other workers in the
organization.

20
Bolton (2010) studied the needs of employees by generation. The research
instrument was a survey questionnaire constructed and validated by the Pew Research
Center (2006). The purpose of this quantitative descriptive study was to close the gap
between organizational management strategies and employee needs. Bolton’s (2010)
research focused on job security and job satisfaction among the generations. The impact
of career motivation and career decision on a generation was the basis of the research
questions. The results of the study revealed that each generation had different
perspectives on job satisfaction and career pursuits. The Boomers were committed to
work seeking acknowledgement for leadership for their accomplishments. Gen X and the
Millennials wanted the opportunity for career development into leadership roles.
Another study by Cennamo and Gardner (2008) focused on work values, job
satisfaction, effective organizational commitment, and intent to look for new work of the
Boomers, Gen X, and Millennials. There were 504 participants from various industries
who completed the questionnaire where 23% were identified as Boomers, 57% as Gen X,
17% as Millennials, and 3% as Traditionalists. The results indicated that the Millennials
value respect and trust in the work place more than the other generational cohorts. Job
satisfaction among all generational cohorts and organizational commitment declined
when turnover of workers increased. This study was based on self-reported data which
limits the reliability and validity of the findings. The revealing factor of this study was
the similarity in perspective of the generations on the relationship between job security
and job satisfaction.
Perez (2005) examined how leadership behaviors affect worker’s job satisfaction
as it relates to pay, promotion opportunities, and tolerance with supervision. He discussed

21
how reward behavior from leaders is a common practice among the different generations
in the workplace. The 242 participants were surveyed from the science and engineering
industry based on their generational identification of Traditionalist, Boomer, Gen X, or
Millennials. The results indicated that, no matter the generation, employees were
influenced by rewarding their accomplishments and the opportunity for professional
growth that related to higher job satisfaction.
Fernandez’s (2009) research examined the differences between Gen X and
Millennials as it related to work engagement, teamwork, and professional development.
The study included 290 participants from a technology company located in the Silicon
Valley. The results indicated there was a significant difference in a higher sense of work
engagement in career development and work engagement between the Millennials and
Gen X. Fernandez (2009) surmised that the reason there was no significant difference
between Gen X and Millennials on teamwork and professional development was that
when their needs are met, they remain engaged at work.
In 2005 Chan conducted a quantitative correlational research study that examined
the relationship between leadership behavior and job satisfaction of Gen X and
Millennials. The results indicated that the Millennials had higher expectations of their
immediate supervisor’s leadership behavior for stimulation and motivation by visibility
within the organization. The findings also indicated that Millennials had a lower job
satisfaction (more willing to change jobs) than Gen X. Chan (2005) concluded that there
were significant differences between the perceptions of leadership behaviors in how
leaders are implementing policies and routines and strengthening relationships that
maximize the organization’s performance.
22
A more recent study by Jones (2010) was based on a quantitative comparative
analysis of corporate loyalty between the generations of Traditionalists, Boomers, Gen X,
and Millennials in the manufacturing industry. The literature review revealed there were
four elements of corporate loyalty consisting of compensation, benefits, job security, and
managerial effectiveness. The survey instrument was created by the researcher that
incorporated a five point Likert scale to quantify the participant’s responses. The results
indicated that differences in corporate loyalty existed between the four generations.
While Traditionalists and Boomers had the high level of loyalty based on trust and
respect, Gen X and Millennials had the lowest. Jones (2010) concluded that leadership
needs to understand the strengths and weaknesses of each generation.
The main focus of the research conducted by Koenigsknecht (2002) studied the
changing workforce between the Boomers and Gen X. The focus of the research was on
the motivation and trust of employees. The elements of motivation include engaging
work, pay, and self-worth in the workplace. The element of trust is based on the
communication of the leaders and the working environment. Koenigsknecht (2002)
concluded that organizational effectiveness is directly affected by trust. Further, the work
environment influences organization, employee perceptions, and corporate culture.
Summers (2011) conducted a theoretical analysis of Millennials army officers’
preference of leadership style. The study included a complete analysis of Millennials’
characteristics and workplace values. The review of literature provides a critical analysis
of Millennial characteristics by examining the transformational and transactional
leadership theories. Summers (2011) concluded that Millennials are drawn to a
transformational leadership style when leadership seeks their input on decisions.
23
Arsenault’s (2004) research sought to extend and validate previous research on
generational differences and the perception of leadership. The sample size consisted of
790 participants. The qualitative portion of the research revealed that each generation has
a unique set of shared memories through events, entertainment, and favorite leaders.
Significant differences were found between the generations related to honesty, care, and
ambition. The Traditionalists and Boomers regarded honesty and caring from their
leaders statistically significantly higher than Gen X and Millennials. On the other hand,
Gen X and Millennials regarded ambition for operational management of the business
significantly higher than Traditionalists and Boomers. Arsenault (2004) concluded that
generational differences were a legitimate diversity issue, and leaders need to develop a
unique style that translates into a mind-set of how people lead and want to be led.
Suckert’s (2008) study compared the values of principals by generational cohort
in the Minnesota school system that included Traditionalists, Boomers, Gen X, and
Millennials. The researcher compared the values based on generational cohort,
administrative level, and sex. Of the 738 participants, 1% were Traditionalists, 56% were
Boomers, 43% were Gen X, and there were no Millennials. The descriptive data indicated
that the principals’ average age was 44 with an average of 11 years of administrative
experience and approximately four job changes. The findings were that there was no
significant difference between the generations indicating that values and responsibility
were regarded the same within the organization.
Lancaster and Stillman (2005) created a company in 1997 called Bridge Works
whose mission was to bridge the generation gap by understanding the unique perspectives
of each generation. They began by conducting small-scale surveys to understand how
24
companies were recruiting, retaining, and managing their workforce. By 2001 the Bridge
Works survey was conducted on a large-scale online format that included over 400
participants from various industries across the United States. The intent of the survey was
to quantify the generational differences of beliefs and behaviors in the workplace. They
found that 65% of the participants agreed that generational gaps hindered work
productivity; 30% of Boomers and 60% of Gen X indicated their generation was viewed
negatively; Millennals noted that safety in the workplace was their primary concern; 33%
stated that they were offended by someone from another generation; Boomers’ reason for
remaining on the job was to make a difference where Gen X was autonomy; all
generations chose Gen X for having the best work-life balance; over half of the
participants stated that there were issues of fairness in regards to compensation and
benefits.
Burke (2004), a survey analyst for the Society for Human Resource Management
(SHRM), conducted a survey on generational differences in the workplace. The online
survey created by SHRM explored the frequency and severity of intergenerational
conflicts among the Boomers, Gen X, and Millennials. Over 2000 requests were sent out
to SHRM employees. Responses were received from 258 participants. The results
indicated that the most common areas of conflict involved work ethics, organizational
hierarchy, and change. Burke concluded that training leaders on collaborative decision-
making and stating clear policies and expectations for their organizations will resolve
intergenerational conflicts. The survey analyst also noted that generational differences
were minor stemming from organizational expectations of policies and procedures such
as work hours and acceptable dress.

25
Ranstad (2008) commissioned Harris Interactive to take an in-depth look at how
employers were cultivating the organizational culture and building relationships with
their employees. This report indicated that gaps exist in employees’ perception of what is
important in their ideal leader’s practices as opposed to their current leader’s practices.
The gap in leadership practices as perceived by each generation idealistic verses current
practices (Table 2). The perception from Boomers is that they are micromanaged by
leaders. Gen X complained their ideas are generally ignored by leaders. Millennials noted
that they are not respected by their leaders. The study concluded that leaders can manage
generational differences and increase intergenerational productivity through a
collaborative teamwork culture with a fusion of knowledge, experience, and
communication.
Generational Cohort
The terminology of a “generation” or a “cohort” is a group that has similar span
of birth years, age location, and shared life events at critical developmental stages
(Kupperschmidt, 2000). Crumpacker and Crumpacker (2007) distinguished the start of a
new generation by birth rates increasing and remaining steady until the birth rates begin
to decline marking the end of a generation. In the 20th
century American society has
attempted to label these generations to identify those cohorts that share distinct set of
beliefs and attitudes growing up during a particular period in history (Strauss & Howe,
1991).
The cohorts relevant to this study are the Boomers, Gen X, and Millennials.
Values differ among the three generations with unique perspectives on ethics, work, and

26
Table 2
Perceived Leadership Practices
Practice Generation Idealistic (%) Current (%)
Seeks input from employees Boomers 72 30
Gen X 67 27
Millennials 54 26
Leadership support Boomers 69 25
Gen X 65 26
Millennials 59 26
Respect from Leadership Boomers 56 34
Gen X 46 27
Millennials 38 30
Leader seeks input Boomers 60 25
Gen X 52 28
Millennials 45 20
Promotes professional growth Boomers 58 28
Gen X 55 28
Millennials 51 32
Decision-making Boomers 56 34
Gen X 49 29
Millennials 38 30
Open and visible Boomers 41 18
Gen X 41 17
Millennials 34 16
Leadership opportunities Boomers 57 20
Gen X 50 22
Millennials 47 21
Policies and procedures Boomers 51 24
Gen X 50 24
Millennials 42 19
Handling business Boomers 64 28
Gen X 54 26
Millennials 51 26

27
management (Zemke et al., 2000). Based on these unique perspectives, conflicts can arise
(Strauss & Howe, 1991). The employee relationships in an organization can become toxic
if the conflicts arise between the generations. The focal points of an organization that can
be affected by worker values and attitudes are promotions, rewards, and sustainability
(Crumpacker & Crumpacker, 2007).
Boomers
Sociologists have defined the Boomers, as those born between 1946 and 1964
(Zemke et al., 2000). This generational cohort was the largest generation in U.S. history.
Approximately 77 million people were born between 1946 and 1965 which represents
approximately 29% of the United States population (United States Census Bureau, n.d.).
The values for the Boomers were dedication to work ethic and worth ethic in their careers
(Zemke et al., 2000). Being subjected to large classrooms, large families, and the
individuals competing for athletic positions, the Boomers became extremely competitive
in their work lives. This generational cohort learned to work harder and spend more hours
at work and became conditioned to being rewarded for their extra efforts (Culp, 2011).
Hence, the word “workaholic” was coined to describe this generation’s work habits.
From their perspective, it was a philosophy of live to work. Boomers did not see much in
life beyond work.
Boomers believe when they enter the workforce they would stay with a company
until retirement. During their work life monetary rewards were more important that free
time. They shared the values of their parents in that they were loyal to their companies
and placed high respect for title and rank. Boomers believed that the dedication to hard
work and sacrifice is a reasonable price to pay for success. This was a generation that

28
believed in job security. The Boomers saw job security as a company where one could
stay for a long time, work up the ladder, and become vested with tenure (Lancaster &
Stillman, 2005).
Gen X
Gen X is the generation with a birth span from 1964 to 1980 and is a relatively
small generational cohort (United States Census Bureau, n.d.). Part of the reason for this
small cohort was that mothers of Gen X delayed childbirth in pursuit of a career
(Crumpacker & Crumpacker, 2007). Babies and children were left alone at home or sent
off to daycare creating a parent-free childhood which made Gen X feel neglected and
attention deprived.
The members of this generation believe they have little job security and a lower
sense of company loyalty. Gen X has a desire for a work-life balance; they are driven by
their accomplishments not by a time clock (Joiner, 2000). Gen X are strongly
individually motivated by personal benefits (Culp, 2011). With a smaller family unit, and
spending much of their time alone, Gen X is not motivated by working with other people.
Gen X is noted as being extremely adaptable to change and prefers a flexible
schedule, and they tend to be more process-oriented than result-oriented (Zemke et al.,
2000). Whereas the Boomers worked harder, Gen X was apt to work smarter. Smarter
often times meant marketing themselves for a new career as companies reacted to
downturns in the economy by downsizing, rightsizing, and layoffs. Companies began to
discontinue retirement plans for new workers, and healthcare costs were passed on to the
worker. The result was a generation where company loyalty did not matter; they were on

29
their own to secure their future for retirement. Gen X learned that in the workplace there
was no guarantee of survival (Zemke et al., 2000).
Millennials
Strauss and Howe (1991) adopted the identification Millennials to describe the
generation with birth years from 1981 to 2000. Millennials, approximately 78 million, are
the largest generational cohort since the Boomers according to the U.S. Census Bureau.
Parents and teachers taught this generation to set goals and aim high (Papp, 2007). As a
whole this is the most educated generation. However, with the rising cost of education,
parents are investing a considerable amount in this generation’s education; any grade
below an A is unacceptable (Elmore, 2010). No longer is the A for achieving, it is for
attempting.
For the Millennials competition is deemed unhealthy. They were nurtured and
coddled by their parents taking care of them each step of the way (Culp, 2011). Their
childhood was very structured with multiple sports activities, recitals, and enrichment
programs. The Millennials have been identified as the most techno savvy generation.
Their technical skills grew at an earlier age than any other generations. Millennials are
connected 24/7 to each other through social networks, cell phones, and the internet.
According to Shaw (2009) an educational shift has occurred for this generation from a
behaviorist paradigm of direct instruction, memorization, and textbooks to a more
constructivist paradigm that is collaborative, global, and interactive.
In the workplace Millennials tend to be goal-oriented and expect results
instantaneously. This generation has little or no experience with failure and high
expectations to the speed of their climb up the corporate ladder (Elmore, 2010). Co-
30
workers complain about the lack of independence of the Millennials who worry about
making a mistake or the fear of failure (Lancaster & Stillman, 2005).
Summary
Today’s workforce environment in education is changing rapidly where leaders
need to consider the multigenerational profile inside their schools to prepare for and
manage the challenges ahead. Bridging the gap of a multigenerational organization will
lead to improved employee satisfaction. Zemke et al. (2000) contended that an
organization can be a positive, productive, and satisfying place for employees if
leadership is willing to model the way.
Themes presented in Chapter II support and justify the need for additional
research of generational differences within organizational cultures that are affected by
leadership practices in education. While research exists on generational differences in
businesses in the public and private sector, a gap of research exists on generational
differences in public education. The research indicates that differences exist between the
generations which can lead to conflict and loss of organizational effectiveness. By
understanding the interactions of each generation, organizational culture, and leadership
practices further research can continue to identify and clarify the factors that increase
organizational performance.
The current study will add to the current gap in research by creating a foundation
for the three generations in education such that future research will have a more complete
picture of organizational culture and leadership practices in a multigenerational
workforce. The review of literature validated the diversity issue within an organization
that stems from generational differences. Each generation has a unique mindset with
31
different preferences, beliefs, and attitudes toward the organization and the leader. These
differences determine how a person from a generation leads or how he or she wants to be
led. The generational cohort in an organization should be recognized by their leader as
integral parts of the diversity mix just as are sex, religion, and race. The objective for
leaders is to become sensitive to these generational differences and transform them into
strengths. Zemke et al. (2000) suggested that listening and questioning skills need to be
developed by leaders that target potential conflicts before they happen.
In previous generational studies as indicated in Chapter II various survey
instruments have been utilized by researchers. One survey instrument used by researchers
was the Kouzes and Posner Leadership Practices Inventory (Kouzes & Posner, 2002).
Others chose an instrument created by the Pew Research Center or from Bridge Works,
and a few researchers chose to create their own survey instruments. For the purposes of
this study these survey instruments were considered by the researcher; however, were
rejected as they were tailored to business and industry, not education. The instrument
utilized for this study was the School Improvement Opinion Survey (Georgia Department
of Education, n.d.).

32
CHAPTER III: METHODOLOGY
The purpose of this quantitative descriptive research was to assess the perceptions
of high school teachers from three generational perspectives on their principal’s
leadership practices. The generation cohorts– Boomers, Gen X, and Millennials– are
from 13 high schools in a Georgia metro-county school district. The research utilized the
2013 data from the 75 question School Improvement Opinion Survey that the school
adopted from the Georgia Department of Education. The district has distributed the
survey annually since it’s’ adoption to all employees in each school to rank the
effectiveness of the principal’s performance in eight dimensions: assessment, curriculum,
instruction, leadership, planning and organization, professional learning, school–family–
community, and school culture. This chapter details the procedures for conducting this
study and presents the research questions and hypotheses, research design, sample, the 75
principal practices variables, measurement instruments, including reliability and validity
estimates, procedures for data collection and analysis, limitations, and ethical
considerations.
Research Questions and Hypothesis
Two sets research questions and associated null and alternative hypotheses guided
the research based on the generational groups of teachers’ perception of their principal’s–
Boomer and Gen X– leadership practices.

33
1. Are there statistically significant differences among the means of the three
generations of teachers’ perceptions of the eight dimensions of principal practices
on the School Improvement Opinion Survey for schools with a Boomer principal?
H1ₒ: There are no statistically significant differences among the means of
the three generations of teachers’ perceptions of the eight principal
practices on the School Improvement Opinion Survey for schools with a
Boomer principal.
H1ₐ: There are statistically significant differences among the means of the
three generations of teachers’ perceptions of the eight principal practices
on the School Improvement Opinion Survey for schools with a Boomer
principal.
If H1o is rejected indicating that there is a statistically significant difference
among the means for the three groups of teachers for a dimension, then the following
additional research hypotheses will be answered for each of the items that comprise the
statistically significant dimension:
H1oi: There are no statistically significant differences among the means of
the three generations of teachers’ perceptions of each item which comprise
the dimension of the principal practices on the School Improvement
Opinion Survey for schools with a Boomer principal.
H1ai: There is a statistically significant difference among the means of the
three generations of teachers’ perceptions of each item which comprise the
dimension of the principal practices on the School Improvement Opinion
Survey for schools with a Boomer principal.

34
2. Are there statistically significant differences among the means of the three
generations of teachers’ perceptions of the eight dimensions of principal practices
on the School Improvement Opinion Survey for schools with a Gen X principal?
H2ₒ: There are no statistically significant differences among the means of
the three generations of teachers’ perceptions of the eight principal
practices on the School Improvement Opinion Survey for schools with a
Gen X principal.
H2ₐ: There are statistically significant differences among the means of the
three generations of teachers’ perceptions of the eight principal practices
on the School Improvement Opinion Survey for schools with a Gen X
principal.
If H2o is rejected indicating that there is a statistically significant difference
among the means for the three groups of teachers for a dimension, then the following
additional research hypotheses will be answered for each of the items that comprise the
statistically significant dimension:
H1oi: There are no statistically significant differences among the means of
the three generations of teachers’ perceptions of each item which comprise
the dimension of the principal practices on the School Improvement
Opinion Survey for schools with a Gen X principal.
H1ai: There is a statistically significant difference among the means of the
three generations of teachers’ perceptions of each item which comprise the
dimension of the principal practices on the School Improvement Opinion
Survey for schools with a Gen X principal.
35
Research Design
This study examined three existing generational groups of teachers for each group
of principal. The analysis consisted of examining the means of perceptions among the
three groups of teachers for each group of principal. For the purposes of this study one
pre-existing group of teachers– Boomers, Gen X, and Millennials– are led by Boomer
principals; the other group of teachers– Boomers, Gen X, and Millennials– are led by
Gen X principals. There were no Millennial principals in this study because these
individuals have not yet achieved sufficient experience to hold a position of a high school
principal.
Creswell (2008) indicated that utilizing a survey design provides a quantitative
description of teacher’s perceptions of leadership practices. A descriptive design allows
researchers to summarize data, analyze the characteristics of a selected sample, and
present a statistically accurate representation of the phenomenon (Leedy & Ormrod,
2001). This study attempted to determine if generational differences exist among teachers
on their perceptions of Boomer and Gen X principals’ leadership practices.
Sample
The sample from one the largest school districts in the state of Georgia consisted
of 16 high schools. Of these, 13 principals (81%) elected to allow their schools to
participate. These 13 schools comprised the sample for this study. Of the 13 high schools,
five were identified to be led by Boomer principals, and eight high schools were led by
Gen X principals. The teachers identified in this study were: (a) employed by the
participating school district, (b) aged between 50 and 70 placed in the Boomers cohort,
(c) aged between 35 and 49 placed in the Gen X cohort, and (d) aged between 22 and 34

36
placed in the Millennial cohort. The principals identified in this study were: (a) employed
by the participating school district, (b) aged between 50 and 70 placed in the Boomers
cohort, and (c) aged between 35 and 49 placed in the Gen X cohort. Tables 3 to 8 provide
teacher demographics, teacher generation, and student demographics for each of five
schools for Boomer principals (HSB1-HSB5), for each of the eight schools for Gen X
principals (HSX1-HSX8). Even though student demographics are not a part of the study,
it could be an indicator of teacher’s perception or a generational school preference.
The sample size of the 13 high schools was 1615 teachers with 642 teachers being
led by Boomer principals and 973 teachers being led by Gen X principals. The
racial/ethnic composition of the teachers under the Boomer principals were 99 Black, 503
White, 25 Hispanic, 5 Asian, and 10 Multi-racial. The racial/ethnic composition of
teacher under Gen X principals were 119 Black, 794 White, 42 Hispanic, 15 Asian, and
11 Multi-racial.
The generational composition of teachers in the 13 high schools were 483
Boomers, 691 Gen X, and 441 Millennials. The five high schools led by Boomer
principals the generational composition of teachers consisted of 175 Boomers, 283 Gen
X, and 184 Millennial. The eight high schools led by Gen X principals the generational
composition of teachers consisted of 304 Boomers, 411 Gen X, and 258 Millennials.
Figure 2 illustrates flow of the sample for this research guided by the two sets research
questions and associated null and alternative hypotheses based on the generational groups
of teachers’ perception of their principal’s–Boomer and Gen X– leadership practices.
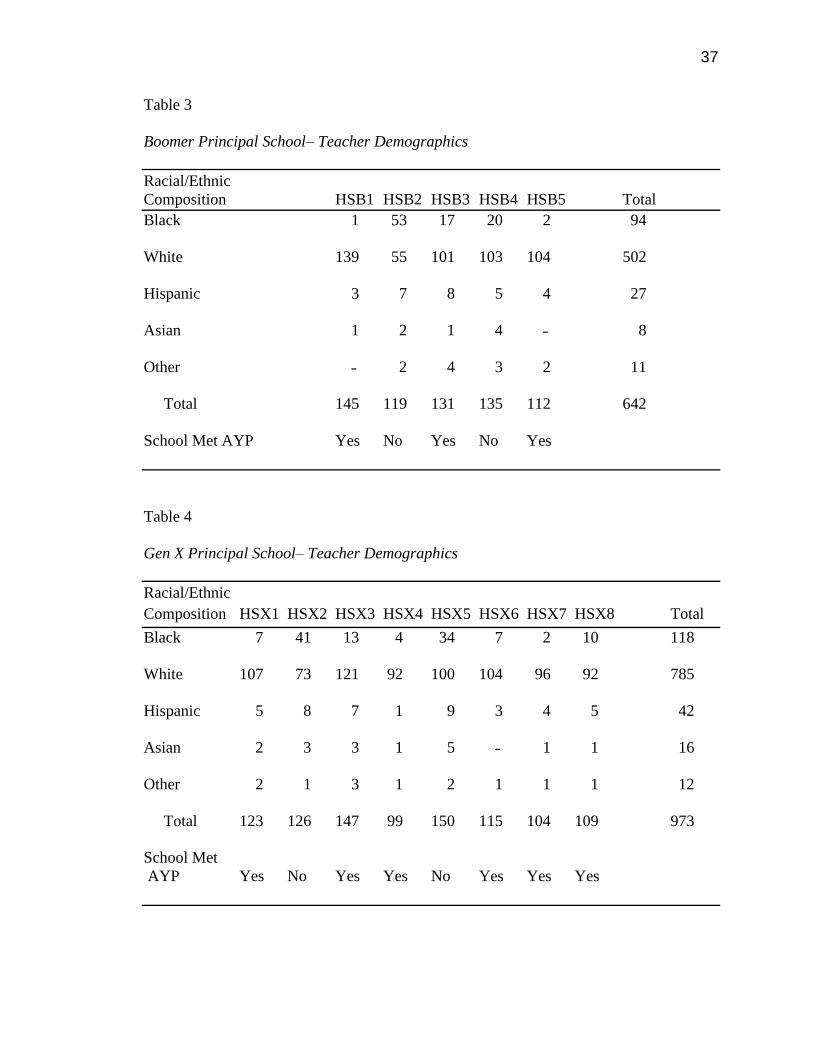
37
Table 3
Boomer Principal School– Teacher Demographics
Racial/Ethnic
Composition HSB1 HSB2 HSB3 HSB4 HSB5 Total
Black 1 53 17 20 2 94
White 139 55 101 103 104 502
Hispanic 3 7 8 5 4 27
Asian 1 2 1 4 ˗ 8
Other ˗ 2 4 3 2 11
Total 145 119 131 135 112 642
School Met AYP Yes No Yes No Yes
Table 4
Gen X Principal School– Teacher Demographics
Racial/Ethnic
Composition HSX1 HSX2 HSX3 HSX4 HSX5 HSX6 HSX7 HSX8 Total
Black 7 41 13 4 34 7 2 10 118
White 107 73 121 92 100 104 96 92 785
Hispanic 5 8 7 1 9 3 4 5 42
Asian 2 3 3 1 5 ˗ 1 1 16
Other 2 1 3 1 2 1 1 1 12
Total 123 126 147 99 150 115 104 109 973
School Met
AYP Yes No Yes Yes No Yes Yes Yes

38
Table 5
Boomer Principal School– Teacher Generation
Sample HSB1 HSB2 HSB3 HSB4 HSB5 Total
Boomers 49 21 48 30 27 175
Gen X 64 48 53 59 59 283
Millennials 32 50 30 46 26 184
Total 145 119 131 135 112 642
Table 6
Gen X Principal School– Teacher Generation
Sample HSX1 HSX2 HSX3 HSX4 HSX5 HSX6 HSX7 HSX8 Total
Boomers 50 36 44 24 41 36 38 35 304
Gen X 46 48 66 40 65 56 40 50 411
Millennials 27 42 37 35 44 23 26 24 258
Total 123 126 147 99 150 115 104 109 973
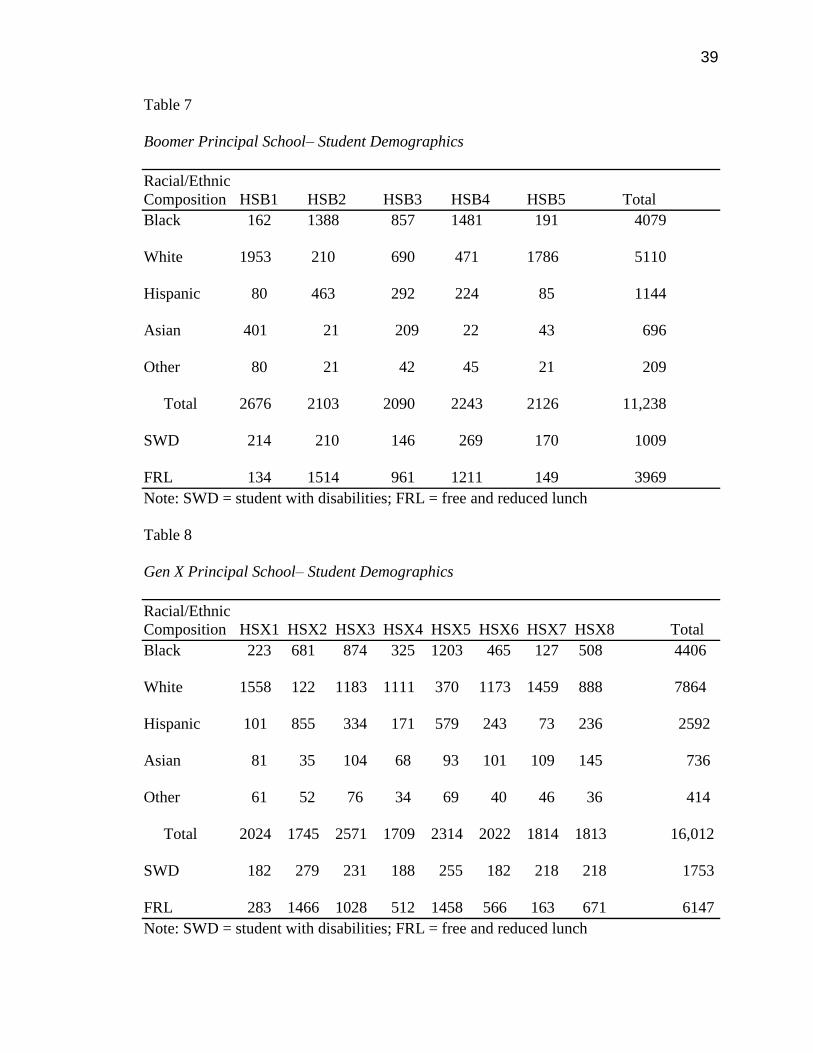
39
Table 7
Boomer Principal School– Student Demographics
Racial/Ethnic
Composition HSB1 HSB2 HSB3 HSB4 HSB5 Total
Black 162 1388 857 1481 191 4079
White 1953 210 690 471 1786 5110
Hispanic 80 463 292 224 85 1144
Asian 401 21 209 22 43 696
Other 80 21 42 45 21 209
Total 2676 2103 2090 2243 2126 11,238
SWD 214 210 146 269 170 1009
FRL 134 1514 961 1211 149 3969
Note: SWD = student with disabilities; FRL = free and reduced lunch
Table 8
Gen X Principal School– Student Demographics
Racial/Ethnic
Composition HSX1 HSX2 HSX3 HSX4 HSX5 HSX6 HSX7 HSX8 Total
Black 223 681 874 325 1203 465 127 508 4406
White 1558 122 1183 1111 370 1173 1459 888 7864
Hispanic 101 855 334 171 579 243 73 236 2592
Asian 81 35 104 68 93 101 109 145 736
Other 61 52 76 34 69 40 46 36 414
Total 2024 1745 2571 1709 2314 2022 1814 1813 16,012
SWD 182 279 231 188 255 182 218 218 1753
FRL 283 1466 1028 512 1458 566 163 671 6147
Note: SWD = student with disabilities; FRL = free and reduced lunch
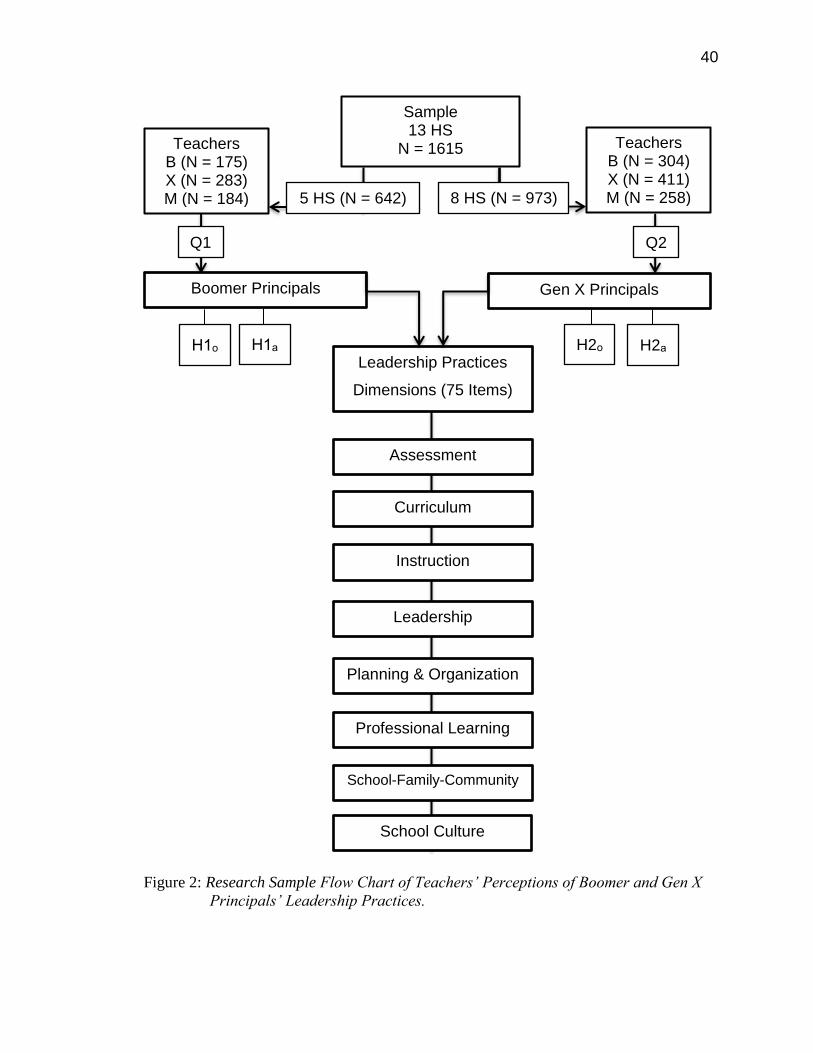
40
Figure 2: Research Sample Flow Chart of Teachers’ Perceptions of Boomer and Gen X
Principals’ Leadership Practices.
Sample 13 HS
N = 1615
5 HS (N = 642) 8 HS (N = 973)
Teachers B (N = 175) X (N = 283) M (N = 184)
Teachers B (N = 304) X (N = 411) M (N = 258)
Boomer Principals
Gen X Principals
Q1 Q2
Leadership Practices
Dimensions (75 Items)
H1ₒ H1ₐ H2ₐ H2ₒ
Assessment
Curriculum
Instruction
Leadership
Planning & Organization
School-Family-Community
School Culture
Professional Learning
41
Instrument
The School Improvement Opinion Survey (Appendix A) was created by the
Georgia Department of Education (GADOE) in 2006 as part of the School Keys data-
driven system (Georgia Department of Education, n.d.). The School Keys are the
foundation for Georgia’s comprehensive school improvement plan. The School Keys
describe what personnel in Georgia’s schools need to understand, know, and do. The
School Improvement Opinion Survey is a source of data collection for schools utilized as
part of their improvement initiatives (Georgia Department of Education, n.d.). The survey
as a part of the School Keys is intended to serve as a descriptor of effective practices in
the schools. The School Keys School Improvement Opinion Survey was aligned with the
meta-analysis research of Marzano, et al. (2003) that created eight broad strands:
curriculum; instruction; assessment; leadership; planning and organization; professional
learning; school-family-community; and school culture.
The survey serves as a tool for all schools in the state of Georgia. It was field-
tested in 2004, and was available for all schools in 2006. Content validity of the
instrument was established by review by an external third party. The Georgia Partnership
for Excellence in Education (GPEE) comprised of a panel of business and educational
leaders conducted an external validation study (Georgia Partnership for Excellence in
Education, 2010). The GPEE are advocates for policy that impact the improvement of
student achievement. They concluded utilizing the School Improvement Opinion survey
can guide schools for continuous improvement. GADOE encourages the schools to use
the tool to assist measuring the growth towards continuous improvement (Georgia
Department of Education, n.d.). While the instrument was developed by the GADOE and

42
widely used in Georgia school districts, consistent with the parameters federally approved
waiver for No Child Left Behind (2001) procedures, the developers did not publish
reliability estimates for the instrument, the dimensions, or the items.
To determine the answers to the research questions, this study used the existing
2013 data from the School Improvement Opinion Survey (2006). Teacher’s perceptions
of school improvement in this survey instrument are an indication of the principal’s
performance. As illustrated in Figure 3, research studies on principal’s leadership
practices provide a framework for understanding the effectiveness of the principal’s
direct and indirect leadership practices (Liethwood, et al., 2006, Marzono, et al., 2003,
Stronge, 2012).
The school district has used this survey tool since 2008 to assist principals in their
efforts for continuous school improvement. The survey instrument consists of eight
principal leadership dimensions that include: assessment, curriculum, instruction,
leadership, planning and organization, professional learning, school-family-community,
and school culture. There were a total of 75 items on the School Improvement Opinion
Survey (2006). Each participant responded to each item and used a 5-point Likert-type
scale that consisted of: (1) Consistently, (2) Often, (3) Infrequently, (4) Never, and (5) No
Basis to Judge to rank the each item. The items were categorized by the eight dimensions
(Table 9).
Data Collection
The survey was conducted online in the spring of 2013 by the school district as
part of its annual data collection to assess school improvement. The researcher first
sought approval of Kennesaw State University Institutional Review Board (IRB).
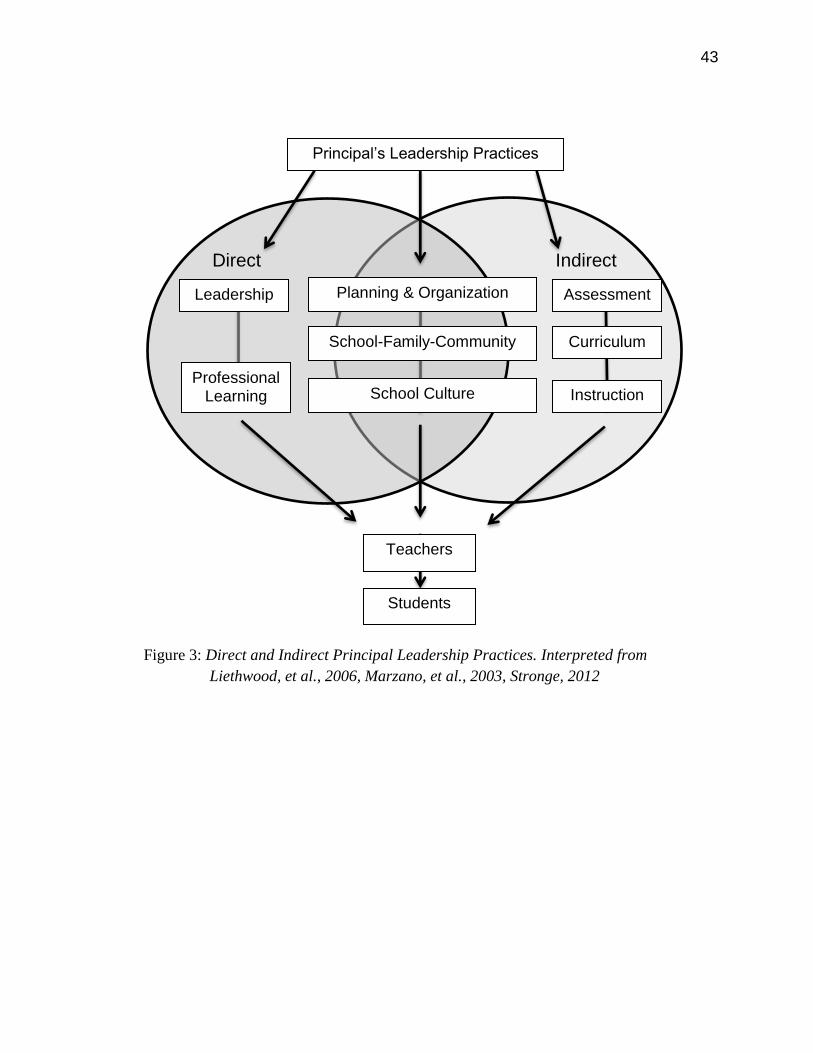
43
Figure 3: Direct and Indirect Principal Leadership Practices. Interpreted from
Liethwood, et al., 2006, Marzano, et al., 2003, Stronge, 2012
Direct Indirect
Principal’s Leadership Practices
School-Family-Community
Planning & Organization
School Culture
Teachers
Students
Professional Learning
Leadership
Curriculum
Assessment
Instruction

44
Table 9
Survey Items by Dimension
Dimension Items (Appendix A)
Assessment 1, 2, 3, 4, 5, 6, 7, 8, 9
Curriculum 10, 11, 12, 13, 14, 15, 16, 17
Instruction 18, 19, 20, 21, 22, 23, 24, 25, 26, 27, 28, 29, 30
Leadership 31, 32, 33, 34, 35, 36, 37, 38, 39, 40, 41, 42, 43, 44
Planning and Organization 45, 46, 47, 48, 49, 50, 51, 52
Professional Learning 53, 54, 55, 56, 57, 58, 59, 60, 61, 62, 63, 64, 65
School- Family- Community 66, 67, 68, 69, 70
School Culture 71, 72, 73, 74, 75
A waiver was granted since there was no direct contact with the sample. Next, the
researcher received permission from the district. This was conditional provided that
principals agreed to allow the researcher to use the school’s data for the study. A letter
(Appendix B) was sent to the high school principals requesting permission to use the
School Improvement Opinion Survey data for their school in this study. Two weeks after
the initial letter was sent, a second request (Appendix C) was sent to the principals who
had not responded. Of the 16 high schools in the district, 13 principals elected to
participate in this study. The empirical data requested were the participant’s years of
service, years at current school, and the school.
In order to determine the generation as defined by age the researcher requested
from the Human Resources Department the participating principal’s age with the teachers

45
years of service, years at the school, and the school. The survey answers were collected
by the school district, and were transferred into an Excel spread sheet by the District’s
Office of Accountability and analyzed using the Statistical Analysis Software (SAS)
package (SAS, 2013). These descriptors were cross-referenced with data requested by the
researcher from the district’s Human Resources department.
Data Analysis
Statistical techniques applied to this study for analysis required data to be
gathered in sufficient amounts to observe emerging trends and creating summaries
(Cooper & Schindler, 2010). Data were collected and analyzed using SAS. Analysis of
Variance (ANOVA) is the appropriate statistic for data responding to the research
questions and the null and alternative hypotheses. While many descriptive studies
exploring new ground often use an alpha level of significance of .10, the researcher used
an alpha level of significance of .05. The justification for a stringent significance level
was to lower the potential for error with a larger number of analyses, and it would
increase the reliability.
The analysis for each of the two research questions were composed of two
hierarchical steps. First, a composite total score for each of the eight dimensions was
created for each teacher by adding each teacher’s perceptual score for each of the items in
each dimension. This increases the stability of the estimate of the dimensions perception
and reduces the total number of analysis of variance from 75 for all items to 8 for the
dimensions. Second, the analysis of variance for any dimension results in a statistically
significance difference in the three means, analysis of variance and Tukey post hoc
analyses for individual items in the dimension was completed to identify those items
46
which contributed significantly to the overall dimension score. The 75 item School
Improvement Opinion Survey was scored and points were assigned based on the
following scale: (1) Consistently, (2) Often, (3) Infrequently, and (4) Never.
Limitations
The following are characteristics of the study which limited the interpretations of
results and/or generalizing conclusions from the results:
Since many of the items in the instrument are indirect measures of leadership
practices about which teachers may not be fully aware, teachers’ perception of
some of these items may not be valid.
This study did not examine the various subunits content areas of English, math,
science, social studies, fine arts, physical education, or career tech.
Other demographic informational relationships, such as sex, ethnicity, national
origin, years of teaching experience, or level of education exceeded the scope of
this research study.
Reliability about the instrument was not published.
Ethical Considerations
A waiver was granted from Kennesaw state University IRB since the study did
not directly involve the sample. The researcher completed the paperwork requesting
authorization from the school district to conduct the study and obtain the data. Once
approval was granted by the school district, a letter was sent to the principals (Appendix
B) requesting permission to utilize their school’s data. This study did not collect any data
directly from the participants. The study is in compliance with the researcher’s IRB and
the school district’s requirements for conducting research.
47
Summary
This chapter described the framework for a quantitative descriptive research by
presenting the procedures and methodology to assess the perceptions of high school
teachers from three generational perspectives on principal leadership practices. The
research questions and hypotheses were presented to guide the research based on the
generational groups of teachers’ perception of their principals–Boomer and Gen X-
leadership practices. The sample included the generation cohorts– Boomers, Gen X, and
Millennials– from 13 high schools in a Georgia metro-county school district. The
research utilized the data from the School Improvement Opinion Survey (2006) that
includes 75 principal performance predictor variables and criterion variables in eight
dimensions: assessment, curriculum, instruction, leadership, planning and organization,
professional learning, school–family–community, and school culture. This chapter also
detailed the procedures for conducting this study including the research design, the
measurement instruments, including validity estimates, procedures for data collection and
analysis, limitations, and ethical considerations. Reliability estimates were not published
by the creator of the instrument.

48
CHAPTER IV: FINDINGS
Chapter I presented the case of the existing gap in present research and the need
to provide the foundation for future research associated with the generational perspective
of teachers’ perceptions of principal leadership practices. Chapter II, the review of
literature, provided a perspective of leadership practices of leaders and the generational
workforce. The review of literature also suggested a gap might exist among teachers from
a generational perspective of the perception of principal leadership practices. Chapter III
presented the methodology associated with the research questions, hypothesis, and the
survey instrument. Chapter IV reports the findings from the data collection and the
statistical analyses along with a discussion of results and conclusions of findings.
The purpose of this quantitative study was to determine if there were any
statically significant perceptional differences evident among of the leadership practices of
Boomer and Gen X principals based on eight dimensions. The eight dimensions
examined were: assessment, curriculum, instruction, leadership, planning and
organization, professional learning, school-family-community, and school culture. The
present study focused on survey responses to 75 items on the School Improvement
Opinion Survey (2006) that was administered throughout the school district in the spring
of 2013 pertaining to principal, direct and indirect, leadership practices within the eight
dimensions. The results offer insights of the generational cohorts of teachers and their
perceptions of Boomer principals and Gen X principal’s leadership practices.

49
Data Description
The 75 item School Improvement Opinion Survey (2006) used a 5 point Likert
scale coded as (1) Consistently, (2) Often, (3) Infrequently, (4) Never, and (5) No Basis
to Judge. Consistency is identified by the effectiveness of the principal’s leadership
practices as perceived by teachers on each of the items. The items of leadership practices
were grouped by these dimensions: assessment (Items 1-9), curriculum (Items 10-17),
instruction (Items 18-30), leadership (Items 31-44), planning and organization (Items 45-
52), professional learning (Items 53-65), school-family-community (Items 66-70), and
school culture (Items 71-75). The researcher considered the participant’s response of “no
basis to judge” to any item the same as any item that was blank as a nonresponse.
Missing values or nonresponses in the survey data may lead to biases that do not
represent an accurate depiction of the sample (Rubin, 1987). To compensate for missing
values, Rubin’s (1987) multiple imputation strategy replaces each set of missing values
with plausible values. The researcher rejected 8% of the sample who responded “no basis
to judge” to all 75 items. To avoid incomplete cases of missing values for other
responders, the researcher utilized SAS’ multiple imputation procedure that incorporates
appropriate variability of the data set. The multiple imputation procedure involves
randomly generating a value based on the distribution of surrounding values. Using the
surrounding data values, SAS randomly generates a value that is tested multiple times to
see how well the value fits. SAS then selects the most likely observation for the missing
data. The incomplete cases of missing values were 7% of the data set. The data was first
analyzed by dimensions to determine if a statistically significant generational difference
of perception existed among the teachers of Boomer principals’ (Appendix D) and Gen X

50
principals’ (Appendix E) leadership practices. The dimensions with a statistical
significant difference (p < .05) were then analyzed by each item for the existence of a
significant generational difference in mean scores.
The descriptor categories for the respondents, provided by the school district’s
Accountability Department for the School Improvement Opinion Survey (2006), were the
respondent’s current school of employment, years of service at the school, and total years
of teaching experience. The demographic categories for the district’s high schools that
were provided by the Human Resource department served two purposes. First, the
descriptor information of the principals consisted of the principal’s current school
assignment and age. The second descriptor data set consisted of the teacher’s current
school of employment, years of service at the school, total years of teaching experience,
and age. To determine the respondents age, the researcher merged the data sets from the
Accountability and Human Resources department. The principals were grouped by the
generations Boomers or Gen X. The teachers were grouped by school and by generation.
The data were transferred to an Excel spreadsheet, and converted into statistical data for
analyses to address the two research questions and hypotheses. The Statistical Analysis
Software (SAS) package 9.3 analyzed and coded the data from the School Improvement
Opinion Survey (2006) (Appendix D). Two sets research questions and associated null
and alternative hypotheses guided the research based on the generational groups of
teachers’ perception of their principal’s–Boomer and Gen X– leadership practices.
1. Are there statistically significant differences among the means of the three
generations of teachers’ perceptions of the eight dimensions of principal practices
on the School Improvement Opinion Survey for schools with a Boomer principal?
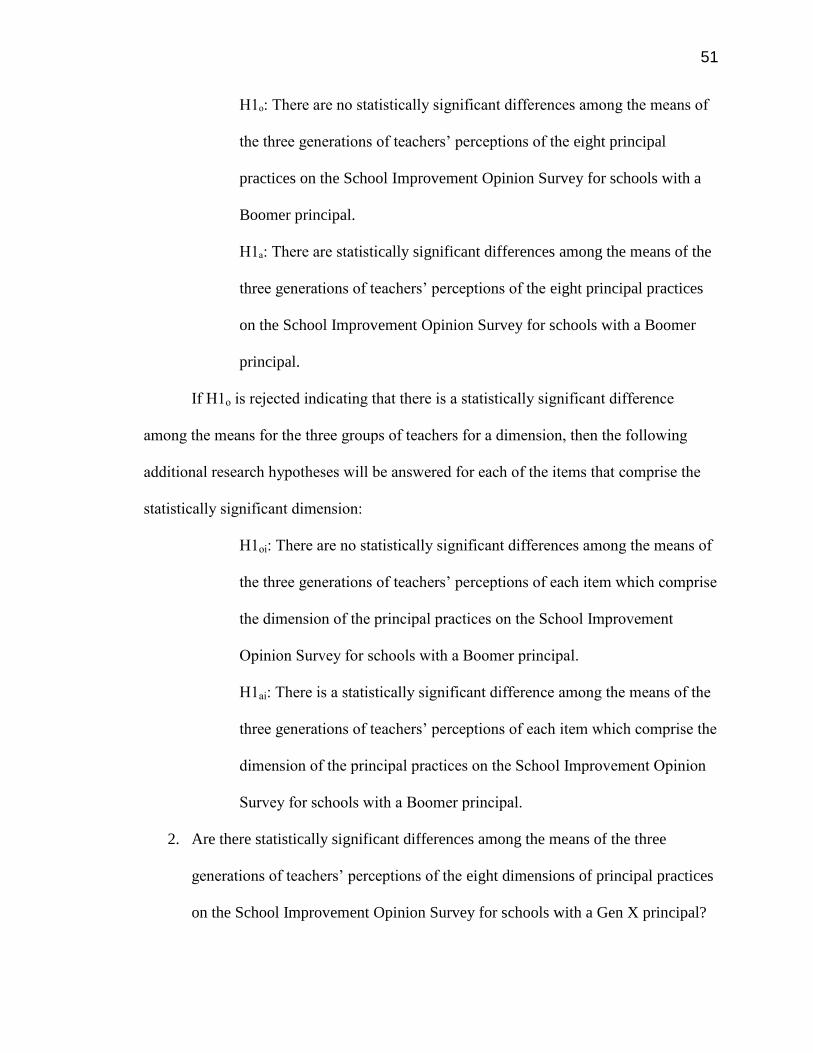
51
H1ₒ: There are no statistically significant differences among the means of
the three generations of teachers’ perceptions of the eight principal
practices on the School Improvement Opinion Survey for schools with a
Boomer principal.
H1ₐ: There are statistically significant differences among the means of the
three generations of teachers’ perceptions of the eight principal practices
on the School Improvement Opinion Survey for schools with a Boomer
principal.
If H1o is rejected indicating that there is a statistically significant difference
among the means for the three groups of teachers for a dimension, then the following
additional research hypotheses will be answered for each of the items that comprise the
statistically significant dimension:
H1oi: There are no statistically significant differences among the means of
the three generations of teachers’ perceptions of each item which comprise
the dimension of the principal practices on the School Improvement
Opinion Survey for schools with a Boomer principal.
H1ai: There is a statistically significant difference among the means of the
three generations of teachers’ perceptions of each item which comprise the
dimension of the principal practices on the School Improvement Opinion
Survey for schools with a Boomer principal.
2. Are there statistically significant differences among the means of the three
generations of teachers’ perceptions of the eight dimensions of principal practices
on the School Improvement Opinion Survey for schools with a Gen X principal?
52
H2ₒ: There are no statistically significant differences among the means of
the three generations of teachers’ perceptions of the eight principal
practices on the School Improvement Opinion Survey for schools with a
Gen X principal.
H2ₐ: There are statistically significant differences among the means of the
three generations of teachers’ perceptions of the eight principal practices
on the School Improvement Opinion Survey for schools with a Gen X
principal.
If H2o is rejected indicating that there is a statistically significant difference
among the means for the three groups of teachers for a dimension, then the following
additional research hypotheses will be answered for each of the items that comprise the
statistically significant dimension:
H1oi: There are no statistically significant differences among the means of
the three generations of teachers’ perceptions of each item which comprise
the dimension of the principal practices on the School Improvement
Opinion Survey for schools with a Gen X principal.
H1ai: There is a statistically significant difference among the means of the
three generations of teachers’ perceptions of each item which comprise the
dimension of the principal practices on the School Improvement Opinion
Survey for schools with a Gen X principal.
Data Analysis of the Sample Participation
Figure 4 illustrates the sample participation response. The response rate to the
survey was 74% (1193) of the sample from the 13 high schools (Tables 10-12).

53
Figure 4: Sample Participation Response Flow Chart
Sample Participation 13 HS
N = 1615 n = 1095
5 HS (n = 502) 8 HS (n = 593)
Teachers B (n = 162) X (n = 249) M (n = 91)
Teachers B (n = 221) X (n = 269) M (n = 103)
Boomer Principals
Gen X Principals
Q1 Q2
Leadership Practices
Dimensions (75 Items)
H1ₒ H1ₐ H2ₐ H2ₒ
Assessment
Curriculum
Instruction
Leadership
Planning & Organization
School-Family-Community
School Culture
Professional Learning

54
Table 10
Total Sample Teacher Participation
Principal
______________________________________
Boomer Gen X Total
Sample N n % N n % N n
Boomers 175 162 93 304 221 73 479 383
Gen X 283 249 88 411 269 65 694 518
Millennials 184 91 49 258 103 40 442 194
Total 642 502 78 973 593 61 1615 1095
Table 11
Boomer Principal School– Teacher Generation Participation
Generation HSB1 HSB2 HSB3 HSB4 HSB5 Total
Boomers 44 8 54 36 20 162
Gen X 48 20 59 62 60 249
Millennials 29 4 22 26 10 91
Total 121 32 135 124 90 502
Table 12
Gen X Principal School– Teacher Generation Participation
Generation HSX1 HSX2 HSX3 HSX4 HSX5 HSX6 HSX7 HSX8 Total
Boomers 32 36 18 32 20 24 31 28 221
Gen X 32 32 31 45 21 45 30 33 269
Millennials 15 14 10 11 7 14 18 14 103
Total 79 82 59 88 48 83 79 75 593

55
Of those who responded, 8% (98) were rejected as a nonresponse due to the respondents
answering “no basis to judge” to all 75 items, resulting in 68% (1095) who responded.
There were five high schools led by a Boomer principal (HSB1- HSB5) with a total
response rate of 78% (502) teachers: 162 Boomers, 249 Gen X, and 91 Millennials. Eight
high schools were led by a Gen X principal (HSX1 – HSX8) with a response rate of 61%
(593) teachers: 221 Boomers, 269 Gen X, and 103 Millennials.
Data Analysis of Teacher Perception of Boomer Principals
Appendix D summarizes the statistical analysis of variance performed and
computed by ANOVA on teacher’s perceptions of the leadership practices of Boomer
principal of the eight dimensions. It also includes analyses of variance on the items of the
dimensions where p ≤ .05. ANOVA displays a summary of the key components: mean
square, F value, and p value. Tukey’s HSD compared the mean scores, and summarized
the mean difference between the generational cohorts. Tables 13 and 14 provide a
summary of the sample by presenting the collected data’s mean, range, and standard
deviation of the dimensions that measured a statistically significant difference in the
mean scores. For the purposes of this study, only a summary of the dimensions and items
with statistically significant difference are shown in this section.
H1ₒ stated there are no statistically significant differences among the means of the
three generations of teachers’ perceptions of the eight principal practices on the School
Improvement Survey for schools with a Boomer principal. The analyses of the
dimensions of assessment, curriculum, instruction, leadership, planning and organization,
and professional learning resulted in the acceptance of the null hypothesis. Therefore,
there were no statistically significant generational differences among the teachers’
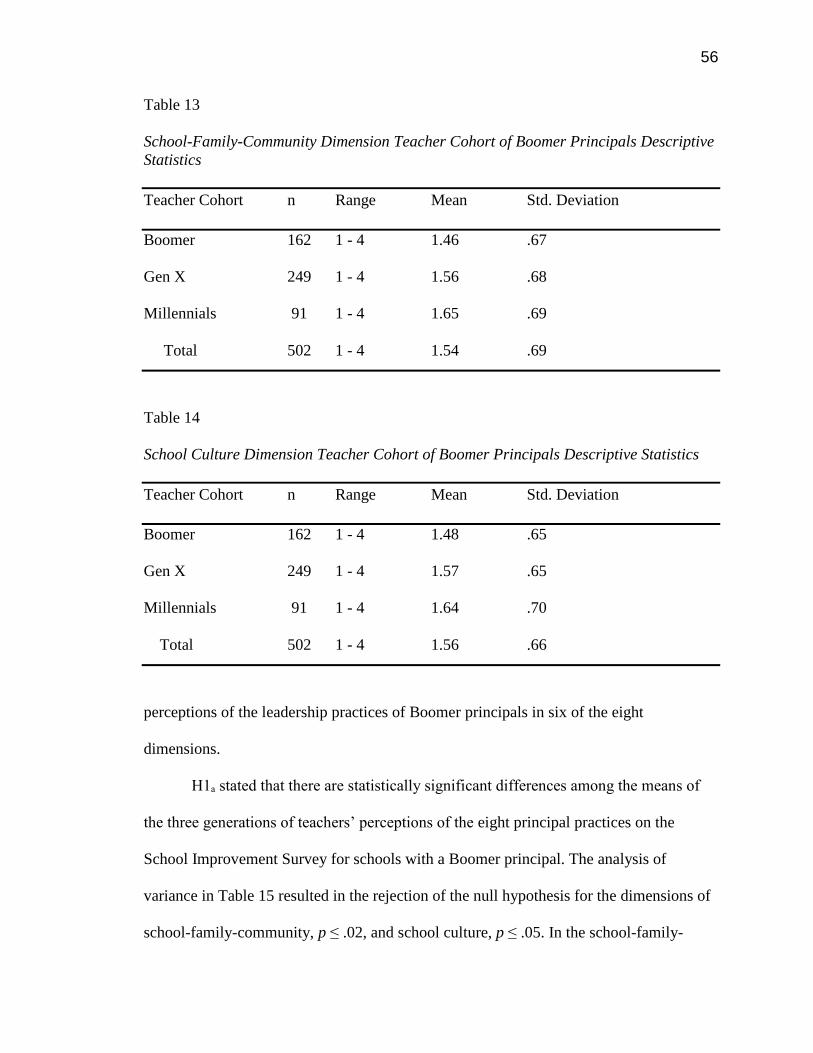
56
Table 13
School-Family-Community Dimension Teacher Cohort of Boomer Principals Descriptive
Statistics
Teacher Cohort n Range Mean Std. Deviation
Boomer 162 1 - 4 1.46 .67
Gen X 249 1 - 4 1.56 .68
Millennials 91 1 - 4 1.65 .69
Total 502 1 - 4 1.54 .69
Table 14
School Culture Dimension Teacher Cohort of Boomer Principals Descriptive Statistics
Teacher Cohort n Range Mean Std. Deviation
Boomer 162 1 - 4 1.48 .65
Gen X 249 1 - 4 1.57 .65
Millennials 91 1 - 4 1.64 .70
Total 502 1 - 4 1.56 .66
perceptions of the leadership practices of Boomer principals in six of the eight
dimensions.
H1ₐ stated that there are statistically significant differences among the means of
the three generations of teachers’ perceptions of the eight principal practices on the
School Improvement Survey for schools with a Boomer principal. The analysis of
variance in Table 15 resulted in the rejection of the null hypothesis for the dimensions of
school-family-community, p ≤ .02, and school culture, p ≤ .05. In the school-family-

57
Table 15
Dimensions with Statistically Significant Differences Analysis of Variance of Teacher
Perceptions of Boomer Principals
Dimension Mean Square F p-value
p ≤
School- Family-
Community 1.17 4.06 .02
School Culture .85 3.09 .05
community dimension 3 of the 5 items rejected the additional research null hypothesis.
There were 2 of the 5 items in the school culture dimension rejected the additional
research null hypothesis.
School-Family-Community
The analyses of variance in Appendix D for the school-family-community
dimension resulted in the acceptance of the additional research null hypothesis for items
68 and 70. The analyses of variance and the post hoc analysis (Table 16) using Tukey’s
HSD, resulted in the rejection of the additional research null hypothesis indicating that
the mean scores were statistically significantly different for items 66, 67, and 69. The
statistic and associated probability for item 66 was statistically significance, p ≤ .02. The
post hoc analyses indicated that there was a statistically significantly lower mean score
for Boomer teachers (M = 1.46, SD = .67) than Millennial teachers (M = 1.65, SD = .69).
The statistic and associated probability for item 67 was statistically significance, p ≤ .01.
Post hoc analyses indicated there was a statistically significantly lower mean score for
Gen X teachers (M = 1.56, SD = .68) and Boomer teachers (M = 1.46, SD = .67) than
Millennial teachers (M = 1.65, SD = .69). The statistic and associated probability for item
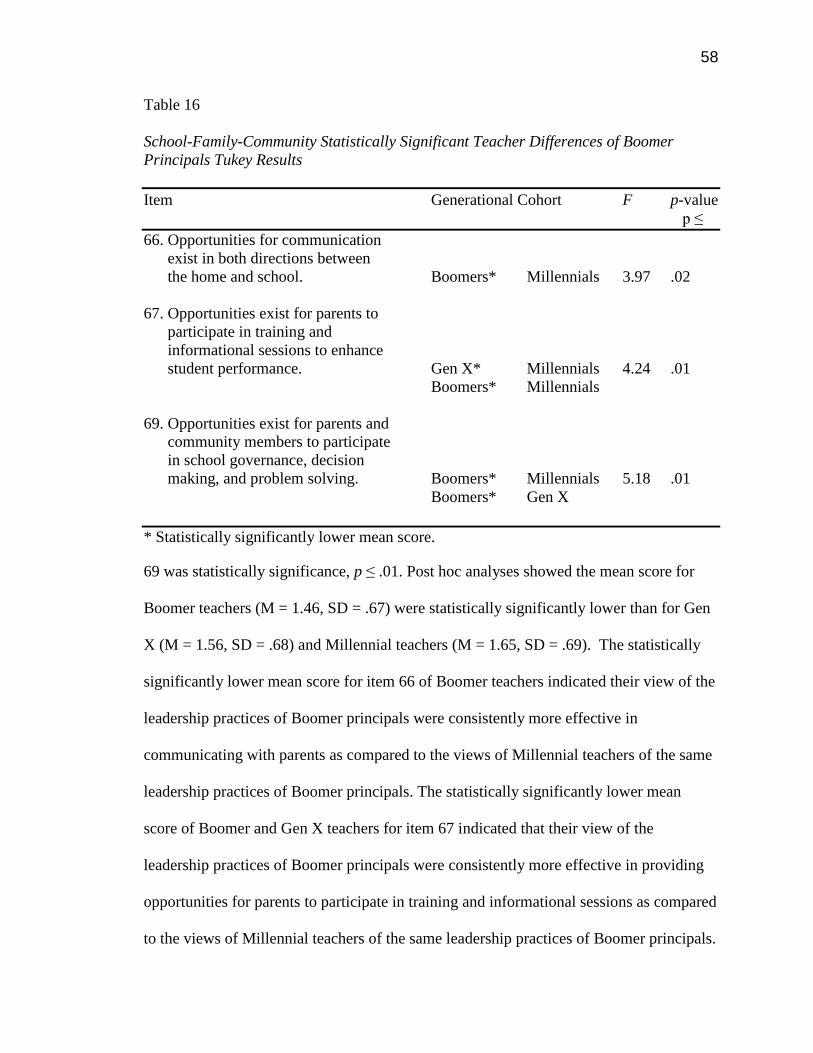
58
Table 16
School-Family-Community Statistically Significant Teacher Differences of Boomer
Principals Tukey Results
Item Generational Cohort F p-value
p ≤
66. Opportunities for communication
exist in both directions between
the home and school. Boomers* Millennials 3.97 .02
67. Opportunities exist for parents to
participate in training and
informational sessions to enhance
student performance. Gen X* Millennials 4.24 .01
Boomers* Millennials
69. Opportunities exist for parents and
community members to participate
in school governance, decision
making, and problem solving. Boomers* Millennials 5.18 .01
Boomers* Gen X
* Statistically significantly lower mean score.
69 was statistically significance, p ≤ .01. Post hoc analyses showed the mean score for
Boomer teachers (M = 1.46, SD = .67) were statistically significantly lower than for Gen
X (M = 1.56, SD = .68) and Millennial teachers (M = 1.65, SD = .69). The statistically
significantly lower mean score for item 66 of Boomer teachers indicated their view of the
leadership practices of Boomer principals were consistently more effective in
communicating with parents as compared to the views of Millennial teachers of the same
leadership practices of Boomer principals. The statistically significantly lower mean
score of Boomer and Gen X teachers for item 67 indicated that their view of the
leadership practices of Boomer principals were consistently more effective in providing
opportunities for parents to participate in training and informational sessions as compared
to the views of Millennial teachers of the same leadership practices of Boomer principals.
59
The statistically significantly lower mean score of Boomer teachers for item 69 indicated
that their view of Boomer principals’ leadership practices were consistently more effect
in providing opportunities for parents and community members to participate in school
governance as compared to the views of Gen X or Millennial teachers of the same
leadership practices of Boomer principals.
School Culture
The analyses of variance in Appendix D for the school culture dimension resulted
in the acceptance of the additional research null hypothesis for items 72, 74, and 75. The
statistic and associated probability for items 71 and 73 resulted in the rejection of the
additional research null hypotheses. The analyses of variance and post hoc analysis using
Tukey’s HSD, indicated that the statistic and associated probability of the mean scores
were statistically significantly different for items 71, p ≤ .05, and item 73, p ≤ .03 (Table
17).The post hoc analyses indicated for items 71 and 73 that there was a statistically
significantly lower mean score for Boomer teachers (M = 1.48, SD = .65) than Gen X
teachers (M = 1.57, SD = .65) and Millennial teachers (M = 1.64, SD = .70).
The statistically significantly lower mean score of Boomer teachers for item 71
indicated their view of the leadership practices of Boomer principals were consistently
more effective in providing support to promote the academic achievement of all learners
as compared to the views of Millennial teachers of the same leadership practices of
Boomer principals. The statistically significantly lower men score of Boomer teachers for
item 73 indicated their view of the leadership practices of Boomer principals were
consistently more effective in school policies and practices that promote respect for
individual differences as compared to the view of Gen X teachers of the same leadership
practices of Boomer principals.

60
Table 17
School Culture Statistically Significant Teacher Differences of Boomer Principals Tukey
Results
Item Generational Cohort F p-value
p ≤
71. Our school provides support to
promote the academic achievement
of all learners. Boomers* Millennials 2.99 .05
73. School policies, practices, and
experiences promote respect
for individual differences. Boomers* Gen X 3.49 .03
* Denotes statistically significant lower mean score.
Data Analysis of Teacher Perception of Gen X Principals
Appendix E summarizes the statistical analyses of variance performed and
computed by ANOVA on the eight dimensions. It also includes analyses of variance on
the items of the dimensions where p ≤ .05. The ANOVA displays a summary of the key
components: mean square, F value, and p value. Tukey’s HSD compared the mean
scores, and summarized the mean difference between the generational cohorts. Tables 18
to 24 provide a summary of the sample by presenting the collected data’s mean, range,
and standard deviation of the dimensions that measured a statistically significant
difference in mean scores. For the purposes of this study only a summary of the
dimensions and items with statistically significant difference are shown in this section.
H2ₒ stated there are no statistically significant differences among the means of the
three generations of teachers’ perceptions of the eight principal practices on the School
Improvement Survey for schools with a Gen X principal. The analysis of variance for the

61
Table 18
Assessment Dimension Teacher Cohort of Gen X Principals Descriptive Statistics
Teacher Cohort n Range Mean Std. Deviation
Boomers 221 1 - 4 1.49 .63
Gen X 269 1 - 4 1.53 .62
Millennials 103 1 - 4 1.39 .58
Total 593 1 - 4 1.49 .62
Table 19
Curriculum Dimension Teacher Cohort of Gen X Principals Descriptive Statistics
Teacher Cohort n Range Mean Std. Deviation
Boomers 221 1 - 4 1.54 .68
Gen X 269 1 - 4 1.60 .67
Millennials 103 1 - 4 1.44 .62
Total 593 1 - 4 1.54 .67
Table 20
Instruction Dimension Teacher Cohort of Gen X Principals Descriptive Statistics
Teacher Cohort n Range Mean Std. Deviation
Boomers 221 1 - 4 1.64 .70
Gen X 269 1 - 4 1.68 .69
Millennials 103 1 - 4 1.48 .62
Total 593 1 - 4 1.63 .68
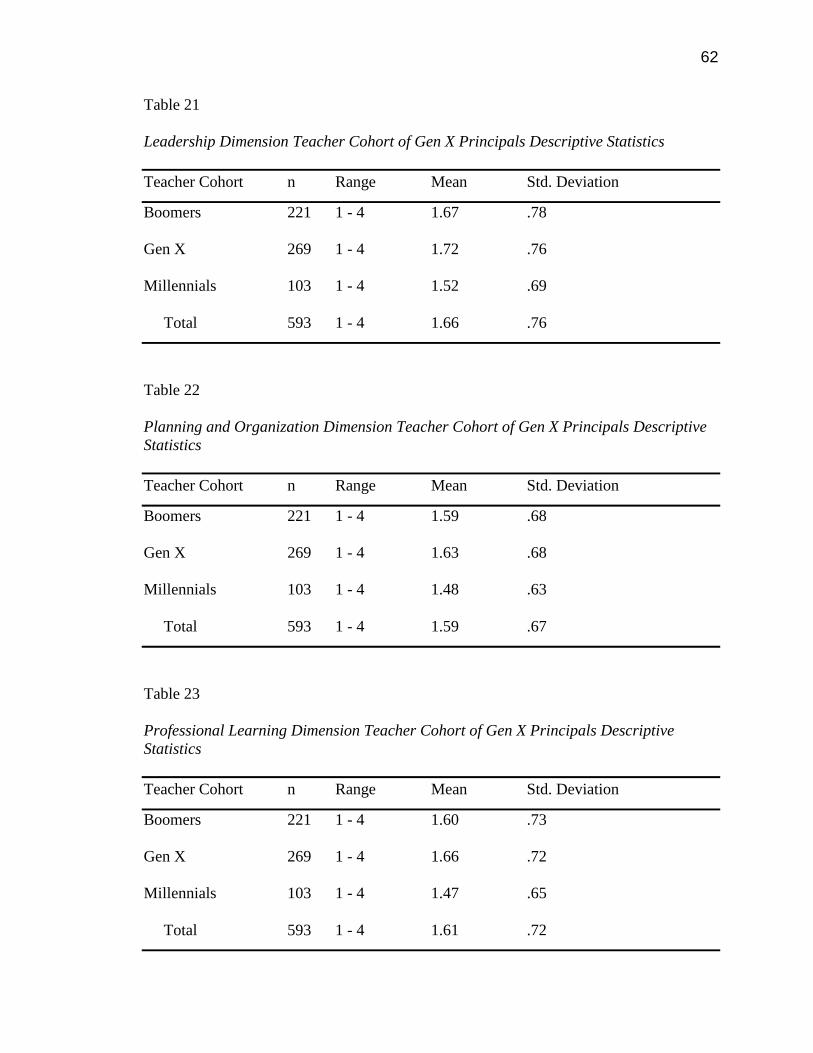
62
Table 21
Leadership Dimension Teacher Cohort of Gen X Principals Descriptive Statistics
Teacher Cohort n Range Mean Std. Deviation
Boomers 221 1 - 4 1.67 .78
Gen X 269 1 - 4 1.72 .76
Millennials 103 1 - 4 1.52 .69
Total 593 1 - 4 1.66 .76
Table 22
Planning and Organization Dimension Teacher Cohort of Gen X Principals Descriptive
Statistics
Teacher Cohort n Range Mean Std. Deviation
Boomers 221 1 - 4 1.59 .68
Gen X 269 1 - 4 1.63 .68
Millennials 103 1 - 4 1.48 .63
Total 593 1 - 4 1.59 .67
Table 23
Professional Learning Dimension Teacher Cohort of Gen X Principals Descriptive
Statistics
Teacher Cohort n Range Mean Std. Deviation
Boomers 221 1 - 4 1.60 .73
Gen X 269 1 - 4 1.66 .72
Millennials 103 1 - 4 1.47 .65
Total 593 1 - 4 1.61 .72
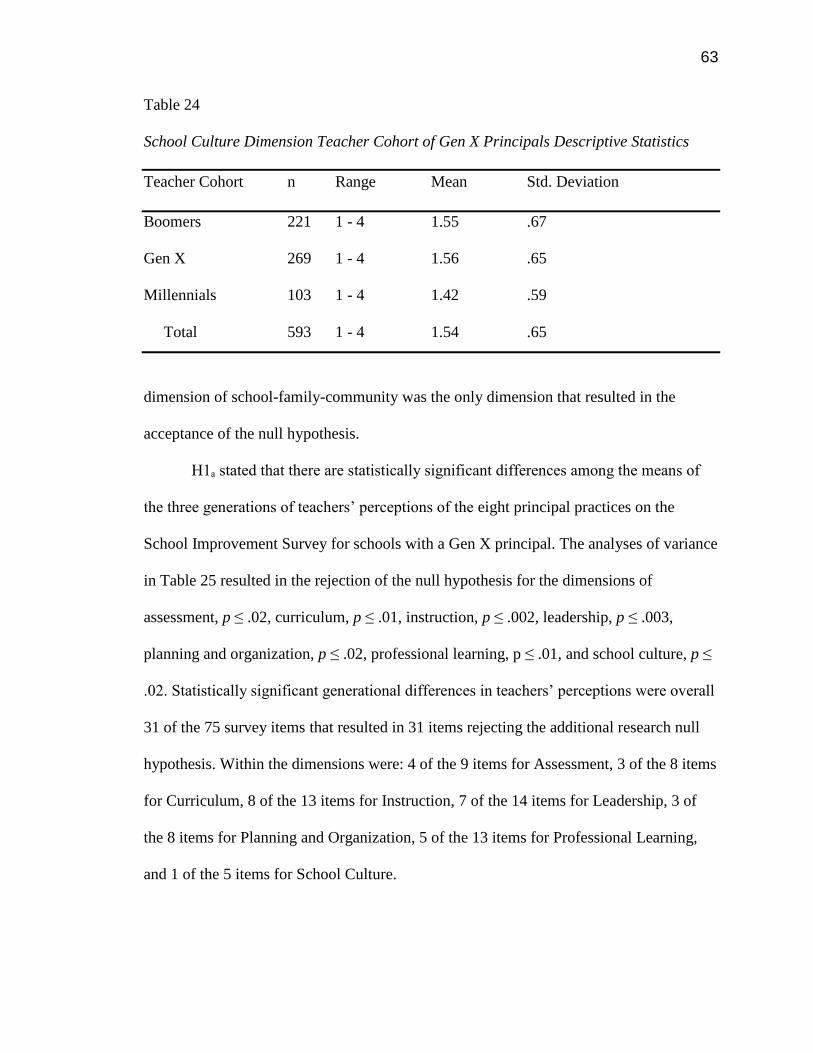
63
Table 24
School Culture Dimension Teacher Cohort of Gen X Principals Descriptive Statistics
Teacher Cohort n Range Mean Std. Deviation
Boomers 221 1 - 4 1.55 .67
Gen X 269 1 - 4 1.56 .65
Millennials 103 1 - 4 1.42 .59
Total 593 1 - 4 1.54 .65
dimension of school-family-community was the only dimension that resulted in the
acceptance of the null hypothesis.
H1ₐ stated that there are statistically significant differences among the means of
the three generations of teachers’ perceptions of the eight principal practices on the
School Improvement Survey for schools with a Gen X principal. The analyses of variance
in Table 25 resulted in the rejection of the null hypothesis for the dimensions of
assessment, p ≤ .02, curriculum, p ≤ .01, instruction, p ≤ .002, leadership, p ≤ .003,
planning and organization, p ≤ .02, professional learning, p ≤ .01, and school culture, p ≤
.02. Statistically significant generational differences in teachers’ perceptions were overall
31 of the 75 survey items that resulted in 31 items rejecting the additional research null
hypothesis. Within the dimensions were: 4 of the 9 items for Assessment, 3 of the 8 items
for Curriculum, 8 of the 13 items for Instruction, 7 of the 14 items for Leadership, 3 of
the 8 items for Planning and Organization, 5 of the 13 items for Professional Learning,
and 1 of the 5 items for School Culture.

64
Table 25
Dimensions with Statistically Significant Differences Analysis of Variance of Teacher
Perceptions of Gen X Principals
Dimension Mean Square F p-value
p ≤
Assessment .72 3.75 .02
Curriculum 1.00 4.45 .01
Instruction 1.48 6.51 .002
Leadership 1.45 5.96 .003
Planning and Organization 1.01 4.03 .02
Professional Learning 1.24 4.65 .01
School Culture 1.08 3.96 .02
Assessment
The analyses of variance in Appendix E for the assessment dimension resulted in
the acceptance of the additional research null hypothesis for items 1, 2, 3, 8 and 9. In
Table 26, the analyses of variance and the post hoc analyses using Tukey’s HSD, resulted
in the rejection of the additional research null hypothesis indicating that the statistic and
associated probability of the mean scores were statistically significantly different for item
4, p ≤.04, item 5, p ≤ .03, item 6, p ≤ .04, and item 7, p ≤ .04. The post hoc analyses
indicated that there was a statistically significantly lower mean score on items 4, 5, 6, and
7 for Millennial teachers (M = 1.39, SD = .58) than Gen X teachers (M = 1.53, SD = .62).
The statistically significantly lower mean scores of Millennial teachers for items
4, 5, and 7 indicated that their view of the leadership practices of Gen X principals were
consistently more effective having teachers use diagnostic assessments to evaluate
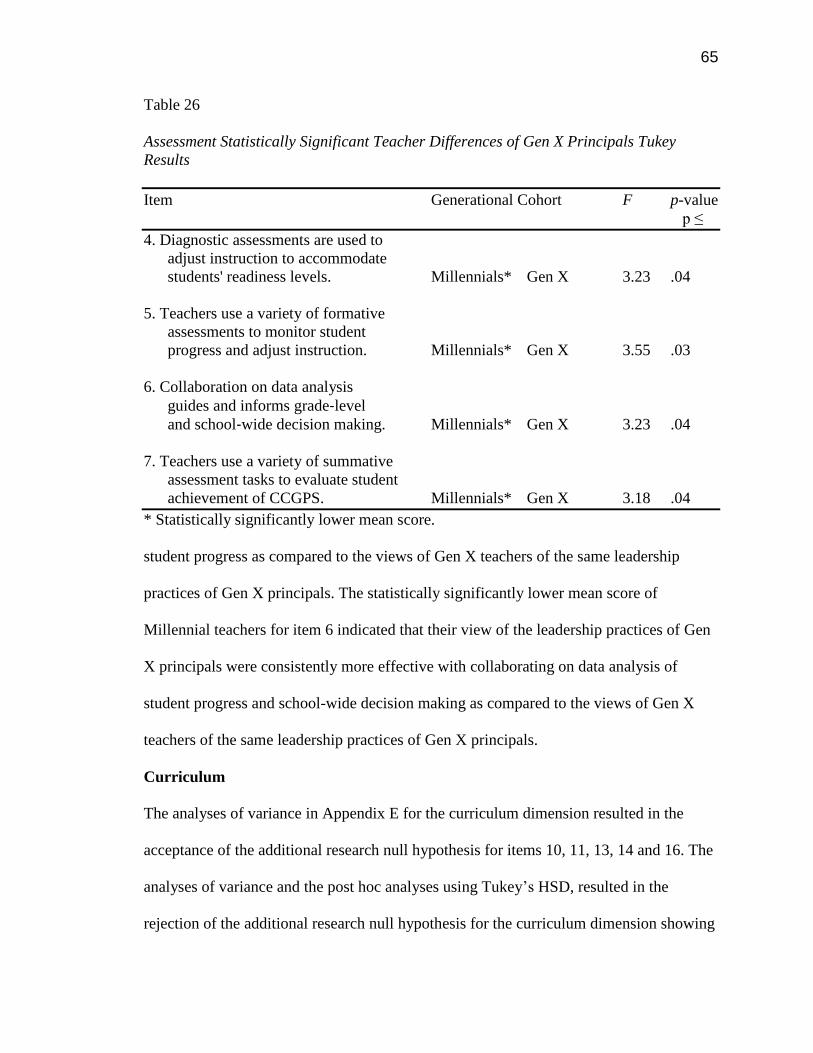
65
Table 26
Assessment Statistically Significant Teacher Differences of Gen X Principals Tukey
Results
Item Generational Cohort F p-value
p ≤
4. Diagnostic assessments are used to
adjust instruction to accommodate
students' readiness levels. Millennials* Gen X 3.23 .04
5. Teachers use a variety of formative
assessments to monitor student
progress and adjust instruction. Millennials* Gen X 3.55 .03
6. Collaboration on data analysis
guides and informs grade-level
and school-wide decision making. Millennials* Gen X 3.23 .04
7. Teachers use a variety of summative
assessment tasks to evaluate student
achievement of CCGPS. Millennials* Gen X 3.18 .04
* Statistically significantly lower mean score.
student progress as compared to the views of Gen X teachers of the same leadership
practices of Gen X principals. The statistically significantly lower mean score of
Millennial teachers for item 6 indicated that their view of the leadership practices of Gen
X principals were consistently more effective with collaborating on data analysis of
student progress and school-wide decision making as compared to the views of Gen X
teachers of the same leadership practices of Gen X principals.
Curriculum
The analyses of variance in Appendix E for the curriculum dimension resulted in the
acceptance of the additional research null hypothesis for items 10, 11, 13, 14 and 16. The
analyses of variance and the post hoc analyses using Tukey’s HSD, resulted in the
rejection of the additional research null hypothesis for the curriculum dimension showing

66
that the statistic and associated probability of the mean scores were statistically
significantly different for item 12, p ≤ .03, item 15, p ≤ .03, and item 17, p ≤ .03 (Table
27). The post hoc analyses indicated that there was a statistically significantly lower
mean score for Millennial teachers (M =1.44, SD = .62) than Gen X teachers (M = 1.60,
SD = .67).
The statistically significantly lower mean scores of Millennial teachers for items
12, 15, and 17 indicated that their view of leadership practices of Gen X principals were
more effective having teachers design curriculum units with depth of understanding and
rigor, analyze student work collaboratively, and revise curriculum through performance
data of student work as compared to the views of Gen X teachers of the same leadership
practices of Gen X principals.
Instruction
The analyses of variance in Appendix E for the instruction dimension resulted in
the acceptance of the additional research null hypothesis for items 19, 20, 23, 25 and 26.
In Table 28, the analyses of variance and the post hoc analyses using Tukey’s HSD,
resulted in the rejection of the additional research null hypothesis indicating that the
statistic and associated probability of the mean scores were statistically significantly
different for item 18, p = .003, item 21, p ≤ .003, item 22, p ≤ .001, item 24, p ≤ .04, item
27, p ≤ .04, item 28, p ≤ .01, item 29, p ≤ .01, and item 30, p ≤ .01. The post hoc analyses
indicated that there was a statistically significantly lower mean score on items 18, 24, 27,
29, and 30 for Millennial teachers (M = 1.48, SD = .62) than Gen X teachers (M = 1.68,
SD = .69). For items 21, 22, and 28 there was a statistically significantly lower mean
score for Millennial teachers (M = 1.48, SD = .62) than Gen X teachers (M = 1.68, SD =
.69) and Boomer teachers (M = 1.64, SD = .70).

67
Table 27
Curriculum Statistically Significant Teacher Differences of Gen X Principals Tukey
Results
Item Generational Cohort F p-value
p ≤
12. Our curriculum maps and units are
designed to ensure all students
participate in a curriculum that
requires depth of understanding
and rigor. Millennials* Gen X 3.37 .03
15. Our teachers analyze student work
collaboratively to build consensus
for a common understanding of
proficiency and rigor. Millennials* Gen X 3.65 .03
17. Performance data and the review of
student work are used to revise
curriculum implementation and to
align resources. Millennials* Gen X 3.39 .03
* Statistically significantly lower mean score.
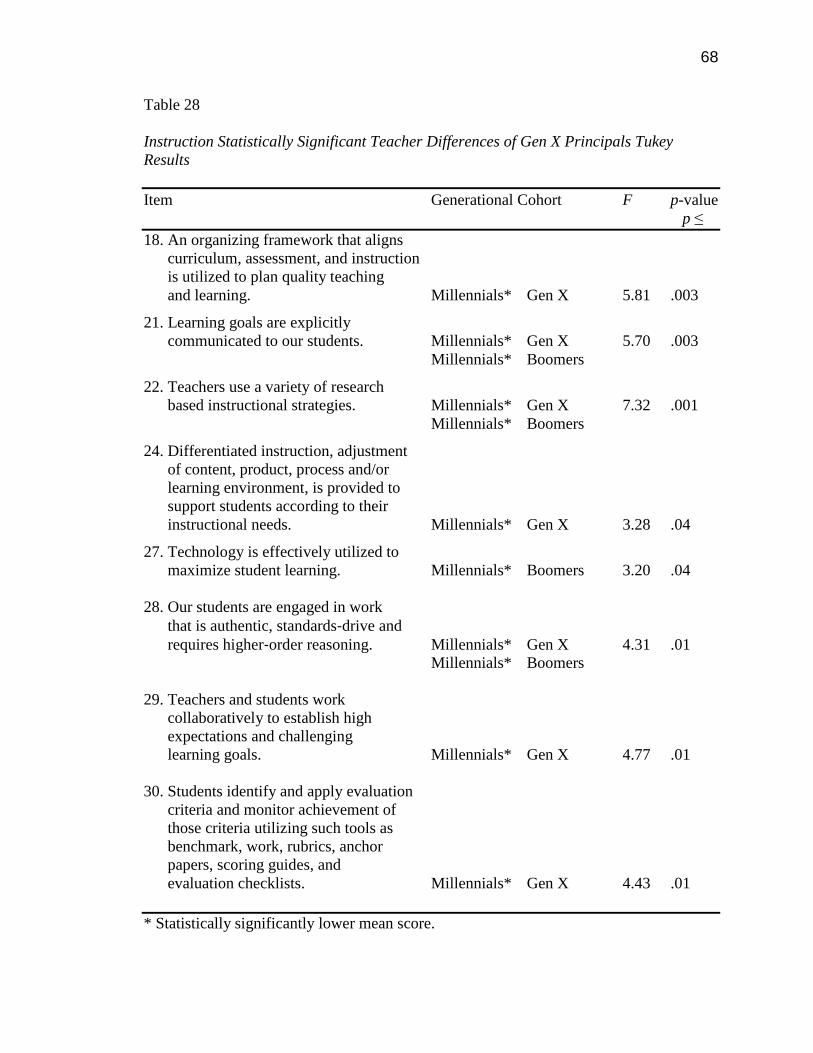
68
Table 28
Instruction Statistically Significant Teacher Differences of Gen X Principals Tukey
Results
Item Generational Cohort F p-value
p ≤
18. An organizing framework that aligns
curriculum, assessment, and instruction
is utilized to plan quality teaching
and learning. Millennials* Gen X 5.81 .003
21. Learning goals are explicitly
communicated to our students. Millennials* Gen X 5.70 .003
Millennials* Boomers
22. Teachers use a variety of research
based instructional strategies. Millennials* Gen X 7.32 .001
Millennials* Boomers
24. Differentiated instruction, adjustment
of content, product, process and/or
learning environment, is provided to
support students according to their
instructional needs. Millennials* Gen X 3.28 .04
27. Technology is effectively utilized to
maximize student learning. Millennials* Boomers 3.20 .04
28. Our students are engaged in work
that is authentic, standards-drive and
requires higher-order reasoning. Millennials* Gen X 4.31 .01
Millennials* Boomers
29. Teachers and students work
collaboratively to establish high
expectations and challenging
learning goals. Millennials* Gen X 4.77 .01
30. Students identify and apply evaluation
criteria and monitor achievement of
those criteria utilizing such tools as
benchmark, work, rubrics, anchor
papers, scoring guides, and
evaluation checklists. Millennials* Gen X 4.43 .01
* Statistically significantly lower mean score.
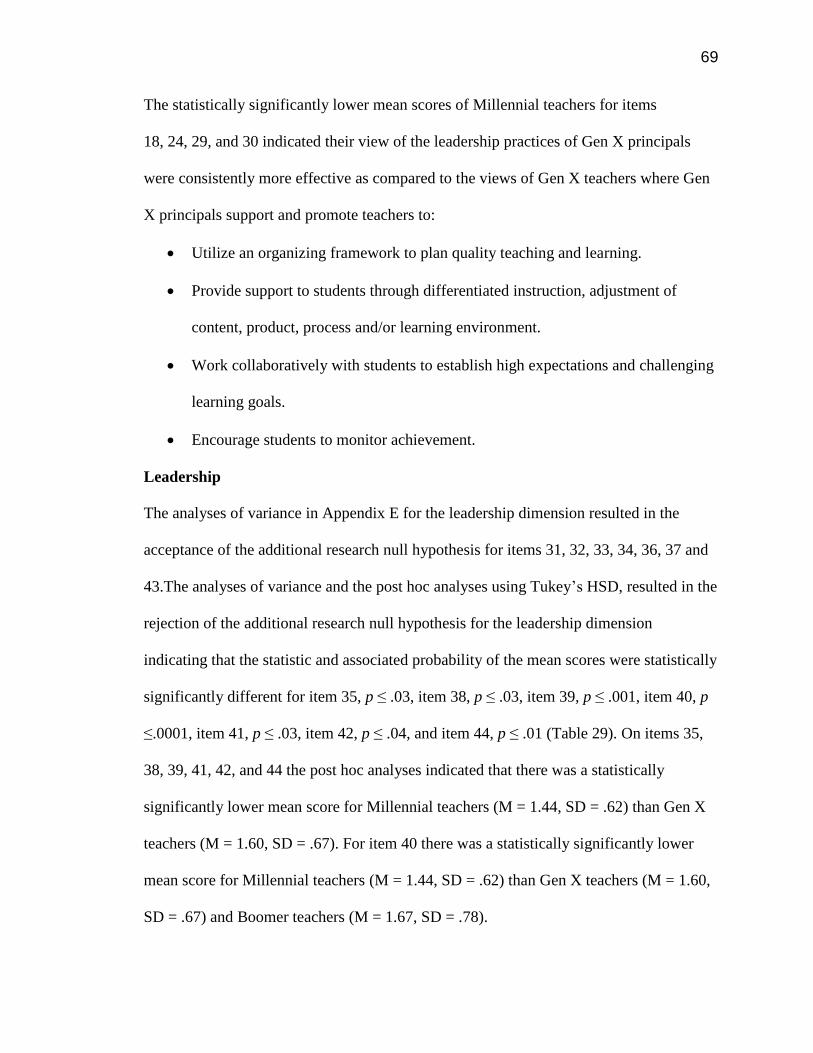
69
The statistically significantly lower mean scores of Millennial teachers for items
18, 24, 29, and 30 indicated their view of the leadership practices of Gen X principals
were consistently more effective as compared to the views of Gen X teachers where Gen
X principals support and promote teachers to:
Utilize an organizing framework to plan quality teaching and learning.
Provide support to students through differentiated instruction, adjustment of
content, product, process and/or learning environment.
Work collaboratively with students to establish high expectations and challenging
learning goals.
Encourage students to monitor achievement.
Leadership
The analyses of variance in Appendix E for the leadership dimension resulted in the
acceptance of the additional research null hypothesis for items 31, 32, 33, 34, 36, 37 and
43.The analyses of variance and the post hoc analyses using Tukey’s HSD, resulted in the
rejection of the additional research null hypothesis for the leadership dimension
indicating that the statistic and associated probability of the mean scores were statistically
significantly different for item 35, p ≤ .03, item 38, p ≤ .03, item 39, p ≤ .001, item 40, p
≤.0001, item 41, p ≤ .03, item 42, p ≤ .04, and item 44, p ≤ .01 (Table 29). On items 35,
38, 39, 41, 42, and 44 the post hoc analyses indicated that there was a statistically
significantly lower mean score for Millennial teachers (M = 1.44, SD = .62) than Gen X
teachers (M = 1.60, SD = .67). For item 40 there was a statistically significantly lower
mean score for Millennial teachers (M = 1.44, SD = .62) than Gen X teachers (M = 1.60,
SD = .67) and Boomer teachers (M = 1.67, SD = .78).

70
Table 29
Leadership Statistically Significant Teacher Differences of Gen X Principals Tukey
Results
Item Generational Cohort F p-value
p ≤
35. Our principal and other school
administrators implement policies,
practices, and procedures that ensure
a safe and orderly learning
environment. Millennials* Gen X 3.55 .03
38. Our principal and other school
administrators collaborate with staff
members and other stakeholders to
elicit input and provide opportunities
for shared decision-making and
problem-solving. Millennials* Gen X 3.63 .03
39. Staff members have opportunities to
serve in a variety of leadership roles. Millennials* Gen X 6.82 .001
40. Our school receives help from
outside agencies like Metro RESA,
colleges, businesses and the
Ga. Dept. of Education. Millennials* Gen X 9.57 <.0001
Millennials* Boomers
41. Our school has a fully operational
Leadership Team that is Representative
of our entire staff. The team conducts
regular, results-driven meetings and
exists to address student achievement
and overall academic success. Millennials* Gen X 3.38 .03
42. Our Leadership Team has a system
for handling business, making
decisions, and solving problems. Millennials* Gen X 3.20 .04
44. Our Leadership Team uses current
data to identify school performance
needs. Millennials* Gen X 4.52 .01
* Statistically significantly lower mean score.

71
The statistically significantly lower mean score of Millennial teachers for item 40
indicated their view of the leadership practices of Gen X principals were consistently
more effective in obtaining assistance outside agencies as compared to either Boomer or
Gen X teachers on the same leadership practices of Gen X principals. Also, within this
dimension leadership, the statistically significantly lower mean scores by Millennial
teachers for items 35, 38, 39, 41, 42, and 44 indicated their view of the leadership
practices of Gen X principals were consistently more effective as compared to the views
of Gen X teachers of Gen X principals when it involved:
Implement policies, practices, and procedures that ensure a safe learning
environment.
Collaborate with staff members and other stakeholders to elicit input and provide
opportunities for shared decision-making and problem-solving.
Create opportunities for staff members to serve in a variety of leadership roles.
The school has a fully operational Leadership Team that is representative of our
entire staff.
Uses current data to identify school performance needs.
Has a system for handling business, making decisions, and solving problems.
Planning and Organization
The analyses of variance in Appendix E for the planning and organization
dimension resulted in the acceptance of the additional research null hypothesis for items
45, 47, 48, 49 and 50. In Table 30, the analyses of variance and the post hoc analyses
using Tukey’s HSD, resulted in the rejection of the additional research null hypothesis
indicating that the statistic and associated probability of the mean scores were statistically
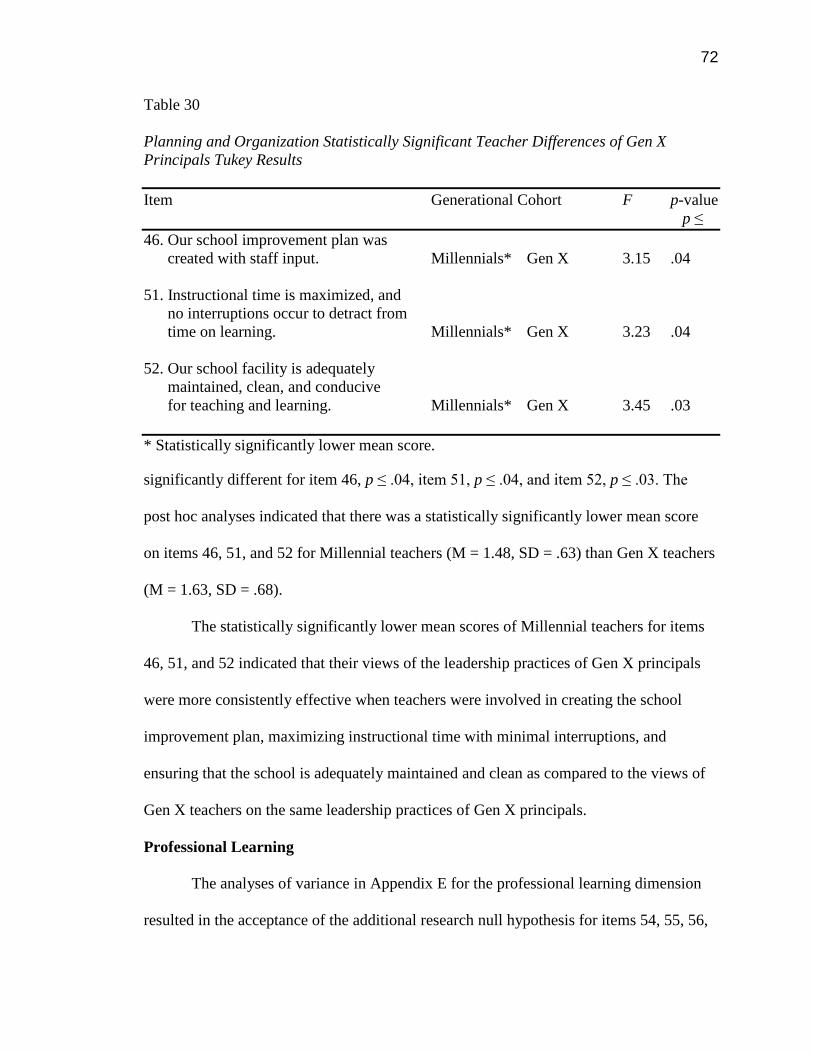
72
Table 30
Planning and Organization Statistically Significant Teacher Differences of Gen X
Principals Tukey Results
Item Generational Cohort F p-value
p ≤
46. Our school improvement plan was
created with staff input. Millennials* Gen X 3.15 .04
51. Instructional time is maximized, and
no interruptions occur to detract from
time on learning. Millennials* Gen X 3.23 .04
52. Our school facility is adequately
maintained, clean, and conducive
for teaching and learning. Millennials* Gen X 3.45 .03
* Statistically significantly lower mean score.
significantly different for item 46, p ≤ .04, item 51, p ≤ .04, and item 52, p ≤ .03. The
post hoc analyses indicated that there was a statistically significantly lower mean score
on items 46, 51, and 52 for Millennial teachers (M = 1.48, SD = .63) than Gen X teachers
(M = 1.63, SD = .68).
The statistically significantly lower mean scores of Millennial teachers for items
46, 51, and 52 indicated that their views of the leadership practices of Gen X principals
were more consistently effective when teachers were involved in creating the school
improvement plan, maximizing instructional time with minimal interruptions, and
ensuring that the school is adequately maintained and clean as compared to the views of
Gen X teachers on the same leadership practices of Gen X principals.
Professional Learning
The analyses of variance in Appendix E for the professional learning dimension
resulted in the acceptance of the additional research null hypothesis for items 54, 55, 56,

73
57, 60, 63, 64 and 65.The analyses of variance and the post hoc analyses using Tukey’s
HSD resulted in the rejection of the additional research null hypothesis indicating that the
statistic and associated probability of the mean scores were statistically significantly
different for item 53, p ≤ .01, item 58, p ≤ .01, item 59, p ≤ .01, item 61, p ≤ .03, and item
62, p ≤ .001 (Table 31). The post hoc analyses for items 58, 59, 61, and 62 indicated that
there was a statistically significantly lower mean score for Millennial teachers (M = 1.47,
SD = .65) than Gen X teachers (M = 1.66, SD = .72). For item 53 there was a statistically
significantly lower mean score for Millennial teachers (M = 1.47, SD = .65) than Gen X
(M = 1.66, SD = .72) and Boomer teachers (M = 1.60, SD = .73).
The statistically significantly lower mean score of Millennial teachers for item 53
indicated their view of the leadership practices of Gen X principals were consistently
more effective in providing job-embedded professional learning as compared to the views
of Boomer or Gen X teachers on the same leadership practices of Gen X principals.
Additionally, the statistically significantly lower mean scores of Millennial teachers for
items 58, 59, 61, and 62 indicated their view of the leadership practices of Gen X
principals were consistently more effective as compared the views of Gen X when Gen X
principals provided opportunities in professional learning to:
Create teams meet to review and study current research to make informed
instructional decisions.
Provide long-term in-depth professional learning.
Prepare teachers in practices with respect for diverse cultural backgrounds.
Prepare teachers to adjust instruction to meet the needs of diverse learners.

74
Table 31
Professional Learning Significantly Significant Teacher Differences of Gen X Principals
Tukey Results
Item Generational Cohort F p-value
p ≤
53. Teachers and administrators participate
in job-embedded professional learning
and collaboration addressing
curriculum, assessment, instruction,
and technology. Millennials* Gen X 4.63 .01
Millennials* Boomers
58. Teams meet to review and study
current research to make informed
instructional decisions. Millennials* Gen X 4.72 .01
59. The staff participates in long-term
in-depth professional learning
which is aligned with our school
improvement goals. Millennials* Gen X 4.33 .01
61.Our professional learning prepares us
in practices that convey respect for
diverse cultural backgrounds and high
expectations for all students. Millennials* Gen X 3.62 .03
62. Our professional learning prepares
teachers to adjust instruction and
assessment to meet the needs of
diverse learners. Millennials* Gen X 6.65 .001
* Statistically significantly lower mean score.
School Culture
The analyses of variance in Appendix E for the school culture dimension resulted
in the acceptance of the additional research null hypothesis for items 71, 72, 74 and 75. In
Table 32, the analyses of variance and the post hoc analysis using Tukey’s HSD, resulted
in the rejection of the additional research null hypothesis indicating that the statistic and
associated probability of the mean scores were statistically significantly different for item
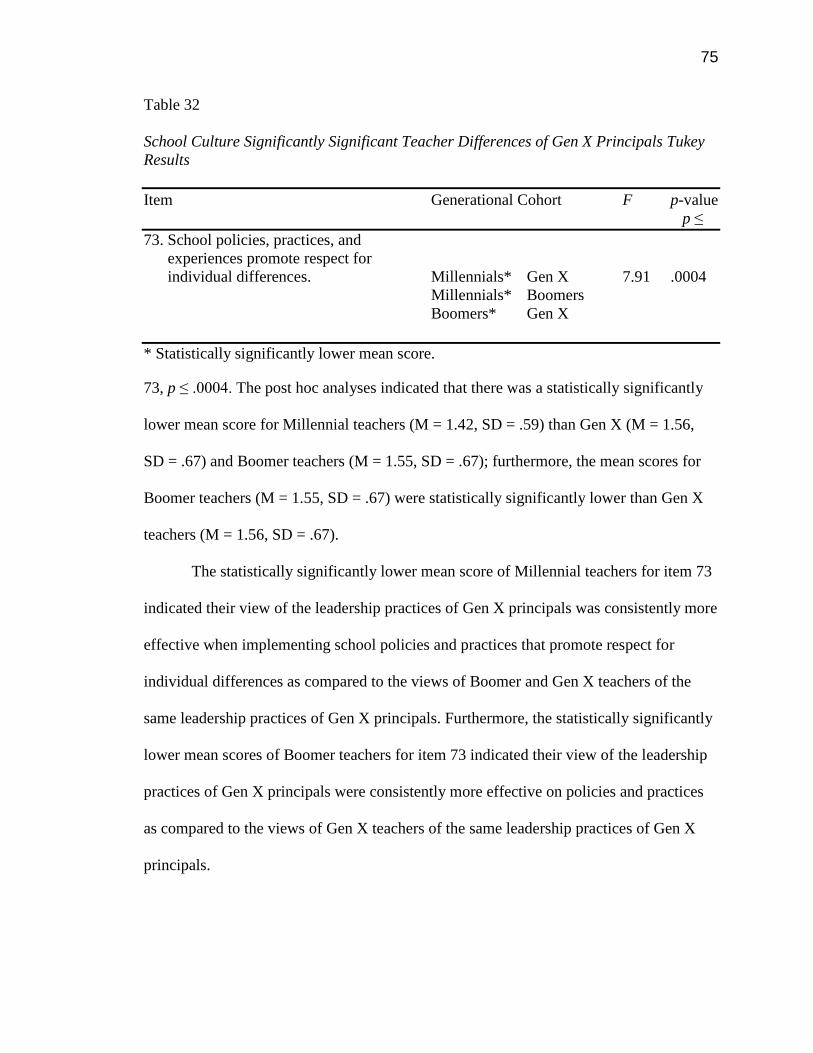
75
Table 32
School Culture Significantly Significant Teacher Differences of Gen X Principals Tukey
Results
Item Generational Cohort F p-value
p ≤
73. School policies, practices, and
experiences promote respect for
individual differences. Millennials* Gen X 7.91 .0004
Millennials* Boomers
Boomers* Gen X
* Statistically significantly lower mean score.
73, p ≤ .0004. The post hoc analyses indicated that there was a statistically significantly
lower mean score for Millennial teachers (M = 1.42, SD = .59) than Gen X (M = 1.56,
SD = .67) and Boomer teachers (M = 1.55, SD = .67); furthermore, the mean scores for
Boomer teachers (M = 1.55, SD = .67) were statistically significantly lower than Gen X
teachers (M = 1.56, SD = .67).
The statistically significantly lower mean score of Millennial teachers for item 73
indicated their view of the leadership practices of Gen X principals was consistently more
effective when implementing school policies and practices that promote respect for
individual differences as compared to the views of Boomer and Gen X teachers of the
same leadership practices of Gen X principals. Furthermore, the statistically significantly
lower mean scores of Boomer teachers for item 73 indicated their view of the leadership
practices of Gen X principals were consistently more effective on policies and practices
as compared to the views of Gen X teachers of the same leadership practices of Gen X
principals.

76
Discussion and Interpretation of the Results
The purpose of this research study was to determine whether generational
differences existed among teachers in their perceptions of the leadership practices of
Boomer and Gen X principals. The dimensions of leadership practices used were:
assessment, curriculum, instruction, leadership, planning and organization, professional
learning, school-family-community, and school culture. This study found statistically
significant differences in the mean scores among the three generations of teachers
depending on the leadership dimension, and whether they were led by a Boomer or Gen
X principal. The statistically significant generational differences of perception among
teachers of the leadership practices of Boomer principals existed in 5 of the 75 survey
items. The statistically significant generational differences of perception among teachers
of the leadership practices of Gen X principals existed in 31 of the 75 survey items. The
pattern that emerged of teachers’ perception of principals’ leadership practices are
illustrated in Figure 5.
Perceptions of Leadership Practices of Boomer Principals
The pattern that emerged from the data analyses indicated in greater frequency
(70 of the 75 items) that there were no statistically significant generational differences of
perceptions among teachers of the leadership practices of Boomer principals. Where the
data analyses indicated statistically significant generational differences (5 of the 75
items) were in the leadership dimension of school-family-community and school culture.
The data indicated of the 5 items statistically significant generational differences
occurred in greater frequency among Boomer and Millennial teachers, followed by
Boomer and Gen X teachers, and only one occurrence among Boomer and Gen X
teachers.
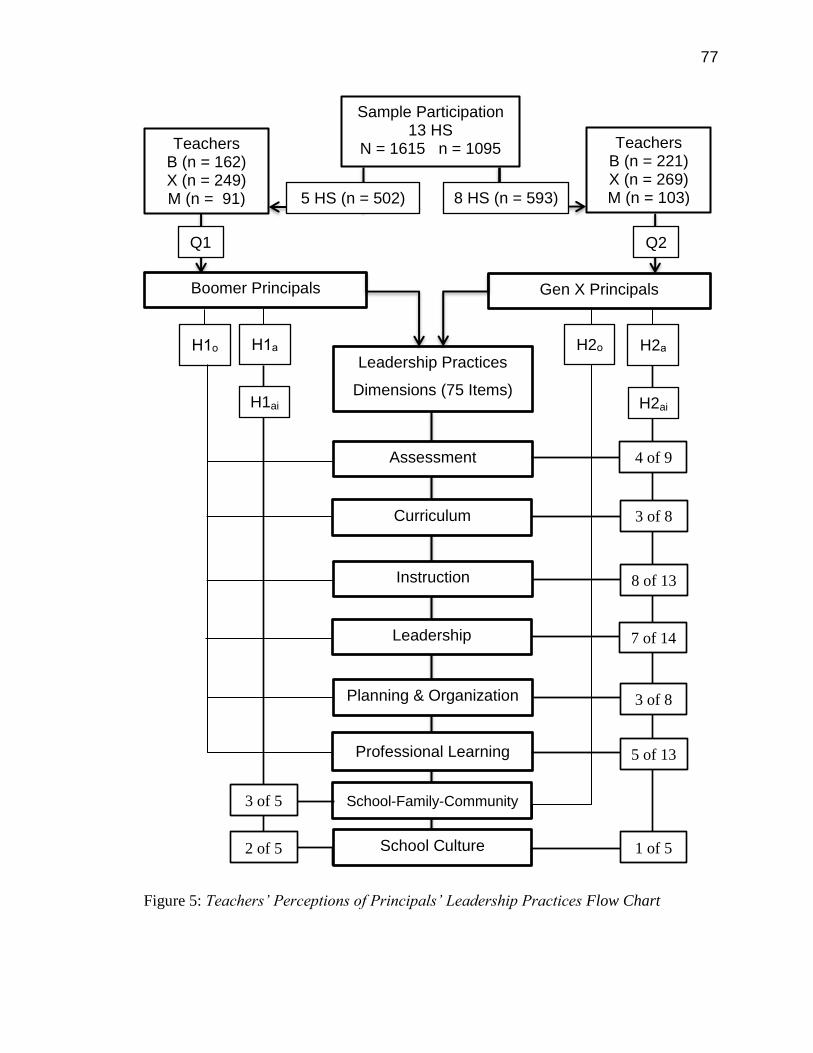
77
Figure 5: Teachers’ Perceptions of Principals’ Leadership Practices Flow Chart
Sample Participation 13 HS
N = 1615 n = 1095
5 HS (n = 502) 8 HS (n = 593)
Teachers B (n = 162) X (n = 249) M (n = 91)
Teachers B (n = 221) X (n = 269) M (n = 103)
Boomer Principals
Gen X Principals
Q1 Q2
Leadership Practices
Dimensions (75 Items)
H1ₒ H1ₐ H2ₐ H2ₒ
Assessment
Curriculum
Instruction
Leadership
Planning & Organization
School-Family-Community
School Culture
Professional Learning
H2ai H1ai
3 of 5
2 of 5 1 of 5
5 of 13
3 of 8
7 of 14
8 of 13
3 of 8
4 of 9

78
School-Family-Community
Responsibilities of the principal include communication along with
community relations with parents, teachers, and the community members
(Stronge, Richard, & Catano, 2008). Effective leadership practices bring together
various stakeholders with the goal of educating children (Cotton, 2003).
Principals that provide opportunities for parents and community members to
participate in school governance and decision-making are more effective
principals (Stronge, et al., 2008; Cotton, 2003). In this way effective principals
leadership practices build professional relationships with teachers, form
relationships between parents and school, and foster partnerships with community
members. The perceptions of Boomer teachers’ perceptions of the leadership
practices of Boomer principals were viewed to be more effective in providing
open communication to parents and the community as compared to the views of
Millennial teachers. Leadership practices of Boomer principals that provide
opportunities for parents and the community members to participate in school
governance and decision-making were viewed by Boomer teachers to be more
effective as compared to the views of Gen X or Millennial teachers.
School Culture
Stronge (2012) noted that school culture can influence student outcomes
and staff satisfaction. The academic performance of students and the principal’s
role in creating a positive school culture are linked. Effective leadership practices
support and promote a positive learning environment for all learners by enlisting
the assistance of parents, teachers, and community members (Cotton, 2003). The
79
perceptions of Boomer teachers of the leadership practices of Boomer principals’
role of supporting and promoting a positive learning environment were viewed to
be more effective as compared to the views of Millennial teachers.
Perceptions of Leadership Practices of Gen X Principals
The pattern that emerged from the data analyses indicated a greater frequency (31
of the 75 items) that there were statistically significant generational differences of the
perceptions among teachers of the leadership practices of Gen X principals. The data
analyses indicted statistically significant generational differences were in the leadership
dimensions of: assessment, curriculum, instruction, leadership, planning and
organization, professional learning, and school culture. The statistically significant
generational differences occurred greater frequently among Millennial and Gen X
teachers (30 of the 75 items), followed by Millennial and Boomer teachers (7 of the 75
items), and one occurrence among Boomers and Gen X teachers.
Assessment, Curriculum, and Instruction
The leadership practices of principals, though indirect, impact student
achievement (Leithwood, Day, Sammons, Harris, & Hopkins, 2006). Stronge
(2012) noted that one critical component of leadership practices for principals are
to prioritize their instructional role by monitoring assessment, curriculum, and
instruction. By monitoring assessment, curriculum, and instruction effective
principal leadership practices are knowledgeable of curriculum standards, and are
able to judge the effectiveness of teaching and instructional practices on student
achievement (Marzano, et al., 2005). There were statistically significant
80
differences in the perceptions among teachers of the leadership practices of Gen X
principals’ effectiveness as an instructional leader.
The perceptions of Millennial teachers of the leadership practices of Gen
X principals were viewed to be more effective as an instructional leader as
compared to the perceptions of Boomer teachers in the use of technology for
instruction. As an instructional leader, Gen X principals’ leadership practices
were perceived by Millennial teachers to be more effective than either by Boomer
or Gen X teachers in how Gen X principals communicate the visions for research-
based learning goals and instructional strategies that require higher-order
reasoning. Monitoring student progress of their depth of understanding and rigor
and providing support to the instructional needs of students as an instructional
leader by Gen X principals were perceived to be more effective by Millennial
teachers than by Gen X teachers.
Leadership, Planning, and Organization
When principals are visible and are interested in the daily activities of
teachers they are seen by teachers to be leaders who are engaged and involved
(Stronge, 2012). Effective principals realize the importance of day-to-day
planning, and long range planning play in the functional and academic success of
their students (Marzano, et al., 2005). Sharing leadership is a leadership practice
that effective principals incorporate to meet the instructional goals by providing
opportunities for teachers to participate in the decision making process
(Hargreaves & Fink, 2004). With a shared leadership structure the principal is
able to build relationships by encouraging teachers to share in decision making

81
responsibilities (Cotton, 2003; Marzano, et al., 2005).There were significant
statistical differences of perceptions among the generation of teachers of the
effectiveness of the leadership practices of Gen X principals of shared leadership
and planning that encourages teachers to participate in the decision making
process. Millennial teachers perceived the leadership practices of Gen X
principals to be more effective with shared leadership and planning as compared
to the perceptions of Gen X teachers.
Professional Learning
Principal’s leadership practices that promote that lead to effective teaching
and mastery of learning are leaders that go beyond only planning and organizing
professional development; they become learners with their teachers (Stronge,
etal., 2008). Effective principals recognize the importance of a collaborative
professional learning community that inspires trust, shared responsibility, and
works toward improved student learning (DuFour, Dufour, & Eaker, 2008).
Stronge (2012) noted that effective principals lead professional learning
communities and stressing the importance of professional learning by being aware
and communicating with teachers the current research that is critical to the
school’s success. There were statistical significant differences in perceptions
among the generations of teachers on the effectiveness of the leadership practices
of Gen X principals on the importance of collaborative professional learning and
communicating current research critical to the success of the school. Millennial
perceived the leadership practices of Gen X principals to be more effective with
job-embedded professional learning as compared to the perceptions of Boomer or

82
Gen X teachers. With trust, shared responsibility, and communicating with
teachers on current research the leadership practices of Gen X principals were
viewed by Millennial teachers as more effective as compared to the views of Gen
X teachers.
Perceptions of Leadership Practices of Boomer and Gen X Principals
Stronge (2012) stated that effective principals build relationship by sharing in the
responsibility of creating policies and practices with a consensus around school norms
and respect for the individual. When principals share information, power, and decision-
making with teachers they create a relationship of trust (Tschannen-Moran, 2004). There
were statistical significant differences among the perceptions of teachers of the leadership
practices of both Boomer and Gen X principals in building relationships that respect the
individual by sharing information, power, and decision making with the teachers. The
effectiveness of the leadership practices of Boomer principals, as well as Gen X
principals, in building relationships were perceived more effective by Boomer teachers
than by Gen X teachers. With Gen X principals, the effectiveness of their leadership
practices in building relationships was perceived to be more effective by Millennial
teachers than Boomer or Gen X teachers.
Summary
The objectives of the study were formulated in the research questions to
determine if statistically significant differences in the mean perceptions among the three
generations of teachers of their views of the leadership practices of Boomer and Gen X
principals. The School Improvement Opinion Survey (2006) instrument provided the
basis to address the research questions and hypotheses. Surveying the respondents’
83
perception of principal leadership practices provided data to support the analyses of this
study.
Analyses of the generational perspective to teachers’ perception of the leadership
practices of Boomer principals accepted the null hypothesis for six of the eight
dimensions: assessment, curriculum, instruction, leadership, planning and organization,
and professional learning. The analyses of the perceptions among teachers of the
leadership practices of Gen X principals only accepted the null hypothesis for the school-
family-community dimension.
Statistically significant generational differences in the perception among teachers
of the leadership practices of Boomer principals did exist resulting in the rejection of the
null hypotheses dimensions of school-family-community and school culture. In the
school-family-community dimension 3 of the 5 items showed statistically significant
generational differences, and there were statistically significant generational differences
in 2 of the 5 items in the school culture dimension.
The statistically significant generational differences in perceptions among
teachers of the leadership practices of Gen X principals existed in seven of the eight
dimensions: assessment, curriculum, instruction, leadership, planning and organization,
professional learning, and school culture. Statistically significant generational differences
of the items were within the dimensions of: assessment 4 of the 9 items, curriculum 3 of
the 8 items, instruction 8 of the 13 items, leadership 7 of the 14 items, planning and
organization 3 of the 8 items, professional learning 5 of the 13 items, and school culture 1
of the 5 items.
84
While this study did not compare the leadership practices between Boomer and
Gen X principals, it should be noted that one item with statistically significant
generational differences of the perceptions among teachers of the leadership practices did
exist between Boomer and Gen X principals. For both Boomer and Gen X principals,
item 73, where their leadership practices on policies that promote respect for the
individual indicated there were statistically significant differences in perception for
Boomer, Gen X, and Millennial teachers. Of the 75 items on the School Improvement
Opinion Survey (2006), only 5 of the 75 items resulted in statistically significant
generational differences of the perceptions among teachers of the leadership practices of
Boomer principals. On the other hand, 31 of the 75 items resulted in statistically
significant generational differences of the perceptions among teachers of the leadership
practices of Gen X principals. Chapter IV reviewed the process of the study and the data
analyses. The analyzed data summary in this chapter was presented in tables with detailed
analyses in the appendices.

85
CHAPTER V: CONCLUSIONS, IMPLICATIONS, AND RECOMMENDATIONS
The purpose of this study was to determine if there were statistically significant
differences among the three generations of teachers’ perceptions of the leadership
practices of Boomer and Gen X principals. The dimensions of direct and indirect
leadership practices included: assessment, curriculum, instruction, leadership, planning
and organization, professional learning, school-family-community, and school culture.
Awareness of generational perceptions may help school principals consider and adopt
new leadership practices with consideration of the effectiveness of their actions relative
to the generation of teachers. Limited research has been conducted in education to
explore the generational perspective of teachers’ perceptions of principal’s leadership
practices. Effective principal leadership practices with a generational perspective have
the potential to create strategies that will lead, grow and motivate teachers (Arsenault,
2004: Kupperschmidt, 2000).
Where generational differences do exist among teachers, principals can adapt new
competencies to incorporate into their leadership practices that will be the most effective
for each generation of teachers (Salopek, 2006). This quantitative study may improve the
understanding of possible influences of principal’s leadership practices, and how the
generational teachers perceive them. The sample consisted of five high schools that were
led by Boomer principals and eight high schools that were led by Gen X principals. The
instrument utilized was the 75 item School Improvement Opinion Survey (2006)
comprised eight dimensions of principal leadership practices: assessment, curriculum,
86
instruction, leadership, planning and organization, professional learning, school-family-
community, and school culture. The two sets research questions and associated null and
alternative hypotheses that guided the research based on the generational groups of
teachers’ perception of their principal’s–Boomer and Gen X– leadership practices were:
1. Are there statistically significant differences among the means of the three
generations of teachers’ perceptions of the eight dimensions of principal practices
on the School Improvement Opinion Survey for schools with a Boomer principal?
H1ₒ: There are no statistically significant differences among the means of
the three generations of teachers’ perceptions of the eight principal
practices on the School Improvement Opinion Survey for schools with a
Boomer principal.
H1ₐ: There are statistically significant differences among the means of the
three generations of teachers’ perceptions of the eight principal practices
on the School Improvement Opinion Survey for schools with a Boomer
principal.
If H1o is rejected indicating that there is a statistically significant difference
among the means for the three groups of teachers for a dimension, then the following
additional research hypotheses will be answered for each of the items that comprise the
statistically significant dimension:
H1oi: There are no statistically significant differences among the means of
the three generations of teachers’ perceptions of each item which comprise
the dimension of the principal practices on the School Improvement
Opinion Survey for schools with a Boomer principal.

87
H1ai: There is a statistically significant difference among the means of the
three generations of teachers’ perceptions of each item which comprise the
dimension of the principal practices on the School Improvement Opinion
Survey for schools with a Boomer principal.
2. Are there statistically significant differences among the means of the three
generations of teachers’ perceptions of the eight dimensions of principal practices
on the School Improvement Opinion Survey for schools with a Gen X principal?
H2ₒ: There are no statistically significant differences among the means of
the three generations of teachers’ perceptions of the eight principal
practices on the School Improvement Opinion Survey for schools with a
Gen X principal.
H2ₐ: There are statistically significant differences among the means of the
three generations of teachers’ perceptions of the eight principal practices
on the School Improvement Opinion Survey for schools with a Gen X
principal.
If H2o is rejected indicating that there is a statistically significant difference
among the means for the three groups of teachers for a dimension, then the following
additional research hypotheses will be answered for each of the items that comprise the
statistically significant dimension:
H1oi: There are no statistically significant differences among the means of
the three generations of teachers’ perceptions of each item which comprise
the dimension of the principal practices on the School Improvement
Opinion Survey for schools with a Gen X principal.

88
H1ai: There is a statistically significant difference among the means of the
three generations of teachers’ perceptions of each item which comprise the
dimension of the principal practices on the School Improvement Opinion
Survey for schools with a Gen X principal.
The major findings obtained from the data suggested that there are statistically
significant generational differences among teachers’ perception of the leadership
practices of Boomer and Gen X principals.
The data indicated that no statistically significant differences of Boomer
principals’ leadership practices occurred more frequently, 70 of the 75 survey items,
among the perceptions of Boomer, Gen X, and Millennial teachers. Statistically
significant generational differences that occurred in 5 of the 75 survey items were within
the leadership practices dimensions of school-family-community and school culture.
The data indicated that teachers’ perceptions of Gen X principals’ leadership
practices were statistically significant generational difference, 31 of the 75 survey items,
occurred more frequently among Millennial and Gen X teachers, followed by Millennial
and Boomer teachers, and only one occurrence among Boomers and Gen X teachers. The
results among teachers of Gen X principals indicated that statistically significant
generational differences existed in 31 of the 75 survey items within all dimensions except
school-family-community. The results indicated that the perceptions teachers of Gen X
principals’ leadership practices were not statistically significant among generational
differences in 44 of the 75 survey items.
89
Context of Findings
The preliminary literature review of previous generational studies provided
evidence that statistically significant differences of the perceptions of leadership practices
existed among the generational cohorts. The results of this study confirm that statistically
significant generational differences exist among Boomers, Gen X, and Millennial
teachers and their perceptions of the leadership practices of Boomer and Gen X
principals. The pattern that emerged from the data analysis was the frequency of
generational differences of principals’ leadership practices existed more with teachers led
by Gen X principals than teachers led by a Boomer principals.
A qualitative research study conducted by Fry (2010), investigated the differences
in the leadership practices of Boomer and Gen X principals. The study utilized a multi-
method, multi-dimension approach to collect the data of case studies among eight
principals. The intent of this research was to study the perspectives of principal
leadership practices through interviews and observations. Four principals were from the
Boomer generation, and four were from the Gen X generation. During the interviews Fry
(2010) noted that both the Boomer and Gen X principals agreed on the importance of
their roles as an instructional leader. However, when Boomer and Gen X principals
described their leadership practices, the emphasis of importance was different. Boomer
principals believed the focus of their leadership practices should be as facilitators and
supporter of teachers. Gen X principals believed the focus of their leadership practices
should be supporters of students. Fry (2010) concluded that Boomer principals advocated
for teachers, and Gen X principals advocated for students.
90
In another study conducted by Yu and Miller (2005), the results indicated that
statistically significant generational differences did exist in the perceptions of Boomer,
Gen X, and Millennial teachers of the leadership practices depending on whether the
leadership was from the a business industry or education. Their research suggested that
the leadership practices from principals of different generations may differ from the
leadership practices of business leaders. They concluded that the nature of business for
industry and education have different aspirations. Workers in industry of this study
indicated that their supervisors were micromanagers, whereas, teachers indicated that
their principals involved them in the decision making process for the school’s success.
Leadership Practices of Boomer Principals
Based on the results where 5 out of the 75 survey items indicated statistically
significant differences among teachers’ perceptions of the leadership practices of Boomer
principals were minimal. These findings support the findings of Fry (2010) in that
Boomer principals’ leadership practices, as advocates for teachers, place emphasis on
providing resources and support to teachers where leadership and teachers work
collectively together as a team to impact student achievement. Boomer principals prefer
consensus and teamwork over efficiency (Zemke et al., 2000).
In a generational study Riescher (2009) found that among workers there were
statistically significant generational differences in the perceptions of the organizational
culture. However, no statistically significant generational differences were found among
workers’ perceptions of leadership practices. Riescher (2009) concluded there were more
similarities in generational perceptions of leadership practices than differences among
workers.
91
Leadership Practices of Gen X Principals
With respect to the findings of the generational differences among teachers of
their perceptions of the leadership practices of Gen X principals, statistically significant
differences existed. Generational differences in perception occurred more frequently
among Millennial and Gen X teachers, followed by perceptual differences among
Millennial and Boomer teachers, and finally among Boomer and Gen X teachers. The
results of this study support the conclusions by Fry (2010) that Gen X principals’
leadership practices are focused on protecting and nurturing the student where Gen X
principals tended to advocate for the student more than for the teachers. In addition, Gen
X prefers an efficient use of time and is less concerned about peer consensus, teamwork,
collaboration, and the needs of the teacher (Zemke et al., 2000). While Gen X principals
understand the importance of collaboration and teamwork, they view it as “a waste of
time” (Fry, 2010, p. 63).
The results of this study did not support Chan’s (2005) generational research of
the perceptions among Gen X and Millennial workers on their supervisor’s leadership
practices. The results indicated that Millennials had higher expectations and were more
critical of their immediate supervisor’s leadership practices. Whereas, Gen X workers
were more accepting of their supervisor’s leadership practices. Chan (2005) concluded
that there were statistically significant differences among Gen X and Millennial workers
of the perceptions of leadership practices in how leaders are implementing policies and
routines and strengthening relationships that maximize the organization’s performance.
The results of Chan (2005) indicated that Gen X workers perceptions of leadership
practices were viewed to be more effective as compared to the views of Millennial
92
workers. The results from this study indicated that Millennial teachers’ perceptions of
leadership practices of Gen X principals were viewed more effective as compared to the
views of Gen X teachers.
Limitations of Findings
The researcher acknowledges the following limitations of the study:
The scope of the study was limited to one school district and high schools for one
school year.
The responses to the survey instrument may have been affected by personal bias
of the respondents toward their principal.
Additional reliability estimates of the School Improvement Opinion Survey
should be determined for elementary, middle, and high schools in Georgia.
Implications of Findings
The implications from the findings of this study are applicable to professional
leadership development of principals, administrators, and teacher leaders. The results of
the findings indicated that generational differences in the perceptions of the leadership
practices of Boomer and Gen X principals do exist among teachers. These differences
were precipitated by differences in principal leadership practices in the dimensions of:
assessment, curriculum, instruction, leadership, planning and organization, professional
learning, school-family-community, and school culture. For principals to fulfill many of
their obligations and responsibilities, effective leadership practices of principals require a
relationship of collaborative between principal and teachers. Understanding the context
of the generation of the principal coupled with his/hers leadership practices that influence
the generation of teachers is one of many factors impacting school improvement.

93
School districts need to implement additional principal evaluation systems that
include a teacher input component. This will assist principals in their awareness of the
effectiveness of their leadership practices.
Recommendations for Future Research
Few studies have investigated the possible influences from a generational
perspective of the perceptions of teachers’ perceptions of principal’s leadership practices.
Even fewer studies have been conducted on the leadership practices based on the
generation of the principal. The purpose of this research was to determine if statistically
significant generational differences of the perceptions of principal leadership practices
exist among a representative sample of teachers. As supported by the review of literature,
the premise of the research was that statistically significant generational differences exist
among teachers of their perceptions of the leadership practices of principals. When
differences among teachers are discovered, it should be determined whether the
differences are influenced by generational factors, or if these differences are influenced
by other factors.
The findings of this study may help school principals understand and reflect on
how their own leadership practices are perceived by teachers. Increasing their knowledge
of generational tendencies may help in leadership practices that communicate
empathetically to each generation of teachers. The findings of this study will add to the
knowledge and skills for the professional development of educational leaders offering
opportunities to develop strategies that improve the effectiveness of the leadership with
multigenerational teachers. Many opportunities exist for further research in this area.
Suggestions for future research include:
94
Expanding the demographics to offer addition insight to the generational
perceptions of teachers. Additional demographics could include: (a) sex; (b)
ethnicity; (c) years of teaching experience; (d) years at the school; (e) part time
and retired teachers; or (f) student demographics.
To conduct a similar study as Millennials begin to serve as principals.
Expanding the research to include middle and elementary schools.
Conducting a mixed methods study to, in addition to survey statement, conduct
interviews with teachers from each generation on the leadership practices of their
principal.
Conducting generational interviews with principals on the perspectives of their
leadership practices.
Conclusion
The findings of this study indicate that statistically significant generational
differences exist among the teacher’s perceptions of the leadership practices of Boomer
and Gen X principal. The indications support the conclusion that teachers of different
generations more frequently have statistically significant differences in their perceptions
of the leadership practices with Gen X principals than with Boomer principals. Principal
leadership practices that are capable of addressing generational contingencies have the
potential of increasing teacher effectiveness. To achieve this goal, principals will need to
adjust their leadership practices to be conducive to collaboration, mutual respect,
diversity, professional growth, innovation, and building relationships among the
generations of teachers.

95
This study contributes by quantitatively exploring the differences among Boomer,
Gen X, and Millennial teachers’ perceptions of the leadership practices of Boomer and
Gen X principals. Principals can leverage these findings to develop and improve their
leadership practices and skills to contend with the generational differences among
teachers. There is great potential for principals though professional learning to develop
leadership practices that will have an impact school improvement.

96
References
Arsenault, P. M. (2004). Validating generational differences: A legitimate diversity and
leadership issue. Leadership & Organizational Development Journal, 2, 124-141.
Retrieved from
http://www.emeraldinsight.com.proxy.kennesaw.edu/search.htm?ct=jnl&fd1=all
&bl2=and&st2=%220143-
7739%22&fd2=isn&st1=validating+generational+differences
Bolton, S. (2010). Career motivation theory: Generational differences and their impact
on organizations (Doctoral dissertation, Walden University). Retrieved from
http://gradworks.umi.com/33/91/3391445.html
Bureau of Labor Statistics. (2011). Labor force statistics from the current population
survey. Retrieved from http://www.bls.gov/cps/demographics.htm#older
Burke, M. E. (2004). Generational differences survey report. Retrieved from
http://www.shrm.org/research/surveyfindings/documents/generational%20differe
nces%20survey%20report.pdf
Burns, J. M. (2010). Leadership. New York: Harper Perennial.
Cennamo, L., & Gardner, D. (2008). Generational differences in work values, outcomes
and person-organization values fit. Journal of Managerial Psychology, 23(8),
891-906. Retrieved from www.emeraldinsight.com/0268-3946.htm
Chan, D. S. (2005). Relationship between generation-responsive leadership behaviors
and job satisfaction of generations x and y professionals (Doctoral dissertation,
University of Phoenix). Retrieved from http://www.proquest.com/en-US/

97
Chelladurai, P., & Saleh, S. D. (1980). Dimensions of leader behavior in sports:
Development of a leadership scale . Journal of Sport Psychology, 2, 34-45.
Retrieved from http://the-coach-athlete-
relationship.wikispaces.com/file/view/LSS%20Article.pdf/183886483/LSS%20A
rticle.pdf
Chernoff, A. (2007). Workplace coaching: Developing leadership skills (Doctoral
dissertation, Royal Roads University). Retrieved from
http://www.proquest.com/en-US/
Cooper, D., & Schindler, P. (2010). Business research methods (11th ed.). Boston, MA:
McGraw-Hill/Irwin.
Cotton, K. (2003). Principals and student achievement: What the research says.
Alexandria, VA: Association for Supervision and Curriculum Development.
Creswell, J. W. (2008). Educational research: Planning, conducting, and evaluating
quantitative and qualitative research (3rd ed.). Columbus, OH: Merrill Prentice
Hall.
Crumpacker, M., & Crumpacker, J. D. (2007). Succession planning and generational
stereotypes: Should HR consider age-based values and attitudes a relevant factor
or a passing fad? Public Personnel Management, 36(4), 349-369. Retrieved from
http://hoosonline.virginia.edu/atf/cf/%7Bbda77a21-0229-499a-ae10-
eadbe96789d6%7D/SUCCESSION%20PLANNING_GENERATIONAL.PDF
Culp, K. (2011). Understanding generational differences. Retrieved from
http://www.ca.uky.edu/agc/pubs/cld1/cld18/cld18.PDF

98
Davis, J., Pawlowski, S., & Houston, A. (2006). Work commitments of baby boomers
and gen xers in the IT profession: Generational differences or myth. Journal of
Computer Information Systems, 46(3), 43-49. Retrieved from
http://connection.ebscohost.com
Davis, S., Kearney, K., Sanders, N., Thomas, C., & Leon, R. (2011). The policies and
practices of principal evaluation: A review of the literature. Retrieved from
http://www.wested.org/online_pubs/resource1104.pdf
DuFour, R., Dufour, R., & Eaker, R. (2008). Revisiting professional learning
communities at work. Bloomington, IN: Solution Tree.
Dychtwald, K., Erickson, T. J., & Morison, R. (2006). Workforce crisis: How to beat the
coming shortage of skills and talent. Boston, MA: Harvard Business School
Publishing.
Ebenkamp, B. (1999). The xer executive’s high expectations. Brandweek, 40(18), 18.
Retrieved from http://connection.ebscohost.com/c/articles/1839476/xer-
executives-high-expectations
Educational Leadership Policy Standards: ISLLC 2008 as adopted by the National Policy
Board for Educational Administration. (2008). Retrieved from
http://www.ccsso.org/documents/2008/educational_leadership_policy_standards_
2008.pdf
Elmore, T. (2010). Generation iY. Atlanta, GA: Poet Gardner Publishing.
Fernandez, S. (2009). Comparing generation x to generation y on work-related beliefs
(Doctoral dissertation, San Jose State University). Retrieved from
http://www.proquest.com/en-US/

99
Fry, L. M. (2010). Baby Boomer and Gen X elementary principals: Differing perspectives
on schooling (Doctoral dissertation). Available from ProQuest. (UMI No.
3421816)
Georgia Department of Education. (n.d.). School. Retrieved from
http://www.mitchell.k12.ga.us/LinkClick.aspx?fileticket=PG_9MauDqbI%3D&ta
bid=1111
Georgia Partnership for Excellence in Education. (2010). Education research. Retrieved
from anhttp://www.gpee.org/Council.74.0.html
Ginsberg, R., & Thompson, T. (1992). Dilemmas and solutions regarding principal
evaluation. Peabody Journal of Education, 68(1), 58-74. Retrieved from
http://www.jstor.org/stable/i265907
Guthrie, J. W., & Schuermann, P. J. (2010). Successful school leadership. Boston, MA:
Pearson Education, Inc.
Hargreaves, A., & Fink, D. (2004, April). The seven principles of sustainable leadership.
Learning in Tough Times, 61, 8-13. Retrieved from
http://www.ascd.org/publications/educational-leadership/apr04/vol61/num07/The-
Seven-Principles-of-Sustainable-Leadership.aspx.
Hater, J. J., & Bass, B. M. (1988). Superior’s evaluations and subordinate’s perceptions
of transformational and transactional Leadership. Journal of Applied Psychology,
73(1), 695-702.
Holleran II, M. J. (2008). The talent war: Attracting and retaining generation Y leaders
in professional services [White paper]. Retrieved from Society for Marketing
Professional Services: http://www.smps.org/foundation/

100
Howell, J. M., & Avolio, B. J. (1993). Transformational leadership, transactional
leadership, locus of control, and support for innovation: Key predictors of
consolidated-business-unit-performance. Journal of Applied Psychology, 78, 891-
902. Retrieved from
http://psycnet.apa.org/index.cfm?fa=buy.optionToBuy&uid=1994-19634-001
Joiner, T. (2000). Gen X-ers focus on life outside the job fulfillment. The Secured
Lender. (May/June), 64-68. Retrieved from http://www.highbeam.com/doc/1P3-
53786928.html
Jones, L. P. (2010). Evaluating generational differences regarding corporate loyalty
within the manufacturing industry (Doctoral dissertation, Northcenteral
University). Retrieved from http://www.proquest.com/en-US/
Kirby, P. C., Paradise, L., & King, M. (1992). Extraordinary leaders in education:
Understanding transformational leadership. Journal of Educational Research,
85(5), 303-311. Retrieved from http://www.jstor.org
Koenigsknecht, S. (2002). A comparison of the motivational factors of baby boomer and
generation x employees (Doctoral dissertation, Colorado Technical University).
Retrieved from http://www.proquest.com/en-US/
Koh, W. L., Steers, R. M., & Terborg, J. R. (1995). The effects of transformational
leadership on teacher attitudes and student performance in Singapore. Journal of
Organizational Business, 16(4), 319-333. Retrieved from
http://www.proquest.com/en-US/

101
Kouzes, J. M., & Posner, B. Z. (2002). The leadership practices inventory: Theory and
evidence behind the five practices of exemplary leaders. Retrieved from
http://media.wiley.com/assets/61/06/lc_jb_appendix.pdf
Kouzes, J., & Posner, B. (2012). The leadership challenge (5th ed.). San Francisco, CA:
Jossey-Bass.
Kowske, B., Rasch, R. L., & Wiley, J. W. (2009). Millennials’ (lack of) attitude problem:
An empirical examination of generational effects on work attitudes. Retrieved
from http://www.kenexa.com/getattachment/94bb8869-7554-46c7-9a5c-
c2ec90f4a4f8/Millennials-Lack-of-Attitude-Problem.aspx
Kupperschmidt, B. R. (2000). Multigeneration employees: Strategies for effective
management. Health Care Manager, 19(1), 65-76. Retrieved from
http://journals.lww.com/healthcaremanagerjournal/Abstract/2000/19010/Multigen
eration_Employees__Strategies_for.11.aspx
Lancaster, L. C., & Stillman, D. (2005). When generations collide. New York, NY:
Harper Collins Publishers Inc.
Leedy, P. D., & Ormrod, J. E. (2001). Practical research: Planning and design (7th ed.).
Upper Saddle River, N.J: Merrill Prentice Hall.
Liethwood, K., Day, C., Sammons, P., Harris, A., & Hopkins, D. (2006). Successful
school leadership: What it is and how it influences pupil learning. Retrieved from
EBSCOHost database: http://www.ncsl.org.uk/media/3F6/2B/What-we-know-
about-school-leadership-full-report.pdf.
Longnecker, C. O., & Nykodym, N. (1996, SEP). Public sector performance appraisal
effectiveness: A case study. Public Personnel Management, 25(2), 151-164.
102
Mannheim, K. (1952). The problems of generations. In essays on the sociology of
knowledge. Centerlane, London: Routledge & Kegan LTD. Retrieved from
http://ia600302.us.archive.org/15/items/essaysonsociolog00mann/essaysonsociolo
g00mann.pdf
Marzano, R. J., Waters, T., & McNulty, B. A. (2005). School leadership that works.
Denver, CO: McREL.
Maxwell, L. (2008). Delaware rolling out new evaluations for principals. Education
Week, 27(41), 10. Retrieved from
http://ehis.ebscohost.com.proxy.kennesaw.edu/ehost/detail?sid=0271cc4f-318e-
4b33-a9c8-
6f1310b48745%40sessionmgr15&vid=8&hid=101&bdata=JnNpdGU9ZWhvc3Qt
bGl2ZSZzY29wZT1zaXRl#db=a9h&AN=32708934
McNeese-Smith, D., & Crook, M. (2003). Nursing values and a changing nurse
workforce: Values, age, and job stages. Journal of Nursing Administration, 33(5),
260-270. Retrieved from http://ovidsp.tx.ovid.com.proxy.kennesaw.edu/sp-
3.8.1a/ovidweb.cgi?WebLinkFrameset=1&S=PLBJFPKEGLDDGJJCNCOKLC
MCGOBOAA00&returnUrl=ovidweb.cgi%3f%26TOC%3dS.sh.12305_1365882
222_72.12305_1365882222_84.12305_1365882222_88.12305_1365882222_90.1
2305_1365882222_94.12305_1365882222_98%257c2%257c50%26FORMAT%
3dtoc%26FIELDS%3dTOC%26S%3dPLBJFPKEGLDDGJJCNCOKLCMCGOB
OAA00&directlink=http%3a%2f%2fgraphics.tx.ovid.com%2fovftpdfs%2fFPDD
NCMCLCJCGL00%2ffs025%2fovft%2flive%2fgv015%2f00005110%2f0000511
0-200305000-
103
00002.pdf&filename=Nursing+Values+and+a+Changing+Nurse+Workforce%3a
+Values%2c+Age%2c+and+Job+Stages.&link_from=S.sh.12305_1365882222_7
2.12305_1365882222_84.12305_1365882222_88.12305_1365882222_90.12305_
1365882222_94.12305_1365882222_98|2&pdf_key=B&pdf_index=S.sh.12305_
1365882222_72.12305_1365882222_84.12305_1365882222_88.12305_1365882
222_90.12305_1365882222_94.12305_1365882222_98
Michaud, D. A. (2012). Generational differences in the perception of leadership styles
and practices between members of the Society for Public Health Education
(Doctoral dissertation, Capella University). Retrieved from
http://www.proquest.com/en-US/
Papp, E. (2007). Managing Gen Y. Retrieved from
http://www.ericpapp.com/downloads/article-managing-gen-y.pdf
Pendergast, D. (2009). Generational dynamics: Y it matters 2 U and me. International
Journal of Home Economics, 2(3), 67-84. Retrieved from
http://search.informit.com.au/search;action=doSearch
Perez, B. (2005). A study of how a leader’s use of contingent and non-contingent reward
behavior effects the job satisfaction of science and engineering employees at a
not-for-profit research organization (Doctoral dissertation, Our Lady of the Lake
University). Retrieved from http://www.proquest.com/en-US/
Pew Research Center. (2006). Public says American work life is worsening, but most
workers remain satisfied with their jobs. Washington, D.C. Retrieved from
http://www.people-press.org/

104
Pew Research Center. (2010). Millennials: A portrait of generation next. Washington,
D.C. Retrieved from http://www.pewsocialtrends.org/files/2010/10/millennials-
confident-connected-open-to-change.pdf
Piper, L. E. (2008). The generation-y workforce in health care: The new challenge for
leadership. The Health Care Manager, 27(2), 98-103.
http://dx.doi.org/10.1097/01.HCM.0000285036.04419.ba
Powell, J. (2003). Generational perceptions of effective leadership (Doctoral dissertation,
Argosy University). Retrieved from http://www.proquest.com/en-US/
Ranstad. (2006). 2006 employee review. Rochester, NY. Harris Interactive, Inc. Retrieved
from www.us.randstad.com
Ranstad. (2008). 2008 world of work. Rochester, NY. Harris Interactive, Inc. Retrieved
from www.randstad.com
Reeves, T. C. (2006). Do generational differences matter in instructional design? Athens,
GA. Retrieved from
http://itforum.coe.uga.edu/Paper104/ReevesITForumJan08.pdf
Riescher, J. G. (2009). Management across time: A study of generational workforce
groups (Baby Boomer and Generation X) and leadership (Doctoral dissertation,
Capella University). Available from ProQuest Dissertations and Theses. (UMI
No. 3355469)
Rosow, I. (1978). What is a cohort and why? Human Development, 21, 65-75.
http://dx.doi.org/10.1159/000271575
Rost, J. (1991). Leadership for the twenty first century. New York: Praeger.
105
Rubin, D. B. (1987). Multiple imputation for nonresponse in surveys. New York: John
Wiley & Sons, Inc.
Ryder, N. B. (1965). The cohort as a concept in the study of social change. American
Sociological Review, 30(6), 843-861. Retrieved from
http://www.soc.washington.edu/users/brines/ryder.pdf
Statistical Analysis Software (SAS). (2013).
http://www.sas.com/technologies/analytics/statistics/stat/
Salopek, J. J. (2006). Leadership for a new age. Training & Development, 60(6), 22-23.
Retrieved from
http://proxy.kennesaw.edu/login?url=http://search.proquest.com.proxy.kennesaw.
edu/docview/227029938?accountid=11824
Schlesinger Jr., A. M. (1986). The cycles of American history. Boston, MA: Houghton
Mifflin.
School Improvement Opinion Survey. (2006). School Keys: Unlocking excellence
through the Georgia school standards. Retrieved from
http://archives.doe.k12.ga.us/DMGetDocument.aspx/GAPSS%20FINAL%20Rev
%20PRINT%20READY%208-6-
08.pdf?p=6CC6799F8C1371F629970641DAA1DDE3ED496B145857D4450887
CCABED6ACE36&Type=D
Sergiovanni, T. J. (2007). Rethinking leadership: A collection of articles (2nd ed.).
Thousand Oaks, CA: Corwin Press.
Sessa, V. I., Kabacoff, R. I., Deal, J., & Brown, H. (2007). Generational differences in
leader values and leadership behaviors. Psychologist-Manager Journal, 10(1), 47-
106
74. Retrieved from
http://ehis.ebscohost.com.proxy.kennesaw.edu/ehost/pdfviewer/pdfviewer?vid=3
&sid=eb2be0dd-5446-4f1d-8d2a-b1efbf438757%40sessionmgr115&hid=101
Shaw, A. (2009). What is 21st century education? Austin, TX. Retrieved from
http://www.21stcenturyschools.com/What_is_21st_Century_Education.htm
Smola, K. W., & Sutton, C. D. (2002). Generational differences: Revisiting generational
work values for the new millennium. Journal of Organizational Behavior, 23,
363-382. http://dx.doi.org/10.1002/job.147
Spillane, J. P. (2006). Distributed leadership. San Francisco, CA: John Wiley & Sons,
Inc.
Strauss, W., & Howe, N. (1991). Generations: The history of America’s future, 1584 to
2069 (1st ed.). New York, NY: William Morrow 7 Company Inc.
Stronge, J. (2012). Stronge Leader Effectiveness Performance Evaluation System.
Trenton, NJ. New Jersey Education Association. Retrieved from
http://www.strongeandassociates.com/files/Stronge%20Evaluation%20System%2
0Report.pdf.
Stronge, J. H., Richard, H. B., & Catano, N. (2008). Qualities of effective principals.
Alexandria, VA: Association for Supervision and Curriculum Development.
Studebaker, G. L. (2000). A comparative study of Indiana superintendent’s perceptions of
principal evaluation instruments (Doctoral dissertation, Indiana State University).
Available from ProQuest Dissertations and Theses.

107
Suckert, M. W. (2008). Generational differences in values among Minnesota K--12
educational leaders (Doctoral dissertation, University of North Dakota).
Retrieved from http://www.proquest.com/en-US/
Summers, A. L. (2011). A theoretical analysis of leadership style preferences among
millennial generation company-grade army officers (Doctoral dissertation,
University of Maryland University College). Retrieved from
http://www.proquest.com/en-US/
Tolbize, A. (2008). Generational differences in the workplace. Retrieved from
http://rtc.umn.edu/docs/2_18_Gen_diff_workplace.pdf
Tschannen-Moran, M. (2004). Trust matters: Leadership for successful schools. San
Francisco, CA: Jossey-Bass.
United States Census Bureau. (n.d.). Census. American FactFinder fact sheet. Retrieved
from http://www.census.gov/#
Yu, H., & Miller, P. (2005). Leadership style: The X Generation and Baby Boomers
compared in different cultural contexts. Leadership & Organization Development
Journal, 26(1), 35-50.
Wallace, J. (2006). Work commitment in the legal profession: A study of baby boomers
and generation xers. International Journal of the Legal Profession, 13(2), 137-
152. http://dx.doi.org/10.1080/09695950600961293
Welsh, R. (2010). Leadership styles of a multigenerational leader (Doctoral dissertation,
Capella University). Retrieved from http://www.proquest.com/en-US/
Zemke, R., Raines, C., & Filipczak, B. (2000). Generations at work. New York, NY:
AMA Publications.

108
Appendix A
School Improvement Opinion Survey
Scale: (1) Consistently, (2) Often, (3) Infrequently, (4) Never, (5) No Basis to Judge
Assessment
1. We use a comprehensive system for assessing student progress toward meeting
the CCGPS.
2. Based on learning gaps and problems identified through assessment data,
instruction is adjusted to improve overall and individual student achievement.
3. Teachers collaborate to design assessments aligned to the CCGPS.
4. Diagnostic assessments are used to adjust instruction to accommodate students'
readiness levels.
5. Teachers use a variety of formative assessments to monitor student progress and
adjust instruction.
6. Collaboration on data analysis guides and informs grade-level and school-wide
decision making.
7. Teachers use a variety of summative assessment tasks to evaluate student
achievement of CCGPS.
8. Our students' ability to self-monitor and self-evaluate is enhanced through the use
of variety of assessments.
9. Assessment data are used to plan and adjust instruction for each student, subgroup
of students, and the school as a whole.

109
Curriculum
10. Our written curriculum documents are aligned with CCGPS and are used to guide
instruction.
11. Our curriculum has been aligned horizontally and vertically in order to support
students' mastery of the CCGPS standards.
12. Our curriculum maps and units are designed to ensure all students participate in a
curriculum that requires depth of understanding and rigor.
13. Our teachers have a shared understanding of what students are expected to know,
do, and understand at all grade levels and in all subject areas.
14. We meet to collaborate on the design and implementation of the curriculum.
15. Our teachers analyze student work collaboratively to build consensus for a
common understanding of proficiency and rigor.
16. Administrators and teacher leaders monitor and evaluate implementation of the
curriculum through a consistent and systematic school wide process.
17. Performance data and the review of student work are used to revise curriculum
implementation and to align resources.
Instruction
18. An organizing framework that aligns curriculum, assessment, and instruction is
utilized to plan quality teaching and learning.
19. Teachers plan together to design, monitor, and revise instruction.
20. Learning goals are aligned with CCGPS.
21. Learning goals are explicitly communicated to our students.
22. Teachers use a variety of research-based instructional strategies.

110
23. Teachers emphasize and encourage learners to use higher-order thinking skills
and mental habits of mind.
24. Differentiated instruction, adjustment of content, product, process and/or learning
environment, is provided to support students according to their instructional
needs.
25. We utilize flexible grouping based on ongoing diagnosis and formative
assessment to enhance student learning.
26. Systematic and data-driven interventions are required for our students who need
additional assistance to master standards.
27. Technology is effectively utilized to maximize student learning.
28. Our students are engaged in work that is authentic standards-driven and requires
higher-order reasoning.
29. Teachers and students work collaboratively to establish high expectations and
challenging learning goals.
30. Students identify and apply evaluation criteria and monitor achievement of those
criteria utilizing such tools as benchmarks, work, rubrics, anchor papers, scoring
guides, and evaluation checklists.
Leadership
31. Our principal and other school administrators exhibit a deep understanding of
curriculum, assessment, and instruction.
32. Our principal and other school administrators are actively involved in the learning
community, including serving as active members on study teams and promoting
meaningful professional learning.

111
33. Our principal and other school administrators keep the school focused on student
learning and promote sustained and continuous improvement.
34. Our principal and other school administrators utilize multiple types of data to
drive and monitor school-wide instructional decisions.
35. Our principal and other school administrators implement policies, practices, and
procedures that ensure a safe and orderly learning environment.
36. Our principal and other school administrators maximize the availability and
distribution of instructional resources focused on school learning goals.
37. Our principal and other school administrators are visible to staff, students, and
parents and participate in subject and/or grade level meetings.
38. Our principal and other school administrators collaborate with staff members and
other stakeholders to elicit input and provide opportunities for shared decision-
making and problem-solving.
39. Staff members have opportunities to serve in a variety of leadership roles.
40. Our school receives help from outside agencies like Metro RESA, colleges,
businesses and the Georgia Department of Education.
41. Our school has a fully operational Leadership Team that is representative of our
entire staff. The team conducts regular, results-driven meetings and exists to
address student achievement and overall academic success.
42. Our Leadership Team has a system for handling business, making decisions, and
solving problems.
43. Our Leadership Team uses current data to identify student achievement needs.
44. Our Leadership Team uses current data to identify school performance needs.

112
Planning and Organization
45. Our schools' vision and mission guides and informs our continuous school
improvement process.
46. Our school improvement plan was created with staff input.
47. Our administrators and the School Leadership Team monitor the implementation
of the school improvement plan and its impact upon student achievement.
48. Our school goals are aligned with district goals.
49. Human, technological, and material resources are effectively selected and used to
ensure the academic success of all learners.
50. A safe learning environment is planned, implemented, and maintained by our
school staff and administrators.
51. Instructional time is maximized, and no interruptions occur to detract from time
on learning.
52. Our school facility is adequately maintained, clean, and conducive for teaching
and learning.
Professional Learning
53. Teachers and administrators participate in job-embedded professional learning
and collaboration addressing curriculum, assessment, instruction, and technology.
54. The principal and other school leaders set clear expectations and monitor the
effectiveness of professional learning on teacher practices and student learning.
55. Opportunities exist for teachers in our school to participate in instructional
leadership development.
56. The principal and other leaders utilize data to plan for professional learning.

113
57. The professional learning activities at my school are connected to our school
improvement goals.
58. Teams meet to review and study current research to make informed instructional
decisions.
59. The staff participates in long-term in-depth professional learning which is aligned
with our school improvement goals.
60. Teachers and administrators have the knowledge and skills necessary to
collaborate.
61. Our professional learning prepares us in practices that convey respect for diverse
cultural backgrounds and high expectations for all students.
62. Our professional learning prepares teachers to adjust instruction and assessment to
meet the needs of diverse learners.
63. Our teachers participate in professional learning to deepen their content
knowledge.
64. Our professional learning designs are purposeful and are aligned with specific
individual group needs.
65. Professional learning in our school provides opportunities for teachers and
administrators to learn how to involve families in their children's education.
School- Family- Community
66. Opportunities for communication exist in both directions between the home and
school.
67. Opportunities exist for parents to participate in training and informational sessions
to enhance student performance.

114
68. Parents feel welcome in our school.
69. Opportunities exist for parents and community members to participate in school
governance, decision making, and problem solving.
70. School and community partnerships exist to provide a network of support for our
students.
School Culture
71. Our school provides support to promote the academic achievement of all learners.
72. Our school supports and enhances the social and emotional growth and
development of all learners.
73. School policies, practices, and experiences promote respect for individual
differences.
74. Our school celebrates the achievement and accomplishments of our students,
staff, and school community.
75. Our school culture reflects an atmosphere of trust and openness among all
stakeholders.

115
Appendix B
Principal Letter
To: Principal From: Greg Doss
High School
Date: April 25, 2013
Subject: Research Approval Request
Dear Principal,
I am a doctoral student of the Department of Educational Leadership at Kennesaw
State University. The purpose of this correspondence is to request your assistance with a
research project I am completing.
The goal of the study is to develop an understanding of the generational
perspective of teachers’ perception of organizational culture and principal effectiveness.
It is intended that the findings of the study will be useful in understanding organizational
culture.
I will be using the existing data from the 2012-2013 School Improvement Opinion
Survey. The data retrieved will include teacher and administrative responses to the
dimensions of school culture and leadership from the high schools in the school district.
I am formally requesting your permission to utilize the existing data from your school as
part of this research project. The data collection will not involve, impede, or interfere
with the daily operation of your school, teachers, or administrators. All response will
remain confidential, with neither the school name, principal name, or teacher names
being revealed in any way.
I hope you will give me permission to include your school in my study. I
appreciate your time and consideration for my request.
In compliance with the rules and regulations for conducting research in the district
please sign and return the enclosed ‘Agreement to Participate’ and self-addressed
stamped envelope.
Please do not hesitate to contact me if you require any additional information.
Sincerely,
Greg Doss

116
Appendix C
Principal Letter Second Request
To: Principal From: Greg Doss
High School
Date: May 13, 2013
Subject: Research Approval Request
Dear Principal,
Two weeks ago a research approval request package was mailed to you. If you
have already processed the request, please accept my sincere appreciation for your
participation. If by some chance you did not receive it or it was misplaced I have
included another package for your convenience.
Sincerely,
Greg Doss
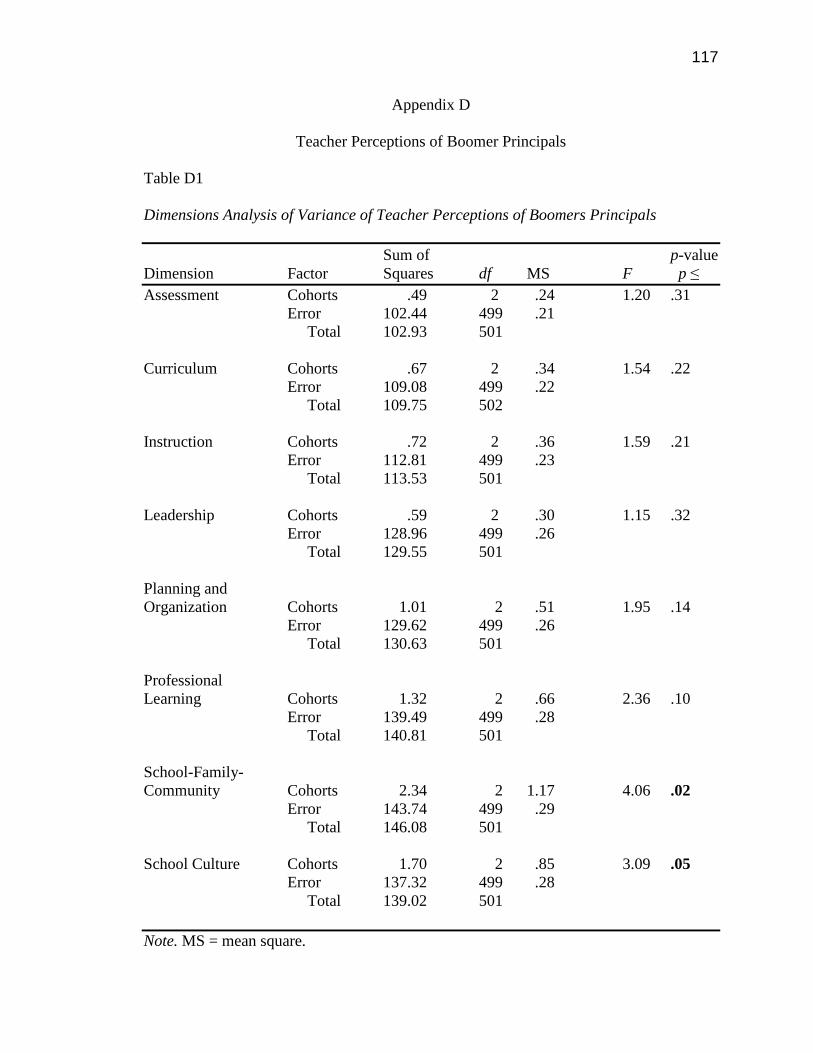
117
Appendix D
Teacher Perceptions of Boomer Principals
Table D1
Dimensions Analysis of Variance of Teacher Perceptions of Boomers Principals
Sum of p-value
Dimension Factor Squares df MS F p ≤
Assessment Cohorts .49 2 .24 1.20 .31
Error 102.44 499 .21
Total 102.93 501
Curriculum Cohorts .67 2 .34 1.54 .22
Error 109.08 499 .22
Total 109.75 502
Instruction Cohorts .72 2 .36 1.59 .21
Error 112.81 499 .23
Total 113.53 501
Leadership Cohorts .59 2 .30 1.15 .32
Error 128.96 499 .26
Total 129.55 501
Planning and
Organization Cohorts 1.01 2 .51 1.95 .14
Error 129.62 499 .26
Total 130.63 501
Professional
Learning Cohorts 1.32 2 .66 2.36 .10
Error 139.49 499 .28
Total 140.81 501
School-Family-
Community Cohorts 2.34 2 1.17 4.06 .02
Error 143.74 499 .29
Total 146.08 501
School Culture Cohorts 1.70 2 .85 3.09 .05
Error 137.32 499 .28
Total 139.02 501
Note. MS = mean square.
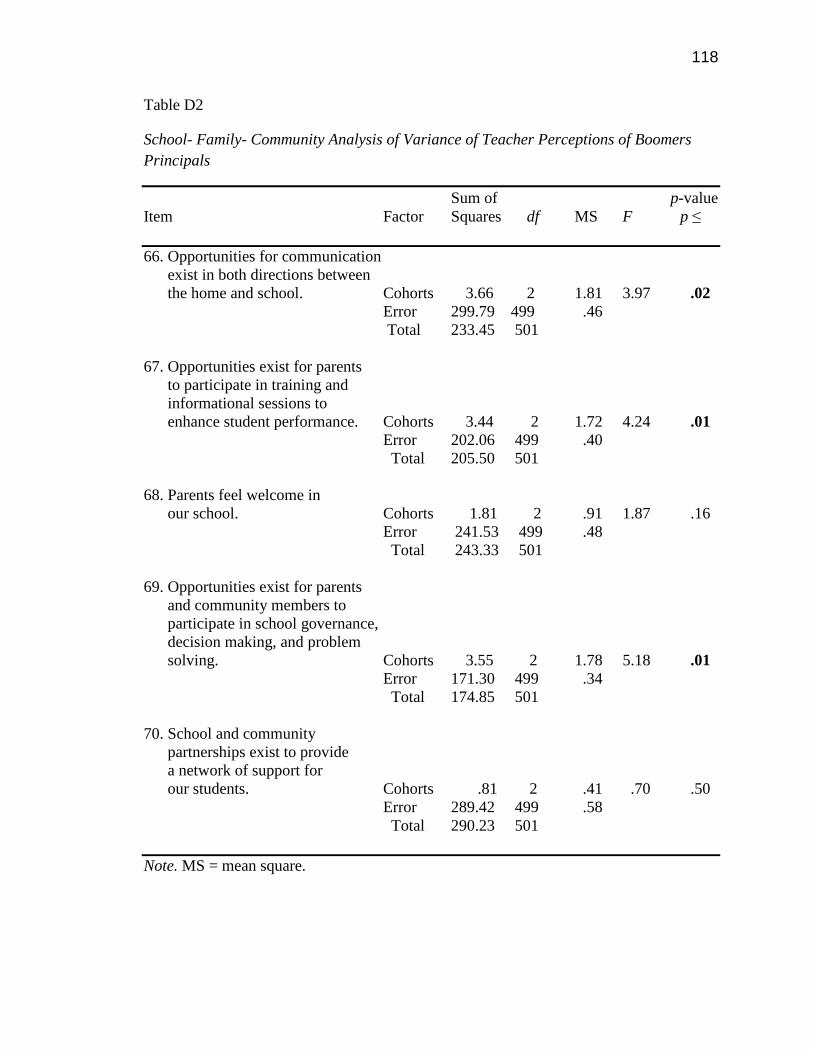
118
Table D2
School- Family- Community Analysis of Variance of Teacher Perceptions of Boomers
Principals
Sum of p-value
Item Factor Squares df MS F p ≤
66. Opportunities for communication
exist in both directions between
the home and school. Cohorts 3.66 2 1.81 3.97 .02
Error 299.79 499 .46
Total 233.45 501
67. Opportunities exist for parents
to participate in training and
informational sessions to
enhance student performance. Cohorts 3.44 2 1.72 4.24 .01
Error 202.06 499 .40
Total 205.50 501
68. Parents feel welcome in
our school. Cohorts 1.81 2 .91 1.87 .16
Error 241.53 499 .48
Total 243.33 501
69. Opportunities exist for parents
and community members to
participate in school governance,
decision making, and problem
solving. Cohorts 3.55 2 1.78 5.18 .01
Error 171.30 499 .34
Total 174.85 501
70. School and community
partnerships exist to provide
a network of support for
our students. Cohorts .81 2 .41 .70 .50
Error 289.42 499 .58
Total 290.23 501
Note. MS = mean square.
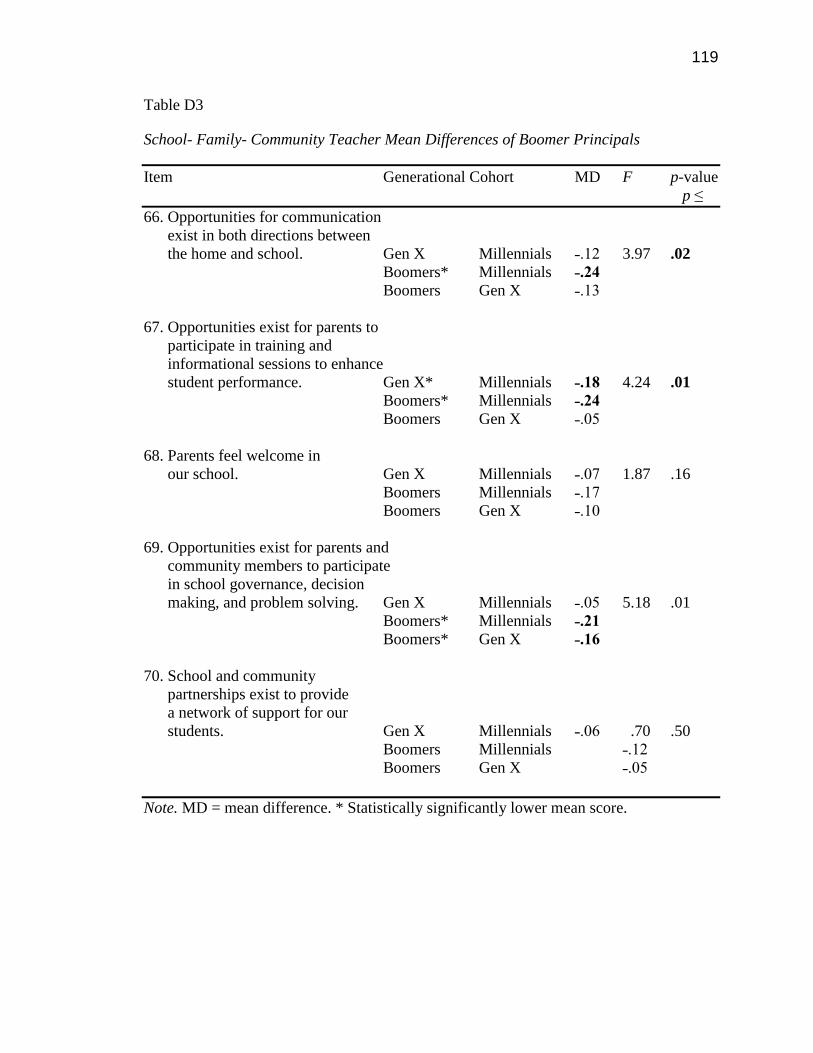
119
Table D3
School- Family- Community Teacher Mean Differences of Boomer Principals
Item Generational Cohort MD F p-value
p ≤
66. Opportunities for communication
exist in both directions between
the home and school. Gen X Millennials ˗.12 3.97 .02
Boomers* Millennials ˗.24
Boomers Gen X ˗.13
67. Opportunities exist for parents to
participate in training and
informational sessions to enhance
student performance. Gen X* Millennials ˗.18 4.24 .01
Boomers* Millennials ˗.24
Boomers Gen X ˗.05
68. Parents feel welcome in
our school. Gen X Millennials ˗.07 1.87 .16
Boomers Millennials ˗.17
Boomers Gen X ˗.10
69. Opportunities exist for parents and
community members to participate
in school governance, decision
making, and problem solving. Gen X Millennials ˗.05 5.18 .01
Boomers* Millennials ˗.21
Boomers* Gen X ˗.16
70. School and community
partnerships exist to provide
a network of support for our
students. Gen X Millennials ˗.06 .70 .50
Boomers Millennials ˗.12
Boomers Gen X ˗.05
Note. MD = mean difference. * Statistically significantly lower mean score.
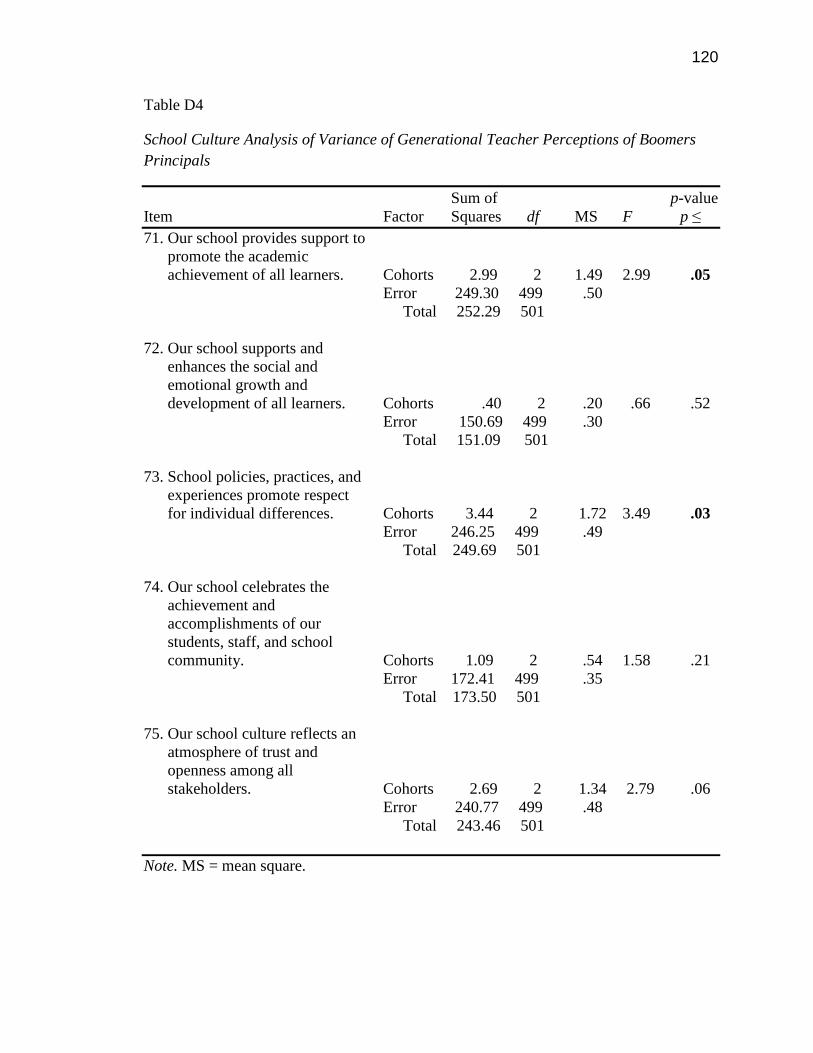
120
Table D4
School Culture Analysis of Variance of Generational Teacher Perceptions of Boomers
Principals
Sum of p-value
Item Factor Squares df MS F p ≤
71. Our school provides support to
promote the academic
achievement of all learners. Cohorts 2.99 2 1.49 2.99 .05
Error 249.30 499 .50
Total 252.29 501
72. Our school supports and
enhances the social and
emotional growth and
development of all learners. Cohorts .40 2 .20 .66 .52
Error 150.69 499 .30
Total 151.09 501
73. School policies, practices, and
experiences promote respect
for individual differences. Cohorts 3.44 2 1.72 3.49 .03
Error 246.25 499 .49
Total 249.69 501
74. Our school celebrates the
achievement and
accomplishments of our
students, staff, and school
community. Cohorts 1.09 2 .54 1.58 .21
Error 172.41 499 .35
Total 173.50 501
75. Our school culture reflects an
atmosphere of trust and
openness among all
stakeholders. Cohorts 2.69 2 1.34 2.79 .06
Error 240.77 499 .48
Total 243.46 501
Note. MS = mean square.
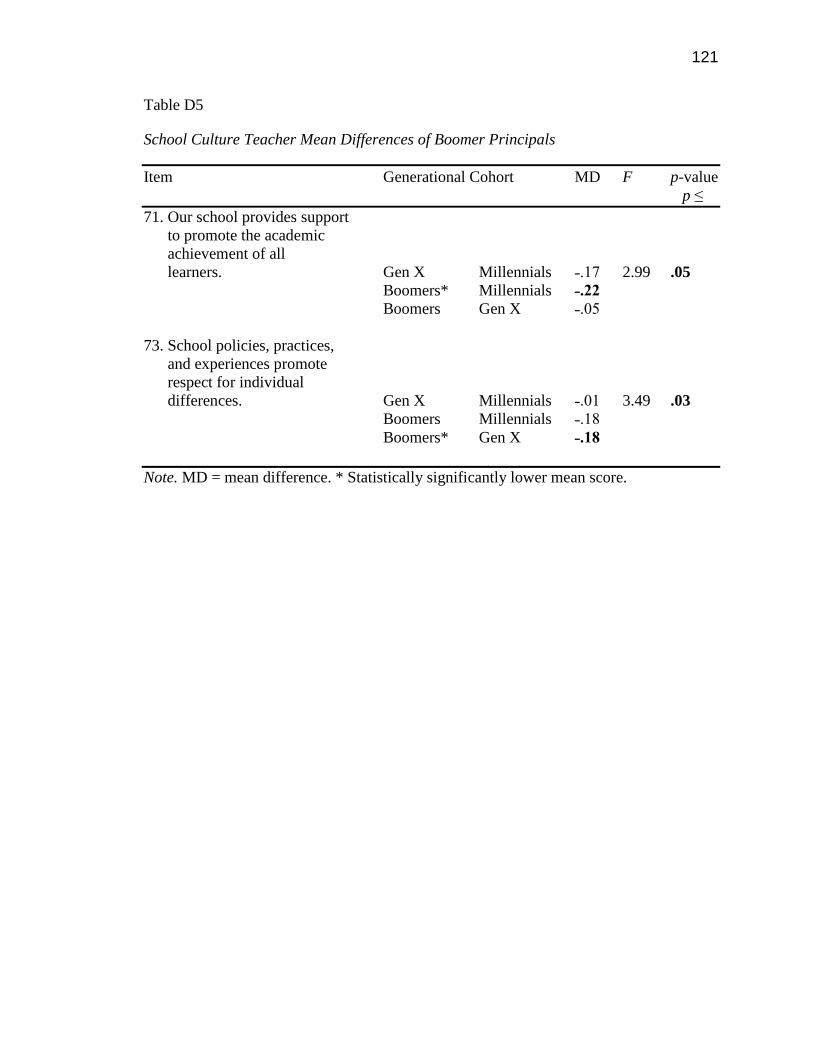
121
Table D5
School Culture Teacher Mean Differences of Boomer Principals
Item Generational Cohort MD F p-value
p ≤
71. Our school provides support
to promote the academic
achievement of all
learners. Gen X Millennials ˗.17 2.99 .05
Boomers* Millennials ˗.22
Boomers Gen X ˗.05
73. School policies, practices,
and experiences promote
respect for individual
differences. Gen X Millennials ˗.01 3.49 .03
Boomers Millennials ˗.18
Boomers* Gen X ˗.18
Note. MD = mean difference. * Statistically significantly lower mean score.

122
Appendix E
Teacher Perceptions of Gen X Principals
Table E1
Dimension Analysis of Variance of Teacher Perceptions of Gen X Principals
Sum of p-value
Dimension Factor Squares df MS F p ≤
Assessment Cohorts 1.45 2 .72 3.75 .02
Error 113.54 590 .19
Total 114.99 592
Curriculum Cohorts 2.00 2 1.00 4.45 .01
Error 132.59 590 .22
Total 134.59 592
Instruction Cohorts 2.95 2 1.48 6.51 .002
Error 133.69 590 .23
Total 136.64 592
Leadership Cohorts 2.90 2 1.45 5.96 .003
Error 143.64 590 .24
Total 146.54 592
Planning and
Organization Cohorts 2.03 2 1.01 4.03 .02
Error 148.07 590 .25
Total 150.10 592
Professional
Learning Cohorts 2.49 2 1.24 4.65 .01
Error 157.76 590 .27
Total 160.25 592
School-Family-
Community Cohorts 1.44 2 .72 2.39 .09
Error 178.27 590 .30
Total 179.71 592
School Culture Cohorts 2.17 2 1.08 3.96 .02
Error 161.77 590 .27
Total 163.94 592
Note. MS = mean square.
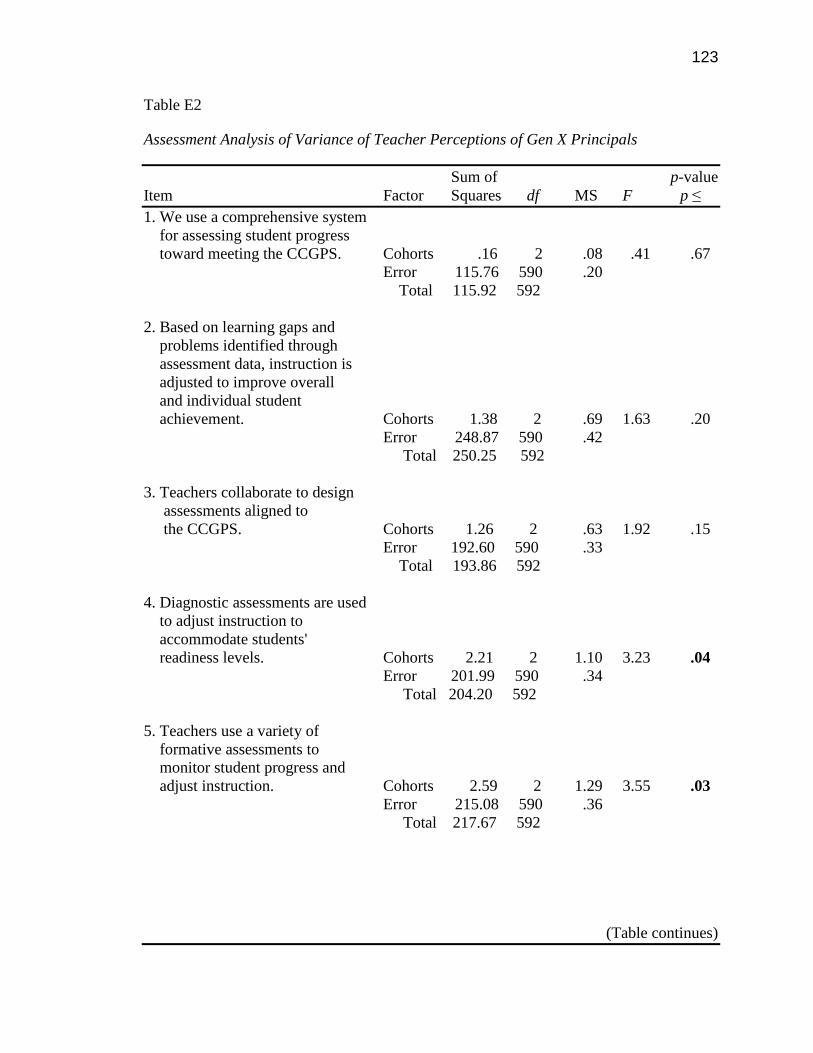
123
Table E2
Assessment Analysis of Variance of Teacher Perceptions of Gen X Principals
Sum of p-value
Item Factor Squares df MS F p ≤
1. We use a comprehensive system
for assessing student progress
toward meeting the CCGPS. Cohorts .16 2 .08 .41 .67
Error 115.76 590 .20
Total 115.92 592
2. Based on learning gaps and
problems identified through
assessment data, instruction is
adjusted to improve overall
and individual student
achievement. Cohorts 1.38 2 .69 1.63 .20
Error 248.87 590 .42
Total 250.25 592
3. Teachers collaborate to design
assessments aligned to
the CCGPS. Cohorts 1.26 2 .63 1.92 .15
Error 192.60 590 .33
Total 193.86 592
4. Diagnostic assessments are used
to adjust instruction to
accommodate students'
readiness levels. Cohorts 2.21 2 1.10 3.23 .04
Error 201.99 590 .34
Total 204.20 592
5. Teachers use a variety of
formative assessments to
monitor student progress and
adjust instruction. Cohorts 2.59 2 1.29 3.55 .03
Error 215.08 590 .36
Total 217.67 592
(Table continues)
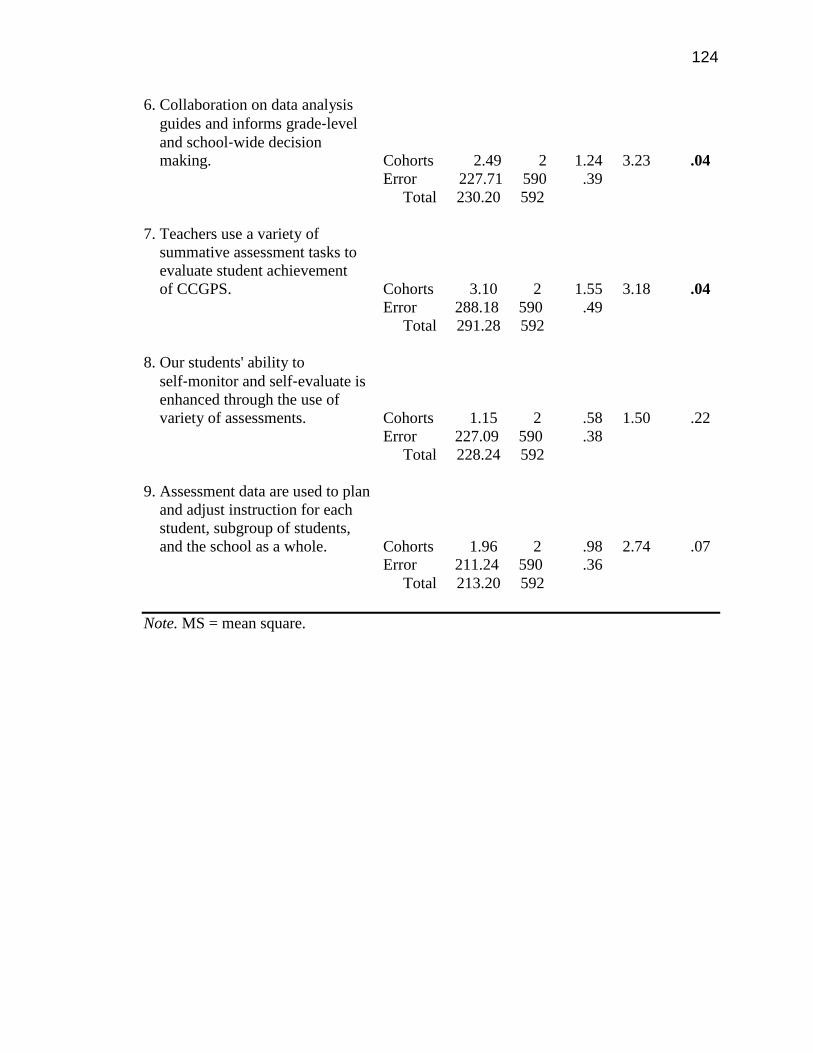
124
6. Collaboration on data analysis
guides and informs grade-level
and school-wide decision
making. Cohorts 2.49 2 1.24 3.23 .04
Error 227.71 590 .39
Total 230.20 592
7. Teachers use a variety of
summative assessment tasks to
evaluate student achievement
of CCGPS. Cohorts 3.10 2 1.55 3.18 .04
Error 288.18 590 .49
Total 291.28 592
8. Our students' ability to
self-monitor and self-evaluate is
enhanced through the use of
variety of assessments. Cohorts 1.15 2 .58 1.50 .22
Error 227.09 590 .38
Total 228.24 592
9. Assessment data are used to plan
and adjust instruction for each
student, subgroup of students,
and the school as a whole. Cohorts 1.96 2 .98 2.74 .07
Error 211.24 590 .36
Total 213.20 592
Note. MS = mean square.

125
Table E3
Assessment Teacher Mean Differences of Gen X Principals
Item Generational Cohort MD F p-value
p ≤
4. Diagnostic assessments are used
to adjust instruction to
accommodate students'
readiness levels. Gen X Millennials* .16 3.23 .04
Boomers Millennials .06
Boomers Gen X ˗.10
5. Teachers use a variety of formative
assessments to monitor student
progress and adjust
instruction. Gen X Millennials* .18 3.55 .03
Boomers Millennials .11
Boomers Gen X ˗.08
6. Collaboration on data analysis
Guides and informs grade-level
And school-wide decision
making. Gen X Millennials* .18 3.23 .04
Boomers Millennials .16
Boomers Gen X ˗.02
7. Teachers use a variety of
Summative assessment tasks
to evaluate student
achievement of CCGPS. Gen X Millennials* .20 3.18 .04
Boomers Millennials .17
Boomers Gen X ˗.03
Note. MD = mean difference. * Statistically significantly lower mean score.

126
Table E4
Curriculum Analysis of Variance of Teacher Perceptions of Gen X Principals
Sum of p-value
Item Factor Squares df MS F p ≤
10. Our written curriculum
documents are aligned with
CCGPS and are used to guide
Instruction. Cohorts 1.47 2 .73 1.67 .19
Error 259.02 590 .44
Total 260.49 592
11. Our curriculum has been
aligned horizontally and
vertically in order to support
students' mastery of the
CCGPS standards. Cohorts 1.44 2 .72 1.88 .15
Error 226.19 590 .38
Total 227.63 592
12. Our curriculum maps and units
are designed to ensure all
students participate in a
curriculum that requires depth
of understanding and rigor. Cohorts 3.10 2 1.55 3.37 .03
Error 271.58 590 .46
Total 274.68 592
13. Our teachers have a shared
understanding of what students
are expected to know, do, and
understand at all grade levels
and in all subject areas. Cohorts 1.65 2 .82 2.00 .14
Error 242.82 590 .41
Total 244.47 592
14. We meet to collaborate on the
design and implementation of
the curriculum. Cohorts 3.05 2 1.52 2.79 .06
Error 321.33 590 .54
Total 324.38 592
(Table continues)
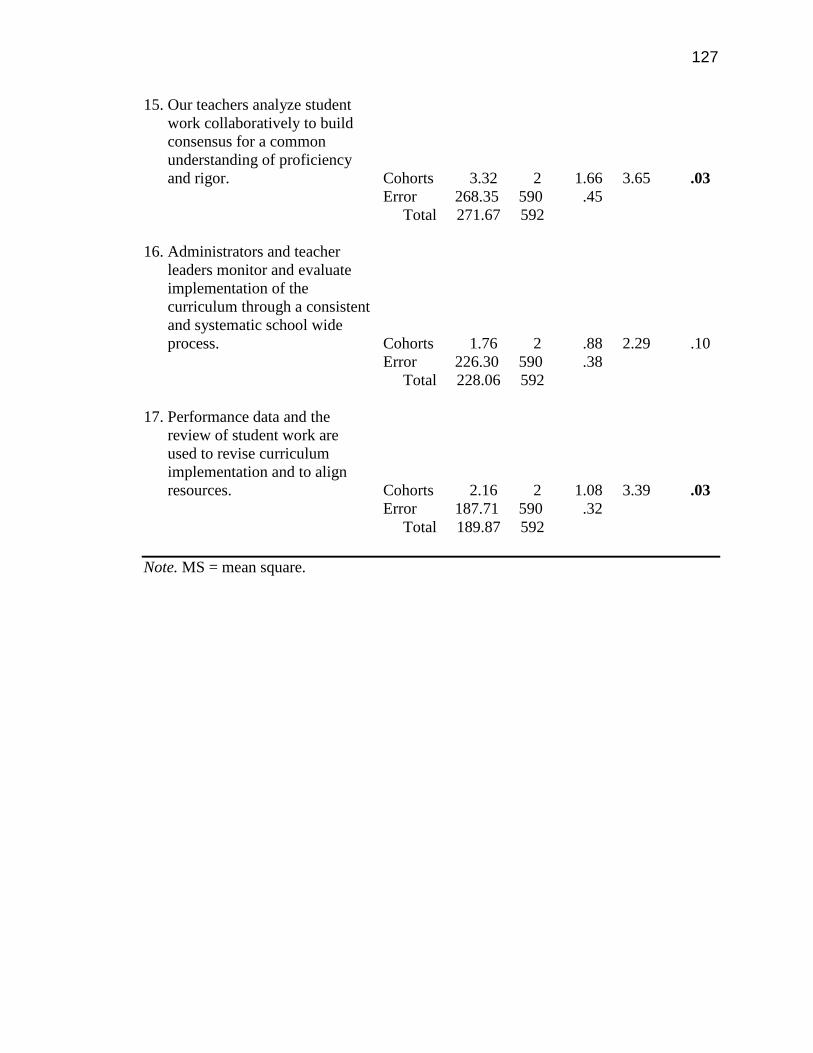
127
15. Our teachers analyze student
work collaboratively to build
consensus for a common
understanding of proficiency
and rigor. Cohorts 3.32 2 1.66 3.65 .03
Error 268.35 590 .45
Total 271.67 592
16. Administrators and teacher
leaders monitor and evaluate
implementation of the
curriculum through a consistent
and systematic school wide
process. Cohorts 1.76 2 .88 2.29 .10
Error 226.30 590 .38
Total 228.06 592
17. Performance data and the
review of student work are
used to revise curriculum
implementation and to align
resources. Cohorts 2.16 2 1.08 3.39 .03
Error 187.71 590 .32
Total 189.87 592
Note. MS = mean square.

128
Table E5
Curriculum Teacher Mean Differences of Gen X Principals
Item Generational Cohort MD F p-value
p ≤
12. Our curriculum maps and units
are designed to ensure all students
participate in a curriculum that
requires depth of
understanding and rigor. Gen X Millennials* .20 3.37 .03
Boomers Millennials .16
Boomers Gen X ˗.05
14. We meet to collaborate on the
design and implementation
of the curriculum. Gen X Millennials .15 2.79 .06
Boomers Millennials .02
Boomers Gen X ˗.14
15. Our teachers analyze student
work collaboratively to build
consensus for a common
understanding of proficiency
and rigor. Gen X Millennials* .20 3.65 .03
Boomers Millennials .09
Boomers Gen X ˗.11
17. Performance data and the review
of student work are used to revise
curriculum implementation and
to align resources. Gen X Millennials* .17 3.39 .03
Boomers Millennials .10
Boomers Gen X ˗.07
Note. MD = mean difference. * Statistically significantly lower mean score.
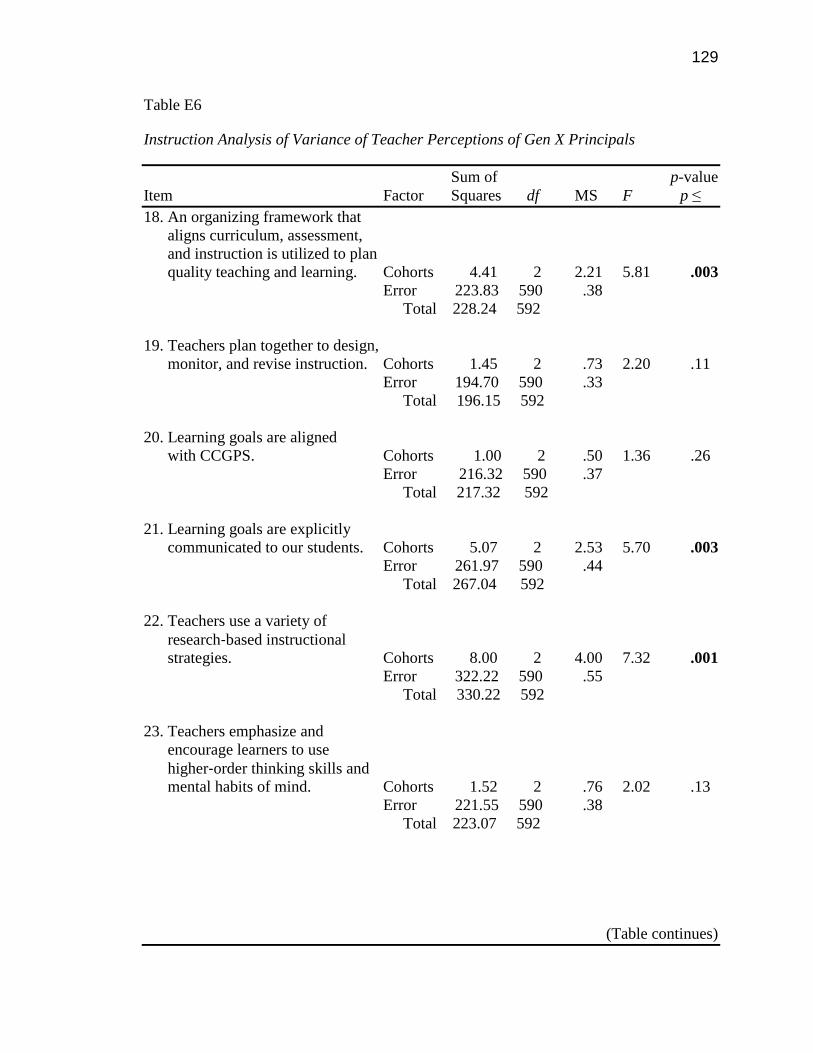
129
Table E6
Instruction Analysis of Variance of Teacher Perceptions of Gen X Principals
Sum of p-value
Item Factor Squares df MS F p ≤
18. An organizing framework that
aligns curriculum, assessment,
and instruction is utilized to plan
quality teaching and learning. Cohorts 4.41 2 2.21 5.81 .003
Error 223.83 590 .38
Total 228.24 592
19. Teachers plan together to design,
monitor, and revise instruction. Cohorts 1.45 2 .73 2.20 .11
Error 194.70 590 .33
Total 196.15 592
20. Learning goals are aligned
with CCGPS. Cohorts 1.00 2 .50 1.36 .26
Error 216.32 590 .37
Total 217.32 592
21. Learning goals are explicitly
communicated to our students. Cohorts 5.07 2 2.53 5.70 .003
Error 261.97 590 .44
Total 267.04 592
22. Teachers use a variety of
research-based instructional
strategies. Cohorts 8.00 2 4.00 7.32 .001
Error 322.22 590 .55
Total 330.22 592
23. Teachers emphasize and
encourage learners to use
higher-order thinking skills and
mental habits of mind. Cohorts 1.52 2 .76 2.02 .13
Error 221.55 590 .38
Total 223.07 592
(Table continues)

130
24. Differentiated instruction,
adjustment of content, product,
process and/or learning
environment, is provided to
support students according to
their instructional needs. Cohorts 3.58 2 1.79 3.28 .04
Error 322.01 590 .55
Total 325.59 592
25. We utilize flexible grouping
based on ongoing diagnosis and
formative assessment to enhance
student learning. Cohorts 1.91 2 .96 2.42 .09
Error 233.06 590 .40
Total 234.97 592
26. Systematic and data-driven
interventions are required for
our students who need additional
assistance to master standards. Cohorts 2.14 2 1.07 2.26 .11
Error 279.33 590 .47
Total 281.47 592
27. Technology is effectively
utilized to maximize student
learning. Cohorts 2.73 2 1.37 3.20 .04
Error 251.35 590 .43
Total 254.08 592
28. Our students are engaged in
work that is authentic,
standards-driven and requires
higher-order reasoning. Cohorts 4.42 2 2.21 4.31 .01
Error 302.39 590 .51
Total 306.81 592
29. Teachers and students work
collaboratively to establish high
expectations and challenging
learning goals. Cohorts 3.85 2 1.92 4.77 .01
Error 237.62 590 .40
Total 241.47 592
(Table continues)
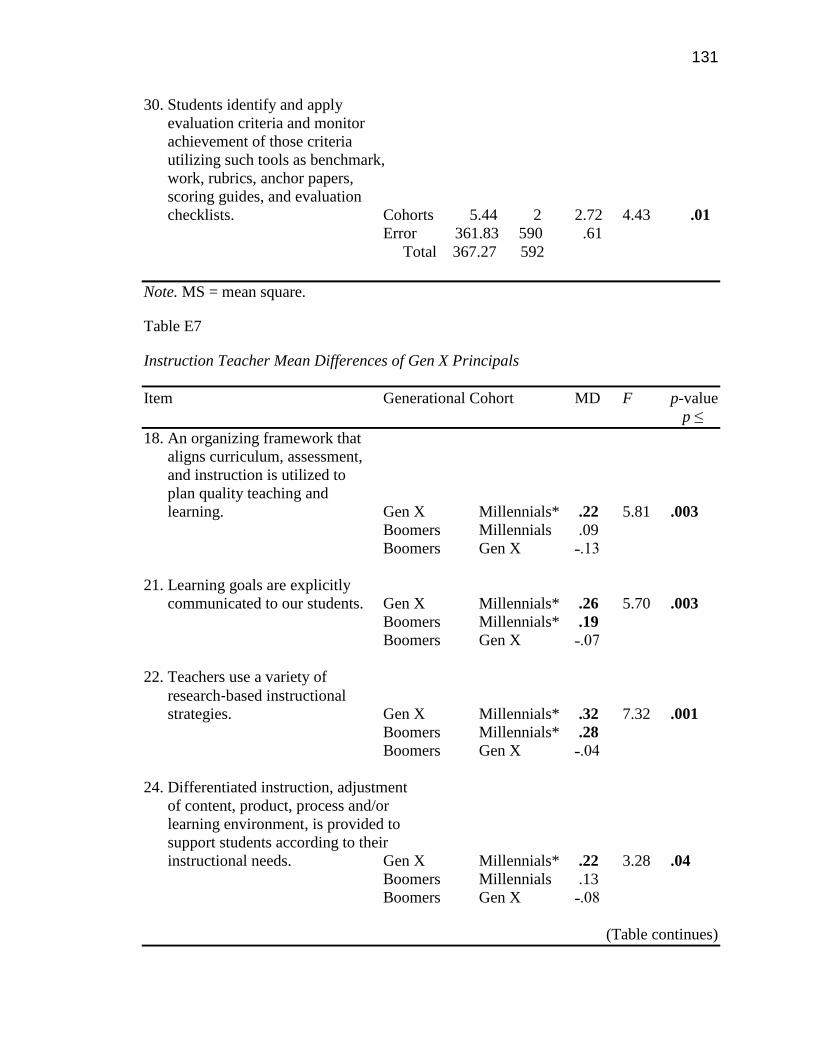
131
30. Students identify and apply
evaluation criteria and monitor
achievement of those criteria
utilizing such tools as benchmark,
work, rubrics, anchor papers,
scoring guides, and evaluation
checklists. Cohorts 5.44 2 2.72 4.43 .01
Error 361.83 590 .61
Total 367.27 592
Note. MS = mean square.
Table E7
Instruction Teacher Mean Differences of Gen X Principals
Item Generational Cohort MD F p-value
p ≤
18. An organizing framework that
aligns curriculum, assessment,
and instruction is utilized to
plan quality teaching and
learning. Gen X Millennials* .22 5.81 .003
Boomers Millennials .09
Boomers Gen X ˗.13
21. Learning goals are explicitly
communicated to our students. Gen X Millennials* .26 5.70 .003
Boomers Millennials* .19
Boomers Gen X ˗.07
22. Teachers use a variety of
research-based instructional
strategies. Gen X Millennials* .32 7.32 .001
Boomers Millennials* .28
Boomers Gen X ˗.04
24. Differentiated instruction, adjustment
of content, product, process and/or
learning environment, is provided to
support students according to their
instructional needs. Gen X Millennials* .22 3.28 .04
Boomers Millennials .13
Boomers Gen X ˗.08
(Table continues)

132
27. Technology is effectively utilized
to maximize student
learning. Gen X Millennials .16 3.20 .04
Boomers Millennials* .19
Boomers Gen X .03
28. Our students are engaged in
work that is authentic,
standards-driven and requires
higher-order reasoning. Gen X Millennials* .22 4.31 .01
Boomers Millennials* .23
Boomers Gen X .01
29. Teachers and students work
collaboratively to establish high
expectations and challenging
learning goals. Gen X Millennials* .22 4.77 .01
Boomers Millennials .14
Boomers Gen X ˗.09
30. Students identify and apply
evaluation criteria and monitor
achievement of those criteria
utilizing such tools as benchmark,
work, rubrics, anchor papers,
scoring guides, and evaluation
checklists. Gen X Millennials* .27 4.43 .01
Boomers Millennials .20
Boomers Gen X ˗.06
Note. MD = mean difference. * Statistically significantly lower mean score.
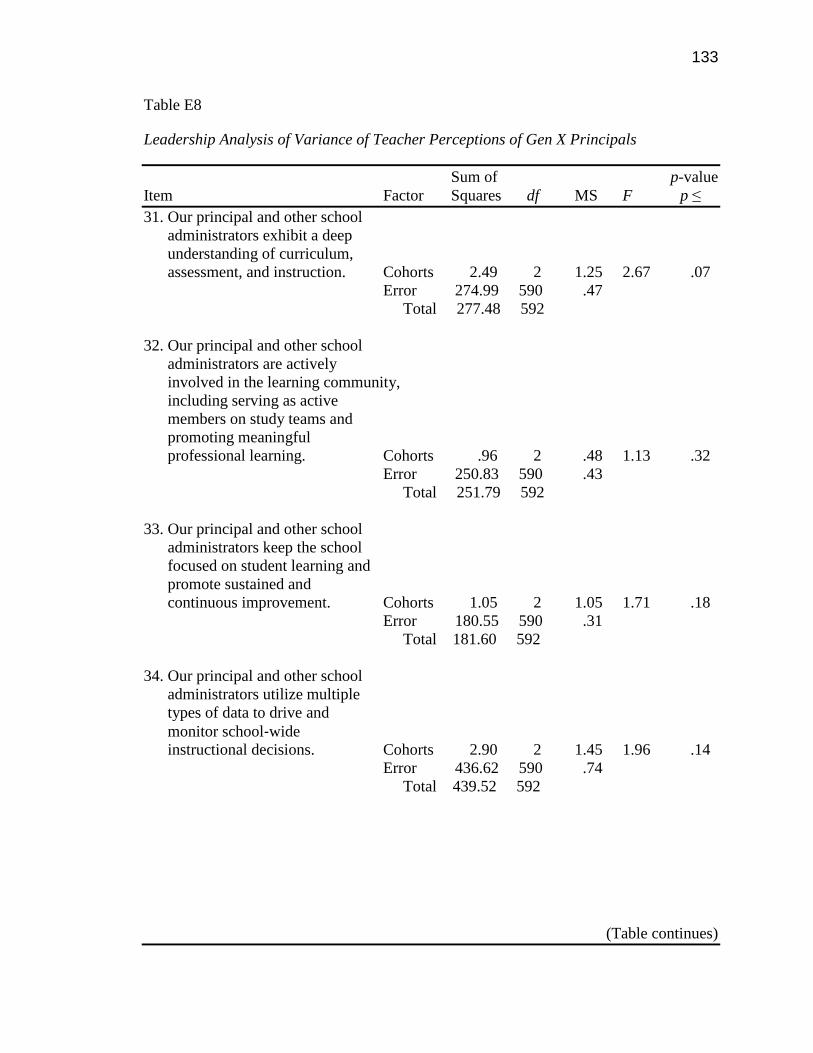
133
Table E8
Leadership Analysis of Variance of Teacher Perceptions of Gen X Principals
Sum of p-value
Item Factor Squares df MS F p ≤
31. Our principal and other school
administrators exhibit a deep
understanding of curriculum,
assessment, and instruction. Cohorts 2.49 2 1.25 2.67 .07
Error 274.99 590 .47
Total 277.48 592
32. Our principal and other school
administrators are actively
involved in the learning community,
including serving as active
members on study teams and
promoting meaningful
professional learning. Cohorts .96 2 .48 1.13 .32
Error 250.83 590 .43
Total 251.79 592
33. Our principal and other school
administrators keep the school
focused on student learning and
promote sustained and
continuous improvement. Cohorts 1.05 2 1.05 1.71 .18
Error 180.55 590 .31
Total 181.60 592
34. Our principal and other school
administrators utilize multiple
types of data to drive and
monitor school-wide
instructional decisions. Cohorts 2.90 2 1.45 1.96 .14
Error 436.62 590 .74
Total 439.52 592
(Table continues)

134
35. Our principal and other school
administrators implement
policies, practices, and
procedures that ensure a safe and
orderly learning environment. Cohorts 3.11 2 1.56 3.55 .03
Error 258.56 590 .44
Total 261.67 592
36. Our principal and other school
administrators maximize the
availability and distribution of
instructional resources focused
on school learning goals. Cohorts .61 2 .30 .76 .47
Error 237.29 590 .40
Total 237.90 592
37. Our principal and other school
administrators are visible to
staff, students, and parents and
participate in subject and/or
grade level meetings. Cohorts 3.92 2 1.96 2.91 .06
Error 397.79 590 .67
Total 401.71 592
38. Our principal and other school
administrators collaborate with
staff members and other
stakeholders to elicit input and
provide opportunities for shared
decision-making and
problem-solving. Cohorts 3.97 2 1.98 3.63 .03
Error 322.84 590 .55
Total 326.81 592
39. Staff members have
opportunities to serve in a
variety of leadership roles. Cohorts 9.11 2 4.55 6.82 .001
Error 394.37 590 .67
Total 403.48 592
(Table continues)
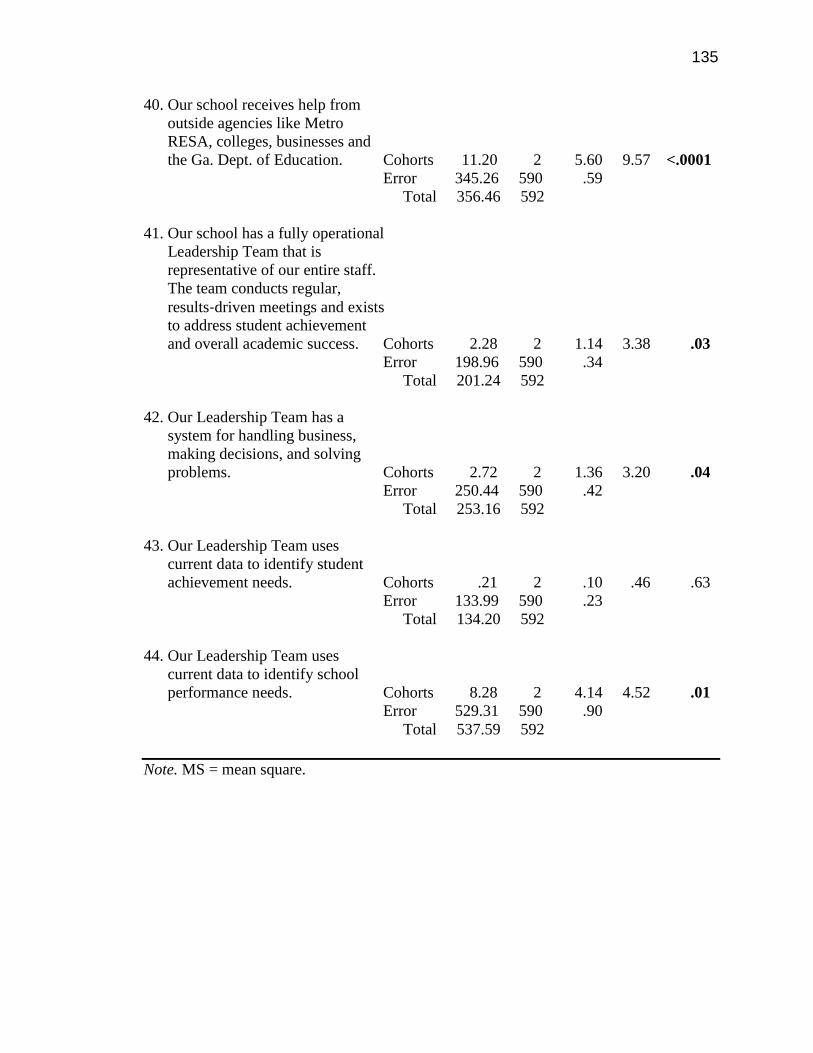
135
40. Our school receives help from
outside agencies like Metro
RESA, colleges, businesses and
the Ga. Dept. of Education. Cohorts 11.20 2 5.60 9.57 <.0001
Error 345.26 590 .59
Total 356.46 592
41. Our school has a fully operational
Leadership Team that is
representative of our entire staff.
The team conducts regular,
results-driven meetings and exists
to address student achievement
and overall academic success. Cohorts 2.28 2 1.14 3.38 .03
Error 198.96 590 .34
Total 201.24 592
42. Our Leadership Team has a
system for handling business,
making decisions, and solving
problems. Cohorts 2.72 2 1.36 3.20 .04
Error 250.44 590 .42
Total 253.16 592
43. Our Leadership Team uses
current data to identify student
achievement needs. Cohorts .21 2 .10 .46 .63
Error 133.99 590 .23
Total 134.20 592
44. Our Leadership Team uses
current data to identify school
performance needs. Cohorts 8.28 2 4.14 4.52 .01
Error 529.31 590 .90
Total 537.59 592
Note. MS = mean square.

136
Table E9
Leadership Teacher Mean Differences of Gen X Principals
Item Generational Cohort MD F p-value
p ≤
31. Our principal and other school
administrators exhibit a deep
understanding of curriculum,
assessment, and instruction. Gen X Millennials .18 2.67 .07
Boomers Millennials .17
Boomers Gen X ˗.01
35. Our principal and other school
administrators implement policies,
practices, and procedures that
ensure a safe and orderly
learning environment. Gen X Millennials* .19 3.55 .03
Boomers Millennials .09
Boomers Gen X ˗.10
37. Our principal and other school
administrators are visible to staff,
students, and parents and
participate in subject and/or
grade level meetings. Gen X Millennials .22 2.91 .06
Boomers Millennials .20
Boomers Gen X ˗.02
38. Our principal and other school
administrators collaborate with
staff members and other
stakeholders to elicit input and
provide opportunities for shared
decision-making and
problem-solving. Gen X Millennials* .23 3.63 .03
Boomers Millennials .17
Boomers Gen X ˗.06
39. Staff members have
opportunities to serve in a
variety of leadership roles. Gen X Millennials* .34 6.82 .001
Boomers Millennials .18
Boomers Gen X ˗.16
(Tables continues)
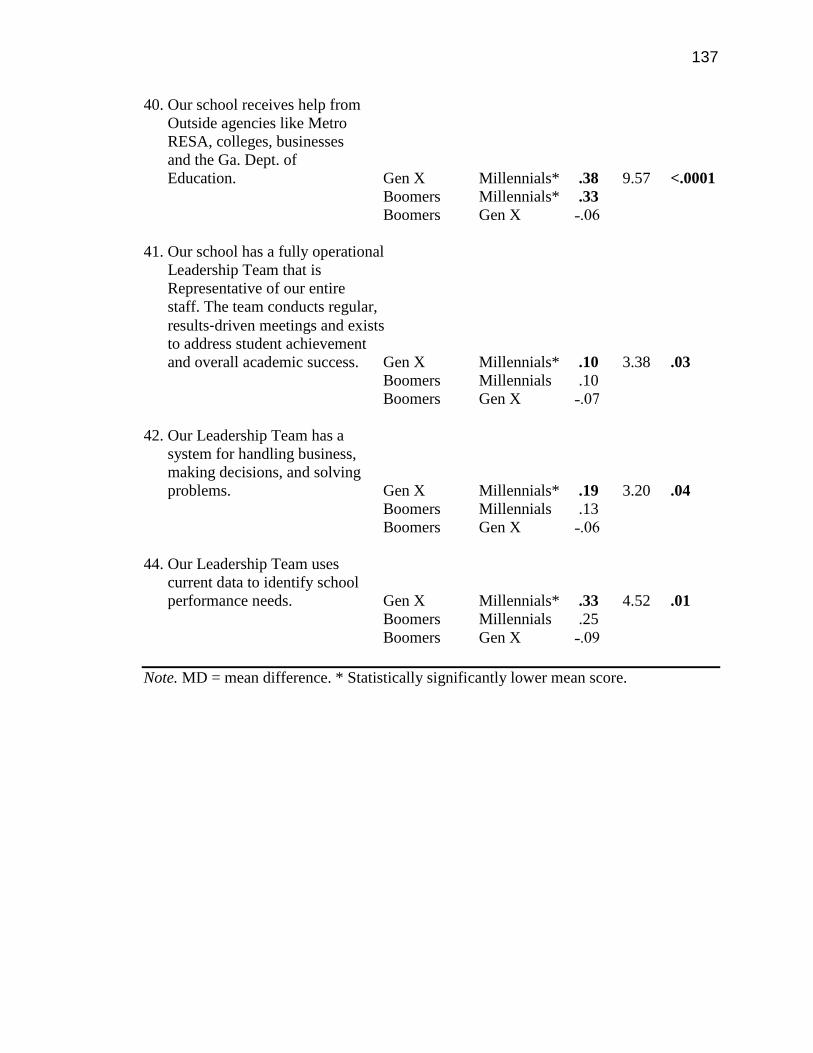
137
40. Our school receives help from
Outside agencies like Metro
RESA, colleges, businesses
and the Ga. Dept. of
Education. Gen X Millennials* .38 9.57 <.0001
Boomers Millennials* .33
Boomers Gen X ˗.06
41. Our school has a fully operational
Leadership Team that is
Representative of our entire
staff. The team conducts regular,
results-driven meetings and exists
to address student achievement
and overall academic success. Gen X Millennials* .10 3.38 .03
Boomers Millennials .10
Boomers Gen X ˗.07
42. Our Leadership Team has a
system for handling business,
making decisions, and solving
problems. Gen X Millennials* .19 3.20 .04
Boomers Millennials .13
Boomers Gen X ˗.06
44. Our Leadership Team uses
current data to identify school
performance needs. Gen X Millennials* .33 4.52 .01
Boomers Millennials .25
Boomers Gen X ˗.09
Note. MD = mean difference. * Statistically significantly lower mean score.
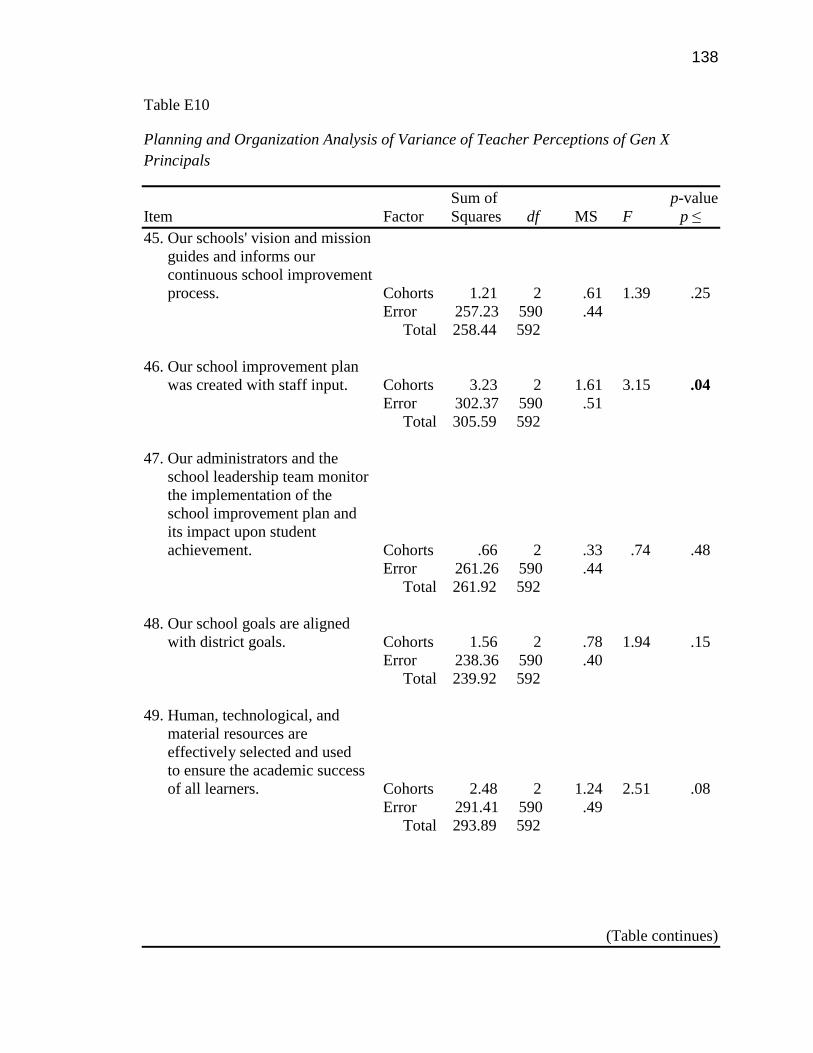
138
Table E10
Planning and Organization Analysis of Variance of Teacher Perceptions of Gen X
Principals
Sum of p-value
Item Factor Squares df MS F p ≤
45. Our schools' vision and mission
guides and informs our
continuous school improvement
process. Cohorts 1.21 2 .61 1.39 .25
Error 257.23 590 .44
Total 258.44 592
46. Our school improvement plan
was created with staff input. Cohorts 3.23 2 1.61 3.15 .04
Error 302.37 590 .51
Total 305.59 592
47. Our administrators and the
school leadership team monitor
the implementation of the
school improvement plan and
its impact upon student
achievement. Cohorts .66 2 .33 .74 .48
Error 261.26 590 .44
Total 261.92 592
48. Our school goals are aligned
with district goals. Cohorts 1.56 2 .78 1.94 .15
Error 238.36 590 .40
Total 239.92 592
49. Human, technological, and
material resources are
effectively selected and used
to ensure the academic success
of all learners. Cohorts 2.48 2 1.24 2.51 .08
Error 291.41 590 .49
Total 293.89 592
(Table continues)

139
50. A safe learning environment is
planned, implemented, and
maintained by our school staff
and administrators. Cohorts 1.02 2 .51 1.58 .21
Error 191.08 590 .32
Total 192.10 592
51. Instructional time is maximized,
and no interruptions occur to
detract from time on learning. Cohorts 3.59 2 1.80 3.23 .04
Error 327.73 590 .56
Total 331.32 592
52. Our school facility is
adequately maintained,
clean, and conducive for
teaching and learning. Cohorts 2.66 2 1.33 3.45 .03
Error 227.28 590 .39
Total 229.94 592
Note. MS = mean square.

140
Table E11
Planning and Organization Teacher Mean Differences of Gen X Principals
Item Generational Cohort MD F p-value
p ≤
46. Our school improvement
plan was created with
staff input. Gen X Millennials* .20 3.15 .04
Boomers Millennials .18
Boomers Gen X ˗.03
51. Instructional time is
maximized, and no
interruptions occur to detract
from time on learning. Gen X Millennials* .21 3.23 .04
Boomers Millennials .20
Boomers Gen X ˗.03
52. Our school facility is
adequately maintained, clean,
and conducive for teaching
and learning. Gen X Millennials* .19 3.45 .03
Boomers Millennials .11
Boomers Gen X ˗.08
Note. MD = mean difference. * Statistically significantly lower mean score.

141
Table E12
Professional Learning Analysis of Variance of Teacher Perceptions of Gen X Principals
Sum of p-value
Item Factor Squares df MS F p ≤
53. Teachers and administrators
participate in job-embedded
professional learning and
collaboration addressing
curriculum, assessment,
instruction, and technology. Cohorts 6.05 2 3.02 4.63 .01
Error 385.09 590 .65
Total 391.14 592
54. The principal and other school
leaders set clear expectations
and monitor the effectiveness of
professional learning on teacher
practices and student learning. Cohorts 1.67 2 .84 4.93 .15
Error 255.48 590 .43
Total 257.53 592
55. Opportunities exist for teachers
in our school to participate in
instructional leadership
development. Cohorts 1.27 2 .64 1.34 .26
Error 279.07 590 .47
Total 280.34 592
56. The principal and other leaders
utilize data to plan for
professional learning. Cohorts 2.05 2 1.03 2.15 .12
Error 281.90 590 .48
Total 283.95 592
57. The professional learning
activities at my school are
connected to our school
improvement goals. Cohorts 2.77 2 1.38 2.23 .11
Error 366.06 590 .62
Total 368.83 592
(Table continues)
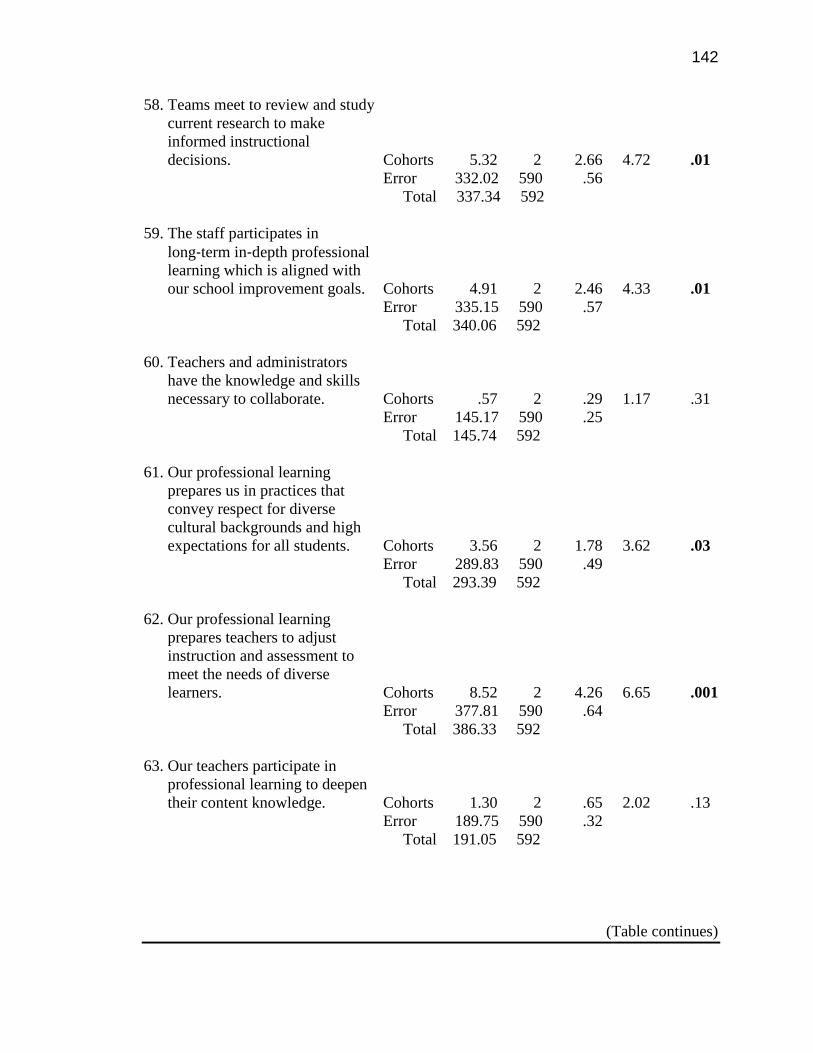
142
58. Teams meet to review and study
current research to make
informed instructional
decisions. Cohorts 5.32 2 2.66 4.72 .01
Error 332.02 590 .56
Total 337.34 592
59. The staff participates in
long-term in-depth professional
learning which is aligned with
our school improvement goals. Cohorts 4.91 2 2.46 4.33 .01
Error 335.15 590 .57
Total 340.06 592
60. Teachers and administrators
have the knowledge and skills
necessary to collaborate. Cohorts .57 2 .29 1.17 .31
Error 145.17 590 .25
Total 145.74 592
61. Our professional learning
prepares us in practices that
convey respect for diverse
cultural backgrounds and high
expectations for all students. Cohorts 3.56 2 1.78 3.62 .03
Error 289.83 590 .49
Total 293.39 592
62. Our professional learning
prepares teachers to adjust
instruction and assessment to
meet the needs of diverse
learners. Cohorts 8.52 2 4.26 6.65 .001
Error 377.81 590 .64
Total 386.33 592
63. Our teachers participate in
professional learning to deepen
their content knowledge. Cohorts 1.30 2 .65 2.02 .13
Error 189.75 590 .32
Total 191.05 592
(Table continues)
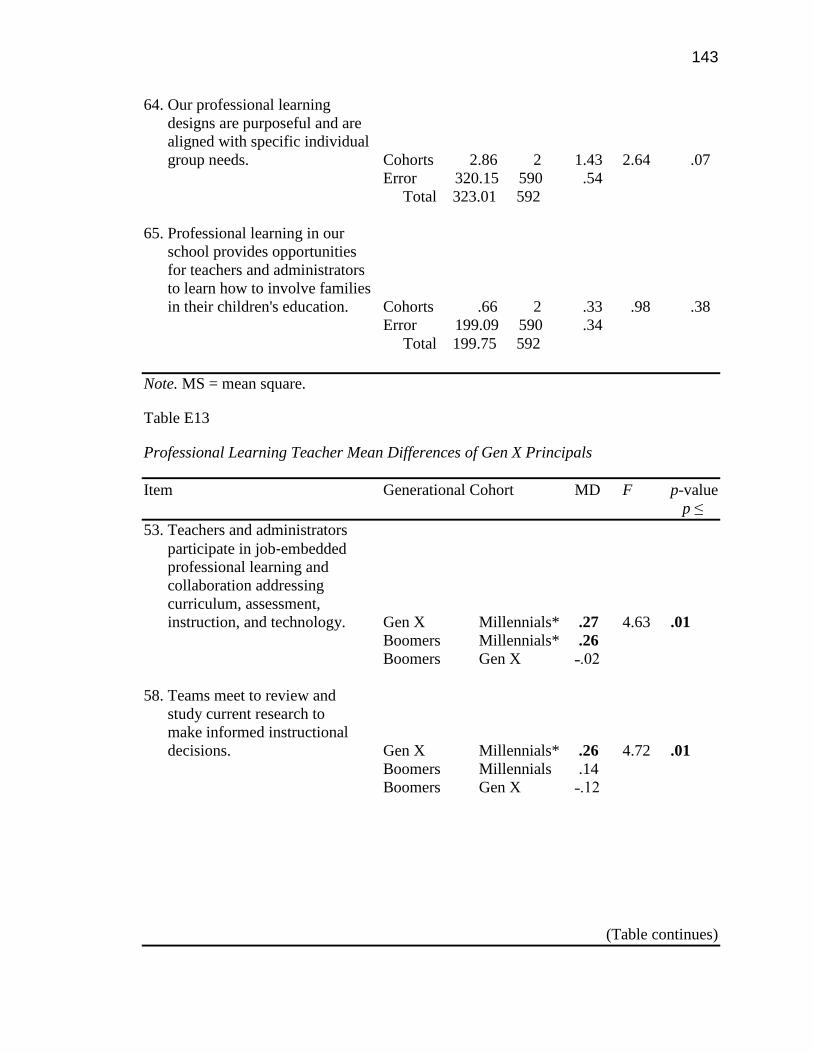
143
64. Our professional learning
designs are purposeful and are
aligned with specific individual
group needs. Cohorts 2.86 2 1.43 2.64 .07
Error 320.15 590 .54
Total 323.01 592
65. Professional learning in our
school provides opportunities
for teachers and administrators
to learn how to involve families
in their children's education. Cohorts .66 2 .33 .98 .38
Error 199.09 590 .34
Total 199.75 592
Note. MS = mean square.
Table E13
Professional Learning Teacher Mean Differences of Gen X Principals
Item Generational Cohort MD F p-value
p ≤
53. Teachers and administrators
participate in job-embedded
professional learning and
collaboration addressing
curriculum, assessment,
instruction, and technology. Gen X Millennials* .27 4.63 .01
Boomers Millennials* .26
Boomers Gen X ˗.02
58. Teams meet to review and
study current research to
make informed instructional
decisions. Gen X Millennials* .26 4.72 .01
Boomers Millennials .14
Boomers Gen X ˗.12
(Table continues)
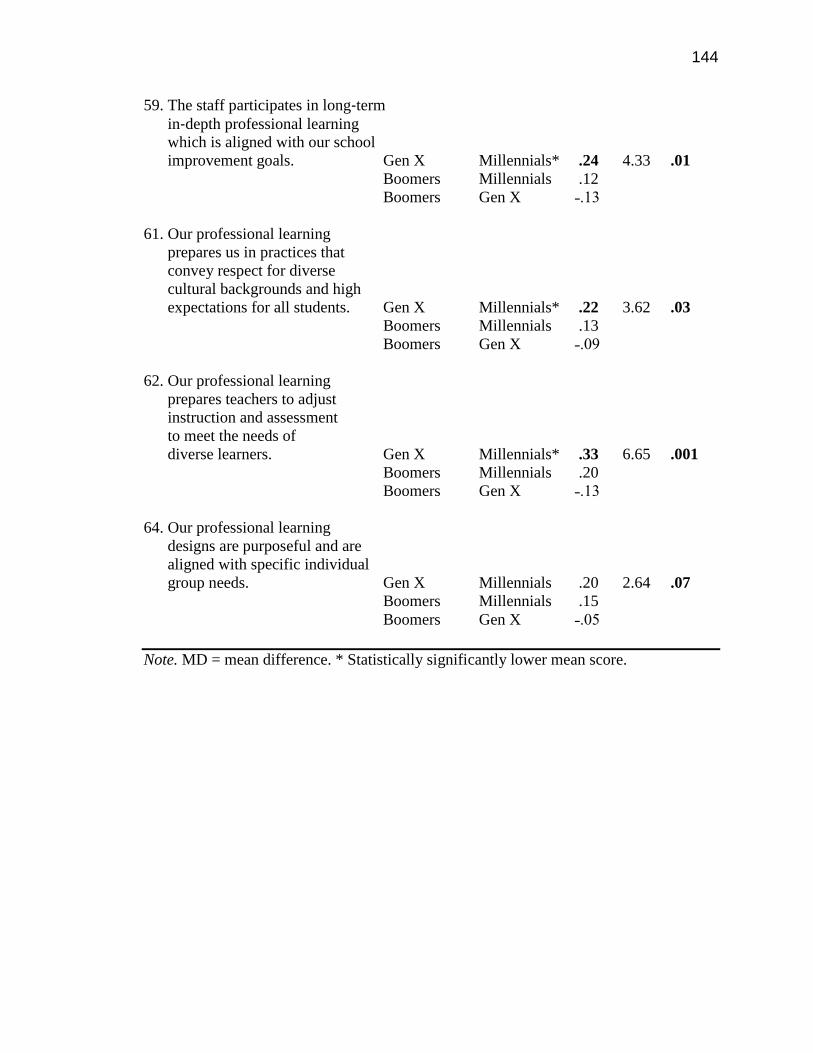
144
59. The staff participates in long-term
in-depth professional learning
which is aligned with our school
improvement goals. Gen X Millennials* .24 4.33 .01
Boomers Millennials .12
Boomers Gen X ˗.13
61. Our professional learning
prepares us in practices that
convey respect for diverse
cultural backgrounds and high
expectations for all students. Gen X Millennials* .22 3.62 .03
Boomers Millennials .13
Boomers Gen X ˗.09
62. Our professional learning
prepares teachers to adjust
instruction and assessment
to meet the needs of
diverse learners. Gen X Millennials* .33 6.65 .001
Boomers Millennials .20
Boomers Gen X ˗.13
64. Our professional learning
designs are purposeful and are
aligned with specific individual
group needs. Gen X Millennials .20 2.64 .07
Boomers Millennials .15
Boomers Gen X ˗.05
Note. MD = mean difference. * Statistically significantly lower mean score.

145
Table E14
School Culture Analysis of Variance of Teacher Perceptions of Gen X Principals
Sum of p-value
Item Factor Squares df MS F p ≤
71. Our school provides support to
promote the academic
achievement of all learners, Cohorts 1.74 2 .87 1.64 .19
Error 214.14 590 .53
Total 315.88 592
72. Our school supports and
enhances the social and
emotional growth and
development of all learners. Cohorts 1.17 2 .58 1.76 .17
Error 195.89 590 .33
Total 197.06 592
73. School policies, practices, and
experiences promote respect for
individual differences. Cohorts 6.75 2 3.38 7.91 .0004
Error 251.70 590 .43
Total 258.45 592
74. Our school celebrates the
achievement and
accomplishments of our
students, staff, and school
community. Cohorts 1.27 2 .64 1.94 .14
Error 192.97 590 .33
Total 194.24 592
75. Our school culture reflects an
atmosphere of trust and
openness among all
stakeholders. Cohorts 1.68 2 .84 1.88 .16
Error 265.64 590 .45
Total 267.32 592
Note. MS = mean square.

146
Table E15
School Culture Teacher Mean Differences of Gen X Principals
Item Generational Cohort MD F p-value
p ≤
73. School policies, practices, and
experiences promote respect for
individual differences. Gen X Millennials* .30 7.91 .0004
Boomers Millennials* .20
Gen X Boomers* .10
Note. MD = mean difference. * Statistically significantly lower mean score.