A General Process Model Ö Application to Unanticipated ...
8
Abstract The improvement of the detection and diagnosis capability for the unanticipated fault is a tendency in the research and application of fault diagnosis. In this paper, some notions and the basic principles for the unanticipated fault detection and diagnosis are given. A general process model applied to the diagnosis for the unanticipated fault is designed, by adopting a three-layer progressive structure, which is comprised of an inherent detection layer, an unanticipated isolation layer and an unantici- pated recognition layer. Several key problems in the general process model are analyzed. The model and methods proposed in this paper are driven by pure data and they can detect and diagnose the unanticipated fault. The approach is evaluated by using an example of a satellite’s attitude control system, and excellent results have been obtained. 1 Introduction At present, in the research field of fault diagnosis, a great majority of methods proposed are based on the premise of a perfect fault pattern database. The treatment on the fault detection and diagnosis are carried out for anticipated fault (AF) [1-3]. However, due to the high complexity and un- certainty of the technical structure, the process environment and the working state of the system etc, the occurrence of some faults which cannot be anticipated in advance (Un- anticipated Fault, UF) is inevitable in actual work [4]. The UF is not included in the anticipated fault database, and the occurrence of the UF affects normal operation of the system and even possibly leads to thorough failure of the system. The improvement of unanticipated fault detection and diagnosis (UFDD) capability is a difficult issue, as well as a developing direction in the research and application for the fault diagnosis [5-8]. In retrospect to the existing researches, rather little at- tention has been paid to research UF detection and diagno- sis. Therefore, no mature solve scheme has been shaped for either the problem itself or the technical realization [9-12]. Most research on the UF focus on the recognition and the match between different patterns based on the known fault pattern database [13-14]. For example, Tom Brotherton and Tom Johnson (2001) [15] proposed a neural network anomaly detector, which was essentially a single neural network classifier and could not identify the UF. Z. H. Duan (2006) [16] proposed that the UF diagnosis was carried out by utilizing particle filter for incomplete patterns. As a transmission mechanism of the UF could not be obtained in advance, the UF diagnosis could not be realized based on model inference. George Vachtsevanos etc. (2008) [17] proposed an UF robust detection method, however, the isolation on the UF could not be realized. Furthermore, Z. M He (2012) [18] proposed a one-class principal compo- nent analysis (OC-PCA) method, which could only be used for processing the system with stable data in a normal pat- tern, and did not relate to the UF diagnosis at all. The ma- jority of currently published articles involve only UF de- tection. However, the fault isolation between the UF and the AF as well as the recognition (i.e. identification) of the UF has not yet been performed. For actual system, some impacts such as nonlinearity, uncertainty and external interference are inevitable in its actual operation, which will result difficulties in setting up a precise model for the system. Consequently, the application of the methods for fault detection and diagnosis based on model inference will be very limited [19-20]. With the development of sensor technology, the input and output data or the system’s status under real-time monitor is easier to obtain. The data are redundant, real-time and reliable. As a result, the fault diagnosis ideology of extracting data instead of establishing a system’s model will play a positive role. This paper proposes a data-driven fault diagnosis method for UF. Combined with the fault diagnosis process, a gen- eral process model (GPM) is advanced, which is comprised of an inherent detection layer (IDL), an unanticipated iso- lation layer (UIL) and an unanticipated recognition layer (URL). Firstly, according to different characteristics of the monitoring data, the corresponding residual statistics are built and a detection criterion of the IDL is provided for fault detection. Secondly, the statistic of angle similarity is constructed on the basis of the fault feature direction, the isolation between the UF and the AF is realized in the UIL. Finally, in the URL, by the adoption of the contribution factor, the UF is recognized. The method, as a fault diag- nosis method driven by pure data, is capable of carrying out detection, isolation and recognition for the UF. The paper is organized as follows. In Section 2, some notions and the basic principles for UF and UFDD are discussed. A three-layer GPM for UFDD is introduced in Section 3. Sections 4 analyzes some key problems in the GPM and advances the corresponding solutions. In Section A General Process Model:Application to Unanticipated Fault Diagnosis Jiongqi WANG 1 , Zhangming HE 2 , Haiyin ZHOU 3 and Shuxing LI 1 1 College of Science, National University of Defense Technology, Changsha, Hunan, P. R. China email: [email protected] 2 Institute for Automatic Control and Complex Systems, University of Duisburg-Essen, Duisburg, Germany email: [email protected] 2 Beijing Institute of Control Engineering, Beijing, P. R. China email: [email protected] 1 College of Science, National University of Defense Technology, Changsha, Hunan, P. R. China email: [email protected] Proceedings of the 26 th International Workshop on Principles of Diagnosis 137
Transcript of A General Process Model Ö Application to Unanticipated ...

Abstract The improvement of the detection and diagnosis capability for the unanticipated fault is a tendency in the research and application of fault diagnosis. In this paper, some notions and the basic principles for the unanticipated fault detection and diagnosis are given. A general process model applied to the diagnosis for the unanticipated fault is designed, by adopting a three-layer progressive structure, which is comprised of an inherent detection layer, an unanticipated isolation layer and an unantici-pated recognition layer. Several key problems in the general process model are analyzed. The model and methods proposed in this paper are driven by pure data and they can detect and diagnose the unanticipated fault. The approach is evaluated by using an example of a satellite’s attitude control system, and excellent results have been obtained.
1 Introduction At present, in the research field of fault diagnosis, a great majority of methods proposed are based on the premise of a perfect fault pattern database. The treatment on the fault detection and diagnosis are carried out for anticipated fault (AF) [1-3]. However, due to the high complexity and un-certainty of the technical structure, the process environment and the working state of the system etc, the occurrence of some faults which cannot be anticipated in advance (Un-anticipated Fault, UF) is inevitable in actual work [4]. The UF is not included in the anticipated fault database, and the occurrence of the UF affects normal operation of the system and even possibly leads to thorough failure of the system. The improvement of unanticipated fault detection and diagnosis (UFDD) capability is a difficult issue, as well as a developing direction in the research and application for the fault diagnosis [5-8].
In retrospect to the existing researches, rather little at-tention has been paid to research UF detection and diagno-sis. Therefore, no mature solve scheme has been shaped for either the problem itself or the technical realization [9-12]. Most research on the UF focus on the recognition and the match between different patterns based on the known fault pattern database [13-14]. For example, Tom Brotherton and Tom Johnson (2001) [15] proposed a neural network anomaly detector, which was essentially a single neural network classifier and could not identify the UF. Z. H. Duan
(2006) [16] proposed that the UF diagnosis was carried out by utilizing particle filter for incomplete patterns. As a transmission mechanism of the UF could not be obtained in advance, the UF diagnosis could not be realized based on model inference. George Vachtsevanos etc. (2008) [17] proposed an UF robust detection method, however, the isolation on the UF could not be realized. Furthermore, Z. M He (2012) [18] proposed a one-class principal compo-nent analysis (OC-PCA) method, which could only be used for processing the system with stable data in a normal pat-tern, and did not relate to the UF diagnosis at all. The ma-jority of currently published articles involve only UF de-tection. However, the fault isolation between the UF and the AF as well as the recognition (i.e. identification) of the UF has not yet been performed.
For actual system, some impacts such as nonlinearity, uncertainty and external interference are inevitable in its actual operation, which will result difficulties in setting up a precise model for the system. Consequently, the application of the methods for fault detection and diagnosis based on model inference will be very limited [19-20]. With the development of sensor technology, the input and output data or the system’s status under real-time monitor is easier to obtain. The data are redundant, real-time and reliable. As a result, the fault diagnosis ideology of extracting data instead of establishing a system’s model will play a positive role.
This paper proposes a data-driven fault diagnosis method for UF. Combined with the fault diagnosis process, a gen-eral process model (GPM) is advanced, which is comprised of an inherent detection layer (IDL), an unanticipated iso-lation layer (UIL) and an unanticipated recognition layer (URL). Firstly, according to different characteristics of the monitoring data, the corresponding residual statistics are built and a detection criterion of the IDL is provided for fault detection. Secondly, the statistic of angle similarity is constructed on the basis of the fault feature direction, the isolation between the UF and the AF is realized in the UIL. Finally, in the URL, by the adoption of the contribution factor, the UF is recognized. The method, as a fault diag-nosis method driven by pure data, is capable of carrying out detection, isolation and recognition for the UF.
The paper is organized as follows. In Section 2, some notions and the basic principles for UF and UFDD are discussed. A three-layer GPM for UFDD is introduced in Section 3. Sections 4 analyzes some key problems in the GPM and advances the corresponding solutions. In Section
A General Process Model:Application to Unanticipated Fault Diagnosis
Jiongqi WANG1, Zhangming HE2, Haiyin ZHOU3 and Shuxing LI1
1 College of Science, National University of Defense Technology, Changsha, Hunan, P. R. China email: [email protected]
2 Institute for Automatic Control and Complex Systems, University of Duisburg-Essen, Duisburg, Germanyemail: [email protected]
2 Beijing Institute of Control Engineering, Beijing, P. R. China email: [email protected]
1 College of Science, National University of Defense Technology, Changsha, Hunan, P. R. China email: [email protected]
Proceedings of the 26th International Workshop on Principles of Diagnosis
137
5, performance evaluation of the proposed GPM and methods for the satellite’s attitude control system is pre-sented. Conclusions are drawn in Section 6.
2 Notions and Basic Principles for UFDD
2.1 Notion of UF The fault can be divided into the anticipated fault (AF) and the unanticipated fault (UF).
Explanation 1: Anticipated fault (AF) is the fault which has been recognized by people, existing in the fault pattern database with the relevant monitoring data and the pro-cessing strategy.
Explanation 2: Unanticipated fault (UF) is the fault which lacks prior knowledge without any fault samples or with few fault data. UF does not exist in the fault pattern database, and the corresponding elimination strategy for it has not been detected.
A perfect fault pattern database should be a set including all AF patterns and UF patterns. However, due to some objective reasons, the acquisition of the perfect fault pattern database is extremely difficult. The AF rarely occurs, and most of faults occurs in the actual working process are UF [21]. At present, to detect the UF and moreover to diagnose the UF is one of the most difficult issues in fault diagnosis region, and it is also a great challenge for fault diagnosis technology.
2.2 Notion for UF Detection Explanation 3: UF detection is a process for judging
whether UF occurs. The tasks of UF detection and AF detection are different.
The two methods apply previous normal monitoring data to train a discriminator, and then the current monitoring data is used as the testing data to be input into the discriminator to judge whether the current status is a fault. However, the UF detection is carried out after the completion of fault detec-tion, and the fault is further judged whether to be UF. Ob-viously, for AF detection, all faults are always assumed to be anticipated. Consequently, if the UF occurs, it will be misjudged as a certain anticipated fault.
2.3 Notion for UF Diagnosis Explanation 4: UF diagnosis is a process of determining
whether the UF occur (i.e. UF detection). In addition, the UF diagnosis further includes the isolation and the recog-nition of the UF after the UF detection is completed.
Compared with the AF diagnosis, due to lack of prior knowledge of the UF, the mapping relationship from fault data to fault part (essentially, the fault pattern is a function between fault data and fault part) cannot be found. There-fore, the key for UF diagnosis is to quickly establish a cognition process. The cognition comprises the recognition of superficial data characteristics or the mapping recogni-tion from data to a physical layer. Based on a fault diagnosis method driven by pure data, this paper focuses on the recognition of superficial data characteristics.
3 General Process Model (GPM) for UFDD By combining the notion and basic principles of the UF and the UFDD, this paper proposes a multi-layer general pro-
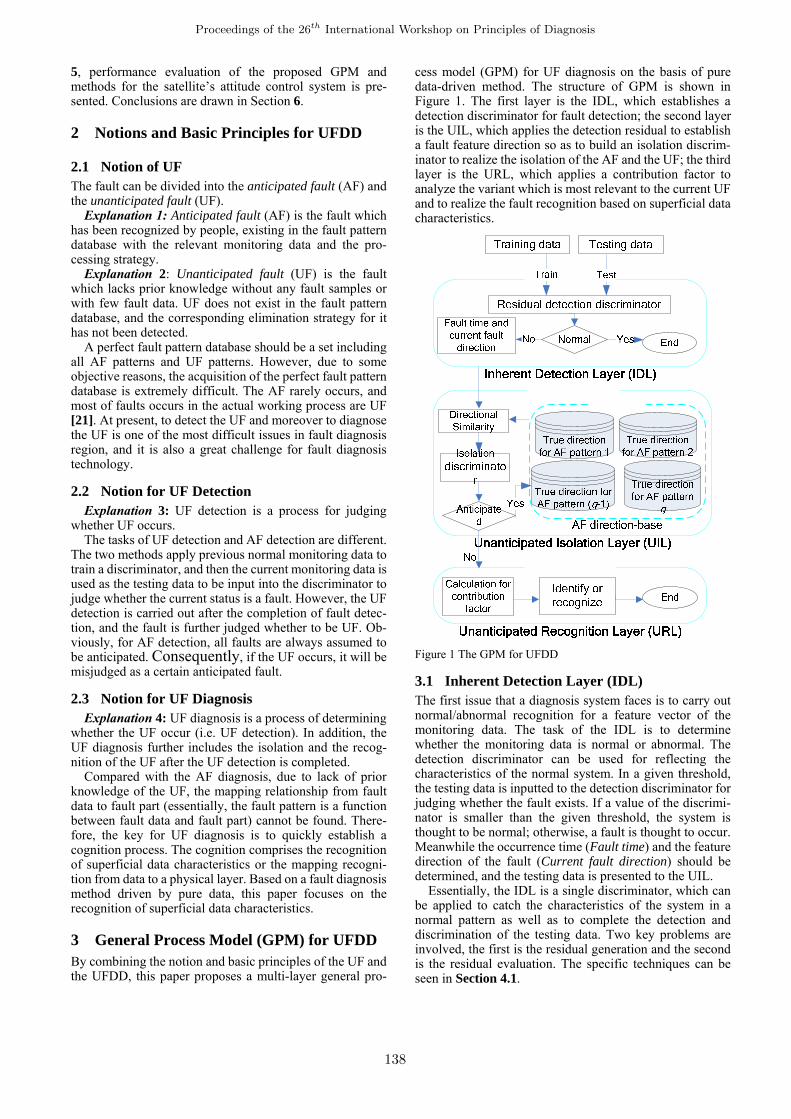
cess model (GPM) for UF diagnosis on the basis of pure data-driven method. The structure of GPM is shown in Figure 1. The first layer is the IDL, which establishes a detection discriminator for fault detection; the second layer is the UIL, which applies the detection residual to establish a fault feature direction so as to build an isolation discrim-inator to realize the isolation of the AF and the UF; the third layer is the URL, which applies a contribution factor to analyze the variant which is most relevant to the current UF and to realize the fault recognition based on superficial data characteristics.
Figure 1 The GPM for UFDD
3.1 Inherent Detection Layer (IDL) The first issue that a diagnosis system faces is to carry out normal/abnormal recognition for a feature vector of the monitoring data. The task of the IDL is to determine whether the monitoring data is normal or abnormal. The detection discriminator can be used for reflecting the characteristics of the normal system. In a given threshold, the testing data is inputted to the detection discriminator for judging whether the fault exists. If a value of the discrimi-nator is smaller than the given threshold, the system is thought to be normal; otherwise, a fault is thought to occur. Meanwhile the occurrence time (Fault time) and the feature direction of the fault (Current fault direction) should be determined, and the testing data is presented to the UIL.
Essentially, the IDL is a single discriminator, which can be applied to catch the characteristics of the system in a normal pattern as well as to complete the detection and discrimination of the testing data. Two key problems are involved, the first is the residual generation and the second is the residual evaluation. The specific techniques can be seen in Section 4.1.
Proceedings of the 26th International Workshop on Principles of Diagnosis
138
3.2 Unanticipated Isolation Layer (UIL) The task of the UIL is to finish the isolation between the UF and AF. After detected, the current fault shall be judged whether to be the AF or the UF. If it is, the current fault will be classified as some sort of AF. All AF patterns are saved in the pattern database of AF. The isolation discriminator matches the feature of the current fault pattern with all those of the AF patterns successively, so as to realize the isolation between the UF and AF. If the feature of the current fault cannot be matched with any AF pattern, it indicates that the UF occurs. The testing data is presented to the URL. The key problem of the UIL lies in the establishment of an iso-lator and the design of an isolation criterion. The specific techniques can be seen in Section 4.2.
3.3 Unanticipated Recognition Layer (URL) The task of the URL is to perform online learning and analysis for the UF data, so as to generate the fault pattern. The function of the URL is to learn and summarize the pattern found in unknown pattern. As it is different from the AF, it is difficult to find the mapping relationship from the fault data to the fault part for the UF. Therefore, the key point of recognition lies in establishing the corresponding relationship between the data and the unknown fault. Due to insufficient recognition on the UF and lack of historical information and prior knowledge, it is usually more difficult to establish the mapping relationship on the physical layer. The key point of this paper is to analyze the UF recognition based on the superficial data layer. According to contribu-tion factor, the variant which is mostly relevant to the cur-rent UF can be found, so that the UF recognition is finished. The specific techniques can be seen in Section 4.3.
4 Some Key Problems in GPM In the above section, a basic framework of the UF diagnosis is provided. The task of the UF diagnosis is to detect, isolate and recognize the UF. The detection is a starting point of fault diagnosis, and the target of the fault detection is to judge whether the UF occurs; the isolation is the core of fault diagnosis; and the recognition is a terminal point of fault diagnosis. Additionally, the recognition is also the starting point of fault-tolerant control (fault processing). The specific techniques on detecting, isolating and recog-nizing the UF can be seen below.
4.1 Detection Statistic Construction Just as Section 3 shows, the basic task of the IDL is to judge whether the testing data is normal. If it is a fault, simulta-neously the occurrence time and the feature direction of the fault shall be determined. The key point of the IDL lies in the detection residual generation as well as the residual evaluation. The detection statistic is established according to the residual, and the fault detection is performed ac-cording to the given criterion. For different monitoring data, different residual generation approaches exist, including simple T2 detection [18, 22], baseline data smoothing de-tection [23], and time-series modeling and predicting de-tection [24-25].
The characteristics of the monitoring system and moni-toring data can be applied to select the corresponding de-tection method. The simple T2 statistic detection is applied to a stable data [22]. The baseline data smoothing detection
is suitable for the system capable of obtaining the baseline data, its calculation amount is small, the detection speed is fast, and the detection effect is the best [23]. The time-series modeling prediction is suitable for the system with con-tinuous output and without input; it is also suitable for it-eration update of the pattern, while the defect is that the prediction time is short [25].
In practical application, the characteristics of the moni-toring system and the monitoring data can be applied to select the corresponding detection method.
Besides, for the three methods analyzed above, only the characteristics of data output are considered. However, for some systems (such as the satellite’s attitude control sys-tem), the object of the fault detection always comprises control input as well as measuring output, and the control input has a certain responding relationship with the meas-uring output. In the situation where there is no baseline training data, an input-output system identification method is needed to search a model structure for the system, and thus the fault detection both on control input and measuring output will be performed in the IDL.
If we assume that ( ) ( )( 1) ( 1)1 1, ,n p n m
n n R R− × − ×− − ∈U Y are re-
spectively as system input and system output before the nth time period, take them as the training data and make ( ) ( )1 1, ,p m
n n R R× ×∈u y as the current testing data. The train purpose is to find the model structure of the system, usually with the rule as follows
( )1 1min n nf − −−Y f U (1)
Let ( )1 1n nf− −=Y U is the tendency term,
( )1 1 1 1 1ˆ
n n n n nf− − − − −= − = −Y Y Y Y U is the residual term;
( )T
1 1ˆ , ,n n n nf − −=y u U Y is one-step prediction, and
ˆn n n= −r y y is the prediction residual, then the key point for the minimum problem in (1) is to construct the function f between the system input and system output.
If a mathematical model can be obtained for the system equation by the physical mechanism, the estimation of f can be converted into the parameter estimation (Gray-Box Model); and if there is no physical background, f can be estimated only according to the experiment and the system identification (Black-Box Model). Common linear black box models comprise an autoregression model (AR Model) with external input, an autoregressive moving average model (ARMA Model) with external input, an output error model (OE Model), a Box-Jenkins model (BJ Model) and a prediction error minimized model (PEM Model); and common nonlinear black box models comprise a nonlinear autoregression moving average model (NLARMA Model) and a nonlinear Hammerstein-Wiener model (NLHW Model) [26-29] with external input.
After obtaining the prediction residual, the detection sta-tistics are as below:
( ) ( )-12 T covn n nT =y r Y r (2)
where ( )cov Y is the covariance of the residual term Y , and a judging threshold is set to be
( )( )( ) ( ) ( )2
1
2, 1
1 1m n n
T F m n mn n mα α−
−= − −
− −( - ) (3)
Proceedings of the 26th International Workshop on Principles of Diagnosis
139

where ( ) ( )1 , 1F m n mα− − − indicates a quantile of F distri-bution function when a significance level is α , the degree of freedom is ( ), 1m n m− − .
If ( )2 2nT Tα>y , 1n−y is considered as the fault point.
However, a false alarm is inevitable because of noise, thus we need a more reliable criterion for detection as follows.
Criterion 1: If ( )2 2nT Tα>y holds continuously for W
times, then the fault has really happened, where W is called time threshold. The W-th alarm time is considered as the fault time (tf) (i.e. the occurrence time of the fault) and the residual r of the fault time is called the current fault direction or current direction (i.e. the feature direction of the fault).
The detection statistic threshold is decided by Equation (3). The time threshold should not be too large (usually 2 to 4) to avoid any false alarms. A larger time threshold makes a more reliable decision, but it will cause some detection delay which will cause harm to the system. Current fault direction is the key information of each fault, and it is the base for the isolation fault. According to Criterion 1, the current fault is detectable if and only if
( ) 12 T 1| || cov( )n n nTα
−−>r r Y r (4)
In the IDL, the fault detection is realized by the adoption of the input-output system identification method. Moreover, the occurrence time and feature direction of the fault can also be obtained.
Obviously, the input-output system identification method is provided with all the advantages of the time-series mod-eling prediction method. It is particularly suitable for the system with discontinuous input and discontinuous output at the same time, its defect is that the calculation amount is large, and the iteration process is relatively difficult.
4.2 Directional Similarity and Isolation Criterion The basic task of the UIL is to utilize the feature direction of the fault obtained in the IDL to establish the isolation dis-criminator, and then to realize the isolation between the AF and the UF. The key point lies in the isolator establishment. Here the concept of direction similarity is induced, and a fault isolation criterion is given. In Criterion 1, the defini-tion of current fault direction or current direction (i.e. the feature direction of a fault) is given. We adopt the true fault feature direction as defined below to be the fault’s pattern characteristics on superficial data layer.
Explanation 5: True (fault) direction of a fault pattern is defined as the unified mean of all possible current fault directions from the same pattern.
The relationship between the current directions and the true direction is just like that between discrete random variable and its expectation. It is easy to understand that
1 1 2
1 1lim /n n
i in i in n→∞= =
= ∑ ∑ξ r r (5)
= +r r ξ ε (6)
where 1
ni i=
r are all possible current directions from the same pattern, and ε is the noise and r is the magnitude of the current direction.
It is shown in Figure 2 that there are two opposite true directions for each fault pattern, e.g. the true direction , 1ξ , is in the center of a symmetric cone, around which are the
current directions from the same pattern. 2ξ is another true direction, corresponding to another fault pattern. The origin of the coordinates can be regarded as the true direction for the normal pattern.
1ξ
1ξ
2ξ
2ξ
Figure 2 True detections and current directions
Denote ( ),θ r ξ is the angle between the current direction and the true direction, ( ) ( )( ), 1 cos ,Ddisc θ= −r ξ r ξ is called the directional discrepancy between them. We can find that if they are from the same pattern, ( ),Ddisc r ξ will be small, otherwise, it will be large.
Suppose that ( ),N∼ε 0 Ω , the current direction is
= +r ε r ξ , and 1
qi i=ξ is all anticipated true directions, and
( ) 0 1argmin 1 cos ,
q
i i i== −
ξξ r ξ , then the isolation statistic is
given as follows ( )( )0
0 0
T
1 cos ,( )
i
i i
Iso−
=r r ξ
rξ Ωξ
(7)
Theorem 1: If ( )Iso r is defined in Equation (7), then ( )( ) 0,1Iso N∼r (8)
Proof: Suppose that the current direction is ε= +r r ξ , where ξ is the true direction and ε is the observation noise, and ( ),N∼ε 0 Ω . According to Explanation 5 we have 1=ξ . If cos( , ) 0≥r ξ , we can approximately obtain that
( )T T
2 Tcos( , ) 1 1N , −= = + ∼ξ r ξ εr ξ r ξ Ωξξ r r
(9)
i.e. cos( , )r ξ satisfies truncated normal distribution. Thus
( ) ( )0 0 0
T1 cos( , ) 0i i iN ,− ∼r ξ r ξ Ωξ (10)
Similarly, if cos( , ) 0<r ξ , we can prove that
( ) ( )T1 cos( , ) 0N ,+ ∼r ξ r ξ Ωξ (11)
According to Equation (10) and Equation (11), we obtain
( ) ( )T1 cos( , ) 0N ,− ∼r ξ r ξ Ωξ (12)
Then ( )( )
( )0
0 0
T
1 cos ,( ) 0,1
i
i i
Iso N−
= ∼r r ξ
rξ Ωξ
(13)
and thus the theorem is proved. Therefore, the threshold for ( )Iso r is ( )1 α−Φ , where α is the significance level, and Φ
is the inverse of the normal cumulative distribution function. We provide the isolation criterion as follows.
Proceedings of the 26th International Workshop on Principles of Diagnosis
140
Criterion 2: If 1( )Iso α−> Φr holds true, the current fault is unanticipated; otherwise, it is anticipated. Criterion 2 indicates that UF with too small a magnitude cannot be isolated. If the current fault is unanticipated, a new fault pattern is found and the unified current direction is regarded as its true direction. If the current fault is an-ticipated, then the current direction should be added to the corresponding AF direction database in UIL of the GPM, and the true direction shall be updated.
4.3 Calculation for Contribution Factor The basic task of the URL is to carry out online learning and analysis for UF data. The key point of recognition or iden-tification is to establish the corresponding relationship from the monitoring data to the unknown fault or the character-istics of the unknown fault. The UF diagnosis discussed in this paper is an approach driven by pure data, thus the characteristic recognition on the data layer is more focused. According to the contribution factor, the variant which is most relevant to the current UF can be found, and then the UF recognition is completed.
Known from Criterion 1 that after the residual detection statistic is established, if ( )2 2
nT y Tα> , it is thought that a fault occurs at time period n-1. For the system with the control input and measure output, firstly a residual covari-ance matrix R (i.e. cov( )Y in Equation (2)) is subjected to the singular value decomposition, which is
T ( )diag=R P λ P (14) where ( )1, , mλ λ= …λ , ( )1, , m= …P p p , ip indicates the ith column of P , and jip indicates the jth component of
ip . Let Ti it = r p , and jr indicates the jth component of
the current fault feature direction r, where 1 mj≤ ≤ . Explanation 6: The contribution factor of the jth variant
to the current fault feature direction r is
( ) ( )1
/m
i j ji ii
Cont j t r p λ=
= ∑ (15)
From the aspect of characteristic recognition in the data layer, the variant with the largest contribution factor is the fault variant. If it is a sensor fault, the sensor corresponding to the variant with the largest contribution factor is the sensor hardware with the fault.
5 Simulation and Performance Evaluation The effectiveness of the proposed GPM and the corre-sponding UF fault detection, isolation and recognition method are demonstrated in this section through a satellite’s attitude control system model.
5.1 Input and Output of Satellite Control System The satellite’s attitude control system is a main part of a satellite, which consists of four main parts: a satellite body, a controller, an execution mechanism and a measuring mechanism [30].
As the complexity of the satellite’s attitude control sys-tem, faults particularly for the measuring mechanism and the execution mechanism occur rather frequently.
Here on consideration of the monitoring data for the sat-ellite’s attitude control system. The monitoring data are provided by China Aerospace Science and Technology Corporation (CASA).
The monitoring data comprises of not only the output data of the measuring mechanism, but also the control input of the execution mechanism. The dimension of the data output by the measuring mechanism is 7m = , The dimen-sion of the data input by the execution mechanism is 4p = , which can be seen in Table 1. There are altogether 10 batches of monitoring data, which can be seen in Table 2. The first batch is the normal data, and the normal pattern data is discontinuous and unstable (Figure 3). The subse-quent 9 batches are used for testing, and different fault patterns (a sudden-change fault, a gradual-change fault and so on) are given. In Figure 3, the comparison of the moni-toring data in the fault with drift-increasing of gyro at roll axis and the normal pattern is given. The time of each batch of data is 45000s-48000s; each piece data is collected per second, and the data length 3000n = . Additionally, the public parameters used in the simulation
are assigned as follows: The significance level 0.01α = and the time threshold defined in Criterion 1 is W=3.
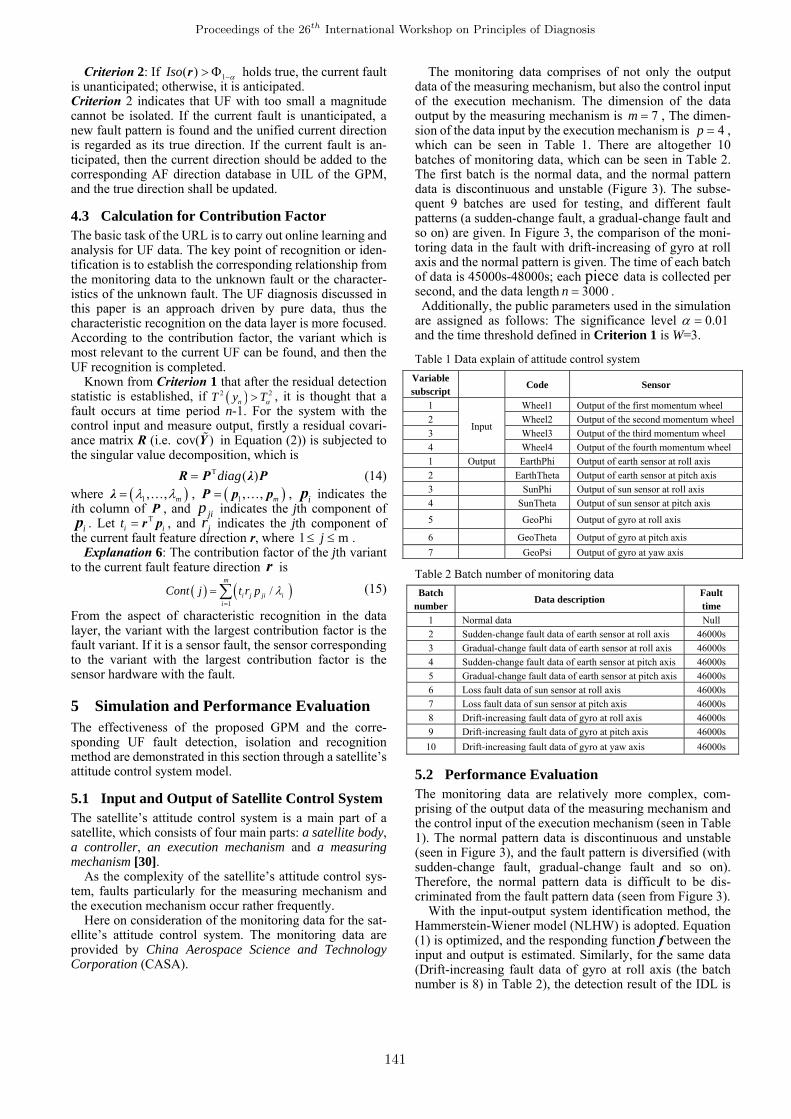
Table 1 Data explain of attitude control system Variable subscript
Code Sensor
1
Input
Wheel1 Output of the first momentum wheel 2 Wheel2 Output of the second momentum wheel3 Wheel3 Output of the third momentum wheel 4 Wheel4 Output of the fourth momentum wheel 1 Output EarthPhi Output of earth sensor at roll axis 2 EarthTheta Output of earth sensor at pitch axis 3 SunPhi Output of sun sensor at roll axis 4 SunTheta Output of sun sensor at pitch axis
5 GeoPhi Output of gyro at roll axis
6 GeoTheta Output of gyro at pitch axis 7 GeoPsi Output of gyro at yaw axis
Table 2 Batch number of monitoring data Batch
numberData description
Fault time
1 Normal data Null 2 Sudden-change fault data of earth sensor at roll axis 46000s 3 Gradual-change fault data of earth sensor at roll axis 46000s 4 Sudden-change fault data of earth sensor at pitch axis 46000s 5 Gradual-change fault data of earth sensor at pitch axis 46000s 6 Loss fault data of sun sensor at roll axis 46000s 7 Loss fault data of sun sensor at pitch axis 46000s 8 Drift-increasing fault data of gyro at roll axis 46000s 9 Drift-increasing fault data of gyro at pitch axis 46000s
10 Drift-increasing fault data of gyro at yaw axis 46000s
5.2 Performance Evaluation The monitoring data are relatively more complex, com-prising of the output data of the measuring mechanism and the control input of the execution mechanism (seen in Table 1). The normal pattern data is discontinuous and unstable (seen in Figure 3), and the fault pattern is diversified (with sudden-change fault, gradual-change fault and so on). Therefore, the normal pattern data is difficult to be dis-criminated from the fault pattern data (seen from Figure 3).
With the input-output system identification method, the Hammerstein-Wiener model (NLHW) is adopted. Equation (1) is optimized, and the responding function f between the input and output is estimated. Similarly, for the same data (Drift-increasing fault data of gyro at roll axis (the batch number is 8) in Table 2), the detection result of the IDL is
Proceedings of the 26th International Workshop on Principles of Diagnosis
141

given in Figure 4, which can be seen that the fault detection is timely, the detection effect is remarkable, and 4s detec-
tion is delayed caused by the time threshold, 3W = .
4.5 4.6 4.7 4.8
x 104
-1.4
-1.2
-1
-0.8
-0.6
es-x4.5 4.6 4.7 4.8
x 104
0.8
1
1.2
1.4
es-y4.5 4.6 4.7 4.8
x 104
-100
-50
0
50
100
ss-x4.5 4.6 4.7 4.8
x 104
-100
-50
0
50
100
ss-y4.5 4.6 4.7 4.8
x 104
-5
0
5
10x 10-3
w-x
4.5 4.6 4.7 4.8
x 104
-0.06
-0.058
-0.056
-0.054
w-y4.5 4.6 4.7 4.8
x 104
-0.01
-0.005
0
0.005
0.01
w-z4.5 4.6 4.7 4.8
x 104
-0.05
0
0.05
0.1
0.15
T-wheel-14.5 4.6 4.7 4.8
x 104
-0.05
0
0.05
0.1
0.15
T-wheel-24.5 4.6 4.7 4.8
x 104
-0.1
-0.05
0
0.05
0.1
T-wheel-3
4.5 4.6 4.7 4.8
x 104
-0.02
0
0.02
0.04
T-wheel-44.5 4.6 4.7 4.8
x 104
-0.1
0
0.1
0.2
0.3
x-esti-attitude4.5 4.6 4.7 4.8
x 104
-0.15
-0.1
-0.05
0
0.05
y-esti-attitude4.5 4.6 4.7 4.8
x 104
-0.4
-0.2
0
0.2
0.4
z-esti-attitude
Figure 3 Drift-increasing fault of gyro at roll axis (Blue line shows the output in the normal pattern while green line shows the output in the fault patter
By adopting the input-output system identification method, the detection results in the IDL for the data in Table 2 are shown in Table 3. The fault detection is timely, and the detection effect is more obvious (both of the FAP (false alarm probability) and the MAP (missing alarm probability) are much lower).
In the IDL, the fault detection can be realized, and the fault time and the current fault direction are also determined. In the UIL, Criterion 2 is adopted to realize the isolation between the UF and the AF. In the initial stage, the AF pattern is assumed to be empty, therefore, when the second batch of data in Table 2 is filled into the UIL, the detected fault must be the UF, and then the isolation result is trans-ferred into the URL. When the third batch of data in Table 2 is filled into the IDL, the fault time is that 1001t s= , the statistic of the directional similarity is
( ) T1 1 11 cos( , ) / 7.3179ξ ξ ξ− =r r R , and the isolation threshold
of the UF is also 0.99 2.3263Φ = . Obviously ( ) T
1 1 1 0.991 cos( , ) /ξ ξ ξ− >Φr r R , the current fault pattern is different from the first fault pattern, and an UF occurs. Then the UF is transferred into the URL. The fault isolation result for all the tested data in Table 2 can be seen in Table 4. From Table 4, we know that the isolator with the fault fea-
ture direction and the direction similarity is valid, and the isolation between the UF and the AF can be truly realized.
tf2: 1004 ln(T2): 5.483
Figure 4 The detection result (with input-output system identification method) for drift-increasing fault data of gyro at roll axis
Table 3 Unanticipated fault diagnosis—IDL
Inherent Detection Layer (IDL)
Batch number
Normal or Fault
FAP (%)
MAP (%)
Fault time (s) Current fault direction
1 N 5 0 0 0 0 0 0 0 2 F 3 2 1000+2 0.9876 -0.0042 0.041 -0.053 0.0453 -0.1342 0.0678 3 F 4 1 1000+1 -0.9997 0.0005 -0.034 0.049 0.0049 -0.0036 0.0222 4 F 5 1 1000+2 -0.1510 -0.9747 -0.0097 0.0105 0.0442 -0.1550 0.0345 5 F 4 1 1000+2 -0.0018 1.0000 0.0007 0.0006 -0.0009 -0.0022 -0.0077 6 F 5 1 1000+2 0.0086 -0.0093 -0.9752 0.0046 -0.0007 0.0003 0.0008 7 F 3 2 1000+3 -0.0067 0.0052 0.0016 -0.9925 -0.1553 0.0028 -0.0016 8 F 5 1 1000+4 -0.0769 0.0051 0.0037 0.0018 0.9682 -0.0139 -0.0549 9 F 3 1 1000+2 -0.0742 0.0215 -0.0029 0.0016 0.0454 -0.9968 0.0447 10 F 3 1 1000+2 0.0627 -0.0201 -0.0079 0.0086 -0.0476 -0.0441 -0.9849
Proceedings of the 26th International Workshop on Principles of Diagnosis
142
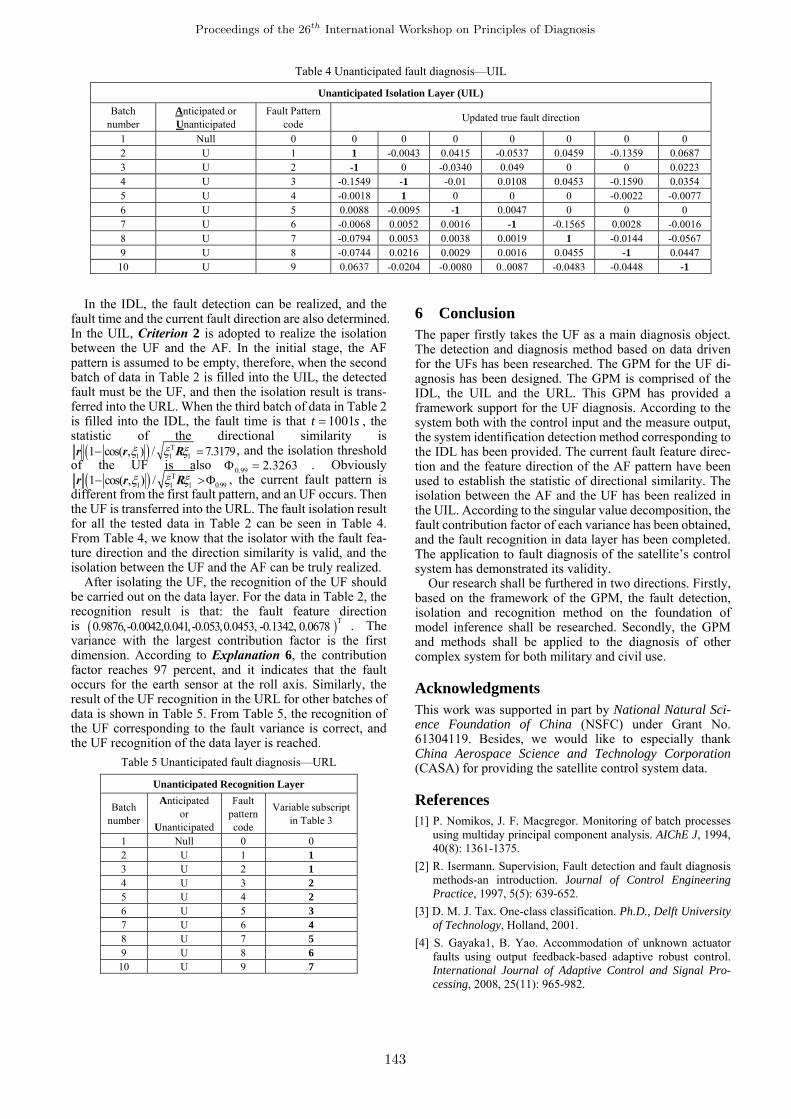
Table 4 Unanticipated fault diagnosis—UIL
Unanticipated Isolation Layer (UIL)
Batch number
Anticipated or Unanticipated
Fault Pattern code Updated true fault direction
1 Null 0 0 0 0 0 0 0 0 2 U 1 1 -0.0043 0.0415 -0.0537 0.0459 -0.1359 0.0687 3 U 2 -1 0 -0.0340 0.049 0 0 0.0223 4 U 3 -0.1549 -1 -0.01 0.0108 0.0453 -0.1590 0.0354 5 U 4 -0.0018 1 0 0 0 -0.0022 -0.00776 U 5 0.0088 -0.0095 -1 0.0047 0 0 0 7 U 6 -0.0068 0.0052 0.0016 -1 -0.1565 0.0028 -0.00168 U 7 -0.0794 0.0053 0.0038 0.0019 1 -0.0144 -0.05679 U 8 -0.0744 0.0216 0.0029 0.0016 0.0455 -1 0.0447 10 U 9 0.0637 -0.0204 -0.0080 0..0087 -0.0483 -0.0448 -1
In the IDL, the fault detection can be realized, and the fault time and the current fault direction are also determined. In the UIL, Criterion 2 is adopted to realize the isolation between the UF and the AF. In the initial stage, the AF pattern is assumed to be empty, therefore, when the second batch of data in Table 2 is filled into the UIL, the detected fault must be the UF, and then the isolation result is trans-ferred into the URL. When the third batch of data in Table 2 is filled into the IDL, the fault time is that 1001t s= , the statistic of the directional similarity is
( ) T1 1 11 cos( , ) / 7.3179ξ ξ ξ− =r r R , and the isolation threshold
of the UF is also 0.99 2.3263Φ = . Obviously ( ) T
1 1 1 0.991 cos( , ) /ξ ξ ξ− >Φr r R , the current fault pattern is different from the first fault pattern, and an UF occurs. Then the UF is transferred into the URL. The fault isolation result for all the tested data in Table 2 can be seen in Table 4. From Table 4, we know that the isolator with the fault fea-ture direction and the direction similarity is valid, and the isolation between the UF and the AF can be truly realized.
After isolating the UF, the recognition of the UF should be carried out on the data layer. For the data in Table 2, the recognition result is that: the fault feature direction is ( )T0.9876,-0.0042,0.041,-0.053,0.0453, -0.1342, 0.0678 . The variance with the largest contribution factor is the first dimension. According to Explanation 6, the contribution factor reaches 97 percent, and it indicates that the fault occurs for the earth sensor at the roll axis. Similarly, the result of the UF recognition in the URL for other batches of data is shown in Table 5. From Table 5, the recognition of the UF corresponding to the fault variance is correct, and the UF recognition of the data layer is reached.
Table 5 Unanticipated fault diagnosis—URL
Unanticipated Recognition Layer
Batch number
Anticipated or
Unanticipated
Fault pattern code
Variable subscript in Table 3
1 Null 0 0 2 U 1 1 3 U 2 1 4 U 3 2 5 U 4 2 6 U 5 3 7 U 6 4 8 U 7 5 9 U 8 6 10 U 9 7
6 Conclusion The paper firstly takes the UF as a main diagnosis object. The detection and diagnosis method based on data driven for the UFs has been researched. The GPM for the UF di-agnosis has been designed. The GPM is comprised of the IDL, the UIL and the URL. This GPM has provided a framework support for the UF diagnosis. According to the system both with the control input and the measure output, the system identification detection method corresponding to the IDL has been provided. The current fault feature direc-tion and the feature direction of the AF pattern have been used to establish the statistic of directional similarity. The isolation between the AF and the UF has been realized in the UIL. According to the singular value decomposition, the fault contribution factor of each variance has been obtained, and the fault recognition in data layer has been completed. The application to fault diagnosis of the satellite’s control system has demonstrated its validity.
Our research shall be furthered in two directions. Firstly, based on the framework of the GPM, the fault detection, isolation and recognition method on the foundation of model inference shall be researched. Secondly, the GPM and methods shall be applied to the diagnosis of other complex system for both military and civil use.
Acknowledgments This work was supported in part by National Natural Sci-ence Foundation of China (NSFC) under Grant No. 61304119. Besides, we would like to especially thank China Aerospace Science and Technology Corporation (CASA) for providing the satellite control system data.
References [1] P. Nomikos, J. F. Macgregor. Monitoring of batch processes
using multiday principal component analysis. AIChE J, 1994, 40(8): 1361-1375.
[2] R. Isermann. Supervision, Fault detection and fault diagnosis methods-an introduction. Journal of Control Engineering Practice, 1997, 5(5): 639-652.
[3] D. M. J. Tax. One-class classification. Ph.D., Delft University of Technology, Holland, 2001.
[4] S. Gayaka1, B. Yao. Accommodation of unknown actuator faults using output feedback-based adaptive robust control. International Journal of Adaptive Control and Signal Pro-cessing, 2008, 25(11): 965-982.
Proceedings of the 26th International Workshop on Principles of Diagnosis
143

[5] P. Smyth. Markov monitoring with unknown States. IEEE Journal on Selected Areas in ConununiCationS, 1994, 12(9):1600-1610.
[6] Hofbaur, B.C. Williams. Hybrid diagnosis with unknown behavioral modes. Proceedings of the 13th International Workshop on Principles of Diagnosis (DX02), May, 2002.
[7] V.J. Hodge, J. Austin. A survey of outlier detection method-ologies. Artificial intelligence review. Kluwer Academic Pub-lishers, Vol. 22, 2004, 85-124.
[8] Patcha, J. M Park. An overview of anomaly detection tech-niques: existing solutions and latest technology trends. Com-puter Networks, 2007, 51: 3448-3470.
[9] K. Kojima, K. Ito. Autonomous learning of novel patterns by utilizing chaotic dynamics. IEEE International Conference on Systems, Man, and Cybernetics, IEEE SMC '99, 1999, 1:284-289.
[10] Petra Perner. Concepts for Novelty Detection and Handling Based on a Case-Based Reasoning Process Scheme. Spring-er-Verlag Berlin Heidelberg, 2007.
[11] Satnam Singh, Haiying Tu, William Donat. Anomaly detec-tion via feature-aided tracking and Hidden Markov Models. IEEE Transactions on Systems, Man, and Cybernetics, Part A: Systems and Humans, 2009, 39(1): 144-159.
[12] Ching-Fang Lin. Predictive fault diagnosis system for intel-ligent and robust health monitoring. AIAA In-fotech@Aerospace, 20-22, April, 2010, Atlanta, Georgia.
[13] E. Sobhani-Tehrani, H. A. Talebi, K. Khorasani1. Neural parameter estimators for hybrid fault diagnosis and estimation in nonlinear systems. IEEE International Conference on Sys-tems, Man and Cybernetics, Montreal, 7-10, Oct, 2007, 3171-3176.
[14] Amitabh Barua. Hierarchical fault diagnosis and health monitoring in satellites formation flight. IEEE Transactions on Systems, Man and Cybernetics-Part C: Applications and Re-views, 2011, 41(2): 223-239.
[15] B. Tom and J. Tom: Anomaly detection for advanced military aircraft using neural networks. Aerospace Conference, IEEE Proceedings, 2001, 6: 3113-3134.
[16] Z. H. Duan: Theoretic and methodological research on fault diagnosis of mobile robots based on adaptive particle filters. Ph.D., Central South University, 2007, 63-89. [in Chinese].
[17] B. Zhang, Chris Sconyers, Carl Byington, Romano Patrick, Marcos Orchard. Anomaly detection: A robust approach to
detection of unanticipated faults. International Conference on Prognostics and Health Management, 6-9, Oct, Denver, CO, 2008: 1-8.
[18] Z. M He, H. Y. Zhou, J. Q. Wang. Model for Unanticipated Fault Detection by OCPCA. Advanced Materials Research, Vols. 591-593, 2012: 2108-2113.
[19] J. Chen, R.J. Patton. Robust model-based fault diagnosis for dynamic systems. Boston: Kluwer Academic Publishers, 1999.
[20] B. Zhang, S. Chris, B. Carl. A probabilistic fault detection approach: application to bearing fault detection. IEEE Trans-actions on Industrial Electronics, 2010, 58(5): 2011-2018.
[21] Pierre Sens. An unreliable failure detector for unknown and mobile networks. OPODIS 2008, LNCS 5401, 2008, 555–559.
[22] Anna M. Bartkowiak. Anomaly, novelty, one-class classifi-cation: a short introduction. Computer Information Systems and Industrial Management Applications (CISIM), 2010 In-ternational Conference, Wrocław, Poland, 8-10, Oct, 2010, 1-6.
[23] F. N. Zhou. Extended DCA method for unknown multiple faults diagnosis. Huazhong Univ. of Sci. & Tech. (Natural Science Edition), 2009, 37(4): 84-94 [in Chinese].
[24] N. Gebraeel, J. Pan. Prognostic degradation models for computing and updating residual life distributions in a time-varying environment. IEEE Trans. Rel., 2008, 57(4): 539–550.
[25] Wang Z M, Yi D Y, Duan X J. Measurement data modeling and parameter estimation. CRC Press, 2011.
[26] Adrian Wills, Brett Ninness. On gradient-based search for multivariable system estimates. IEEE Trans. Automat. Control, 2008, 53(1): 298–306.
[27] E. Wernholt, S. Moberg. Nonlinear gray-box identification using local models applied to industrial robots. Automatica, 2011, 4(47): 650-660.
[28] Lennart Ljung. System identification: Theory for the User. Linkoping University, Sweden Published, 1998.
[29] Goethals, K. Pelckmans, J. A. K. Suykens, B. De Moor. Sup-space identification of Hammerstein systems using least squares support vector machines. IEEE Transactions on Au-tomatic Control, 2005, 50(10): 1509-1519.
[30] Tu S C. Satellite attitude dynamics and control. Beijing: Chinese Astronautic Publishing House, 2003; 125-168 [in Chinese].
Proceedings of the 26th International Workshop on Principles of Diagnosis
144