A General Equilibrium Analysis in the Palestinian …...Our analysis suggests that if the status quo...
84
Prospects for Growth and Jobs in the Palestinian Economy A General Equilibrium Analysis Public Disclosure Authorized Public Disclosure Authorized Public Disclosure Authorized Public Disclosure Authorized
Transcript of A General Equilibrium Analysis in the Palestinian …...Our analysis suggests that if the status quo...

Prospects for Growth and Jobs in the Palestinian EconomyA General Equilibrium Analysis
June 2017
Prospects for Growth and Jobs in the Palestinian EconomyA General Equilibrium Analysis
Pub
lic D
iscl
osur
e A
utho
rized
Pub
lic D
iscl
osur
e A
utho
rized
Pub
lic D
iscl
osur
e A
utho
rized
Pub
lic D
iscl
osur
e A
utho
rized


Global Practice for Macroeconomics & Fiscal Management Middle East and North Africa Region
Prospects for Growth and Jobs in the Palestinian EconomyA General Equilibrium Analysis
November 2017
i
Table of Contents
Acknowledgements ........................................................................................................................ iiiAbbreviations ..................................................................................................................................ivExecutive Summary .........................................................................................................................v1.Political and Economic Context ....................................................................................................12.Objectives of the Study .................................................................................................................73.Constraints to Growth and Job Creation .......................................................................................9 A. Externally-Imposed Restrictions ..............................................................................................9 B. Internal Constraints ................................................................................................................114.Hypotheses ..................................................................................................................................135.Methodology ...............................................................................................................................146.Scenarios and Simulation Results ...............................................................................................207.Practical Implications of the Model ............................................................................................28References ......................................................................................................................................30Annex I Benchmarking ..............................................................................................................33Annex II Understanding Palestine’s Low Private Savings ..........................................................42Annex III Estimating Tariff Equivalents of External and Internal Constraints ............................56Annex IV Key Parameter Estimates for Scenario Simulations.....................................................66Annex V Simulation Results (Charts) ..........................................................................................68
List of Figures
Figure 1: Projected GDP in 2025 under various scenarios ............................................................viiFigure 2: Unemployment rate under various scenarios, 2016-2025 ............................................ viiiFigure 3: Real GDP growth, 1995-2016 ..........................................................................................1Figure 4: Contribution to real GDP growth, 1995-2016 ..................................................................1Figure 5: Gross private savings (% of GDP) ...................................................................................2Figure 6: Savings, consumption and transfers .................................................................................2Figure 7: Palestine’s exports and imports, 2000-2016 .....................................................................3Figure 8: Public finances, 1999-2016 ..............................................................................................5Figure 9: Trade costs and duration of trade process in Palestine compared to MNA and Israel .....9Figure A1.1: GDP Per Capita, Current USD .................................................................................33Figure A1.2: General government wage bill/GDP, select countries ..............................................34Figure A1.3: Components of public spending: Palestine, 2016 .....................................................35Figure A1.4: Components of public spending: Jordan, 2013 .........................................................35Figure A1.5: Selected health and education indicators ..................................................................35Figure A1.6: GDP Per Capita, Current USD .................................................................................37
i i
Figure A1.7: Public health expenditure per capita, current USD ..................................................38Figure A1.8: Select health indicators .............................................................................................38Figure A1.9: GDP Per Capita, Current USD .................................................................................39Figure A1.10: Select health and education indicators ....................................................................40Figure A2.1: Gross Private Savings (% of GDP) ...........................................................................42Figure A2.2: Gross Private Savings over time (% of GDP) ..........................................................42Figure A2.3: % of respondents that “Saved any money in the past year” (%age 15+) Palestine vs. MENA ......................................................................................................................42Figure A2.4: GDP Per Capita (PPP, 2014 international $) .............................................................44Figure A2.5: Average Annual GDP per capita Growth over 2004-2014 (constant 2010 US$) .....44Figure A2.6: Real GDP Per Capita Growth (PPP) .........................................................................44Figure A2.7: Savings, consumption & transfers ............................................................................45Figure A2.8: Gross Public savings (% of GDP) ............................................................................46Figure A2.9: Public and Private savings ........................................................................................46Figure A2.10: Broad money (% of GDP) ......................................................................................47Figure A2.11: Domestic credit to private sector (% of GDP) ........................................................47Figure A2.12: Real Interest Rate (%) .............................................................................................47Figure A2.13: Real interest rate (%) ..............................................................................................47Figure A2.14(a): Deposit Interest Rate (%) ...................................................................................47Figure A2.14(b): Lending interest rate (%) ....................................................................................47Figure A2.15: Age dependency ratio .............................................................................................48Figure A2.16: Female Labor force participation Rate (Modeled ILO Estimate) ...........................48
List of Tables
Table 1: Significance of Area C in terms of natural resources .......................................................10Table A3.1: Estimated Average Cost of moving goods from Israel to Palesting ...........................58Table A3.2: Tariff Equivalent Estimates ........................................................................................59Table A3.3: Estimation of TE-Capital ............................................................................................61Table A3.4: TE-Capital Estimate - Summary ................................................................................61
List of Boxes
Box 1: Understanding Palestine’s Low Private Savings ..................................................................2Box 2: Benchmarking Palestine’s Economic Performance .............................................................5Box 3: Overview of Social Accounting Matrix and General Equilibrium Model for the West Bank and Gaza ...................................................................................................................14Box 4: Estimating Tariff Equivalents of External and Internal Constraints ..................................17
i i i
Acknowledgements
This study was prepared by a core team consisting of Thomas Laursen (Lead Economist and TTL, GMF05) and Nur Nasser Eddin (Country Economist and Co-TTL, GMF05). It includes contributions from Rei Odawara (Senior Country Economist, GMF05), Sahar Hussain (Economist, GMF05), and Fayavar Hayati (Young Professional, GMF05). Peter Griffin (international consultant) conducted the CGE modeling work, and Ramesh Adhikari (international consultant) supported by Sami Miari (local consultant) guided and oversaw the data collection and analysis needed for the estimation of tariff equivalents. Elena Ianchovichina (Lead Economist, MNACE) and the MFM modeling team led by Andrew Burns (Lead Economist, GMFD1) and including Dinar Prihardini and Calvin Djiofack provided technical support to the team. The study benefited from guidance and comments from Marina Wes (Country Director, MNCO4), Ranjana Mukherjee (CPC, MNCA4), Mark Ahern (EFI Program Leader, MNC04), Peter Mousley (EFI Program Leader, MNC02), Vivien Foster (Lead Economist, GEEDR), Nabila Assaf (Senior Private Sector Specialist, GTC05), and Lorenzo Bertolini (Senior Private Sector Specialist, GPV01). Peer reviewers were Claudia Nassif (Lead Economist, GMF06), Birgit Hansl (Program Leader, EACPF), Massimiliano Cali (Senior Economist, GTC02), and Ragnar Gudmundsson (Resident Representative West Bank and Gaza, IMF). Muna Salim (Senior Program Assistant, GMF05) provided outstanding editorial and logistical support to the team.
The team is grateful for excellent cooperation and warm hospitality received from the Ministry of National Economy, Ministry of Finance and Planning, Palestinian Monetary Authority, and Palestinian Central Bureau of Statistics. In particular, the team would like to thank the modeling unit in the Ministry of Economy for the technical partnership established in the context of this study. Further, very useful discussions were held with the Peres Center for Peace in Jaffa, which has been studying a range of issues related to trade and Non Trade Barriers between Palestine and Israel.

iv
AbbreviationsARIJ Applied Research Institute - JerusalemBiH Bosnia and HerzegovinaCGE Computable General EquilibriumCIF Cost, Insurance and FreightFCV Fragility, Conflict and ViolenceFDI Foreign Direct InvestmentFOB Freight on BoardGDP Gross Domestic Product GFID Global Financial Inclusion DatabaseGoI Government of IsraelI/O Input-Output ICT Information and Communications TechnologyIEC Israel Electric CorporationIFC International Finance CorporationIL IsraeliITC International Trade CentreK-FP Capital Factor ProductivityL-FP Labor Factor ProductivityLIC Lower Income CountryM2-to-GDP The Ratio of Money and Quasi Money to Gross Domestic ProductMENA Middle East and North AfricaNIS New Israeli SheqelNTB Non Trade BarrierNTM Nontariff Measure ODA Official Development Assistance PA Palestinian Authority PCBS Palestinian Central Bureau of Statistics PFM Public Financial ManagementPLO Palestine Liberation OrganizationPMA Palestine Monetary AuthoritySAM Social Accounting Matrix SSA Sub-Saharan Africa SUT Supply and Use TablesTEs Tariff Equivalents TFP Total Factor Productivity TIMSS Trends in Mathematics and Science StudyWA Wassenaar ArrangementWDI World Development IndicatorsWDR World Development ReportWGI Worldwide Governance Indicators

v
Executive Summary i. The Palestinian economy continues to be severely constrained by the long-lasting
Israeli restrictions.1 The overarching constraint to economic development in Palestine is the restrictions on trade, movement, and access imposed by the Government of Israel (GoI), including a blockade on Gaza since 2007. External trade is tightly controlled by Israel and subject to a range of costly non-tariff barriers, including a long list of dual use items that increase transaction costs and reduce the competitiveness of Palestinian exports. Also, the ongoing expansion of Israeli settlements has significantly reduced land available for use by the Palestinian private sector. For example, Area C, which represents 61 percent of the West Bank and holds strategic transport corridors and access to key natural resources, remains under full Israeli control despite the gradual withdrawal of its administrative and military presence agreed in the Oslo Accords. This leaves Palestinian-controlled areas severely confined and disconnected.
ii. At the same time, internal constraints hold back progress in the current situation and the potential to take full advantage of any alleviation of Israeli restrictions. The political division and strife between the West Bank and Gaza since 2007 has prevented policy coordination, further fragmenting the already limited economic space. Despite a gradual but continuous improvement in institution building and governance between 2003 and 2010, progress has been limited since and in some areas, previous gains have been reversed. Further, significant distortions arise from an economy dominated by the public sector and large utility subsidies provided by the Palestinian Authority (PA). Issues with outdated business legislation, inadequate infrastructure, large swathes of unregistered land and skill mismatches in the labor market also hold back private sector development and can be improved with PA efforts.
iii. Constrained by very difficult external and internal environments, the Palestinian economy has become stuck in a low-income, low-growth trap that is not creating jobs fast enough to keep up with a rapidly growing labor force. Relatively strong growth in the years following the end of the second intifada has subsided, and GDP per capita has been almost stagnant since 2013 - in the context of rapid population growth. Most of the growth that occurred during 2007-12 was driven by an increase in public and private consumption financed by large inflows of donor aid, while investment and productivity growth remained weak. The relative size of the Palestinian tradable sectors, which would have to be the engine of sustainable economic growth, has been shrinking slowly since the 1990s, and Palestine can be described as an import economy with one of the lowest export/import coverage ratios in the world. While economic activity picked up in 2015 and 2016, this was mainly due to a rebound in Gaza related to reconstruction after the 2014 war. The weak economy has contributed to high unemployment despite very low labor force participation rates.
iv. There is an urgent need for a new vision for the Palestinian economy and the main value proposition of this study is to inform such exercise. Using a Computable General Equilibrium (CGE) model as the main tool, this study attempts to quantify the broader economic benefits that could be achieved through an alleviation of external restrictions imposed by the GoI as well as efforts by the PA to mitigate the internal constraints. This in turn could help guide the thinking on a new vision for growth and job creation in Palestine. In addition to a baseline (status quo) scenario, the study analyzes five main scenarios that assume a sequential alleviation of external restrictions (along the lines of the Paris Protocol2) and improvement in the domestic business environment. The analysis is done separately for the West Bank and for Gaza.
1 The GoI states that these restrictions are in place to protect the security of Israel and its citizens.2 The Paris Protocol is the economic annex to the Oslo Accords that regulates the economic relationship between Israel and the PA.
v i
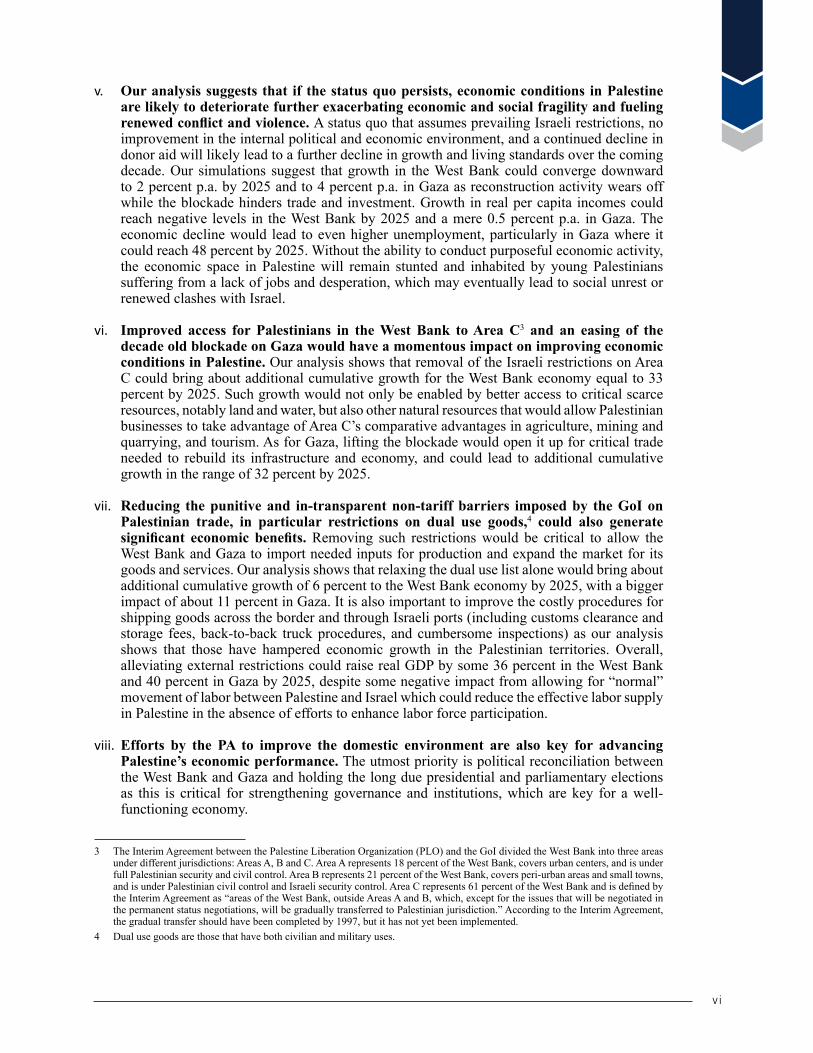
v. Our analysis suggests that if the status quo persists, economic conditions in Palestine are likely to deteriorate further exacerbating economic and social fragility and fueling renewed conflict and violence. A status quo that assumes prevailing Israeli restrictions, no improvement in the internal political and economic environment, and a continued decline in donor aid will likely lead to a further decline in growth and living standards over the coming decade. Our simulations suggest that growth in the West Bank could converge downward to 2 percent p.a. by 2025 and to 4 percent p.a. in Gaza as reconstruction activity wears off while the blockade hinders trade and investment. Growth in real per capita incomes could reach negative levels in the West Bank by 2025 and a mere 0.5 percent p.a. in Gaza. The economic decline would lead to even higher unemployment, particularly in Gaza where it could reach 48 percent by 2025. Without the ability to conduct purposeful economic activity, the economic space in Palestine will remain stunted and inhabited by young Palestinians suffering from a lack of jobs and desperation, which may eventually lead to social unrest or renewed clashes with Israel.
vi. Improved access for Palestinians in the West Bank to Area C3 and an easing of the decade old blockade on Gaza would have a momentous impact on improving economic conditions in Palestine. Our analysis shows that removal of the Israeli restrictions on Area C could bring about additional cumulative growth for the West Bank economy equal to 33 percent by 2025. Such growth would not only be enabled by better access to critical scarce resources, notably land and water, but also other natural resources that would allow Palestinian businesses to take advantage of Area C’s comparative advantages in agriculture, mining and quarrying, and tourism. As for Gaza, lifting the blockade would open it up for critical trade needed to rebuild its infrastructure and economy, and could lead to additional cumulative growth in the range of 32 percent by 2025.
vii. Reducing the punitive and in-transparent non-tariff barriers imposed by the GoI on Palestinian trade, in particular restrictions on dual use goods,4 could also generate significant economic benefits. Removing such restrictions would be critical to allow the West Bank and Gaza to import needed inputs for production and expand the market for its goods and services. Our analysis shows that relaxing the dual use list alone would bring about additional cumulative growth of 6 percent to the West Bank economy by 2025, with a bigger impact of about 11 percent in Gaza. It is also important to improve the costly procedures for shipping goods across the border and through Israeli ports (including customs clearance and storage fees, back-to-back truck procedures, and cumbersome inspections) as our analysis shows that those have hampered economic growth in the Palestinian territories. Overall, alleviating external restrictions could raise real GDP by some 36 percent in the West Bank and 40 percent in Gaza by 2025, despite some negative impact from allowing for “normal” movement of labor between Palestine and Israel which could reduce the effective labor supply in Palestine in the absence of efforts to enhance labor force participation.
viii. Efforts by the PA to improve the domestic environment are also key for advancing Palestine’s economic performance. The utmost priority is political reconciliation between the West Bank and Gaza and holding the long due presidential and parliamentary elections as this is critical for strengthening governance and institutions, which are key for a well-functioning economy.
3 The Interim Agreement between the Palestine Liberation Organization (PLO) and the GoI divided the West Bank into three areas under different jurisdictions: Areas A, B and C. Area A represents 18 percent of the West Bank, covers urban centers, and is under full Palestinian security and civil control. Area B represents 21 percent of the West Bank, covers peri-urban areas and small towns, and is under Palestinian civil control and Israeli security control. Area C represents 61 percent of the West Bank and is defined by the Interim Agreement as “areas of the West Bank, outside Areas A and B, which, except for the issues that will be negotiated in the permanent status negotiations, will be gradually transferred to Palestinian jurisdiction.” According to the Interim Agreement, the gradual transfer should have been completed by 1997, but it has not yet been implemented.
4 Dual use goods are those that have both civilian and military uses.

v i i
Pros
pect
s for
Gro
wth
and
Jobs
in th
e Pale
stin
ian E
cono
my
ix. Our analysis shows that there is much to be gained from PA actions, particularly to improve the business climate and accelerate fiscal reforms. On the business climate front, improving the doing business indicators, increased focus on vocational training to bridge the skill gap in the labor market and accelerating land registration to fully release this factor of production into the economy are key areas that the PA should focus on. On the fiscal side, rationalizing employment in the public sector, making tax collection more effective and efficient, removing price distortions (notably in energy and water), and providing adequate infrastructure are all areas that need to be improved. Our analysis shows that such reforms by the PA would significantly reinforce the positive impact of an alleviation of Israeli restrictions and could generate additional cumulative growth in the range of 24 percent in the West bank by 2025, and even higher at 30 percent in Gaza due to a lower base effect.
x. While progress on these fronts should encourage additional foreign direct investment and private capital inflows, international donors will also have a key role to play through reversing the major decline in aid in recent years. This is particularly important over the medium term while Palestine makes progress on increasing its own fiscal space and improving the environment for private savings. Enhancing public financial management and investment planning while ensuring proper coordination and integration into the budget of donor-funded activities should be a sine-qua-non in this regard.
Figure 1: Projected GDP in 2025 under various scenarios
xi. If progress along these lines were to be made over the medium term, Palestine could achieve much higher rates of growth—perhaps around 6 percent in the West Bank and 8 percent in Gaza by 2025—and creation of new jobs over and above the rapid population growth. Real per capita income growth is expected to exceed 3 percent in the West Bank by 2025 and even higher at about 5 percent in Gaza. This growth level would result in a reduction in the very high rates of unemployment to a projected 11 percent in the West Bank and 34 percent in Gaza, while absorbing additional participants in the labor market - not least women. At the same time, such growth levels would dramatically reduce the dependence on foreign aid. Sustaining such progress in the longer run would require continued steps to enhance access to productive resources, trade-liberalization and integration, labor mobility within the Palestinian territories and between Palestine and Israel, and domestic governance and institutions that affect the business environment. A longer-term vision would of course also have to consider the future of a Palestinian state and options for the economic policy regime (including trade and exchange rate).

v i i i
Figure 2: Unemployment rate under various scenarios, 2016-2025

1
1. Political and Economic Context1. Prospects for a resolution of the longstanding Israeli-Palestinian conflict remain
elusive and internal divisions between the two main Palestinian factions continue to be unresolved. There has been no recent progress in the Israeli-Palestinian peace process and the Oslo Accords of 1995 that were supposed to be for an interim period of five years continue to be in place. Also, the Paris Protocol -- the economic annex to the peace agreement -- still regulates the economic relationship between the parties even though it has become outdated and is not fully implemented as envisaged. The political situation remains precarious with peace talks between the Palestinian Authority (PA) and the Government of Israel (GoI) last held in April 2014. The latest international conference on the Israeli-Palestinian conflict in January 2017 did not succeed in formulating a strategy for restarting discussions. Also, the continuous growth in the size of land allocated for settlement activity in Area C leaves highly limited prospects for a sustainable Palestinian state, even if some land does eventually pass to the PA’s control. On the domestic side, reconciliation efforts between the two main Palestinian factions, Fatah and Hamas, have not yielded any tangible results and the internal divide between Gaza and the West Bank since 2007 continues.
2. For years, the Palestinian economy has been suffering from volatile and unsustainable growth. Following the signing of the Oslo accords and the establishment of the PA, the Palestinian economy enjoyed strong annual growth averaging 9 percent between 1994 and 1999, enabled by the return of Palestinian refugees, restoration of livelihoods, and large inflows of public and private capital. This trend was quickly interrupted after the outbreak of the second Intifada in 2000 when the GoI imposed a multi-layered system of physical, institutional, and administrative restrictions that fragmented the Palestinian territories into small enclaves lacking most forms of economic cohesion, pushing the annual growth rate to minus 9 percent. An initial period of recovery after the end of the Intifada was interrupted by the turmoil surrounding the internal divide in 2006/7 which caused the economy to slip into recession again. In the following years, growth picked up to an annual average of 8 percent between 2008 and 2012 as large amounts of donor funding, equivalent to 32 percent of Palestinian GDP in 2008, in addition to substantial PA reforms and some easing of Israeli restrictions boosted public and private consumption. However, a strong decline in donor aid in recent years led to a slowdown in growth between 2011-2013, while the 2014 war on Gaza pushed the economy into recession again. Even though the economy has been slowly recovering since the war with real GDP growth reaching 4 percent in 2016, recent growth has been driven by unsustainable factors mainly reconstruction efforts in Gaza and some private consumption financed by bank loans in the West Bank.
Figure 3: Real GDP growth, 1995-2016 Figure 4: Contribution to real GDP growth,1995-2016
Source: Palestinian Central Bureau of Statistics
2
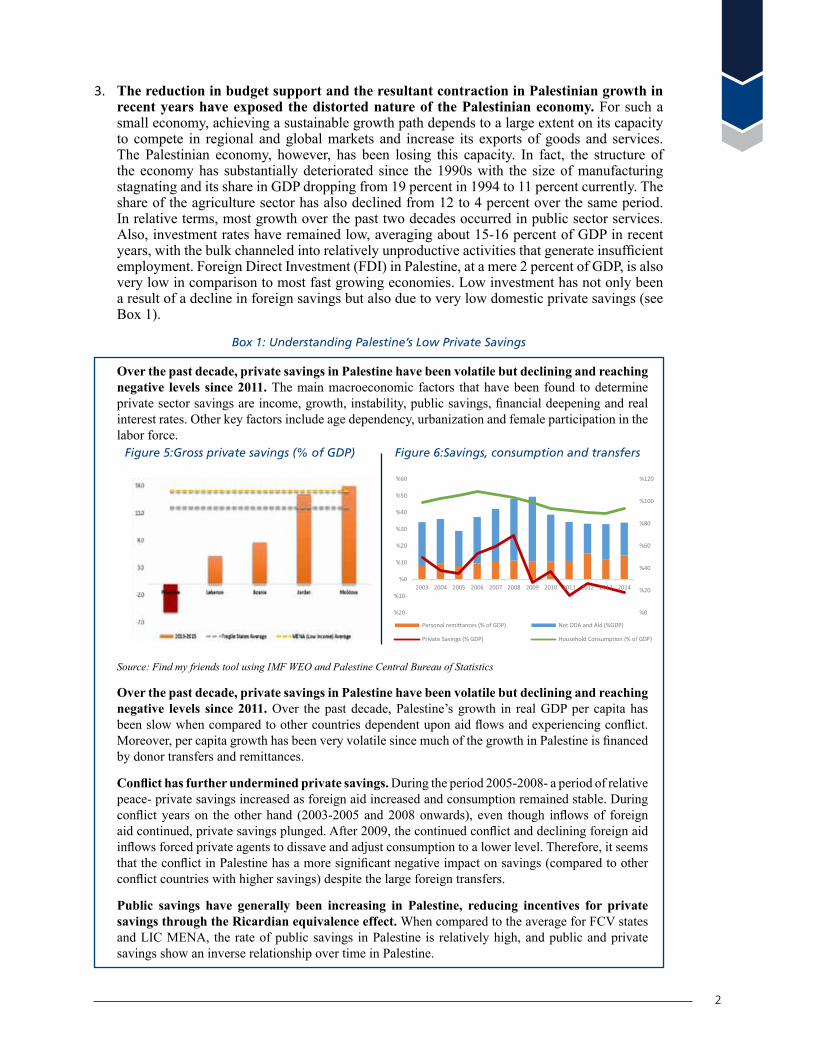
3. The reduction in budget support and the resultant contraction in Palestinian growth in recent years have exposed the distorted nature of the Palestinian economy. For such a small economy, achieving a sustainable growth path depends to a large extent on its capacity to compete in regional and global markets and increase its exports of goods and services. The Palestinian economy, however, has been losing this capacity. In fact, the structure of the economy has substantially deteriorated since the 1990s with the size of manufacturing stagnating and its share in GDP dropping from 19 percent in 1994 to 11 percent currently. The share of the agriculture sector has also declined from 12 to 4 percent over the same period. In relative terms, most growth over the past two decades occurred in public sector services. Also, investment rates have remained low, averaging about 15-16 percent of GDP in recent years, with the bulk channeled into relatively unproductive activities that generate insufficient employment. Foreign Direct Investment (FDI) in Palestine, at a mere 2 percent of GDP, is also very low in comparison to most fast growing economies. Low investment has not only been a result of a decline in foreign savings but also due to very low domestic private savings (see Box 1).
Box 1: Understanding Palestine’s Low Private Savings
Over the past decade, private savings in Palestine have been volatile but declining and reaching negative levels since 2011. The main macroeconomic factors that have been found to determine private sector savings are income, growth, instability, public savings, financial deepening and real interest rates. Other key factors include age dependency, urbanization and female participation in the labor force.
Figure 5:Gross private savings (% of GDP) Figure 6:Savings, consumption and transfers
Source: Find my friends tool using IMF WEO and Palestine Central Bureau of Statistics
Over the past decade, private savings in Palestine have been volatile but declining and reaching negative levels since 2011. Over the past decade, Palestine’s growth in real GDP per capita has been slow when compared to other countries dependent upon aid flows and experiencing conflict. Moreover, per capita growth has been very volatile since much of the growth in Palestine is financed by donor transfers and remittances.
Conflict has further undermined private savings. During the period 2005-2008- a period of relative peace- private savings increased as foreign aid increased and consumption remained stable. During conflict years on the other hand (2003-2005 and 2008 onwards), even though inflows of foreign aid continued, private savings plunged. After 2009, the continued conflict and declining foreign aid inflows forced private agents to dissave and adjust consumption to a lower level. Therefore, it seems that the conflict in Palestine has a more significant negative impact on savings (compared to other conflict countries with higher savings) despite the large foreign transfers.
Public savings have generally been increasing in Palestine, reducing incentives for private savings through the Ricardian equivalence effect. When compared to the average for FCV states and LIC MENA, the rate of public savings in Palestine is relatively high, and public and private savings show an inverse relationship over time in Palestine.
Pros
pect
s for
Gro
wth
and
Jobs
in th
e Pale
stin
ian E
cono
my
3
Limited financial development and low real deposit interest rates have also contained private savings. The ratio of M2-to-GDP for Palestine is less than half of its comparators, while credit to the private sector has been expanding over time. The deposit interest rate is the lowest among comparators and has remained flat since 2000 (increasing only during 2005-2008).
Further, low female labor force participation rates and a high youth age dependency ratio have made it difficult for households to save. The female labor force participation rate in Palestine at 18 percent is the lowest among its comparators, and the lowest in the MENA region, while the youth dependency below the age of 15 years is relatively high at 76 percent. Moreover, with a low old age dependency ratio and high fertility rates, parents can rely on children to support them in old age, thus reducing the need for retirement savings.
The relatively urbanized economy also means less savings. In the Household Expenditure survey of 2010 (covering 3,600 households), only 25 percent report positive savings, all accounted for by the highest income decile. Regression analysis finds that the youth dependency ratio has a negative and significant coefficient, that urban dwellers save less than those in rural areas (and that higher education expenses lead to lower savings), that a higher dependence on remittances has a positive impact on savings, and that wealth such as home and car ownership have a significantly negative impact on savings.
Micro-evidence from Palestine supports these indicative findings. In the Household Expenditure survey of 2010 (covering 3,600 households), only 25 percent report positive savings, all accounted for by the highest income decile. Regression analysis finds that the youth dependency ratio has a negative and significant coefficient, that urban dwellers save less than those in rural areas (and that higher education expenses lead to lower savings), that a higher dependence on remittances has a positive impact on savings, and that wealth such as home and car ownership have a significantly negative impact on savings.
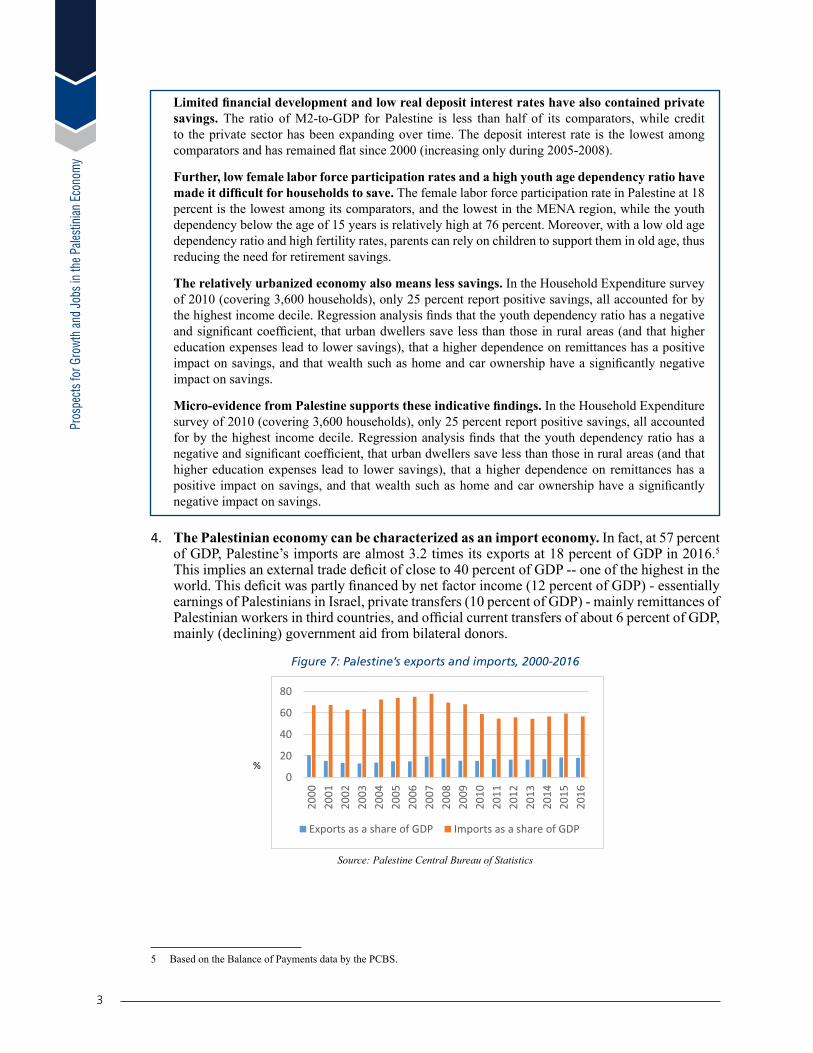
4. The Palestinian economy can be characterized as an import economy. In fact, at 57 percent of GDP, Palestine’s imports are almost 3.2 times its exports at 18 percent of GDP in 2016.5 This implies an external trade deficit of close to 40 percent of GDP -- one of the highest in the world. This deficit was partly financed by net factor income (12 percent of GDP) - essentially earnings of Palestinians in Israel, private transfers (10 percent of GDP) - mainly remittances of Palestinian workers in third countries, and official current transfers of about 6 percent of GDP, mainly (declining) government aid from bilateral donors.
Figure 7: Palestine’s exports and imports, 2000-2016
Source: Palestine Central Bureau of Statistics
5 Based on the Balance of Payments data by the PCBS.

4
5. The Palestinian economy has not been able to generate enough jobs to absorb new labor market entrants, resulting in high and stubborn unemployment. Over the last two decades, the number of Palestinians in the labor force increased by 0.8 million, while only 0.5 million additional jobs were created by the private and public sectors. Hence, the number of unemployed increased by 0.3 million, resulting in an extremely high unemployment rate, fluctuating between 20 and 31 percent over the post Oslo period. Most recent data for 2016 shows that the unemployment rate reached 27 percent: 42 percent in Gaza and 18 percent in the West Bank. The Palestinian labor market suffers from structural problems of inclusion particularly for young people and women. Despite a low participation rate amongst those between 15 and 29 years of age (40 percent), unemployment amongst them reached 27 percent in 2016 in the West Bank and a staggering 56 percent in Gaza. Palestinian women have long been underrepresented in the labor market with recent participation rates of 18 percent – compared to an average of 39 percent in comparator countries
6. Progress in poverty reduction in Palestine remains a challenge as political shocks and episodes of conflict frequently erode welfare gains and increase the risk of the vulnerable falling below the poverty line. Economic growth, social assistance and a well targeted cash transfer program run by the PA have helped reduce poverty in Palestine in the years following the second Intifada. However, political instability and multiple episodes of war in Gaza over the last ten years have significantly eroded these welfare gains. For example, following the 2008/9 war in Gaza, poverty in the Strip increased by 20 percentage points, pushing up the overall poverty rate in Palestine. The latest available poverty data is for 2011 and shows that poverty levels in Gaza were not able to recover to prewar levels, remaining very high at 38 percent. Poverty in the West Bank, however, was much lower at 18 percent in 2011. This clearly indicates a significant spatial disparity in poverty rates, with a large and widening gap in living standards between the West Bank and Gaza. Poverty rates in Gaza are also more volatile because a large share of Gazans live very close to the poverty line and remains at constant risk of falling into poverty with any economic shock or episode of war. Given that poverty is highly correlated with labor market outcomes, and given that the unemployment rate has been on the rise in recent years, it is anticipated that poverty levels in Palestine have increased since 2011, especially in Gaza.
7. On the fiscal side, the most noteworthy development over the last decade is that the PA has managed to significantly reduce the relative size of its recurrent fiscal deficit mainly due to a drop in public spending, while progress on the revenue front has been much weaker. The reduction in the recurrent deficit from 24 percent of GDP in 2006 to close to 6 percent of GDP in 2016 is significant. It was achieved mostly through reduction in the wage bill which dropped by 9 percentage points of GDP between 2006 and 2016 largely thanks to strong GDP growth but also due to hiring control and wage growth. That said, at its current share of 15 percent of GDP, the PA’s wage bill is still amongst the highest in the world. The relative size of the PA’s revenues declined by 9 percentage points of GDP between 2005 and 2013, primarily as a result of the internal divide as the PA has become unable to collect taxes in Gaza. A reversal of this trend started in 2014 and continued throughout 2016 when a series of one-off payments by the GoI pushed revenues to close to 26 percent of GDP. However, domestic revenue collected internally in Palestine remains relatively small at 9 percent of GDP, and low compared to other MENA and emerging economies.
8. The PA continues to suffer from a tight fiscal space and it has relied on the accumulation of payment arrears to finance its deficit. The PA’s total public debt as of December 2016 was close to USD5 billion, equivalent to 37 percent of GDP and close to the legal ceiling of 40 percent. Arrears to the pension fund (12 percent of GDP) and private sector suppliers (4.5 percent of GDP) comprised about half of total public debt. Foreign debt amounted to USD1.07 billion or 8.5 percent of GDP while domestic debt to the banking sector was USD1.47 billion or
Pros
pect
s for
Gro
wth
and
Jobs
in th
e Pale
stin
ian E
cono
my
5
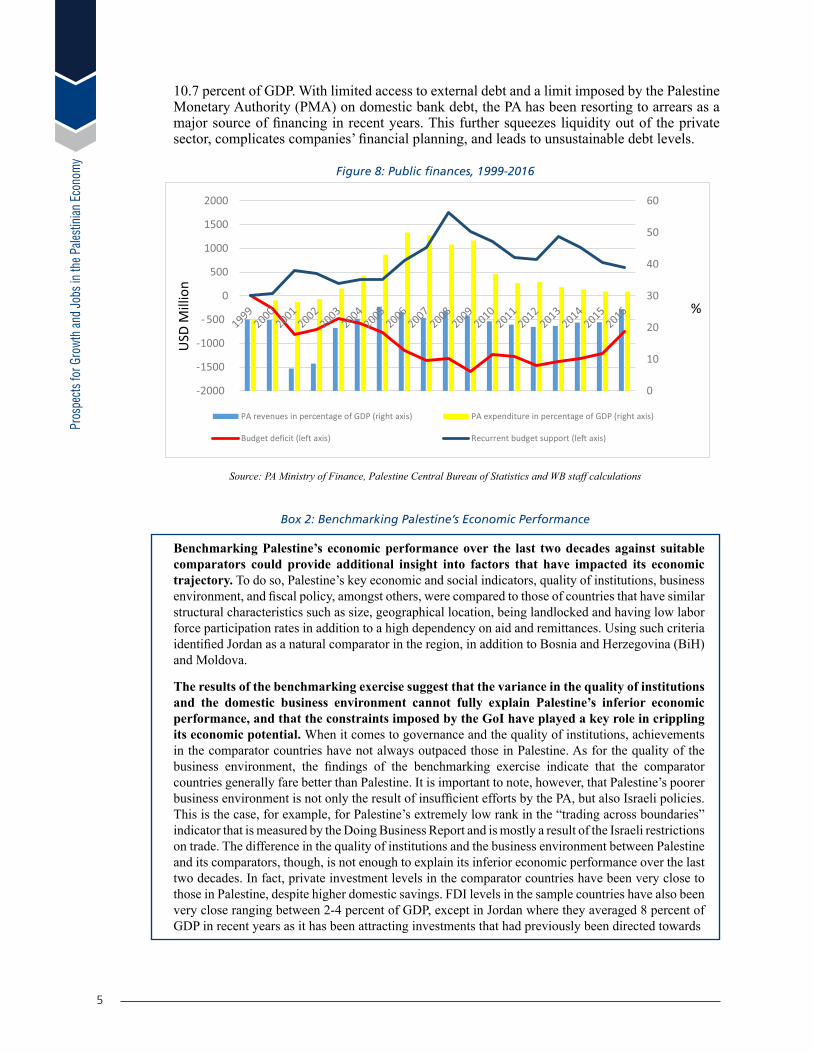
10.7 percent of GDP. With limited access to external debt and a limit imposed by the Palestine Monetary Authority (PMA) on domestic bank debt, the PA has been resorting to arrears as a major source of financing in recent years. This further squeezes liquidity out of the private sector, complicates companies’ financial planning, and leads to unsustainable debt levels.
Figure 8: Public finances, 1999-2016
Source: PA Ministry of Finance, Palestine Central Bureau of Statistics and WB staff calculations
Box 2: Benchmarking Palestine’s Economic Performance
Benchmarking Palestine’s economic performance over the last two decades against suitable comparators could provide additional insight into factors that have impacted its economic trajectory. To do so, Palestine’s key economic and social indicators, quality of institutions, business environment, and fiscal policy, amongst others, were compared to those of countries that have similar structural characteristics such as size, geographical location, being landlocked and having low labor force participation rates in addition to a high dependency on aid and remittances. Using such criteria identified Jordan as a natural comparator in the region, in addition to Bosnia and Herzegovina (BiH) and Moldova.
The results of the benchmarking exercise suggest that the variance in the quality of institutions and the domestic business environment cannot fully explain Palestine’s inferior economic performance, and that the constraints imposed by the GoI have played a key role in crippling its economic potential. When it comes to governance and the quality of institutions, achievements in the comparator countries have not always outpaced those in Palestine. As for the quality of the business environment, the findings of the benchmarking exercise indicate that the comparator countries generally fare better than Palestine. It is important to note, however, that Palestine’s poorer business environment is not only the result of insufficient efforts by the PA, but also Israeli policies. This is the case, for example, for Palestine’s extremely low rank in the “trading across boundaries” indicator that is measured by the Doing Business Report and is mostly a result of the Israeli restrictions on trade. The difference in the quality of institutions and the business environment between Palestine and its comparators, though, is not enough to explain its inferior economic performance over the last two decades. In fact, private investment levels in the comparator countries have been very close to those in Palestine, despite higher domestic savings. FDI levels in the sample countries have also been very close ranging between 2-4 percent of GDP, except in Jordan where they averaged 8 percent of GDP in recent years as it has been attracting investments that had previously been directed towards

6
Syria and Iraq. Further, the employment ratio in the four countries has not been much different, ranging between a minimum of 33 percent in Palestine and a maximum of 40 percent in Moldova in 2016 – lower than the average for other middle income countries which is close to 60 percent. Also, outcomes in health and education (key for the quality of labor inputs) have also been comparable. Despite these similarities, the comparator countries have managed to achieve much higher average growth rates and better integrate in the global economy while Palestine’s trade has been extremely limited and exports stagnant. These findings suggest that the Israeli policies have played a key role in constraining economic development in Palestine, including through the restrictions on trade, movement and access and also general political and security risks (see Annex I for more details).

7
2. Objectives of the Study9. A large number of studies in recent years have attempted to analyze and quantify the
myriad of restrictions holding back economic development in the West Bank and Gaza, but the full picture remains blurred. The World Bank (2014A) estimated the impact of restrictions on movement and access to Area C to be about 35 percent of GDP (including indirect but not general equilibrium effects; see Annex I). In a similar study, the ARIJ (2015) estimated the overall impact of the Israeli restrictions on the West Bank and Gaza to be 74 percent of GDP (also excluding inter-sectoral linkages, especially important in agriculture and services). The IMF (2016) estimated that GDP per capita could have been 37-130 percent higher had it not been for political issues (using a very simple methodology to estimate the growth performance gap 1994-2014). The World Bank (2013) in another partial equilibrium analysis estimated the impact on the labor market to be at least 6 percent of GDP, mainly resulting from lower labor mobility and firm profitability/labor demand. The focus in these studies has been mainly on the impact of the externally imposed restrictions and generally static and (at best) partial equilibrium effects. Other studies of key constraints to sustainable and inclusive growth in Palestine such as World Bank (2012), while remaining relevant, have been largely qualitative.
10. The main value proposition of this study is to assess and quantify the overall prospects for growth and jobs in the West Bank and Gaza using a Computable General Equilibrium model and taking into consideration the uncertain and dynamic environment of shifting boundaries, including the broader economic benefits that could be achieved with an alleviation of external and internal constraints.6 The main focus will be on growth and jobs, including how changes in quantitative restrictions and domestic reforms may affect the availability and productivity of productive resources and their allocation among sectors as well as overall demand patterns. While strong and continued growth is needed to generate new jobs and a more sustained increase in labor demand, employment could also be increased through better matching of skills, lowering of apparent reservation wages arising from e.g. remittances (or other transfers) and/or wage illusion related to higher wages of Palestinian workers in Israel, and increases in labor force participation rates from their current very low levels. As discussed above, domestic savings are also very low, and a more favorable external and internal environment could support higher savings and investment while over time reducing dependence on aid and remittances.
11. It is important to acknowledge that the external and domestic environments are in some cases interdependent. While the restrictions imposed by the GoI are undoubtedly the binding constraint to sustainable development in Palestine, they may have also contributed to the internal political division between the West Bank and Gaza. In the case of Gaza in particular, this has further aggravated external restrictions, mainly through the burden of the blockade. It has also led to creating two separate governance structures and business environments in the West Bank and in Gaza, making it more difficult for Palestine to take better advantage of any alleviation in external constraints. This inevitably makes it difficult in some areas to disentangle external and internal effects and assign resulting distortions to one or the other.
12. The study analyzes a number of different scenarios related to both external and internal constraints. The baseline scenario is essentially a status quo scenario with very limited, if any, improvement in the externally-imposed restrictions and internal politics, institutions, and policies. However, it is conceivable that constraints could be further magnified if the political and security situation were to deteriorate again (as has happened several times in the past) and/or donor funding continues to decline, which warrants analysis of a downside
6 Israel could also benefit from a less restricted economic association with Palestine and a more productive use of resources employed in protecting the existing arrangements, but that analysis goes beyond the scope of this study.
8
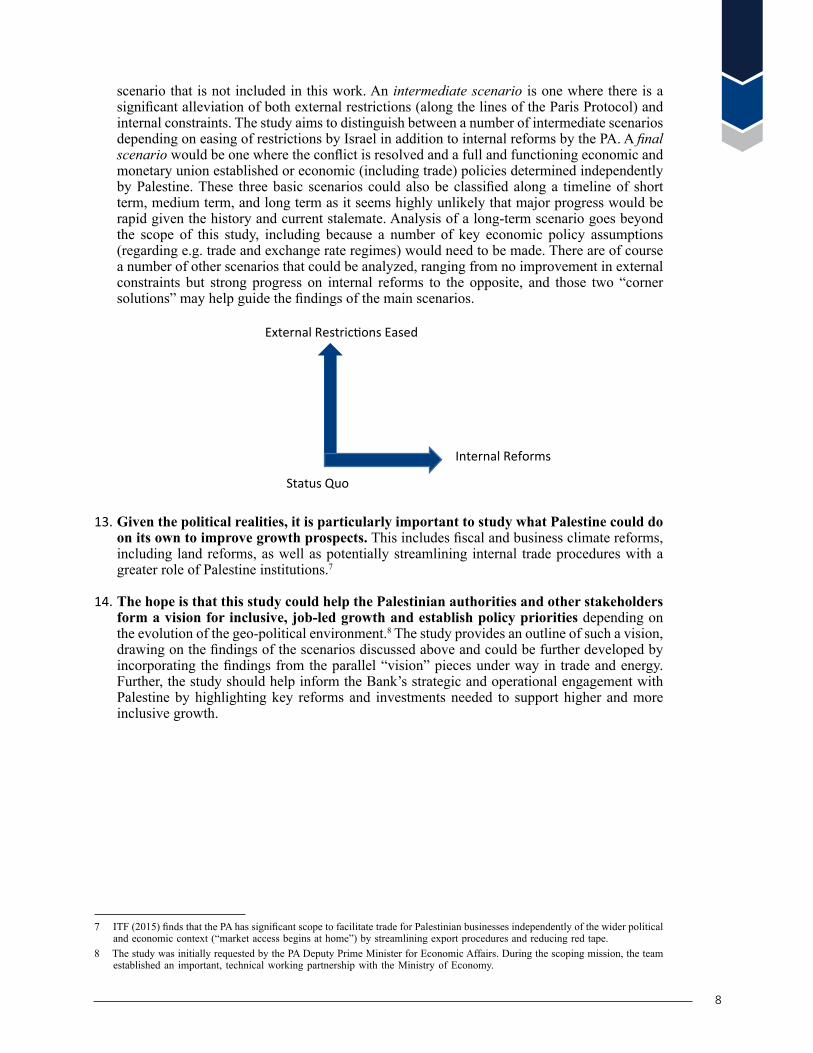
scenario that is not included in this work. An intermediate scenario is one where there is a significant alleviation of both external restrictions (along the lines of the Paris Protocol) and internal constraints. The study aims to distinguish between a number of intermediate scenarios depending on easing of restrictions by Israel in addition to internal reforms by the PA. A final scenario would be one where the conflict is resolved and a full and functioning economic and monetary union established or economic (including trade) policies determined independently by Palestine. These three basic scenarios could also be classified along a timeline of short term, medium term, and long term as it seems highly unlikely that major progress would be rapid given the history and current stalemate. Analysis of a long-term scenario goes beyond the scope of this study, including because a number of key economic policy assumptions (regarding e.g. trade and exchange rate regimes) would need to be made. There are of course a number of other scenarios that could be analyzed, ranging from no improvement in external constraints but strong progress on internal reforms to the opposite, and those two “corner solutions” may help guide the findings of the main scenarios.
13. Given the political realities, it is particularly important to study what Palestine could do on its own to improve growth prospects. This includes fiscal and business climate reforms, including land reforms, as well as potentially streamlining internal trade procedures with a greater role of Palestine institutions.7
14. The hope is that this study could help the Palestinian authorities and other stakeholders form a vision for inclusive, job-led growth and establish policy priorities depending on the evolution of the geo-political environment.8 The study provides an outline of such a vision, drawing on the findings of the scenarios discussed above and could be further developed by incorporating the findings from the parallel “vision” pieces under way in trade and energy. Further, the study should help inform the Bank’s strategic and operational engagement with Palestine by highlighting key reforms and investments needed to support higher and more inclusive growth.
7 ITF (2015) finds that the PA has significant scope to facilitate trade for Palestinian businesses independently of the wider political and economic context (“market access begins at home”) by streamlining export procedures and reducing red tape.
8 The study was initially requested by the PA Deputy Prime Minister for Economic Affairs. During the scoping mission, the team established an important, technical working partnership with the Ministry of Economy.

9
3. Constraints to Growth and Job CreationA. Externally-Imposed Restrictions
15. Restrictions imposed by the GoI have severely hindered Palestine’s trade over the years. The Customs Union formalized under the 1994 Paris Protocol granted Palestinian and Israeli traders equal treatment at Israeli border points, and allowed Palestinian imports and exports to enter or exit Israel either by sea through the Ashdod and Haifa Ports, via land through the Allenby Bridge into Jordan, or via the Ben Gurion Airport. However, with the onset of the second Intifada, the GoI took administrative, logistical and security measures that have become serious obstacles to Palestinian trade and movement of goods and people. These measures collectively operate as a non-tariff barrier for Palestinian traders, weakening the competitiveness of Palestinian products. For example, since the PA does not have presence at the borders, all Palestinian imports and exports pass through Israeli ports or through the Allenby Bridge with Jordan. All goods that transit through Israeli ports must first go through one of four commercial crossings operated by the Israeli Authorities and built along the route of the Israeli – West Bank separation barrier. These commercial crossings have limited working hours and are unable to efficiently process Palestinian goods leading to long waiting hours and increased costs. Moreover, the Israeli authorities impose a back-to-back system in these crossings whereby all Palestinian goods must be moved from/to a Palestinian truck to/from an Israeli truck, or a Jordanian one if the goods are going through the Allenby bridge. This system in addition to long inspections and pervasive security checks (that are even more stringent for goods coming in and out of Gaza) add significant transaction costs (see Figure 12).9
Figure 9: Trade costs and duration of trade process in Palestine compared to MNA and Israel
Average trade costs per transaction (USD) Average duration of trade process (days)
Source: World Bank Doing Business database
16. The GoI applies a long list of dual use items whose export/re-export from Israel to the Palestinian territories is highly controlled, prohibiting the development of key economic sectors. Similar to other advanced countries, Israel controls its exports of goods that have both civilian and military uses, or the so called dual use items. The most common regulatory basis governing the movement of such goods is the 1996 Wassenaar Arrangement (WA).10 Though not a signatory to the WA, Israel uses the arrangement’s lists to license the export of all dual use goods manufactured or assembled in Israel. However, when it comes to exports to the Palestinian territories, the GoI enforces more stringent controls on additional items that it has deemed as “dual use” through the Defense Export Control Law of 2007 and a Military
9 The World Bank, Unlocking the Trade Potential of the Palestinian Economy: Short-Term Measures and a Long-Term Vision to Improve Economic Outcomes in the West Bank and Gaza. 2016.
10 The Wassenaar Arrangement is an international agreement aimed at increasing global stability through transparency and supervision of dual-use exports. States following the arrangement maintain national export controls on listed items. The lists, including those under the various categories of "Dual-Use Goods & Technology," very narrowly describe items of concern and are updated annually by the WA secretariat. For more info, see http://www.wassenaar.org.
10
Order passed in 2008 stipulating that all dual use items destined to Palestine require a special permit and reporting duties.11 These procedures make it extremely difficult, and oftentimes impossible, to import dual use goods to the Palestinian territories. Currently, the dual use list for the West Bank includes 6 fertilizers, 2 pesticides, and 23 chemicals in their pure form in addition to 26 types of materials, machinery, and equipment. Gaza has a more extensive dual use list that covers 61 additional items including reinforcing steel, cement, aggregates, insulating panels, timber for furniture manufacture, amongst many others. Also, traders report that nearly any item can be deemed “dual use” at the entry to Gaza, even if it has been imported previously by the same importer with no special controls. Three major macro sectors are particularly affected by the dual-use restrictions—agriculture, manufacturing, and ICT—and, in particular, the subsectors of food processing, beverages, metal fabrication, pharmaceuticals, textiles, leather, paints, detergents, and cosmetics. In Gaza, the situation is very difficult as almost all economic activities are somehow impacted by the dual use list.
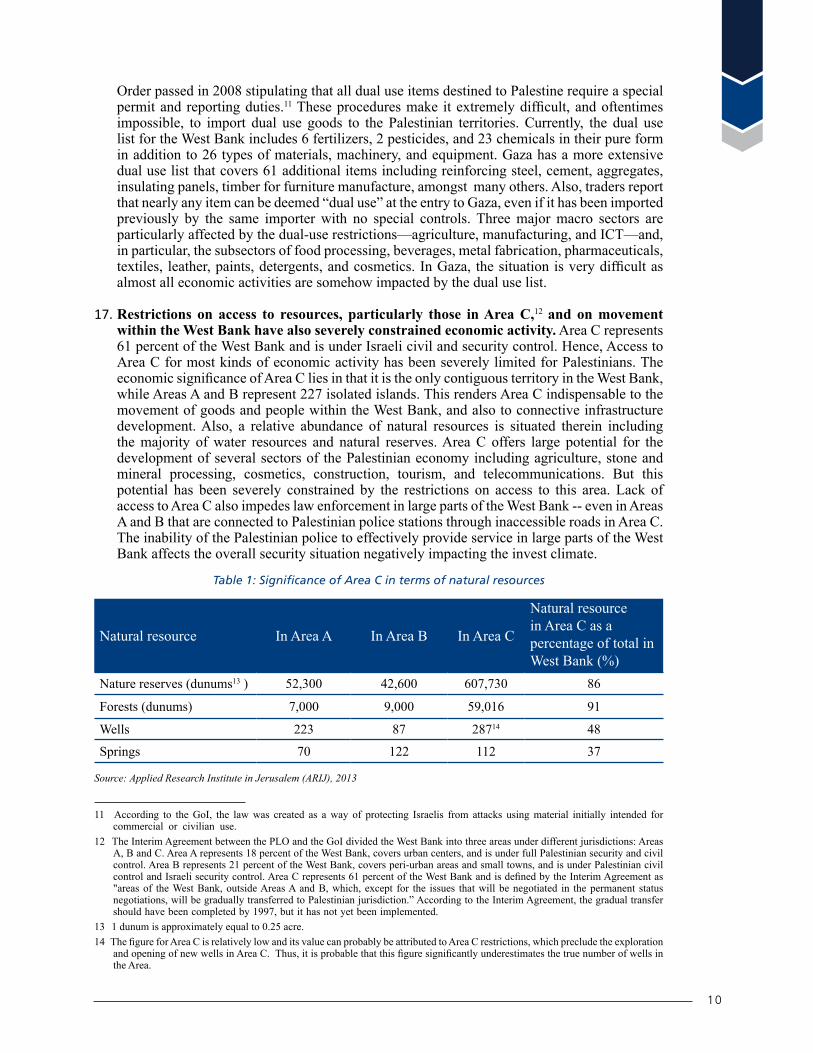
17. Restrictions on access to resources, particularly those in Area C,12 and on movement within the West Bank have also severely constrained economic activity. Area C represents 61 percent of the West Bank and is under Israeli civil and security control. Hence, Access to Area C for most kinds of economic activity has been severely limited for Palestinians. The economic significance of Area C lies in that it is the only contiguous territory in the West Bank, while Areas A and B represent 227 isolated islands. This renders Area C indispensable to the movement of goods and people within the West Bank, and also to connective infrastructure development. Also, a relative abundance of natural resources is situated therein including the majority of water resources and natural reserves. Area C offers large potential for the development of several sectors of the Palestinian economy including agriculture, stone and mineral processing, cosmetics, construction, tourism, and telecommunications. But this potential has been severely constrained by the restrictions on access to this area. Lack of access to Area C also impedes law enforcement in large parts of the West Bank -- even in Areas A and B that are connected to Palestinian police stations through inaccessible roads in Area C. The inability of the Palestinian police to effectively provide service in large parts of the West Bank affects the overall security situation negatively impacting the invest climate.
Table 1: Significance of Area C in terms of natural resources
Natural resource In Area A In Area B In Area C
Natural resource in Area C as a percentage of total in West Bank (%)
Nature reserves (dunums13 ) 52,300 42,600 607,730 86
Forests (dunums) 7,000 9,000 59,016 91
Wells 223 87 28714 48
Springs 70 122 112 37
Source: Applied Research Institute in Jerusalem (ARIJ), 201313 14
11 According to the GoI, the law was created as a way of protecting Israelis from attacks using material initially intended for commercial or civilian use.
12 The Interim Agreement between the PLO and the GoI divided the West Bank into three areas under different jurisdictions: Areas A, B and C. Area A represents 18 percent of the West Bank, covers urban centers, and is under full Palestinian security and civil control. Area B represents 21 percent of the West Bank, covers peri-urban areas and small towns, and is under Palestinian civil control and Israeli security control. Area C represents 61 percent of the West Bank and is defined by the Interim Agreement as "areas of the West Bank, outside Areas A and B, which, except for the issues that will be negotiated in the permanent status negotiations, will be gradually transferred to Palestinian jurisdiction.” According to the Interim Agreement, the gradual transfer should have been completed by 1997, but it has not yet been implemented.
13 1 dunum is approximately equal to 0.25 acre.14 The figure for Area C is relatively low and its value can probably be attributed to Area C restrictions, which preclude the exploration
and opening of new wells in Area C. Thus, it is probable that this figure significantly underestimates the true number of wells in the Area.

Pros
pect
s for
Gro
wth
and
Jobs
in th
e Pale
stin
ian E
cono
my
11
18. Gaza’s economy has been suffering for years now due to a blockade that was imposed in 2007. After the takeover of Gaza by Hamas, the GoI imposed a land, air and water blockade on the strip prohibiting the movement of goods and people from/to it. The blockade had an immediate negative impact on Gaza’s economy which shrank by an annual average of 10 percent between 2006 and 2008, while per capita incomes declined by an annual average of 14 percent over the same period. Even though the GoI took some steps to ease the blockade in 2010, exports allowed out of Gaza continue to be extremely low as the monthly average of truckloads leaving Gaza in 2016 represented 17 percent of what it used to be before the blockade.15 Also, exports to East Jerusalem and the West Bank, which were former lucrative markets for Gaza’s businesses, are mostly not allowed. The GoI allows imports of consumer products and some construction material for donor supervised projects, but the inflow of materials remains much below the needs. Gaza has close to 2 million inhabitants that are not allowed to leave the Strip without special exit permits that Israel has been limiting, mostly to humanitarian cases. The isolation of Gazans has been exacerbated by additional constraints imposed by Egypt on the Rafah crossing. Years of blockade have undermined the living conditions in Gaza and fragmented the economic and social fabric of the Palestinian territories.
19. Although physical restrictions are the most visible, non-transparent and highly unpredictable measures and practices by the GoI also have profound economic impact on the Palestinian economy. For instance, while the Paris Protocol of 1994 stipulated free movement of labor between Israel and the PA, a tight quota has been imposed on Palestinian workers in Israel.16 Obtaining visas for foreign investors to enter Palestine is controlled by the GoI, which has been sparing in issuing such travel permits. Lack of easy access to investments discourages potential foreign investors from exploring business opportunities in Palestine. Also, the high level of uncertainty linked to the political environment makes Palestinian firms highly reluctant to make further investments or upgrade their product lines. Further, the tight restrictions on access to resources such as water and the electromagnetic spectrum are other examples hindering the growth and development of the Palestinian private sector.
B. Internal Constraints
20. At the same time, important inter-related internal constraints hold back any progress in the current situation and the potential to take full advantage of any alleviation of external constraints. The political division and strife between the West Bank and Gaza since 2007 has prevented policy coordination and resulted in two parallel regulatory frameworks thus further fragmenting the already limited economic space. The Palestinian Parliament has not been operational since the internal divide creating a state of legislative paralysis, particularly since the President is hesitant to pass new laws under the emergency powers granted to him. Presidential and parliamentary terms ended in 2009 and 2010 without new elections.
21. Poor governance undermines service delivery and the environment for private sector development. Despite recent progress in improving the business environment, some issues remain outstanding. Since 2010, Palestine’s performance has worsened in key areas such as rule of law, government effectiveness, control of corruption, and regulatory quality based on Worldwide Governance Indicators (WGI). There are major weaknesses in the rule of law, including well-functioning and fair courts and clearly defined and enforced property rights. Further, significant distortions arise from an economy dominated by consumption of public services, a large and ineffective civil service, an unsustainable public sector wage bill, weak institutions, and lack of transparency and accountability. This manifests itself through labor market distortions (public sector salaries are much higher than private sector wages at the lower end of the scale), a non-transparent and archaic legal and regulatory framework, public finances that are neither adequately oriented to growth and inclusion nor financially sustainable despite
15 GISHA - Legal Center for Freedom of Movement, The Gaza Cheat Sheet, accessed on May 3, 2017 and available at: http://gisha.org/reports-and-data/the-gaza-cheat-sheet
16 The Paris Protocol states that labor should be allowed to move freely under “normal circumstances.”
12
substantial donor support, and the inability to pay for essential services (e.g. non-payment by Palestinian distribution companies and municipalities for electricity purchased from the Israel Electric Corporation (IEC), causing cuts in power supplies and frequent power outages). Inadequate infrastructure in land, energy, water and transport constrain private investment and social progress, while the education system fails to deliver a proper match of skills of labor market entrants with private sector demand. Current Public Financial Management (PFM) systems do not provide enough assurances on the quality of spending and the PA’s latest audited financial statements date back to 2011. Given the severe land constraints, limited land registration and unclear property rights even within Palestinian-controlled areas are a major challenge for urban/housing and business development. Gaps in access to finance for dynamic start-ups further limit the space for Palestine’s well-educated and entrepreneurial population, including in promising services such as tourism, IT and telecommunications. Limited competition and contestability of markets further renders the state susceptible to capture by vested interests, while the large and well-established Palestinian diaspora remains waiting on the sidelines.
22. Ultimately, governance failures complicate the peace process. The WDR 2017 and other work on inclusive institutions show that there is a clear correlation between inclusive governance and quality of institutions, on the one hand, and peace, control of violence and stability, on the other hand. The PA’s weakening institutional legitimacy, its perceived lack of effectiveness at national reconciliation, and the perception that it is susceptible to capture are an obstacle rather than an enabler of inclusive growth and can work to aggravate tendencies that could precipitate the Palestinian territories into another cycle of conflict and violence.
13
4. Hypotheses23. Based on the above, in particular the large number of recent relevant studies and
discussions during the missions, a number of hypotheses emerge regarding the impact of external and internal constraints and critical actions and reforms needed to generate growth and jobs in Palestine:
1. Israeli restrictions on movement of goods and people and access to key natural resources constitute the overarching constraint to economic development in Palestine, but there is significant scope for internal reforms to improve performance in the short-medium term while creating the business environment needed to take full advantage of a potential easing of restrictions. Also, bridging the internal divide between the West Bank and Gaza would boost prospects for growth and jobs in both, especially with an easing of Israeli restrictions.
2. There is a significant difference in the impact of restrictions between the West Bank and Gaza and between different sectors and even between companies within the same sector, depending in particular on the reliance on external trade (and on main trading partners) and restricted production inputs as well as competition with Israeli products.
3. In the absence of any significant easing of both external restrictions and internal constraints (that is, moving towards the upper right in the diagram above), living standards are unlikely to improve in a strong and sustained manner and could well deteriorate if existing pressures result in renewed unrest.
4. Investment, employment, and productivity growth could all fuel private sector and export-led growth if restrictions were eased and the business environment improved. At the same time, it is possible that additional Palestine workers would seek jobs in Israel, which could lead to excessive upward pressure on local wages. Over time, wage pressures could be further fueled by domestic demand for labor, especially skilled labor.
5. It is difficult to hypothesize about the relative importance of restrictions on trade, movement of people, and access to land and other natural resources. The priority may be to ease non-tariff barriers on trade, including reducing the dual list for imports, streamlining inspections, and eliminating the back-to-back transport system between Palestine and Israel (and Jordan), if for no other reason that this may be less difficult to achieve politically in the short-medium term.
6. Public finance reforms to strengthen revenue collection and streamline expenditures will be important to make additional fiscal space available for effective development spending and progress towards fiscal sustainability, but significant additional donor funding is also likely to be required at least over the short-medium term. Other key reforms such as land registration and property rights, starting a business, and strengthening the education system to better match labor market needs will also be critical for improving the business environment and strengthening private sector-led growth and job creation.
24. The study analyzes these hypotheses, though it has not been possible to empirically test all of them with any significant degree of confidence.

14
5. Methodology25. In contrast to earlier work attempting to quantify the impact of restrictions, we have
developed a Computable General Equilibrium (CGE) model as the basic tool for analysis in order to capture the broader and dynamic economic impact of external and internal constraints.17 A Social Accounting Matrix (SAM) for 2014 (in transaction prices) was constructed based on the latest available 2004 Input-Output table covering 16 activities. Accounts were divided between the West Bank and Gaza using the available national accounts for each in order to be able to analyze the two regions separately.18 Detailed satellite accounts were constructed for the energy sector to support parallel analysis of energy sector policies.19 A key constraint was the absence of national income accounts; in particular, data were not available on the functional income distribution between labor and capital and had to be based on sector surveys used for the 2001 SAM for Palestine applying the same ratios to each sector in the West Bank and Gaza. Further, we did not have detailed information on labor, including between skilled and unskilled labor, which is an important shortcoming in particular as the impact of potentially more free movement of labor from Palestine to Israel likely would affect mainly unskilled workers.20 Official data also does not distinguish land from other capital, which would be particularly useful for analyzing the Palestinian situation given the restrictions on access to land.21 Finally, trade prices are generally not available as external trade is only recorded in value terms making it difficult to analyze detailed trade policy regimes.
26. The CGE model broadly follows the standard for these models, with parameter estimates and closure rules defining the Palestine-specific model. CGE models are by nature focused on the real sector, with details on fiscal operations and external current account transactions added as available and needed for the analysis at hand. They normally do not include a monetary and financial sector, including assumptions about budget and current account financing and analysis of debt dynamics, and with the focus of our analysis on growth and jobs, we have also not attempted to do that in our model. Further, in line with common practice, investment behavior is not modeled but rather determined by the overall level of savings with no distinction between public and private investment. In the case of Palestine, this is somewhat of a mute-point as only some 20 percent of public investment is captured by the budget (according to the Ministry of Finance).
Box 3: Overview of Social Accounting Matrix and General Equilibrium Model for the West Bank and Gaza
Social Accounting Matrices (SAMs) for West Bank and Gaza (separately) were updated to and balanced for 2014 based on the 2004 Input-Output table(s) covering 17 sectors: Agricultural and Fishing, Mining and Quarrying, Petroleum Products, Manufacturing, Electricity, Water, Construction, Trade and Repair Services, Hotel and Restaurant Services, Transport Services, Communication Services, Financial Services, Business Services & Real Estate, Public Administration, Education Services, Health Services, and Other Services. We have opted for separating the two regions, West Bank and Gaza, into two models as records of economic linkages in terms of goods and factor movements do not currently exist. The only linkage between the West Bank and Gaza is in the form of intra-governmental transfers.
17 The main previous attempt to quantify the impact of Israeli restrictions on trade, mobility, and access was the Area C Report (World Bank, 2014) which focused on the West Bank and the sectoral, static impact of these restrictions. Other work such as Doing Business includes attention to domestic constraints but indicators are not translated to economic terms.
18 PCBS publishes sector production, trade, and consumption data for each region. Government and external income and transfers (net of remittances) were allocated to each region based on population size, and the I/O table imposed on each region balancing the SAM using the standard entropy technique.
19 The PCBS has a good disaggregated energy balance with prices on petroleum products, but not electricity.20 Parallel work underway has collected more detailed labor market data that could be incorporated into the CGE framework in the
future.21 The Ministry of Finance finds that land values are grossly underestimated based on actual property tax collections.

Pros
pect
s for
Gro
wth
and
Jobs
in th
e Pale
stin
ian E
cono
my
15
For each region, an aggregate SAM of main macroeconomic accounts was constructed. The IO sector structure was applied to the sector value added structure. Private demand and capital formation was disaggregated using expenditure shares from IO tables. Export and import shares from trade accounts were applied to aggregate export levels. External transfers were taken from Balance of Payments reports. Detailed energy use and supply information were obtained from the energy balance, and energy prices from survey information. The government accounts were generated from budget information. The application of fixed expenditure and input shares gives an initial SAM estimate that is unbalanced, and balancing was done using a bidirectional entropy method constrained by observed levels.
Each SAM portrays the circular flow of income in each of the economies: from activities and commodities, to factors of production, to institutions, and back again to activities and commodities. The different accounts in the SAMs define the boundaries of each of the economy-wide models. Specification of a complete model requires that the market, behavioral, and system relationships embodied in each account in the SAMs be described in the model. Activity, commodity, and factor accounts all require the specification of market behavior: supply; demand; and clearing conditions. The household and government accounts embody the budget constraints of private households and the public sector budget - income equals expenditure. The capital and the rest of the world accounts represent the macro-economic requirements for internal balance, savings equal investment, and external balance, exports plus net-capital inflows equal imports.
For the households, a representative consumer is assumed to allocate his/her disposable income optimally among goods and services, leisure and savings. The income is defined as after-tax return on capital endowment, government and external transfers, and after-tax return on labor endowment and share of tariff equivalent revenue from service trade restrictions. First, given disposable income and after-tax prices of consumer goods and labor, consumers make an optimal allocation of income between savings and the total consumption of goods and services. Second, given the level of total demand, consumers choose an optimal mix of goods and services and leisure. We follow common assumptions on the parameters guiding the latter choice, but may be overestimating the demand for leisure in Palestine given the particular circumstances.
The standard CGE model does not incorporate explicit investment behavior by firms, either at the sectoral or aggregate level. In each period, the total level of savings available for investment is defined as the sum of household savings, the government sector’s operational balance and the net inflow of foreign capital given by the difference between total imports and total exports less net official and non-official transfer payments. If the model is run in a dynamic model, total investment is added to an estimate of the existing stock of capital net of depreciation 22. The institutional ownership of the additional capital stock is allocated according to each institution’s share in total savings.
The government sector has two principal functions, the collection of revenues and the determination of the level and pattern of public expenditures, including government consumption, subsidies, and net asset financing. Revenues are derived from taxes and/or profit shares on factor incomes. The incentive effects of the tax and subsidy regime are reflected through their influence on the decisions of economic agents by changing relative prices and disposable incomes. The level of tax revenues is endogenous in the model as it depends on the resulting (equilibrium) level of economic activity.
Two sets of factor markets must be in equilibrium: capital and labor. Electricity generation & transmission capital is specific to the electricity sector, while general capital is perfectly mobile between competing uses. Sectors using general capital are assumed to be able to disinvest when their demand for capital in any period is less than their depreciated stock of old capital. The disinvested
22 To calculate the initial capital stock in each sector, we assume that the rate of return on any type of assets is the same in all occupations. Second, this return is assumed equal to an average nominal long-term interest rate in the economy in 2014 of 9 percent for the West Bank and 11 percent for Gaza. These two assumptions give the total stock of capital in the economy, which is then allocated to each of the institutions according to its share of capital factor payments in the SAM for 2014. The portfolio choices of each type of capital for the capital owners are given as a revenue maximization problem.
16
capital is added to the supply of new capital. The capital market is in equilibrium when the value of the marginal product of capital is equalized between all sectors. The labor force is assumed to be fully mobile between sectors. Labor demand is based on firm cost minimization with diminishing returns to scale and employment and wages determined by the intersection of labor supply and demand. Unemployment is the difference between the labor force and employment.
Closure rules are chosen to reflect assumptions on the working of the household savings behavior, factor markets market, the rest of the world, and the fiscal policy environment, including changes to the user specific subsidy rates (or prices) for individual energy products. Household savings behavior and transfers are assumed constant in the model simulations. We employ the classical assumption of flexible factor prices determined as the market-clearing price between the demand and the supply of all factors. Changes in the labor factor endowment of model institutions are at this stage of the model development given exogenously. For the ‘rest of the world’, we assume that changes in the world prices for each commodity group and transfer payments from abroad are exogenous. We have specified a fixed exchange rate system with an exogenous current account balance (real exchange rate adjusts to balance the external accounts). For the government, we assume the following exogenous variables: changes in user specific and non-user specific subsidy rates for goods and services, tariffs and other indirect tax rates on goods and services and direct tax rates on factors by type of institutional factor owner; the composition and level of government commodity demand; and transfers to and from households as either direct transfers (including pensions and interest payments) or as fees, fines and other non-tax revenues.
The parameters that need to be specified empirically range from the share parameters in the material balances and income equations to the own and cross-price elasticities in the demand and supply equations. The approach adopted here (and in nearly all CGE applications) is to use information contained in the SAM, supplemented as needed by additional sources or, when possible, by econometric estimates. The model employs a number of estimates of substitution elasticities in trade, production, and consumption. As is normal practice, these values are based on econometric estimates found in the literature. 23
27. In order to analyze the impact of non-tariff trade barriers, restrictions on mobility and access to land and other natural resources, and other distortions arising from the domestic policy and institutional environment, we estimate trade-related and nontrade-related tariff equivalents (TEs).24 While Doing Business indicators may provide some useful information on the severity of Non Trade Barriers (NTBs), they are not in economic terms and cannot be used in our model. We estimate the TEs based on the 2014 industrial survey of cost structure in 45 sectors. Trade-related TEs are estimated in two steps: (i) estimation of the average cost of storage, transportation, and border crossing (based on our own surveys); (ii) application of this cost to the share of traded-inputs in production. Nontrade-related (“capital”) TEs are estimated as the residual operating surplus, adjusted for the “normal” rate of return.
23 See e.g. Capros et. Al. 2010.24 An alternative and simpler, intuitively appealing approach would be to estimate the impact of the restrictions by modeling a
reference country (e.g. Jordan). The economic structure of Palestine could be compared to that of a similar economy that is considered free of the constraints imposed on Palestine but has similar technology. A model of the reference economy could be prepared with the same aggregation of commodities and factors as the one for Palestine, and the exogenous environment for a given reference year (e.g. factor endowments, tax and tariff rates, subsidy rates, transfers, government consumption, household saving rates, current account deficit, GDP deflator, and all substitution elasticities) from Palestine could be imposed on the model of the reference economy in a (static) counterfactual simulation. The resulting SAM from the counterfactual simulation of the reference economy could then be compared to the existing SAM for Palestine, with the difference between the SAMs being an approximation of the total distortion imposed on the economy. The estimates of distortions (adjustment factors) could finally be converted to tariff equivalents. Similar to our estimation of nontrade-related tariff equivalents, the reference country approach would not easily allow one to distinguish the impact of external versus internal constraints, and differences could also reflect the broader peculiarity of the Palestinian economy and lack of comparability with other countries under the current circumstances. A study of the welfare impact of the blockade of Gaza 2007-10 uses the West Bank as a counterfactual (see Etges et al, 2015), but it is not clear that much would be gained for our analysis as we do not have separate I/O data for the two regions and have to assume the same technology for both. A variant of the reference country approach could be to compare to an earlier period for Palestine when restrictions were less of an issue, but this would be difficult due to the lack of sufficient time-series and because we have only the same I/O table.

Pros
pect
s for
Gro
wth
and
Jobs
in th
e Pale
stin
ian E
cono
my
17
The TEs are then aggregated to the 16 sectors in the SAM. We find that trade-related TEs are around 2-3 percent, as expected highest in sectors that rely more on traded inputs. Capital TEs are very high in some sectors such as construction and international trade & repair (as well as real estate in the West Bank and agriculture in Gaza) due to the combined impact of external restrictions and domestic distortions. It is generally not possible to distinguish the impact from one versus the other, though in some sectors such as real estate it is plausible that the major impact comes from the external restrictions on access to land. Further detail on the estimation of TEs is provided in Box 4.
Box 4: Estimating Tariff Equivalents of External and Internal Constraints
The estimation of tariff equivalents (TEs) involves estimating the price distortions resulting from externally imposed restrictions and internal structural, institutional and regulatory constraints on domestic economic activities. TEs raise prices similar to the effect of tariffs and taxes, but they are dissimilar in the sense that they do not necessarily raise revenues for the government. We estimate two main types of TEs: trade-related (TE-trade), i.e. cost of externally imposed constraints (nontariff barriers) on moving goods from Israeli (IL) ports and markets to major Palestinian domestic markets; and (ii) capital-related (TE-capital) emanating from a host of external and internal constraints in domestic markets (such as access to land/water sources and internal structural, institutional and regulatory constraints on domestic economic activities such as construction permits, trade licenses, export certification, etc. 25
Palestine’s (PA) main channel of trade is with IL and through IL and subject to numerous hurdles. Goods need to get customs cleared and then moved to PA markets via IL-PA border crossings where they are subject to border checks\inspections (imports from/through IL face similar challenges). For imports to the PA, the cost of moving goods from IL ports\markets to PA markets includes (i) transport cost, (ii) customs clearing agent’s charge, (iii) cost of delays, and (iv) cost of border checks (including security checks) in addition to documentary compliance checks. The cost of the latter depends on the intensity of the checks\inspections. Based on information from freighters and customs clearing agents, we estimate the average cost to be 6.2 percent (of the CIF value) in the West Bank, close to the average nominal customs duty rate of 7.5 percent.26 We do not have a similar survey for Gaza, but costs are likely to be significantly higher given the perceived escalated security risks. We assume that the trading costs would be at least 50 percent higher than for the West Bank.
Based on a Palestine Central Bureau of Statistics (PCBS) 2014 industry survey of 45 sectors and sub-sectors covering cost of production data (traded inputs, nontraded services, electricity and water, labor, capital charges, tariffs and taxes, and operating surplus), we estimated TE-trade and TE-capital for each sector (the survey does not provide information on domestic versus foreign sales and we can thus not calculate export-TEs; see footnote 25 on how these are addressed in the model). TE-trade is estimated using the cost of trading across the border cost above (6.2 percent and 9.3 percent, respectively) and the traded
25 Exports also face cumbersome compliance challenges in terms of border checks and documentary compliance as they have to pass IL-PA border crossing and eventually be shipped from IL ports. Under the documentary compliance, there are two stringent requirements that should satisfy IL authorities: (i) certificate of standards; and (ii) certificate of health. As part of the customs union, PA has to comply with both IL standards (transit country) and then international standards (destination country). Exporters find it cumbersome to obtain export certificates and permits as well as certificates of origin from PA authorities. PA institutions associated with trade procedural obstacles include the Ministry of National Economy, the Palestinian Standards Institute, testing facilities, the Ministry of Finance, the Ministry of Health, and the Ministry of Agriculture. Few PA firms manage to live up to international standards and obtain the related certification. Based on the 2016 Doing Business Survey cost of trade data, and assuming that transportation costs and border security inspection costs are similar to those for imports, we estimate that the total cost of moving export goods across the border to be in the order of 10 percent of the FOB value of exports.
26 A substantial part of the cross-border trade is not recorded thus raising considerable uncertainty about the cost per container.
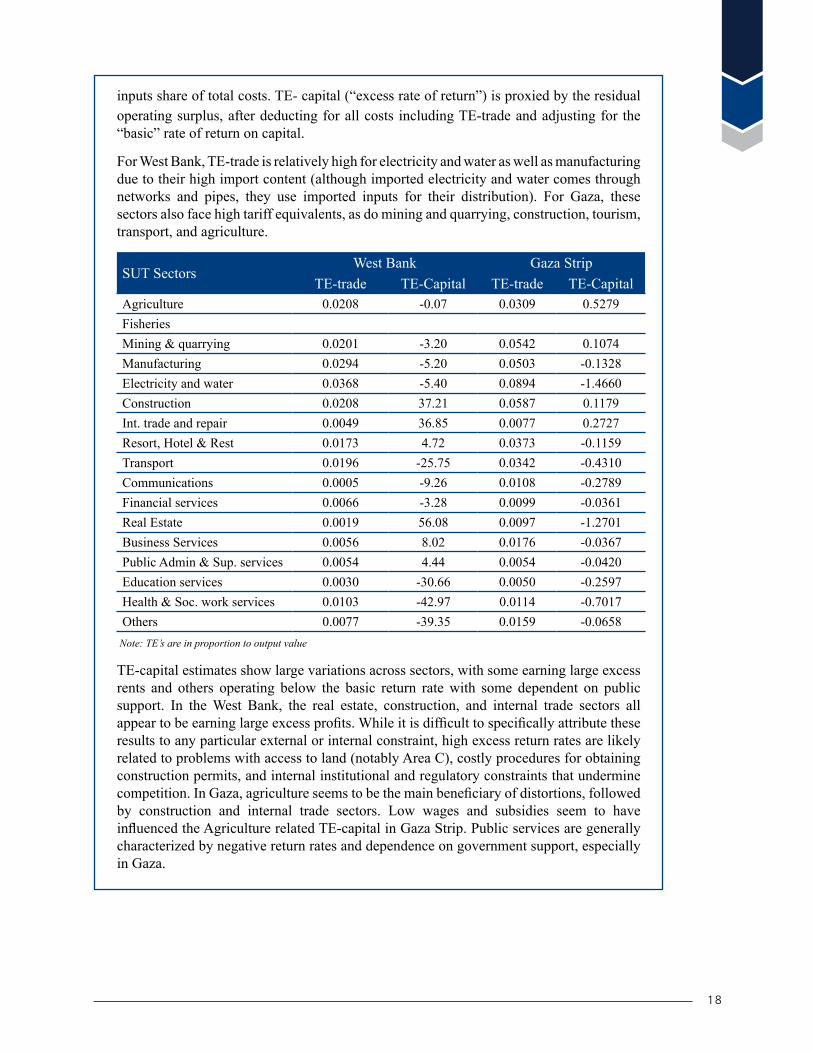
18
inputs share of total costs. TE- capital (“excess rate of return”) is proxied by the residual operating surplus, after deducting for all costs including TE-trade and adjusting for the “basic” rate of return on capital.
For West Bank, TE-trade is relatively high for electricity and water as well as manufacturing due to their high import content (although imported electricity and water comes through networks and pipes, they use imported inputs for their distribution). For Gaza, these sectors also face high tariff equivalents, as do mining and quarrying, construction, tourism, transport, and agriculture.
SUT SectorsWest Bank Gaza Strip
TE-trade TE-Capital TE-trade TE-CapitalAgriculture 0.0208 -0.07 0.0309 0.5279Fisheries
Mining & quarrying 0.0201 -3.20 0.0542 0.1074Manufacturing 0.0294 -5.20 0.0503 -0.1328Electricity and water 0.0368 -5.40 0.0894 -1.4660Construction 0.0208 37.21 0.0587 0.1179Int. trade and repair 0.0049 36.85 0.0077 0.2727Resort, Hotel & Rest 0.0173 4.72 0.0373 -0.1159Transport 0.0196 -25.75 0.0342 -0.4310Communications 0.0005 -9.26 0.0108 -0.2789Financial services 0.0066 -3.28 0.0099 -0.0361Real Estate 0.0019 56.08 0.0097 -1.2701Business Services 0.0056 8.02 0.0176 -0.0367Public Admin & Sup. services 0.0054 4.44 0.0054 -0.0420Education services 0.0030 -30.66 0.0050 -0.2597Health & Soc. work services 0.0103 -42.97 0.0114 -0.7017Others 0.0077 -39.35 0.0159 -0.0658
Note: TE’s are in proportion to output value
TE-capital estimates show large variations across sectors, with some earning large excess rents and others operating below the basic return rate with some dependent on public support. In the West Bank, the real estate, construction, and internal trade sectors all appear to be earning large excess profits. While it is difficult to specifically attribute these results to any particular external or internal constraint, high excess return rates are likely related to problems with access to land (notably Area C), costly procedures for obtaining construction permits, and internal institutional and regulatory constraints that undermine competition. In Gaza, agriculture seems to be the main beneficiary of distortions, followed by construction and internal trade sectors. Low wages and subsidies seem to have influenced the Agriculture related TE-capital in Gaza Strip. Public services are generally characterized by negative return rates and dependence on government support, especially in Gaza.

Pros
pect
s for
Gro
wth
and
Jobs
in th
e Pale
stin
ian E
cono
my
19
28. In our CGE model, both trade- and capital TEs work through the price system as ad-valorem taxes. The trade-TEs are applied to import prices and the revenue of the tax (equivalent) accrues to foreign agents (export-related TEs act as a tax on exports paid by households and again accruing to foreign agents but these are already reflected in FOB export prices and any reduction would be reflected in higher export prices). The capital TEs work as an indirect tax and applies to domestic producer prices. Unlike the indirect tax, the revenue from the capital TEs (excess rents) accrue to households rather than the government (households own the factors and are getting the both the normal and the excess return). Regretfully, we only have one household type in the model; distributional impacts would be very interesting to trace in a multiple household model (capital versus labor income-based households).
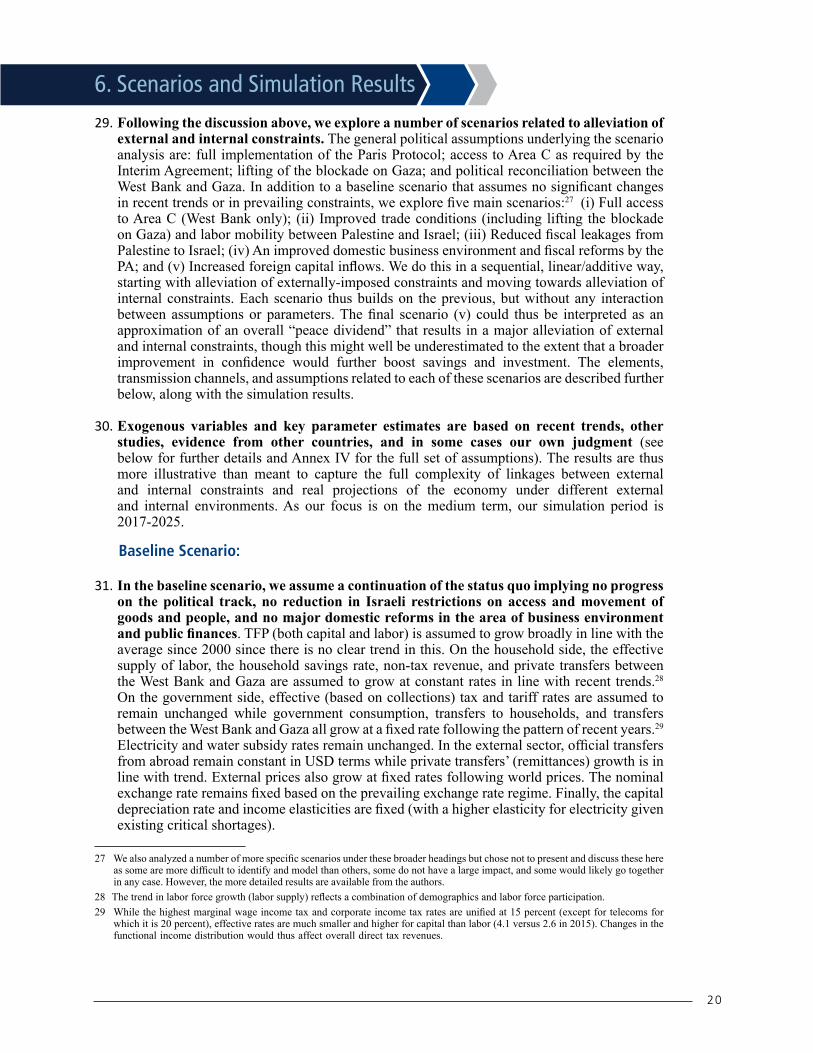
20
6. Scenarios and Simulation Results
29. Following the discussion above, we explore a number of scenarios related to alleviation of external and internal constraints. The general political assumptions underlying the scenario analysis are: full implementation of the Paris Protocol; access to Area C as required by the Interim Agreement; lifting of the blockade on Gaza; and political reconciliation between the West Bank and Gaza. In addition to a baseline scenario that assumes no significant changes in recent trends or in prevailing constraints, we explore five main scenarios:27 (i) Full access to Area C (West Bank only); (ii) Improved trade conditions (including lifting the blockade on Gaza) and labor mobility between Palestine and Israel; (iii) Reduced fiscal leakages from Palestine to Israel; (iv) An improved domestic business environment and fiscal reforms by the PA; and (v) Increased foreign capital inflows. We do this in a sequential, linear/additive way, starting with alleviation of externally-imposed constraints and moving towards alleviation of internal constraints. Each scenario thus builds on the previous, but without any interaction between assumptions or parameters. The final scenario (v) could thus be interpreted as an approximation of an overall “peace dividend” that results in a major alleviation of external and internal constraints, though this might well be underestimated to the extent that a broader improvement in confidence would further boost savings and investment. The elements, transmission channels, and assumptions related to each of these scenarios are described further below, along with the simulation results.
30. Exogenous variables and key parameter estimates are based on recent trends, other studies, evidence from other countries, and in some cases our own judgment (see below for further details and Annex IV for the full set of assumptions). The results are thus more illustrative than meant to capture the full complexity of linkages between external and internal constraints and real projections of the economy under different external and internal environments. As our focus is on the medium term, our simulation period is 2017-2025.
Baseline Scenario:
31. In the baseline scenario, we assume a continuation of the status quo implying no progress on the political track, no reduction in Israeli restrictions on access and movement of goods and people, and no major domestic reforms in the area of business environment and public finances. TFP (both capital and labor) is assumed to grow broadly in line with the average since 2000 since there is no clear trend in this. On the household side, the effective supply of labor, the household savings rate, non-tax revenue, and private transfers between the West Bank and Gaza are assumed to grow at constant rates in line with recent trends.28
On the government side, effective (based on collections) tax and tariff rates are assumed to remain unchanged while government consumption, transfers to households, and transfers between the West Bank and Gaza all grow at a fixed rate following the pattern of recent years.29
Electricity and water subsidy rates remain unchanged. In the external sector, official transfers from abroad remain constant in USD terms while private transfers’ (remittances) growth is in line with trend. External prices also grow at fixed rates following world prices. The nominal exchange rate remains fixed based on the prevailing exchange rate regime. Finally, the capital depreciation rate and income elasticities are fixed (with a higher elasticity for electricity given existing critical shortages).
27 We also analyzed a number of more specific scenarios under these broader headings but chose not to present and discuss these here as some are more difficult to identify and model than others, some do not have a large impact, and some would likely go together in any case. However, the more detailed results are available from the authors.
28 The trend in labor force growth (labor supply) reflects a combination of demographics and labor force participation.29 While the highest marginal wage income tax and corporate income tax rates are unified at 15 percent (except for telecoms for
which it is 20 percent), effective rates are much smaller and higher for capital than labor (4.1 versus 2.6 in 2015). Changes in the functional income distribution would thus affect overall direct tax revenues.

Pros
pect
s for
Gro
wth
and
Jobs
in th
e Pale
stin
ian E
cono
my
21
West Bank GazaReal GDP growth converges downwards to around 2% as government savings and total investment ratios decline while TFP growth returns to its recent lower level. The already very high unemployment rate continues to rise as employment growth cannot keep pace with labor force growth.
Real GDP growth declines to 3.9% by 2025 as official transfers to Gaza (namely for reconstruction) significantly drop over the coming years leading to lower public consumption. Employment cannot keep up with the growing labor force leading to a continuous increase in the unemployment rate, projected to reach almost 48% by 2025, while TFP growth declines (though still contributing most of the growth during 2016-25).
West Bank Gaza2016 2020 2025 2016 2020 2025
Real GDP growth (%) 2.9 2.5 2.0 7.6 4.0 3.9Cumulative (2016-2025) 30 23.4 43.5Cumulative (in factor prices)31 19.2 39.4 Investment 8.0 4.8 K-FP 3.2 13.0 Labor 6.0 10.2 L-FP 2.0 11.5GDP per capita ($) 32 3944 3921 3824 1991 2060 2113Investment (% GDP) 25.6 24.5 23.8 13.4 14.8 16.4Private savings (% GDP) 9.4 9.5 9.7 2.4 2.1 1.9Fiscal operational balance(% GDP)
1.4 0.1 -1.2 -3.3 -2.4 -1.4
Current account balance(% GDP)
-14.8 -14.9 -15.3 -14.3 -15.0 -15.9
Employment (1000) 690 747 819 250 278 315Unemployment rate (%) 18.5 18.4 19.0 44.8 45.9 47.5Wage rate (2014=100) 1.0 1.1 1.1 1.0 0.9 0.9Labor force (1000) 846 915 1010 454 513 599Population 33 2,670,431 2,972,194 3,397,793 1,881,135 2,150,824 2,542,940
Scenario 1: Full access to Area C (West Bank)
32. Area C constitutes 61 percent of the West Bank, includes most of its natural resources, and is currently largely off-limits to Palestinians. Full access to Area C would imply, inter alia, improved access to land and water thus augmenting the capital stock in key sectors with potential in the West Bank (notably agriculture, mining, water, and tourism) while lowering the need for water subsidies; higher productivity in agriculture from irrigation etc. (with higher labor productivity spreading to the rest of the economy as labor is assumed to be fully mobile
30 Here and in the following tables this is compared to the previous scenario (not relevant for baseline).31 Contributions to real GDP growth relative to the previous scenario (not relevant for baseline).32 Per capita figures cited in this report are higher than those published by the PCBS because GDP figures used in our model include
all indirect taxes while GDP figures published by the PCBS only include indirect taxes on imports. 33 West Bank population includes the part of Jerusalem that is within the separation barrier.

22
between sectors); and improved infrastructure that would lower transport costs and further enhance productivity in key sectors operating in the area (as well as reduce opportunities for excess rents resulting from scarcity of resources such as land). Guided by the findings of previous work by the World Bank on the overall economic potential of Area C (World Bank 2014A), we assume that the capital stock in key sectors increases by 8.5 percent per year, that labor and capital factor productivity growth will increase by 0.6 and 2.0 percentage points, respectively, per year (and in agriculture by an additional 2.5 percentage points increase in capital factor productivity), that water subsidies decline by 25 percent per year, and that trade and capital TEs will decline by 5 percent per year. The simulations suggest the following outcomes:
West Bank GazaReal GDP growth increases to about 5½% in the coming years driven mainly by a higher capital stock and TFP growth while savings and investment decline (including because of a reduction in the external current account deficit reflecting an improved trade balance that outweighs lower private and official transfers). The unemployment rate declines to 14½% as employment expands even faster than the labor force, while wages rise rapidly due to higher demand for labor.
No Impact on the Gaza economy.
West Bank2016 2020 2025
Real GDP growth (%) 2.9 5.3 4.1
Cumulative (2016-2025) 33.0
Cumulative (in factor prices) 27.2
Investment -0.7
K-FP 23.3
Labor 2.1
L-FP 2.5
GDP per capita ($) 3944 4448 4846
Investment (% GDP) 25.6 23.4 21.8
Private savings (% GDP) 9.4 9.1 8.8
Fiscal operational balance (% GDP) 1.4 0.9 0.5
Current account balance (% GDP) -14.8 -13.4 -12.5
Employment (1000) 690 770 863
Unemployment rate (%) 18.5 15.9 14.4
Wage rate (2014=100) 1.0 1.4 1.7
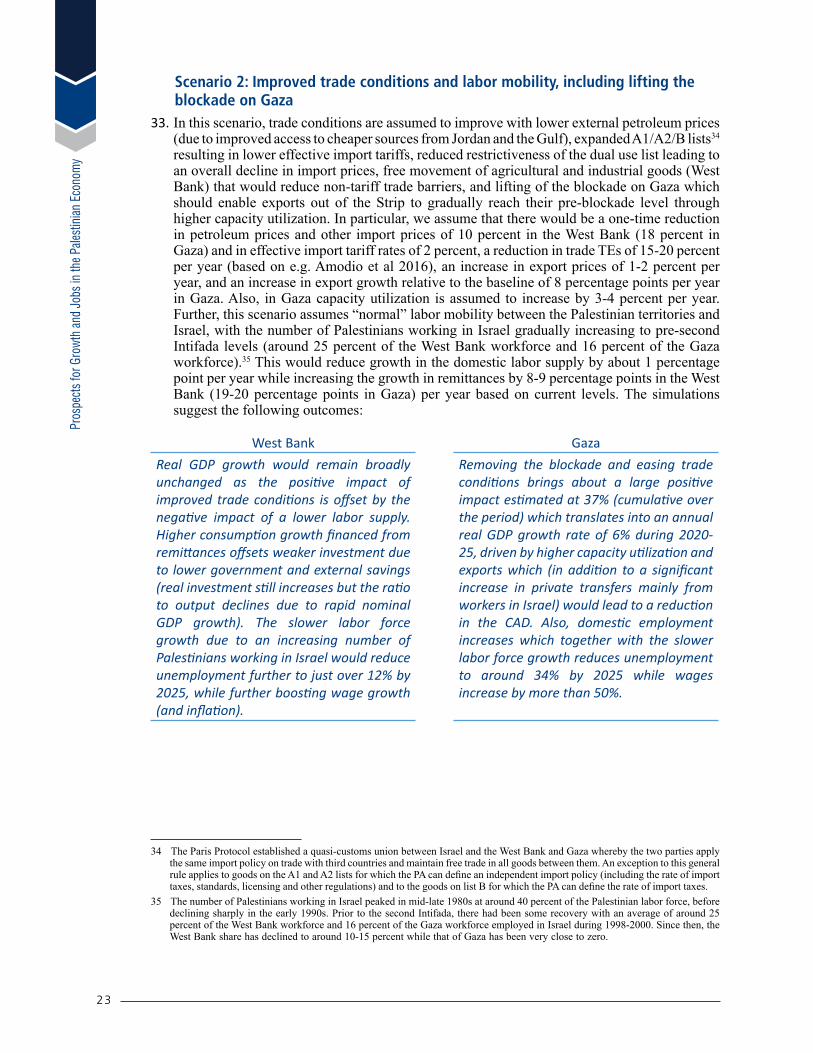
Pros
pect
s for
Gro
wth
and
Jobs
in th
e Pale
stin
ian E
cono
my
23
Scenario 2: Improved trade conditions and labor mobility, including lifting the blockade on Gaza
33. In this scenario, trade conditions are assumed to improve with lower external petroleum prices (due to improved access to cheaper sources from Jordan and the Gulf), expanded A1/A2/B lists34
resulting in lower effective import tariffs, reduced restrictiveness of the dual use list leading to an overall decline in import prices, free movement of agricultural and industrial goods (West Bank) that would reduce non-tariff trade barriers, and lifting of the blockade on Gaza which should enable exports out of the Strip to gradually reach their pre-blockade level through higher capacity utilization. In particular, we assume that there would be a one-time reduction in petroleum prices and other import prices of 10 percent in the West Bank (18 percent in Gaza) and in effective import tariff rates of 2 percent, a reduction in trade TEs of 15-20 percent per year (based on e.g. Amodio et al 2016), an increase in export prices of 1-2 percent per year, and an increase in export growth relative to the baseline of 8 percentage points per year in Gaza. Also, in Gaza capacity utilization is assumed to increase by 3-4 percent per year. Further, this scenario assumes “normal” labor mobility between the Palestinian territories and Israel, with the number of Palestinians working in Israel gradually increasing to pre-second Intifada levels (around 25 percent of the West Bank workforce and 16 percent of the Gaza workforce).35 This would reduce growth in the domestic labor supply by about 1 percentage point per year while increasing the growth in remittances by 8-9 percentage points in the West Bank (19-20 percentage points in Gaza) per year based on current levels. The simulations suggest the following outcomes:
West Bank GazaReal GDP growth would remain broadly unchanged as the positive impact of improved trade conditions is offset by the negative impact of a lower labor supply. Higher consumption growth financed from remittances offsets weaker investment due to lower government and external savings (real investment still increases but the ratio to output declines due to rapid nominal GDP growth). The slower labor force growth due to an increasing number of Palestinians working in Israel would reduce unemployment further to just over 12% by 2025, while further boosting wage growth (and inflation).
Removing the blockade and easing trade conditions brings about a large positive impact estimated at 37% (cumulative over the period) which translates into an annual real GDP growth rate of 6% during 2020-25, driven by higher capacity utilization and exports which (in addition to a significant increase in private transfers mainly from workers in Israel) would lead to a reduction in the CAD. Also, domestic employment increases which together with the slower labor force growth reduces unemployment to around 34% by 2025 while wages increase by more than 50%.
34 The Paris Protocol established a quasi-customs union between Israel and the West Bank and Gaza whereby the two parties apply the same import policy on trade with third countries and maintain free trade in all goods between them. An exception to this general rule applies to goods on the A1 and A2 lists for which the PA can define an independent import policy (including the rate of import taxes, standards, licensing and other regulations) and to the goods on list B for which the PA can define the rate of import taxes.
35 The number of Palestinians working in Israel peaked in mid-late 1980s at around 40 percent of the Palestinian labor force, before declining sharply in the early 1990s. Prior to the second Intifada, there had been some recovery with an average of around 25 percent of the West Bank workforce and 16 percent of the Gaza workforce employed in Israel during 1998-2000. Since then, the West Bank share has declined to around 10-15 percent while that of Gaza has been very close to zero.

24
West Bank Gaza2016 2020 2025 2016 2020 2025
Real GDP growth (%) 2.9 5.3 3.5 7.6 6.7 5.0
Cumulative (2016-2025) 1.5 36.9
Cumulative (in factor prices) -5.2 28.6
Investment -3.3 -1.2
K-FP 0.4 21.7
Labor -2.0 6.2
L-FP -0.3 1.8
GDP per capita ($) 3944 4567 4893 1991 2369 2656
Investment (% GDP) 25.6 20.8 16.3 13.4 13.3 9.1
Private savings (% GDP) 9.4 10.1 9.5 2.4 5.2 5.8
Fiscal operational balance (% GDP)
1.4 -0.7 -3.2 -3.3 -1.8 -3.7
Current account balance (% GDP)
-14.8 -11.4 -10.0 -14.3 -9.9 -7.0
Employment (1000) 690 758 820 250 295 354
Unemployment rate (%) 18.5 14.4 12.3 44.8 39.7 34.4
Wage rate (2014=100) 1.0 1.8 2.8 1.0 1.1 1.5
Labor force (1000) 846 885 936 454 490 540
Scenario 3: Reduced fiscal leakages
34. In this scenario, issues related to fiscal leakages under the revenue sharing arrangement instituted by the Paris Protocol between the PA and the GoI are resolved. These leakages include deductions by the GoI from Palestinian workers in Israel, notably health and national insurance contributions, in addition to fees and trade taxes collected by Israel on behalf of the PA.36 This would increase official external transfer receipts and also yield a one-off increase in nontax revenues as well as what corresponds to effective import tariff rates and other indirect tax rates. Previous studies suggest that official transfers would increase by 1-1½ percent per year, while effective import tariff rates and other indirect tax rates would have a one-off increase of around 5 percentage points. The simulations suggest the following outcomes:
West Bank GazaThe additional impact on real GDP growth and unemployment would be marginal as investment remains broadly unchanged compared to the previous scenario with higher government savings offset by lower private savings.
As in the West Bank, this scenario has a marginal impact on growth (from 5.0% in 2025 in the previous scenario to 5.2%) and unemployment because the increase in government savings is small and investment levels remain compressed.
36 For more information on the nature and amount of fiscal leakages, please see the World Bank report to the April 2016 AHLC meeting: http://documents.worldbank.org/curated/en/780371468179658043/pdf/104808-WP-v1-2nd-revision-PUBLIC-AHLC-report-April-19-2016.pdf
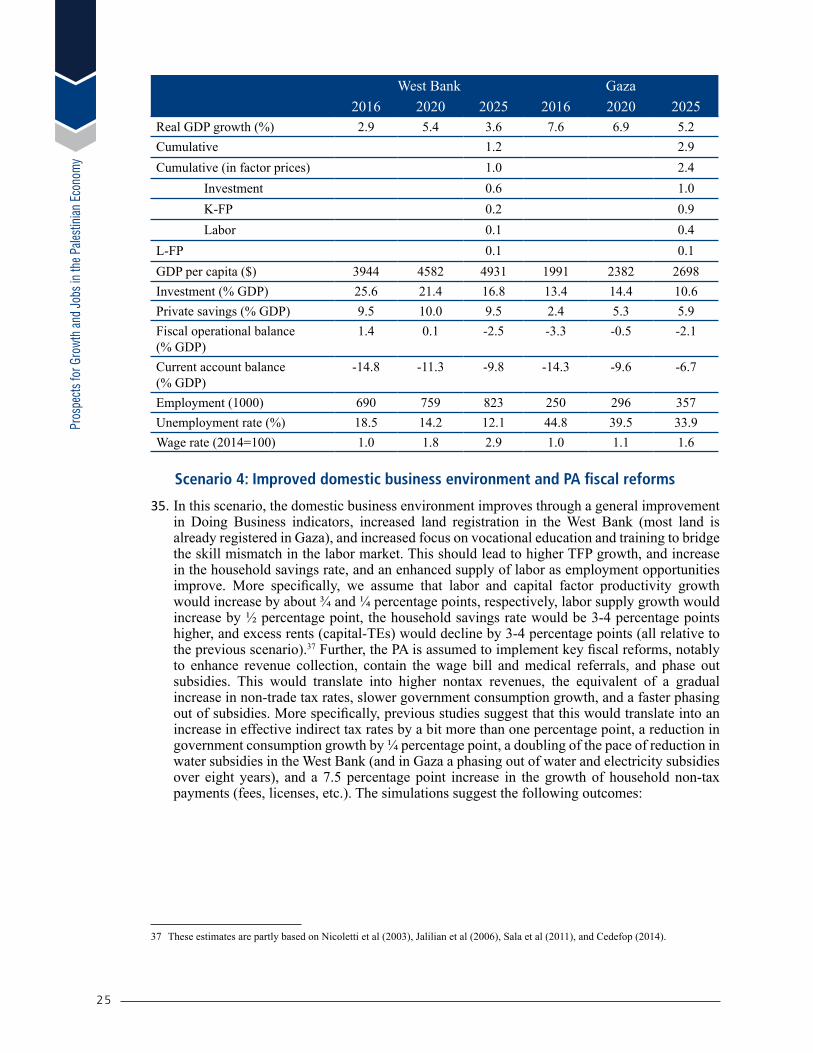
Pros
pect
s for
Gro
wth
and
Jobs
in th
e Pale
stin
ian E
cono
my
25
West Bank Gaza2016 2020 2025 2016 2020 2025
Real GDP growth (%) 2.9 5.4 3.6 7.6 6.9 5.2Cumulative 1.2 2.9Cumulative (in factor prices) 1.0 2.4 Investment 0.6 1.0 K-FP 0.2 0.9 Labor 0.1 0.4L-FP 0.1 0.1GDP per capita ($) 3944 4582 4931 1991 2382 2698Investment (% GDP) 25.6 21.4 16.8 13.4 14.4 10.6Private savings (% GDP) 9.5 10.0 9.5 2.4 5.3 5.9Fiscal operational balance(% GDP)
1.4 0.1 -2.5 -3.3 -0.5 -2.1
Current account balance(% GDP)
-14.8 -11.3 -9.8 -14.3 -9.6 -6.7
Employment (1000) 690 759 823 250 296 357Unemployment rate (%) 18.5 14.2 12.1 44.8 39.5 33.9Wage rate (2014=100) 1.0 1.8 2.9 1.0 1.1 1.6
Scenario 4: Improved domestic business environment and PA fiscal reforms
35. In this scenario, the domestic business environment improves through a general improvement in Doing Business indicators, increased land registration in the West Bank (most land is already registered in Gaza), and increased focus on vocational education and training to bridge the skill mismatch in the labor market. This should lead to higher TFP growth, and increase in the household savings rate, and an enhanced supply of labor as employment opportunities improve. More specifically, we assume that labor and capital factor productivity growth would increase by about ¾ and ¼ percentage points, respectively, labor supply growth would increase by ½ percentage point, the household savings rate would be 3-4 percentage points higher, and excess rents (capital-TEs) would decline by 3-4 percentage points (all relative to the previous scenario).37 Further, the PA is assumed to implement key fiscal reforms, notably to enhance revenue collection, contain the wage bill and medical referrals, and phase out subsidies. This would translate into higher nontax revenues, the equivalent of a gradual increase in non-trade tax rates, slower government consumption growth, and a faster phasing out of subsidies. More specifically, previous studies suggest that this would translate into an increase in effective indirect tax rates by a bit more than one percentage point, a reduction in government consumption growth by ¼ percentage point, a doubling of the pace of reduction in water subsidies in the West Bank (and in Gaza a phasing out of water and electricity subsidies over eight years), and a 7.5 percentage point increase in the growth of household non-tax payments (fees, licenses, etc.). The simulations suggest the following outcomes:
37 These estimates are partly based on Nicoletti et al (2003), Jalilian et al (2006), Sala et al (2011), and Cedefop (2014).
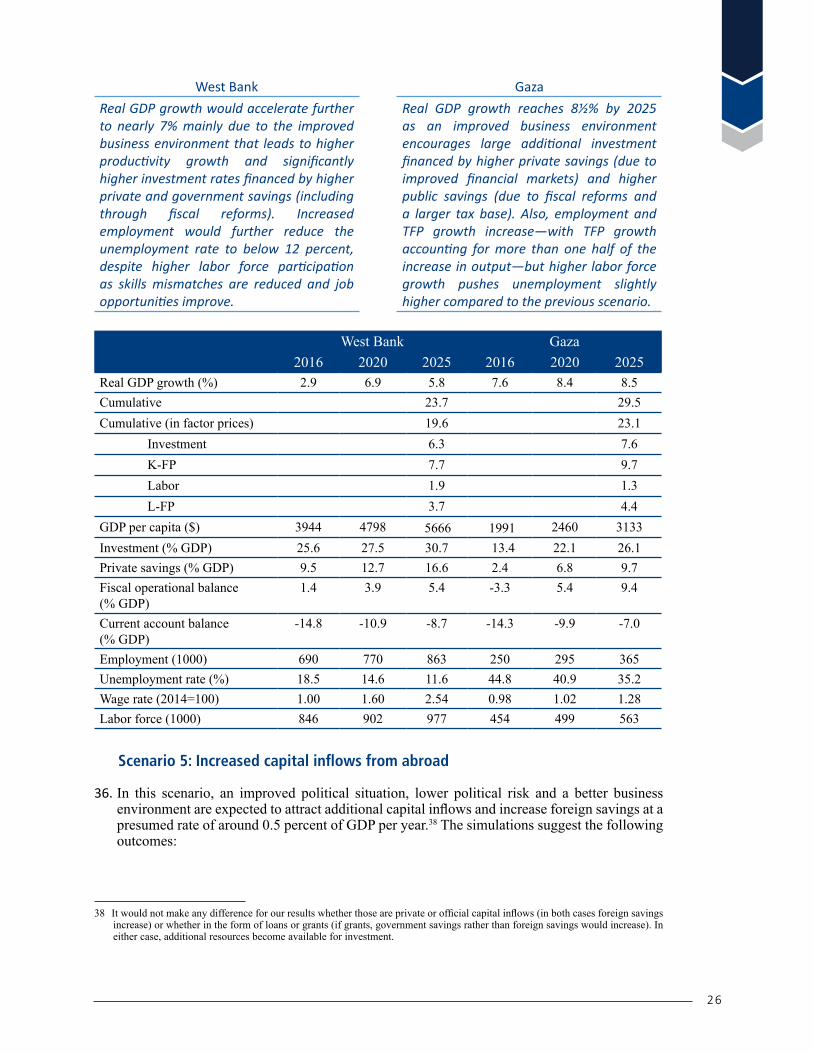
26
West Bank GazaReal GDP growth would accelerate further to nearly 7% mainly due to the improved business environment that leads to higher productivity growth and significantly higher investment rates financed by higher private and government savings (including through fiscal reforms). Increased employment would further reduce the unemployment rate to below 12 percent, despite higher labor force participation as skills mismatches are reduced and job opportunities improve.
Real GDP growth reaches 8½% by 2025 as an improved business environment encourages large additional investment financed by higher private savings (due to improved financial markets) and higher public savings (due to fiscal reforms and a larger tax base). Also, employment and TFP growth increase—with TFP growth accounting for more than one half of the increase in output—but higher labor force growth pushes unemployment slightly higher compared to the previous scenario.
West Bank Gaza2016 2020 2025 2016 2020 2025
Real GDP growth (%) 2.9 6.9 5.8 7.6 8.4 8.5Cumulative 23.7 29.5Cumulative (in factor prices) 19.6 23.1 Investment 6.3 7.6 K-FP 7.7 9.7 Labor 1.9 1.3 L-FP 3.7 4.4GDP per capita ($) 3944 4798 5666 1991 2460 3133Investment (% GDP) 25.6 27.5 30.7 13.4 22.1 26.1Private savings (% GDP) 9.5 12.7 16.6 2.4 6.8 9.7Fiscal operational balance(% GDP)
1.4 3.9 5.4 -3.3 5.4 9.4
Current account balance(% GDP)
-14.8 -10.9 -8.7 -14.3 -9.9 -7.0
Employment (1000) 690 770 863 250 295 365Unemployment rate (%) 18.5 14.6 11.6 44.8 40.9 35.2Wage rate (2014=100) 1.00 1.60 2.54 0.98 1.02 1.28Labor force (1000) 846 902 977 454 499 563
Scenario 5: Increased capital inflows from abroad
36. In this scenario, an improved political situation, lower political risk and a better business environment are expected to attract additional capital inflows and increase foreign savings at a presumed rate of around 0.5 percent of GDP per year.38 The simulations suggest the following outcomes:
38 It would not make any difference for our results whether those are private or official capital inflows (in both cases foreign savings increase) or whether in the form of loans or grants (if grants, government savings rather than foreign savings would increase). In either case, additional resources become available for investment.
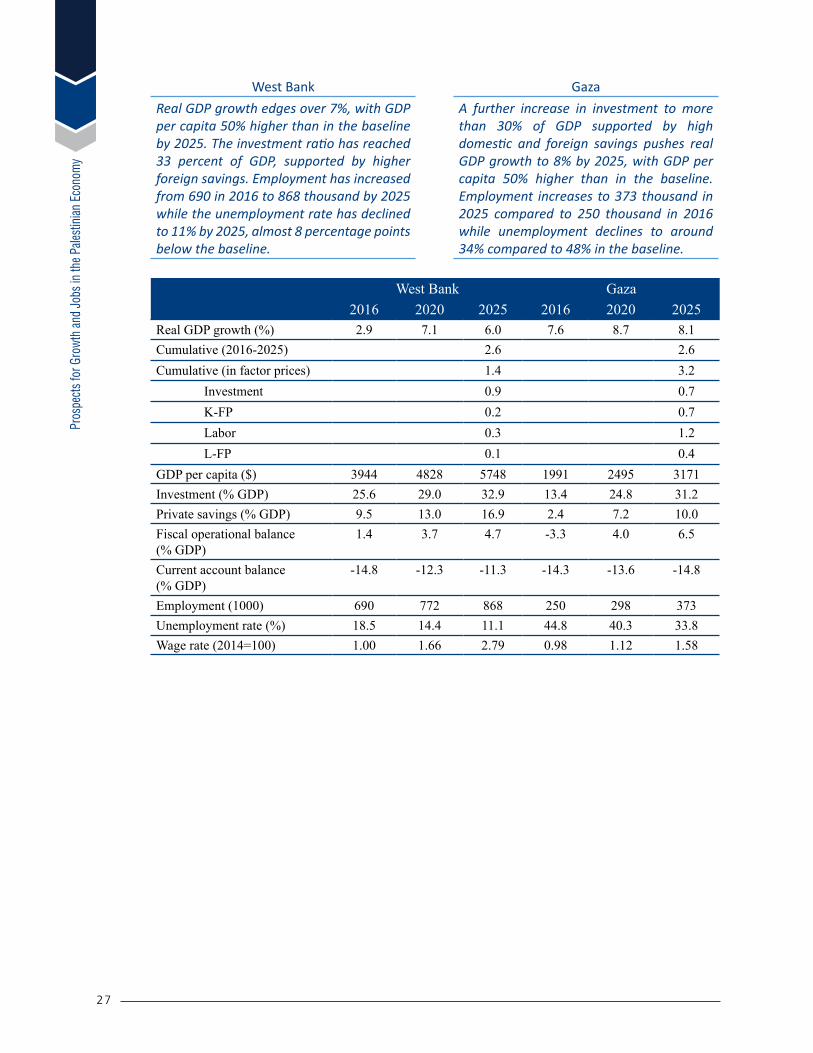
Pros
pect
s for
Gro
wth
and
Jobs
in th
e Pale
stin
ian E
cono
my
27
West Bank GazaReal GDP growth edges over 7%, with GDP per capita 50% higher than in the baseline by 2025. The investment ratio has reached 33 percent of GDP, supported by higher foreign savings. Employment has increased from 690 in 2016 to 868 thousand by 2025 while the unemployment rate has declined to 11% by 2025, almost 8 percentage points below the baseline.
A further increase in investment to more than 30% of GDP supported by high domestic and foreign savings pushes real GDP growth to 8% by 2025, with GDP per capita 50% higher than in the baseline. Employment increases to 373 thousand in 2025 compared to 250 thousand in 2016 while unemployment declines to around 34% compared to 48% in the baseline.
West Bank Gaza2016 2020 2025 2016 2020 2025
Real GDP growth (%) 2.9 7.1 6.0 7.6 8.7 8.1Cumulative (2016-2025) 2.6 2.6Cumulative (in factor prices) 1.4 3.2 Investment 0.9 0.7 K-FP 0.2 0.7 Labor 0.3 1.2 L-FP 0.1 0.4GDP per capita ($) 3944 4828 5748 1991 2495 3171Investment (% GDP) 25.6 29.0 32.9 13.4 24.8 31.2Private savings (% GDP) 9.5 13.0 16.9 2.4 7.2 10.0Fiscal operational balance(% GDP)
1.4 3.7 4.7 -3.3 4.0 6.5
Current account balance(% GDP)
-14.8 -12.3 -11.3 -14.3 -13.6 -14.8
Employment (1000) 690 772 868 250 298 373Unemployment rate (%) 18.5 14.4 11.1 44.8 40.3 33.8Wage rate (2014=100) 1.00 1.66 2.79 0.98 1.12 1.58

28
7. Practical Implications of the Model 37. Our analysis suggests a number of considerations that could help guide a new vision for
growth and job creation in Palestine, a vision that could only be formulated in a meaningful way with the support of all key stakeholders.
1. Improved access for Palestinians in the West Bank to Area C and an easing of the blockade on Gaza would be the most important actions to ease the external constraints. For the West Bank, this would allow for better access to critical scarce resources, notably land and water but also other natural resources to take advantage of its comparative advantages in agriculture, mining and quarrying, and tourism. Our analysis shows that access to Area C could bring about additional cumulative growth for the West bank economy equal to 33 percent by 2025. As for Gaza, lifting the blockade would open it up for critical trade needed to rebuild its infrastructure and economy, and could lead to additional cumulative growth of 32 percent by 2025.
2. Reducing the punitive and in-transparent Israeli non-tariff barriers to Palestinian trade would be critical to allow the West Bank and Gaza to import needed inputs for production and expand the market for its goods and services. The unduly restrictive dual use list is particularly important in this regard as our analysis shows that relaxing the list would bring about additional cumulative growth of 6 percent to the West Bank economy by 2025, with a bigger impact of 11 percent in Gaza. It is also important to improve the costly procedures for shipping goods across the border and through Israeli ports (including customs clearance and storage fees, back-to-back truck procedures, and cumbersome inspections) as our analysis suggests that those have hampered economic growth in the Palestinian territories.
3. Allowing for increased mobility of labor from Palestine to Israel could help enhance the quality of human capital while increasing private and public incomes through remittances and taxes. However, this would need to go hand in hand with enhancing labor force participation in Palestine and strengthening domestic institutions (including in education and health) in order to avoid Dutch disease and an excessive exodus of Palestinian workers from the West Bank and Gaza. In fact, our work shows that without these internal reforms, allowing additional Palestinian workers in Israel could negatively impact economic growth in the West Bank and in Gaza as the Palestinian labor supply is reduced.
4. For Palestine itself, the utmost priority is political reconciliation between the West Bank and Gaza, conducting long overdue presidential elections, electing an inclusive and representative Parliament, and establishing the division of powers between the legislative, judicial, and executive branches needed for a functioning democracy.
5. This is critical for strengthening governance and institutions. Palestine has much to be gained from improving its own business environment, including enhancing the rule of law and anti-corruption efforts, streamlining regulations, leveling the playing field and strengthening competition along with removing price distortions (notably in energy and water), securing property rights (notably land), matching skills between education and the labor market and rationalizing employment in the public sector, making tax collection more effective and efficient, and providing for adequate infrastructure (notably electricity). Our analysis shows that such reforms by the PA could generate additional cumulative growth in the range of 24 percent in the West bank by 2025, and even higher at 30 percent in Gaza due to a lower base effect.
Pros
pect
s for
Gro
wth
and
Jobs
in th
e Pale
stin
ian E
cono
my
29
6. While progress on these fronts should encourage additional foreign direct investment and private capital inflows, international donors will also have a key role to play through reversing the major decline in aid in recent years, at least over the medium term while Palestine makes progress on increasing its own fiscal space and improving the environment for private savings. Enhancing public financial management and investment planning while ensuring proper coordination and integration into the budget of donor-funded activities should be a sine-qua-non in this regard.
7. If progress along these lines were to be made over the medium term, Palestine could achieve much higher rates of growth—perhaps around 6 percent in the West Bank and 8 percent in Gaza by 2025—and creation of new jobs over and above the rapid population growth. This would allow it to reduce the very high rates of unemployment while absorbing additional participants in the labor market, not least women. At the same time, it would dramatically reduce its dependence on foreign aid. Sustaining such progress in the longer run would require continued steps to enhance access to productive resources, trade-liberalization and integration, labor mobility within the Palestinian territories and between Palestine and Israel, and domestic governance and institutions that affect the business environment. A longer-term vision would of course also have to consider the future of a Palestinian state and options for the economic policy regime (including trade and exchange rate) under a two-state solution.

30
References
Ahern, M. (2011). “West Bank and Gaza: Governance and Anti-Corruption.” World Bank.
Amodio, F, L. Baccini, and M. Di Maio (2016), “Security, Trade, and Political Violence.”
Applied Research Institute Jerusalem (2015). “The Economic Cost of the Israeli Occupation of the Palestinian Territories.”
Bebczuk, R., Gasparini, L., Amendolaggine, J., and Garbero, N. (2015), ‘Understanding the Determinants of Household Saving: Micro Evidence for Latin America, Inter-american Development Bank, IDB-TN-843
Blankespoor, B. and R. van der Weide (2016ff). “Measuring the Restrictions to Mobility in the West Bank.” World Bank.
Capros, Pantelis, Kostas Fragiadakis, Nikos Kouvaritakis, and Leonidas Paroussos (2010). “A Multi Country Econometric Estimation of the Constant Elasticity of Substitution.” WIOD project funded by the European Commission, DG Research.
Carroll, C.D., and Kimball, M.S., (2005), “Liquidity Constraints and Precautionary Saving”, JEL
Deaton, Angus S. and Paxson, Christina H. (1997), “The Effects of Economic and Population Growth on National Saving and Inequality.” Demography, February 1997, 34(1), pp. 97–114.
Denizer, C., Wolf, H, and Ying, Y., (2000), ‘Household Savings in Transition Economies,’ World Bank Policy Research Working Paper.
Economic Research Institute of Northern Ireland (2006). “Decomposition of Regional GVA per Capita Gap by U.K. Region.” ERINI Monograph 7 (January).
Etges, H. and A Zimring (2015). “When trade Stops: Lessons from the Gaza Blockade 2007-10.” Journal of International Economics 95.
European Centre for the Development of Vocational Training CEDEFOP (2014). “Macroeconomic Benefits of Vocational Education and Training.” Research Paper No. 40.
Ianchovichia, E. and M. Ivanic. (2016). “Economic Effects of the Syrian War and the Spread of the Islamic State on the Levant.” The World Economy (2016).
Ianchovichina, E., S. Devarajan, and C. Lakatos. (2016). “Lifting Economic Sanctions on Iran: Global Effects and Strategic Responses.” World Bank WPS7549 (February).
IMF (2016). “West Bank and Gaza: Report to the Ad Hoc Liaison Committee” (August).
__________. (2016), Turkey, Selected Issues, IMF Country Report No. 16/105
International Trade Center (2015). “State of Palestine: Company Perspectives—an ITF Series on Non-Tariff Barriers.”
Jalilian, H., C. Kirkpatrick, and D. Parker (2006). “The Impact of Regulation on Economic Growth in Developing Countries: A Cross-Country Analysis.” XXX
Kraay, A. (2000), ‘Household Saving in China’, World Bank Economic Review, VOL. 14, NO. 3: 545-70
Pros
pect
s for
Gro
wth
and
Jobs
in th
e Pale
stin
ian E
cono
my
31
Loayza, Norman; Schmidt-Hebbel, Klaus; Serven, Luis. 2000. What Drives Private Saving around the World? Policy Research Working Paper; No. 2309. World Bank, Washington, DC.
Middle East Partnership Initiative (MEPI), Peres Center for Peace, and Core Associates (2015). “Strengthening the Palestinian Private Sector through Reducing Trade Transaction Costs: A Comprehensive Research and Advocacy Program.” (December).
Nicoletti, G. and S. Scarpetta (2003). “Regulation, Productivity, and Growth: OECD Evidence.” World Bank Policy Research Working Paper 2944 (January).Ozcan, K., and
Ozcan, Y. (2015),’Determinants of Private Savings in the Middle East and North Africa’ http://dx.doi.org/10.1016/S1094-5334(05)06005-X
Palestinian Ministry of National Economy and Applied Research Institute Jerusalem (2011). “The Economic Cost of the Israeli Occupation for the Occupied Palestinian Territory.” Bulletin (September).
PalTrade (2015). “Palestine: Non-Tariff Measures—Company Perspectives.”
Pirgan Matur, Eser, Ali Sabuncu, and Sema Bahceci, (2012), “Determinants of Private Savings and Interaction Between Public and Private Savings in Turkey,” Topics in Middle Eastern and African Economies, vol. 14.
Saerbeck, R. (1988). “Estimating Accounting Price Ratios with a Semi Input-Output Table: Botswana. In Project Appraisal Volume 3 (December).
Sala, H. and J.I. Silva (2011). “Labor Productivity and Vocational Training: Evidence from Europe.” IZA DP No. 6171 (November).
Sawani, M. and Patterson, S., (2010), “Informal Saving Practices in Developing Countries”, Journal of International Business and Cultural Studies
State of Palestine (2016). “2017-22 National Policy Agenda—Putting Citizens First.” (December)
UNCTAD (2015). “The 2013 WTO Agreement on Trade Facilitation: Israel’s Obligations towards Palestinian Trade.”
World Bank. (2017). “Unlocking The Trade Potential of The Palestinian Economy.”
World Bank. (2016f). “Reforming the Palestine Trade Regime: A Long-Term Vision and Reform Pathway to Improve Economic Outcomes in West Bank and Gaza.”
World Bank. (2016). “West Bank and Gaza: Palestinian Territories Public Expenditure Review 2013-14.” (June).
__________. (2016). “Economic Monitoring Report to the Ad Hoc Liaison Committee” (April)
__________. (2015). “Economic Monitoring Report to the Ad Hoc Liaison Committee” (May).
__________. (2014A). “Area C and the Future of the Palestinian Economy.”
__________. (2014B). “West Bank and Gaza: Investment Climate Assessment. Fragmentation and Uncertainty.”
__________. (2014), ‘Turkey in Transition: Time for a Fiscal Policy Pivot?’, Public Finance Review. World Bank: Washington, D.C.
__________. (2013). “The Labor Market Impact of Mobility Restrictions—Evidence from the West Bank.” Policy Research Working Paper 6457 (May).
32
__________. (2012). “West Bank and Gaza: Towards Economic Sustainability of a Future Palestinian State—Promoting Private Sector-Led Growth.” (April).
__________. (2011). “West Bank and Gaza: Coping with Conflict? Poverty and Inclusion in the West Bank and Gaza.” (Report No. 61293-GZ, July).
__________. (2008). “West Bank and Gaza: The Economic Effects of Restricted Access to Land in the West Bank,” Social and Economic Development Group, Finance and Private Sector Development, MENA region.
__________. (1979). “Estimating Shadow Prices for Colombia in an Input-Output Table Framework,” Working Paper No. 357 (September).
Weiss, John. (2012). “Approaches to Estimating National Economic Parameters: Jamaica, Nepal, and Ethiopia.” In Project Appraisal, Vol. 2, No. 1, Beech Tree Publishing (March 1987).

33
Annex I BenchmarkingJordan
In the MENA region, the most relevant comparator to benchmark Palestine’s economic performance is Jordan. This is mainly because both countries are quite similar in terms of their basic resource base and are part of similar favorable trade agreements with other trading partners.
Between 1994 (earliest available data for Palestine) and 1999, the Palestinian GDP per capita was very close to that of Jordan growing at almost the same rate. However, since the year 2000, after the second Intifada broke, the gap between both economies’ income levels has significantly widened and the Palestinian economy has not been able to catch up. Data show that the Jordanian GDP per capita is currently 72 percent higher than that of Palestine. One must ask whether the second Intifada and the political constraints that have followed are the main reasons behind Palestine’s lagging performance, or has the Jordanian economy benefited from superior policies and institutions that have enabled it to perform better over the last two decades?
Figure A1.1: GDP Per Capita, Current USD
Source: World Bank data and PCBS.
Data show that progress in institution building in Jordan over the last two decades has not always outpaced achievements in Palestine. According to the World Bank’s worldwide governance indicators related to accountability, Jordan’s rank has significantly declined over the years while Palestine has successfully increased its rating and both countries currently rank similarly. When it comes to government effectiveness, even though Jordan’s public institutions currently rank higher than Palestine’s in the 60th percentile, it has not achieved any progress in improving its rating over the last twenty years, while Palestine has managed to increase its rank from the 11th to the 36th percentile during the same period. In regards to the rule of law, Palestine and Jordan came in quite similar ranks in 1996. Palestine’s rank, however, has made a significant drop in 2007 following the internal divide which has resulted in an inactive legislative council. In other areas such as controlling corruption, Palestine has conducted successful efforts to increase its rank over the years, but it still lags significantly behind Jordan.

34
There is ample space in both countries to make fiscal policy more growth friendly. In both countries, current spending occupies the majority of public expenditure, and a substantial part of which is consumed by the wage bill whose share in GDP in Palestine and Jordan is amongst the highest in the world (see Figure A1.2). As a result, capital spending in both countries has been low at around 4-5 percent of GDP, leaving little budget for growth friendly investments by the government.
Figure A1.2: General government wage bill/GDP, select countries
Source: World Bank staff calculations based on IMF Government Finance Statistics data for 2000-2008. Note: The Palestine estimate is for 2015. Estimates for other countries are averages of yearly estimates during the period 2000-2008.

Pros
pect
s for
Gro
wth
and
Jobs
in th
e Pale
stin
ian E
cono
my
35
Considering the components of public spending in Jordan and Palestine reveals further similarities in the fiscal policy applied by both countries. For instance, spending on the security sector is by far the largest compared to other functions, reaching around 7 percent of GDP in both countries. Resources dedicated to more productive areas including health, education and the social sector have been much lower over the years. For example, in Jordan, the 2013 spending on the health, education and the social sector combined barely reached the amount dedicated for public spending on security. Given these similar fiscal trends, it is not surprising that Palestine and Jordan both have similar human development outcomes, as illustrated by the below figure.
Figure A1.3: Components of public spending: Palestine, 2016
Figure A1.4: Components of public spending: Jordan, 2013
Source: PA MoF and Jordan Economic Monitor fall 2016
Figure A1.5: Selected health and education indicators
Source: World Bank data and PA MoH.
36
The business environment in Jordan does fare slightly better than in Palestine. According to the IFC Doing Business report for 2017, Jordan ranked at 118 while Palestine came in at number 140 out of 189 countries. Jordan achieved better results regarding procedures to register a business, dealing with construction permits and getting electricity. Another key area where Palestine’ s doing business rank lags behind Jordan is related to trading across borders due to higher costs and longer times involved in exporting and importing. Unlike procedures for starting a business, facilitating trade across borders is outside the Palestinian Authority’s control and requires action by the GoI to ease trade restrictions in the West Bank and the blockade on Gaza. It is worth noting, though, that there are some areas of the business environment that are considered better in Palestine including access to credit, protecting minority investors and enforcing contracts.
Private investment, which is essential for maintaining competitiveness, has been low in both Palestine and Jordan. Private investment in Jordan has averaged around 18 percent of GDP over the last decade compared to 15 percent in Palestine. This is surprising given that private domestic savings in Jordan are much higher than in Palestine. While a sectoral breakdown of private investment data is not easily obtainable, it is apparent that much of it is destined to less productive activities in both Palestine and Jordan, particularly in the non-tradable sectors. Interestingly, Foreign Direct Investment (FDI) inflows to Jordan have been higher averaging 8 percent of GDP compared to less than 2 percent in Palestine since the year 2000. This cannot be explained by differences in investment regulation as both countries offer generous tax exemptions to investors and do not impose controls on the limit of foreign ownership. Higher FDI inflows to Jordan can probably be attributed to lower average wages compared to Palestine, particularly for low skilled workers. Furthermore, in recent years, Jordan’s FDI inflows have witnessed a jump as it is considered more stable relative to its regional neighbors including Egypt, Lebanon and Syria – Jordan’s traditional FDI competitors. There has also been a significant increase in FDI inflows to Jordan by Syrians following the civil war. Another important reason explaining higher FDI inflows to Jordan is the high political risk in Palestine which foreign investors see as key for shying away from the Palestinian market.
In line with higher FDI, labor productivity in Jordan is higher than in Palestine, but technical efficiency is surprisingly more advanced amongst Palestinian firms. Labor productivity measured by value added per worker stands at around USD10 thousand in Palestine compared to more than USD15 thousand in Jordan. Lower labor productivity in Palestine seems to be the result of relatively low capital investments as data confirm that firms in Palestine are less capital intensive.39 Interestingly, though, Total Factor Productivity (TFP) or technical efficiency is 44 percent lower amongst Jordanian firms compared to Palestinian firms. In fact, Palestinian firms are more technically efficient than firms in most regional comparators including Egypt, Yemen, Tunis and Iraq. While low capital intensity may be attributed to the uncertainty in the investment climate, the relatively high technical efficiency is more challenging to interpret. It may be the result of the quality of management, workforce, and transfer of know-how and practices from Israel, or from Palestinians gaining experience from abroad.40
Drivers of growth in both economies have been very similar, but with a bigger role for the productive sectors in Jordan. On the supply side, services have been the main driver of growth in both Palestine and Jordan over the last two decades. In Jordan, manufacturing and agriculture have also contributed to growth while the size of these sectors has been shrinking in Palestine due to the restrictions. Drivers of growth on the demand side have also been similar in Palestine and
39 Using the book value of machinery as an indicator, capital per worker in Palestine is USD2500 compared to close to USD7000 in Jordan.
40 World Bank Investment Climate Assessment (ICA), 2014.
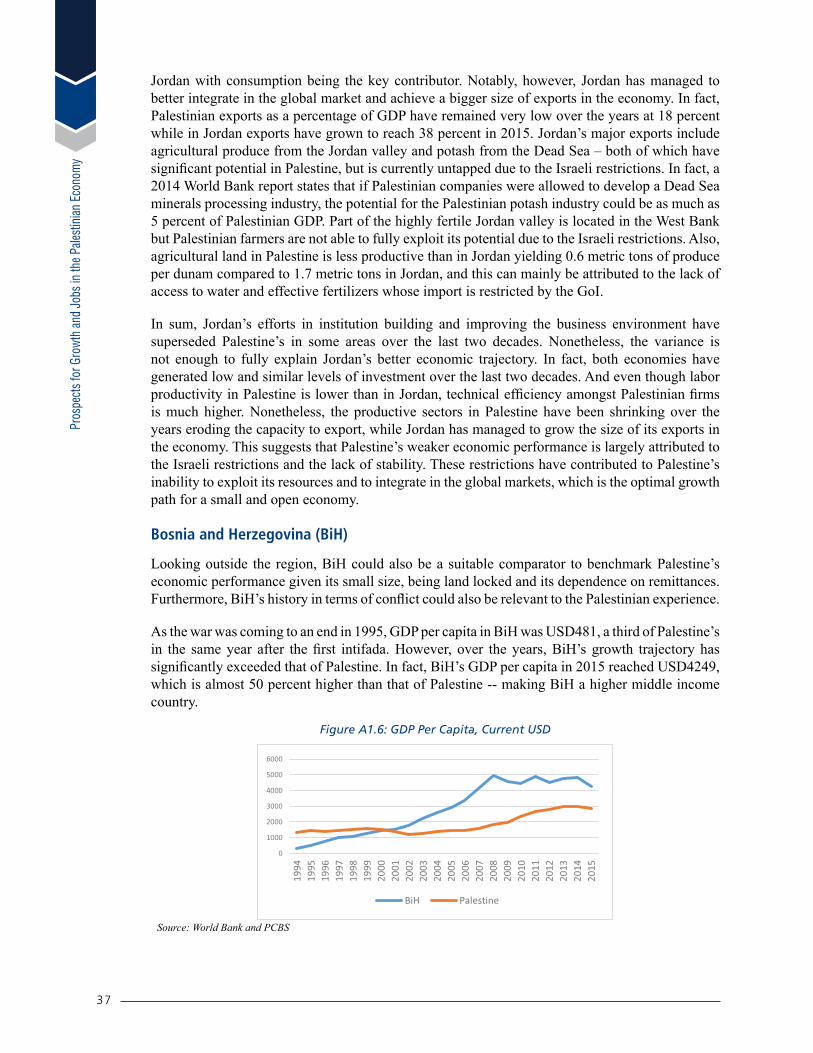
Pros
pect
s for
Gro
wth
and
Jobs
in th
e Pale
stin
ian E
cono
my
37
Jordan with consumption being the key contributor. Notably, however, Jordan has managed to better integrate in the global market and achieve a bigger size of exports in the economy. In fact, Palestinian exports as a percentage of GDP have remained very low over the years at 18 percent while in Jordan exports have grown to reach 38 percent in 2015. Jordan’s major exports include agricultural produce from the Jordan valley and potash from the Dead Sea – both of which have significant potential in Palestine, but is currently untapped due to the Israeli restrictions. In fact, a 2014 World Bank report states that if Palestinian companies were allowed to develop a Dead Sea minerals processing industry, the potential for the Palestinian potash industry could be as much as 5 percent of Palestinian GDP. Part of the highly fertile Jordan valley is located in the West Bank but Palestinian farmers are not able to fully exploit its potential due to the Israeli restrictions. Also, agricultural land in Palestine is less productive than in Jordan yielding 0.6 metric tons of produce per dunam compared to 1.7 metric tons in Jordan, and this can mainly be attributed to the lack of access to water and effective fertilizers whose import is restricted by the GoI.
In sum, Jordan’s efforts in institution building and improving the business environment have superseded Palestine’s in some areas over the last two decades. Nonetheless, the variance is not enough to fully explain Jordan’s better economic trajectory. In fact, both economies have generated low and similar levels of investment over the last two decades. And even though labor productivity in Palestine is lower than in Jordan, technical efficiency amongst Palestinian firms is much higher. Nonetheless, the productive sectors in Palestine have been shrinking over the years eroding the capacity to export, while Jordan has managed to grow the size of its exports in the economy. This suggests that Palestine’s weaker economic performance is largely attributed to the Israeli restrictions and the lack of stability. These restrictions have contributed to Palestine’s inability to exploit its resources and to integrate in the global markets, which is the optimal growth path for a small and open economy.
Bosnia and Herzegovina (BiH)
Looking outside the region, BiH could also be a suitable comparator to benchmark Palestine’s economic performance given its small size, being land locked and its dependence on remittances. Furthermore, BiH’s history in terms of conflict could also be relevant to the Palestinian experience.
As the war was coming to an end in 1995, GDP per capita in BiH was USD481, a third of Palestine’s in the same year after the first intifada. However, over the years, BiH’s growth trajectory has significantly exceeded that of Palestine. In fact, BiH’s GDP per capita in 2015 reached USD4249, which is almost 50 percent higher than that of Palestine -- making BiH a higher middle income country.
Figure A1.6: GDP Per Capita, Current USD
Source: World Bank and PCBS

38
Coming out of conflict in 1994-1995, both countries have made institution building a priority, but data show that BiH has generally achieved better results over the last two decades. In regards to the rule of law, the World Bank’s worldwide governance indicators show that systems in both countries ranked similarly in 1996. But, BiH’s performance has significantly exceeded that of Palestine over the years, particularly as the latter has been in a stage of legislative paralysis since 2007 after the suspension of the Legislative council following the internal divide. Data also show that BiH has established better systems over the years for controlling corruption. As for government effectiveness, both Palestine and BiH have successfully managed to improve the effectiveness of public institutions over the years as they currently occupy similar ranks in the World Bank’s database, in the 36th and 34th percentiles, respectively.
Even though both countries have achieved good fiscal consolidation over the years, fiscal policy has not played a key role in promoting sustainable growth. In fact, Palestine and BiH both have an oversized public sector with a very high share of spending on the wage bill, particularly since public wages are higher than those paid in the private sector in both countries. This has limited fiscal space available for spending on public investment, which has been very low at around 4 percent of GDP in Palestine and close to 7 percent in BiH. When it comes to public spending on productive areas, particularly health, BiH’s public expenditure relative to the size of the population is almost three times as high as that of Palestine’s. However, outcome indicators show that with much lower per capita spending, Palestine is able to achieve comparator health outcomes and in some areas even better results than BiH (See Figures A1.7 and Figure A1.8).
Figure A1.7: Public health expenditure per capita, current USD
Figure A1.8: Select health indicators
Source: World Bank, MoH, MoF and PCBS
The business environment in BiH and Palestine is considered poor, mainly reflecting high political risks. The complicated political set up and the governing structure in BiH with its multiple layers of regulations results in a fragmented economic space that creates major challenges for private businesses. Hence, BiH still ranks substantially behind its regional peers in the doing business indicators, occupying the 81st rank out of 189 economies. BiH’s rank, however, exceeds Palestine’s which comes in at number 140. But the overall rating hides important details. For instance, when it comes to indicators related to opening a business, dealing with construction permits, getting electricity, and paying taxes, Palestine actually fares better than BiH. One area where Palestine significantly lags behind BiH is related to trading across borders – an area directly impacted by the Israeli restrictions and which the PA is unable to improve under the current political constraints. Also, getting credit in BiH seems to be much easier than in Palestine according to the Doing Business database.
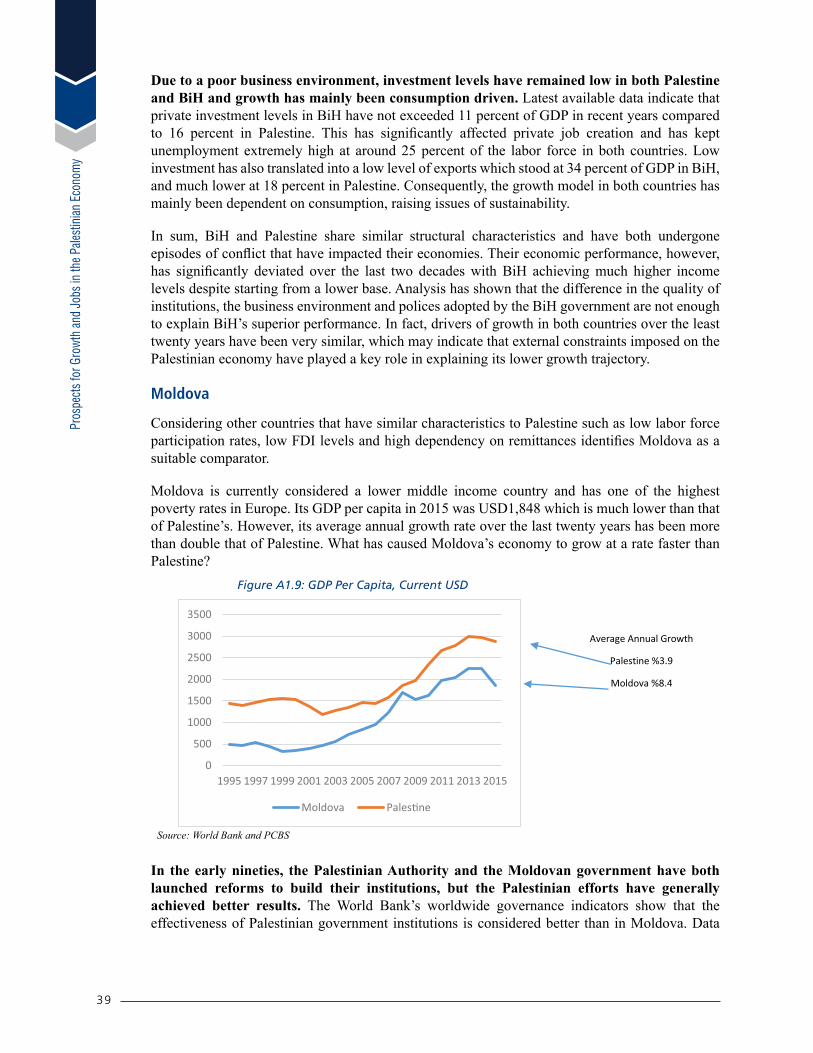
Pros
pect
s for
Gro
wth
and
Jobs
in th
e Pale
stin
ian E
cono
my
39
Due to a poor business environment, investment levels have remained low in both Palestine and BiH and growth has mainly been consumption driven. Latest available data indicate that private investment levels in BiH have not exceeded 11 percent of GDP in recent years compared to 16 percent in Palestine. This has significantly affected private job creation and has kept unemployment extremely high at around 25 percent of the labor force in both countries. Low investment has also translated into a low level of exports which stood at 34 percent of GDP in BiH, and much lower at 18 percent in Palestine. Consequently, the growth model in both countries has mainly been dependent on consumption, raising issues of sustainability.
In sum, BiH and Palestine share similar structural characteristics and have both undergone episodes of conflict that have impacted their economies. Their economic performance, however, has significantly deviated over the last two decades with BiH achieving much higher income levels despite starting from a lower base. Analysis has shown that the difference in the quality of institutions, the business environment and polices adopted by the BiH government are not enough to explain BiH’s superior performance. In fact, drivers of growth in both countries over the least twenty years have been very similar, which may indicate that external constraints imposed on the Palestinian economy have played a key role in explaining its lower growth trajectory.
Moldova
Considering other countries that have similar characteristics to Palestine such as low labor force participation rates, low FDI levels and high dependency on remittances identifies Moldova as a suitable comparator.
Moldova is currently considered a lower middle income country and has one of the highest poverty rates in Europe. Its GDP per capita in 2015 was USD1,848 which is much lower than that of Palestine’s. However, its average annual growth rate over the last twenty years has been more than double that of Palestine. What has caused Moldova’s economy to grow at a rate faster than Palestine? Figure A1.9: GDP Per Capita, Current USD
Source: World Bank and PCBS
In the early nineties, the Palestinian Authority and the Moldovan government have both launched reforms to build their institutions, but the Palestinian efforts have generally achieved better results. The World Bank’s worldwide governance indicators show that the effectiveness of Palestinian government institutions is considered better than in Moldova. Data
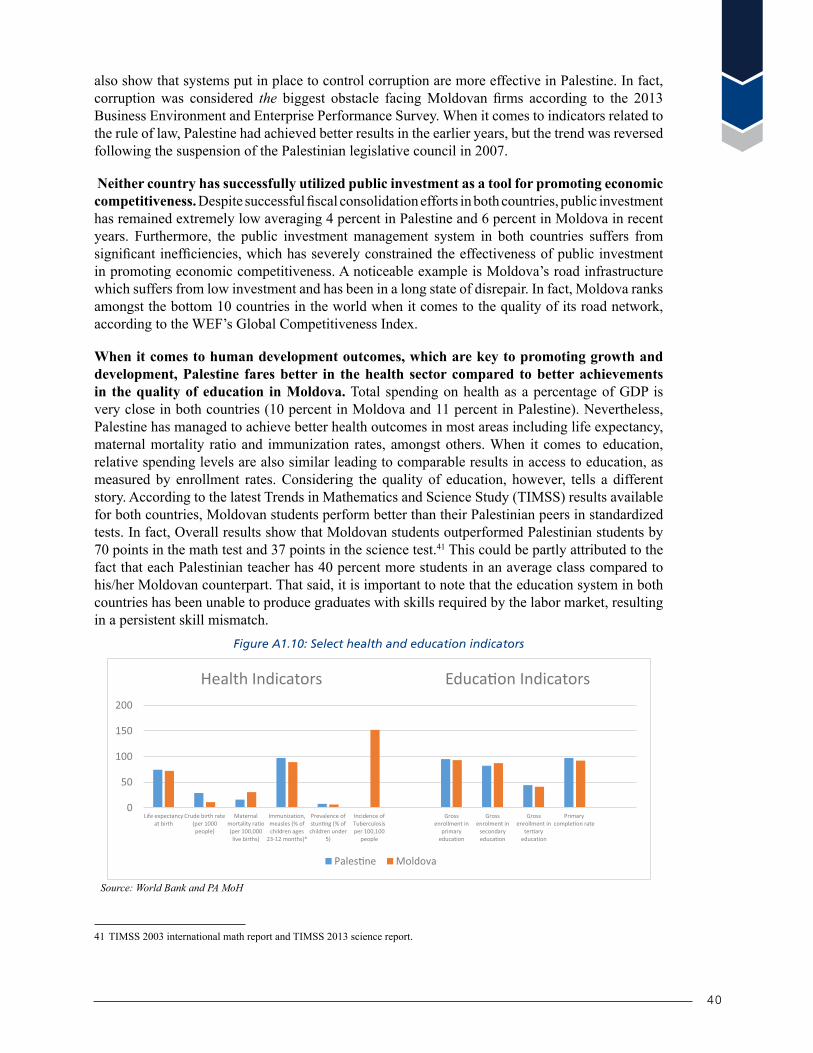
40
also show that systems put in place to control corruption are more effective in Palestine. In fact, corruption was considered the biggest obstacle facing Moldovan firms according to the 2013 Business Environment and Enterprise Performance Survey. When it comes to indicators related to the rule of law, Palestine had achieved better results in the earlier years, but the trend was reversed following the suspension of the Palestinian legislative council in 2007.
Neither country has successfully utilized public investment as a tool for promoting economic competitiveness. Despite successful fiscal consolidation efforts in both countries, public investment has remained extremely low averaging 4 percent in Palestine and 6 percent in Moldova in recent years. Furthermore, the public investment management system in both countries suffers from significant inefficiencies, which has severely constrained the effectiveness of public investment in promoting economic competitiveness. A noticeable example is Moldova’s road infrastructure which suffers from low investment and has been in a long state of disrepair. In fact, Moldova ranks amongst the bottom 10 countries in the world when it comes to the quality of its road network, according to the WEF’s Global Competitiveness Index.
When it comes to human development outcomes, which are key to promoting growth and development, Palestine fares better in the health sector compared to better achievements in the quality of education in Moldova. Total spending on health as a percentage of GDP is very close in both countries (10 percent in Moldova and 11 percent in Palestine). Nevertheless, Palestine has managed to achieve better health outcomes in most areas including life expectancy, maternal mortality ratio and immunization rates, amongst others. When it comes to education, relative spending levels are also similar leading to comparable results in access to education, as measured by enrollment rates. Considering the quality of education, however, tells a different story. According to the latest Trends in Mathematics and Science Study (TIMSS) results available for both countries, Moldovan students perform better than their Palestinian peers in standardized tests. In fact, Overall results show that Moldovan students outperformed Palestinian students by 70 points in the math test and 37 points in the science test.41 This could be partly attributed to the fact that each Palestinian teacher has 40 percent more students in an average class compared to his/her Moldovan counterpart. That said, it is important to note that the education system in both countries has been unable to produce graduates with skills required by the labor market, resulting in a persistent skill mismatch.
Figure A1.10: Select health and education indicators
Source: World Bank and PA MoH
41 TIMSS 2003 international math report and TIMSS 2013 science report.
Pros
pect
s for
Gro
wth
and
Jobs
in th
e Pale
stin
ian E
cono
my
41
The business environment in Moldova ranks better than in Palestine in the IFC’s doing business indicators. In the 2017 Doing Business Report, Moldova occupied the 44th rank out of 189 economies compared to 140 for Palestine. In fact, Moldova fares significantly better when it comes to most aspects of the business environment including starting a business, registering property, getting credit, protecting minority investors, trading across borders and resolving insolvency.
Even though doing business is considered easier in Moldova, weak institutions have significantly weighed on private investment keeping it low and close to its level in Palestine. Large scale fraud in the Moldovan banking sector in addition to corruption and widespread favoritism amongst public institutions42 have kept confidence levels low and negatively impacted private investment. In fact, private investment in Moldova has averaged 17 percent of GDP in recent years, which is very close to that in Palestine where it has been stymied by high political risk and conflict.
Therefore, consumption has been the main driver of growth in both economies, but with a bigger role for exports in Moldova. In Palestine, growth over the last two decades has mainly been driven by consumption financed through large amounts of external aid. In Moldova, high remittances and transfers (mainly pensions) have played a key role in increasing income levels and have also led private consumption to be the main driver of growth. In contrast to Palestine, however, Moldova has been able to achieve a higher share of exports in the economy (43 percent of GDP) mainly consisting of agriculture and agro-processing goods). This rate is more than twice as high than in Palestine where the productive sectors continue to be constrained by the ongoing restrictions.
In sum, even though Moldova’s per capita income level continues to be lower than Palestine’s, it has achieved much faster growth over the last two decades. This variant performance cannot be attributed to the quality of institutions in Moldova as the analysis has shown that Palestinian institutions fare better in most areas. It also cannot be fully explained by education and health outcomes which are generally comparable in both countries. Even though procedures for starting a business are considered simpler in Moldova, this has not translated into higher private investment due to high levels of corruption and favoritism. In fact, private investment in Moldova has remained very low and at a level close to that in Palestine where it is stymied by the ongoing restrictions. The key advantage benefitting a faster growth trajectory in Moldova is that its economy has not been controlled by restrictions on access, movement and trade as has been the case in Palestine over the last two decades.
42 The IMF staff report for the 2015 Article IV consultation, Moldova, January 2016.
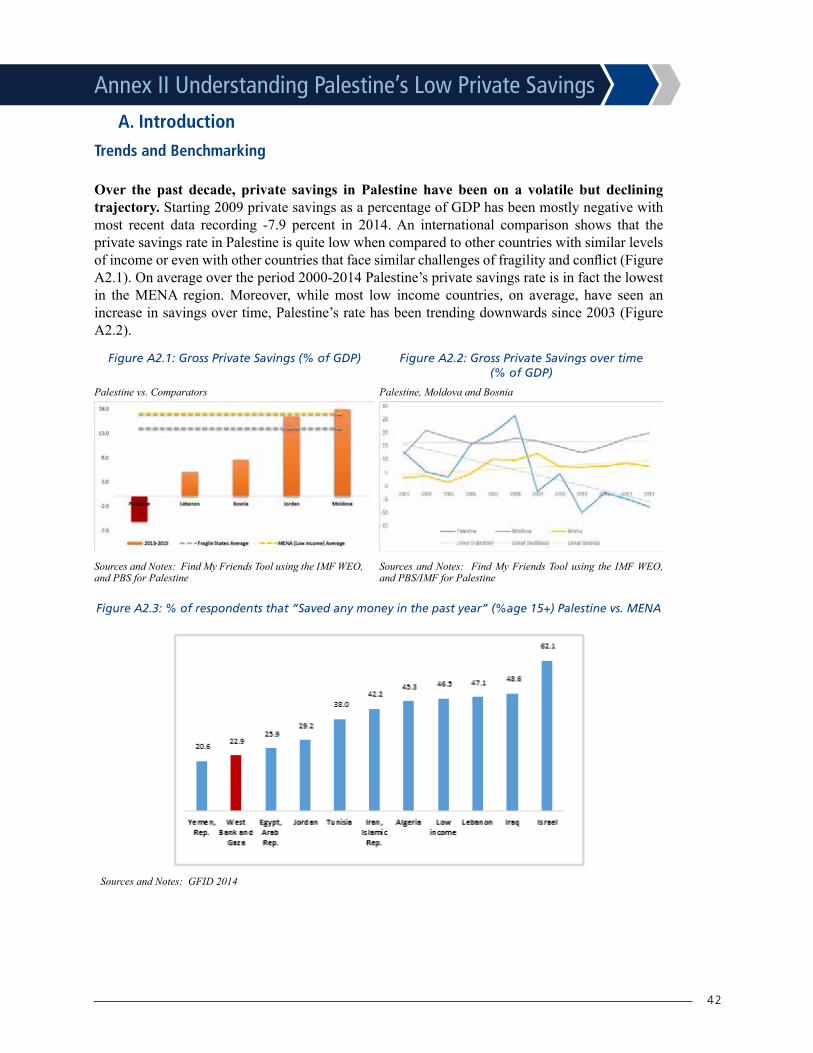
42
Annex II Understanding Palestine’s Low Private SavingsA. Introduction
Trends and Benchmarking
Over the past decade, private savings in Palestine have been on a volatile but declining trajectory. Starting 2009 private savings as a percentage of GDP has been mostly negative with most recent data recording -7.9 percent in 2014. An international comparison shows that the private savings rate in Palestine is quite low when compared to other countries with similar levels of income or even with other countries that face similar challenges of fragility and conflict (Figure A2.1). On average over the period 2000-2014 Palestine’s private savings rate is in fact the lowest in the MENA region. Moreover, while most low income countries, on average, have seen an increase in savings over time, Palestine’s rate has been trending downwards since 2003 (Figure A2.2).
Palestine vs. Comparators
Sources and Notes: Find My Friends Tool using the IMF WEO, and PBS for Palestine
Palestine, Moldova and Bosnia
Sources and Notes: Find My Friends Tool using the IMF WEO, and PBS/IMF for Palestine
Figure A2.1: Gross Private Savings (% of GDP) Figure A2.2: Gross Private Savings over time(% of GDP)
Figure A2.3: % of respondents that “Saved any money in the past year” (%age 15+) Palestine vs. MENA
Sources and Notes: GFID 2014
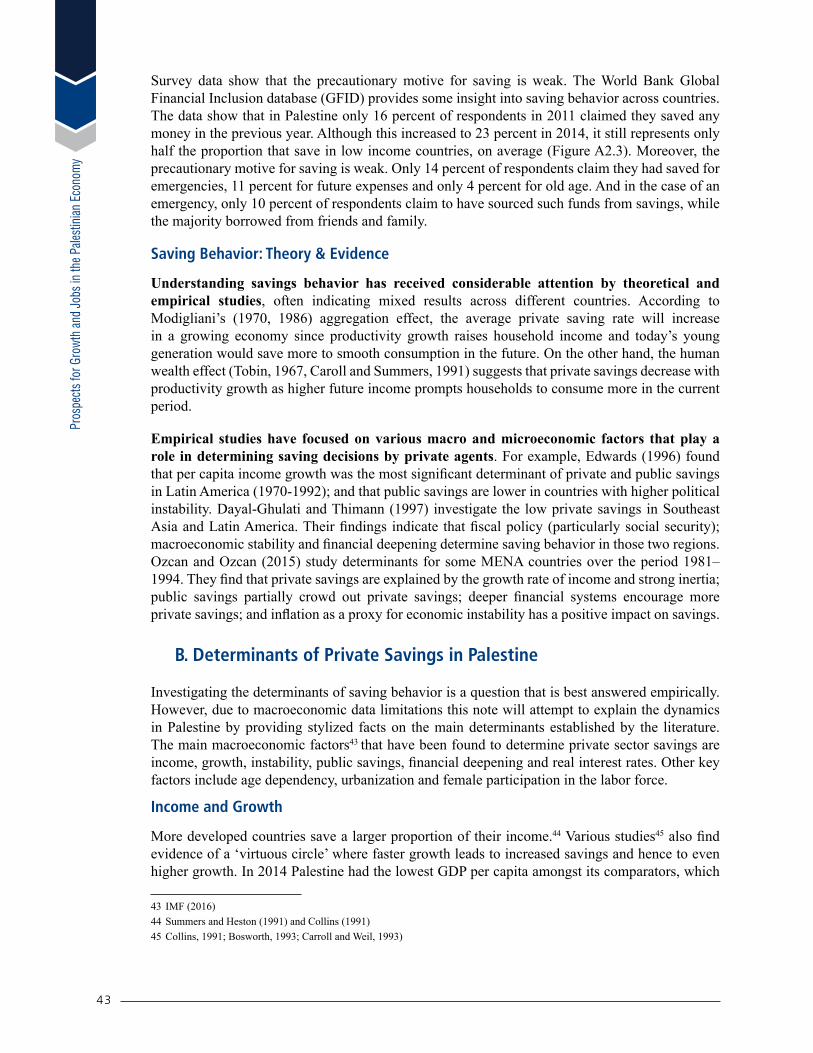
Pros
pect
s for
Gro
wth
and
Jobs
in th
e Pale
stin
ian E
cono
my
43
Survey data show that the precautionary motive for saving is weak. The World Bank Global Financial Inclusion database (GFID) provides some insight into saving behavior across countries. The data show that in Palestine only 16 percent of respondents in 2011 claimed they saved any money in the previous year. Although this increased to 23 percent in 2014, it still represents only half the proportion that save in low income countries, on average (Figure A2.3). Moreover, the precautionary motive for saving is weak. Only 14 percent of respondents claim they had saved for emergencies, 11 percent for future expenses and only 4 percent for old age. And in the case of an emergency, only 10 percent of respondents claim to have sourced such funds from savings, while the majority borrowed from friends and family.
Saving Behavior: Theory & Evidence
Understanding savings behavior has received considerable attention by theoretical and empirical studies, often indicating mixed results across different countries. According to Modigliani’s (1970, 1986) aggregation effect, the average private saving rate will increase in a growing economy since productivity growth raises household income and today’s young generation would save more to smooth consumption in the future. On the other hand, the human wealth effect (Tobin, 1967, Caroll and Summers, 1991) suggests that private savings decrease with productivity growth as higher future income prompts households to consume more in the current period.
Empirical studies have focused on various macro and microeconomic factors that play a role in determining saving decisions by private agents. For example, Edwards (1996) found that per capita income growth was the most significant determinant of private and public savings in Latin America (1970-1992); and that public savings are lower in countries with higher political instability. Dayal-Ghulati and Thimann (1997) investigate the low private savings in Southeast Asia and Latin America. Their findings indicate that fiscal policy (particularly social security); macroeconomic stability and financial deepening determine saving behavior in those two regions. Ozcan and Ozcan (2015) study determinants for some MENA countries over the period 1981–1994. They find that private savings are explained by the growth rate of income and strong inertia; public savings partially crowd out private savings; deeper financial systems encourage more private savings; and inflation as a proxy for economic instability has a positive impact on savings.
B. Determinants of Private Savings in Palestine
Investigating the determinants of saving behavior is a question that is best answered empirically. However, due to macroeconomic data limitations this note will attempt to explain the dynamics in Palestine by providing stylized facts on the main determinants established by the literature. The main macroeconomic factors43 that have been found to determine private sector savings are income, growth, instability, public savings, financial deepening and real interest rates. Other key factors include age dependency, urbanization and female participation in the labor force.
Income and Growth
More developed countries save a larger proportion of their income.44 Various studies45 also find evidence of a ‘virtuous circle’ where faster growth leads to increased savings and hence to even higher growth. In 2014 Palestine had the lowest GDP per capita amongst its comparators, which
43 IMF (2016)44 Summers and Heston (1991) and Collins (1991)45 Collins, 1991; Bosworth, 1993; Carroll and Weil, 1993)

44
was also lower than the average for low income countries in MENA (Figure A2.4). Over the past decade Palestine’s growth in real GDP per capita has also been slow when compared to other countries dependent upon aid flows and share similar conflict experience (Figure A2.5). Moreover, per capita growth has been very volatile since much of the growth in Palestine is financed by donor transfers and remittances. Official Development Assistance (ODA) and foreign aid represent 20 percent of GDP and personal remittances represented 14 percent of GDP in 2014. This ranks Palestine among the top 10 ODA per capita receivers and the fifth highest receiver of remittances amongst other fragile and conflict affected46 states. Over the long run, Palestine’s slow and volatile per capita growth and aid dependency has not been conducive to boosting savings (Figure A2.6).
Sources and Notes: Find My Friends Tool using WDI Sources and Notes: Find My Friends Tool using WDI
Figure A2.4: GDP Per Capita (PPP, 2014 international $)
Figure A2.5: Average Annual GDP per capita Growth over 2004-2014 (constant 2010 US$)
Figure A2.6: Real GDP Per Capita Growth (PPP)
Palestine vs. Bosnia, Moldova & Israel
Sources and notes: Find My Friends Tool using WDI
Political instability, uncertainty and conflict
Various empirical studies suggest that the higher the economic uncertainty, the greater the need for precautionary savings. Accordingly, the pervasive political and economic instability and elusive reconciliation of the long-standing conflict between Israel and Palestine, should have led to higher precautionary savings in Palestine.47 However, political uncertainty and conflict has also been found to impact private savings negatively through the distortion of incentives. Polachek & Sevastianova (2010) cite several studies that find uncertainty about property rights brought about by conflict can effectively create a tax on investment and distort saving incentives. Conflict and economic volatility may also suggest higher uncertainty regarding the future value of savings, a situation where current consumption becomes more attractive. Furthermore, Carroll and Kimball (2005) find that the closer one’s income is to subsistence levels, the less likely it is that private
46 According to the World Bank Definition of FCV states47 Lower private savings reflect improved economic stability (World Bank, 2014 and IMF, 2016).
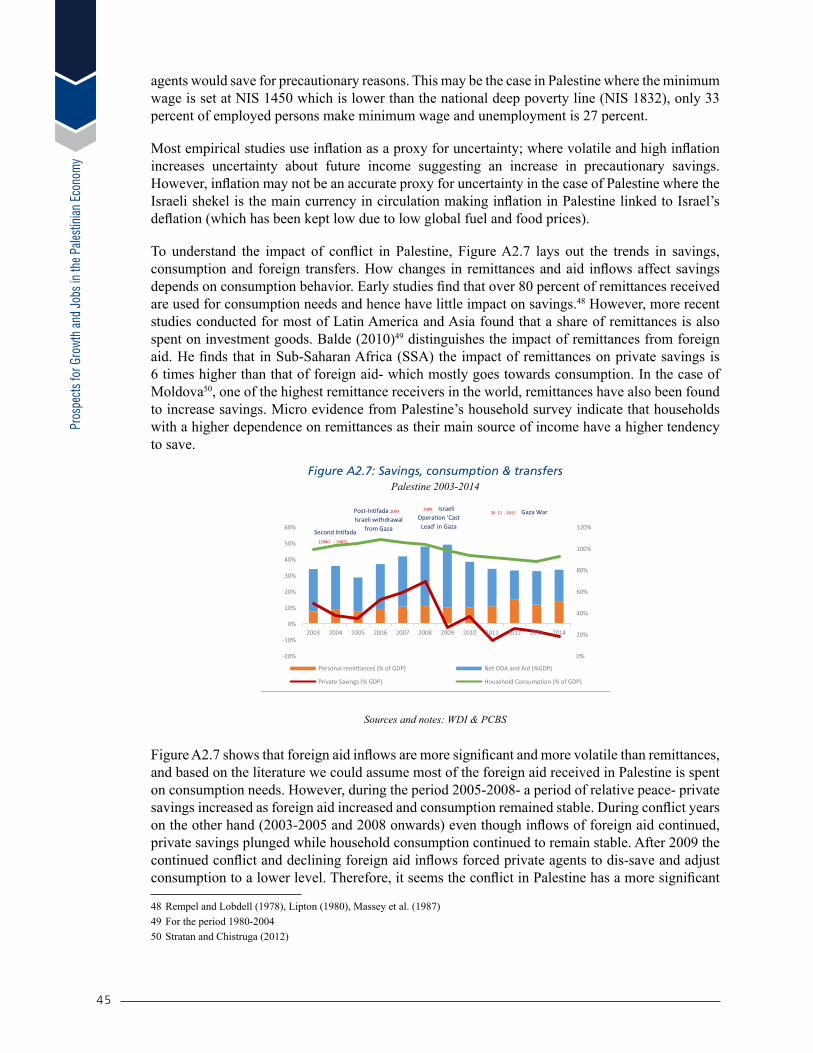
Pros
pect
s for
Gro
wth
and
Jobs
in th
e Pale
stin
ian E
cono
my
45
agents would save for precautionary reasons. This may be the case in Palestine where the minimum wage is set at NIS 1450 which is lower than the national deep poverty line (NIS 1832), only 33 percent of employed persons make minimum wage and unemployment is 27 percent.
Most empirical studies use inflation as a proxy for uncertainty; where volatile and high inflation increases uncertainty about future income suggesting an increase in precautionary savings. However, inflation may not be an accurate proxy for uncertainty in the case of Palestine where the Israeli shekel is the main currency in circulation making inflation in Palestine linked to Israel’s deflation (which has been kept low due to low global fuel and food prices).
To understand the impact of conflict in Palestine, Figure A2.7 lays out the trends in savings, consumption and foreign transfers. How changes in remittances and aid inflows affect savings depends on consumption behavior. Early studies find that over 80 percent of remittances received are used for consumption needs and hence have little impact on savings.48 However, more recent studies conducted for most of Latin America and Asia found that a share of remittances is also spent on investment goods. Balde (2010)49 distinguishes the impact of remittances from foreign aid. He finds that in Sub-Saharan Africa (SSA) the impact of remittances on private savings is 6 times higher than that of foreign aid- which mostly goes towards consumption. In the case of Moldova50, one of the highest remittance receivers in the world, remittances have also been found to increase savings. Micro evidence from Palestine’s household survey indicate that households with a higher dependence on remittances as their main source of income have a higher tendency to save.
Figure A2.7: Savings, consumption & transfersPalestine 2003-2014
Sources and notes: WDI & PCBS
Figure A2.7 shows that foreign aid inflows are more significant and more volatile than remittances, and based on the literature we could assume most of the foreign aid received in Palestine is spent on consumption needs. However, during the period 2005-2008- a period of relative peace- private savings increased as foreign aid increased and consumption remained stable. During conflict years on the other hand (2003-2005 and 2008 onwards) even though inflows of foreign aid continued, private savings plunged while household consumption continued to remain stable. After 2009 the continued conflict and declining foreign aid inflows forced private agents to dis-save and adjust consumption to a lower level. Therefore, it seems the conflict in Palestine has a more significant
48 Rempel and Lobdell (1978), Lipton (1980), Massey et al. (1987)49 For the period 1980-200450 Stratan and Chistruga (2012)
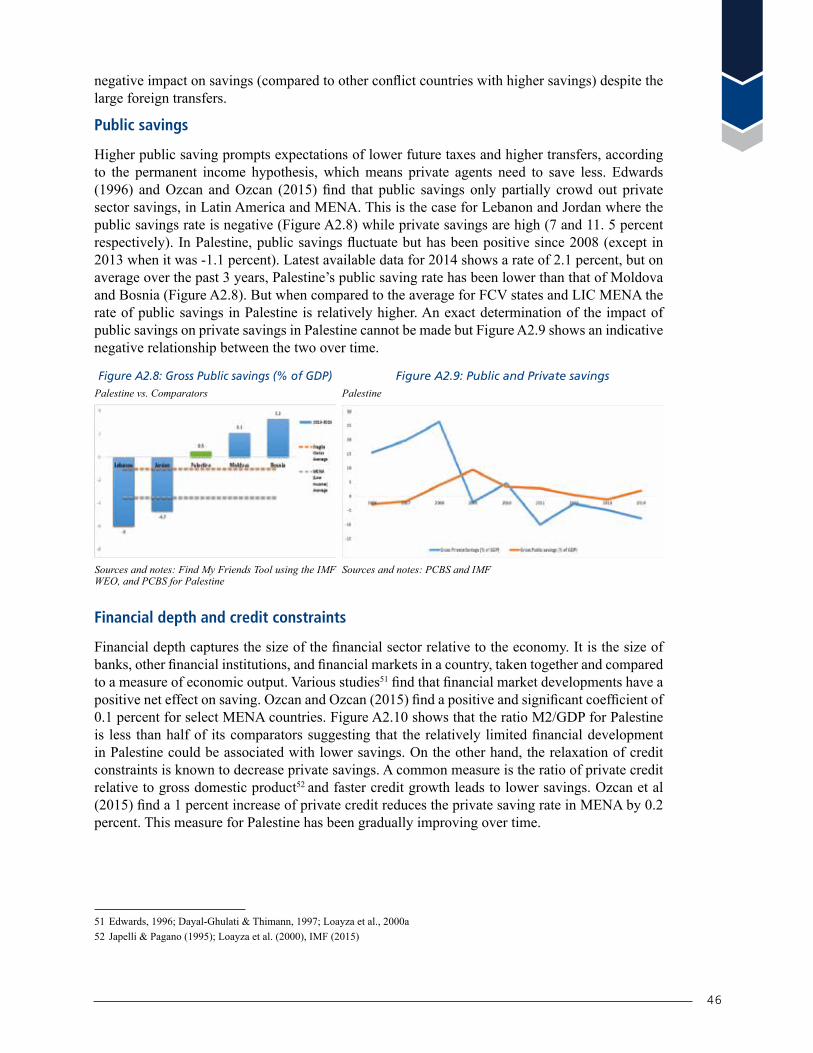
46
negative impact on savings (compared to other conflict countries with higher savings) despite the large foreign transfers.
Public savings
Higher public saving prompts expectations of lower future taxes and higher transfers, according to the permanent income hypothesis, which means private agents need to save less. Edwards (1996) and Ozcan and Ozcan (2015) find that public savings only partially crowd out private sector savings, in Latin America and MENA. This is the case for Lebanon and Jordan where the public savings rate is negative (Figure A2.8) while private savings are high (7 and 11. 5 percent respectively). In Palestine, public savings fluctuate but has been positive since 2008 (except in 2013 when it was -1.1 percent). Latest available data for 2014 shows a rate of 2.1 percent, but on average over the past 3 years, Palestine’s public saving rate has been lower than that of Moldova and Bosnia (Figure A2.8). But when compared to the average for FCV states and LIC MENA the rate of public savings in Palestine is relatively higher. An exact determination of the impact of public savings on private savings in Palestine cannot be made but Figure A2.9 shows an indicative negative relationship between the two over time.
Palestine vs. Comparators Palestine
Sources and notes: Find My Friends Tool using the IMF WEO, and PCBS for Palestine
Sources and notes: PCBS and IMF
Figure A2.8: Gross Public savings (% of GDP) Figure A2.9: Public and Private savings
Financial depth and credit constraints
Financial depth captures the size of the financial sector relative to the economy. It is the size of banks, other financial institutions, and financial markets in a country, taken together and compared to a measure of economic output. Various studies51 find that financial market developments have a positive net effect on saving. Ozcan and Ozcan (2015) find a positive and significant coefficient of 0.1 percent for select MENA countries. Figure A2.10 shows that the ratio M2/GDP for Palestine is less than half of its comparators suggesting that the relatively limited financial development in Palestine could be associated with lower savings. On the other hand, the relaxation of credit constraints is known to decrease private savings. A common measure is the ratio of private credit relative to gross domestic product52 and faster credit growth leads to lower savings. Ozcan et al (2015) find a 1 percent increase of private credit reduces the private saving rate in MENA by 0.2 percent. This measure for Palestine has been gradually improving over time.
51 Edwards, 1996; Dayal-Ghulati & Thimann, 1997; Loayza et al., 2000a52 Japelli & Pagano (1995); Loayza et al. (2000), IMF (2015)
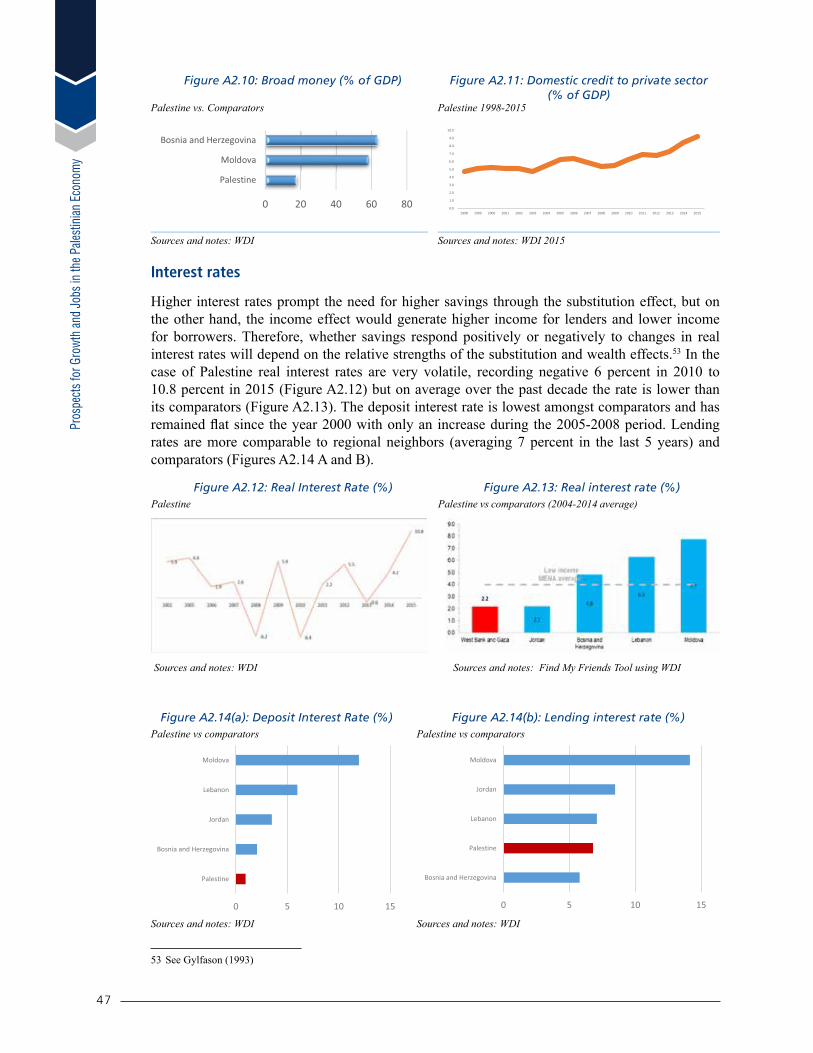
Pros
pect
s for
Gro
wth
and
Jobs
in th
e Pale
stin
ian E
cono
my
47
Palestine 1998-2015Palestine vs. Comparators
Figure A2.11: Domestic credit to private sector(% of GDP)
Figure A2.10: Broad money (% of GDP)
Sources and notes: WDI Sources and notes: WDI 2015
Interest rates
Higher interest rates prompt the need for higher savings through the substitution effect, but on the other hand, the income effect would generate higher income for lenders and lower income for borrowers. Therefore, whether savings respond positively or negatively to changes in real interest rates will depend on the relative strengths of the substitution and wealth effects.53 In the case of Palestine real interest rates are very volatile, recording negative 6 percent in 2010 to 10.8 percent in 2015 (Figure A2.12) but on average over the past decade the rate is lower than its comparators (Figure A2.13). The deposit interest rate is lowest amongst comparators and has remained flat since the year 2000 with only an increase during the 2005-2008 period. Lending rates are more comparable to regional neighbors (averaging 7 percent in the last 5 years) and comparators (Figures A2.14 A and B).
Palestine vs comparators (2004-2014 average)Palestine Figure A2.13: Real interest rate (%)Figure A2.12: Real Interest Rate (%)
Sources and notes: WDI Sources and notes: Find My Friends Tool using WDI
Palestine vs comparators Palestine vs comparators Figure A2.14(b): Lending interest rate (%)Figure A2.14(a): Deposit Interest Rate (%)
Sources and notes: WDI Sources and notes: WDI
53 See Gylfason (1993)

48
Demographics
Several demographic characteristics shape consumption and savings decisions. When the working age population increases relative to that of retired persons, savings are also likely to increase54. Palestine’s working age population constitutes 56.7 percent (along with Iraq this is the lowest in the region) while the average for MENA is 68 percent. Moreover 31 percent of the youth are not in education, employment or training. Palestine has the second highest fertility rate in the region (4.2 births per woman). The age dependency ratio (largely determined by youth dependency below the age of 15 years and not old age dependency) is relatively high at 76 percent (Figure A2.15). A high youth dependency ratio is generally associated with lower household savings, since overall spending on more children is higher.55 Moreover, with a low old age dependency ratio and high fertility rates, parents can rely on children to support them in old age, thus reducing the need for retirement savings. Micro evidence (described in the next section) corroborates this. However, the youth dependency ratio has been on a declining trajectory since the 1990’s whereas the old age dependency ratio has been slightly increasing, which could prompt higher savings in the future.
Figure A2.15: Age dependency ratio% of working age population
Sources and notes: Find my Friends using WDI
Female labor force participation
Low female labor force participation rates also reduce the ability for households to save. This is true in the case of Palestine where the female labor force participation rate is 16.4 percent, lowest amongst its comparators (Figure A2.16), and lowest in the MENA region.
Figure A2.16: Female Labor force participation Rate (Modeled ILO Estimate)% of working age population
Sources and notes: Find my Friends using WDI
54 (Lahiri, 1989; Edwards, 1996; Higgins & Williamson, 1996; Dayal-Ghulati & Thimann, 1997; Loayza et al., 2000a)55 An empirical study on some MENA countries (Ozcan et. al 2015) estimate the impact on private savings and find a positive sign
of the coefficients of the young- and the old-dependency ratio, which is explained by child-rearing traditions.
Pros
pect
s for
Gro
wth
and
Jobs
in th
e Pale
stin
ian E
cono
my
49
Urbanization
Urban households tend to save less than rural ones, as rural population require more savings to overcome the uncertainty that comes with agricultural income.56 Urban dwellers tend to save less also because of the relatively better provision of public services such as health and education as well as social protection programs (Dayal-Ghulati and Thimann,1997). In Palestine 75 percent of the population reside in urban areas where most health and education indicators are at par with its well performing neighbors. Micro evidence is found to corroborate this- urban households in Palestine tend to save less than rural ones.
Household characteristics: Micro evidence
Using the Household Expenditure survey of 2010, this section outlines the key results of regressions of the household saving rate on an array of household characteristics. Some descriptive statistics are outlined in Appendix I. The survey covers 3,600 households, out of which only 25 percent report positive savings. All saving is accounted for by the highest income decile, regardless of the level of education. Younger heads of households in the highest 3 deciles tend to save more than older ones. Table 2 outlines the different characteristics of households that have positive and negative savings.
For the regressions, the variable of interest is the household saving rate, defined as disposable income minus consumption expenditure as a ratio of disposable income. Control variables include income, characteristics of the head of the household (such as gender, level of education, age and age squared) the number of household members and location dummy variables for each of the governorates. Regressions can be classified into two groups, one containing the baseline specification and another incorporating additional explanatory variables.
Baseline regression
The results of the baseline regression are listed in Appendix II. Current income presents a positive and significant coefficient throughout all the regressions. Age has a negative but increasing effect on saving, with saving peaking at the age of 40. The number of household members also has a negative coefficient indicating the reduction in the ability to save as the family gets larger. The gender of the household head does not seem to impact savings, given the insignificant positive coefficient of the female household head dummy variable in most regressions, which is contrary to most evidence in the literature where households with female heads tend to save less.57 Higher levels of education of the head of the household (those with primary education or higher) reduce the saving rate when controlling for income, but increases it otherwise. The positive correlation between current income and education may have led to this result. Bebczuk et al. (2015) find a similar result for Latin America,58 and a possible interpretation is that, once current income is controlled for highly educated heads foresee higher future income, boosting current consumption whilst decreasing saving.
Augmented regressions
The baseline regression was augmented with additional explanatory variables to test the impact of some household characteristics on saving behavior (Appendix II). The young dependency,
56 Deaton (1990) finds the coefficient of the ratio of urban population to be negative and significant in most regressions, supporting the 'buffer stock' approach to private savings for countries in Latin America.
57 However, this variable is not robust and its coefficient’s sign and significance changes with different model specifications.58 Gandelman (2014b), for a number of economies in the region, Sandoval-Hernández (2013), for Mexico, and Butelmann and
Gallego (2000), for Chile, find mixed evidence regarding the education-saving nexus, with several countries and years where the household saving rate drops with educational levels.
50
defined as the number of household members below the age of 15, is found to have a negative and significant coefficient, while the number of household members older than 65 is insignificant. This is in line with the macro indicators described in the previous section. Household heads that work in the public sector tend to save more than others. The coefficients of the dummy variable for the type of location indicate that urban dwellers save less than those in rural areas. The higher the level of education expenses, the lower the saving rate. A higher dependence on remittances has a positive impact on savings- the coefficient for the dummy variable representing those who answered yes to the question ‘Were remittances your main source of income’ was found to be positive and significant. On the other hand, a dummy variable set to one if the household claimed to have received any government assistance/ aid, was found to be insignificant. Measures of wealth such as home and car ownership have a significantly negative impact on savings.
Some important caveats
The large gap between the household survey and national accounts measures of saving and income indicate that the imputed household saving rate is likely to be problematic due to the commonly found under-reporting of income and/or over-reporting of consumption in household level surveys. Moreover, although results from these regressions remain robust for different subsamples and after excluding outliers, the model specification is subject to measurement issues such as endogeneity bias.59
C. Conclusion
In summary, Palestine’s growth trajectory has been extremely volatile and inadequate to lead to the growth-push effects other countries have had on savings due to the protracted nature of the conflict, instability and dependence upon foreign aid. The weak precautionary motive for saving in Palestine could be explained60 by the (1) low per capita income and slow and volatile growth which overall prompts the use of aid and remittances towards smoothing consumption rather than savings (2) the distortionary effects of conflict and instability on incentives (3) low real interest rates (4) limited financial depth and increasing access to credit (5) a high youth dependency ratio and (6) low female labor force participation. Micro evidence suggests that certain household characteristics have a positive impact on savings: households with members working in the public sector, those that reside in the rural areas and those that depend on remittances. Whereas households with higher youth dependency, education expenditure and wealth assets tend to save less. However, any inference from the micro results must be made with caution due to the various reporting and measurement issues associated with household surveys.
59 Kraay (2000) and Bebczuk et al. (2015) outline the various measurement issues related to household level analysis of savings behavior
60 These are only inferences based on stylized facts, actual causality cannot be determined due to limited macro data.

51
APPENDIX I HOUSEHOLD LEVEL DESCRIPTIVE STATISTICS
Table 1: Mean & Median Saving Rates by Income decile
Income Deciles Mean Saving Rate (%) Median Saving Rate (%)1 -188 -1592 -130 -1003 -90 -664 -71 -475 -53 -396 -42 -277 -31 -198 -22 -109 -16 -2.710 6.8 16%
Table 2: Characteristics of Households that Save / Dis-save
Variable Positive Savings Dis-savingHouseholds (% of total) 25% 75%Saving Rate (Mean) 23% -83%Saving Rate (Median) 20% -58%Monthly HH Income 6,668 3,263Per capita Income 1,039 511Young Dependency Ratio 41% 44%Old Dependency Ratio 3% 3%Remittances (Reported as main source of Income) 13% 16%Primary Education (% of HH) 30% 31%Secondary Education (% of HH) 39% 47%Tertiary Education (% of HH) 27% 17%% Received Government assistance 25% 43%% HH is a Public employee 23% 19%% Living in Urban area 71% 74%% Living in Rural area 22% 16%% Living in Refugee Camps 33% 44%% Owned a Car 27% 23%% Owned their home 84% 87%Education spending (%of HH Income) 2% 7%
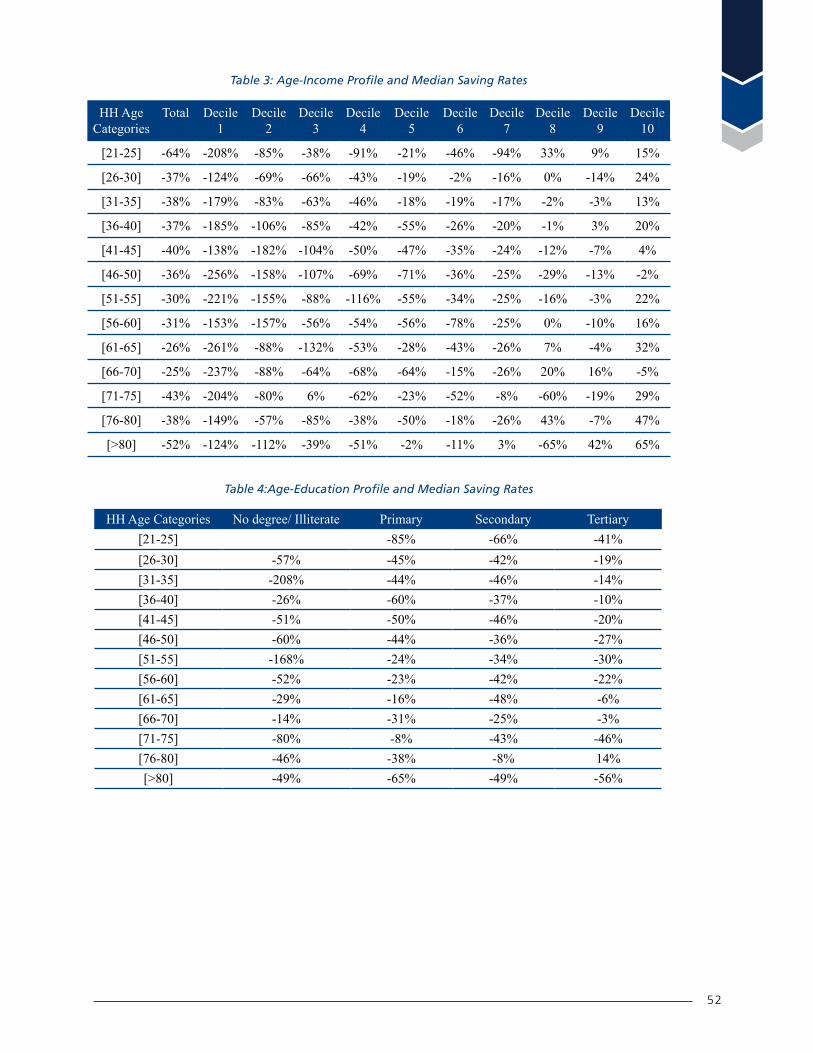
52
Table 3: Age-Income Profile and Median Saving Rates
HH Age Categories
Total Decile 1
Decile 2
Decile 3
Decile 4
Decile 5
Decile 6
Decile 7
Decile 8
Decile 9
Decile 10
[21-25] -64% -208% -85% -38% -91% -21% -46% -94% 33% 9% 15%
[26-30] -37% -124% -69% -66% -43% -19% -2% -16% 0% -14% 24%
[31-35] -38% -179% -83% -63% -46% -18% -19% -17% -2% -3% 13%
[36-40] -37% -185% -106% -85% -42% -55% -26% -20% -1% 3% 20%
[41-45] -40% -138% -182% -104% -50% -47% -35% -24% -12% -7% 4%
[46-50] -36% -256% -158% -107% -69% -71% -36% -25% -29% -13% -2%
[51-55] -30% -221% -155% -88% -116% -55% -34% -25% -16% -3% 22%
[56-60] -31% -153% -157% -56% -54% -56% -78% -25% 0% -10% 16%
[61-65] -26% -261% -88% -132% -53% -28% -43% -26% 7% -4% 32%
[66-70] -25% -237% -88% -64% -68% -64% -15% -26% 20% 16% -5%
[71-75] -43% -204% -80% 6% -62% -23% -52% -8% -60% -19% 29%
[76-80] -38% -149% -57% -85% -38% -50% -18% -26% 43% -7% 47%
[>80] -52% -124% -112% -39% -51% -2% -11% 3% -65% 42% 65%
Table 4:Age-Education Profile and Median Saving Rates
HH Age Categories No degree/ Illiterate Primary Secondary Tertiary[21-25] -85% -66% -41%[26-30] -57% -45% -42% -19%[31-35] -208% -44% -46% -14%[36-40] -26% -60% -37% -10%[41-45] -51% -50% -46% -20%[46-50] -60% -44% -36% -27%[51-55] -168% -24% -34% -30%[56-60] -52% -23% -42% -22%[61-65] -29% -16% -48% -6%[66-70] -14% -31% -25% -3%[71-75] -80% -8% -43% -46%[76-80] -46% -38% -8% 14%[>80] -49% -65% -49% -56%
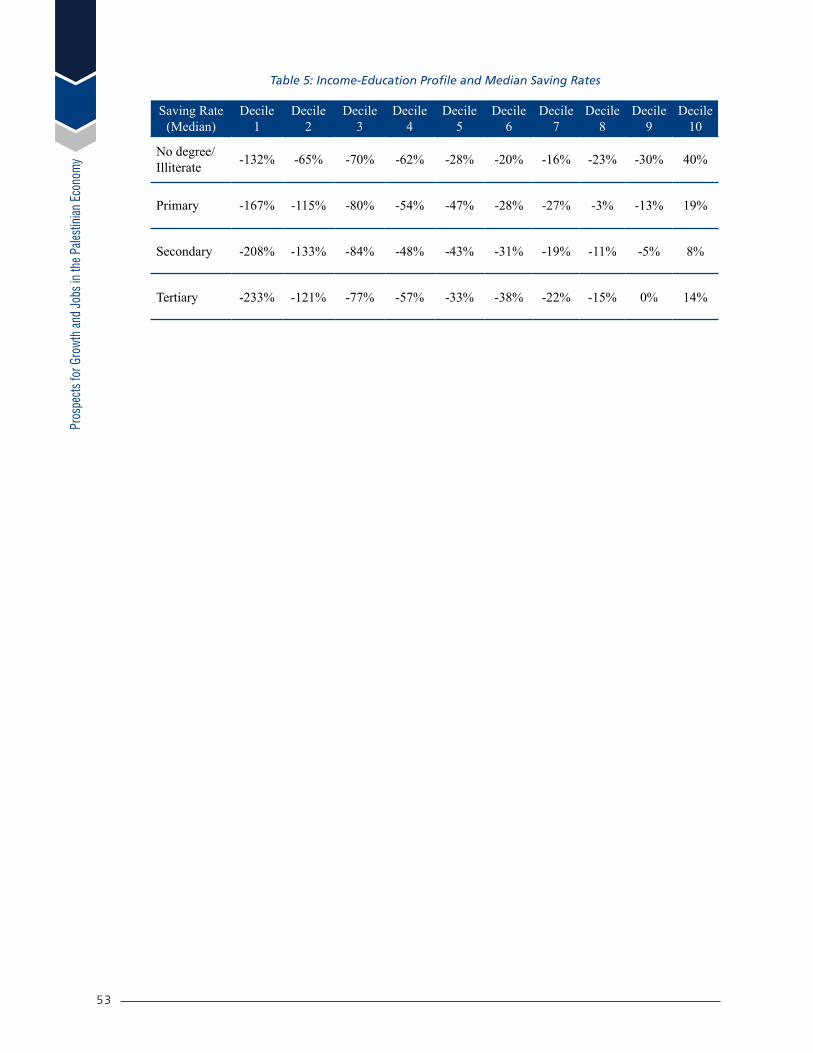
Pros
pect
s for
Gro
wth
and
Jobs
in th
e Pale
stin
ian E
cono
my
53
Table 5: Income-Education Profile and Median Saving Rates
Saving Rate (Median)
Decile 1
Decile 2
Decile 3
Decile 4
Decile 5
Decile 6
Decile 7
Decile 8
Decile 9
Decile 10
No degree/ Illiterate -132% -65% -70% -62% -28% -20% -16% -23% -30% 40%
Primary -167% -115% -80% -54% -47% -28% -27% -3% -13% 19%
Secondary -208% -133% -84% -48% -43% -31% -19% -11% -5% 8%
Tertiary -233% -121% -77% -57% -33% -38% -22% -15% 0% 14%
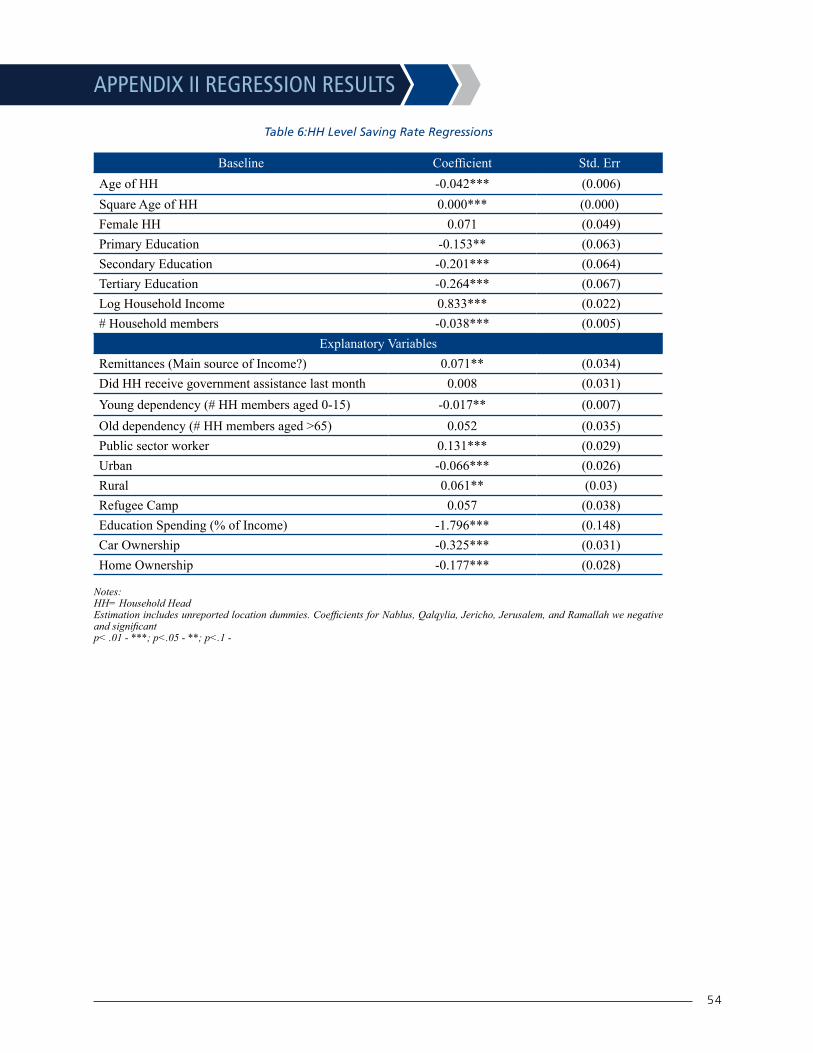
54
APPENDIX II REGRESSION RESULTS
Table 6:HH Level Saving Rate Regressions
Baseline Coefficient Std. ErrAge of HH -0.042*** (0.006) Square Age of HH 0.000*** (0.000)Female HH 0.071 (0.049) Primary Education -0.153** (0.063) Secondary Education -0.201*** (0.064) Tertiary Education -0.264*** (0.067) Log Household Income 0.833*** (0.022) # Household members -0.038*** (0.005)
Explanatory VariablesRemittances (Main source of Income?) 0.071** (0.034) Did HH receive government assistance last month 0.008 (0.031) Young dependency (# HH members aged 0-15) -0.017** (0.007) Old dependency (# HH members aged >65) 0.052 (0.035) Public sector worker 0.131*** (0.029) Urban -0.066*** (0.026) Rural 0.061** (0.03) Refugee Camp 0.057 (0.038) Education Spending (% of Income) -1.796*** (0.148) Car Ownership -0.325*** (0.031) Home Ownership -0.177*** (0.028)
Notes: HH= Household Head Estimation includes unreported location dummies. Coefficients for Nablus, Qalqylia, Jericho, Jerusalem, and Ramallah we negative and significantp< .01 - ***; p<.05 - **; p<.1 -
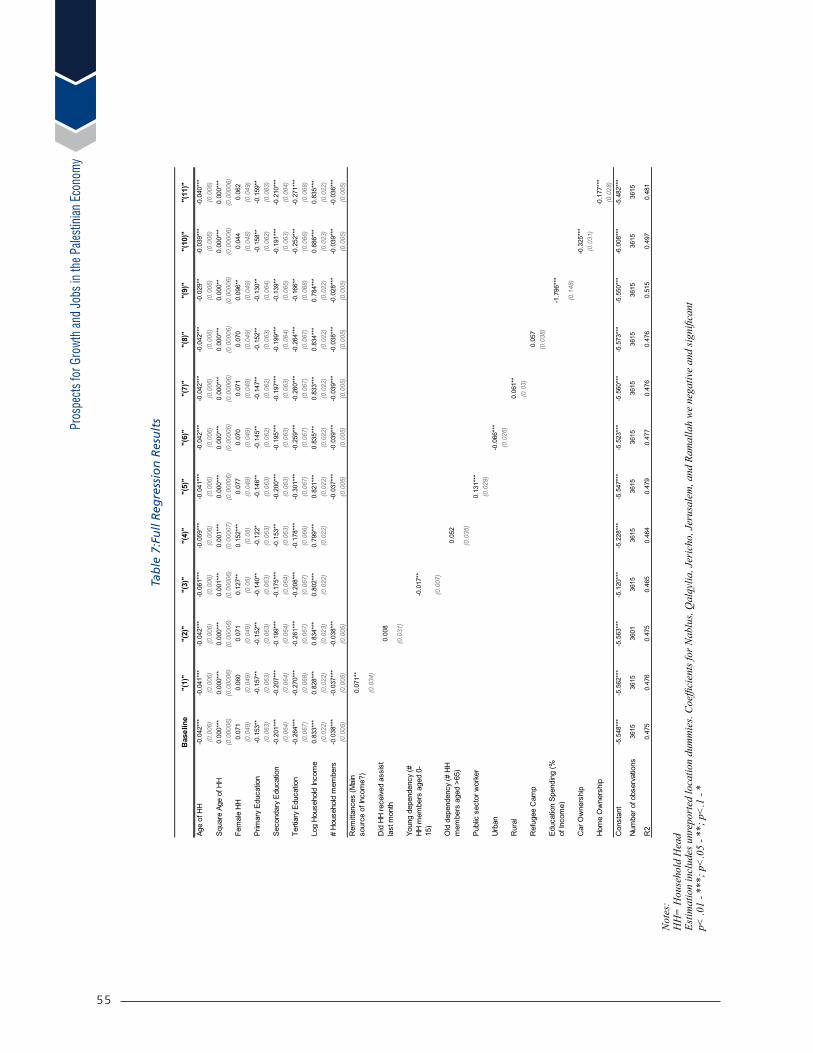
Pros
pect
s for
Gro
wth
and
Jobs
in th
e Pale
stin
ian E
cono
my
55
Tab
le 7
:Fu
ll R
egre
ssio
n R
esu
lts
Not
es:
HH
= H
ouse
hold
Hea
d Es
timat
ion
incl
udes
unr
epor
ted
loca
tion
dum
mie
s. C
oeffi
cien
ts fo
r Nab
lus,
Qal
qylia
, Jer
icho
, Jer
usal
em, a
nd R
amal
lah
we
nega
tive
and
sign
ifica
ntp<
.01
- ***
; p<
.05
- **;
p<
.1 -
*

56
Annex III Estimating Tariff Equivalents of External and Internal ConstraintsA. Introduction
The main purpose of the study was to inform on price distortions due to external and internal constraints to the preparation of a Social Accounting Matrix (SAM) and a dynamic Computable General Equilibrium (CGE) model for Palestine (West Bank and Gaza) that quantitatively tries to indicate the impact of externally imposed restrictions and internal structural, institutional and regulatory constraints on domestic economic activities.
Theoretically, prices of goods and services are determined by the market forces - supply and demand. However, in reality, particularly in the context of developing economies, prices are influenced by the forces of government policy measures, nontariff barriers and structural constraints in the market as well. A common effect of all these constraints is ‘price distortions’ and ‘economic inefficiency’ in the allocation and use of real resources in the national economy.
In this context, the study looked at the price raising effect of the nontariff measures (NTM) or nontariff barriers (NTB) to trade and domestic economic activities, which are also called tariff equivalents (TEs). TEs have similar price raising effect of tariff and taxes, but they are dissimilar in the sense that they do not necessarily raise revenues for the government.
The study was primarily based on the available secondary data from the Palestine Central Bureau of Statistics (PCBS). This included, among others, data on cost of production data for main economic activities (sectors) based on 2014 survey. In addition, the study gathered information from freighters and customs clearing agents on the cost of moving goods from main ports and markets of Israel (IL) to main Palestine (PA) markets, including cost of customs clearance, transport and crossing borders.
B. The Effect of Nontariff Measures\Nontariff Barriers
Being landlocked by IL, PA’s imports and exports face serious challenges as imported goods first enter IL ports and then cross IL-PA border to arrive at PA domestic markets. Goods need to get customs cleared and then moved to PA markets via IL-PA border crossing where they are subjected to border checks\inspections. Imports from IL also face similar challenges in moving goods to PA markets.
Exports face even more cumbersome compliance challenges in terms of border checks and also documentary compliance as they have to pass IL-PA border crossing and eventually get shipped from IL ports. Under the documentary compliance, there are two stringent requirements that should satisfy IL authorities, then only goods can cross IL border – (i) certificate of standards, and (ii) certificate of health. Being part of the Customs Union, PA is expected to comply with both IL standards (transit country) and then international standards (destination country). Making sure whether export goods comply such standards takes time and involves cumbersome procedures that eventually add cost to PA exporters and by that undermine export competitiveness. PA’s regulatory framework and institutional capacity in this regard will play a pivotal role, where and when they are inadequate will create an internal constraint.

Pros
pect
s for
Gro
wth
and
Jobs
in th
e Pale
stin
ian E
cono
my
57
A recent ITC (2015) study61 of NTM in PA stresses that market access begins at home as the prevailing internal constraints on exports stem from procedural obstacles and not from the regulations per se. For example, exporters find it cumbersome to obtain export certificates and permits as well as certificates of origin from PA authorities. The most frequently reported procedural obstacles were delays (39 percent), followed by high fees or charges for particular certificates or regulations (29 percent), and arbitrary behavior of officials (11 percent).
The ITC report argues that difficulties with foreign NTMs are often rooted in domestic inefficiencies. For example, as revealed by the study, most obstacles are encountered in IL and at the IL border (56 percent), but also to a large extent in PA itself (36 percent). PA institutions associated with trade procedural obstacles include – (i) Ministry of National Economy, (ii) Palestinian Standards Institute, (iv) testing facilities, (v) Ministry of Finance, (vi) Ministry of Health, and (vii) Ministry of Agriculture.
The report further underscores the special nature of the PA economy and scarcity of resources greatly affect the capacity of companies, including non-exporting ones, to comply with strict sanitary and phyto-sanitary measures and technical barriers to trade, mainly due to the lack of adequate internal quality-management systems. As a result, few PA firms manage to live up to international standards and obtain the related certification, 72 percent of Palestinian exporters have no quality certification. Sanitary and phyto-sanitary and technical barriers to trade measures create about 22 percent of reported NTM cases.
As to the comparative cost of trading across border, no improvement has been made in recent years. Doing Business Survey (2016) reports that PA exports still face about 15 working days’ time and about USD484 cost per container for being able to trade across the border. This excludes unofficial payments and security inspections.
For imports to PA, the cost of moving goods from IL ports\markets to PA markets includes (i) transport cost, (ii) customs clearing agent’s charge, (iii) delays cost, and (iv) cost of border checks (including security checks) in addition to documentary compliance checks. The cost of latter depends on the intensity of the checks\inspections – e.g., normal (scanning only), high (scanning and sample of the content check, and (iii) extreme cases whereby the entire container is fully inspected, and the frequency of such checks/inspections.
It is estimated that the tariff equivalent (TE) of the average cost of transportation and border crossing for goods destined to PA markets from IL amounts to 6.2 percent (of the CIF value) on an average. The following table shows the details (Table A3.1). The TE-trade (6.2 percent of the CIF value of the goods) is quite significant, being quite close to the average nominal customs duty rate (7.5 percent). Delays and border checks are unpredictable and ensuing time and costs vary accordingly. Without delays and extreme border checks, this cost would come down to about half.
61 International Trade Centre (ITC) State of Palestine: Company Perspectives: An ITC Series on Non-Tariff Measures. Geneva: ITC, 2015.
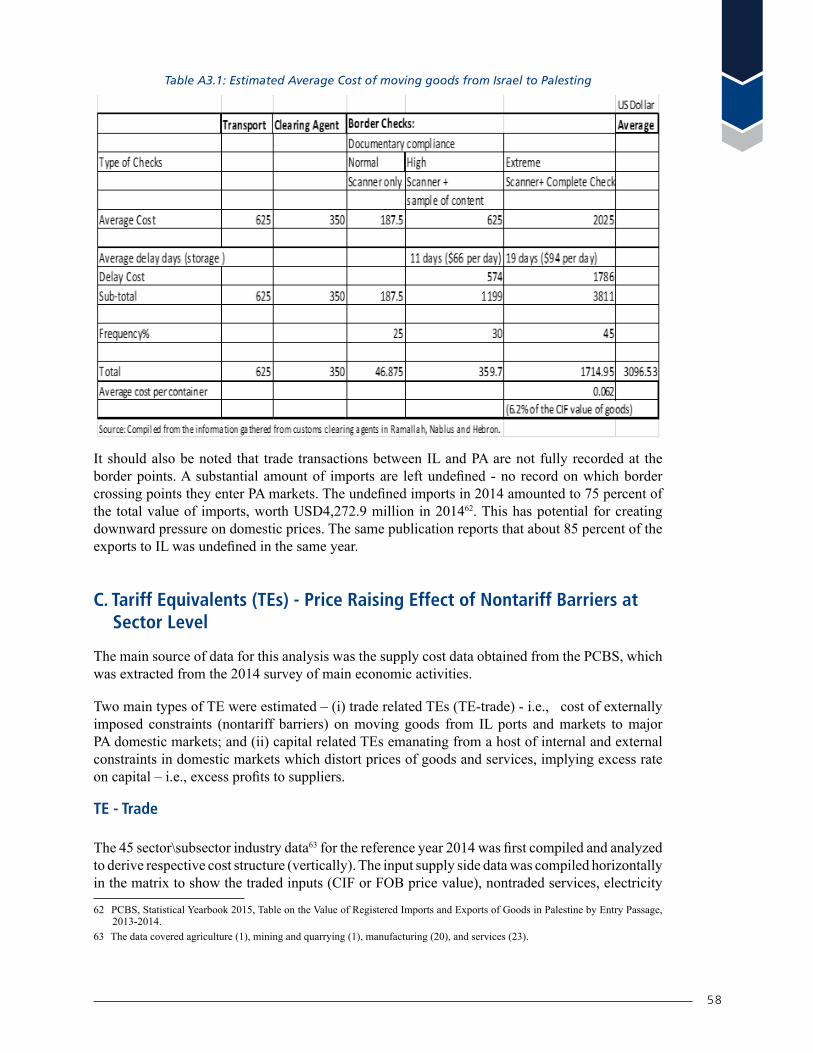
58
Table A3.1: Estimated Average Cost of moving goods from Israel to Palesting
It should also be noted that trade transactions between IL and PA are not fully recorded at the border points. A substantial amount of imports are left undefined - no record on which border crossing points they enter PA markets. The undefined imports in 2014 amounted to 75 percent of the total value of imports, worth USD4,272.9 million in 201462. This has potential for creating downward pressure on domestic prices. The same publication reports that about 85 percent of the exports to IL was undefined in the same year.
C. Tariff Equivalents (TEs) - Price Raising Effect of Nontariff Barriers at Sector Level
The main source of data for this analysis was the supply cost data obtained from the PCBS, which was extracted from the 2014 survey of main economic activities.
Two main types of TE were estimated – (i) trade related TEs (TE-trade) - i.e., cost of externally imposed constraints (nontariff barriers) on moving goods from IL ports and markets to major PA domestic markets; and (ii) capital related TEs emanating from a host of internal and external constraints in domestic markets which distort prices of goods and services, implying excess rate on capital – i.e., excess profits to suppliers.
TE - Trade
The 45 sector\subsector industry data63 for the reference year 2014 was first compiled and analyzed to derive respective cost structure (vertically). The input supply side data was compiled horizontally in the matrix to show the traded inputs (CIF or FOB price value), nontraded services, electricity
62 PCBS, Statistical Yearbook 2015, Table on the Value of Registered Imports and Exports of Goods in Palestine by Entry Passage, 2013-2014.
63 The data covered agriculture (1), mining and quarrying (1), manufacturing (20), and services (23).

Pros
pect
s for
Gro
wth
and
Jobs
in th
e Pale
stin
ian E
cono
my
59
and water, labor, capital charges, tariff and taxes, TEs and operating surplus attributing to the 45 production sectors. All values were derived from the survey data, except for TE – trade, which was separately computed (Table 1). Sectoral trade related TEs were calculated using the cost of trading across the border related cost (6.2 percent) as in Table 1 and traded inputs component of the sectors as in Appendix I. TE- nontrade - TEs not related to trade or rather capital related – was the residual operating surplus, after deducting for traded inputs, nontraded services, labor, capital charges (rents and depreciation), taxes, and TEs-trade.
Table A3.2 presents the TE results (as proportion of output value) for the SUT sectors, full results are documented in Appendix I. The results show the overall price distortion due to a variety of constraints and TE of nontariff barriers at the sector level.
For West Bank, the trade related TEs (TE-Trade) ranged between 0.05 percent for Communications and 3.68 percent for electricity, followed by 2.94 percent for manufacturing. As expected, the TEs follow very much the traded inputs intensity of the economic activities (production sectors). Manufacturing, and electricity, gas water supply sector have relatively higher value of TEs, primarily due to their import contents (traded input intensity. Although, imported electricity and water comes through networks and pipes, they use imported inputs for their distribution.
On the whole, TEs-trade look relatively small as compared with the TEs – nontrade (related to nontrade or capital related. (The latter will be further examined separately in the next section). On the other hand, TE- nontrade look quite high for many sectors, for example, 71.85 percent for Real Estate, 45.39 percent for Construction, 43.85 percent for Administration and Support Services, 31.96 percent for Professional and Technical Business Services. While absolute values differ, the TE results for Gaza Strip follow broadly the same pattern.
Following section examines the TE- nontrade (capital related) further.
Table A3.2: Tariff Equivalent Estimates
SUT SectorsWest Bank Gaza Strip
TE-trade TE-nontrade TE-trade TE-nontradeAgriculture 0.0208 0.0588 0.0309 0.5746Fisheries
Mining & quarrying 0.0201 0.2838 0.0542 0.2229Manufacturing 0.0294 0.1570 0.0503 0.1648Electricity and water 0.0368 0.0369 0.0894 -0.3755Construction 0.0208 0.4539 0.0587 0.1792Int. trade and repair 0.0049 0.3942 0.0077 0.5209Resort, Hotel & Rest 0.0173 0.1814 0.0373 0.1873Transport 0.0196 0.1221 0.0342 0.1459Communications 0.0005 0.3960 0.0108 0.0308Financial services 0.0066 0.2521 0.0099 0.2488Real Estate 0.0019 0.7185 0.0097 0.2522Business Services 0.0056 0.3196 0.0176 0.2734Public Admin & Sup. services 0.0054 0.4385 0.0054 0.1056Education services 0.0030 0.0337 0.0050 0.0052
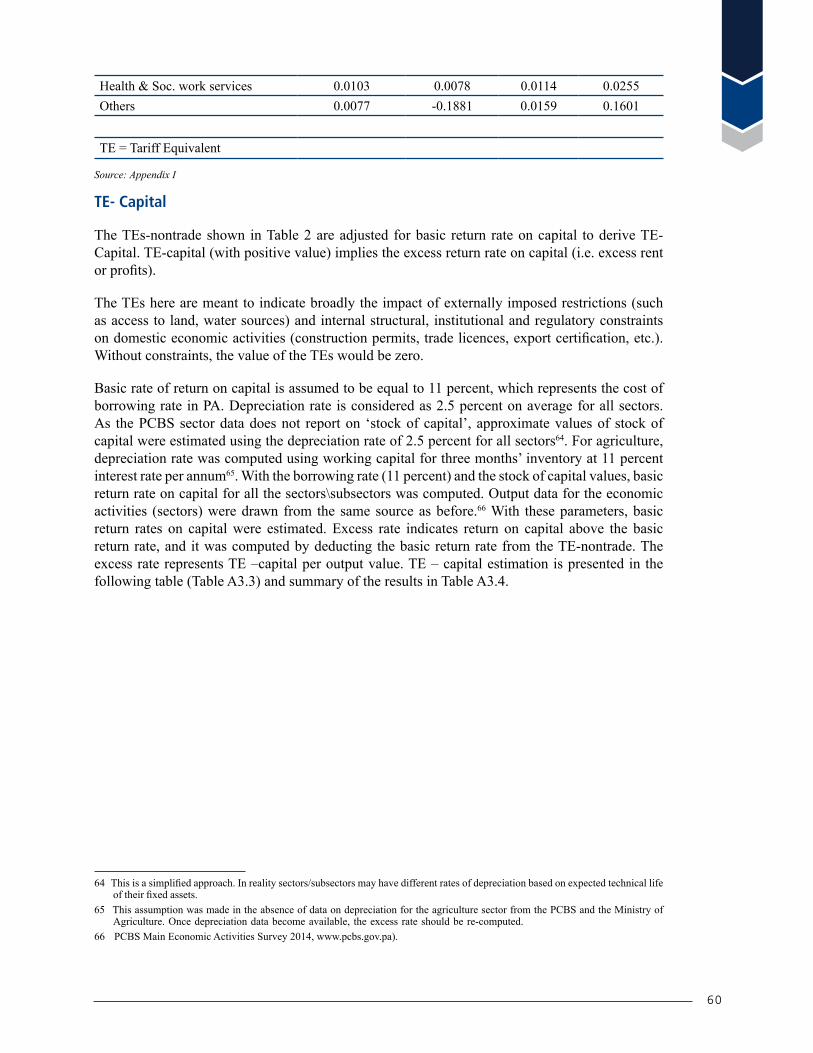
60
Health & Soc. work services 0.0103 0.0078 0.0114 0.0255Others 0.0077 -0.1881 0.0159 0.1601
TE = Tariff Equivalent
Source: Appendix I
TE- Capital
The TEs-nontrade shown in Table 2 are adjusted for basic return rate on capital to derive TE-Capital. TE-capital (with positive value) implies the excess return rate on capital (i.e. excess rent or profits).
The TEs here are meant to indicate broadly the impact of externally imposed restrictions (such as access to land, water sources) and internal structural, institutional and regulatory constraints on domestic economic activities (construction permits, trade licences, export certification, etc.). Without constraints, the value of the TEs would be zero.
Basic rate of return on capital is assumed to be equal to 11 percent, which represents the cost of borrowing rate in PA. Depreciation rate is considered as 2.5 percent on average for all sectors. As the PCBS sector data does not report on ‘stock of capital’, approximate values of stock of capital were estimated using the depreciation rate of 2.5 percent for all sectors64. For agriculture, depreciation rate was computed using working capital for three months’ inventory at 11 percent interest rate per annum65. With the borrowing rate (11 percent) and the stock of capital values, basic return rate on capital for all the sectors\subsectors was computed. Output data for the economic activities (sectors) were drawn from the same source as before.66 With these parameters, basic return rates on capital were estimated. Excess rate indicates return on capital above the basic return rate, and it was computed by deducting the basic return rate from the TE-nontrade. The excess rate represents TE –capital per output value. TE – capital estimation is presented in the following table (Table A3.3) and summary of the results in Table A3.4.
64 This is a simplified approach. In reality sectors/subsectors may have different rates of depreciation based on expected technical life of their fixed assets.
65 This assumption was made in the absence of data on depreciation for the agriculture sector from the PCBS and the Ministry of Agriculture. Once depreciation data become available, the excess rate should be re-computed.
66 PCBS Main Economic Activities Survey 2014, www.pcbs.gov.pa).

Pros
pect
s for
Gro
wth
and
Jobs
in th
e Pale
stin
ian E
cono
my
61
Table A3.3: Estimation of TE-Capital
Source: Computed by the study team
Table A3.4: TE-Capital Estimate - Summary
SUT SectorsTE-Capital % TE-Capital %
West Bank Gaza Strip1 Agricultural products -0.07 0.52792 Fisheries products
3 Mining and quarrying -3.20 0.10744 Manufacturing -5.20 -0.13285 Electricity and water -5.40 -1.46606 Construction products 37.21 0.11797 Trade and repair services 36.85 0.27278 Resort, hotel and restaurants 4.72 -0.11599 Transport services -25.75 -0.431010 Communication services -9.26 -0.278911 Financial services -3.28 -0.036112 Real estate 56.08 -1.2701

62
SUT SectorsTE-Capital % TE-Capital %
West Bank Gaza Strip13 Prof. & Tech Services 8.02 -0.036714 Admin & Support services 4.44 -0.042015 Education services -30.66 -0.259716 Health services -42.97 -0.701717 Other services -39.35 -0.0658
Note: TE Capital = (TE-nontrade – Basic Return Rate). TE=Tariff equivalent. Source: Table 3.
Positive values of the TE implies the excess rents on capital, i.e., abnormal profits being made by certain economic activities due to structural constraints. Negative values show inefficiencies across economic activities which are operating below basic return rate. Their operation will not survive without public support. Correcting these distortions would have positive fiscal implications for the PA economy.
The TE-capital results for West Bank show that Real Estate (56.08 percent), and Construction (37.2 have very high TE-capital (excess rate). Whilst, Wholesale Trade and Repair sector also shows an excess rate of 36.85 percent.
While it is difficult to specifically attribute these results to any particular external or internal constraint, the occurrence of the excess return rates may be related broadly to (i) problems with access to land (shortage of land), and (ii) costly procedures for obtaining construction permits. The former is being affected by the externally imposed restriction to access land – e.g., Area C is restricted, and whatever land that is available for housing development still requires clearance for which the local developers have to deal with IL authorities. There is strong demand for residential and also commercial properties67. It is generally perceived that Industrial development is handicapped by a combination of trade impediments and unavailability of industrial plots at viable prices.
As to obtaining construction permits, dealing with construction permits requires 17 procedures, takes 108 days and costs about $17,000, (18.6 percent of the warehouse value), according to Doing Business 2016. The service sector activities such as Trade and Repair (32 percent) and Public support services (6 percent) also enjoy excess returns above the basic return rate due to internal institutional and regulatory constraints that undermines competition.
Several of the public service activities such as Health (-42.96 percent), Education (-30.65 percent), Transport (-25.75 percent), Communications (-9.26 percent) and Electricity and water (-5.40 percent) show negative return rates, followed by Manufacturing (-5.20 percent) and Mining (-3.20) implying their weak competitive advantage. These activities will not survive without public budgetary support.
The TE- capital for Gaza Strip show a distinct situation in some sectors. Agriculture (52.79 percent), Internal Trade and Repair (27.27 percent), Construction (11.79 percent) and Mining activities (10.74 percent) follow the high rent on capital trend. Public services like Electricity and Water (-146.6 percent), Health Services (-70.17 percent), Transport (-43.1 percent), Communications (-27.89 percent), Education (-25.97 percent), and Manufacturing (-13.28 percent), show negative TE-Capital – i.e., operating below basic return rate like in West Bank. Low wage rate and subsidies seem to have influenced the Agriculture related TE-capital in Gaza Strip. The activities with 67 World Bank, The Economic Effects of Restricted Access to Land in the West Bank, The World Bank, Washington, DC.
Pros
pect
s for
Gro
wth
and
Jobs
in th
e Pale
stin
ian E
cono
my
63
negative TEs imply their un-competitiveness, and heavy dependence on public sector support. Given the small size of the market and externally imposed restrictions, even otherwise lucrative Real Estate (-127.01 percent) and hotel and restaurants (-11.59 percent) activities seem to be operating below basic rate of return in 2014. The effect of external and internal constraints in Gaza Strip seem more severe than that in West Bank.
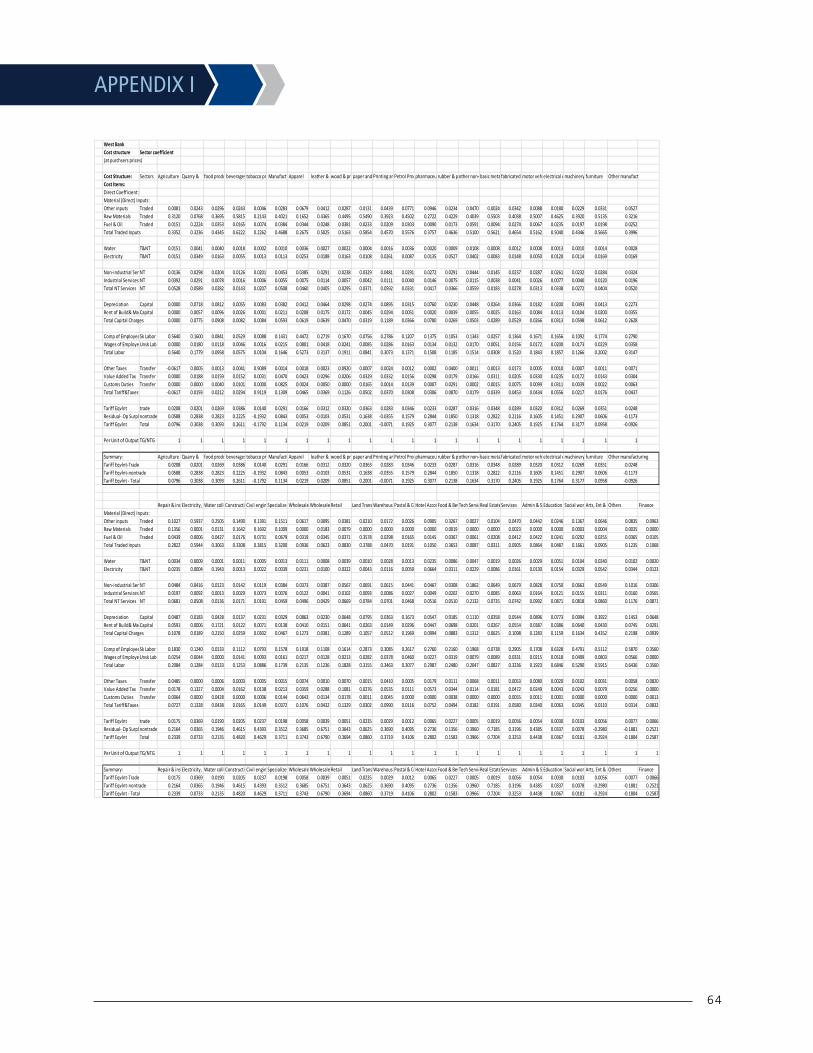
64
APPENDIX I
62
APPENDIX I
West BankCost structure Sector coefficient(at purchsers prices)
Cost Structure: Sectors Agriculture Quarry & food products beverages tobacco products Manufact textilesApparel leather & related products wood & products of wood, cork, etc. paper and paper products Printing and reproduction (media) Petrol Prodctspharmaceutical products rubber & plastics products other non-metallic mineral products basic metalsfabricated metal products motor vehicles, trailerselectrical equipment machinery and equipment n.e.c. furniture Other manufactCost Items:Direct Coefficient:Material (Direct) Inputs:Other inputs Traded 0.0081 0.0243 0.0296 0.0243 0.0046 0.0283 0.0679 0.0412 0.0287 0.0131 0.0439 0.0771 0.0946 0.0234 0.0470 0.0024 0.0342 0.0088 0.0180 0.0229 0.0331 0.0527Raw Materials Traded 0.3120 0.0768 0.3695 0.5815 0.2143 0.4021 0.1652 0.4365 0.4495 0.5490 0.3923 0.4502 0.2722 0.4229 0.4039 0.5503 0.4038 0.5007 0.4625 0.3920 0.5135 0.3216Fuel & Oil Traded 0.0151 0.2224 0.0353 0.0165 0.0074 0.0384 0.0344 0.0248 0.0381 0.0233 0.0209 0.0303 0.0090 0.0173 0.0591 0.0094 0.0274 0.0067 0.0235 0.0197 0.0198 0.0252Total Traded Inputs 0.3352 0.3236 0.4345 0.6222 0.2262 0.4688 0.2675 0.5025 0.5163 0.5854 0.4570 0.5576 0.3757 0.4636 0.5100 0.5621 0.4654 0.5162 0.5040 0.4346 0.5665 0.3996
Water T&NT 0.0151 0.0041 0.0040 0.0018 0.0002 0.0010 0.0036 0.0027 0.0022 0.0004 0.0016 0.0036 0.0020 0.0009 0.0108 0.0008 0.0012 0.0008 0.0013 0.0010 0.0014 0.0028Electricity T&NT 0.0151 0.0349 0.0163 0.0055 0.0013 0.0113 0.0253 0.0188 0.0163 0.0108 0.0261 0.0087 0.0135 0.0527 0.0402 0.0083 0.0148 0.0050 0.0120 0.0114 0.0169 0.0169
Non-industrial ServicesNT 0.0136 0.0298 0.0204 0.0126 0.0201 0.0453 0.0385 0.0291 0.0238 0.0329 0.0481 0.0291 0.0272 0.0291 0.0444 0.0145 0.0237 0.0287 0.0261 0.0232 0.0284 0.0324Industrial Services NT 0.0392 0.0291 0.0078 0.0016 0.0006 0.0055 0.0075 0.0114 0.0057 0.0042 0.0111 0.0040 0.0146 0.0075 0.0115 0.0038 0.0041 0.0026 0.0077 0.0040 0.0120 0.0196Total NT Services NT 0.0528 0.0589 0.0282 0.0143 0.0207 0.0508 0.0460 0.0405 0.0295 0.0371 0.0592 0.0331 0.0417 0.0366 0.0559 0.0183 0.0278 0.0313 0.0338 0.0272 0.0404 0.0520
Depreciation Capital 0.0000 0.0718 0.0812 0.0055 0.0083 0.0382 0.0412 0.0464 0.0298 0.0274 0.0895 0.0315 0.0760 0.0230 0.0448 0.0264 0.0366 0.0182 0.0200 0.0493 0.0413 0.2273Rent of Build& Mach. Capital 0.0000 0.0057 0.0096 0.0026 0.0001 0.0211 0.0208 0.0175 0.0172 0.0045 0.0294 0.0051 0.0020 0.0039 0.0055 0.0025 0.0163 0.0084 0.0113 0.0104 0.0200 0.0355Total Capital Charges 0.0000 0.0775 0.0908 0.0082 0.0084 0.0593 0.0619 0.0639 0.0470 0.0319 0.1189 0.0366 0.0780 0.0269 0.0503 0.0289 0.0529 0.0266 0.0313 0.0598 0.0612 0.2628
Comp of EmployeesSk Labor 0.5640 0.1600 0.0841 0.0529 0.0088 0.1431 0.4472 0.2719 0.1670 0.0756 0.2786 0.1207 0.1375 0.1053 0.1343 0.0257 0.1364 0.1671 0.1656 0.1092 0.1774 0.2790Wages of EmployeesUnsk Lab 0.0000 0.0180 0.0118 0.0046 0.0016 0.0215 0.0801 0.0418 0.0241 0.0085 0.0286 0.0163 0.0134 0.0132 0.0170 0.0051 0.0156 0.0172 0.0200 0.0173 0.0229 0.0358Total Labor 0.5640 0.1779 0.0958 0.0575 0.0104 0.1646 0.5273 0.3137 0.1911 0.0841 0.3073 0.1371 0.1508 0.1185 0.1514 0.0308 0.1520 0.1843 0.1857 0.1266 0.2002 0.3147
Other Taxes Transfer -0.0617 0.0005 0.0013 0.0041 0.9089 0.0014 0.0018 0.0023 0.0920 0.0007 0.0024 0.0012 0.0002 0.0400 0.0011 0.0013 0.0173 0.0005 0.0010 0.0007 0.0011 0.0071Value Added Tax Transfer 0.0000 0.0188 0.0159 0.0152 0.0031 0.0470 0.0423 0.0296 0.0206 0.0329 0.0332 0.0156 0.0298 0.0179 0.0166 0.0311 0.0205 0.0330 0.0235 0.0172 0.0143 0.0304Customs Duties Transfer 0.0000 0.0000 0.0040 0.0101 0.0000 0.0825 0.0024 0.0050 0.0000 0.0165 0.0014 0.0139 0.0007 0.0291 0.0002 0.0015 0.0075 0.0099 0.0311 0.0039 0.0022 0.0063Total Tariff&Taxes -0.0617 0.0193 0.0212 0.0294 0.9119 0.1309 0.0465 0.0369 0.1126 0.0502 0.0370 0.0308 0.0306 0.0870 0.0179 0.0339 0.0453 0.0434 0.0556 0.0217 0.0176 0.0437
Tariff Eqvlnt trade 0.0208 0.0201 0.0269 0.0386 0.0140 0.0291 0.0166 0.0312 0.0320 0.0363 0.0283 0.0346 0.0233 0.0287 0.0316 0.0348 0.0289 0.0320 0.0312 0.0269 0.0351 0.0248Residual- Op Surplusnontrade 0.0588 0.2838 0.2823 0.2225 -0.1932 0.0843 0.0053 -0.0103 0.0531 0.1638 -0.0355 0.1579 0.2844 0.1850 0.1318 0.2822 0.2116 0.1605 0.1451 0.2907 0.0606 -0.1173Tariff Eqvlnt Total 0.0796 0.3038 0.3093 0.2611 -0.1792 0.1134 0.0219 0.0209 0.0851 0.2001 -0.0071 0.1925 0.3077 0.2138 0.1634 0.3170 0.2405 0.1925 0.1764 0.3177 0.0958 -0.0926
Per Unit of Output TG/NTG 1 1 1 1 1 1 1 1 1 1 1 1 1 1 1 1 1 1 1 1 1 1
Summary: Agriculture Quarry & food products beverages tobacco products ManufacturingApparel leather & related products wood & products of wood, cork, etc. paper and paper products Printing and reproduction (media) Petrol Prodctspharmaceutical products rubber & plastics products other non-metallic mineral products basic metalsfabricated metal products motor vehicles, trailerselectrical equipment machinery and equipment n.e.c. furniture Other manufacturing Tariff Eqvlnt-Trade 0.0208 0.0201 0.0269 0.0386 0.0140 0.0291 0.0166 0.0312 0.0320 0.0363 0.0283 0.0346 0.0233 0.0287 0.0316 0.0348 0.0289 0.0320 0.0312 0.0269 0.0351 0.0248Tariff Eqvlnt-nontrade 0.0588 0.2838 0.2823 0.2225 -0.1932 0.0843 0.0053 -0.0103 0.0531 0.1638 -0.0355 0.1579 0.2844 0.1850 0.1318 0.2822 0.2116 0.1605 0.1451 0.2907 0.0606 -0.1173Tariff Eqvlnt - Total 0.0796 0.3038 0.3093 0.2611 -0.1792 0.1134 0.0219 0.0209 0.0851 0.2001 -0.0071 0.1925 0.3077 0.2138 0.1634 0.3170 0.2405 0.1925 0.1764 0.3177 0.0958 -0.0926
Repair & install Electricity, Gas, etcWater collection treatment and supplyConstruction of buildingsCivil engineeringSpecialized constructionWholesale, retail and Motor repairWholesale & RetailRetail Land TransportWarehousing& trans SupportPostal & CourierHotel AccomodationFood & BeveragesTech ServicesReal EstateServices Admin & SupportEducation Social workArts, Ent & SportsOthers FinanceMaterial (Direct) Inputs:Other inputs Traded 0.1027 0.5937 0.2505 0.1490 0.1391 0.1511 0.0617 0.0095 0.0381 0.0210 0.0172 0.0026 0.0905 0.3267 0.0027 0.0104 0.0470 0.0442 0.0246 0.1367 0.0646 0.0835 0.0963Raw Materials Traded 0.1356 0.0001 0.0131 0.1642 0.1692 0.1009 0.0000 0.0183 0.0079 0.0000 0.0000 0.0000 0.0000 0.0019 0.0000 0.0000 0.0023 0.0000 0.0000 0.0003 0.0004 0.0035 0.0000Fuel & Oil Traded 0.0439 0.0006 0.0427 0.0176 0.0731 0.0679 0.0319 0.0345 0.0371 0.3578 0.0298 0.0165 0.0145 0.0367 0.0061 0.0208 0.0412 0.0422 0.0241 0.0292 0.0255 0.0365 0.0105Total Traded Inputs 0.2822 0.5944 0.3063 0.3308 0.3815 0.3200 0.0936 0.0623 0.0830 0.3788 0.0470 0.0191 0.1050 0.3653 0.0087 0.0311 0.0905 0.0864 0.0487 0.1661 0.0905 0.1235 0.1068
Water T&NT 0.0034 0.0009 0.0001 0.0011 0.0005 0.0013 0.0111 0.0008 0.0039 0.0010 0.0028 0.0013 0.0235 0.0086 0.0047 0.0019 0.0026 0.0029 0.0051 0.0104 0.0240 0.0102 0.0020Electricity T&NT 0.0235 0.0004 0.1943 0.0013 0.0022 0.0039 0.0231 0.0100 0.0322 0.0043 0.0116 0.0059 0.0664 0.0311 0.0229 0.0086 0.0161 0.0130 0.0154 0.0329 0.0542 0.0344 0.0123
Non-industrial ServicesNT 0.0484 0.0416 0.0123 0.0142 0.0119 0.0384 0.0373 0.0387 0.0567 0.0691 0.0615 0.0441 0.0467 0.0308 0.1862 0.0649 0.0679 0.0828 0.0750 0.0663 0.0549 0.1016 0.0306Industrial Services NT 0.0197 0.0092 0.0013 0.0029 0.0073 0.0076 0.0122 0.0041 0.0102 0.0093 0.0086 0.0027 0.0049 0.0202 0.0270 0.0085 0.0063 0.0164 0.0121 0.0155 0.0311 0.0160 0.0565Total NT Services NT 0.0681 0.0508 0.0136 0.0171 0.0191 0.0459 0.0496 0.0429 0.0669 0.0784 0.0701 0.0468 0.0516 0.0510 0.2132 0.0735 0.0742 0.0992 0.0871 0.0818 0.0860 0.1176 0.0871
Depreciation Capital 0.0487 0.0183 0.0428 0.0137 0.0231 0.0329 0.0863 0.0230 0.0648 0.0795 0.0363 0.1673 0.0547 0.0185 0.1110 0.0358 0.0544 0.0896 0.0773 0.0994 0.3922 0.1453 0.0648Rent of Build& Mach. Capital 0.0591 0.0006 0.1721 0.0122 0.0071 0.0138 0.0410 0.0151 0.0641 0.0263 0.0149 0.0296 0.0447 0.0698 0.0201 0.0267 0.0554 0.0387 0.0386 0.0640 0.0430 0.0745 0.0291Total Capital Charges 0.1078 0.0189 0.2150 0.0259 0.0302 0.0467 0.1273 0.0381 0.1289 0.1057 0.0512 0.1969 0.0994 0.0883 0.1312 0.0625 0.1098 0.1283 0.1159 0.1634 0.4352 0.2198 0.0939
Comp of EmployeesSk Labor 0.1830 0.1240 0.0133 0.1112 0.0793 0.1578 0.1918 0.1108 0.1614 0.2873 0.3085 0.2617 0.2760 0.2160 0.1968 0.0738 0.2905 0.1708 0.6328 0.4791 0.5112 0.5870 0.3560Wages of EmployeesUnsk Lab 0.0254 0.0044 0.0000 0.0141 0.0093 0.0161 0.0217 0.0128 0.0213 0.0282 0.0378 0.0460 0.0227 0.0319 0.0079 0.0089 0.0331 0.0215 0.0518 0.0499 0.0803 0.0566 0.0000Total Labor 0.2084 0.1284 0.0133 0.1253 0.0886 0.1739 0.2135 0.1236 0.1828 0.3155 0.3463 0.3077 0.2987 0.2480 0.2047 0.0827 0.3236 0.1923 0.6846 0.5290 0.5915 0.6436 0.3560
Other Taxes Transfer 0.0485 0.0000 0.0006 0.0003 0.0005 0.0015 0.0074 0.0010 0.0070 0.0015 0.0410 0.0005 0.0179 0.0111 0.0068 0.0011 0.0053 0.0080 0.0020 0.0102 0.0031 0.0058 0.0820Value Added Tax Transfer 0.0178 0.1327 0.0004 0.0162 0.0138 0.0213 0.0359 0.0288 0.1081 0.0276 0.0535 0.0111 0.0573 0.0344 0.0114 0.0181 0.0472 0.0249 0.0043 0.0243 0.0079 0.0256 0.0000Customs Duties Transfer 0.0064 0.0000 0.0428 0.0000 0.0006 0.0144 0.0643 0.0134 0.0178 0.0011 0.0045 0.0000 0.0000 0.0038 0.0000 0.0000 0.0055 0.0011 0.0001 0.0000 0.0000 0.0000 0.0013Total Tariff&Taxes 0.0727 0.1328 0.0438 0.0165 0.0149 0.0372 0.1076 0.0432 0.1329 0.0302 0.0990 0.0116 0.0752 0.0494 0.0182 0.0191 0.0580 0.0340 0.0063 0.0345 0.0110 0.0314 0.0832
Tariff Eqvlnt trade 0.0175 0.0369 0.0190 0.0205 0.0237 0.0198 0.0058 0.0039 0.0051 0.0235 0.0029 0.0012 0.0065 0.0227 0.0005 0.0019 0.0056 0.0054 0.0030 0.0103 0.0056 0.0077 0.0066Residual- Op Surplusnontrade 0.2164 0.0365 0.1946 0.4615 0.4393 0.3512 0.3685 0.6751 0.3643 0.0625 0.3690 0.4095 0.2736 0.1356 0.3960 0.7185 0.3196 0.4385 0.0337 0.0078 -0.2980 -0.1881 0.2521Tariff Eqvlnt Total 0.2339 0.0733 0.2135 0.4820 0.4629 0.3711 0.3743 0.6790 0.3694 0.0860 0.3719 0.4106 0.2802 0.1583 0.3966 0.7204 0.3253 0.4438 0.0367 0.0181 -0.2924 -0.1804 0.2587
Per Unit of Output TG/NTG 1 1 1 1 1 1 1 1 1 1 1 1 1 1 1 1 1 1 1 1 1 1 1
Summary: Repair & install Electricity, Gas, etcWater collection treatment and supplyConstruction of buildingsCivil engineeringSpecialized constructionWholesale, retail and Motor repairWholesale & RetailRetail Land TransportWarehousing& trans SupportPostal & CourierHotel AccomodationFood & BeveragesTech ServicesReal EstateServices Admin & SupportEducation Social workArts, Ent & SportsOthers FinanceTariff Eqvlnt-Trade 0.0175 0.0369 0.0190 0.0205 0.0237 0.0198 0.0058 0.0039 0.0051 0.0235 0.0029 0.0012 0.0065 0.0227 0.0005 0.0019 0.0056 0.0054 0.0030 0.0103 0.0056 0.0077 0.0066Tariff Eqvlnt-nontrade 0.2164 0.0365 0.1946 0.4615 0.4393 0.3512 0.3685 0.6751 0.3643 0.0625 0.3690 0.4095 0.2736 0.1356 0.3960 0.7185 0.3196 0.4385 0.0337 0.0078 -0.2980 -0.1881 0.2521Tariff Eqvlnt - Total 0.2339 0.0733 0.2135 0.4820 0.4629 0.3711 0.3743 0.6790 0.3694 0.0860 0.3719 0.4106 0.2802 0.1583 0.3966 0.7204 0.3253 0.4438 0.0367 0.0181 -0.2924 -0.1804 0.2587
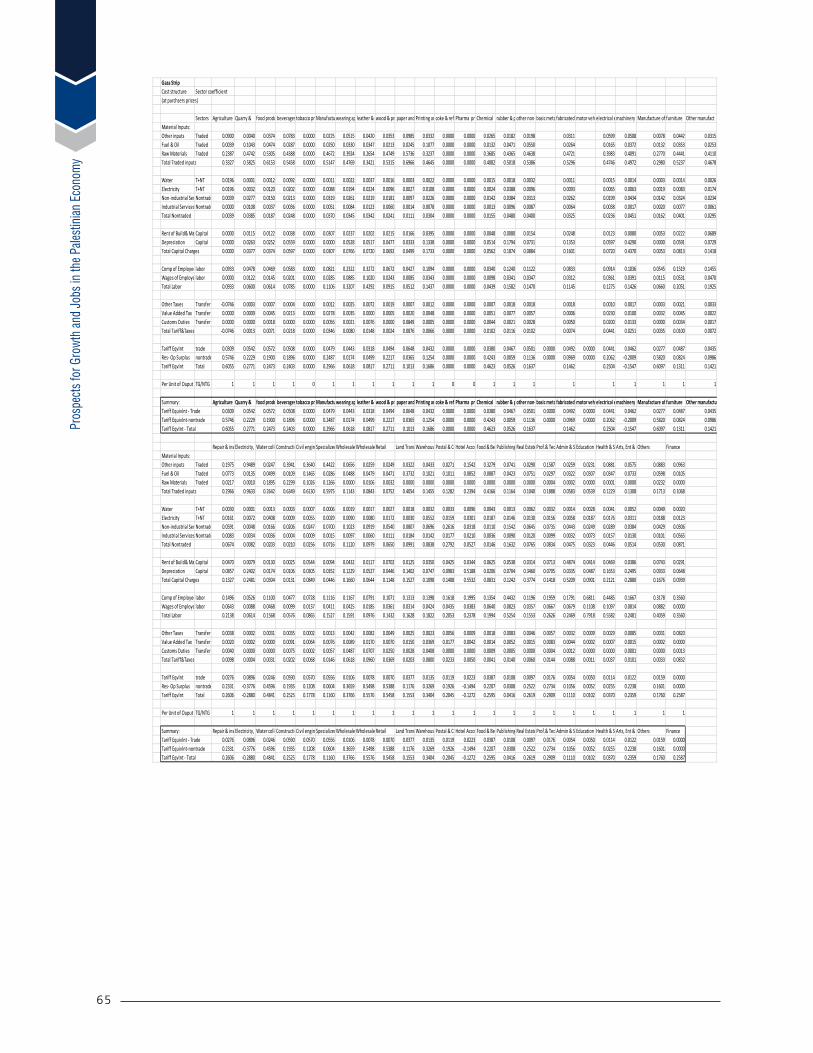
Pros
pect
s for
Gro
wth
and
Jobs
in th
e Pale
stin
ian E
cono
my
65
63
Gaza StripCost structure Sector coefficient(at purchsers prices)
Sectors Agriculture Quarry & food products beverages tobacco productsManufacture of textiles wearing apparel leather & related products wood & products of wood, cork, etc. paper and paper products Printing and reproduction (media) coke & refined petroleum products Pharma products Chemical rubber & plastics products other non-metallic mineral products basic metalsfabricated metal products motor vehicles, trailerselectrical equipment machinery and equipment n.e.c. Manufacture of transport equipmentfurniture Other manufactMaterial Inputs:Other inputs Traded 0.0900 0.0040 0.0374 0.0783 0.0000 0.0225 0.0515 0.0420 0.0353 0.0985 0.0332 0.0000 0.0000 0.0265 0.0182 0.0198 0.0311 0.0599 0.0508 0.0078 0.0442 0.0315Fuel & Oil Traded 0.0039 0.1043 0.0474 0.0287 0.0000 0.0250 0.0330 0.0347 0.0213 0.0245 0.1077 0.0000 0.0000 0.0132 0.0471 0.0550 0.0264 0.0165 0.0372 0.0132 0.0353 0.0253Raw Materials Traded 0.2387 0.4742 0.5305 0.4388 0.0000 0.4672 0.3924 0.2654 0.4749 0.5736 0.3237 0.0000 0.0000 0.3685 0.4365 0.4638 0.4721 0.3983 0.4091 0.2770 0.4441 0.4110Total Traded inputs 0.3327 0.5825 0.6153 0.5458 0.0000 0.5147 0.4769 0.3421 0.5315 0.6966 0.4645 0.0000 0.0000 0.4082 0.5018 0.5386 0.5296 0.4746 0.4972 0.2980 0.5237 0.4678
Water T+NT 0.0196 0.0001 0.0012 0.0092 0.0000 0.0011 0.0022 0.0037 0.0016 0.0003 0.0022 0.0000 0.0000 0.0015 0.0018 0.0032 0.0011 0.0015 0.0014 0.0003 0.0014 0.0026Electricity T+NT 0.0196 0.0032 0.0120 0.0202 0.0000 0.0088 0.0194 0.0224 0.0096 0.0027 0.0108 0.0000 0.0000 0.0024 0.0388 0.0096 0.0093 0.0065 0.0063 0.0019 0.0083 0.0174Non-industrial ServicesNontraded 0.0039 0.0277 0.0150 0.0213 0.0000 0.0319 0.0261 0.0219 0.0181 0.0097 0.0226 0.0000 0.0000 0.0142 0.0384 0.0313 0.0262 0.0199 0.0434 0.0142 0.0324 0.0234Industrial Services Nontraded 0.0000 0.0108 0.0037 0.0036 0.0000 0.0051 0.0084 0.0123 0.0060 0.0014 0.0078 0.0000 0.0000 0.0013 0.0096 0.0087 0.0064 0.0038 0.0017 0.0020 0.0077 0.0061Total Nontraded 0.0039 0.0385 0.0187 0.0248 0.0000 0.0370 0.0345 0.0342 0.0241 0.0111 0.0304 0.0000 0.0000 0.0155 0.0480 0.0400 0.0325 0.0236 0.0451 0.0162 0.0401 0.0295
Rent of Build& Mach. Capital 0.0000 0.0115 0.0122 0.0038 0.0000 0.0307 0.0237 0.0202 0.0215 0.0166 0.0395 0.0000 0.0000 0.0048 0.0080 0.0154 0.0248 0.0123 0.0080 0.0053 0.0222 0.0689Depreciation Capital 0.0000 0.0263 0.0252 0.0559 0.0000 0.0000 0.0528 0.0517 0.0477 0.0333 0.1338 0.0000 0.0000 0.0514 0.1794 0.0731 0.1353 0.0597 0.4290 0.0000 0.0591 0.0729Total Capital Charges 0.0000 0.0377 0.0374 0.0597 0.0000 0.0307 0.0766 0.0720 0.0692 0.0499 0.1733 0.0000 0.0000 0.0562 0.1874 0.0884 0.1601 0.0720 0.4370 0.0053 0.0813 0.1418
Comp of Employeeslabor 0.0933 0.0478 0.0469 0.0583 0.0000 0.0821 0.2322 0.3272 0.0672 0.0427 0.1094 0.0000 0.0000 0.0340 0.1240 0.1122 0.0833 0.0914 0.1036 0.0545 0.1519 0.1455Wages of Employeeslabor 0.0000 0.0122 0.0145 0.0201 0.0000 0.0285 0.0885 0.1020 0.0243 0.0085 0.0343 0.0000 0.0000 0.0098 0.0341 0.0347 0.0312 0.0361 0.0391 0.0115 0.0531 0.0470Total Labor 0.0933 0.0600 0.0614 0.0785 0.0000 0.1106 0.3207 0.4292 0.0915 0.0512 0.1437 0.0000 0.0000 0.0439 0.1582 0.1470 0.1145 0.1275 0.1426 0.0660 0.2051 0.1925
Other Taxes Transfer -0.0746 0.0003 0.0007 0.0004 0.0000 0.0012 0.0025 0.0072 0.0019 0.0007 0.0012 0.0000 0.0000 0.0007 0.0018 0.0018 0.0018 0.0010 0.0017 0.0003 0.0021 0.0033Value Added Tax Transfer 0.0000 0.0009 0.0045 0.0213 0.0000 0.0278 0.0035 0.0000 0.0005 0.0020 0.0048 0.0000 0.0000 0.0051 0.0077 0.0057 0.0006 0.0230 0.0100 0.0032 0.0045 0.0022Customs Duties Transfer 0.0000 0.0000 0.0018 0.0000 0.0000 0.0056 0.0021 0.0076 0.0000 0.0849 0.0005 0.0000 0.0000 0.0044 0.0021 0.0028 0.0050 0.0200 0.0133 0.0000 0.0034 0.0017Total Tariff&Taxes -0.0746 0.0013 0.0071 0.0218 0.0000 0.0346 0.0080 0.0148 0.0024 0.0876 0.0066 0.0000 0.0000 0.0102 0.0116 0.0102 0.0074 0.0441 0.0251 0.0035 0.0100 0.0072
Tariff Eqvlnt trade 0.0309 0.0542 0.0572 0.0508 0.0000 0.0479 0.0443 0.0318 0.0494 0.0648 0.0432 0.0000 0.0000 0.0380 0.0467 0.0501 0.0000 0.0492 0.0000 0.0441 0.0462 0.0277 0.0487 0.0435Res- Op Surplus nontrade 0.5746 0.2229 0.1900 0.1896 0.0000 0.2487 0.0174 0.0499 0.2217 0.0365 0.1254 0.0000 0.0000 0.4243 0.0059 0.1136 0.0000 0.0969 0.0000 0.2062 -0.2009 0.5820 0.0824 0.0986Tariff Eqvlnt Total 0.6055 0.2771 0.2473 0.2403 0.0000 0.2966 0.0618 0.0817 0.2711 0.1013 0.1686 0.0000 0.0000 0.4623 0.0526 0.1637 0.1462 0.2504 -0.1547 0.6097 0.1311 0.1421
Per Unit of Ouput TG/NTG 1 1 1 1 0 1 1 1 1 1 1 0 0 1 1 1 1 1 1 1 1 1
Summary: Agriculture Quarry & food products beverages tobacco productsManufacture of textiles wearing apparel leather & related products wood & products of wood, cork, etc. paper and paper products Printing and reproduction (media) coke & refined petroleum products Pharma products Chemical rubber & plastics products other non-metallic mineral products basic metalsfabricated metal products motor vehicles, trailerselectrical equipment machinery and equipment n.e.c. Manufacture of transport equipmentfurniture Other manufacturing Tariff Equivlnt - Trade 0.0309 0.0542 0.0572 0.0508 0.0000 0.0479 0.0443 0.0318 0.0494 0.0648 0.0432 0.0000 0.0000 0.0380 0.0467 0.0501 0.0000 0.0492 0.0000 0.0441 0.0462 0.0277 0.0487 0.0435Tariff Equivlnt-nontrade 0.5746 0.2229 0.1900 0.1896 0.0000 0.2487 0.0174 0.0499 0.2217 0.0365 0.1254 0.0000 0.0000 0.4243 0.0059 0.1136 0.0000 0.0969 0.0000 0.2062 -0.2009 0.5820 0.0824 0.0986Tariff Eqvlnt - Total 0.6055 0.2771 0.2473 0.2403 0.0000 0.2966 0.0618 0.0817 0.2711 0.1013 0.1686 0.0000 0.0000 0.4623 0.0526 0.1637 0.1462 0.2504 -0.1547 0.6097 0.1311 0.1421
Repair & install Electricity, Gas, etcWater collection treatment and supplyConstruction of buildingsCivil engineeringSpecialized constructionWholesale, retail and Motor repairWholesale & RetailRetail Land TransportWarehousing& trans SupportPostal & CourierHotel AccomodationFood & BeveragesPublishing Activities, ICTReal EstateProf.& TechnicalAdmin & SupportEducation Health & Social workArts, Ent & SportsOthers FinanceMaterial Inputs:Other inputs Traded 0.1975 0.9489 0.0247 0.3941 0.3640 0.4422 0.0656 0.0259 0.0249 0.0322 0.0433 0.0271 0.1542 0.3279 0.0741 0.0290 0.1587 0.0259 0.0231 0.0881 0.0575 0.0883 0.0963Fuel & Oil Traded 0.0773 0.0135 0.0499 0.0109 0.1465 0.0286 0.0488 0.0479 0.0471 0.3732 0.1021 0.1011 0.0852 0.0887 0.0423 0.0751 0.0297 0.0322 0.0307 0.0347 0.0733 0.0598 0.0105Raw Materials Traded 0.0217 0.0010 0.1895 0.2299 0.1026 0.1266 0.0000 0.0106 0.0032 0.0000 0.0000 0.0000 0.0000 0.0000 0.0000 0.0000 0.0004 0.0002 0.0000 0.0001 0.0000 0.0232 0.0000Total Traded inputs 0.2966 0.9633 0.2642 0.6349 0.6130 0.5975 0.1143 0.0843 0.0752 0.4054 0.1455 0.1282 0.2394 0.4166 0.1164 0.1040 0.1888 0.0583 0.0539 0.1229 0.1308 0.1713 0.1068
Water T+NT 0.0030 0.0001 0.0013 0.0003 0.0007 0.0006 0.0019 0.0017 0.0027 0.0018 0.0032 0.0033 0.0096 0.0043 0.0013 0.0062 0.0032 0.0014 0.0028 0.0041 0.0052 0.0049 0.0020Electricity T+NT 0.0161 0.0072 0.0408 0.0009 0.0055 0.0029 0.0090 0.0080 0.0172 0.0030 0.0552 0.0159 0.0301 0.0187 0.0146 0.0130 0.0156 0.0058 0.0187 0.0176 0.0311 0.0188 0.0123Non-industrial ServicesNontraded 0.0591 0.0048 0.0166 0.0206 0.0247 0.0700 0.1023 0.0919 0.0540 0.0807 0.0696 0.2616 0.0318 0.0110 0.1542 0.0645 0.0735 0.0443 0.0249 0.0289 0.0384 0.0429 0.0306Industrial Services Nontraded 0.0083 0.0034 0.0036 0.0004 0.0009 0.0015 0.0097 0.0060 0.0111 0.0184 0.0142 0.0177 0.0210 0.0036 0.0090 0.0120 0.0099 0.0032 0.0073 0.0157 0.0130 0.0101 0.0565Total Nontraded 0.0674 0.0082 0.0203 0.0210 0.0256 0.0716 0.1120 0.0979 0.0650 0.0991 0.0838 0.2792 0.0527 0.0146 0.1632 0.0765 0.0834 0.0475 0.0323 0.0446 0.0514 0.0530 0.0871
Rent of Build& Mach. Capital 0.0470 0.0079 0.0130 0.0025 0.0544 0.0094 0.0432 0.0117 0.0702 0.0125 0.0350 0.0425 0.0344 0.0625 0.0538 0.0314 0.0713 0.4874 0.0414 0.0469 0.0386 0.0743 0.0291Depreciation Capital 0.0857 0.2402 0.0174 0.0106 0.0305 0.0352 0.1229 0.0527 0.0446 0.1402 0.0747 0.0983 0.5188 0.0206 0.0704 0.3460 0.0705 0.0335 0.0487 0.1653 0.2495 0.0933 0.0648Total Capital Charges 0.1327 0.2481 0.0304 0.0131 0.0849 0.0446 0.1660 0.0644 0.1148 0.1527 0.1098 0.1408 0.5532 0.0831 0.1242 0.3774 0.1418 0.5209 0.0901 0.2121 0.2880 0.1676 0.0939
Comp of Employeeslabor 0.1496 0.0526 0.1100 0.0477 0.0728 0.1116 0.1167 0.0791 0.1071 0.1313 0.1398 0.1618 0.1995 0.1354 0.4432 0.1196 0.1959 0.1791 0.6811 0.4485 0.1667 0.3178 0.3560Wages of Employeeslabor 0.0643 0.0088 0.0468 0.0099 0.0137 0.0411 0.0425 0.0185 0.0361 0.0314 0.0424 0.0435 0.0383 0.0640 0.0823 0.0357 0.0667 0.0679 0.1108 0.1097 0.0814 0.0882 0.0000Total Labor 0.2138 0.0614 0.1568 0.0576 0.0865 0.1527 0.1591 0.0976 0.1432 0.1628 0.1822 0.2053 0.2378 0.1994 0.5254 0.1553 0.2626 0.2469 0.7918 0.5582 0.2481 0.4059 0.3560
Other Taxes Transfer 0.0038 0.0002 0.0031 0.0035 0.0002 0.0013 0.0042 0.0082 0.0049 0.0025 0.0023 0.0056 0.0009 0.0018 0.0083 0.0046 0.0057 0.0032 0.0009 0.0029 0.0085 0.0031 0.0820Value Added Tax Transfer 0.0020 0.0002 0.0000 0.0091 0.0064 0.0076 0.0089 0.0170 0.0070 0.0150 0.0369 0.0177 0.0042 0.0014 0.0052 0.0015 0.0083 0.0044 0.0002 0.0007 0.0015 0.0002 0.0000Customs Duties Transfer 0.0040 0.0000 0.0000 0.0075 0.0002 0.0057 0.0487 0.0707 0.0250 0.0028 0.0408 0.0000 0.0000 0.0009 0.0005 0.0000 0.0004 0.0012 0.0000 0.0000 0.0001 0.0000 0.0013Total Tariff&Taxes 0.0098 0.0004 0.0031 0.0202 0.0068 0.0146 0.0618 0.0960 0.0369 0.0203 0.0800 0.0233 0.0050 0.0041 0.0140 0.0060 0.0144 0.0088 0.0011 0.0037 0.0101 0.0033 0.0832
Tariff Eqvlnt trade 0.0276 0.0896 0.0246 0.0590 0.0570 0.0556 0.0106 0.0078 0.0070 0.0377 0.0135 0.0119 0.0223 0.0387 0.0108 0.0097 0.0176 0.0054 0.0050 0.0114 0.0122 0.0159 0.0000Res- Op Surplus nontrade 0.2331 -0.3776 0.4596 0.1935 0.1208 0.0604 0.3659 0.5498 0.5388 0.1176 0.3269 0.1926 -0.1494 0.2207 0.0308 0.2522 0.2734 0.1056 0.0052 0.0255 0.2238 0.1601 0.0000Tariff Eqvlnt Total 0.2606 -0.2880 0.4841 0.2525 0.1778 0.1160 0.3766 0.5576 0.5458 0.1553 0.3404 0.2045 -0.1272 0.2595 0.0416 0.2619 0.2909 0.1110 0.0102 0.0370 0.2359 0.1760 0.2587
Per Unit of Ouput TG/NTG 1 1 1 1 1 1 1 1 1 1 1 1 1 1 1 1 1 1 1 1 1 1 1
Summary: Repair & install Electricity, Gas, etcWater collection treatment and supplyConstruction of buildingsCivil engineeringSpecialized constructionWholesale, retail and Motor repairWholesale & RetailRetail Land TransportWarehousing& trans SupportPostal & CourierHotel AccomodationFood & BeveragesPublishing Activities, ICTReal EstateProf.& TechnicalAdmin & SupportEducation Health & Social workArts, Ent & SportsOthers FinanceTariff Equivlnt - Trade 0.0276 0.0896 0.0246 0.0590 0.0570 0.0556 0.0106 0.0078 0.0070 0.0377 0.0135 0.0119 0.0223 0.0387 0.0108 0.0097 0.0176 0.0054 0.0050 0.0114 0.0122 0.0159 0.0000Tariff Equivlnt-nontrade 0.2331 -0.3776 0.4596 0.1935 0.1208 0.0604 0.3659 0.5498 0.5388 0.1176 0.3269 0.1926 -0.1494 0.2207 0.0308 0.2522 0.2734 0.1056 0.0052 0.0255 0.2238 0.1601 0.0000Tariff Eqvlnt - Total 0.2606 -0.2880 0.4841 0.2525 0.1778 0.1160 0.3766 0.5576 0.5458 0.1553 0.3404 0.2045 -0.1272 0.2595 0.0416 0.2619 0.2909 0.1110 0.0102 0.0370 0.2359 0.1760 0.2587
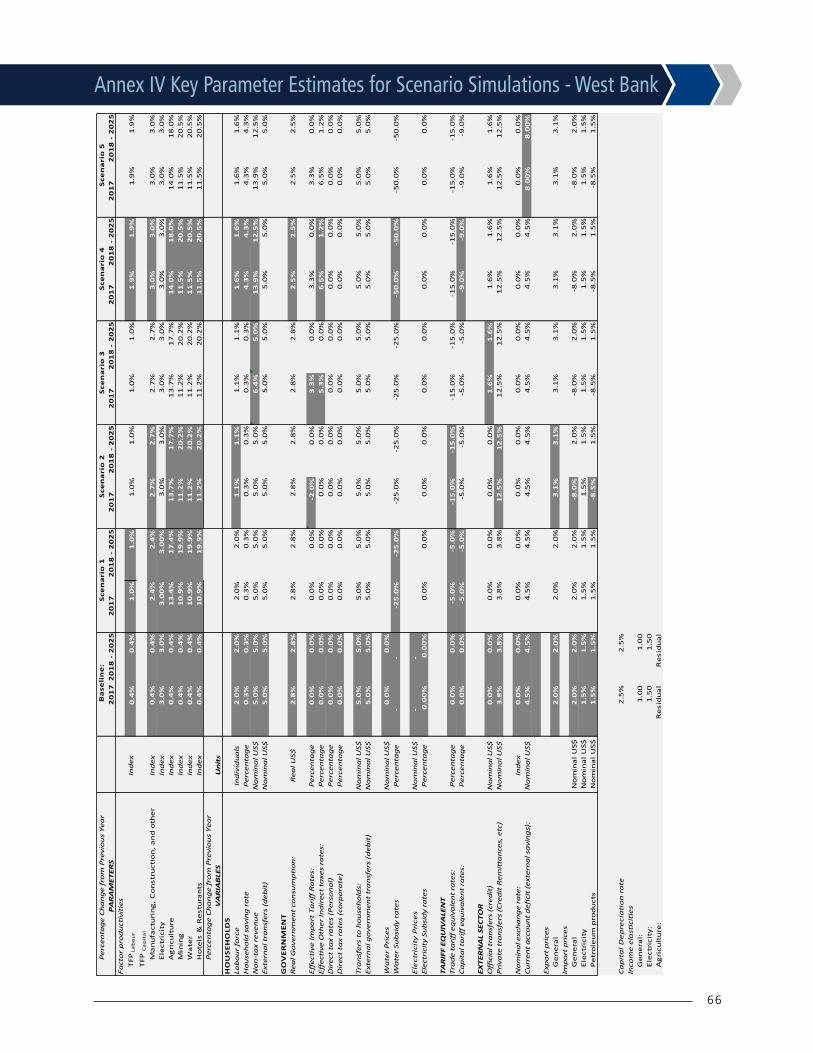
66
Annex IV Key Parameter Estimates for Scenario Simulations - West Bank
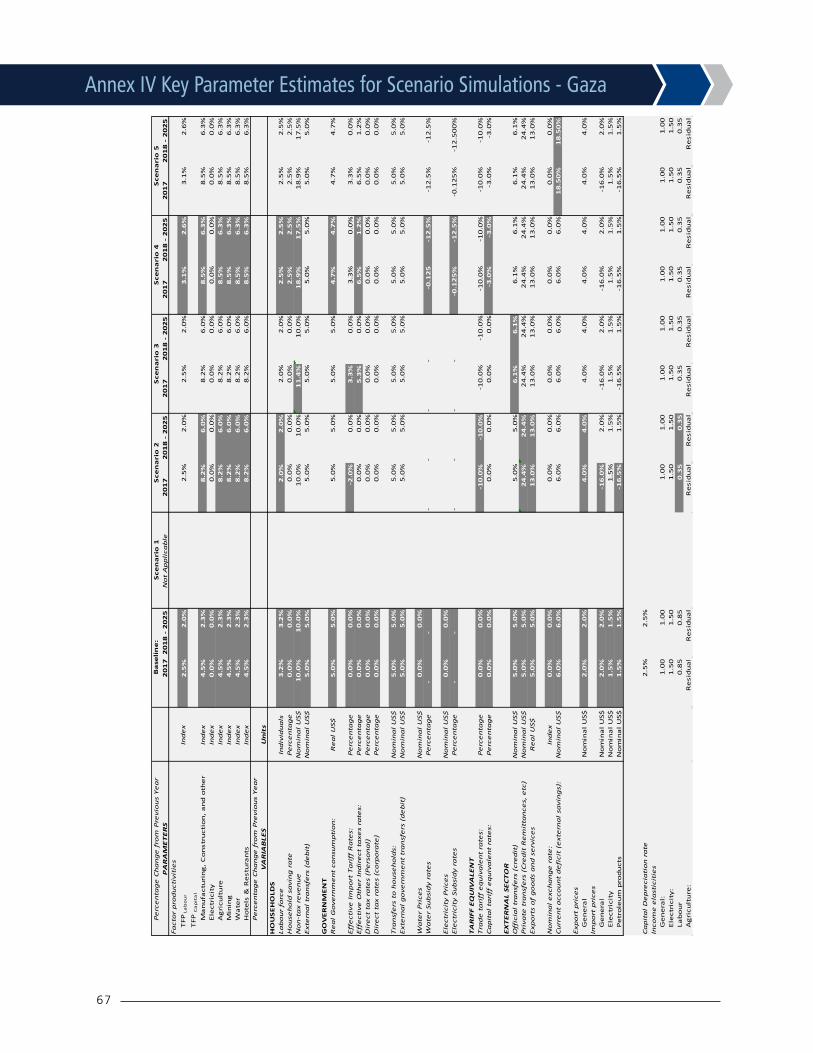
67
65
G
aza
Pe
rce
nta
ge
Ch
an
ge
fro
m P
revi
ou
s Y
ea
rS
cen
ari
o 1
PA
RA
ME
TE
RS
20
17
20
18
- 2
02
5N
ot
Ap
pli
cab
le2
01
72
01
8 -
20
25
20
17
20
18
- 2
02
52
01
72
01
8 -
20
25
20
17
20
18
- 2
02
5Fa
cto
r p
rod
uct
ivit
ies
TFP
La
bo
ur
Ind
ex
2.5
%2
.0%
2.5
%2
.0%
2.5
%2
.0%
3.1
%2
.6%
3.1
%2
.6%
TFP
Ca
pit
al
Ma
nu
fact
uri
ng
, C
on
stru
ctio
n,
an
d o
the
rIn
de
x4
.5%
2.3
%8
.2%
6.0
%8
.2%
6.0
%8
.5%
6.3
%8
.5%
6.3
%E
lect
rici
tyIn
de
x0
.0%
0.0
%0
.0%
0.0
%0
.0%
0.0
%0
.0%
0.0
%0
.0%
0.0
%A
gri
cult
ure
Ind
ex
4.5
%2
.3%
8.2
%6
.0%
8.2
%6
.0%
8.5
%6
.3%
8.5
%6
.3%
Min
ing
Ind
ex
4.5
%2
.3%
8.2
%6
.0%
8.2
%6
.0%
8.5
%6
.3%
8.5
%6
.3%
Wa
ter
Ind
ex
4.5
%2
.3%
8.2
%6
.0%
8.2
%6
.0%
8.5
%6
.3%
8.5
%6
.3%
Ho
tels
& R
est
ura
nts
Ind
ex
4.5
%2
.3%
8.2
%6
.0%
8.2
%6
.0%
8.5
%6
.3%
8.5
%6
.3%
Pe
rce
nta
ge
Ch
an
ge
fro
m P
revi
ou
s Y
ea
rV
AR
IAB
LES
Un
its
HO
US
EH
OLD
SLa
bo
ur
forc
eIn
div
idu
als
3.2
%3
.2%
2.0
%2
.0%
2.0
%2
.0%
2.5
%2
.5%
2.5
%2
.5%
Ho
use
ho
ld s
avi
ng
ra
teP
erc
en
tag
e0
.0%
0.0
%0
.0%
0.0
%0
.0%
0.0
%2
.5%
2.5
%2
.5%
2.5
%N
on
-ta
x re
ven
ue
No
min
al
US$
10
.0%
10
.0%
10
.0%
10
.0%
11
.4%
10
.0%
18
.9%
17
.5%
18
.9%
17
.5%
Ext
ern
al
tra
nsf
ers
(d
eb
it)
No
min
al
US$
5.0
%5
.0%
5.0
%5
.0%
5.0
%5
.0%
5.0
%5
.0%
5.0
%5
.0%
GO
VE
RN
ME
NT
Re
al
Go
vern
me
nt
con
sum
pti
on
: R
ea
l U
S$5
.0%
5.0
%5
.0%
5.0
%5
.0%
5.0
%4
.7%
4.7
%4
.7%
4.7
%
Eff
ect
ive
Im
po
rt T
ari
ff R
ate
s:
Pe
rce
nta
ge
0.0
%0
.0%
-2.0
%0
.0%
3.3
%0
.0%
3.3
%0
.0%
3.3
%0
.0%
Eff
ect
ive
Oth
er
Ind
ire
ct t
axe
s ra
tes:
P
erc
en
tag
e0
.0%
0.0
%0
.0%
0.0
%5
.3%
0.0
%6
.5%
1.2
%6
.5%
1.2
%D
ire
ct t
ax
rate
s (P
ers
on
al)
Pe
rce
nta
ge
0.0
%0
.0%
0.0
%0
.0%
0.0
%0
.0%
0.0
%0
.0%
0.0
%0
.0%
Dir
ect
ta
x ra
tes
(co
rpo
rate
)P
erc
en
tag
e0
.0%
0.0
%0
.0%
0.0
%0
.0%
0.0
%0
.0%
0.0
%0
.0%
0.0
%
Tra
nsf
ers
to
ho
use
ho
lds:
No
min
al
US$
5.0
%5
.0%
5.0
%5
.0%
5.0
%5
.0%
5.0
%5
.0%
5.0
%5
.0%
Ext
ern
al
go
vern
me
nt
tra
nsf
ers
(d
eb
it)
No
min
al
US$
5.0
%5
.0%
5.0
%5
.0%
5.0
%5
.0%
5.0
%5
.0%
5.0
%5
.0%
Wa
ter
Pri
ces
No
min
al
US$
0.0
%0
.0%
Wa
ter
Sub
sid
y ra
tes
Pe
rce
nta
ge
--
--
--
-0.1
25
-12
.5%
-12
.5%
-12
.5%
Ele
ctri
city
Pri
ces
No
min
al
US$
0.0
%0
.0%
Ele
ctri
city
Su
bsi
dy
rate
sP
erc
en
tag
e-
--
--
--0
.12
5%
-12
.5%
-0.1
25
%-1
2.5
00
%
TA
RIF
F E
QU
IVA
LEN
TT
rad
e t
ari
ff e
qu
iva
len
t ra
tes:
Pe
rce
nta
ge
0.0
%0
.0%
-10
.0%
-10
.0%
-10
.0%
-10
.0%
-10
.0%
-10
.0%
-10
.0%
-10
.0%
Ca
pit
al
tari
ff e
qu
iva
len
t ra
tes:
Pe
rce
nta
ge
0.0
%0
.0%
0.0
%0
.0%
0.0
%0
.0%
-3.0
%-3
.0%
-3.0
%-3
.0%
EX
TE
RN
AL
SEC
TO
RO
ffic
ial
tra
nsf
ers
(cr
ed
it)
No
min
al
US$
5.0
%5
.0%
5.0
%5
.0%
6.1
%6
.1%
6.1
%6
.1%
6.1
%6
.1%
Pri
vate
tra
nsf
ers
(C
red
it R
em
itta
nce
s, e
tc)
No
min
al
US$
5.0
%5
.0%
24
.4%
24
.4%
24
.4%
24
.4%
24
.4%
24
.4%
24
.4%
24
.4%
Exp
ort
s o
f g
oo
ds
an
d s
erv
ice
sR
ea
l U
S$5
.0%
5.0
%1
3.0
%1
3.0
%1
3.0
%1
3.0
%1
3.0
%1
3.0
%1
3.0
%1
3.0
%
No
min
al
exc
ha
ng
e r
ate
:In
de
x0
.0%
0.0
%0
.0%
0.0
%0
.0%
0.0
%0
.0%
0.0
%0
.0%
0.0
%C
urr
en
t a
cco
un
t d
efi
cit
(ext
ern
al
savi
ng
s):
No
min
al
US$
6.0
%6
.0%
6.0
%6
.0%
6.0
%6
.0%
6.0
%6
.0%
18
.50
%1
8.5
0%
Exp
ort
pri
ces
Ge
ne
ral
No
min
al
US$
2.0
%2
.0%
4.0
%4
.0%
4.0
%4
.0%
4.0
%4
.0%
4.0
%4
.0%
Imp
ort
pri
ces
Ge
ne
ral
No
min
al
US$
2.0
%2
.0%
-16
.0%
2.0
%-1
6.0
%2
.0%
-16
.0%
2.0
%-1
6.0
%2
.0%
Ele
ctri
city
No
min
al
US$
1.5
%1
.5%
1.5
%1
.5%
1.5
%1
.5%
1.5
%1
.5%
1.5
%1
.5%
Pe
tro
leu
m p
rod
uct
sN
om
ina
l U
S$1
.5%
1.5
%-1
6.5
%1
.5%
-16
.5%
1.5
%-1
6.5
%1
.5%
-16
.5%
1.5
%
Ca
pit
al
De
pre
cia
tio
n r
ate
2.5
%2
.5%
Inco
me
ela
stic
itie
sG
en
era
l:
1.0
01
.00
1.0
01
.00
1.0
01
.00
1.0
01
.00
1.0
01
.00
Ele
ctri
city
: 1
.50
1.5
01
.50
1.5
01
.50
1.5
01
.50
1.5
01
.50
1.5
0La
bo
ur
0.8
50
.85
0.3
50
.35
0.3
50
.35
0.3
50
.35
0.3
50
.35
Ag
ricu
ltu
re:
Re
sid
ua
lR
esi
du
al
Re
sid
ua
lR
esi
du
al
Re
sid
ua
lR
esi
du
al
Re
sid
ua
lR
esi
du
al
Re
sid
ua
lR
esi
du
al
Ba
seli
ne
:S
cen
ari
o 2
Sce
na
rio
3S
cen
ari
o 4
Sce
na
rio
5
Annex IV Key Parameter Estimates for Scenario Simulations - Gaza

68
Annex V Simulation Results (Charts) - West Bank
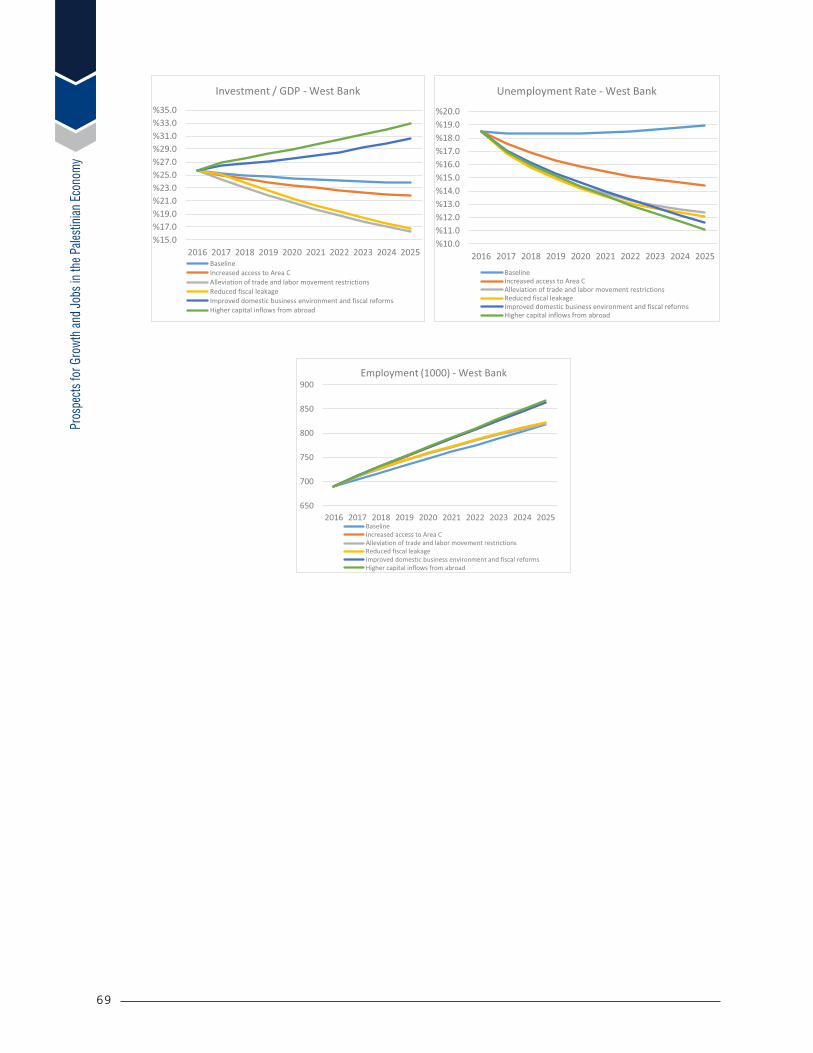
Pros
pect
s for
Gro
wth
and
Jobs
in th
e Pale
stin
ian E
cono
my
69
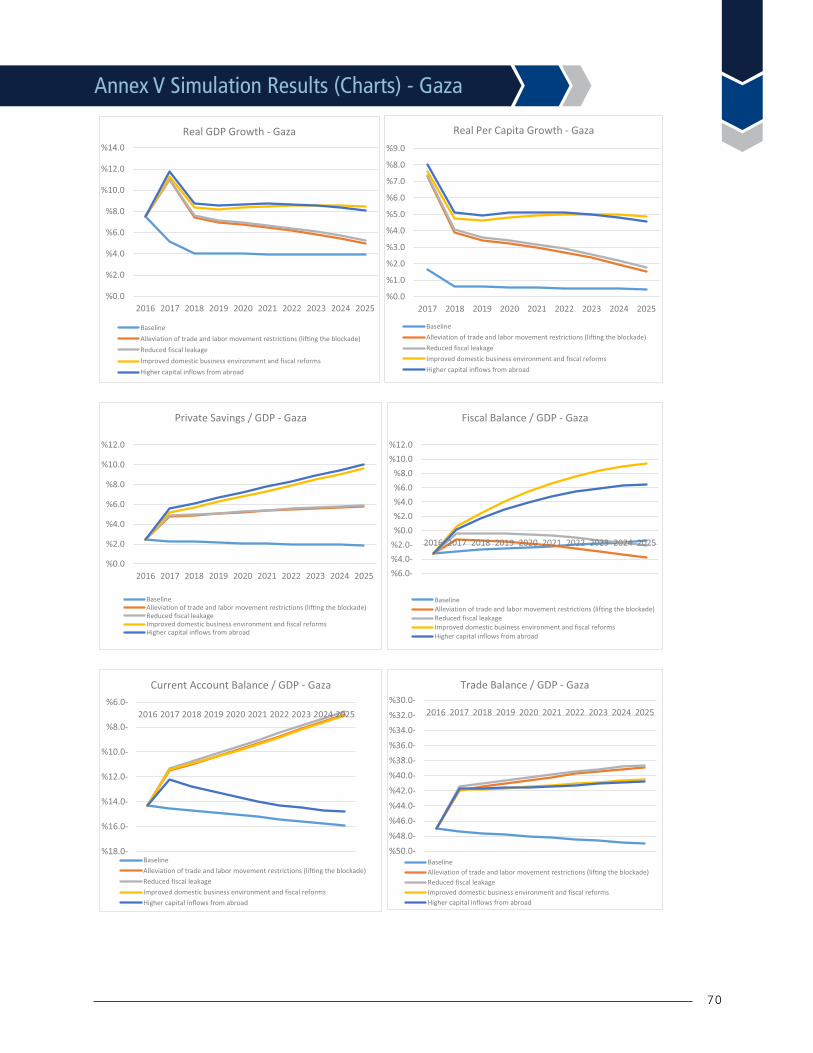
70
Annex V Simulation Results (Charts) - Gaza
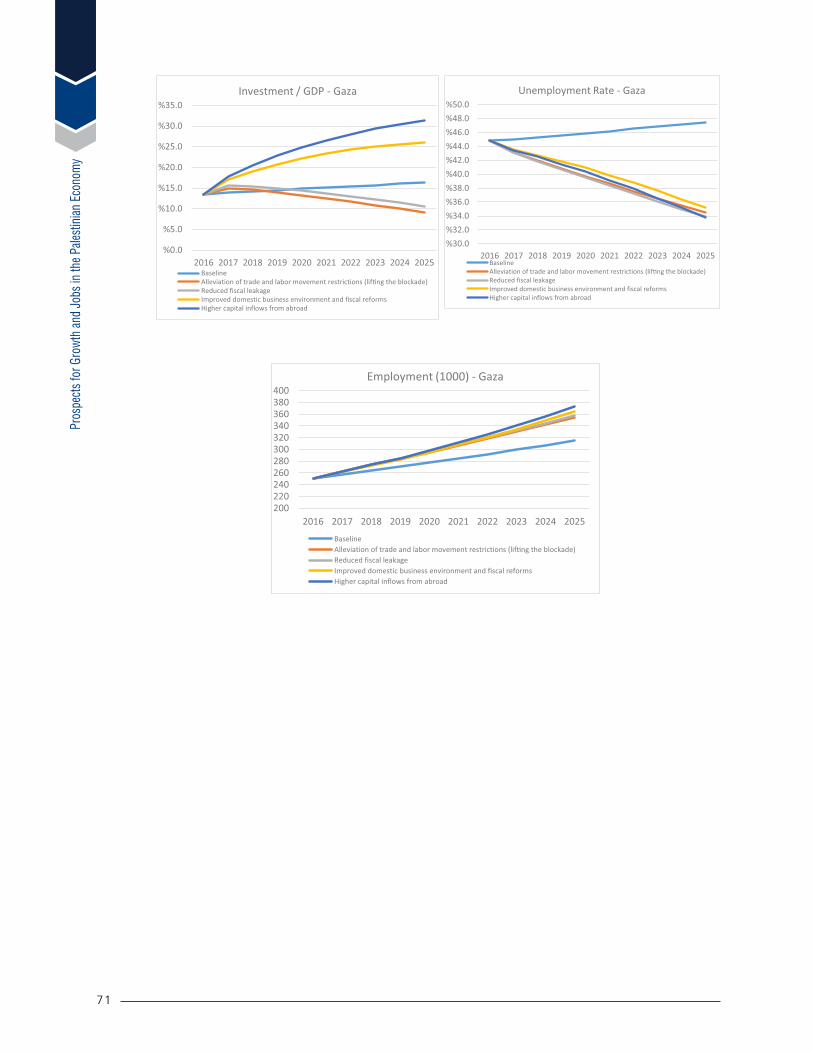
Pros
pect
s for
Gro
wth
and
Jobs
in th
e Pale
stin
ian E
cono
my
71


Prospects for Growth and Jobs in the Palestinian EconomyA General Equilibrium Analysis
June 2017
© Copyright 2017, all rights reserved
Global Practice for Macroeconomics & Fiscal Management Middle East and North Africa Region