A General Assembly - UNCTADunctad.org/meetings/en/SessionalDocuments/a70d278_en.pdf · Conference...
21
United Nations A/70/278 General Assembly Distr.: General 4 August 2015 Original: English 15-13166 (E) 260815 *1513166* Seventieth session Item 18 (c) of the provisional agenda* Macroeconomic policy questions External debt sustainability and development Report of the Secretary-General Summary The present report, prepared by the secretariat of the United Nations Conference on Trade and Development pursuant to General Assembly resolution 69/207, reviews the recent evolution of debt indicators of developing countries and countries with economies in transition. It provides an assessment of trends in debt relief and official development assistance. The report analyses the growing challenges faced by developing countries in maintaining and managing debt sustainability as a result of changes in the global economic environment, shifts in the composition of their external debt and increased incidences of natural disasters. * A/70/150.
Transcript of A General Assembly - UNCTADunctad.org/meetings/en/SessionalDocuments/a70d278_en.pdf · Conference...

United Nations A/70/278
General Assembly Distr.: General
4 August 2015
Original: English
15-13166 (E) 260815
*1513166*
Seventieth session
Item 18 (c) of the provisional agenda*
Macroeconomic policy questions
External debt sustainability and development
Report of the Secretary-General
Summary
The present report, prepared by the secretariat of the United Nations
Conference on Trade and Development pursuant to General Assembly resolution
69/207, reviews the recent evolution of debt indicators of developing countries and
countries with economies in transition. It provides an assessment of trends in debt
relief and official development assistance. The report analyses the growing
challenges faced by developing countries in maintaining and managing debt
sustainability as a result of changes in the global economic environment, shifts in the
composition of their external debt and increased incidences of natural disasters.
* A/70/150.
A/70/278
15-13166 2/21
I. Overview and trends
1. The total external debt stocks of developing countries and countries with
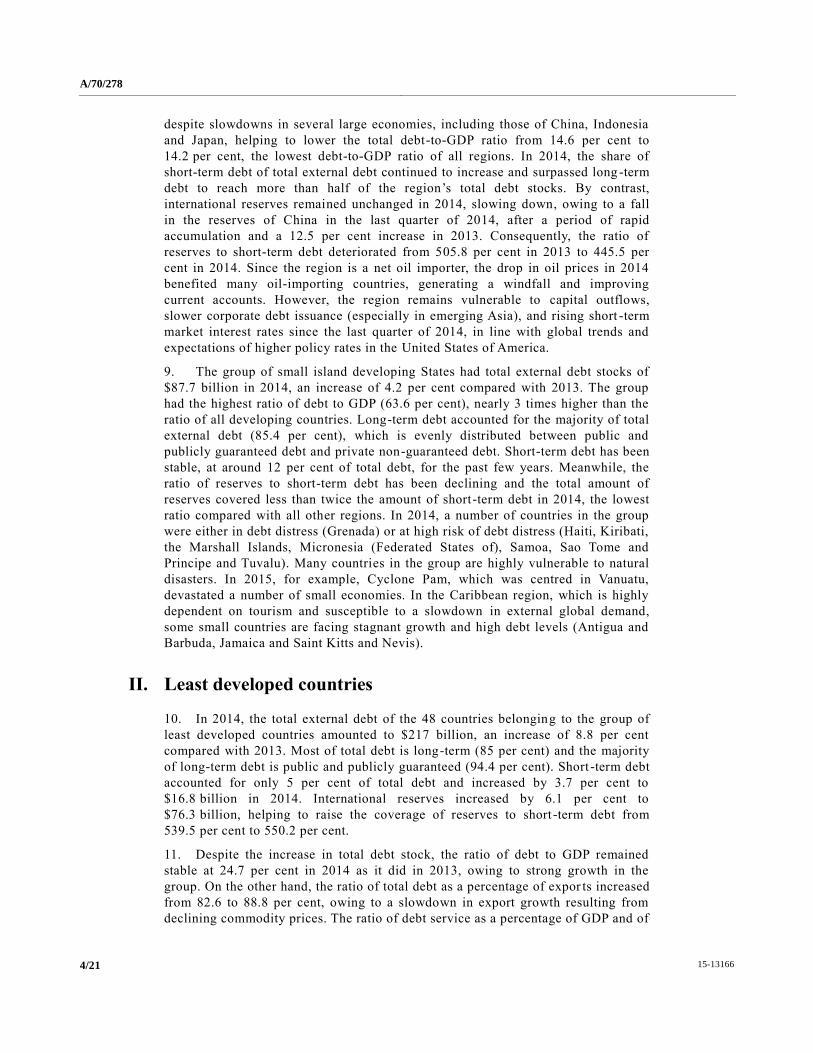
economies in transition (henceforth “developing countries”) reached $6.7 trillion in
2014 (see annex), an increase of 5.2 per cent compared with 2013 stocks.1 Long-
term debt constituted nearly three-quarters of total debt stocks and was mainly owed
to private creditors (78.8 per cent). Official lending to developing countries, which
accounted for 21.2 per cent of total long-term external debt, has been on a
downward trend following the global crisis. Meanwhile, the stock of short -term debt
has been increasing rapidly, totalling $1.8 trillion in 2014, an increase of 60 per cent
compared with 2010.
2. The gross domestic product (GDP) of the developing countries grew by 4.4 per
cent in 2014, which was lower than the growth rate of total debt stocks.
Consequently, the ratio of total debt to GDP increased slightly, from 23.3 per cent in
2013 to 23.5 per cent in 2014. Owing to a slowdown in export growth from 4.4 per
cent in 2013 to 1.8 per cent in 2014, the ratios of debt to exports and debt service to
exports rose from 81.1 to 84.0 per cent and from 8.8 to 9.2 per cent, respectively.
3. International reserves for developing countries as a group are estimated to
have decreased slightly, from $6.8 trillion in 2013 to $6.7 trillion in 2014, with
China accounting for more than half the stock of total reserves. The decrease, which
resulted from a fall in the reserves of China in the last quarter of 2014, marks the
first time that international reserves have declined after more than a decade of rapid
growth. Total reserves now just barely cover the stocks of total external debt for all
developing countries. The ratio of total reserves to short-term debt also fell, from
424.6 per cent in 2013 to 382.5 per cent in 2014. Of 117 countries for which short -
term debt data was available for 2014, 108 countries had international reserves that
covered more than 100 per cent of short-term debt. The nine countries with
international reserves lower than the amount of short-term debt were Belarus,
Guyana, the Lao People’s Democratic Republic, Seychelles, the Sudan, Turkey,
Ukraine, Venezuela (Bolivarian Republic of) and Zimbabwe.
Regional trends
4. Total debt stocks in Europe and Central Asia fell by 3.9 per cent, from
$1.93 trillion in 2013 to $1.86 trillion in 2014, after increasing by nearly 10 per cent
in 2013. A high share (90 per cent) of the region’s private debt is in long-term debt.
The amount of short-term debt fell by 11.2 per cent in 2014, while international
reserves fell significantly, by nearly 20 per cent, from $762 billion in 2013 to
$612 billion in 2014, resulting in the further deterioration of the ratio of reserves to
short-term debt. All other debt indicators for the region also worsened in 2014.
Although total debt stocks declined, the region’s total debt to GDP ratio increased
from 44 per cent to 45.7 per cent as a result of major GDP contractions in some
countries (Kazakhstan, the Russian Federation and Ukraine). Europe and Central
Asia region, among all regions, continues to have the highest ratio of debt to GDP.
5. Total external debt stocks in sub-Saharan Africa increased by 7.6 per cent in
2014, to reach $395 billion. The majority of long -term debt in that region is public __________________
1 United Nations Conference on Trade and Development (UNCTAD) secretariat calculations based
on the World Bank 2015 International Debt Statistics online database (the database does not
include debt data for Chile, the Russian Federation or Uruguay).

A/70/278
3/21 15-13166
and publicly guaranteed debt (81.3 per cent). International reserves fell by 5 per
cent in 2014 compared with 2013 but still covered around three times the level of
short-term debt. The GDP growth rate of the region slowed to 4.3 per cent in 20 14,
from 5 per cent in 2013, owing to such factors as declining commodity prices, the
Ebola epidemic in some countries (Guinea, Liberia and Sierra Leone) and lower oil
prices that severely affected the region’s oil exporters (e.g., Chad and Nigeria). The
total value of exports for the region also declined by 3 per cent in 2014. As a result,
the ratio of debt to GDP increased from 26.1 per cent to 27 per cent and that of debt
to exports increased from 76.8 per cent to 85.2 per cent. The favourable global
financing conditions in 2014 enabled the continuation of the recent surge in
sovereign bond issuance, which increased from $6.5 billion in 2013 to $8.7 billion
in 2014 for the region,2 with maiden issuances by Côte d’Ivoire, Ethiopia and
Kenya. However, yields on the region’s bonds have been trending up, especially in
Gabon, Ghana and Nigeria, as a result of high fiscal deficits or lower oil prices .
6. In Latin America and the Caribbean, total external debt stocks rose by 11 per
cent to $1.8 trillion in 2014, giving the region the second-highest debt level. Most
of the debt is long-term and the majority of long-term debt (82.4 per cent) is owed
to private creditors. Short-term debt increased by 20 per cent in 2014, while
international reserves increased by only 3 per cent, resulting in a deterioration of the
ratio of reserves to short-term debt from 336.9 per cent in 2013 to 288.5 per cent in
2014. Growth in the region declined for the fourth consecutive year, to 1.3 per cent
in 2014, owing to subdued external demand and worsening terms of trade. Falling
commodity prices resulted in a loss of 1.8 per cent in export value and further
widened external current account deficits in most commodity -exporting economies.
Both sluggish growth and falling exports in 2014 contributed to a worsening of all
debt indicators for the region, with the ratio of total debt to GDP increasing from
27.8 per cent to 30.2 per cent and that of total debt to exports from 128.3 per cent to
145.1 per cent.
7. Total debt stocks in the Middle East and North Africa continued to grow at a
rate of 5 per cent in 2014 to reach $200 billion. The long -term debt consisted mainly
of public and publicly guaranteed debt (93 per cent). In 2014, short -term debt
increased by 2 per cent while international reserves declined by 2.5 per cent.
Nevertheless, international reserves still covered more than 11 times the amount of
short-term debt, making it the highest ratio among all the regions. Debt -to-GDP
ratios increased from 14.8 per cent in 2013 to 16.2 per cent in 2014, owing to
slower growth in the region as a result of declining oil prices, ongoing conflicts and
political instability. Many of the region’s oil exporting countries (e.g., Iran (Islamic
Republic of), Iraq, Saudi Arabia and the United Arab Emirates) have seen
substantial downward revisions to their growth forecasts. Exports were also hit by
declining oil prices and high volatility, with a fall of 2.5 per cent in the value of
exports. As a result, the ratio of debt to exports rose from 58.7 per cent to 63.2 per
cent.
8. The growth of total debt stocks in East Asia and the Pacific slowed to 7.6 per
cent in 2014 after a period of, on average, more than 10 per cent annual growth.
Private debt accounted for a large share of long -term debt (77.2 per cent) and
continued on an upward trend. The region experienced strong growth in 2014
__________________
2 International Monetary Fund (IMF), World Economic Outlook, World Economic and Financial
Surveys (Washington, D.C., April 2015).
A/70/278
15-13166 4/21
despite slowdowns in several large economies, including those of China, Indonesia
and Japan, helping to lower the total debt-to-GDP ratio from 14.6 per cent to
14.2 per cent, the lowest debt-to-GDP ratio of all regions. In 2014, the share of
short-term debt of total external debt continued to increase and surpassed long -term
debt to reach more than half of the region’s total debt stocks. By contrast,
international reserves remained unchanged in 2014, slowing down, owing to a fall
in the reserves of China in the last quarter of 2014, after a period of rapid
accumulation and a 12.5 per cent increase in 2013. Consequently, the ratio of
reserves to short-term debt deteriorated from 505.8 per cent in 2013 to 445.5 per
cent in 2014. Since the region is a net oil importer, the drop in oil prices in 2014
benefited many oil-importing countries, generating a windfall and improving
current accounts. However, the region remains vulnerable to capital outflows,
slower corporate debt issuance (especially in emerging Asia), and rising short -term
market interest rates since the last quarter of 2014, in line with global trends and
expectations of higher policy rates in the United States of America.
9. The group of small island developing States had total external debt stocks of
$87.7 billion in 2014, an increase of 4.2 per cent compared with 2013. The group
had the highest ratio of debt to GDP (63.6 per cent), nearly 3 times higher than the
ratio of all developing countries. Long-term debt accounted for the majority of total
external debt (85.4 per cent), which is evenly distributed between public and
publicly guaranteed debt and private non-guaranteed debt. Short-term debt has been
stable, at around 12 per cent of total debt, for the past few years. Meanwhile, the
ratio of reserves to short-term debt has been declining and the total amount of
reserves covered less than twice the amount of short-term debt in 2014, the lowest
ratio compared with all other regions. In 2014, a number of countries in the group
were either in debt distress (Grenada) or at high risk of debt distress (Haiti, Kiribati,
the Marshall Islands, Micronesia (Federated States of), Samoa, Sao Tome and
Principe and Tuvalu). Many countries in the group are highly vulnerable to natural
disasters. In 2015, for example, Cyclone Pam, which was centred in Vanuatu,
devastated a number of small economies. In the Caribbean region, which is highly
dependent on tourism and susceptible to a slowdown in external global demand,
some small countries are facing stagnant growth and high debt levels (Antigua and
Barbuda, Jamaica and Saint Kitts and Nevis).
II. Least developed countries
10. In 2014, the total external debt of the 48 countries belonging to the group of
least developed countries amounted to $217 billion, an increase of 8.8 per cent
compared with 2013. Most of total debt is long-term (85 per cent) and the majority
of long-term debt is public and publicly guaranteed (94.4 per cent). Short -term debt
accounted for only 5 per cent of total debt and increased by 3.7 per cent to
$16.8 billion in 2014. International reserves increased by 6.1 per cent to
$76.3 billion, helping to raise the coverage of reserves to short -term debt from
539.5 per cent to 550.2 per cent.
11. Despite the increase in total debt stock, the ratio of debt to GDP remained
stable at 24.7 per cent in 2014 as it did in 2013, owing to strong growth in the
group. On the other hand, the ratio of total debt as a percentage of expor ts increased
from 82.6 to 88.8 per cent, owing to a slowdown in export growth resulting from
declining commodity prices. The ratio of debt service as a percentage of GDP and of

A/70/278
5/21 15-13166
exports for the group remained low in 2014, at 1.6 per cent and 5.7 per cent,
respectively, owing to highly concessional terms (long maturity, low interest rates)
of most of the external debt of the least developed countries.
12. As of May 2015,3 one least developed country was in debt distress (the Sudan)
and ten least developed countries were at high risk of debt distress (Afghanistan,
Burundi, the Central African Republic, Chad, Djibouti, Haiti, Kiribati, Mauritania,
Sao Tome and Principe and Tuvalu). Mauritania and Tuvalu joined the list of least
developed countries at high risk of debt distress in 2014, while the Comoros and the
Democratic Republic of the Congo got off the list by reducing their risk of debt
distress from high to moderate.
13. The GDP growth for the group of least developed countries, at an estimated at
5.2 per cent in 2014, was the second highest globally, just below that of East Asia
and the Pacific. Within the group, performance varied markedly, with some
countries achieving a growth rate of more than 7 per cent (Cambodia, Chad, the
Democratic Republic of the Congo, the Lao People’s Democratic Republic,
Mozambique and the United Republic of Tanzania), while others, especially oil -
exporting countries, experienced a negative GDP growth rate (Equatorial Guinea
and South Sudan) owing to declining oil prices.4
14. A total of 20 countries in the group of least developed countries ran double -
digit current account deficits in 2014 compared with 17 countries in 2013.5 Among
those countries, Liberia and Mozambique continued to run persistently high current
account deficits of more than 30 per cent of GDP for the third consecutive year.
Djibouti and Kiribati also had high current account deficits; the current account
deficit of Kiribati is more than half of its GDP (53 per cent). The widening current
account deficit is due mainly to lower exports as a result of declining commodity
prices. Meanwhile, imports of goods and services are projected to increase in least
developed countries that continue to expand their production capacity. Countries
running both large current account deficits and large fiscal deficits (Kiribati, Liberia
and Mozambique) require careful monitoring, as those countries will have less
space to adopt expansionary policies and Kiribati was already at high risk of debt
distress.
15. In 2014, a number of least developed countries continued to tap the
international market through the issuance of sovereign international bonds. Ethiopia
successfully issued $1 billion of 10-year Eurobonds at a yield of 6.625 per cent.
Senegal raised $500 million of 10-year bonds at a yield of 6.25 per cent and Zambia
launched $1 billion of 10-year bonds at 8.625 per cent.6 Those activities reflect a
continuing trend for some least developed countries to diversify away from such
traditional sources of finance as concessional loans and to take advantage of the
current favourable financing conditions in the international financial market to
borrow on commercial terms.
16. While greater access to international financial markets could help least
developed countries to mobilize resources to meet their long-term infrastructure
__________________
3 IMF list of debt sustainability assessments for low -income countries that are eligible for the
Poverty Reduction and Growth Trust as at 7 May 2015 (available from www.imf.org).
4 Estimates from IMF World Economic Outlook and The Economist Economic Intelligence Unit.
5 World Economic Outlook, April 2015.
6 Bloomberg data.

A/70/278
15-13166 6/21
needs, it is important that they manage the market risk exposure associated with
such instruments, including refinancing risk, currency risk and greater
macroeconomic volatility owing to large capital inflows. Moreover, taking into
account the risks of excessive private-sector borrowing and the inevitable
limitations of the credit assessments of private lenders, least developed countries
should carefully weigh the risks of such borrowing and pursue active debt
management, especially in the case of significant mismatches between the exchange
rate and maturity.
17. Nine countries belong to both the group of least developed countries and that
of small island developing States (the Comoros, Guinea -Bissau, Haiti, Kiribati, Sao
Tome and Principe, Solomon Islands, Timor-Leste, Tuvalu and Vanuatu). These
countries are small, open economies that are particularly vulnerable to external
economic shocks and natural disasters. Among them, four (Kiribati, Haiti, Tuvalu
and Sao Tome and Principe) were already at high risk of debt distress in 2014.
Natural disasters pose threats and additional risks to the economies of the small
island and least developed States.
III. Debt relief initiatives
Heavily Indebted Poor Countries Initiative and Multilateral Debt Relief Initiative
18. Since the enhanced Heavily Indebted Poor Countries (HIPC) Initiative was
launched in 1999, 36 of the eligible 39 heavily indebted poor countries have reached
the completion point and benefited from debt rel ief under that initiative and the
Multilateral Debt Relief Initiative.7 Progress under the HIPC Initiative has slowed
tremendously as it comes to an end. The only country to reach the completion point
since 2012 is Chad, which reached it in April 2015, marking the end of a long
process for the country from its arrival at the decision point in 2001. Three eligible
heavily indebted poor countries have yet to reach the decision point: Eritrea,
Somalia and the Sudan. In addition, Myanmar and Zimbabwe may potent ially
benefit from both initiatives’ debt relief, depending upon whether they meet
indebtedness and income criteria and can clear the arrears they owe to the Paris
Club and multilateral creditors. To be eligible for debt relief, countries are also
required to demonstrate the ability to implement policy reforms and establish a
strong track record under an IMF staff-monitored programme. In the case of
Zimbabwe, it is uncertain whether an exception to the income criteria will be
required.
19. To date, the total cost of debt relief delivered under the HIPC Initiative is
estimated at $75 billion. That of the Multilateral Debt Relief Initiative was
$41.1 billion in present value terms, at the end of 2013. As a result of that
assistance, the 36 post-decision point heavily indebted poor countries have
witnessed an improvement in debt ratios. The debt service -to-exports ratios for
those countries declined from 15.7 per cent to an estimated 5.5 per cent between
2001 and 2015, and their debt service-to-GDP ratios from 3 per cent to an estimated
1.5 per cent during the same period. In addition, the ratio of poverty -reducing
expenditure to GDP increased from 6.8 per cent to an estimated 9.3 per cent from
__________________
7 See IMF, “Heavily Indebted Poor Countries (HIPC) Initiative and Multilateral Debt Relief
Initiative (MDRI) — statistical update” (Washington, D.C., December 2014).
A/70/278
7/21 15-13166
2001 to 2015. The ratio of poverty-reducing expenditure to government revenues,
however, has remained relatively stable, at 49.7 per cent in 2001 compared with an
estimated 49.3 per cent in 2015. It peaked at 56.2 per cent in 2009.8
20. While the improvement of debt ratios is encouraging, a number of completion
point heavily indebted poor countries continue to face debt difficulties. As of May
2015, the Sudan was classified as being in debt distress and 7 other heavily indebted
poor countries were classified as being at high risk of debt distress (Afghanistan,
Burundi, the Central African Republic, Ghana, Haiti, Mauritania and Sao Tome and
Principe), 17 at moderate risk of debt distress and 11 at low risk of debt distress.
21. Of concern is the lack of progress of heavily indebted poor countries towards
achieving the Millennium Development Goals. Despite the increase in poverty-
reducing expenditure, many of those countries, particularly in sub -Saharan Africa,
are seriously off-track in terms of meeting their targets,9 in particular in the areas of
health and education. To date, no heavily indebted poor country has met the
objectives for reducing infant mortality rates or combating HIV/AIDS and other
diseases. The funds provided under the HIPC Initiative were designed to supplement
existing development assistance programmes under the principle of additionality.
22. Securing the participation of commercial creditors in debt relief initiatives has
been a challenge in delivering full debt relief to heavily indebted poor countries.
Debt relief is provided with a clause of “comparability of treatment”, which aims to
ensure balanced treatment among all external creditors of the debtor country. Under
Paris Club agreements, the debtor country commits itself to seeking rescheduling on
comparable terms from non-multilateral creditors (non-Paris Club and private
creditors). Litigation by non-cooperative creditors, in addition to the lack of
participation by some creditors, has compounded that negative effect and led to
inequitable burden-sharing among creditors. While the number has diminished, at
present 11 commercial creditor lawsuits are being pursued against six heavily
indebted poor countries,10
threatening to undermine the debt relief and consequent
policy space for pursuing development goals.
23. As the international community embarks on a new international development
agenda and the pursuit of the sustainable development goals, it is important to take
stock of the strengths and disadvantages of the HIPC and Multilateral Debt Relief
initiatives in order to improve international efforts going forward. A
multidimensional approach is necessary for securing debt sustainability and
attaining internationally agreed development goals in heavily indebted poor
countries. Debt relief must be complemented by stable and predictable funds and
sound management and planning. In the absence of debt relief, reliable aid flows or
good debt management, the ability of the poorest countries to succeed is greatly
diminished.
__________________
8 Ibid., table AIII1.
9 See UNCTAD, Least Developed Countries Report 2014 — Growth with Structural
Transformation: A Post-2015 Development Agenda.
10
See IMF, “Heavily Indebted Poor Countries (HIPC) Initiative and Multilateral Debt Relief
Initiative (MDRI) — statistical update” (Washington, D.C., December 2014), table AIII16.

A/70/278
15-13166 8/21
Paris Club
24. The structural shift in the composition of the debt of developing countries
away from official bilateral lending to bond financing over the past 15 years,
coupled with the continued progress of the HIPC and Multilateral Debt Relief
initiatives, is reflected in a drastic drop in the number of Paris Club meetings. In the
last 12 months, there have been only two Paris Club meetings, compared with a
yearly average of 14 meetings in the 1980s.
25. While a reduced number of restructuring meetings in the Paris Club is a
positive development, the shift towards bonds as the primary sovereign borrowing
instrument and the lack of an appropriate forum for restructuring that type of debt
has probably decreased the overall efficiency of the restructuring process. As an
example, Paris Club creditors were historically quick to respond to the restructuring
needs of a country following a natural disaster. It is questionable whether such a
quick response, with traditionally fairly generous terms, will be obtained in the
context of a bond restructuring following a default linked to an unforese en event of
nature.
26. There have been some positive advances, however. Although the amounts
involved are not very large, with the volume of affected debt at around $30 million,
on 25 February 2015 Seychelles and Paris Club creditors reached an extremely
innovative debt restructuring agreement aimed at supporting the environment. The
deal consists of a buyback by Seychelles of its debt at a discount, which both
reduces the country’s external debt and releases funds previously committed to
servicing the debt to be used for marine conservation and adaptation to climate
change. As climate change poses increasing challenges to developing countries,
such types of deals should receive the full support of the international community
and be expanded to a wide range of developing countries.
27. An additional Paris Club meeting was convened in June 2015 to consider the
case of Chad after the country reached the completion point under the HIPC
Initiative in April 2015. Paris Club creditors met their debt commitments i n line
with the HIPC Initiative and, on a bilateral basis, agreed to further debt write -offs.
The totality of the agreement amounted to a full cancellation of the country ’s
eligible debt.
IV. Official development assistance
28. The total net official development assistance11
flows remained stable in 2014
at $135.2 billion, on par with the 2013 level of $135.1 billion, although the 2014
level marked a 0.5 per cent decline in real terms. Of concern is the decline in aid to
the poorest countries. In aggregate terms, official development assistance is at an
historical high, with steady increases delivered since 2000 when Member States
committed to achieving the Millennium Development Goals. The stability of official
development assistance is encouraging in light of the global recession and the
austerity measures taken by some donors.
__________________
11
Organization for Economic Cooperation and Development (OECD), “Development aid stable in
2014 but flows to poorest countries still falling”, 8 April 2015 (available from www.oecd.org/
dac/stats/documentupload/ODA%202014%20Technical%20Note.pdf).
A/70/278
9/21 15-13166
29. While official development assistance has been increasing overall, such
assistance to heavily indebted poor countries began to sharply contract in 2010 (see
figure I). This was also the case for official development assistance that excluded
debt relief.
Figure I
Total official development assistance to heavily indebted poor countries
(Constant price, millions of United States dollars 2013)
Source: Organization for Economic Cooperation and Development , International Development Statistics
online database.
30. In addition, there is some concern about the contraction of official
development assistance to least developed countries of 16 per cent in real terms in
2014, which is estimated to be a decline of 8 per cent when debt relief is excluded.
This contraction is of particular concern as official development assistance
constitutes more than two-thirds of external financing for least developed countries.
31. The current international dialogue around the new sustainable development
goals has brought the topic of development finance to the fore, as the awareness of
donors and recipients of the considerable costs of attaining those goals grows and
discussions about climate change mitigation and adaptation imply a significant
increase in the price tag attached to internationally agreed development goals. The
World Bank and IMF spring meetings included calls for a paradigm shift to consider
mobilizing more and different forms of finance, with a particular emphasis on more
private sector investment in the poorest economies, along with more innovative
financing instruments. There is some concern, however, that unless the principle of
the additionality of official development assistance is preserved, that approach
might not only shift the burden of financing the new development goals to
developing countries as a whole, but also seriously distract attention from the
importance of international public finance for development cooperation.
0
5000
10000
15000
20000
25000
30000
35000
2000 2001 2002 2003 2004 2005 2006 2007 2008 2009 2010 2011 2012 2013
Total ODA to HIPCs ODA Total, excl. Debt to HIPCs

A/70/278
15-13166 10/21
32. The meetings highlighted the need to increase development financing from
$100 billion per year in official development assistance to trillions per year in
overall financing. It remains to be seen whether such an increase is feasible, but it is
still important to emphasize that such forms of financing should be additional to
existing official development assistance and that donors must redouble their efforts
to deliver on their aid commitments. At present, alternative instruments and funds,
including innovative sources of financing, constitute only a small fraction of the
resources mobilized annually through official development assistance.
V. Challenges to debt sustainability in developing countries
Risks posed by the global macroeconomic environment
33. Following the implosion of an increasingly fragile international financial
system in the 2008 global financial crisis, levels of indebtedness, mainly public,
have continued to grow in advanced economies. By contrast, the sovereign debt
indicators of developing countries have improved owing to a more rapid rebound in
economic growth, a favourable interest rate environment and ongoing international
debt relief initiatives since 2002. However, such a broadly beneficial environment,
from the perspective of developing countries’ overall debt sustainability, is unlikely
to last as a number of supporting factors appear set to change.
34. To stimulate their domestic economies in the aftermath of the global financial
crisis, central banks in major developed economies adopted policies that combined
low interest rates with quantitative easing, resulting in a multiyear period of
historically low borrowing costs across the maturity curve (see figure II).
Figure II
United States 10-year treasury bond yield
Source: Thomson Reuters Datastream.

A/70/278
11/21 15-13166
35. By now, there are clear indications of a normalization of United States interest
rates in the near future, however, presenting emerging markets with the possibility
of a rapid reversal of capital inflows, as well as refinancing risks, as already
witnessed during the 2013 so-called “taper tantrum” episode. While there are well-
known links between interest rates in the developed economies and borrowing costs
for developing countries, the past 30 years have profoundly changed the
transmission mechanisms between monetary policy in advanced economies and debt
sustainability in developing countries.
36. The change in the composition of developing country debt from predominantly
syndicated bank lending to bond financing entails a significant increase in exposure
to financial risk and instabilities. Generally speaking, highly marketable securities
can change hands much faster, making herd behaviour both more prevalent and
more damaging. Bond financing of external debt also substantially increases the
complexity of debt workouts once financial or debt crises happen. Specifically,
when developing countries borrowed mostly from banks, provided that most of their
external debt was contracted on fixed rates, they were essentially insulated from
changes in global interest rates, except for refinancing costs and exchange rate
movements. Indeed, as long as the maturity of their debt portfolio was staggered
over time, they could benefit from fairly stable average interest payments on their
debt, making currency risks the only important risk to debt sustainability. The
increased prevalence of bond financing, and in particular the shift in the
composition of some developing country sovereign debt towards local currency
bonds observed from the mid-1990s, has seemingly reduced the risk of exchange
rate shocks to debt sustainability in those countries. In reality, while the currency
risk might be lower for sovereign borrowers, new challenges for policymakers have
emerged in countries that rely heavily on bond financing. The significant increase of
non-residents holding local currency debt over the past 20 years has substantially
increased the risk of capital outflows in response to small interest rate differentials
emerging across countries.
37. Newcomers to the international bond market, such as sub-Saharan Africa, are
particularly vulnerable. Some of them are former heavily indebted poor countries
and countries that depend heavily on commodity export revenues for foreign
exchange income. Questions about the future price path of commodities, potential
rollover risk at expiration and the capacity of their debt management offices to
anticipate refinancing costs and design strategies to mitigate such risks, create
concerns that some of those countries might face debt servicing difficultie s in a less
benign international financial environment.

A/70/278
15-13166 12/21
Figure III
Sub-Saharan Africa sovereign bond issues
(Millions of United States dollars)
Source: Bloomberg, Dealogic and Financial Times.
38. Such potential risk to developing country debt sustainability over the next few
years is compounded by the fact that although sovereign borrowers have reduced
their currency risk by issuing heavily in their domestic debt markets, that has not
been the case for private borrowers. Companies have borrowed heavily, often in
United States dollars, exposing themselves to currency risk, both from dollar
appreciations relative to the domestic currency and from any sudden reversal of
capital flows. There are particular vulnerabilities among companies in the
commodity sector that might have borrowed aggressively against future revenue
streams under the assumption of relatively stable commodity prices. Following
major adjustments of commodity prices over the last 12 months, in particular oil
prices, such assumptions may turn out to have been mistaken. That could raise
problems of contingent liabilities, as many of the companies concerned benefit from
explicit or implicit government guarantees, and their failure would pose a systemic
risk to the domestic financial sector and to the growth prospects of the countries in
which they are domiciled. The rapid rise of external private debt repeats a pattern
seen prior to the Latin American crisis of the 1980s and the Asian crisis of the
1990s. Solvency problems of large domestic companies in key sectors of the
economy can rapidly become public debt, as evidenced by the current public finance
crises in the eurozone.12
39. Over the coming years, the speed and magnitude of the increase in the United
States federal funds rate could have major implications for international bond
markets. It is hard to predict the level of volatility that will affect bonds with longer
maturities and the spread between United States Treasury securities and emerging
market bonds. Because of the new transmission channels created by the higher
integration of developing countries in the global financial system, the impact of the
readjustment of monetary policy in developed countries needs to be closely
monitored by policymakers in both developed and developing countries.
__________________
12
See UNCTAD, Trade and Development Report, 2015, chap. V.

A/70/278
13/21 15-13166
0
50
100
150
200
250
300
350
400
450
1980 1985 1990 1995 2000 2005 2010
Economic loss (total)
Insured loss (total)
10-year average
40. The recent drop in commodities prices also has important implications for
lower income countries that are not directly exposed to a potential rout in global
bond markets but rely heavily on commodities for their export earnings. The secular
boom in commodity prices that has been driven mainly by the rapid growth in
emerging markets over the last 20 years may have come to an end. The recent
weakness in the growth rates of some major developing countries might worsen
with continued lacklustre growth in developed countries and a new episode of
global financial turbulence. Falling commodity prices and increased exchange rate
volatility is likely to create a challenging economic environment for a growing
number of developing countries.
Climate change and debt instruments to mitigate risk
41. The increased frequency of natural disasters owing to climate change will pose
further sustainability problems in affected countries (see figure IV).
Figure IV
Total and insured global economic losses from natural catastrophes and
man-made disasters, 1980-2014, 2014 prices
(Billions of United States dollars)
Source: Swiss Re, Sigma World Insurance Database.
42. Natural catastrophes and extreme climate events are negative income shocks
associated with an immediate contraction in economic output and a rise in
borrowing needs to replace physical capital losses. As was evidenced by the 2007
tsunami, natural disasters can cause immediate insolvency in countries by
devastating key economic sectors.
43. A number of market-based instruments are currently available to mitigate the
impact of natural disasters. Catastrophe bonds are securities issued by special
purpose vehicles that transfer risk from a financial sponsor, usually a reinsurance
company or an investment bank, to capital market investors. There are two main
advantages over the alternative of issuing plain vanilla bonds plus buying an
insurance contract, especially for emerging market countries. First, increasing

A/70/278
15-13166 14/21
liquidity and a maturing market should reduce the cost of the bundled contract
(bond plus insurance) with respect to the alternative, in particular in countries with
poorly rated and little traded bonds or those in which insurance premiums are likely
to be higher because of their past catastrophe record. Second, insurance contracts
determined on the basis of parametric indexes remove all sources of moral hazard.
As a further advantage, catastrophe bonds also alleviate counter -party credit risk as
they are collateralized.
44. Another option is to use contingent capital as a risk transfer instrument. This is
securitized capital that makes funds available under pre-negotiated terms through an
options contract if a specific event (e.g., a natural catastrophe) occurs or a threshold
(e.g., a certain earthquake magnitude) is crossed. A debt management office
underwriting a contingent capital contract would pay a fee to a second party that
agrees to extend a loan or purchase debt if the trigger event occurs. With contingent
capital, no risk is actually transferred from one party to the other, and the
underlying option is exercisable if both counterparties agree that a pre-defined
trigger has occurred.
45. The World Bank Group has developed a broad range of financing solutions to
help countries prepare to respond to natural disasters. The catastrophe deferred
drawdown option provides a committed line of credit that can be drawn upon if a
major natural disaster occurs.
46. The introduction of GDP-indexed bonds, which pay an interest coupon based
on the issuing country’s rate of growth, could have a number of positive effects, not
only in the context of natural disaster risk management but also for the broader goal
of exogenous shock mitigation (see A/62/151). By issuing GDP-indexed bonds,
borrowing countries would benefit from the stabilization of overall government
spending and limit the pro-cyclicality of fiscal pressures. Moreover, allowing debt -
service ratios to fall in times of slow or negative growth would reduce the
likelihood of costly defaults and debt crises. The main benefits arise from the
possibility of taking a position on countries’ future growth and from lowering the
frequency of defaults and debt crises by stabilizing the overall budget. Issuing GDP -
indexed bonds might naturally create a constituency in favour of growth that will
back the reform efforts of Governments. Finally, at a broader level, GDP-indexed
bonds can be viewed as desirable vehicles for international risk -sharing and as a
way of avoiding the disruptions arising from formal default.
47. A potential downside is that markets for new complex instruments may be
illiquid and it might be difficult for investors to price such instruments. This poses
the challenge to the international financial community to engage in a coordinated
effort to achieve and maintain a critical mass of GDP -indexed bonds to attain
market liquidity. However, for low income countries with limited capacities to use
market-based instruments, in particular, and for the most vulnerable nations, global
measures to assist such economies directly to mitigate climate change impacts will
remain highly relevant. It is extremely important that these new international
commitments be additional to the already agreed level of official development
assistance of 0.7 per cent of gross national income.

A/70/278
15/21 15-13166
VI. Debt management capacities
Developments since 2000
48. Changes since 2000 in the size and composition of public debt in developing
countries have reinforced the need for effective debt management. Developing
countries have generally strengthened their capacity to analyse their debt portfolios
over the period, although the rate of progress differs greatly among countries. The
most notable improvements have been in relation to debt recording and reporting,
debt sustainability analysis and debt strategies. Increased capacity in debt recording
and reporting is evident from the results of Public Expenditure and Financial
Accountability framework assessments. These indicate that, on average, since 2006,
the quality of debt recording and reporting and of public debt management systems
for contracting loans and issuing guarantees has improved significantly. The
increasing number of countries reporting to the various debt databases developed by
the World Bank in collaboration with IMF also attest to the improved capacity.
Although the quality of debt data of low-income countries, in general, is still
slightly lower than that of other income categories, those countries have shown the
fastest rate of improvement.
49. There is broad consensus that technical assistance has been a major
contributing factor in improving debt management capacity. The support available
to countries has evolved in line with their changing needs since 2000, with an
increased number of organizations providing technical assistance, including a
broadening range of support services. The de facto organization of technical
assistance in debt management into “downstream” and “upstream” activities has
been an important development. Downstream activities include the maintenance of
debt databases, debt-data validation, debt operations, internal and external debt
reporting, debt statistics and basic debt analysis. The main providers of technical
assistance in that area are the UNCTAD Debt Management and Financial Analysis
System and the Commonwealth Secretariat. The downstream activities complemen t
the upstream activities, which include diagnosis, designing reform plans, medium -
term debt strategy formulation and debt sustainability analysis. The main providers
of the upstream activities are the World Bank and IMF, in partnership with other
international and regional organizations, through the Debt Management Facility.
Challenges post-2015
50. While much progress has been made in strengthening debt management
capacity, countries still need to improve in many areas. Debt management requires a
higher level of sophistication than in the past owing to the increased complexity of
portfolios. Many countries have yet to reach the minimum standards in some key
areas and high staff turnover continues to be a common and recurrent problem.
Recent studies have concluded that the weakest performance indicators are debt
management strategy, audit, cash flow forecasting and cash balance management,
the segregation of duties, staff capacity and business continuity planning and debt
administration and data security.
51. The post-2015 environment can also be expected to present countries with new
challenges. Increased access to international capital markets, public -private
partnerships, sub-national debt, blended and climate finance, development finance
from emerging or re-emerging sovereign donors and domestic debt will require new

A/70/278
15-13166 16/21
capacities. Operational and financial risk management, the development of effective
borrowing strategies and the full integration of debt within the public finance
framework will become increasingly important for debt crisis prevention. Improving
the coverage of debt data will also be critical, particularly in relation to domestic,
short-term and private non-guaranteed debt and contingent liabilities. An important
issue is that there is evidence that the lack of a mechanism to help low-income
countries to identify resources to implement downstream reforms represents a
significant risk for the sustainability of improvements.
52. For debt management to be effective in meeting those challenges , countries
will need to invest in building adequate capacity and implementing sustainable
reforms. This will require financial resources and technical assistance. Building
sustainable capacity in debt management necessitates a long -term, continuous,
iterative process of learning and adapting to change. Assistance should be provided
to strengthen recipients’ capacities to monitor their debt profiles and reduce
vulnerabilities from the excessive build-up of debt and increased market exposure.
Technical assistance providers, particularly UNCTAD, IMF and the World Bank,
must ensure that the products and services offered are public goods that are
continuously updated in line with the new requirements of countries and best
practices. Providers must also maximize coordination and complementarity to
minimize duplication and adopt a cooperative, holistic approach that covers both
upstream and downstream activities, thus ensuring that the full spectrum of country
needs is met. Similarly, the international community must ensure that adequate
financing is provided to support the implementation of national reforms and the
provision of technical assistance for public debt management as an effective tool for
debt crisis prevention. Donor support for downstream activities in low-income
countries will be particularly important.
53. It is critical for effective crisis management that debt management offices have
the staffing, skills and systems needed to meet those challenges. Debt strategy,
financial and operational risk management and debt management systems will
require particular attention. The international community should continue to support
the provision of financial and technical assistance for institutional capacity -building
for public debt management to assist countries in implementing the required reforms
and ensure that both the upstream and downstream activities are adequately
supported, with specific consideration given to financing downstream activities.
Priority should be given to fragile countries in sub -Saharan Africa. It is critical to
ensure the availability of comprehensive, reliable debt databases that cover all
aspects of the evolving debt portfolio and adequate support for debt statistical
capacity and reporting. Providers of technical assistance in debt management should
give precedence to coordination and cooperation.
VII. Conclusions and policy recommendations
54. The trend since 2010 of a gradual, albeit mild, deterioration of the external
debt indicators of developing countries persisted in 2014. Total external debt stocks,
in particular the stock of short-term debt, continued to rise and key debt ratios to
worsen. The total international reserves of developing countries also fell for the first
time after more than a decade of rapid growth, owing mainly to a decline in the
reserves of China at the end of 2014. While the group of least developed countries
experienced a year of relatively strong GDP growth, thus maintaining a stable ratio
A/70/278
17/21 15-13166
of total debt to GDP, its export growth declined as a result of falling prices in some
commodities markets, leading to an increase in that group's total debt -to-export
ratio. Least developed countries also continued to diversify away from traditional
sources of financing, favouring in particular the issuance of sovereign bonds on
international markets.
55. After declines in 2011 and 2012, official development assistance maintained
its 2013 level of approximately $135 billion in 2014. Although this is high by
historical standards, the renewed decline, in 2014, of official development assistance
to the poorest developing economies is of concern, especially since the enhanced
HIPC Initiative is fast approaching its end. For vulnerable countries, including small
island developing States, post-HIPC Initiative assistance is urgently needed and
should be considered swiftly. For developing countries overall, it is important to
ensure that future official development assistance terms and modalities preserve the
principle of its additionality. This is especially relevant in the context of the
ambitious post-2015 development agenda and support for climate change adaptation
measures. Policymakers in developing countries should be wary of blending
concessional assistance with complementary funds from non -concessional public or
private sources. While such blended finance can provide opportunities to meet
additional financing needs, recipient Governments of aid packages funded in part by
official development assistance should be aware of their overall financial
obligations and contingent liabilities. The danger of undermining the principle of
official development assistance additionality is not only the shift of much of the
burden of financing the new development goals to developing economies, but the
serious erosion of the contribution of international public finance to development
cooperation.
56. Although the external debt of developing countries and countries with
emerging economies declined markedly as a share of their GDP between 2000
(37.2 per cent) and 2011 (21.3 per cent) and has risen only gradually since, regional
performances have differed and developing countries now face considerable
challenges to the future sustainability of their external debt. These challenges
emanate from a combination of factors, including slower global growth since 2008,
the expected normalization of United States interest rates in the near future,
increased volatility in some commodity markets and the impact of climate change
and the increased incidence of natural disasters. Such continuing changes in the
composition of the debt of developing countries as a large and growing share of
commercial debt relative to official debt, the shift from international bank claims to
debt securities issues and heightened foreign participation in growing domestic debt
markets are a double-edged sword. As highlighted in earlier reports, while greater
access to international financial markets can facilitate resource mobilization for
growth and development, it also results in much higher market risk exposure and
more complex transmission mechanisms between monetary policies in advanced
economies and developing country debt sustainability. Consequently, the external
debt of developing countries is considerably more vulnerable today to economic
policy changes in advanced economies and to the vagaries of decision-making in
international financial markets than even a few years ago.
57. International support to ensure the effective management of day -to-day public
liabilities, through financial and technical assistance and institutional capacity -
building for public debt management, is critical to equipping developing countries
with the means to manage and assess the market-based risks to debt sustainability.
A/70/278
15-13166 18/21
Some innovative financing mechanisms, such as GDP -indexed and catastrophe
bonds, also merit further attention and may prove helpful in mitigating the growing
vulnerability of the external debt positions of developing countries. In the current
global economic environment, however, debt crises are highly likely to recur. The
ability of the international community to resolve such crises in a timely, predictable,
fair and transparent manner therefore remains of the utmost importance. The present
fragmented and ad hoc arrangements for debt resolution are unsatisfactory in that
regard, as well as excessively slow and costly. Recent IMF initiatives to improve
collective action clauses with a view to minimizing interference by non -cooperative
creditors are a step in the right direction, but are not designed to address the lack of
early crisis diagnosis and prevention. It is therefore of vital importance, in order to
achieve both greater global financial stability and sustainable long -term
development, that the international community continue its efforts to reform current
debt resolution mechanisms.

A/70/278
19/21 15-13166
Annex
External debt of developing countriesa
All developing countries and countries with
economies in transition Sub-Saharan Africa
2000-
2010 2011 2012 2013 2014b
2000-
2010 2011 2012 2013 2014b
Debt indicators (billions of
United States dollars)
Total debt stocksc 3 045.2 5 197.6 5 763.0 6 324.8 6 655.6 227.4 302.4 342.1 366.6 394.6
Long-term debt 2 358.5 3 726.7 4 163.3 4 563.0 4 735.1 179.9 239.1 269.5 290.7 314.8
Public and publicly guaranteed 1 435.2 1 847.9 2 105.9 2 311.9 2 327.6 157.9 180.2 203.8 227.2 256.0
Private non-guaranteed 923.3 1 878.8 2 057.3 2 251.1 2 407.4 22.0 58.9 65.7 63.5 58.7
Short-term debt 586.7 1 301.3 1 440.7 1 627.0 1 777.1 37.6 42.5 50.9 53.9 53.2
Arrears 88.3 59.8 69.5 63.6 64.8 37.7 26.8 28.3 29.8 30.9
Debt service 428.7 683.5 693.4 789.4 831.5 14.3 18.1 22.4 27.6 31.2
International reserves 2 508.7 5 998.9 6 296.4 6 793.1 6 701.5 85.2 146.4 164.1 166.3 158.3
Debt indicators (percentage)d
Debt service/exportse 11.3 8.0 8.1 8.8 9.2 6.8 3.8 4.8 5.8 6.8
Total debt/exports 85.0 70.7 75.9 81.1 84.0 105.7 63.0 72.4 76.8 85.2
Debt service/GDP 3.5 2.4 2.4 2.6 2.6 2.1 1.4 1.7 2.0 2.2
Total debt/GDP 26.4 21.3 22.5 23.3 23.5 32.8 23.0 25.2 26.1 27.0
Reserves/short-term debt 447.4 474.0 445.3 424.6 382.5 246.6 348.3 321.8 309.4 300.7
Reserves/money and near money 29.5 28.4 26.3 25.3 22.9 33.7 31.7 32.9 32.3 27.8
Middle East and North Africa Latin America and the Caribbean
2000-
2010 2011 2012 2013 2014b
2000-
2010 2011 2012 2013 2014b
Debt indicators (billions of
United States dollars)
Total debt stocksc 154.4 164.0 172.9 190.6 199.9 848.5 1 316.7 1 481.7 1 641.1 1 823.0
Long-term debt 123.2 120.6 130.7 147.1 157.1 699.5 1 087.5 1 230.0 1 376.0 1 509.6
Public and publicly guaranteed 117.1 112.5 121.3 136.8 146.5 436.1 537.8 613.2 669.5 718.8
Private non-guaranteed 6.1 8.0 9.5 10.2 10.6 263.4 549.7 616.8 706.4 790.8
Short-term debt 27.7 35.2 33.5 34.0 34.7 126.0 203.7 225.2 239.7 288.8
Arrears 6.4 0.8 1.4 2.1 2.2 22.5 21.3 21.3 21.7 21.9
Debt service 18.6 18.2 15.6 16.1 18.0 139.6 177.8 209.6 209.9 224.6
International reserves 208.4 382.5 389.7 400.5 390.4 325.4 743.4 804.1 802.0 827.4
Debt indicators (percentage)d
Debt service/exportse 9.1 4.5 4.5 5.0 5.7 22.4 14.2 16.4 16.4 17.9
Total debt/exports 75.3 40.5 50.1 58.7 63.2 135.9 105.1 115.9 128.3 145.1
Debt service/GDP 2.9 1.4 1.2 1.2 1.5 4.6 3.1 3.7 3.5 3.7

A/70/278
15-13166 20/21
Middle East and North Africa Latin America and the Caribbean
2000-
2010 2011 2012 2013 2014b
2000-
2010 2011 2012 2013 2014b
Total debt/GDP 23.8 13.0 13.2 14.8 16.2 28.1 23.0 25.9 27.8 30.2
Reserves/short-term debt 751.5 1 086.9 1 163.6 1 177.3 1 123.7 260.1 367.4 359.8 336.9 288.5
Reserves/money and near money 52.0 61.1 58.6 61.6 57.8 30.1 34.6 33.6 32.4 33.5
East Asia and the Pacific South Asia
2000-
2010 2011 2012 2013 2014b
2000-
2010 2011 2012 2013 2014b
Debt indicators (billions of
United States dollars)
Total debt stocksc 693.4 1 334.7 1 492.7 1 654.0 1 780.0 242.5 456.0 511.8 543.1 603.7
Long-term debt 462.8 668.3 746.6 772.9 775.3 210.2 351.5 395.4 431.3 470.5
Public and publicly guaranteed 293.0 368.7 385.4 397.9 402.3 141.1 201.8 229.5 228.4 234.5
Private non-guaranteed 169.8 299.6 361.2 375.0 372.9 69.1 149.7 165.9 202.8 236.0
Short-term debt 219.1 646.2 726.0 861.0 980.0 25.6 84.6 98.0 96.2 116.6
Arrears 11.2 6.8 6.8 5.5 5.6 0.1 0.0 0.0 0.1 0.1
Debt service 80.9 105.4 107.1 116.5 137.8 25.2 33.8 35.0 47.4 49.0
International reserves 1 349.4 3 705.5 3 866.2 4 348.3 4 359.8 177.5 306.5 305.9 313.6 353.9
Debt indicators (percentage)d
Debt service/exportse 6.5 3.4 3.2 3.3 3.6 13.2 6.3 6.6 8.4 8.4
Total debt/exports 55.5 43.0 44.4 46.3 47.1 127.3 85.0 96.0 96.6 103.5
Debt service/GDP 2.1 1.1 1.0 1.0 1.1 2.2 1.5 1.5 2.0 1.9
Total debt/GDP 18.3 14.4 14.5 14.6 14.2 21.1 20.1 22.5 23.1 23.4
Reserves/short-term debt 616.5 573.8 533.3 505.8 445.5 694.3 362.2 312.2 326.0 303.5
Reserves/money and near money 24.9 24.8 22.6 22.0 20.0 24.0 20.9 19.3 19.2 19.5
Europe and Central Asia
2000-2010 2011 2012 2013 2014b
Debt indicators (billions of
United States dollars)
Total debt stocksc 879.0 1 623.8 1 761.8 1 929.4 1 854.4
Long-term debt 683.0 1 259.7 1 391.1 1 545.0 1 508.0
Public and publicly guaranteed 290.1 446.8 552.7 651.9 569.6
Private non-guaranteed 392.9 812.8 838.4 893.1 938.4
Short-term debt 150.8 289.0 307.0 342.2 303.8
Arrears 10.4 3.9 11.5 4.4 4.1
Debt service 150.1 330.1 303.7 371.9 370.8
International reserves 362.8 714.6 766.3 762.3 611.7

A/70/278
21/21 15-13166
Europe and Central Asia
2000-2010 2011 2012 2013 2014b
Debt indicators (percentage)
d
Debt service/exportse 20.4 16.8 15.3 18.9 19.5
Total debt/exports 139.0 111.5 118.2 130.9 130.1
Debt service/GDP 6.2 5.9 5.4 6.4 6.9
Total debt/GDP 42.9 39.4 41.7 44.0 45.7
Reserves/short-term debt 280.8 279.1 270.5 239.3 216.3
Reserves/money and near money 60.7 49.9 46.2 43.1 31.9
Source: United Nations Conference on Trade and Development calculations based on the
World Bank International Debt Statistics 2015 online database.
Abbreviations: GDP, gross domestic product; GNI, gross national income.
a As defined in the Global Development Finance publication.
b 2014 estimates.
c Total debt stocks include long-term debt, short-term debt and use of IMF credit.
d Data used for ratio calculation has been adjusted according to country data availability .
e Exports comprise exports of goods, services and primary income.