Strain-softening of concrete in uniaxial compression, RILEM TC 148-SSC

Arab J Sci Eng (2014) 39:4515–4527DOI 10.1007/s13369-014-1170-z
RESEARCH ARTICLE - CIVIL ENGINEERING
A Fuzzy Model Approach to Stress–Strain Relationshipof Concrete in Compression
Ugur Sahin · Idris Bedirhanoglu
Received: 14 March 2013 / Accepted: 30 June 2013 / Published online: 3 June 2014© King Fahd University of Petroleum and Minerals 2014
Abstract In this study, a fuzzy model was developed to pre-dict the stress–strain relationship of unconfined concrete incompression. For this purpose, a database including 91 datasets was used to train and test a neuro-fuzzy system whichincluded two inputs and one output. The model can be uti-lized to predict the stress–strain relationships of the uncon-fined concrete standard cylindrical members tested by dif-ferent researchers. After the training stage, a total of 64 “if–then” fuzzy rules were obtained. Lastly, performance of themodel was evaluated and compared by the other models pro-posed by different researchers. The performance values suchas root mean square error, relative error and average of pre-dicted values to experimental values were calculated. Theseperformance values showed that the constructed neuro-fuzzymodel exhibited a high performance by means of predictionof stress–strain relationship of concrete.
Keywords Fuzzy logic · Concrete · Compressive strength ·Stress–strain relationship · ANFIS
U. SahinMulti Agent Biorobotic Laboratory, Rochester Instituteof Technology, Rochester NY, 14623, USAe-mail: [email protected]
I. Bedirhanoglu (B)Civil Engineering Department, Engineering Faculty,Dicle University, 21280 Diyarbakir, Turkeye-mail: [email protected]
1 Introduction
The realistic stress–strain behavior of the concrete is animportant input during the nonlinear analysis of reinforcedconcrete members. Since it is not simple and needs exten-sive labor to obtain the complete stress–strain relationshipof concrete experimentally, various researchers tried to useeither a theoretical or an empirical approach. In the lattercase, which is widely used, the stress–strain relationships areusually obtained as functions of unconfined concrete cylinderstrength ( f ′
co), strain at peak stress (εco) and modulus of elas-ticity (Ec), which are the main characteristics of the stress–strain relationship of concrete. The shape of the descendingpart is another main parameter, as well as f ′
co, εco and Ec.All these variables can be evaluated in terms of f ′
co. As theconcrete strength increases, the drop in the descending partbecomes steeper, εco decreases and Ec increases [1]. How-ever, changes in the mechanical characteristics of concreteare not linear with respect to the change in f ′
co, and response ofconcrete is not on a certain line; it rises depending on an area.The process of establishing a rating relationship is basically
123
4516 Arab J Sci Eng (2014) 39:4515–4527
a non-linear mapping problem. The statistical tools that arecommonly used in such situations are regression and curvefitting [2]. However, these techniques are not adequate inview of the complexity of the problem, and there is room formuch improvement. Neuro-fuzzy network system is an effec-tive practice for data processing in laboratory works [3]. Useof neural network and fuzzy systems has been recently devel-oped in various fields of civil engineering [4,5]. But this sys-tem has been rarely employed in concrete technology [6–14].Recently, an adaptive neuro-fuzzy inference system (ANFIS)has been developed. As the name suggests, ANFIS combinesthe fuzzy qualitative approach with the neural network adap-tive capabilities to achieve a desired performance [15].
This study was concerned with the application of a pow-erful tool, i.e. fuzzy logic and neural network, for predictingstress–strain relationships of unconfined concrete. A neuro-fuzzy modelling technique is more convenient to predict sucha non-linear and uncertain behavior. Hence, the main purposeof the presented study is to construct an ANFIS to predictthe all stress–strain relationship of unconfined plain concrete(normal weight). For this purpose, many test data of standardcylindrical members were collected from different studieswhich were done by different researchers [1,16–24]. Par-ticularly, tests on low strength concrete cylindrical memberswere collected from experimental studies done at the IstanbulTechnical University, Structure and Earthquake EngineeringLaboratory [19–24].
Throughout the study, some of the experimental data wereused to train the model and some of them were used to eval-uate the performance of the model. To train the model, f ′
co
Table 1 Mix-proportion of concrete cylinders (kg/m3)
Cement Water Sand Gravel Powderedstone
Superplasticizer
Mix-I 150 210 923 – 1,074 –
Mix-II 180 210 650 880 337 2.10
Mix-III 200 104 822 880 488 2.10
and the strains (εci) were entered as input while stress val-ues (σci) corresponding to each strain value were the out-puts entered. The model was tested with experimental dataused in the model construction and with experimental datathat were not used in any stage of the model construction.It was seen from results that the ANFIS model outperformsthe traditional methods in prediction of the full stress–strainrelationships realistically.
2 Data Used in the Analysis
For constructing the ANFIS model, a database used in theanalysis was formed through experiments on standard cylin-der specimens with 150 mm diameter and 300 mm height.The compressive strength range of the specimen was 5–68 MPa and the age of the specimens was at least 28 days.The experimental data used in this study can be divided intotwo parts: the first part of the data was collected from exper-imental studies conducted in the laboratories at the IstanbulTechnical University and the second part was collected fromthe literature. Some of the details of the first part of the experi-mental data which are specimens 1–10 of training data (Table4) and 1–25 of testing data (Table 5) were collected from Ilkiand Bedirhanoglu [23,24] and are given in the following. Itshould be noted that the properties of the other specimenswere nearly the same and details of these specimens can befound in [1,16–22].
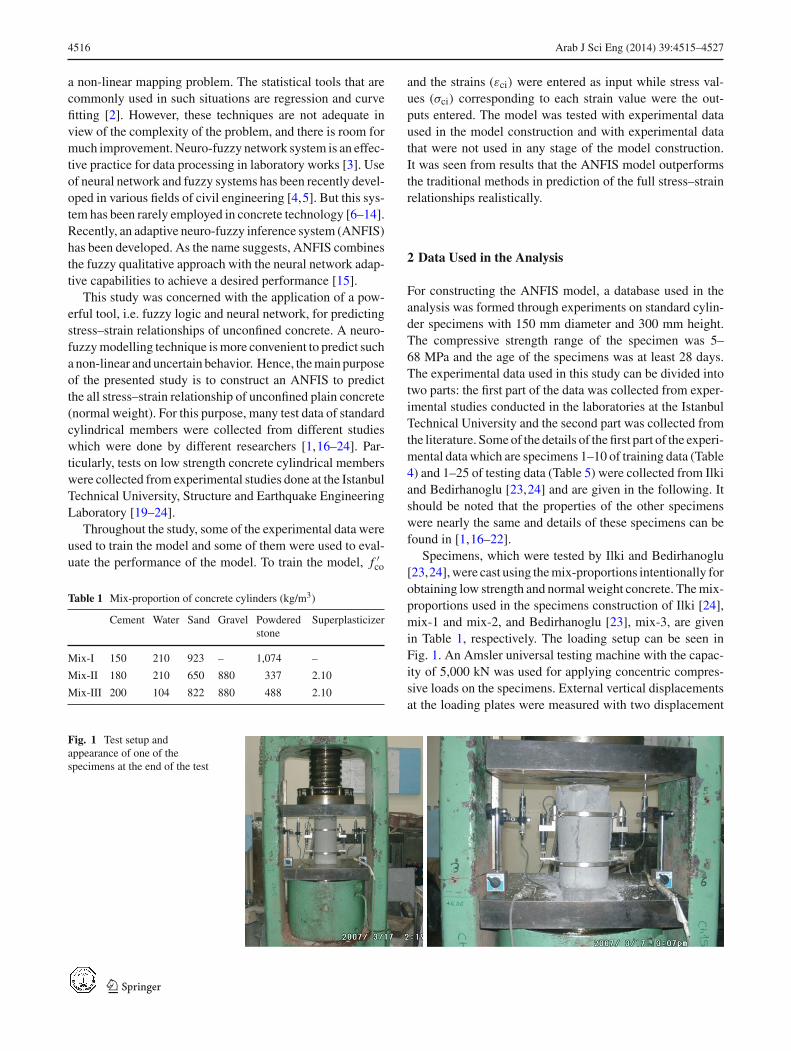
Specimens, which were tested by Ilki and Bedirhanoglu[23,24], were cast using the mix-proportions intentionally forobtaining low strength and normal weight concrete. The mix-proportions used in the specimens construction of Ilki [24],mix-1 and mix-2, and Bedirhanoglu [23], mix-3, are givenin Table 1, respectively. The loading setup can be seen inFig. 1. An Amsler universal testing machine with the capac-ity of 5,000 kN was used for applying concentric compres-sive loads on the specimens. External vertical displacementsat the loading plates were measured with two displacement
Fig. 1 Test setup andappearance of one of thespecimens at the end of the test
123
Arab J Sci Eng (2014) 39:4515–4527 4517
Table 2 Mean compressive strength of mixes at different ages (days)
Mean compressive strength of the specimensat their different ages (MPa)
Testing ages (days) 28 90 180 360
Mix-I 7.2 10.2 10.5 11
Mix-II 5 8.2 7.6 7.3
Mix-III 6.4 8.5 8.3 8.3
transducers from 300 mm gage length, and vertical displace-ments on the specimen were measured with an extensometerfrom 100 mm gage length.
The standard cylinder (150 × 300 mm) compression testswere carried out at the ages of 28, 90, 180 and 360 days. Asseen in Table 2, the compressive strength range of the spec-imens is between 6.4 and 11 MPa. In this table, compres-sive strength values represent mean values of three standardcylinder specimens. It should be noted that these compressivestrength values are very low and normally they do not usedin the construction. However, in old buildings constructedbefore 1998 found in Turkey and many other developingcountries, the general compressive strength of the concrete isaround 10 MPa [25,26]. It should also be noted that it is dif-ficult to find experimental data (stress–strain relationships)with such a low compressive strength. The elasticity modulusof specimens between the ages of 28–360 days was between14,000 and 14,700 MPa for Mix-I, 11,948 and 12,974 MPafor Mix-II and 12,567–13,600 MPa for Mix-III specimens.
It should be noted that the concrete properties of the cylin-ders which were collected from literature have nearly thesame characteristics of specimens tested in the laboratory ofthe Istanbul Technical University. In this study, a total of 91instances of experimental data were used. Fifty five of themwere used in training and checking process while the otherswere used for comparisons.
3 Existing Models for Stress–Strain Curve
Over the last few decades, many researchers have conductedexperimental and analytical studies to generate the stress–strain curves for concrete in compression. Almost all themodels were generated using the experimental data. In thisstudy, Hognestad’s [27] and Wee and Mansur’s [17] exper-imental models are used for comparison. Design formulasof these models are explained in the following while furtherdetails can be found in references [17,27].
In general, to obtain the stress–strain relationships, all themodels use the formula of εci, starting strain values from zeroand increasing to calculate the stress values. This continuesuntil the relative values are attained for stress values. Then,these stress–strain values are entered in the x–y plane to find
the stress–strain relationship. Design formulas of these mod-els are explained in the following.
Hognestad model:The following equation, which is a second degree para-
bola, was proposed by Hognestad [27],
σci = f′co
[2
(εci
εco
)−
(εci
εco
)2]
(1)
In this equation, f’co is the strength of an unconfined standardconcrete cylinder and εco is the corresponding strain whichwas assumed to be 0.002 by Hognestad. εci is the ith strainand σci is the corresponding stress. Modulus of elasticity wasalso given by Hognestad as follows:
Ec = 12, 680 + 460 f ′co (2)
Wee et al. [17] model:The following equations were proposed by Wee et al. [17]
for stress–strain relationship:
Ec = 10, 200 × ( f ′co)
1/3 (3)
εco = 0.00078( f ′co)
1/4 (4)
β = 1
1 − ( f ′co/εco Ec)
(5)
σci = f ′co
[k1β( εci
εco)
k1β − 1 + ( εciεco
)k2β
](6)
k1 =(
50
f ′co
)3
, k2 =(
50
f ′co
)1.3
(7)
It should be noted that for concrete strength f ′co ≤50 MPa, k1
and k2 should be taken as unity. Some other models, whichwere used for comparing the modulus of elasticity, are alsogiven herein.
Attard et al. [28]:
Ec = 4, 370.3 f ′0.5164co (8)
ACI [38]:
Ec = 4, 730 × √f ′co (9)
TS500 [39]:
Ec = 14, 000 + 3, 250 × √f ′co (10)
4 Neuro-Fuzzy Modelling
Fuzzy set theory, introduced by Zadeh [29,30], is a mathe-matical tool for translating abstract concepts found in naturallanguage into computable entities. Such entities are calledfuzzy sets. Fuzzy sets represent vague descriptions of objects,i.e. tall, small, cold, and bright. Mathematically, a fuzzy set A
123
4518 Arab J Sci Eng (2014) 39:4515–4527
is represented by a membership function defined on a domainX, called universe of discourse, given by:
μA : X → [0, 1] (11)
where A is the fuzzy label or linguistic (value) term describ-ing the variable x . As an extension to Boolean logic, μA(x)
represents the grade of membership of x belonging to thefuzzy set A. On specifying a membership function μA(x)
in its present context, the vague fuzzy label A is preciselydefined. Hence, fuzzy sets can be thought of as measuringthe inherent vagueness of language precisely. These proper-ties of the fuzzy sets play an important role in the modelingcapabilities of the fuzzy system, and for a model to be trulytransparent these sets should sensibly represent terms thatdescribe the input and output variables. It is up to the systemdesigner to determine the shape of the fuzzy sets. In mostcases, however, the semantics captured by fuzzy sets are nottoo sensitive to variations in the shape; hence, it is conve-nient to use simple membership functions. Fuzzy sets forma key methodology for representing and processing uncer-tainty. As such, fuzzy sets constitute a powerful approachnot only to deal with incomplete, noisy or imprecise data butalso to develop models of the data that provide smarter andsmoother performance than traditional modeling techniques[3].
A fuzzy system approximates an unknown mapping byinference from a set of humanly understandable statementsor rules such as:
IF the temperature is cold THEN set the output of the
heater to high
IF the temperature is warm THEN set the output of the
heater to zero (12)
describing a typical relationship between room temperatureand the desired output of a heater. To cover the completegraph of the mapping being approximated, a collection ofsuch rules, called the rule base, is used. Hence, fuzzy systemsrepresent the imprecision found in real-world problems usingIF–THEN rules expressed in a natural language.
The basic structure of a fuzzy system, as described byMamdani and Assillan [31], is shown in Fig. 2. A fuzzy sys-tem processes crisp data at the input and produces crisp data
OutputData
InputData
DefuzzificationFuzzification
FuzzyRule Base
Fuzzy InferenceEngine
Fig. 2 Fuzzy inference system
at the output through inference from a fuzzy rule base. There-fore, a fuzzifier is used at the front of the system to convertcrisp data to fuzzy sets, and a defuzzifier is used at the out-put of the system to convert fuzzy sets into crisp values. Thefuzzy rule base represents the knowledge base of the system.The fuzzy inference engine combines the rules in the rulebase according to approximate reasoning theory to producea mapping from fuzzy sets in the input space to fuzzy sets inthe output space. Hence, a fuzzy system provides a compu-tational scheme describing how rules must be evaluated andcombined to compute a crisp output value (vector) for anyinput crisp value. Therefore, one can think of a fuzzy systemsimply as a parameterized function that maps real vectors toreal vectors [32].
In the applications of the fuzzy system in control and fore-casting, there are mainly two approaches, namely, the Mam-dani and the TS methods (Takagi and Sugeno [36]). For thefirst approach, there are clear procedures, i.e. fuzzification,inference and defuzzification procedure. The main differencebetween the Mamdani and the TS approach originates fromdefuzzification procedure. For the Mamdani approach, eachIF–THEN rule produces a fuzzy set for the output variable,and hence the step of defuzzification is indispensable so as toobtain crisp values of the output variable. However, in the TSmethod, outcome of each IF–THEN inference rule is a scalarrather than a fuzzy set for the output variable. The defuzzifi-cation procedure is completed simply in TS method by takingthe weighted average of the rule outcome. The main prob-lem with TS fuzzy logic modeling is related to the choice ofthe parameters. For this reason, the adaptive network-basedfuzzy inference system (ANFIS) methodology as first pro-posed by Jang [33] is applied to estimate the parameters ofthe membership and the consequent functions [34].
4.1 T–S Type Fuzzy System
Neuro-fuzzy hybrid systems combine the advantages of fuzzysystems, which deal with explicit knowledge which can beexplained and understood, and neural networks which dealwith implicit knowledge which can be acquired by learn-ing. Neural network learning provides a good way to adjustthe expert’s knowledge and automatically generate additionalfuzzy rules and membership functions to meet certain spec-ifications and reduce design time and costs.
Adaptive network-based fuzzy inference systems arefuzzy Sugeno models put in the framework of adaptive sys-tems to facilitate learning and adaptation. Such frameworkmakes fuzzy models more systematic and less relying onexpert knowledge [35]. In Fig. 3, the inference methodol-ogy of a first-order Sugeno-type fuzzy inference system isdenoted [33].
To present the proposed model, let us consider a first-orderSugeno model:
123
Arab J Sci Eng (2014) 39:4515–4527 4519
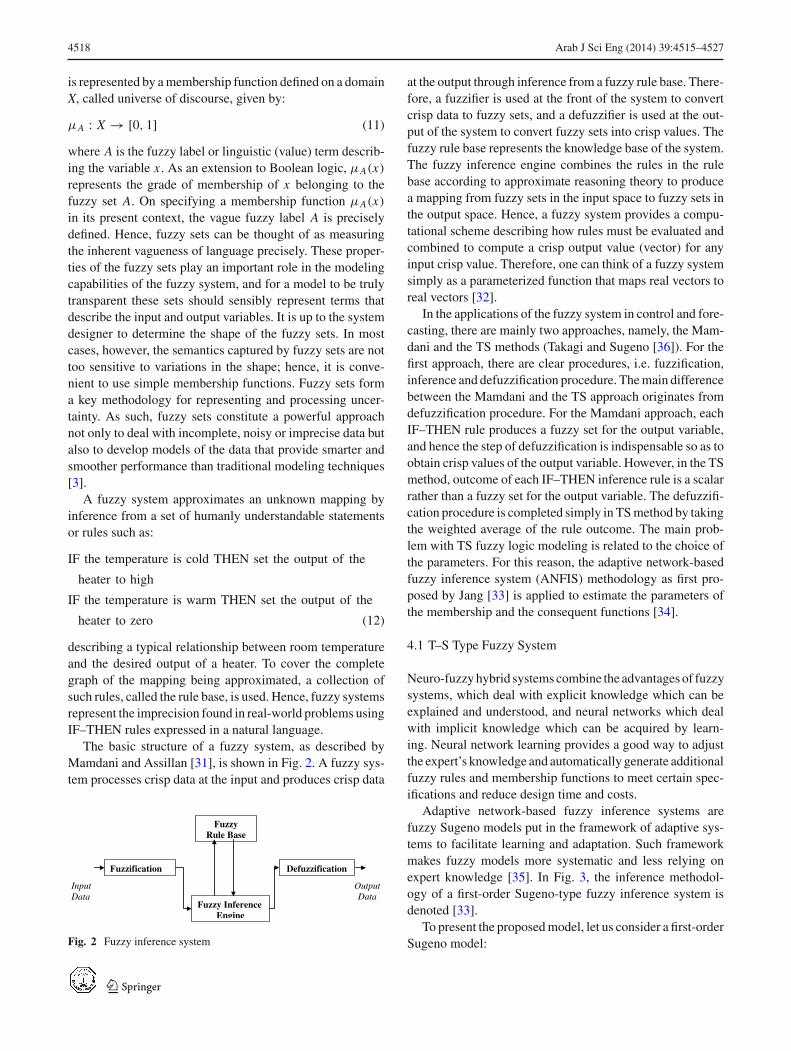
Fig. 3 First order T–S typefuzzy system with two variables
Rule 2
µ(x)
Rule 1
µ(x)
a1
a2
µ(y)
µ(y)
b1
b2
A1
A2
B1
B2
X
X
Y
Y
x
x
y
y
Minimum or Product[min(ai,bi) or aixbi]
w1 z1= p1x+q1y+r1
w2 z2= p2x+q2y+r2
1 1 2 2
1 2
w z w zz
w w
+=+
10 20 30 40 50 60
0
0.2
0.4
0.6
0.8
1
Stress
Deg
ree
of m
embe
rshi
p
fcmf1 fcmf2 fcmf3 fcmf4 fcmf5 fcmf6 fcmf7 fcmf8
0 1 2 3 4 5 6 7
x 10-3
0
0.2
0.4
0.6
0.8
1
Strain
Deg
ree
of m
embe
rshi
p
ecmf1 ecmf2 ecmf3ecmf4 ecmf5 ecmf6ecmf7 ecmf8
(a) (b)
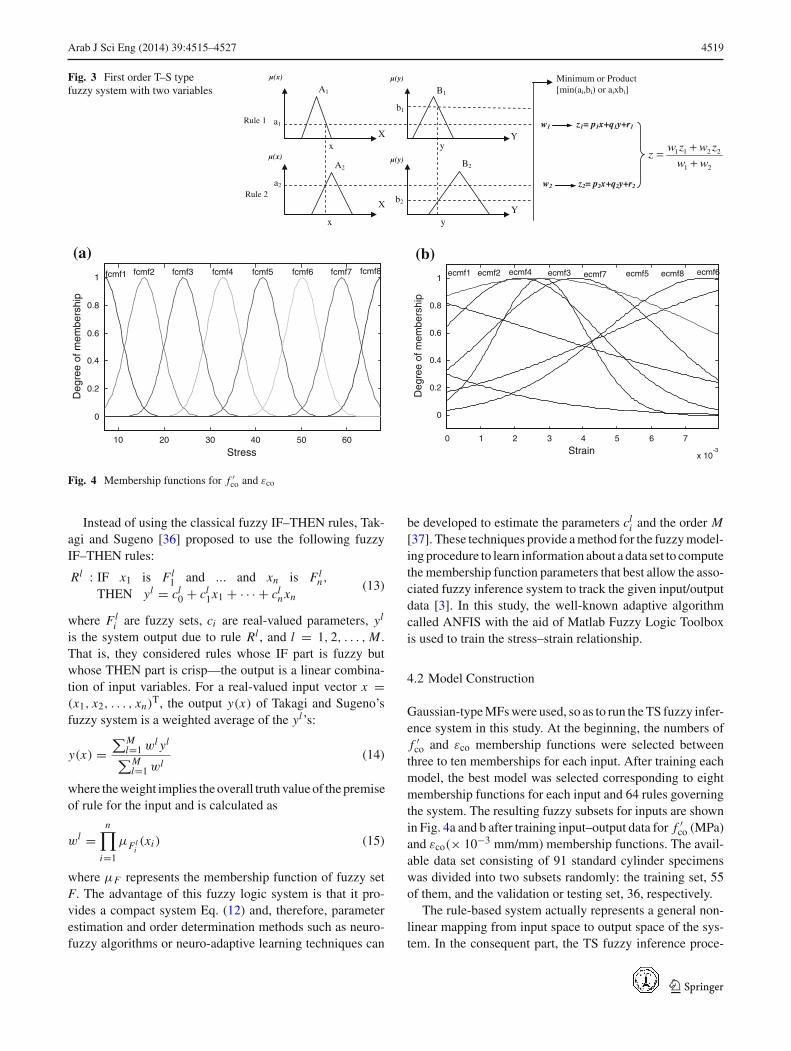
Fig. 4 Membership functions for f ′co and εco
Instead of using the classical fuzzy IF–THEN rules, Tak-agi and Sugeno [36] proposed to use the following fuzzyIF–THEN rules:
Rl : IF x1 is Fl1 and ... and xn is Fl
n,
THEN yl = cl0 + cl
1x1 + · · · + cln xn
(13)
where Fli are fuzzy sets, ci are real-valued parameters, yl
is the system output due to rule Rl , and l = 1, 2, . . . , M .That is, they considered rules whose IF part is fuzzy butwhose THEN part is crisp—the output is a linear combina-tion of input variables. For a real-valued input vector x =(x1, x2, . . . , xn)T, the output y(x) of Takagi and Sugeno’sfuzzy system is a weighted average of the yl ’s:
y(x) =∑M
l=1 wl yl∑Ml=1 wl
(14)
where the weight implies the overall truth value of the premiseof rule for the input and is calculated as
wl =n∏
i=1
μFli(xi ) (15)
where μF represents the membership function of fuzzy setF. The advantage of this fuzzy logic system is that it pro-vides a compact system Eq. (12) and, therefore, parameterestimation and order determination methods such as neuro-fuzzy algorithms or neuro-adaptive learning techniques can
be developed to estimate the parameters cli and the order M
[37]. These techniques provide a method for the fuzzy model-ing procedure to learn information about a data set to computethe membership function parameters that best allow the asso-ciated fuzzy inference system to track the given input/outputdata [3]. In this study, the well-known adaptive algorithmcalled ANFIS with the aid of Matlab Fuzzy Logic Toolboxis used to train the stress–strain relationship.
4.2 Model Construction
Gaussian-type MFs were used, so as to run the TS fuzzy infer-ence system in this study. At the beginning, the numbers off ′co and εco membership functions were selected between
three to ten memberships for each input. After training eachmodel, the best model was selected corresponding to eightmembership functions for each input and 64 rules governingthe system. The resulting fuzzy subsets for inputs are shownin Fig. 4a and b after training input–output data for f ′
co (MPa)and εco(× 10−3 mm/mm) membership functions. The avail-able data set consisting of 91 standard cylinder specimenswas divided into two subsets randomly: the training set, 55of them, and the validation or testing set, 36, respectively.
The rule-based system actually represents a general non-linear mapping from input space to output space of the sys-tem. In the consequent part, the TS fuzzy inference proce-
123
4520 Arab J Sci Eng (2014) 39:4515–4527
Table 3 Rule base forstress–strain relationship Rule # Antecedent Consequent
1 IF f ′c0
is fcmf1 and εc is εcmf1 σ1 = 0.7411 fc − 93.26εc − 75.78
2 IF f ′c0
is fcmf2 and εc is εcmf2 σ2 = −0.4434 fc − 14.77εc + 64.02
3 IF f ′c0
is fcmf3 and εc is εcmf3 σ3 = 0.2535 fc − 11.2εc − 24.22
4 IF f ′c0
is fcmf4 and εc is εcmf4 σ4 = −0.2144 fc − 15.03εc + 45.55
THEN
62 IF f ′c0
is fcmf62 and εc is εcmf62 σ62 = 0.2676 fc − 8.055εc + 43.2
63 IF f ′c0
is fcmf62 and εc is εcmf63 σ63 = 0.278 fc + 2.181εc + 48.57
64 IF f ′c0
is fcmf62 and εc is εcmf64 σ64 = 0.0827 fc − 7.043εc + 11.87
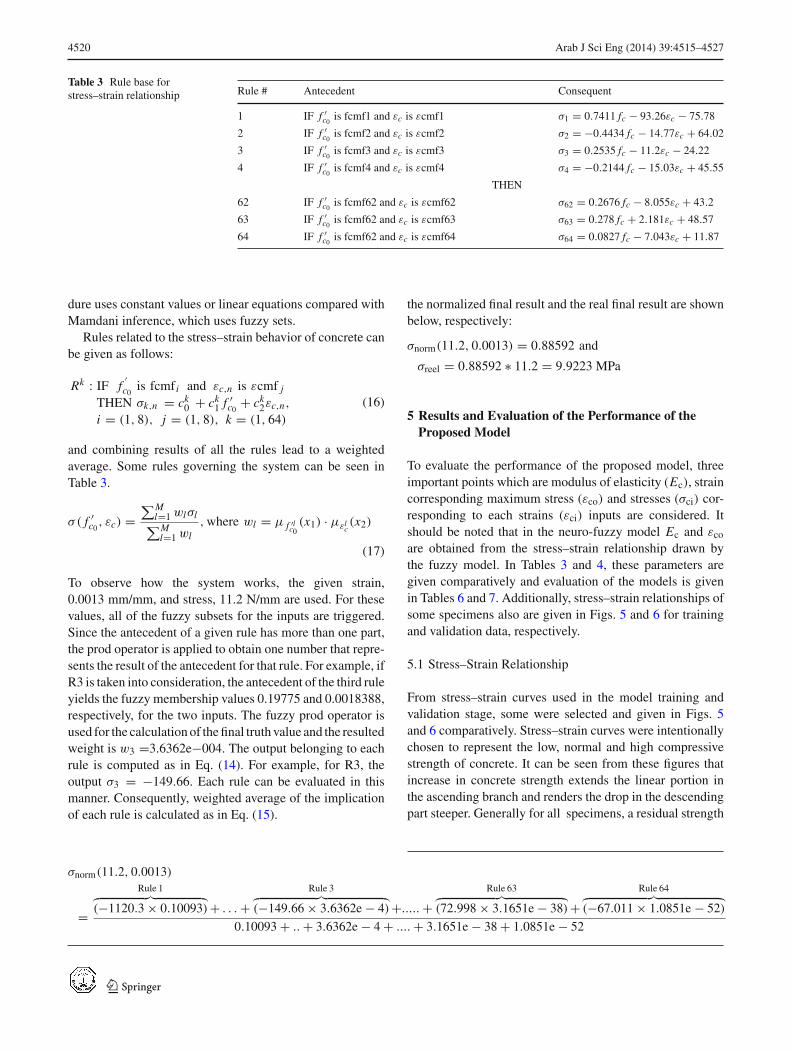
dure uses constant values or linear equations compared withMamdani inference, which uses fuzzy sets.
Rules related to the stress–strain behavior of concrete canbe given as follows:
Rk : IF f′c0
is fcmf i and εc,n is εcmf j
THEN σk,n = ck0 + ck
1 f ′c0
+ ck2εc,n,
i = (1, 8), j = (1, 8), k = (1, 64)
(16)
and combining results of all the rules lead to a weightedaverage. Some rules governing the system can be seen inTable 3.
σ( f ′c0
, εc) =∑M
l=1 wlσl∑Ml=1 wl
, where wl = μ f ′lc0
(x1) · μεlc(x2)
(17)
To observe how the system works, the given strain,0.0013 mm/mm, and stress, 11.2 N/mm are used. For thesevalues, all of the fuzzy subsets for the inputs are triggered.Since the antecedent of a given rule has more than one part,the prod operator is applied to obtain one number that repre-sents the result of the antecedent for that rule. For example, ifR3 is taken into consideration, the antecedent of the third ruleyields the fuzzy membership values 0.19775 and 0.0018388,respectively, for the two inputs. The fuzzy prod operator isused for the calculation of the final truth value and the resultedweight is w3 =3.6362e−004. The output belonging to eachrule is computed as in Eq. (14). For example, for R3, theoutput σ3 = −149.66. Each rule can be evaluated in thismanner. Consequently, weighted average of the implicationof each rule is calculated as in Eq. (15).
σnorm(11.2, 0.0013)
=Rule 1︷ ︸︸ ︷
(−1120.3 × 0.10093) + . . . +Rule 3︷ ︸︸ ︷
(−149.66 × 3.6362e − 4) +..... +Rule 63︷ ︸︸ ︷
(72.998 × 3.1651e − 38) +Rule 64︷ ︸︸ ︷
(−67.011 × 1.0851e − 52)
0.10093 + .. + 3.6362e − 4 + .... + 3.1651e − 38 + 1.0851e − 52
the normalized final result and the real final result are shownbelow, respectively:
σnorm(11.2, 0.0013) = 0.88592 and
σreel = 0.88592 ∗ 11.2 = 9.9223 MPa
5 Results and Evaluation of the Performance of theProposed Model
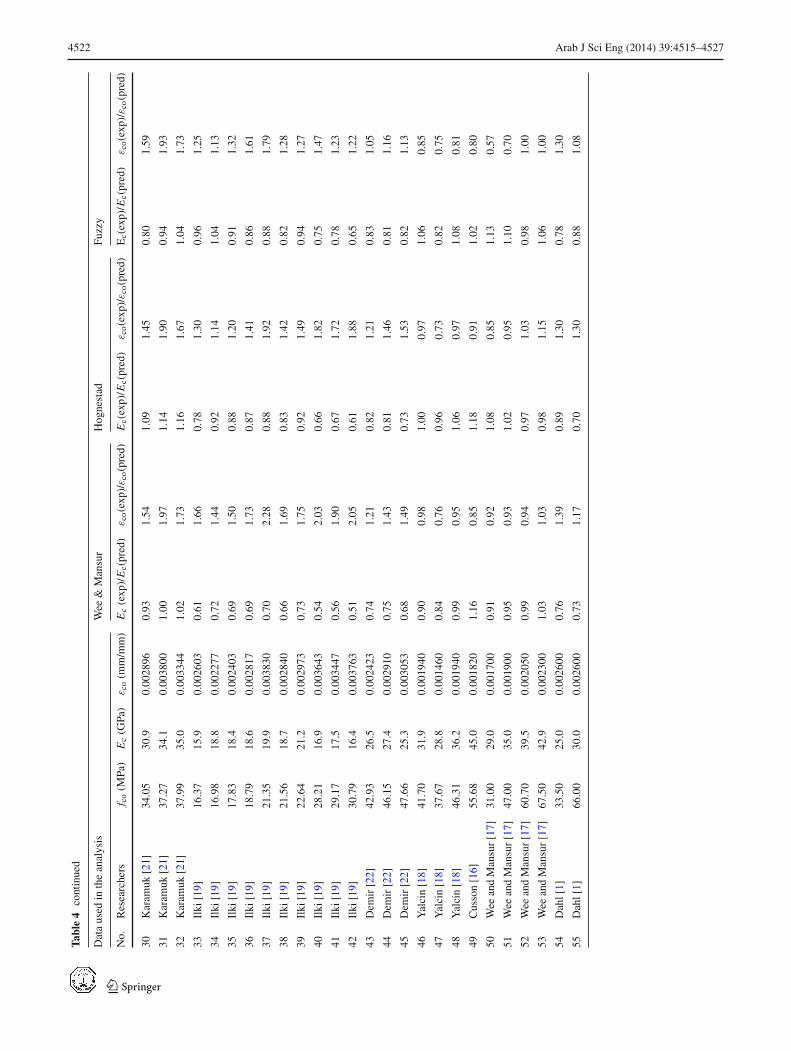
To evaluate the performance of the proposed model, threeimportant points which are modulus of elasticity (Ec), straincorresponding maximum stress (εco) and stresses (σci) cor-responding to each strains (εci) inputs are considered. Itshould be noted that in the neuro-fuzzy model Ec and εco
are obtained from the stress–strain relationship drawn bythe fuzzy model. In Tables 3 and 4, these parameters aregiven comparatively and evaluation of the models is givenin Tables 6 and 7. Additionally, stress–strain relationships ofsome specimens also are given in Figs. 5 and 6 for trainingand validation data, respectively.
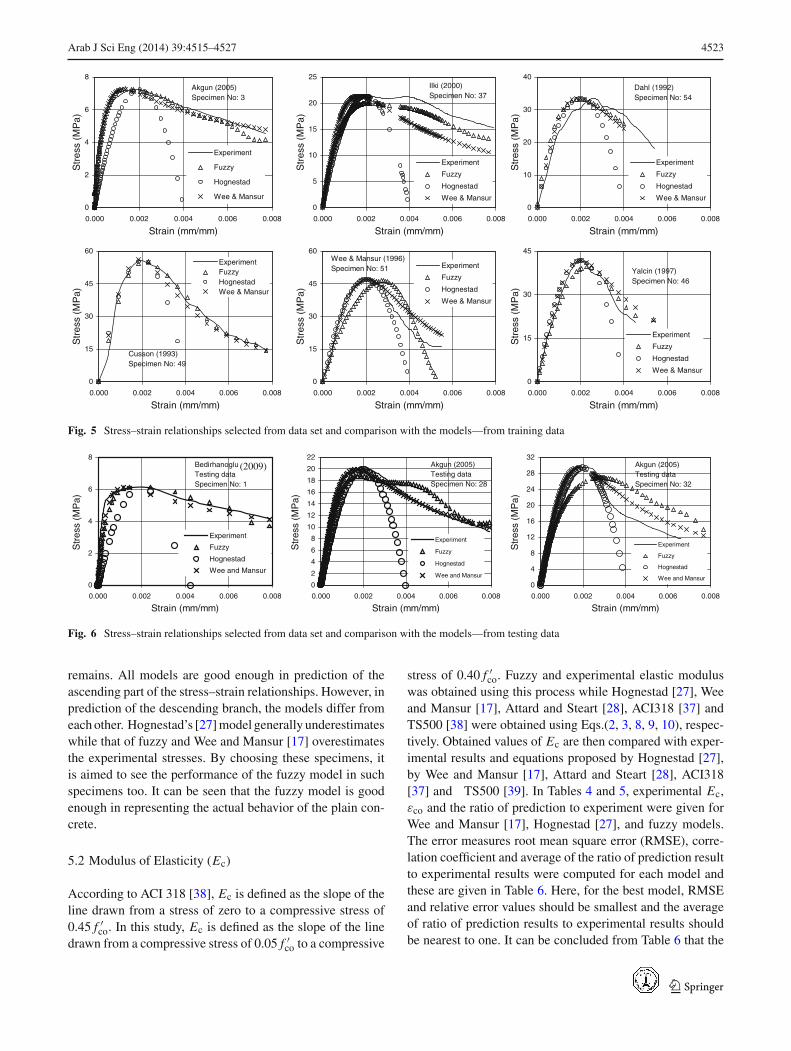
5.1 Stress–Strain Relationship
From stress–strain curves used in the model training andvalidation stage, some were selected and given in Figs. 5and 6 comparatively. Stress–strain curves were intentionallychosen to represent the low, normal and high compressivestrength of concrete. It can be seen from these figures thatincrease in concrete strength extends the linear portion inthe ascending branch and renders the drop in the descendingpart steeper. Generally for all specimens, a residual strength
123

Arab J Sci Eng (2014) 39:4515–4527 4521
Tabl
e4
Com
pari
son
ofex
peri
men
tala
ndan
alyt
ical
resu
lts-t
rain
ing
data
Dat
aus
edin
the
anal
ysis
Wee
&M
ansu
rH
ogne
stad
Fuzz
y
No.
Res
earc
hers
f co
(MPa
)E
c(G
Pa)
εco
(mm
/mm
)E
c(e
xp)/
Ec(
pred
)ε
co(e
xp)/ε
co(p
red)
Ec(
exp)
/Ec(
pred
)ε
co(e
xp)/ε
co(p
red)
Ec(
exp)
/Ec(
pred
)ε
co(e
xp)/ε
co(p
red)
1Il
kiet
al.[
24]
6.90
14.4
0.00
1793
0.74
1.42
0.91
0.90
1.15
1.28
2Il
kiet
al.[
24]
7.20
13.6
0.00
1653
0.69
1.29
0.85
0.83
1.03
0.95
3Il
kiet
al.[
24]
7.50
14.0
0.00
1517
0.70
1.17
0.87
0.76
1.03
1.00
4Il
kiet
al.[
24]
9.80
15.0
0.00
1877
0.69
1.36
0.87
0.94
0.91
1.15
5Il
kiet
al.[
24]
10.1
013
.50.
0017
170.
611.
230.
780.
860.
830.
74
6Il
kiet
al.[
24]
10.1
012
.70.
0026
930.
581.
940.
731.
350.
781.
29
7Il
kiet
al.[
24]
10.3
013
.50.
0027
170.
611.
940.
781.
360.
841.
14
8Il
kiet
al.[
24]
10.6
015
.00.
0021
830.
671.
550.
861.
090.
950.
82
9Il
kiet
al.[
24]
10.7
014
.10.
0026
600.
631.
890.
801.
330.
901.
00
10Il
kiet
al.[
24]
10.7
015
.10.
0019
070.
671.
350.
860.
950.
960.
75
11A
kgun
[20]
19.4
024
.10.
0014
870.
880.
911.
120.
741.
070.
84
12A
kgun
[20]
19.9
024
.40.
0018
430.
881.
121.
120.
921.
071.
00
13A
kgun
[20]
20.0
029
.50.
0015
701.
060.
951.
350.
791.
290.
90
14A
kgun
[20]
25.3
021
.10.
0021
830.
701.
250.
871.
090.
891.
00
15A
kgun
[20]
26.6
023
.90.
0022
530.
791.
270.
961.
131.
021.
00
16A
kgun
[20]
25.7
022
.50.
0021
670.
751.
230.
921.
080.
960.
94
17K
aram
uk[2
1]11
.44
24.1
0.00
1500
1.05
1.05
1.34
0.75
1.67
0.55
18K
aram
uk[2
1]13
.22
10.5
0.00
2925
0.44
1.97
0.56
1.46
0.88
1.00
19K
aram
uk[2
1]14
.22
10.0
0.00
2616
0.40
1.73
0.52
1.31
0.80
0.91
20K
aram
uk[2
1]14
.39
13.6
0.00
2245
0.55
1.48
0.71
1.12
1.06
0.74
21K
aram
uk[2
1]15
.72
11.0
0.00
2047
0.43
1.32
0.55
1.02
0.72
0.74
22K
aram
uk[2
1]16
.00
11.8
0.00
2204
0.46
1.41
0.59
1.10
0.76
0.93
23K
aram
uk[2
1]16
.05
9.3
0.00
2432
0.36
1.56
0.46
1.22
0.58
1.00
24K
aram
uk[2
1]23
.11
27.6
0.00
1577
0.95
0.92
1.19
0.79
1.22
0.70
25K
aram
uk[2
1]27
.22
34.2
0.00
3122
1.12
1.75
1.36
1.56
1.48
1.28
26K
aram
uk[2
1]27
.49
33.7
0.00
1998
1.09
1.12
1.33
1.00
1.46
0.84
27K
aram
uk[2
1]28
.05
29.8
0.00
3643
0.96
2.03
1.17
1.82
1.32
1.46
28K
aram
uk[2
1]30
.94
32.1
0.00
3189
1.00
1.73
1.19
1.59
1.23
1.01
29K
aram
uk[2
1]31
.55
31.8
0.00
2813
0.99
1.52
1.17
1.41
1.12
1.01
123
4522 Arab J Sci Eng (2014) 39:4515–4527
Tabl
e4
cont
inue
d
Dat
aus
edin
the
anal
ysis
Wee
&M
ansu
rH
ogne
stad
Fuzz
y
No.
Res
earc
hers
f co
(MPa
)E
c(G
Pa)
εco
(mm
/mm
)E
c(e
xp)/
Ec(
pred
)ε
co(e
xp)/ε
co(p
red)
Ec(
exp)
/Ec(
pred
)ε
co(e
xp)/ε
co(p
red)
Ec(
exp)
/Ec(
pred
)ε
co(e
xp)/ε
co(p
red)
30K
aram
uk[2
1]34
.05
30.9
0.00
2896
0.93
1.54
1.09
1.45
0.80
1.59
31K
aram
uk[2
1]37
.27
34.1
0.00
3800
1.00
1.97
1.14
1.90
0.94
1.93
32K
aram
uk[2
1]37
.99
35.0
0.00
3344
1.02
1.73
1.16
1.67
1.04
1.73
33Il
ki[1
9]16
.37
15.9
0.00
2603
0.61
1.66
0.78
1.30
0.96
1.25
34Il
ki[1
9]16
.98
18.8
0.00
2277
0.72
1.44
0.92
1.14
1.04
1.13
35Il
ki[1
9]17
.83
18.4
0.00
2403
0.69
1.50
0.88
1.20
0.91
1.32
36Il
ki[1
9]18
.79
18.6
0.00
2817
0.69
1.73
0.87
1.41
0.86
1.61
37Il
ki[1
9]21
.35
19.9
0.00
3830
0.70
2.28
0.88
1.92
0.88
1.79
38Il
ki[1
9]21
.56
18.7
0.00
2840
0.66
1.69
0.83
1.42
0.82
1.28
39Il
ki[1
9]22
.64
21.2
0.00
2973
0.73
1.75
0.92
1.49
0.94
1.27
40Il
ki[1
9]28
.21
16.9
0.00
3643
0.54
2.03
0.66
1.82
0.75
1.47
41Il
ki[1
9]29
.17
17.5
0.00
3447
0.56
1.90
0.67
1.72
0.78
1.23
42Il
ki[1
9]30
.79
16.4
0.00
3763
0.51
2.05
0.61
1.88
0.65
1.22
43D
emir
[22]
42.9
326
.50.
0024
230.
741.
210.
821.
210.
831.
05
44D
emir
[22]
46.1
527
.40.
0029
100.
751.
430.
811.
460.
811.
16
45D
emir
[22]
47.6
625
.30.
0030
530.
681.
490.
731.
530.
821.
13
46Y
alci
n[1
8]41
.70
31.9
0.00
1940
0.90
0.98
1.00
0.97
1.06
0.85
47Y
alci
n[1
8]37
.67
28.8
0.00
1460
0.84
0.76
0.96
0.73
0.82
0.75
48Y
alci
n[1
8]46
.31
36.2
0.00
1940
0.99
0.95
1.06
0.97
1.08
0.81
49C
usso
n[1
6]55
.68
45.0
0.00
1820
1.16
0.85
1.18
0.91
1.02
0.80
50W
eean
dM
ansu
r[1
7]31
.00
29.0
0.00
1700
0.91
0.92
1.08
0.85
1.13
0.57
51W
eean
dM
ansu
r[1
7]47
.00
35.0
0.00
1900
0.95
0.93
1.02
0.95
1.10
0.70
52W
eean
dM
ansu
r[1
7]60
.70
39.5
0.00
2050
0.99
0.94
0.97
1.03
0.98
1.00
53W
eean
dM
ansu
r[1
7]67
.50
42.9
0.00
2300
1.03
1.03
0.98
1.15
1.06
1.00
54D
ahl[
1]33
.50
25.0
0.00
2600
0.76
1.39
0.89
1.30
0.78
1.30
55D
ahl[
1]66
.00
30.0
0.00
2600
0.73
1.17
0.70
1.30
0.88
1.08
123
Arab J Sci Eng (2014) 39:4515–4527 4523
0
2
4
6
8
0.000 0.002 0.004 0.006 0.008
Strain (mm/mm)
Str
ess
(MP
a)
Experiment
Fuzzy
Hognestad
Wee & Mansur
Akgun (2005)Specimen No: 3
0
5
10
15
20
25
0.000 0.002 0.004 0.006 0.008
Strain (mm/mm)
Str
ess
(MP
a)
Experiment
Fuzzy
Hognestad
Wee & Mansur
Ilki (2000)Specimen No: 37
0
10
20
30
40
0.000 0.002 0.004 0.006 0.008
Strain (mm/mm)
Str
ess
(MP
a)
Experiment
Fuzzy
Hognestad
Wee & Mansur
Dahl (1992)Specimen No: 54
0
15
30
45
0.000 0.002 0.004 0.006 0.008
Strain (mm/mm)
Str
ess
(MP
a)
Experiment
Fuzzy
Hognestad
Wee & Mansur
Yalcin (1997)Specimen No: 46
0
15
30
45
60
0.000 0.002 0.004 0.006 0.008
Strain (mm/mm)
Str
ess
(MP
a)
Experiment
Fuzzy
Hognestad
Wee & Mansur
Wee & Mansur (1996)Specimen No: 51
0
15
30
45
60
0.000 0.002 0.004 0.006 0.008
Strain (mm/mm)
Str
ess
(MP
a)
ExperimentFuzzyHognestadWee & Mansur
Cusson (1993)Specimen No: 49
Fig. 5 Stress–strain relationships selected from data set and comparison with the models—from training data
0
2
4
6
8
0.000 0.002 0.004 0.006 0.008
Strain (mm/mm)
Str
ess
(MP
a)
Experiment
Fuzzy
Hognestad
Wee and Mansur
Bedirhanoglu (2007)Testing dataSpecimen No: 1
0
2
4
6
8
10
12
14
16
18
20
22
0.000 0.002 0.004 0.006 0.008
Strain (mm/mm)
Str
ess
(MP
a)
Experiment
Fuzzy
Hognestad
Wee and Mansur
Akgun (2005)Testing dataSpecimen No: 28
0
4
8
12
16
20
24
28
32
0.000 0.002 0.004 0.006 0.008
Strain (mm/mm)
Str
ess
(MP
a)
Experiment
Fuzzy
Hognestad
Wee and Mansur
Akgun (2005)Testing dataSpecimen No: 32
(2009)
Fig. 6 Stress–strain relationships selected from data set and comparison with the models—from testing data
remains. All models are good enough in prediction of theascending part of the stress–strain relationships. However, inprediction of the descending branch, the models differ fromeach other. Hognestad’s [27] model generally underestimateswhile that of fuzzy and Wee and Mansur [17] overestimatesthe experimental stresses. By choosing these specimens, itis aimed to see the performance of the fuzzy model in suchspecimens too. It can be seen that the fuzzy model is goodenough in representing the actual behavior of the plain con-crete.
5.2 Modulus of Elasticity (Ec)
According to ACI 318 [38], Ec is defined as the slope of theline drawn from a stress of zero to a compressive stress of0.45 f ′
co. In this study, Ec is defined as the slope of the linedrawn from a compressive stress of 0.05 f ′
co to a compressive
stress of 0.40 f ′co. Fuzzy and experimental elastic modulus
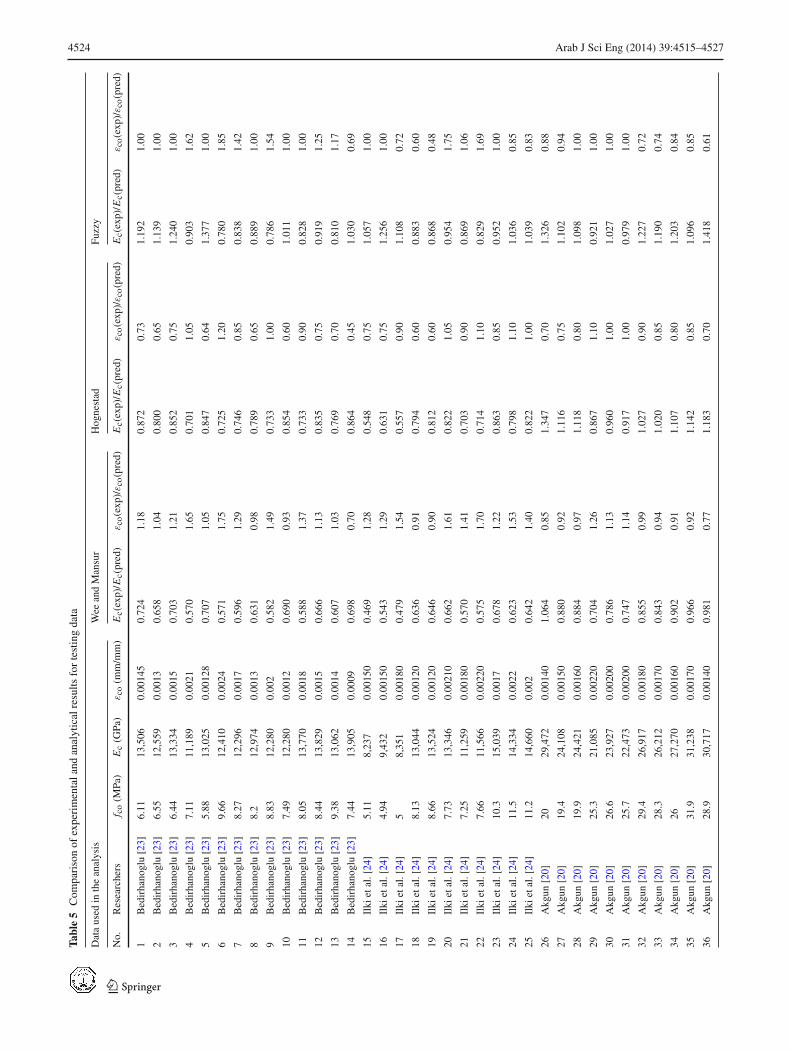
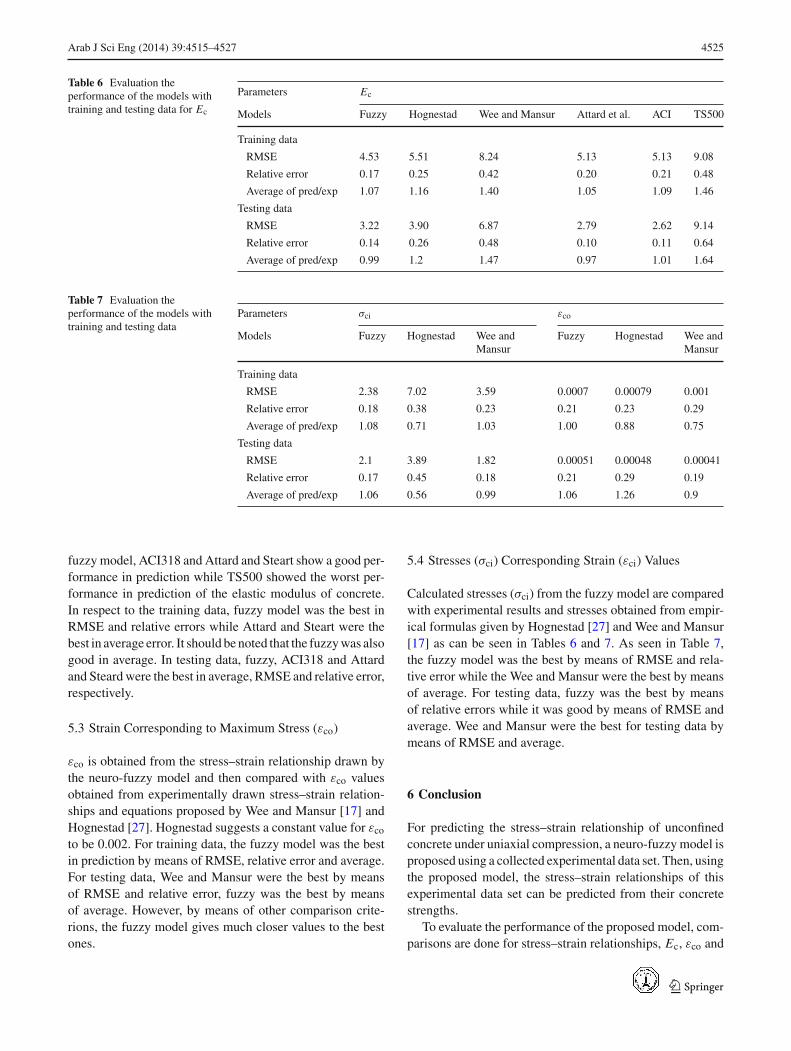
was obtained using this process while Hognestad [27], Weeand Mansur [17], Attard and Steart [28], ACI318 [37] andTS500 [38] were obtained using Eqs.(2, 3, 8, 9, 10), respec-tively. Obtained values of Ec are then compared with exper-imental results and equations proposed by Hognestad [27],by Wee and Mansur [17], Attard and Steart [28], ACI318[37] and TS500 [39]. In Tables 4 and 5, experimental Ec,εco and the ratio of prediction to experiment were given forWee and Mansur [17], Hognestad [27], and fuzzy models.The error measures root mean square error (RMSE), corre-lation coefficient and average of the ratio of prediction resultto experimental results were computed for each model andthese are given in Table 6. Here, for the best model, RMSEand relative error values should be smallest and the averageof ratio of prediction results to experimental results shouldbe nearest to one. It can be concluded from Table 6 that the
123
4524 Arab J Sci Eng (2014) 39:4515–4527
Tabl
e5
Com
pari
son
ofex
peri
men
tala
ndan
alyt
ical
resu
ltsfo
rte
stin
gda
ta
Dat
aus
edin
the
anal
ysis
Wee
and
Man
sur
Hog
nest
adFu
zzy
No.
Res
earc
hers
f co
(MPa
)E
c(G
Pa)
εco
(mm
/mm
)E
c(ex
p)/E
c(pr
ed)
εco
(exp
)/ε
co(p
red)
Ec(
exp)
/Ec(
pred
)ε
co(e
xp)/ε
co(p
red)
Ec(
exp)
/Ec(
pred
)ε
co(e
xp)/ε
co(p
red)
1B
edir
hano
glu
[23]
6.11
13,5
060.
0014
50.
724
1.18
0.87
20.
731.
192
1.00
2B
edir
hano
glu
[23]
6.55
12,5
590.
0013
0.65
81.
040.
800
0.65
1.13
91.
00
3B
edir
hano
glu
[23]
6.44
13,3
340.
0015
0.70
31.
210.
852
0.75
1.24
01.
00
4B
edir
hano
glu
[23]
7.11
11,1
890.
0021
0.57
01.
650.
701
1.05
0.90
31.
62
5B
edir
hano
glu
[23]
5.88
13,0
250.
0012
80.
707
1.05
0.84
70.
641.
377
1.00
6B
edir
hano
glu
[23]
9.66
12,4
100.
0024
0.57
11.
750.
725
1.20
0.78
01.
85
7B
edir
hano
glu
[23]
8.27
12,2
960.
0017
0.59
61.
290.
746
0.85
0.83
81.
42
8B
edir
hano
glu
[23]
8.2
12,9
740.
0013
0.63
10.
980.
789
0.65
0.88
91.
00
9B
edir
hano
glu
[23]
8.83
12,2
800.
002
0.58
21.
490.
733
1.00
0.78
61.
54
10B
edir
hano
glu
[23]
7.49
12,2
800.
0012
0.69
00.
930.
854
0.60
1.01
11.
00
11B
edir
hano
glu
[23]
8.05
13,7
700.
0018
0.58
81.
370.
733
0.90
0.82
81.
00
12B
edir
hano
glu
[23]
8.44
13,8
290.
0015
0.66
61.
130.
835
0.75
0.91
91.
25
13B
edir
hano
glu
[23]
9.38
13,0
620.
0014
0.60
71.
030.
769
0.70
0.81
01.
17
14B
edir
hano
glu
[23]
7.44
13,9
050.
0009
0.69
80.
700.
864
0.45
1.03
00.
69
15Il
kiet
al.[
24]
5.11
8,23
70.
0015
00.
469
1.28
0.54
80.
751.
057
1.00
16Il
kiet
al.[
24]
4.94
9,43
20.
0015
00.
543
1.29
0.63
10.
751.
256
1.00
17Il
kiet
al.[
24]
58,
351
0.00
180
0.47
91.
540.
557
0.90
1.10
80.
72
18Il
kiet
al.[
24]
8.13
13,0
440.
0012
00.
636
0.91
0.79
40.
600.
883
0.60
19Il
kiet
al.[
24]
8.66
13,5
240.
0012
00.
646
0.90
0.81
20.
600.
868
0.48
20Il
kiet
al.[
24]
7.73
13,3
460.
0021
00.
662
1.61
0.82
21.
050.
954
1.75
21Il
kiet
al.[
24]
7.25
11,2
590.
0018
00.
570
1.41
0.70
30.
900.
869
1.06
22Il
kiet
al.[
24]
7.66
11,5
660.
0022
00.
575
1.70
0.71
41.
100.
829
1.69
23Il
kiet
al.[
24]
10.3
15,0
390.
0017
0.67
81.
220.
863
0.85
0.95
21.
00
24Il
kiet
al.[
24]
11.5
14,3
340.
0022
0.62
31.
530.
798
1.10
1.03
60.
85
25Il
kiet
al.[
24]
11.2
14,6
600.
002
0.64
21.
400.
822
1.00
1.03
90.
83
26A
kgun
[20]
2029
,472
0.00
140
1.06
40.
851.
347
0.70
1.32
60.
88
27A
kgun
[20]
19.4
24,1
080.
0015
00.
880
0.92
1.11
60.
751.
102
0.94
28A
kgun
[20]
19.9
24,4
210.
0016
00.
884
0.97
1.11
80.
801.
098
1.00
29A
kgun
[20]
25.3
21,0
850.
0022
00.
704
1.26
0.86
71.
100.
921
1.00
30A
kgun
[20]
26.6
23,9
270.
0020
00.
786
1.13
0.96
01.
001.
027
1.00
31A
kgun
[20]
25.7
22,4
730.
0020
00.
747
1.14
0.91
71.
000.
979
1.00
32A
kgun
[20]
29.4
26,9
170.
0018
00.
855
0.99
1.02
70.
901.
227
0.72
33A
kgun
[20]
28.3
26,2
120.
0017
00.
843
0.94
1.02
00.
851.
190
0.74
34A
kgun
[20 ]
2627
,270
0.00
160
0.90
20.
911.
107
0.80
1.20
30.
84
35A
kgun
[20]
31.9
31,2
380.
0017
00.
966
0.92
1.14
20.
851.
096
0.85
36A
kgun
[20]
28.9
30,7
170.
0014
00.
981
0.77
1.18
30.
701.
418
0.61
123
Arab J Sci Eng (2014) 39:4515–4527 4525
Table 6 Evaluation theperformance of the models withtraining and testing data for Ec
Parameters Ec
Models Fuzzy Hognestad Wee and Mansur Attard et al. ACI TS500
Training data
RMSE 4.53 5.51 8.24 5.13 5.13 9.08
Relative error 0.17 0.25 0.42 0.20 0.21 0.48
Average of pred/exp 1.07 1.16 1.40 1.05 1.09 1.46
Testing data
RMSE 3.22 3.90 6.87 2.79 2.62 9.14
Relative error 0.14 0.26 0.48 0.10 0.11 0.64
Average of pred/exp 0.99 1.2 1.47 0.97 1.01 1.64
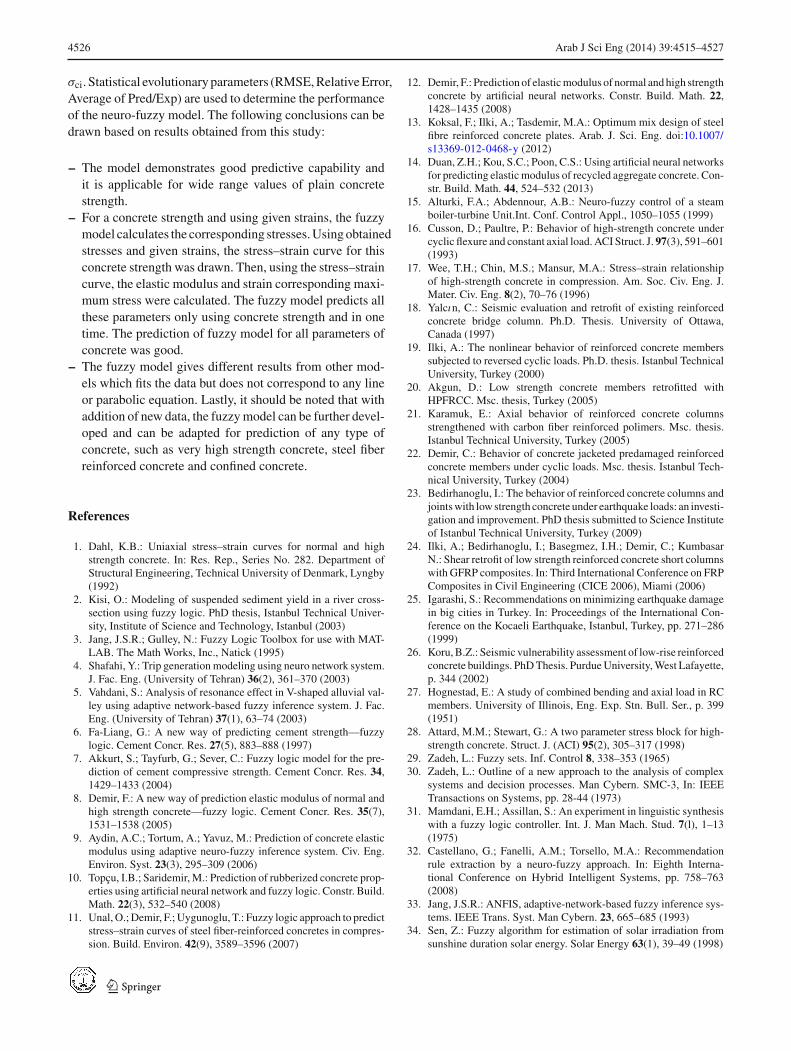
Table 7 Evaluation theperformance of the models withtraining and testing data
Parameters σci εco
Models Fuzzy Hognestad Wee andMansur
Fuzzy Hognestad Wee andMansur
Training data
RMSE 2.38 7.02 3.59 0.0007 0.00079 0.001
Relative error 0.18 0.38 0.23 0.21 0.23 0.29
Average of pred/exp 1.08 0.71 1.03 1.00 0.88 0.75
Testing data
RMSE 2.1 3.89 1.82 0.00051 0.00048 0.00041
Relative error 0.17 0.45 0.18 0.21 0.29 0.19
Average of pred/exp 1.06 0.56 0.99 1.06 1.26 0.9
fuzzy model, ACI318 and Attard and Steart show a good per-formance in prediction while TS500 showed the worst per-formance in prediction of the elastic modulus of concrete.In respect to the training data, fuzzy model was the best inRMSE and relative errors while Attard and Steart were thebest in average error. It should be noted that the fuzzy was alsogood in average. In testing data, fuzzy, ACI318 and Attardand Steard were the best in average, RMSE and relative error,respectively.
5.3 Strain Corresponding to Maximum Stress (εco)
εco is obtained from the stress–strain relationship drawn bythe neuro-fuzzy model and then compared with εco valuesobtained from experimentally drawn stress–strain relation-ships and equations proposed by Wee and Mansur [17] andHognestad [27]. Hognestad suggests a constant value for εco
to be 0.002. For training data, the fuzzy model was the bestin prediction by means of RMSE, relative error and average.For testing data, Wee and Mansur were the best by meansof RMSE and relative error, fuzzy was the best by meansof average. However, by means of other comparison crite-rions, the fuzzy model gives much closer values to the bestones.
5.4 Stresses (σci) Corresponding Strain (εci) Values
Calculated stresses (σci) from the fuzzy model are comparedwith experimental results and stresses obtained from empir-ical formulas given by Hognestad [27] and Wee and Mansur[17] as can be seen in Tables 6 and 7. As seen in Table 7,the fuzzy model was the best by means of RMSE and rela-tive error while the Wee and Mansur were the best by meansof average. For testing data, fuzzy was the best by meansof relative errors while it was good by means of RMSE andaverage. Wee and Mansur were the best for testing data bymeans of RMSE and average.
6 Conclusion
For predicting the stress–strain relationship of unconfinedconcrete under uniaxial compression, a neuro-fuzzy model isproposed using a collected experimental data set. Then, usingthe proposed model, the stress–strain relationships of thisexperimental data set can be predicted from their concretestrengths.
To evaluate the performance of the proposed model, com-parisons are done for stress–strain relationships, Ec, εco and
123
4526 Arab J Sci Eng (2014) 39:4515–4527
σci. Statistical evolutionary parameters (RMSE, Relative Error,Average of Pred/Exp) are used to determine the performanceof the neuro-fuzzy model. The following conclusions can bedrawn based on results obtained from this study:
– The model demonstrates good predictive capability andit is applicable for wide range values of plain concretestrength.
– For a concrete strength and using given strains, the fuzzymodel calculates the corresponding stresses. Using obtainedstresses and given strains, the stress–strain curve for thisconcrete strength was drawn. Then, using the stress–straincurve, the elastic modulus and strain corresponding maxi-mum stress were calculated. The fuzzy model predicts allthese parameters only using concrete strength and in onetime. The prediction of fuzzy model for all parameters ofconcrete was good.
– The fuzzy model gives different results from other mod-els which fits the data but does not correspond to any lineor parabolic equation. Lastly, it should be noted that withaddition of new data, the fuzzy model can be further devel-oped and can be adapted for prediction of any type ofconcrete, such as very high strength concrete, steel fiberreinforced concrete and confined concrete.
References
1. Dahl, K.B.: Uniaxial stress–strain curves for normal and highstrength concrete. In: Res. Rep., Series No. 282. Department ofStructural Engineering, Technical University of Denmark, Lyngby(1992)
2. Kisi, O.: Modeling of suspended sediment yield in a river cross-section using fuzzy logic. PhD thesis, Istanbul Technical Univer-sity, Institute of Science and Technology, Istanbul (2003)
3. Jang, J.S.R.; Gulley, N.: Fuzzy Logic Toolbox for use with MAT-LAB. The Math Works, Inc., Natick (1995)
4. Shafahi, Y.: Trip generation modeling using neuro network system.J. Fac. Eng. (University of Tehran) 36(2), 361–370 (2003)
5. Vahdani, S.: Analysis of resonance effect in V-shaped alluvial val-ley using adaptive network-based fuzzy inference system. J. Fac.Eng. (University of Tehran) 37(1), 63–74 (2003)
6. Fa-Liang, G.: A new way of predicting cement strength—fuzzylogic. Cement Concr. Res. 27(5), 883–888 (1997)
7. Akkurt, S.; Tayfurb, G.; Sever, C.: Fuzzy logic model for the pre-diction of cement compressive strength. Cement Concr. Res. 34,1429–1433 (2004)
8. Demir, F.: A new way of prediction elastic modulus of normal andhigh strength concrete—fuzzy logic. Cement Concr. Res. 35(7),1531–1538 (2005)
9. Aydin, A.C.; Tortum, A.; Yavuz, M.: Prediction of concrete elasticmodulus using adaptive neuro-fuzzy inference system. Civ. Eng.Environ. Syst. 23(3), 295–309 (2006)
10. Topçu, I.B.; Saridemir, M.: Prediction of rubberized concrete prop-erties using artificial neural network and fuzzy logic. Constr. Build.Math. 22(3), 532–540 (2008)
11. Unal, O.; Demir, F.; Uygunoglu, T.: Fuzzy logic approach to predictstress–strain curves of steel fiber-reinforced concretes in compres-sion. Build. Environ. 42(9), 3589–3596 (2007)
12. Demir, F.: Prediction of elastic modulus of normal and high strengthconcrete by artificial neural networks. Constr. Build. Math. 22,1428–1435 (2008)
13. Koksal, F.; Ilki, A.; Tasdemir, M.A.: Optimum mix design of steelfibre reinforced concrete plates. Arab. J. Sci. Eng. doi:10.1007/s13369-012-0468-y (2012)
14. Duan, Z.H.; Kou, S.C.; Poon, C.S.: Using artificial neural networksfor predicting elastic modulus of recycled aggregate concrete. Con-str. Build. Math. 44, 524–532 (2013)
15. Alturki, F.A.; Abdennour, A.B.: Neuro-fuzzy control of a steamboiler-turbine Unit.Int. Conf. Control Appl., 1050–1055 (1999)
16. Cusson, D.; Paultre, P.: Behavior of high-strength concrete undercyclic flexure and constant axial load. ACI Struct. J. 97(3), 591–601(1993)
17. Wee, T.H.; Chin, M.S.; Mansur, M.A.: Stress–strain relationshipof high-strength concrete in compression. Am. Soc. Civ. Eng. J.Mater. Civ. Eng. 8(2), 70–76 (1996)
18. Yalcın, C.: Seismic evaluation and retrofit of existing reinforcedconcrete bridge column. Ph.D. Thesis. University of Ottawa,Canada (1997)
19. Ilki, A.: The nonlinear behavior of reinforced concrete memberssubjected to reversed cyclic loads. Ph.D. thesis. Istanbul TechnicalUniversity, Turkey (2000)
20. Akgun, D.: Low strength concrete members retrofitted withHPFRCC. Msc. thesis, Turkey (2005)
21. Karamuk, E.: Axial behavior of reinforced concrete columnsstrengthened with carbon fiber reinforced polimers. Msc. thesis.Istanbul Technical University, Turkey (2005)
22. Demir, C.: Behavior of concrete jacketed predamaged reinforcedconcrete members under cyclic loads. Msc. thesis. Istanbul Tech-nical University, Turkey (2004)
23. Bedirhanoglu, I.: The behavior of reinforced concrete columns andjoints with low strength concrete under earthquake loads: an investi-gation and improvement. PhD thesis submitted to Science Instituteof Istanbul Technical University, Turkey (2009)
24. Ilki, A.; Bedirhanoglu, I.; Basegmez, I.H.; Demir, C.; KumbasarN.: Shear retrofit of low strength reinforced concrete short columnswith GFRP composites. In: Third International Conference on FRPComposites in Civil Engineering (CICE 2006), Miami (2006)
25. Igarashi, S.: Recommendations on minimizing earthquake damagein big cities in Turkey. In: Proceedings of the International Con-ference on the Kocaeli Earthquake, Istanbul, Turkey, pp. 271–286(1999)
26. Koru, B.Z.: Seismic vulnerability assessment of low-rise reinforcedconcrete buildings. PhD Thesis. Purdue University, West Lafayette,p. 344 (2002)
27. Hognestad, E.: A study of combined bending and axial load in RCmembers. University of Illinois, Eng. Exp. Stn. Bull. Ser., p. 399(1951)
28. Attard, M.M.; Stewart, G.: A two parameter stress block for high-strength concrete. Struct. J. (ACI) 95(2), 305–317 (1998)
29. Zadeh, L.: Fuzzy sets. Inf. Control 8, 338–353 (1965)30. Zadeh, L.: Outline of a new approach to the analysis of complex
systems and decision processes. Man Cybern. SMC-3, In: IEEETransactions on Systems, pp. 28-44 (1973)
31. Mamdani, E.H.; Assillan, S.: An experiment in linguistic synthesiswith a fuzzy logic controller. Int. J. Man Mach. Stud. 7(l), 1–13(1975)
32. Castellano, G.; Fanelli, A.M.; Torsello, M.A.: Recommendationrule extraction by a neuro-fuzzy approach. In: Eighth Interna-tional Conference on Hybrid Intelligent Systems, pp. 758–763(2008)
33. Jang, J.S.R.: ANFIS, adaptive-network-based fuzzy inference sys-tems. IEEE Trans. Syst. Man Cybern. 23, 665–685 (1993)
34. Sen, Z.: Fuzzy algorithm for estimation of solar irradiation fromsunshine duration solar energy. Solar Energy 63(1), 39–49 (1998)
123

Arab J Sci Eng (2014) 39:4515–4527 4527
35. Shekarchizadeh, M.; Chari, M.N.; Dormohammadi, H.; Mah-moodzadeh, F.: Prediction of compressive strength of concreteusing adaptive network-based fuzzy inference system (ANFIS).In: ACI Project Competition (2004)
36. Takagi, T.; Sugeno, M.: Fuzzy identification of systems and itsapplication to modeling and control. IEEE Trans. Syst. ManCybern. 15(1), 116–132 (1985)
37. Wang, L.: Adaptive Fuzzy Systems and Control. PTR Prentice Hall,London (1994)
38. ACI Committee 318: Building Code Requirement for StructuralConcrete and Commentary (ACI 318-02/318R-02). American Con-crete Institute, Farmington Hills (2002)
39. TS 500: Turkish Standards Institute (TSE), Requirements forDesign and Construction of Reinforced Concrete Structures.TS500, Ankara (2000)
123