The NCBI Eukaryotic Genome Annotation Pipeline and Alternate Genomic Sequences
Upload
elizabeth-jacobCategory
view
212download
0
A fuzzy-driven genetic algorithm for sequence segmentation appliedto genomic sequences
Elizabeth Jacob a,*, K.N. Ramachandran Nair b, Roschen Sasikumar a
a Computational Modeling and Simulation Unit, National Institute for Interdisciplinary Science and Technology (CSIR), Trivandrum 695019, Indiab School of Computer Sciences, Mahatma Gandhi University, Kottayam 686560, India
Applied Soft Computing 9 (2009) 488–496
A R T I C L E I N F O
Article history:
Received 27 June 2007
Received in revised form 26 June 2008
Accepted 27 July 2008
Available online 14 August 2008
Keywords:
Sequence segmentation
Genetic algorithm
Fuzzy fitness finder
Genome
Genes
A B S T R A C T
The fuzzy-driven genetic algorithm for sequence segmentation consists of a genetic algorithm whose
objective function is driven by a fuzzy fitness finder. The genetic algorithm starts with an initial
population of alternate solutions where each solution is a different partitioning of the sequence into
segments. The algorithm uses adaptations of the standard genetic operators to reallocate the partitions so
as to achieve optimal segmentations. A fuzzy fitness finding mechanism evaluates the fitness values of
the evolving segmentations, taking into consideration the combined effect of multiple heterogeneous
features that have been identified as governing factors for the formation of the segments. The
relationships between segment elements can also be modeled by this novel approach of applying soft
computing paradigms to the segmentation of multi-dimensional sequences. The algorithm developed in
this work has been successfully implemented for gene sequence segmentation to predict groups of
functionally related genes that lie adjacent on the genome sequences of bacterial genomes.
� 2008 Elsevier B.V. All rights reserved.
Contents lists available at ScienceDirect
Applied Soft Computing
journal homepage: www.elsev ier .com/ locate /asoc
1. Introduction
Sequential datasets are generated from diverse applications likestock market analysis, telecommunications, bioinformatics, textprocessing, click stream mining and many more. Mining of suchdata needs the development of techniques that can handlesequences with large number of data points. Sequence segmenta-tion is defined as the division of the sequence into k non-overlapping contiguous segments covering all the data points suchthat each segment is as homogeneous as possible. Segmentationsgive a high-level view of the sequence’s structure. An ordered set ofN numbers {ai: i = 0 . . . N � 1} can be partitioned into k contiguousgroups in
N � 1k� 1
� �ways. An expression for the total number of
partitions is calculated as 2N�1 where k can take values from 1 to N.For a set of 10 numbers, the number of groups will be 512 but thisnumber increases exponentially to 5 � 1029 approximately, for adata set of 100 numbers. Hence exhaustive enumeration of allpossible partitions is not computationally feasible.
The segmentation problem can be solved optimally usingdynamic programming which uses recursion. The problem isdivided into subproblems which are solved separately andcombined to form the original solution. The optimal k-segmenta-
* Corresponding author. Tel.: +91 471 2515381; fax: +91 471 2491712.
E-mail address: [email protected] (E. Jacob).
1568-4946/$ – see front matter � 2008 Elsevier B.V. All rights reserved.
doi:10.1016/j.asoc.2008.07.004
tion of T[1,N] is the optimal segmentation of T[1,j] into k � 1segments and a single segment that spans the subsequenceT[j + 1,N]. The quadratic running time, however, makes its useprohibitive for long sequences. In the Divide & Segment algorithm(DNS) [1], the main sequence is partitioned into disjointsubsequences and each subsequence is segmented by dynamicprogramming into k segments. The representatives of thesubsequences are concatenated to form a weighted sequenceand dynamic programming is again applied on the sequence.
The top-down approach starts with an unsegmented sequenceand introduces one boundary at a time [2,3] by splitting thesequence. The bottom-up method begins with all points indifferent segments. At each step the algorithm merges segmentsuntil a k-segmentation is obtained [4,5]. The split and merge isdone with the goal of minimization of overall error.
Local search techniques for segmentation [6] use arbitrary orfixed size (oblivious) segments and then keep moving segmentboundaries until there is no improvement in the quality of thesegments. The sliding window (SW) algorithm scans the sequencefrom left to right. The left boundary of a segment is fixed and theright boundary is stretched as far as possible. When the error of thesegment exceeds a given threshold value then the boundary isfixed and the process repeated till the end of the sequence [3,7,8].Given a multidimensional time series, the basis segmentationmethod [9] takes a small set of latent variables (basis set) and usedimensionality reduction techniques like principal component
E. Jacob et al. / Applied Soft Computing 9 (2009) 488–496 489
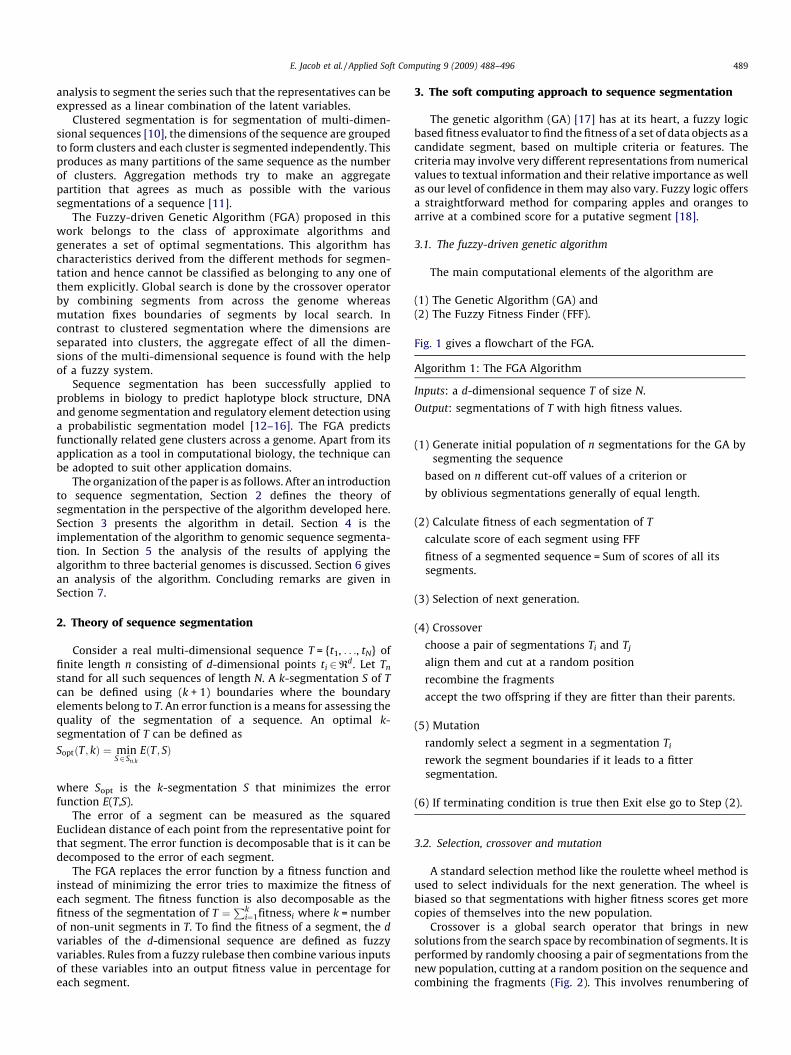
analysis to segment the series such that the representatives can beexpressed as a linear combination of the latent variables.
Clustered segmentation is for segmentation of multi-dimen-sional sequences [10], the dimensions of the sequence are groupedto form clusters and each cluster is segmented independently. Thisproduces as many partitions of the same sequence as the numberof clusters. Aggregation methods try to make an aggregatepartition that agrees as much as possible with the varioussegmentations of a sequence [11].
The Fuzzy-driven Genetic Algorithm (FGA) proposed in thiswork belongs to the class of approximate algorithms andgenerates a set of optimal segmentations. This algorithm hascharacteristics derived from the different methods for segmen-tation and hence cannot be classified as belonging to any one ofthem explicitly. Global search is done by the crossover operatorby combining segments from across the genome whereasmutation fixes boundaries of segments by local search. Incontrast to clustered segmentation where the dimensions areseparated into clusters, the aggregate effect of all the dimen-sions of the multi-dimensional sequence is found with the helpof a fuzzy system.
Sequence segmentation has been successfully applied toproblems in biology to predict haplotype block structure, DNAand genome segmentation and regulatory element detection usinga probabilistic segmentation model [12–16]. The FGA predictsfunctionally related gene clusters across a genome. Apart from itsapplication as a tool in computational biology, the technique canbe adopted to suit other application domains.
The organization of the paper is as follows. After an introductionto sequence segmentation, Section 2 defines the theory ofsegmentation in the perspective of the algorithm developed here.Section 3 presents the algorithm in detail. Section 4 is theimplementation of the algorithm to genomic sequence segmenta-tion. In Section 5 the analysis of the results of applying thealgorithm to three bacterial genomes is discussed. Section 6 givesan analysis of the algorithm. Concluding remarks are given inSection 7.
2. Theory of sequence segmentation
Consider a real multi-dimensional sequence T = {t1, . . ., tN} offinite length n consisting of d-dimensional points ti 2Rd. Let Tn
stand for all such sequences of length N. A k-segmentation S of T
can be defined using (k + 1) boundaries where the boundaryelements belong to T. An error function is a means for assessing thequality of the segmentation of a sequence. An optimal k-segmentation of T can be defined as
SoptðT; kÞ ¼ minS2 Sn;k
EðT; SÞ
where Sopt is the k-segmentation S that minimizes the errorfunction E(T,S).
The error of a segment can be measured as the squaredEuclidean distance of each point from the representative point forthat segment. The error function is decomposable that is it can bedecomposed to the error of each segment.
The FGA replaces the error function by a fitness function andinstead of minimizing the error tries to maximize the fitness ofeach segment. The fitness function is also decomposable as thefitness of the segmentation of T ¼
Pki¼1fitnessi where k = number
of non-unit segments in T. To find the fitness of a segment, the d
variables of the d-dimensional sequence are defined as fuzzyvariables. Rules from a fuzzy rulebase then combine various inputsof these variables into an output fitness value in percentage foreach segment.
3. The soft computing approach to sequence segmentation
The genetic algorithm (GA) [17] has at its heart, a fuzzy logicbased fitness evaluator to find the fitness of a set of data objects as acandidate segment, based on multiple criteria or features. Thecriteria may involve very different representations from numericalvalues to textual information and their relative importance as wellas our level of confidence in them may also vary. Fuzzy logic offersa straightforward method for comparing apples and oranges toarrive at a combined score for a putative segment [18].
3.1. The fuzzy-driven genetic algorithm
The main computational elements of the algorithm are
(1) T
he Genetic Algorithm (GA) and (2) T he Fuzzy Fitness Finder (FFF).Fig. 1 gives a flowchart of the FGA.
Algorithm 1: The FGA Algorithm
Inputs: a d-dimensional sequence T of size N.
Output: segmentations of T with high fitness values.
(1) Generate initial population of n segmentations for the GA bysegmenting the sequence
based on n different cut-off values of a criterion or
by oblivious segmentations generally of equal length.
(2) Calculate fitness of each segmentation of T
calculate score of each segment using FFF
fitness of a segmented sequence = Sum of scores of all itssegments.
(3) Selection of next generation.
(4) Crossover
choose a pair of segmentations Ti and Tj
align them and cut at a random position
recombine the fragments
accept the two offspring if they are fitter than their parents.
(5) Mutation
randomly select a segment in a segmentation Ti
rework the segment boundaries if it leads to a fittersegmentation.
(6) If terminating condition is true then Exit else go to Step (2).
3.2. Selection, crossover and mutation
A standard selection method like the roulette wheel method isused to select individuals for the next generation. The wheel isbiased so that segmentations with higher fitness scores get morecopies of themselves into the new population.
Crossover is a global search operator that brings in newsolutions from the search space by recombination of segments. It isperformed by randomly choosing a pair of segmentations from thenew population, cutting at a random position on the sequence andcombining the fragments (Fig. 2). This involves renumbering of

Fig. 1. Flowchart for FGA.
E. Jacob et al. / Applied Soft Computing 9 (2009) 488–496490
segments in the new individuals. In the example shown, theparents have 11 and 8 segments, respectively. After crossover, theoffspring have 9 and 10 segments. If, at least one of the twooffspring is better than the parents in terms of fitness, thecrossover is said to be successful.
Mutation in FGA is a local search method for improving thefitness of segment members. The mutation operator works atsegment boundaries readjusting the breakpoints. Segment bordersare randomly selected and are reallocated depending upon howstrongly the border data objects are connected to the segment. Thisleads to switching of segment membership of border objects,merging of segments, delinking to become a unit segment orleaving the segments unchanged (Fig. 3). In the illustration, the
Fig. 2. Illustration of crossover.
mutation site falls at g4. If the fitness of segment (g3,g4) is low andthe fitness of segment (g4,g5) is large enough, then g4 switchesover to the right segment.
The process of evaluation, selection, crossover and mutation iscarried on until there is no significant difference in fitness values insuccessive generations or an upper limit for generations is reached.The last generation consists of the best segmentations found by thealgorithm.
3.3. The fuzzy fitness finder
3.3.1. Why fuzzy?
In a multi-dimensional sequence, a segmentation may be bestw.r.t. one variable but not so w.r.t. the other variables. In theclassical method of objective weighting, each variable is given aweight and the weighted sum of the fitness of individual variablesis taken as the overall objective function. The weights are ameasure of the significance of a variable in comparison to the othervariables. For example if one weight is two times the other, itimplies that the first variable is doubly significant compared to thesecond. However, a set of fixed weights leads to a constantinterrelationship. If values for one or more of these criteria are notavailable, then the total fitness score will drop drastically. Actually,some of the other criteria may be enough to give a high combinedscore. Under different combinations of inputs, the weight valuescan vary.
In a fuzzy-logic based system, a weighting function is replacedby a set of rules. A variable can take a range of values in an interval.The variable, if modeled as a fuzzy variable can belong to differentclasses in the interval with different probabilities. Differentcombinations of different variables (fuzzy inputs) join togetherto produce unique effects. A fuzzy logic inferencing system can

Fig. 3. Illustration of mutation.
E. Jacob et al. / Applied Soft Computing 9 (2009) 488–496 491
capture the complex interactions among the variables which is notpossible by assignment of fixed weights to the inputs.
Algorithm 2: Fuzzy Fitness Finder
Inputs: a segmentation of sequence T
Output: fitness score of the segmentation of T
(1) For each of the d variables, calculate a crisp value forevery segment
numerical values: average of values of segment members
non-numerical values: convert to categories or numericalvalue
relationships between segment elements: convert tonumerical value by (sum of pairwise scores of segmentmembers)/number of pairs.
(2) Design of fuzzy membership functions for each of thed variables.
(3) Fuzzification of the values of the d variables of every segment.
(4) Fuzzy inference mechanism
Construction of fuzzy rulebase
IF variable1 is very high AND . . . variable d is low
THEN fitness score is high
rules fire when antecedents match.
(5) Defuzzification of fitness scores
Consequents of the fired rules defuzzified to yield a crisp fitness
score (in %) for a given segment.
(6) Fitness score of a segmentation of T = summation of fitnessof non-unit segments.
The FFF is applied to every segment of all individuals of theinitial population. In each generation, variation is brought about bycrossover and mutation. In crossover, only if the cut-point fallsinside a segment, the fitness values have to be recalculated.Similarly, fitness values have to be re-calculated for segmentsaffected by mutation only. Hence, the FFF is called only if geneticoperators disturb the segments.
4. Application to gene sequence segmentation
4.1. The system
Different segments of the DNA sequence, code for differentproteins and these segments are called genes. The code getstranscribed and translated into proteins when the genesare ‘‘expressed’’. The full sequence containing all thegenes and intergenic regions (stretches of bases that havenot been identified as genes) is called the genome of anorganism.
It has been observed both experimentally and computation-ally that in lower organisms like bacteria and to some extent inhigher organisms, genes that code for related functionalityhuddle together on the genome. Evolution favours such group-ing as it is easier for these genes to get expressed (decoded)together when they are called upon to carry out the particularfunction. Groups of adjacent genes that are expressed togetherare called ‘‘operons’’.
The genome can be viewed as a sequence of genes g1, g2,g3,. . . gn with each gene separated from the next by an intergenicgap of bases that varies from gene to gene. In order togroup genes into operons, some of the factors that could beresponsible for keeping the genes together as operons arecommonality of metabolic pathways and similarity of proteinfunction. The segments from the FGA are candidate operons. Asexperimental detection of operons is time consuming anddifficult to implement in the laboratory, computational algo-rithms for operon prediction are being recognized as a tool todiscovery of important gene groups in newly sequencedmicrobial genomes.
4.2. Implementation
Genomes of three bacteria were studied using the FGAalgorithm
I. S
coring criteria taken for grouping genes into operons are(a) intergenic distance (number of bases in between twogenes),(b) participation in the same metabolic pathway(c) conservation of the proximity of a gene pair across many
genomes(d) similarity of protein function.
II. T
he initial population is created by partitioning the genomeusing 10 different threshold intergenic distance values from 0to 600 bases. For a threshold of 200 bases, if the gap betweentwo genes is greater than 200 bases, then a new segment isinitiated.III. C
alculation of crisp input values for the criteria.(a) The score based on intergenic distance is the averageintergenic distance between consecutive genes within anoperon.
(b) Commonality of metabolic pathway / protein function andconservation If two genes in an segment have a commonpathway or protein function, the score for that pair is takenas 1 or else as 0. If there are m genes in a segment, all pairs of

Fig. 4. Fuzzy membership functions for pathway.
TabOpe
Exp
b00
b00
b20
b34
E. Jacob et al. / Applied Soft Computing 9 (2009) 488–496492
genes are scored as above and divided by mC2 to give a crispvalue between 0 and 1. Thus if all pairs have a commonpathway, the pathway score for the segment will be 1. Forconservation, pair-wise scores are available in literature.
le 1rons
erim
01to
81 t
19 t
35 t
IV. F
uzzification of inputsThe fuzzy membership functions for each variable isdefined by triangular sets (V1, V2,. . .) where V1, V2 havelinguistic interpretations like extremely low, very low, high,etc.
Fig. 4 shows the fuzzy membership functions for the fuzzyvariable, metabolic pathway. Here, scores close to one impliesthat the two genes have a good possibility of being together inthe same segment, i.e. they participate in similar metabolicpathways.
V. F
uzzy inferenceThe inference engine works from a rulebase. The outputvalue which is the fitness of a segment is in percentage. Theoutput range (0–100) is divided uniformly into fuzzy sets (V1,V2,. . .). The rules are of the form:
IF pathway is V8 AND conservation is V8 THEN fitness is V7.
For the three criteria case onwards, due to the large numberof rules, the inference engine is cascaded or it combines thescores two at a time. It first combines the distance score withpathway score. The combined score of distance and pathwaycriteria is then combined with the conservation score to get thefinal fitness.
VI. D
efuzzification of outputThe final fitness scores are de-fuzzified using the root-sum-squares method to yield a crisp fitness value.
4.3. Program parameters
The parameters that the designer can select are the parametersof the GA and the FFF. Parameters chosen are:Population size = 10.
As crossover is not taken to be a random phenomenon, there isno need to define a probability for crossover which is taken as asure event with probability equal to one.
Probability of mutation = 0.1.
predicted for E. coli
entally predicted operons Predicted by FGA D
b0004 (4 genes) b0002 to b0004 (3 genes)
o b0095 (15 genes) b0081 to b0096 (16 genes) 1
o b2026 (8 genes) b2019 to b2026 (8 genes) 1
o b3437 (3 genes) b3435 to b3437 (3 genes)
For mutation, the threshold values are (15, 75). Therefore, thepair-wise fitness is considered significant if it is more than 75and insignificant if less than 15.
The maximum number of iterations = 50.
The number of fuzzy sets for inputs as well as output = 9.
Fuzzy membership functions for the variables and the rules aredesigned by intuition.
4.4. Aggregation of segmentations
A ‘best of n’ genome map is constructed by gene-by-geneanalysis of segment fitness. Each gene is taken and it is seen inwhich of the n genome maps, it has the best fitness. The genes ofthat segment are chosen. For example in Escherichia coli, geneb0001 may have maximum fitness when grouped as b0001 andb0002. b0002 could have maximum fitness when it is grouped asb0002, b0003 and b0004. So, b0002 appears in two segments andthe biologist can decide which of these to choose. The n genomemaps generated by the algorithm have no overlaps but the post-processing for aggregation causes overlaps.
5. Analysis of results
Genome data are taken from public domain databases [19,20].
5.1. Case 1: E. coli
E. coli K12 consisting of about 4400 genes are friendly bacteriathat inhabit the intestine but sometimes turn virulent. The genesare named as b#### (e.g. b0001).
At first only one criterion (intergenic distance) was used. Thenthe second criterion of conservation across genomes was addedand operons generated. For the three criteria case, commonality ofmetabolic pathways was added. In the four criteria case, proteinsimilarity criterion was added.
Most of the experimentally predicted operons were discoveredexactly by our algorithm. There are currently 237 known operonsin E. coli of which our method predicted 213 operons (sensitiv-ity = 90%). The mhp operon (b0347, b0348, b0349, b0350, b0351and b0352) and the Men operon (b2260, b2261, b2262, b2263,b2264 and b2265) were predicted with 100% fitness value by theFGA. In certain cases, genes that are not predicted by experimentappear inside operons. This could lead to the possible annotation ofgenes whose functions are currently unknown. The biologicalresults using the method have been published [21]. A fewpredicted operons alongwith their fitness values are shown inTable 1.
The operon b0001. . .b0004 is an experimentally predictedoperon of four genes but our algorithm predicts only three of themto be in one operon with a fitness value of 100%. The intergenicdistance by definition is the number of base pairs between genesand their average is a numeric value. As the four genes have acommon pathway (eco00260 for metabolism) and protein(EC1.5.1.8 oxidoreductase), their scores are one. The conservationscore available between pairs of genes is averaged to get 0.82. The
ist Path Cons Protein Fitness (in %)
1.5 1.0 0.82 1.0 100
3.4 0.17 0.07 0.52 55
4.88 0.78 0.11 1.0 100
6.0 0.0 0.76 1.0 65

Fig. 5. Fitness vs. number of variables in E. coli.
Fig. 7. Part of the operon map of B. subtilis.
E. Jacob et al. / Applied Soft Computing 9 (2009) 488–496 493
relationships between the genes are converted to numerical valuesrepresenting the segment. The FFF calculates the fitness scoreusing the rules that combine these criteria. Fig. 5 is a graphshowing the relationship between the number of criteria andfitness values for E. coli taken at four intermediate points (after 5,10, 15 and 20 generations) of a run.
The four criteria are added in the order intergenic distance,pathway, conservation and protein function. It can be noted thatadditional features improve the fitness value. To start with, theinitial fitness is higher when a new criterion is added. The reasonfor this is that when only one feature is considered, the presence orabsence of one feature results in small segments with high fitnessvalues (100%), however, many segments are unit segments whichdo not have a fitness contribution. When there are more features,there are more multi-gene clusters formed because the contribu-tion of many features brings together more genes into clusters.There will be more clusters with less than 100% fitness and thesummation of these leads to a higher total fitness value. Though,the rule seems to imply that more criteria means better fitnessvalues, this cannot be generalized.
5.2. Case 2: Bacillus subtilis
B. subtilis is a bacteria that promotes plant growth and has beenshown to increase crop yield. They live at the interface between theplant roots and the surrounding soil. The sequencing of its genomewas completed in 1997. The genome has 4200 genes. Genes of B.
subtilis are named as BG#####.
Fig. 6. ROC curves for B. subtilis.
Data for B. subtilis was available only for intergenic distance andmetabolic pathway. An ROC (Receiver Operating Characteristic)curve has been used to evaluate the overall accuracy and predictivevalue of the method. The ROC curve is obtained by plotting the TruePositive rate (TP) against the False Positive rate (FP) whereTP = Fraction of experimental linkages that are predicted by themethod and FP = 1 � fraction of experimental borders predicted bythe method.
The area under the ROC curve is a measure of the predictivevalue of the method. The ROC curves for B. subtilis using thedistance and metabolic pathway criteria individually and takentogether are shown in Fig. 6. The metabolic pathway data beingscantier and probably less reliable for B. subtilis compared to E. coli,this criterion makes only a small improvement to predictionsbased on distance alone. Using both criteria, the area under theROC curve increases to 88.2%. The same rules that were used for E.
coli were used for scoring. Experimental data received in personalcommunication from Shujiro Okuda of Kyoto University (2004)was used. Fig. 7 shows a stretch of gene segments on the genomewith their scores for pathway and distance before fuzzification andfitness values.
5.3. Case 3: Mycobacterium tuberculosis
M. tuberculosis bacteria causes tuberculosis. Thought to haveevolved from a soil bacterium, it evolved to infect cows and thenmade the jump to humans when animals were domesticated10,000 years ago. Of late, it has been found to have a deadlypartnership with the AIDS virus. There are 3924 genes of M.
tuberculosis named as Rv####.A computational tool proves to be very useful for predicting
operons in organisms, for which no training set of experimentaloperons is available. M. tuberculosis does not have experimentaloperons but Zheng et al. [22] have made predictions basedon metabolic pathways alone using a graph-theoreticalapproach. Our predictions were compared with these and itwas found that 80 of the 89 operons were predicted by ourmethod also.
Some of the predictions comparing operons predicted by thetwo methods are listed in Table 2. While some operons arepredicted exactly by both methods, some others are predicted withmore or less genes and some are not predicted at all by Zheng et al.
6. Algorithm analysis
6.1. Segment quality index
In order to evaluate the quality of segments generated by thealgorithm, there are standard cluster validity indices. The Davies–Bouldin (DB) index [23] is a function of the ratio of the sum of‘‘within-cluster’’ scatter to ‘‘between-cluster’’ separation. The DBanalysis was suitably modified to determine the equivalent of

Table 2Operons predicted for M. tuberculosis
Predicted operons, Zheng et al. Predicted by FGA Fitness (in %)
Rv0407 to Rv0408 (2genes) Rv0407 to Rv0409 (3genes) 55
Rv3145 to Rv3158 (14genes) Rv3145 to Rv3151 (7 genes) 100
Rv2064 to Rv2066 (3genes) Rv2064 to Rv2066 (3genes) 100
Not predicted Rv0254 to Rv0255 (2 genes) 100
Not predicted Rv0880 to Rv0882 (3 genes) 67
E. Jacob et al. / Applied Soft Computing 9 (2009) 488–496494
‘‘within-cluster’’ scatter and ‘‘between-cluster’’ separation.
Segment Quality Index ðSQIÞ ¼ 1
nc
Xnc
i¼1
Ri (1)
where nc = number of segments
Ri ¼ maxj ¼ i� 1j ¼ iþ 1
Si
di j
¼ maxj ¼ i� 1j ¼ iþ 1
100� f i
100� pi j
where Si is the scatter within the ith segment, dij is the separationbetween the ith segment and the jth segment.
The maximum is taken over the left and right ratio values. Thefuzzy fitness score (fi) for the segment is a measure of the similarityof the genes constituting the segment with respect to the multiplefeatures compared. Thus a high fitness score is equivalent to a lowscatter within the segment and vice versa. Therefore (100 � fi) isconsidered equivalent to the scatter S in our calculation. Similarlythe separation between two segments dij, is taken as (100 � pij)where pij is the pair-wise fitness across bordering elements ofsegments on the right and left. Therefore, more the pair-wisefitness at the border, lesser will be the separation between the twosegments.
Fig. 8 plots the SQI values for criteria starting from the criterionof intergenic distance alone and adding conservation, commonpathway and similarity of protein function. The DB index has beenplotted at the end of 20 generations. Minimization of CQI achievesbetter segmentation. The value of the index is minimum when allfour scoring features are used for segmenting (zero) and maximumwhen only the first feature, intergenic distance is used (0.2288). Inthis application, segments improve when more criteria are takeninto the study.
Fig. 8. Variation of segmentation quality index with the number of variables.
6.2. Complexity calculations
6.2.1. Time complexity
An expression for time complexity has been derived as follows.
Time Complexity ¼ Complexityðinitial populationÞ
þ Complexityðan iterationÞ
� number of iterations
Let niter = number of iterations of the algorithm; n = populationsize or number of different segmentations; N = total number ofdata items in the sequence; m = average segment size excludingsingle unit segments; nf = number of features; k = average numberof non-single segments in a segmentation of the sequence;K = average number of segments in an individual including singlesegments; mp = average number of segments affected due tomutation in an individual.
Complexityðinitial populationÞ
¼ Complexityðcreating segmentsÞ
þ Complexityðcomputing fitness values of the segmentsÞ
¼ nN þ ðmC2 � nf þ nf � 1Þ � k � n ¼ Oðn � N þ mC2 � nf � k � nÞ(2)
If data items in a segment have to be compared pair-wise thenmC2 comparisons have to be made to arrive at a crisp value for eachfeature. For nf number of features, the fuzzy fitness finder isexecuted (nf � 1) times for each segment. (nf � 1) can be ignored asmC2nf > (nf � 1) since mC2 � 1 (as m � 2).
Complexityðan iterationÞ ¼ Complexityðselection
þ crossoverþmutationÞnþ mC2
� nf � nþ mC2 � nf �mp � nOðmC2 � nf
�mp � nÞ (3)
From (2) and (3), an estimate of the time complexity is given byO(n�N + mC2�nf�n(k + niter�mp)).
For the first generation, all segments in each individual areevaluated for their fitness. Hence the main computational burden isincurred at the start. In following iterations, only the segments thatare affected by crossover and mutation have to be recalculated.
6.2.2. Space complexity
Space Complexity is calculated as: Space Complexity = Space fordata items + Space for segment information.
Every data item has criteria information. For every individual,each data item will have a segment number.
Space for data items ¼ nf � N þ n � N (4)
Pertaining to each segment, there are nf scores for criteriavalues and one value for segment fitness. For storing the values ofthe whole population, the space needed has to be summed over allsegments of an individual and then over all the individuals.
At every instant, the values of the new population are beingcalculated from the old population. Hence the same space isneeded for the new population also.
Space for segment information ¼ 2K � n � ðnf þ 1Þ (5)
Adding (4) and (5), an estimate of space complexity is given by
Sp ¼ Nðnf þ nÞ þ 2 � K � nðnf þ 1Þ:
Genetic algorithms are sensitive to control parameters likepopulation size, probabilities of crossover, mutation, etc. Tuning ofthese parameters is required for each problem.
E. Jacob et al. / Applied Soft Computing 9 (2009) 488–496 495
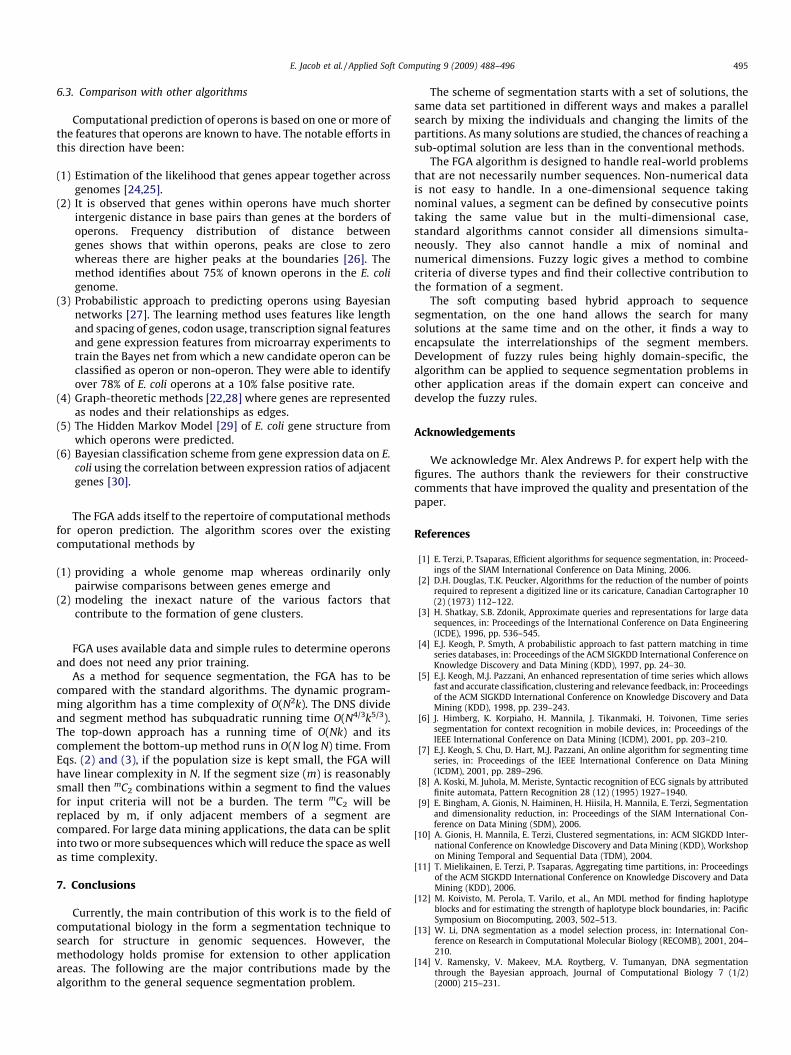
6.3. Comparison with other algorithms
Computational prediction of operons is based on one or more ofthe features that operons are known to have. The notable efforts inthis direction have been:
(1) E
stimation of the likelihood that genes appear together acrossgenomes [24,25].(2) It
is observed that genes within operons have much shorterintergenic distance in base pairs than genes at the borders ofoperons. Frequency distribution of distance betweengenes shows that within operons, peaks are close to zerowhereas there are higher peaks at the boundaries [26]. Themethod identifies about 75% of known operons in the E. coligenome.
(3) P robabilistic approach to predicting operons using Bayesiannetworks [27]. The learning method uses features like lengthand spacing of genes, codon usage, transcription signal featuresand gene expression features from microarray experiments totrain the Bayes net from which a new candidate operon can beclassified as operon or non-operon. They were able to identifyover 78% of E. coli operons at a 10% false positive rate.
(4) G
raph-theoretic methods [22,28] where genes are representedas nodes and their relationships as edges.(5) T
he Hidden Markov Model [29] of E. coli gene structure fromwhich operons were predicted.(6) B
ayesian classification scheme from gene expression data on E.coli using the correlation between expression ratios of adjacentgenes [30].
The FGA adds itself to the repertoire of computational methodsfor operon prediction. The algorithm scores over the existingcomputational methods by
(1) p
roviding a whole genome map whereas ordinarily onlypairwise comparisons between genes emerge and(2) m
odeling the inexact nature of the various factors thatcontribute to the formation of gene clusters.FGA uses available data and simple rules to determine operonsand does not need any prior training.
As a method for sequence segmentation, the FGA has to becompared with the standard algorithms. The dynamic program-ming algorithm has a time complexity of O(N2k). The DNS divideand segment method has subquadratic running time O(N4/3k5/3).The top-down approach has a running time of O(Nk) and itscomplement the bottom-up method runs in O(N log N) time. FromEqs. (2) and (3), if the population size is kept small, the FGA willhave linear complexity in N. If the segment size (m) is reasonablysmall then mC2 combinations within a segment to find the valuesfor input criteria will not be a burden. The term mC2 will bereplaced by m, if only adjacent members of a segment arecompared. For large data mining applications, the data can be splitinto two or more subsequences which will reduce the space as wellas time complexity.
7. Conclusions
Currently, the main contribution of this work is to the field ofcomputational biology in the form a segmentation technique tosearch for structure in genomic sequences. However, themethodology holds promise for extension to other applicationareas. The following are the major contributions made by thealgorithm to the general sequence segmentation problem.
The scheme of segmentation starts with a set of solutions, thesame data set partitioned in different ways and makes a parallelsearch by mixing the individuals and changing the limits of thepartitions. As many solutions are studied, the chances of reaching asub-optimal solution are less than in the conventional methods.
The FGA algorithm is designed to handle real-world problemsthat are not necessarily number sequences. Non-numerical datais not easy to handle. In a one-dimensional sequence takingnominal values, a segment can be defined by consecutive pointstaking the same value but in the multi-dimensional case,standard algorithms cannot consider all dimensions simulta-neously. They also cannot handle a mix of nominal andnumerical dimensions. Fuzzy logic gives a method to combinecriteria of diverse types and find their collective contribution tothe formation of a segment.
The soft computing based hybrid approach to sequencesegmentation, on the one hand allows the search for manysolutions at the same time and on the other, it finds a way toencapsulate the interrelationships of the segment members.Development of fuzzy rules being highly domain-specific, thealgorithm can be applied to sequence segmentation problems inother application areas if the domain expert can conceive anddevelop the fuzzy rules.
Acknowledgements
We acknowledge Mr. Alex Andrews P. for expert help with thefigures. The authors thank the reviewers for their constructivecomments that have improved the quality and presentation of thepaper.
References
[1] E. Terzi, P. Tsaparas, Efficient algorithms for sequence segmentation, in: Proceed-ings of the SIAM International Conference on Data Mining, 2006.
[2] D.H. Douglas, T.K. Peucker, Algorithms for the reduction of the number of pointsrequired to represent a digitized line or its caricature, Canadian Cartographer 10(2) (1973) 112–122.
[3] H. Shatkay, S.B. Zdonik, Approximate queries and representations for large datasequences, in: Proceedings of the International Conference on Data Engineering(ICDE), 1996, pp. 536–545.
[4] E.J. Keogh, P. Smyth, A probabilistic approach to fast pattern matching in timeseries databases, in: Proceedings of the ACM SIGKDD International Conference onKnowledge Discovery and Data Mining (KDD), 1997, pp. 24–30.
[5] E.J. Keogh, M.J. Pazzani, An enhanced representation of time series which allowsfast and accurate classification, clustering and relevance feedback, in: Proceedingsof the ACM SIGKDD International Conference on Knowledge Discovery and DataMining (KDD), 1998, pp. 239–243.
[6] J. Himberg, K. Korpiaho, H. Mannila, J. Tikanmaki, H. Toivonen, Time seriessegmentation for context recognition in mobile devices, in: Proceedings of theIEEE International Conference on Data Mining (ICDM), 2001, pp. 203–210.
[7] E.J. Keogh, S. Chu, D. Hart, M.J. Pazzani, An online algorithm for segmenting timeseries, in: Proceedings of the IEEE International Conference on Data Mining(ICDM), 2001, pp. 289–296.
[8] A. Koski, M. Juhola, M. Meriste, Syntactic recognition of ECG signals by attributedfinite automata, Pattern Recognition 28 (12) (1995) 1927–1940.
[9] E. Bingham, A. Gionis, N. Haiminen, H. Hiisila, H. Mannila, E. Terzi, Segmentationand dimensionality reduction, in: Proceedings of the SIAM International Con-ference on Data Mining (SDM), 2006.
[10] A. Gionis, H. Mannila, E. Terzi, Clustered segmentations, in: ACM SIGKDD Inter-national Conference on Knowledge Discovery and Data Mining (KDD), Workshopon Mining Temporal and Sequential Data (TDM), 2004.
[11] T. Mielikainen, E. Terzi, P. Tsaparas, Aggregating time partitions, in: Proceedingsof the ACM SIGKDD International Conference on Knowledge Discovery and DataMining (KDD), 2006.
[12] M. Koivisto, M. Perola, T. Varilo, et al., An MDL method for finding haplotypeblocks and for estimating the strength of haplotype block boundaries, in: PacificSymposium on Biocomputing, 2003, 502–513.
[13] W. Li, DNA segmentation as a model selection process, in: International Con-ference on Research in Computational Molecular Biology (RECOMB), 2001, 204–210.
[14] V. Ramensky, V. Makeev, M.A. Roytberg, V. Tumanyan, DNA segmentationthrough the Bayesian approach, Journal of Computational Biology 7 (1/2)(2000) 215–231.

E. Jacob et al. / Applied Soft Computing 9 (2009) 488–496496
[15] M. Salmenkivi, J. Kere, H. Mannila, Genome segmentation using piecewise con-stant intensity models and reversible jump MCMC, in: Proceedings of the Eur-opean Conference on Computational Biology (ECCB), 2002, pp. 211–218.
[16] H.J. Bussemaker, H. Li, E.D. Siggia, Regulatory element detection using a prob-abilistic segmentation model, in: Proceedings of the 8th International Conferenceon Intelligent Systems for Molecular Biology, 2000, pp. 67–74.
[17] D.E. Goldberg, Genetic Algorithms in Search Optimization and Machine Learning,Addison-Wesley, New York, 1989.
[18] E. Cox, The Fuzzy Systems Handbook, AP Professional, New York, 1994.[19] http://www.genome.ad.jp/kegg.[20] http://www.tigr.org.[21] E. Jacob, R. Sasikumar, K.N.R. Nair, A fuzzy-guided genetic algorithm for operon
prediction, Bioinformatics 21 (2005) 1403.[22] Y. Zheng, et al., Computational identification of operons in microbial genomes,
Genome Research 12 (2002) 1221.[23] D.L. Davies, D.W. Bouldin, A cluster separation measure, IEEE Transactions on
Pattern Analysis and Machine Intelligence 1 (1979) 224–227.
[24] R. Overbeek, M. Fonstein, M. D’Souza, G.D. Pusch, N. Maltsev, The use of geneclusters to infer functional coupling, Proceedings of the National Academy ofSciences, United States of America 96 (1999) 2896–2901.
[25] M.D. Ermolaeva, O. White, S.L. Salzberg, Prediction of operons in microbialgenomes, Nucleic Acids Research 29 (5) (2001) 1216–1221.
[26] H. Salgado, G. Moreno-Hagelsieb, T.F. Smith, C.V. Julio, Operons in E. coli: genomicanalysis and predictions, Proceedings of the National Academy of Sciences, UnitedStates of America 97 (12) (2000) 6652–6657.
[27] J. Bockhorst, M. Craven, D. Page, J. Shavlik, J. Glasner, A Bayesian networkapproach to operon prediction, Bioinformatics 19 (10) (2003) 1227–1235.
[28] A. Nakaya, S. Goto, M. Kanehisa, Extraction of correlated gene clusters by multiplegraph comparison, Genome Informatics 12 (2001) 44–53.
[29] T. Yada, M. Nakao, Y. Totoki, K. Nakai, Modeling and predicting transcriptional unitsof E. coli genes using hidden Markov models, Bioinformatics 15 (12) (1999) 987–993.
[30] C. Sabatti, L. Rohlin, M. Oh, J.C. Liao, Co-expression pattern from DNA micro arrayexperiments as a tool for operon prediction, Nucleic Acids Research 30 (13) (2002)2886–2893.