A Fuzzy Decision-Making Trial and Evaluation Laboratory ...
15
A Fuzzy Decision-Making Trial and Evaluation Laboratory approach to analyse risk factors related to environmental health and safety aspects in the healthcare industry R K A BHALAJI 1 , S BATHRINATH 1, * , S G PONNAMBALAM 2 and S SARAVANASANKAR 1 1 Department of Mechanical Engineering, Kalasalingam Academy of Research and Education, Krishnankoil 626126, India 2 Faculty of Manufacturing Engineering, Universiti Malaysia, 26600 Pekan, Pahang, Malaysia e-mail: [email protected] MS received 13 August 2018; revised 29 November 2018; accepted 29 November 2018; published online 9 February 2019 Abstract. In healthcare firms, environmental health and safety (EHS) remains as a vital factor as healthcare products pose very intricate problems related to environment safety. The different similar and dissimilar risk factors that prevail in the system have complicated known and unknown causal relationships that are difficult to understand and interpret. Hence, improving the EHS remains as a challenge in healthcare industry. A research study is carried out utilizing the data (in conjunction with expert’s opinion) and conditions of a healthcare firm in India to categorize and obtain the prominent risk factors based on identifying the most adverse causal rela- tionship among them. A Fuzzy Decision-Making Trial and Evaluation Laboratory (fuzzy DEMATEL)-based approach is designed and employed to assess and rank different EHS risk factors. The trapezoidal fuzzy membership function of the model facilitates better learning of interrelationships in spite of the prevailing vagueness in the causal relationships between the risk factors. The outcomes (the decisive risk factors) out of the experimentation using the proposed methodology strongly coincide with the actual causes of the EHS factors during the last one decade. As the proposed approach is found to be very effective in fixing the causal relationships and ranking among the risk factors, this may be successfully employed in similar healthcare firms/ industries for finding out their respective decisive risk factors. Keywords. Fuzzy DEMATEL; EHS; healthcare; risk factors; India. 1. Introduction The healthcare industry is highly regulated and are man- aged by federal, state and local regulatory agencies with the obligation of creating and maintaining a safe, healthy and sustainable condition for patients and employees. It is also required for the development of a nation, and has to combat effluents, pollutants and wastes generated. Hence, the healthcare industry needs to maintain environmental health and safety (EHS) [1]. It has become an industry norm and statutory requirement for the healthcare industry to adhere to the laws and guidelines relating to EHS laid down by the relevant regulatory bodies. More than anything else, EHS is necessary to guarantee the safety and consent to Good Manufacturing Practices (GMP). Alongside secure and more beneficial employees, a solid EHS management sys- tem (EMS) can work wonders in expanding the efficiency of an organization. Diseases related to healthcare industry influence between 5% and 30% of patients and staff. The related weight of sickness is high, and heavily depletes healthcare sector assets and families. Implementing safe ecological wellbeing conditions in healthcare can decrease transmission of healthcare-related diseases. EHS interven- tions in healthcare facilities act to lessen the disease, as they are focused on high-risk populations. These interven- tions provide a chance to advance safe environments that are significant to populations everywhere. They also con- tribute to safe environments at home. EHS guidelines should be strictly followed by health and safety managers, clinical and nursing staff, water and sanitation staff and other healthcare suppliers and healthcare promoters. Fur- ther, EHS in healthcare industries is studied by numerous specialists [2–4]. 2. Relevant literature The review of EHS literature is classified into three sections: (i) risk factors involved in EHS of healthcare industries, (ii) risk factors involved in EHS of other industries and (iii) usage of soft computing tools to analyse risk factors in EHS. *For correspondence 1 Sådhanå (2019) 44:55 Ó Indian Academy of Sciences https://doi.org/10.1007/s12046-018-1050-4
Transcript of A Fuzzy Decision-Making Trial and Evaluation Laboratory ...

A Fuzzy Decision-Making Trial and Evaluation Laboratory approachto analyse risk factors related to environmental health and safetyaspects in the healthcare industry
R K A BHALAJI1 , S BATHRINATH1,*, S G PONNAMBALAM2 and S SARAVANASANKAR1
1Department of Mechanical Engineering, Kalasalingam Academy of Research and Education,
Krishnankoil 626126, India2Faculty of Manufacturing Engineering, Universiti Malaysia, 26600 Pekan, Pahang, Malaysia
e-mail: [email protected]
MS received 13 August 2018; revised 29 November 2018; accepted 29 November 2018; published online 9 February 2019
Abstract. In healthcare firms, environmental health and safety (EHS) remains as a vital factor as healthcare
products pose very intricate problems related to environment safety. The different similar and dissimilar risk
factors that prevail in the system have complicated known and unknown causal relationships that are difficult to
understand and interpret. Hence, improving the EHS remains as a challenge in healthcare industry. A research
study is carried out utilizing the data (in conjunction with expert’s opinion) and conditions of a healthcare firm in
India to categorize and obtain the prominent risk factors based on identifying the most adverse causal rela-
tionship among them. A Fuzzy Decision-Making Trial and Evaluation Laboratory (fuzzy DEMATEL)-based
approach is designed and employed to assess and rank different EHS risk factors. The trapezoidal fuzzy
membership function of the model facilitates better learning of interrelationships in spite of the prevailing
vagueness in the causal relationships between the risk factors. The outcomes (the decisive risk factors) out of the
experimentation using the proposed methodology strongly coincide with the actual causes of the EHS factors
during the last one decade. As the proposed approach is found to be very effective in fixing the causal
relationships and ranking among the risk factors, this may be successfully employed in similar healthcare firms/
industries for finding out their respective decisive risk factors.
Keywords. Fuzzy DEMATEL; EHS; healthcare; risk factors; India.
1. Introduction
The healthcare industry is highly regulated and are man-
aged by federal, state and local regulatory agencies with the
obligation of creating and maintaining a safe, healthy and
sustainable condition for patients and employees. It is also
required for the development of a nation, and has to combat
effluents, pollutants and wastes generated. Hence, the
healthcare industry needs to maintain environmental health
and safety (EHS) [1]. It has become an industry norm and
statutory requirement for the healthcare industry to adhere
to the laws and guidelines relating to EHS laid down by the
relevant regulatory bodies. More than anything else, EHS is
necessary to guarantee the safety and consent to Good
Manufacturing Practices (GMP). Alongside secure and
more beneficial employees, a solid EHS management sys-
tem (EMS) can work wonders in expanding the efficiency
of an organization. Diseases related to healthcare industry
influence between 5% and 30% of patients and staff. The
related weight of sickness is high, and heavily depletes
healthcare sector assets and families. Implementing safe
ecological wellbeing conditions in healthcare can decrease
transmission of healthcare-related diseases. EHS interven-
tions in healthcare facilities act to lessen the disease, as
they are focused on high-risk populations. These interven-
tions provide a chance to advance safe environments that
are significant to populations everywhere. They also con-
tribute to safe environments at home. EHS guidelines
should be strictly followed by health and safety managers,
clinical and nursing staff, water and sanitation staff and
other healthcare suppliers and healthcare promoters. Fur-
ther, EHS in healthcare industries is studied by numerous
specialists [2–4].
2. Relevant literature
The review of EHS literature is classified into three sections:
(i) risk factors involved in EHS of healthcare industries, (ii)
risk factors involved in EHS of other industries and (iii) usage
of soft computing tools to analyse risk factors in EHS.*For correspondence
1
Sådhanå (2019) 44:55 � Indian Academy of Sciences
https://doi.org/10.1007/s12046-018-1050-4Sadhana(0123456789().,-volV)FT3](0123456789().,-volV)

2.1 Risk factors involved in EHS of the healthcare
industry
Nieva and Sorra [5] presented wellbeing culture appraisal, a
device for enhancing patient wellbeing in healthcare
administration. It shows that wellbeing culture appraisal
includes dedication of staff time and assets. It can be uti-
lized to quantify administrative conditions that prompt
harmful occasions and patient damage, and for creating and
assessing safety mediations in healthcare administrations.
Baicker et al [6] stated that work environment wellbeing
projects can produce reserve funds. The outcome suggested
that employer-based wellbeing programmes and activities
may not just enhance wellbeing but result in generous
savings, and help budgets and productivity in addition to
wellbeing results. Govindarajulu and Daily [7] exhibited a
structure for environmental performance by inspiring
workers. It was expected that workers associated with
environmental endeavours might improve an organization
towards superior environmental performance. The result
shows that top management ought to help a system by
formalizing EMS and conveying the significance of worker
inspiration in ecological change, while directors and man-
agers should likewise include workers at all levels in sat-
isfying ecological development objectives. Hignett et al [8]
presented a mandate to guard labour against risks when
taking care of heavy loads. To exclude this risk, execution
of the Union order on manual controlling within the
healthcare sector was mooted. It was proposed that medi-
ation should be founded on an organizational wellbeing
culture method where patient dealing is fully incorporated
into clinical preparation, in view of learning principles and
abilities. Duijm et al [9] studied the management of well-
being and security in the process industry. They used the
inputs and guidelines adopted by the industry in their model
to recognize patterns and requirements for development.
Management activities connected to health, safety and
environment (HSE) should be sufficient and organized to
enhance HSE quality effectively.
2.2 Risk factors involved in EHS of other
industries
Phimister et al [10] introduced a systematic structure for
the examination and development of close miss pro-
grammes in chemical process industries that enhance cor-
porate ecological, wellbeing and security execution through
the recognizing and administration of close misses. Shen
and Tam [11] studied the execution of environmental
boards in the construction industry that has an immediate
commitment to environmental assurance and includes
assigning assets for practicing different environmental
management strategies, for example noise control, treat-
ment of contaminated water, waste recycling and reuse, etc.
It was observed that decrease of environmental risk,
enhancing environmental image and cost reduction due to
lessening of environment-related convictions were the most
critical advantages of executing environmental manage-
ment in the construction industry. It should assist temporary
workers to change their environmental management
approach through effective resources inside their compa-
nies. Lee et al [12] proposed the environmental wellbeing
and security considerations of nanomaterials in the con-
struction industry. To accomplish environmentally capable
nanotechnology in construction, it is essential to consider
the lifecycle effects of MNM on the wellbeing of con-
struction employees and inhabitants, and in addition unin-
tended ecological impact during assembling, construction,
utilization, annihilation and removal.
2.3 Usage of soft computing tools to analyse risk
factors in EHS
Ilangkumaran et al [13] examined risk investigation and the
cautioning rate for hot conditions in the foundry industry
using multicriteria decision making (MCDM) methods. A
man working in a hot condition has a serious risk of heat-
related wellbeing issues. Consequently, these devices sup-
port the evaluators and chiefs in industry to investigate and
survey the risk and guarantee safe working conditions.
Reyes et al [14] presented health and safety criteria for
choosing reasonable construction schemes using MCDM
techniques. The health and safety record for financial
assessment of two projects were observed by them. They
found that the health and safety for scheme A was greater
than for scheme B, implying increased sustainability.
Finally, they concluded that if sustainability problems were
given more attention in construction industry, better
buildings with more secure, affordable and environmental
friendliness could be raised. Hatami-Marbini et al [15]
proposed a protection and wellbeing evaluation in danger-
ous litter reusing facilities through MCDM methods. Litter
is a potential risk to human wellbeing as the environment
turns more destructive, harmful and irresistible. Subse-
quently, there is a need for an ecological administration
framework that aims at decreasing and arranging litter in an
environmentally healthy way that secures human and eco-
logical wellbeing to help decision makers shape their
thoughts and sort out decisions; it should be utilized very
carefully. Jozi et al [16] studied the ecological risk
appraisal of dams in the construction industry using
MCDM methods. The result suggested that cut and fill,
blast, falling from heights and boring are the maximum
vital ecological risks in the construction phase. In other
words, risk assessment will secure the dam’s construction
and working staff against risk and also save nearby vil-
lagers from possible danger. Zheng et al [17] analysed
work safety in hot and damp situations using an MCDM
method like analytical hierarchy process (AHP). They
showed that the comprehensive security file, wellbeing
55 Page 2 of 15 Sådhanå (2019) 44:55

grade and early cautioning rate can be resolved. The out-
comes exhibit engineering practicability and the efficiency
of the strategies adopted in extreme environmental assess-
ment. Gupta and Thakkar [18] proposed a risk measure-
ment approach and showed its application for a developed
construction venture. This work embraces an incorporated
way to order risks using MCDM methods like GTOPSIS
and to measure risks in terms of general task postpones
using JRAP and MCS. They concluded that risks are
extremely reliant on task plan and the suggested approach
could provide a superior risk order list for the reason that it
considers slackness related with the venture activities.
Rajak et al [19] examined the interdependences among
sustainability criteria and chose the finest sustainable pro-
vider in the fuzzy environment using the AHP, TOPSIS and
fuzzy inference system and a MATLAB toolbox.
3. Risk factors affecting EHS in healthcareindustry
The healthcare industry is one of the world’s biggest and
quickest-developing industries. In this research, a renowned
healthcare firm in India was chosen for investigating risk
factors that affect EHS in the firm. There are certain risk
factors that need to be identified and analysed correctly to
ensure effective EHS in healthcare industries. Factors affect-
ing EHS in healthcare industries can be identified through a
literature review. As per literature, there is no research on
finding risk factors affecting EHS in healthcare industries. The
risks factors affecting EHS in healthcare industry are collected
from the literature and are presented in table 1.
4. Methodology
A Fuzzy Decision-Making Trial and Evaluation Laboratory
(fuzzy DEMATEL) is proposed to solve the problem. The
key factors related to EHS healthcare industries identified
are based on the survey from existing literature as well as
inputs from experts in this field and they are examined
using the fuzzy DEMATEL. Fuzzy DEMATEL tool aids in
finding the consequences of causal relations among factors.
4.1 Fuzzy set theory
The information obtained through the fuzzy set theory might
be probabilistic or uncertain and even vague in general. Zadeh
[40] proposed the superiority of fuzzy sets in decision making
under the status of insufficient information data. Human needs
were not required to solve fuzzy set theory once it was
assigned by linguistic values to solve complicated problems.
Considering real life scenario, decision makers’ judgments
were defined as expressions that when given to linguistic
constants were given in terms of fuzzy notations. Based on the
literature survey, it is found that triangular and trapezoidal
fuzzy membership functions were used most frequently by the
researchers and practitioners. A trapezoidal membership
function is used in this research, where X1 denotes a set of
objects, A1 is the fuzzy set for the set of objects and x1 is the
element inX1. Then, lA1 X1ð Þ denotes its membership func-
tion. In this research, a specialized fuzzy number called
trapezoidal fuzzy number (TrapFN) is used.
Let A1 ¼ a1; b1; c1; d1ð Þ be a trapezoidal membership
function that is mathematically expressed using Eq. (1),
wherea1� b1� c1� d1; for any two TrapFN, A1 ¼a1; b1; c1; d1ð Þ andA2 ¼ p1; q1; r1; s1ð Þ will be equal if andonly if a1 ¼ p1; b1 ¼ q1; c1 ¼ r1; d1 ¼ s1:
lA1 X1ð Þ ¼
0; x1\a1;x1� a1
x1� b1; a1� x1� b1;
1; b1� x1� c1;d1� x1
d1� c1; c1� x1� d1;
0; x1[ d1:
26666664
37777775
ð1Þ
4.2 Fuzzy DEMATEL
DEMATEL is a methodology that uses causal and effect
diagrams helpful to understand basic interactions among
key factors in EHS aspects in healthcare industries. Even
so, DEMATEL is not likely to manage human predictions
and data vagueness. To avoid such consequences, fuzzy
DEMATEL is proposed in this work. Data fuzziness was
managed by fuzzy logic, which coverts data to crisp values
[41]. The combined merits of DEMATEL and fuzzy logic
are exploited by formulating a fuzzy DEMATEL model to
examine and apportion the recognized key factors of EHS
in healthcare industries. The formulated fuzzy DEMATEL
not only figures out the uncertainty in examining causal
relations among factors but also speculates a plan of action
to manage EHS. Some fuzzy DEMATEL applications
found in the literature are presented in table 2.
Table 1. Categories of risk.
Sl. no. Risk factors Notation References
1 Process risk F1 [20, 21]
2 Factory age F2 [22, 23]
3 Raw materials F3 [24, 25]
4 Engineering-based risk F4 [26, 27]
5 Psychological F5 [28, 29]
6 Cultural F6 [5, 30]
7 Hygienic programme F7 [6, 31]
8 Government norms F8 [32, 33]
9 Employee awareness F9 [7, 34]
10 Stakeholders F10 [35, 36]
11 Emergencies F11 [37, 38]
12 Union F12 [8, 39]
Sådhanå (2019) 44:55 Page 3 of 15 55

The steps of the fuzzy DEMATEL adopted from [52] and
[41] are presented here.
Step 1: Seeking expert’s opinions and categorizing
evaluation criteria.
A panel of experts is established and valuable sugges-
tions on related subjects are obtained. The key factors of
EHS in the healthcare industry were identified from exist-
ing literature and from the panel of subject experts
established.
Step 2: Obtaining a Fuzzy Direct Assessment Matrix
(FDAM).
Once the assessment criteria are completed, pairwise
comparison for criteria is essential. For this, a fuzzy lin-
guistic scale with five different points (0=no influence,
1=very low influence, 2=low influence, 3=high influence,
4=very high influence) is used to aid decision makers to
evaluate the interrelation among various criteria. Decision
makers are requested to assign rating based on the fuzzy
linguistic scale for the development of an assessment
matrix as part of the evaluation criteria. When assessing
and modifying linguistic content from decision makers,
predictions go into fuzzy evaluations, leading to an opti-
mistic TrapFN presented in table 3. TrapFN is represented
by a quadruplet, i.e., a1ij; b1ij; c1ij; d1ij� �
, where a1� b1�c1� d1. Let x1kij ¼ a1kij; b1
kij; c1
kij; d1
kij
� �, where1� k� k,
be the fuzzy classification that the kth decision maker
provides for rating if factor i affects factorj.
Step 3: Obtain a Fuzzy Initial Direct Relation Matrix
(FIDRM).
Defuzzification is the process of changing fuzzy numbers to
corresponding crisp values. FIDRM is obtained due to the
separation of the region (technique), when defuzzification of
fuzzy assessment matrix is undertaken utilizing Eq. (2).
Average k obtained from n� n FIDRM is computed for all
decision makers, where k is the number of decision makers:
IT ¼ 1
4a1þ b1þ c1þ d1ð Þ: ð2Þ
Step 4: Obtain the normalized, initial, direct relation
matrix (NIRDM) using Eqs. (3) and (4):
m ¼ min1
maxPn
j¼1 aij�� �� ;
1
maxPn
i¼1 aij�� ��
" #; ð3Þ
NIDRM ¼ mA: ð4Þ
Step 5: Construct the Total Relation Matrix (TRM) using
Eq. (5) as follows:
TRM ¼ I � NIDRMð Þ�1 ð5Þ
where I = identity matrix and TRM ¼ ½tij�n�n.
Step 6: Calculate the summation of rows Rowið Þand the
summation of columns Colið Þ utilizing Eqs. (6)
and (7) as follows:
Rowi ¼Xnj¼1
tij
( )
n�1
; ð6Þ
Coli ¼Xni¼1
tij
( )
1�n
: ð7Þ
Table 2. Applications of fuzzy DEMATEL.
Sl.
no. Application area References
1 Facility layout problem in the machinery
industry
[42]
2 Knowledge management adoption in the
supply chain of a hydraulic valve
manufacturing organization
[43]
3 Inowits software organization [44]
4 Mining industry [45]
5 Supplier selection [46]
6 Crisis management [47]
7 Truck selection of land transportation
company
[48]
8 Green supply chain management [49]
9 Municipal solid waste management in Metro
Manila
[50]
10 Logistics idea assortment in Belgrade [51]
Table 3. Fuzzy linguistic scale used in this research.
Five-point score for
decision makers
preference
Linguistic
constants and
their description
Trapezoidal fuzzy
numbers (TrapFN) for
equivalent scores
0 No influence
(No)
(0,0,0.1,0.2)
1 Very low
influence (VL)
(0.1,0.2,0.3,0.4)
2 Low influence
(L)
(0.3,0.4,0.5,0.6)
3 High influence
(H)
(0.5,0.6,0.7,0.8)
4 Very high
influence
(VH)
(0.7,0.8,0.9,1)
55 Page 4 of 15 Sådhanå (2019) 44:55

Rowi denotes the general impact of one criterion, say
impact of criterion i on criterion j, and Coli denotes the
general impact experienced by criterion j because of cri-
terion i.
Step 7: Draw a cause and effect graph (CEG) by
processing the data set of
Rowi þ coli;Rowi � Colið Þ
The data set Rowi þ Colið Þ shows the significance of keycriteria and its ‘Prominence’ in EHS of healthcare indus-
tries, while Rowi � Colið Þ shows the impact of similar
factors ‘Influence’. If a positive value is obtained from
Rowi � Colið Þ, then the factor falls under the cause group,
and if Rowi � Colið Þ value is pessimistic, the factor falls
under the effect group. A flowchart of steps regarding the
process associated with fuzzy DEMATEL method is shown
in figure 1.
5. Empirical case study
The factors of EHS in a healthcare firm in India were
analysed by the suggested decision-making methodology.
As per the reports obtained from the industries for the past
10 years, employees face environment-related issues
almost every month throughout the year. It is also com-
prehended that works get delayed due to the risks engaged
in this firm. The firm considered for this study is one of the
leading private healthcare industry in India; the annual
turnover of the firm is more than 60 crores of Indian Rupees
and it is also known for its reputation. Over 400 direct and
150 indirect employees are involved in routine activities of
the firm. For successful implementation of EHS activities, it
is important to analyse the risk factors related to EHS. The
consequence of this research will surely aid the EHS
managers to comprehend the different risks involved in the
firm by implementing EMS for minimizing its severity. To
exemplify the suggested methodology there are three stages
that need to be followed, which are discussed here.
Stage
1:
Data gathering and identification of key factors of
EHS.
The key factors are gathered from the literature review,
straight interviews and inputs from industrial experts. For this
issue, primarily we approached a team of decision makers
including two managers in the senior cadre from healthcare
industry who practice EHS, a senior academician from the
institution of health and safety, and a member from the Min-
istry of Environment under the Government of India is formed
to characterize and to determine key factors of EHS in
healthcare industries. The chosen decision makers are
knowledgeable in their relevant areas and are skilled in deci-
sion making. The choice of decision makers is based on the
source of working knowledge (at least ten years’ experience)
and expertise in their domains. Twelve key factors of EHS in
healthcare industries chosen based on the literature review
match with the decision maker’s views. The questionnaire is
given in Appendix A to obtain decision makers opinion.
Get the fuzzy initial direct relation matrix
Get the normalized initial direct relation matrix (NIRDM)
Develop the total-relation matrix
Compute the summation of rows (R) and the sum of column
Draw a cause and effect graph by mapping the dataset
Define expert panel/decision group and evaluation
criteria for effective EHS in healthcare Industries
Construct fuzzy pair-wise comparison matrix(Obtaining linguistic judgment based on fuzzy linguistic scale to build up a relation matrix)
Utilize literature inputsand specialist opinions
Utilize specialist opinions
and trapezoidal fuzzy number
Figure 1. Fuzzy DEMATEL flow chart.
Table 4. Fuzzy initial direct relation matrix.
F1 F2 F3 F4 F5 F6 F7 F8 F9 F10 F11 F12
1. Process risk (F1) 0 4 4 4 0 0 3 4 2 3 4 0
2. Factory age (F2) 3 0 0 3 2 1 2 0 2 0 2 3
3. Raw materials (F3) 4 0 0 2 0 0 4 4 0 2 4 0
4. Engineering-based risk (F4) 4 0 0 0 0 0 4 4 3 0 3 0
5. Psychological (F5) 2 0 0 0 0 4 2 2 4 2 2 4
6. Cultural (F6) 1 0 0 0 4 0 2 2 4 3 1 4
7. Hygienic programme (F7) 4 0 4 4 2 2 0 4 2 0 0 1
8. Government norms (F8) 3 0 3 4 0 0 4 0 4 4 4 3
9. Employee awareness (F9) 3 0 0 2 3 4 3 1 0 0 2 4
10. Stakeholders (F10) 0 0 0 0 0 2 0 3 0 0 3 0
11. Emergencies (F11) 3 0 4 4 0 0 2 4 2 4 0 0
12. Union (F12) 0 2 0 0 4 4 0 3 4 0 0 0
Sådhanå (2019) 44:55 Page 5 of 15 55

Stage 2: Analysing the factors of EHS using fuzzy
DEMATEL.
The next stage is to examine the key factors of EHS
recognized from stage 1. The factors of EHS will be
examined through fuzzy DEMATEL. The step by step
analysis of factors with fuzzy DEMATEL is given as
follows.
Step 1: Pairwise comparison by decision makers among
key factors of EHS in healthcare industries utilizing a
point scale is shown in table 3. The fuzzy assessment
matrix suggested by the four decision makers is presented
in Appendix B.
Step 2: To develop initial direct relation matrix or
normal matrix, fuzzy numbers are changed to crisp
values by defuzzification as recommended in Step 3
of the fuzzy DEMATEL approach. FIDRM of key
factors in EHS in the healthcare industry is presented
in table 4.
Step 3: NIRDM of factors was accomplished by Eqs. (3)
and (4). Fuzzy NIRDM of key factors in EHS in the
healthcare industry is given in table 5.
Step 4: TRM of key factors of EHS in the healthcare
industry is obtained using Eq. (5) as shown in table 6.
Step 5: The row-wise sum ðRowiÞ and the column-wise
sum ðColiÞ of factors in the EHS in healthcare industry are
computed using Eqs. (6) and (7), respectively.
Step 6: Data sets Rowi þ Colið Þ and Rowi � Colið Þ data
sets of key factors of EHS in the healthcare industry are
exhibited in table 7.
Also, positioning of EHS key factors in the healthcare
industry is done based on Rowi þ Colið Þ data set and the
Rowi � Colið Þ data. The key factors are classified as a causeor effect group (see table 5). In the last stage,
Rowi þ Colið Þ and Rowi � Colið Þ data sets are created to
infer from the causal diagram, which is exhibited in
figure 2.
The significance of this factor is known as Prominence
Rowi þ Colið Þ. The influence Rowi � Colið Þ categorizes thecause and effect group. The knowledge for EHS analysis in
the healthcare industry is provided by the causal effect
diagram. Based on the analysis of different factors, their
corresponding positions and relative significance in the
framework, managers recognize factors influencing EHS
choices and helpful for them to make decisions accord-
ingly. Tables 8 and 9 present cause and effect group,
respectively.
Stage 3: Result verification.
The third and final stage of this study is to verify final
outcomes. The verification is acquired from industrial
experts by means of sending final outcomes of this research
for clarification as well as by verifying the results with
existing literatures. After verification, final outcomes are
presented to the healthcare firm.Table
5.
Fuzzynorm
alized
initialdirectrelationmatrix.
F1
F2
F3
F4
F5
F6
F7
F8
F9
F10
F11
F12
F1
0.010959
0.124201
0.124201
0.124201
0.024658
0.010959
0.094977
0.124201
0.065753
0.094977
0.124201
0.010959
F2
0.087671
0.010959
0.010959
0.109589
0.051142
0.051142
0.065753
0.017352
0.065753
0.010959
0.065753
0.094977
F3
0.124201
0.010959
0.010959
0.065753
0.010959
0.010959
0.116895
0.124201
0.010959
0.065753
0.124201
0.010959
F4
0.124201
0.010959
0.010959
0.010959
0.010959
0.010959
0.124201
0.124201
0.094977
0.010959
0.094977
0.030137
F5
0.065753
0.010959
0.010959
0.010959
0.010959
0.124201
0.065753
0.065753
0.102283
0.065753
0.065753
0.124201
F6
0.03653
0.010959
0.010959
0.010959
0.124201
0.010959
0.065753
0.065753
0.124201
0.094977
0.03653
0.102283
F7
0.109589
0.010959
0.109589
0.102283
0.065753
0.065753
0.010959
0.124201
0.065753
0.010959
0.010959
0.03653
F8
0.094977
0.010959
0.073059
0.124201
0.010959
0.010959
0.124201
0.010959
0.109589
0.124201
0.124201
0.094977
F9
0.087671
0.010959
0.010959
0.065753
0.073059
0.124201
0.102283
0.051142
0.010959
0.010959
0.080365
0.124201
F10
0.010959
0.010959
0.010959
0.010959
0.010959
0.065753
0.010959
0.094977
0.010959
0.010959
0.094977
0.010959
F11
0.094977
0.010959
0.116895
0.094977
0.010959
0.010959
0.065753
0.102283
0.065753
0.124201
0.010959
0.010959
F12
0.010959
0.065753
0.010959
0.010959
0.124201
0.124201
0.010959
0.094977
0.124201
0.010959
0.010959
0.010959
55 Page 6 of 15 Sådhanå (2019) 44:55

6. Results and discussion
In this work, a fuzzy DEMATEL is proposed to rec-
ognize highly influential risk factors affecting EHS in
the healthcare industry. EHS in the healthcare industry
faces difficulties in daily life as they are difficult to
solve. This paper investigates twelve risk factors
affecting EHS in the healthcare industry and their
interrelationships with each other using fuzzy
Table 6. Fuzzy Total Relation Matrix.
F1 F2 F3 F4 F5 F6 F7 F8 F9 F10 F11 F12
F1 0.27 0.2 0.29 0.35 0.15 0.16 0.34 0.4 0.29 0.28 0.36 0.18
F2 0.25 0.077 0.13 0.26 0.15 0.17 0.23 0.22 0.23 0.14 0.22 0.22
F3 0.31 0.081 0.16 0.25 0.1 0.12 0.31 0.35 0.19 0.22 0.31 0.13
F4 0.31 0.082 0.15 0.19 0.11 0.13 0.31 0.34 0.27 0.16 0.28 0.16
F5 0.24 0.08 0.13 0.17 0.13 0.26 0.24 0.28 0.29 0.21 0.24 0.26
F6 0.2 0.073 0.12 0.16 0.23 0.15 0.23 0.26 0.29 0.22 0.2 0.24
F7 0.31 0.085 0.24 0.28 0.17 0.19 0.22 0.35 0.26 0.17 0.22 0.18
F8 0.33 0.096 0.23 0.33 0.14 0.16 0.35 0.29 0.32 0.29 0.35 0.24
F9 0.28 0.086 0.15 0.24 0.2 0.26 0.29 0.28 0.22 0.17 0.26 0.27
F10 0.11 0.042 0.08 0.1 0.064 0.12 0.11 0.2 0.11 0.096 0.19 0.08
F11 0.28 0.078 0.24 0.27 0.1 0.12 0.26 0.32 0.23 0.27 0.21 0.13
F12 0.17 0.12 0.1 0.15 0.23 0.25 0.17 0.26 0.29 0.14 0.16 0.15
Table 7. Calculation of (Rowi?Coli) and (Rowi–Coli) data sets of key factors in EHS.
Barriers Rowi Coli Rowi?Coli Rank Rowi–Coli Cause/effect
F1 3.27 3.06 6.33 2 0.21 Cause
F2 2.297 1.1 3.397 12 1.197 Cause
F3 2.531 2.02 4.551 7 0.511 Cause
F4 2.492 2.75 5.242 6 -0.258 Effect
F5 2.53 1.774 5.508 10 0.756 Cause
F6 2.373 2.09 4.463 8 0.283 Cause
F7 2.675 3.06 5.735 3 -0.385 Effect
F8 3.126 3.55 6.676 1 -0.424 Effect
F9 2.706 2.99 5.696 4 -0.284 Effect
F10 1.302 2.366 3.668 11 -1.064 Effect
F11 2.508 3 5.508 5 -0.492 Effect
F12 2.19 2.24 4.43 9 -0.05 Effect
Figure 2. Cause and effect graph (CEG)
Table 8. Relative vector for cause group-criteria (Rowi–Coli).
Rank Cause group-criteria Rowi–Coli
1 2 1.197
2 5 0.756
3 3 0.511
4 6 0.283
5 1 0.21
Table 9. Relative vector for effect group-criteria (Rowi–Coli).
Rank Effect group-criteria Rowi–Coli
1 10 -1.064
2 11 -0.492
3 8 -0.424
4 7 -0.385
5 9 -0.284
Sådhanå (2019) 44:55 Page 7 of 15 55

DEMATEL. Figure 2 presents the CEG, which is
obtained based on the study conducted.
The order of importance of the 12 risk factors regarding
EHS in the healthcare industry through a level of signifi-
cance Rowi þ Colið Þ is noted as F8–F1–F7–F9–F11–F4–
F3–F6–F12–F5–F10–F2. As per Rowi þ Colið Þ the value inthe table, Government norms (F8), Process risk (F1) and
Hygiene programmes (F7) are the most noteworthy in
contrast with other risk factors with values of 6.676, 6.33
and 5.735, respectively. Additionally, Psychological factors
(F5), Stake holders (F10) and Factory age (F2) have the
least significance, their respective values being 5.508, 3.668
and 3.397. Risk factors like Factory age (F2), Psychological
factors (F5), Raw materials (F3), Cultural (F6) and Process
risk (F1) were classified in the cause group. Specific risk
factors like Stakeholders (F10), Emergencies (F11),
Government norms (F8), Hygiene programmes (F7),
Employee awareness (F9), Engineering-based risk (F4) and
Unions (F12) are classified in the effect group using the
individual Rowi � Colið Þ value. A specific investigation of
the cause and effect groups fixes risk factors in the subse-
quent subsets.
6.1 Discussion of cause group risk factors
As cause group risk factors are essential, it is critical to
centre other factors around them. Among all cause group
risk factors, Factory age (F2) Rowi � Colið Þ has a value of
1.197, suggesting that (F2) has a higher impact on the
whole system. However, its Rowi þ Colið Þ value is 3.397,
which is small and indicates relatively less impact. Factory
age in the healthcare industry indicates that the industry
uses old medical equipment and devices, which could lead
to enormous health issues. This is the reason why it ranks
first in the cause group. Advanced medical equipment and
devices are required in the healthcare industry to ensure
clean EHS and assure customer happiness by embracing
new medical equipment. Therefore, Factory age has a
crucial role in improving EHS in the healthcare industry.
The second most elevated risk factor in Rowi � Colið Þcolumn is the Psychological factor with a value of 0.756,
which additionally has the capacity to impact other risk
factors as given by Rowi þ Colið Þ value equivalent of
5.508. Psychological risks and work-related stress are
extremely difficult issues to handle in the firm. They
influence significantly on the health of people, administra-
tors and national frugalities. Psychological risks emerge
from improper work plan, organization and administration
and also weak social background of work and they lead to
pessimistic psychological, physical and social conse-
quences such as work-related stress, collapse and unhap-
piness. These are the reasons why it ranks second in the
cause group. Among workers, mental and physical health
has equal significance with work ability, but psychological
awareness and work ability had similar determinants. Raw
materials (F3) with a Rowi � Colið Þ value of 0.511 ranked
third with an impact Rowi þ Colið Þ value equivalent to
4.551. When manufacturing a healthcare product, raw
material extraction and handling affect environment,
degrading soil, creating water deficiencies and biodiversity
issues, and harm environment, leading to global warming.
Improper healthcare product use results in poisonous dis-
charges into water, soil and air. Safely and Secured Raw
material handling is very much essential for healthcare
services. Essentially, the succession of risk factors in the
cause group as indicated by their impact on risk factors can
be listed as Cultural (F6), with a Rowi � Colið Þ value of
0.283. Cultural risks are the accumulation of social values
and behaviours existing in an organization that portrays risk
judgments for the general administration as well as work-
ers. Misunderstandings, strains and predispositions caused
by cultural risks can prompt healthcare product failure as
also neglecting to revive culture-related management
practices. These are the reasons why it ranks fourth in the
cause group. Hence for achieving better performance the
cultural risks need to be reduced or controlled. Process risk
(F1) with a Rowi � Colið Þ score of 0.21 has a noteworthy
part in the healthcare industry. It is the risk of loss due to
failed inward procedures, individuals and systems or due to
outside occasions. In the healthcare industry, potential
danger to human health and safety is possible as an accident
or damage due to repeated strain. Due to this, process risk
comes last in the cause group.
6.2 Discussion of effect group risk factors
Risk factors in the effect group are affected by different
factors. They do not directly affect the system. Of all effect
group factors, Stakeholders factor (F10) gets the minimum
Rowi � Colið Þ score of -1.064, suggesting that this factor
has a high effect. There are people influenced by decision,
treatment, system or process. Healthcare industry stake-
holders can be individuals, associations or gatherings with
associations like an administration, which may change
during the process. These are the reasons why it ranks first
in the effect group as it helps maintain a strategic distance
from this issue and understand the stakeholder’s environ-
ment and execute stakeholder management plan. The other
risk factors, in an order of precedence in the effect group,
are Emergencies (F11) with a Rowi � Colið Þ value of
-0.492, Government norms (F8) with a Rowi � Colið Þscore of -0.424, Hygiene programmes (F7) with a
Rowi � Colið Þ score of -0.385, Employee awareness (F9)
with a Rowi � Colið Þ score of -0.284, Engineering-based
risk (F4) with a Rowi � Colið Þ score of -0.258 and Union
(F12) with a Rowi � Colið Þ score of -0.05. The Factor (F8)
is among the best as indicated by a Rowi þ Colið Þ value of
6.676, suggesting the factor’s significance. Government
fixes norms for high-risk medicines. In a move to upgrade
customer awareness and safety of drugs, the health ministry
55 Page 8 of 15 Sådhanå (2019) 44:55

affixes marking standards for high-risk medicines, making
it mandatory for the healthcare industry. However, many
industries do not follow standards for high-risk medicines.
The new guidelines are applicable to medicines that have a
high risk of side effects or are to be used only under
medical supervision. As per the standards, the label is on
the inner container of such high-risk or sensitive drugs
arranged as per schedule ten in the Drugs and Cosmetics
rules 2018. Also, the healthcare industry follows Environ-
mental Protection Act (1986) with the aim of protecting and
improving the environment.
Emergencies (F11) are the most viable factor in the
effect group. They are a circumstance representing an
immediate risk to health, life, property or environment.
Emergency care services are the regular issue looked at by
the healthcare industry. To overcome this issue, an industry
can get ready with an Emergency Response Plan, while
creating and keeping up an emergency preparedness com-
munication plan that conforms to government, state and
local laws. In case of any emergency, industries can utilize
this plan. Factors are categorized as cause and effect groups
as per discoveries and are illustrative of execution and
result directions. To acquire the wanted impact, constant
development is needed for the cause group. Lastly, the
study may encourage professionals/decision analysts to
think about different key factors to develop EHS in
industries.
7. Managerial implications
The findings of this work reveal that Factory age (F2) is the
most influential factor and hence must be given due con-
sideration for achieving the success of EHS in healthcare
industry. The research outcomes are helpful for managers
and top authorities in the industry to improve EHS as a
justification after identification of this factor. Latest and
advanced medical equipment and devices are required for
the healthcare industry to ensure clean environmental
health. Safety is an essential factor and should be tended to
first. The healthcare industry cannot give equal weight to all
factors simultaneously. However, it is mandatory to ensure
equal weight to all factors. In this research, a fuzzy
DEMATEL is proposed, which has many implications for
the practitioners and researchers in healthcare sector in
India.
8. Conclusion
There is an extraordinary potential for EHS in a country
like India as far as favourable conditions, environmental
pollution and clean environment are concerned. However,
implementing EHS activities and projects is not simple.
This work endeavours to put into practice successful EHS
by assessing risk factors connected to health and safety in
the healthcare industry. This paper proposes a decision
model and elucidates interrelations among factors, in
addition to outlining their causal interactions through a
causal diagram. The final causal effect diagram shows a
detailed picture of the collaborations among factors in
developing EHS in the healthcare industry. This will be
valuable for policy makers to create systems dealing with
health and safety and to make decisions effectively. A
fuzzy DEMATEL method to examine the impact and
powerful communications among factors is proposed.
Fuzzy DEMATEL is helpful in managing human subjec-
tivity, while DEMATEL empowers building up a basic
model to comprehend and investigate causal collaborations
among key EHS factors.
The suggested factor analysis based on fuzzy DEMA-
TEL method is deliberated upon with respect to India. In
view of literature and information sources from experts,
this paper has listed 12 factors with regard to effective EHS
in the healthcare industry. Fuzzy DEMATEL is used to
dissect identified factors. Then the cause and effect group is
framed. Risk factors, viz., Factory age (E2), Psychological
(E5), Raw materials (E3), cultural (E6) and Process risk
(E1), are slotted into the cause group, which aims to ensure
EHS in the healthcare industry. The remaining factors,
namely Stakeholders (E10), Emergencies (E11), Govern-
ment norms (E8), Hygiene programmes (E7), Employee
awareness (E9), Engineering-based risk (E4) and Union
(E12), fall into the effect group; they should be enhanced to
increase EHS in the healthcare industry.
This study has some limitations. The 12 risk factors
related to EHS in the healthcare industry are recognized in
this paper, but not the others. The identification of risk
factors could be a challenge from a futuristic point of
view. In the present research, all pairwise comparisons in
fuzzy DEMATEL methodology are formed based on the
views of specialists. However, they could be prejudiced in
their views. In future research, in addition to the 12
identified risk factors, a few more factors related to EHS
could be identified. The implementation of other comput-
ing tools or ranking methods like ANP, TOPSIS and IRP
may ensure good bonding to overcome this limitation. The
number of experts considered in this study is limited to
four experts. In future, though fuzzy set theory manages
uncertainty, it is restricted to managing fuzziness, and
hence further addition can be made to the grey theory for
further investigations.
Appendix A. Questionnaire
Note: A questionnaire is framed for the intention of per-
forming survey among the experts to assess factors affect-
ing EHS in healthcare industry as part of this research
work. The collected data will be used only for educational/
research work. The data acquired through the survey will
Sådhanå (2019) 44:55 Page 9 of 15 55
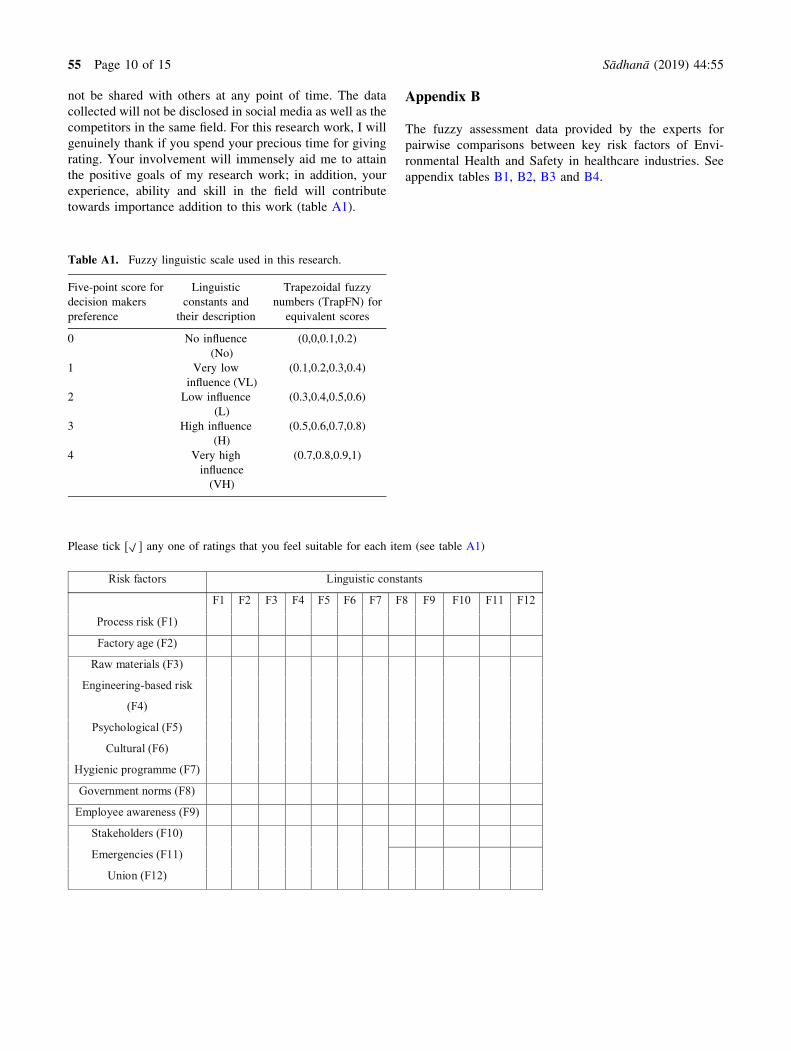
not be shared with others at any point of time. The data
collected will not be disclosed in social media as well as the
competitors in the same field. For this research work, I will
genuinely thank if you spend your precious time for giving
rating. Your involvement will immensely aid me to attain
the positive goals of my research work; in addition, your
experience, ability and skill in the field will contribute
towards importance addition to this work (table A1).
Appendix B
The fuzzy assessment data provided by the experts for
pairwise comparisons between key risk factors of Envi-
ronmental Health and Safety in healthcare industries. See
appendix tables B1, B2, B3 and B4.
Please tick [ ] any one of ratings that you feel suitable for each item (see table A1)
F1 F2 F3 F4 F5 F6 F7 F8 F9 F10 F11 F12
Process risk (F1)
Factory age (F2)
Raw materials (F3)
Engineering-based risk
(F4)
Psychological (F5)
Cultural (F6)
Hygienic programme (F7)
Government norms (F8)
Employee awareness (F9)
Stakeholders (F10)
Emergencies (F11)
Union (F12)
Risk factors Linguistic constants
Table A1. Fuzzy linguistic scale used in this research.
Five-point score for
decision makers
preference
Linguistic
constants and
their description
Trapezoidal fuzzy
numbers (TrapFN) for
equivalent scores
0 No influence
(No)
(0,0,0.1,0.2)
1 Very low
influence (VL)
(0.1,0.2,0.3,0.4)
2 Low influence
(L)
(0.3,0.4,0.5,0.6)
3 High influence
(H)
(0.5,0.6,0.7,0.8)
4 Very high
influence
(VH)
(0.7,0.8,0.9,1)
55 Page 10 of 15 Sådhanå (2019) 44:55

Personal information:
1. Name: ……………………………………..
2. Sex: Male Female
3. Age: Less than 30 to 40 to 60
4. Educational level:
5. Position/title:
6. Seniority: …………………years
Thank you very much for your time and effort in filling this questionnaire.
Table B1. The fuzzy assessment data provided by Expert 1.
F1 F2 F3 F4 F5 F6
F1 0.00,0.00,0.10,0.20 0.70,0.80,0.90,1.00 0.70,0.80,0.90,1.00 0.70,0.80,0.90,1.00 0.00,0.00,0.10,0.20 0.00,0.00,0.10,0.20
F2 0.50,0.60,0.70,0.80 0.00,0.00,0.10,0.20 0.00,0.00,0.10,0.20 0.50,0.60,0.70,0.80 0.30,0.40,0.50,0.60 0.10,0.20,0.30,0.40
F3 0.70,0.80,0.90,1.00 0.00,0.00,0.10,0.20 0.00,0.00,0.10,0.20 0.30,0.40,0.50,0.60 0.00,0.00,0.10,0.20 0.00,0.00,0.10,0.20
F4 0.70,0.80,0.90,1.00 0.00,0.00,0.10,0.20 0.00,0.00,0.10,0.20 0.00,0.00,0.10,0.20 0.00,0.00,0.10,0.20 0.00,0.00,0.10,0.20
F5 0.30,0.40,0.50,0.60 0.00,0.00,0.10,0.20 0.00,0.00,0.10,0.20 0.00,0.00,0.10,0.20 0.00,0.00,0.10,0.20 0.70,0.80,0.90,1.00
F6 0.10,0.20,0.30,0.40 0.00,0.00,0.10,0.20 0.00,0.00,0.10,0.20 0.00,0.00,0.10,0.20 0.70,0.80,0.90,1.00 0.00,0.00,0.10,0.20
F7 0.70,0.80,0.90,1.00 0.00,0.00,0.10,0.20 0.70,0.80,0.90,1.00 0.70,0.80,0.90,1.00 0.30,0.40,0.50,0.60 0.30,0.40,0.50,0.60
F8 0.50,0.60,0.70,0.80 0.00,0.00,0.10,0.20 0.50,0.60,0.70,0.80 0.70,0.80,0.90,1.00 0.00,0.00,0.10,0.20 0.00,0.00,0.10,0.20
F9 0.50,0.60,0.70,0.80 0.00,0.00,0.10,0.20 0.00,0.00,0.10,0.20 0.30,0.40,0.50,0.60 0.50,0.60,0.70,0.80 0.70,0.80,0.90,1.00
F10 0.00,0.00,0.10,0.20 0.00,0.00,0.10,0.20 0.00,0.00,0.10,0.20 0.00,0.00,0.10,0.20 0.00,0.00,0.10,0.20 0.30,0.40,0.50,0.60
F11 0.50,0.60,0.70,0.80 0.00,0.00,0.10,0.20 0.70,0.80,0.90,1.00 0.70,0.80,0.90,1.00 0.00,0.00,0.10,0.20 0.00,0.00,0.10,0.20
F12 0.00,0.00,0.10,0.20 0.30,0.40,0.50,0.60 0.00,0.00,0.10,0.20 0.00,0.00,0.10,0.20 0.70,0.80,0.90,1.00 0.70,0.80,0.90,1.00
F7 F8 F9 F10 F11 F12
F1 0.50,0.60,0.70,0.80 0.70,0.80,0.90,1.00 0.30,0.40,0.50,0.60 0.50,0.60,0.70,0.80 0.70,0.80,0.90,1.00 0.00,0.00,0.10,0.20
F2 0.30,0.40,0.50,0.60 0.00,0.00,0.10,0.20 0.30,0.40,0.50,0.60 0.00,0.00,0.10,0.20 0.30,0.40,0.50,0.60 0.50,0.60,0.70,0.80
F3 0.70,0.80,0.90,1.00 0.70,0.80,0.90,1.00 0.00,0.00,0.10,0.20 0.30,0.40,0.50,0.60 0.70,0.80,0.90,1.00 0.00,0.00,0.10,0.20
F4 0.70,0.80,0.90,1.00 0.70,0.80,0.90,1.00 0.50,0.60,0.70,0.80 0.00,0.00,0.10,0.20 0.50,0.60,0.70,0.80 0.00,0.00,0.10,0.20
F5 0.30,0.40,0.50,0.60 0.30,0.40,0.50,0.60 0.70,0.80,0.90,1.00 0.30,0.40,0.50,0.60 0.30,0.40,0.50,0.60 0.70,0.80,0.90,1.00
F6 0.30,0.40,0.50,0.60 0.30,0.40,0.50,0.60 0.70,0.80,0.90,1.00 0.50,0.60,0.70,0.80 0.10,0.20,0.30,0.40 0.70,0.80,0.90,1.00
F7 0.00,0.00,0.10,0.20 0.70,0.80,0.90,1.00 0.30,0.40,0.50,0.60 0.00,0.00,0.10,0.20 0.00,0.00,0.10,0.20 0.10,0.20,0.30,0.40
F8 0.70,0.80,0.90,1.00 0.00,0.00,0.10,0.20 0.70,0.80,0.90,1.00 0.70,0.80,0.90,1.00 0.70,0.80,0.90,1.00 0.50,0.60,0.70,0.80
F9 0.50,0.60,0.70,0.80 0.10,0.20,0.30,0.40 0.00,0.00,0.10,0.20 0.00,0.00,0.10,0.20 0.30,0.40,0.50,0.60 0.70,0.80,0.90,1.00
F10 0.00,0.00,0.10,0.20 0.50,0.60,0.70,0.80 0.00,0.00,0.10,0.20 0.00,0.00,0.10,0.20 0.50,0.60,0.70,0.80 0.00,0.00,0.10,0.20
F11 0.30,0.40,0.50,0.60 0.70,0.80,0.90,1.00 0.30,0.40,0.50,0.60 0.70,0.80,0.90,1.00 0.00,0.00,0.10,0.20 0.00,0.00,0.10,0.20
F12 0.00,0.00,0.10,0.20 0.50,0.60,0.70,0.80 0.70,0.80,0.90,1.00 0.00,0.00,0.10,0.20 0.00,0.00,0.10,0.20 0.00,0.00,0.10,0.20
Sådhanå (2019) 44:55 Page 11 of 15 55

Table B3. The fuzzy assessment data provided by Expert 3.
F1 F2 F3 F4 F5 F6
F1 0.00,0.00,0.10,0.20 0.70,0.80,0.90,1.00 0.70,0.80,0.90,1.00 0.70,0.80,0.90,1.00 0.00,0.00,0.10,0.20 0.00,0.00,0.10,0.20
F2 0.50,0.60,0.70,0.80 0.00,0.00,0.10,0.20 0.00,0.00,0.10,0.20 0.70,0.80,0.90,1.00 0.10,0.20,0.30,0.40 0.30,0.40,0.50,0.60
F3 0.70,0.80,0.90,1.00 0.00,0.00,0.10,0.20 0.00,0.00,0.10,0.20 0.30,0.40,0.50,0.60 0.00,0.00,0.10,0.20 0.00,0.00,0.10,0.20
F4 0.70,0.80,0.90,1.00 0.00,0.00,0.10,0.20 0.00,0.00,0.10,0.20 0.00,0.00,0.10,0.20 0.00,0.00,0.10,0.20 0.00,0.00,0.10,0.20
F5 0.30,0.40,0.50,0.60 0.00,0.00,0.10,0.20 0.00,0.00,0.10,0.20 0.00,0.00,0.10,0.20 0.00,0.00,0.10,0.20 0.70,0.80,0.90,1.00
F6 0.10,0.20,0.30,0.40 0.00,0.00,0.10,0.20 0.00,0.00,0.10,0.20 0.00,0.00,0.10,0.20 0.70,0.80,0.90,1.00 0.00,0.00,0.10,0.20
F7 0.50,0.60,0.70,0.80 0.00,0.00,0.10,0.20 0.70,0.80,0.90,1.00 0.50,0.60,0.70,0.80 0.30,0.40,0.50,0.60 0.30,0.40,0.50,0.60
F8 0.50,0.60,0.70,0.80 0.00,0.00,0.10,0.20 0.30,0.40,0.50,0.60 0.70,0.80,0.90,1.00 0.00,0.00,0.10,0.20 0.00,0.00,0.10,0.20
F9 0.50,0.60,0.70,0.80 0.00,0.00,0.10,0.20 0.00,0.00,0.10,0.20 0.30,0.40,0.50,0.60 0.30,0.40,0.50,0.60 0.70,0.80,0.90,1.00
F10 0.00,0.00,0.10,0.20 0.00,0.00,0.10,0.20 0.00,0.00,0.10,0.20 0.00,0.00,0.10,0.20 0.00,0.00,0.10,0.20 0.30,0.40,0.50,0.60
F11 0.70,0.80,0.90,1.00 0.00,0.00,0.10,0.20 0.70,0.80,0.90,1.00 0.30,0.40,0.50,0.60 0.00,0.00,0.10,0.20 0.00,0.00,0.10,0.20
F12 0.00,0.00,0.10,0.20 0.30,0.40,0.50,0.60 0.00,0.00,0.10,0.20 0.00,0.00,0.10,0.20 0.70,0.80,0.90,1.00 0.70,0.80,0.90,1.00
F7 F8 F9 F10 F11 F12
F1 0.50,0.60,0.70,0.80 0.70,0.80,0.90,1.00 0.30,0.40,0.50,0.60 0.50,0.60,0.70,0.80 0.70,0.80,0.90,1.00 0.00,0.00,0.10,0.20
F2 0.30,0.40,0.50,0.60 0.00,0.00,0.10,0.20 0.30,0.40,0.50,0.60 0.00,0.00,0.10,0.20 0.30,0.40,0.50,0.60 0.50,0.60,0.70,0.80
F3 0.70,0.80,0.90,1.00 0.70,0.80,0.90,1.00 0.00,0.00,0.10,0.20 0.30,0.40,0.50,0.60 0.70,0.80,0.90,1.00 0.00,0.00,0.10,0.20
F4 0.70,0.80,0.90,1.00 0.70,0.80,0.90,1.00 0.50,0.60,0.70,0.80 0.00,0.00,0.10,0.20 0.50,0.60,0.70,0.80 0.10,0.20,0.30,0.40
F5 0.30,0.40,0.50,0.60 0.30,0.40,0.50,0.60 0.50,0.60,0.70,0.80 0.30,0.40,0.50,0.60 0.30,0.40,0.50,0.60 0.70,0.80,0.90,1.00
F6 0.30,0.40,0.50,0.60 0.30,0.40,0.50,0.60 0.70,0.80,0.90,1.00 0.50,0.60,0.70,0.80 0.10,0.20,0.30,0.40 0.50,0.60,0.70,0.80
F7 0.00,0.00,0.10,0.20 0.70,0.80,0.90,1.00 0.30,0.40,0.50,0.60 0.00,0.00,0.10,0.20 0.00,0.00,0.10,0.20 0.10,0.20,0.30,0.40
F8 0.70,0.80,0.90,1.00 0.00,0.00,0.10,0.20 0.70,0.80,0.90,1.00 0.70,0.80,0.90,1.00 0.70,0.80,0.90,1.00 0.50,0.60,0.70,0.80
F9 0.70,0.80,0.90,1.00 0.30,0.40,0.50,0.60 0.00,0.00,0.10,0.20 0.00,0.00,0.10,0.20 0.50,0.60,0.70,0.80 0.70,0.80,0.90,1.00
F10 0.00,0.00,0.10,0.20 0.50,0.60,0.70,0.80 0.00,0.00,0.10,0.20 0.00,0.00,0.10,0.20 0.50,0.60,0.70,0.80 0.00,0.00,0.10,0.20
F11 0.30,0.40,0.50,0.60 0.50,0.60,0.70,0.80 0.30,0.40,0.50,0.60 0.70,0.80,0.90,1.00 0.00,0.00,0.10,0.20 0.00,0.00,0.10,0.20
F12 0.00,0.00,0.10,0.20 0.50,0.60,0.70,0.80 0.70,0.80,0.90,1.00 0.00,0.00,0.10,0.20 0.00,0.00,0.10,0.20 0.00,0.00,0.10,0.20
Table B2. The fuzzy assessment data provided by Expert 2.
F1 F2 F3 F4 F5 F6
F1 0.00,0.00,0.10,0.20 0.70,0.80,0.90,1.00 0.70,0.80,0.90,1.00 0.70,0.80,0.90,1.00 0.00,0.00,0.10,0.20 0.00,0.00,0.10,0.20
F2 0.30,0.40,0.50,0.60 0.00,0.00,0.10,0.20 0.00,0.00,0.10,0.20 0.50,0.60,0.70,0.80 0.30,0.40,0.50,0.60 0.10,0.20,0.30,0.40
F3 0.70,0.80,0.90,1.00 0.00,0.00,0.10,0.20 0.00,0.00,0.10,0.20 0.30,0.40,0.50,0.60 0.00,0.00,0.10,0.20 0.00,0.00,0.10,0.20
F4 0.70,0.80,0.90,1.00 0.00,0.00,0.10,0.20 0.00,0.00,0.10,0.20 0.00,0.00,0.10,0.20 0.00,0.00,0.10,0.20 0.00,0.00,0.10,0.20
F5 0.30,0.40,0.50,0.60 0.00,0.00,0.10,0.20 0.00,0.00,0.10,0.20 0.00,0.00,0.10,0.20 0.00,0.00,0.10,0.20 0.70,0.80,0.90,1.00
F6 0.10,0.20,0.30,0.40 0.00,0.00,0.10,0.20 0.00,0.00,0.10,0.20 0.00,0.00,0.10,0.20 0.70,0.80,0.90,1.00 0.00,0.00,0.10,0.20
F7 0.50,0.60,0.70,0.80 0.00,0.00,0.10,0.20 0.70,0.80,0.90,1.00 0.50,0.60,0.70,0.80 0.30,0.40,0.50,0.60 0.30,0.40,0.50,0.60
F8 0.50,0.60,0.70,0.80 0.00,0.00,0.10,0.20 0.30,0.40,0.50,0.60 0.70,0.80,0.90,1.00 0.00,0.00,0.10,0.20 0.00,0.00,0.10,0.20
F9 0.50,0.60,0.70,0.80 0.00,0.00,0.10,0.20 0.00,0.00,0.10,0.20 0.30,0.40,0.50,0.60 0.30,0.40,0.50,0.60 0.70,0.80,0.90,1.00
F10 0.00,0.00,0.10,0.20 0.00,0.00,0.10,0.20 0.00,0.00,0.10,0.20 0.00,0.00,0.10,0.20 0.00,0.00,0.10,0.20 0.30,0.40,0.50,0.60
F11 0.50,0.60,0.70,0.80 0.00,0.00,0.10,0.20 0.70,0.80,0.90,1.00 0.70,0.80,0.90,1.00 0.00,0.00,0.10,0.20 0.00,0.00,0.10,0.20
F12 0.00,0.00,0.10,0.20 0.30,0.40,0.50,0.60 0.00,0.00,0.10,0.20 0.00,0.00,0.10,0.20 0.70,0.80,0.90,1.00 0.70,0.80,0.90,1.00
F7 F8 F9 F10 F11 F12
F1 0.50,0.60,0.70,0.80 0.70,0.80,0.90,1.00 0.30,0.40,0.50,0.60 0.50,0.60,0.70,0.80 0.70,0.80,0.90,1.00 0.00,0.00,0.10,0.20
F2 0.30,0.40,0.50,0.60 0.10,0.20,0.30,0.40 0.30,0.40,0.50,0.60 0.00,0.00,0.10,0.20 0.30,0.40,0.50,0.60 0.50,0.60,0.70,0.80
F3 0.50,0.60,0.70,0.80 0.70,0.80,0.90,1.00 0.00,0.00,0.10,0.20 0.30,0.40,0.50,0.60 0.70,0.80,0.90,1.00 0.00,0.00,0.10,0.20
F4 0.70,0.80,0.90,1.00 0.70,0.80,0.90,1.00 0.50,0.60,0.70,0.80 0.00,0.00,0.10,0.20 0.50,0.60,0.70,0.80 0.10,0.20,0.30,0.40
F5 0.30,0.40,0.50,0.60 0.30,0.40,0.50,0.60 0.50,0.60,0.70,0.80 0.30,0.40,0.50,0.60 0.30,0.40,0.50,0.60 0.70,0.80,0.90,1.00
F6 0.30,0.40,0.50,0.60 0.30,0.40,0.50,0.60 0.70,0.80,0.90,1.00 0.50,0.60,0.70,0.80 0.10,0.20,0.30,0.40 0.50,0.60,0.70,0.80
F7 0.00,0.00,0.10,0.20 0.70,0.80,0.90,1.00 0.30,0.40,0.50,0.60 0.00,0.00,0.10,0.20 0.00,0.00,0.10,0.20 0.10,0.20,0.30,0.40
F8 0.70,0.80,0.90,1.00 0.00,0.00,0.10,0.20 0.70,0.80,0.90,1.00 0.70,0.80,0.90,1.00 0.70,0.80,0.90,1.00 0.50,0.60,0.70,0.80
F9 0.50,0.60,0.70,0.80 0.10,0.20,0.30,0.40 0.00,0.00,0.10,0.20 0.00,0.00,0.10,0.20 0.30,0.40,0.50,0.60 0.70,0.80,0.90,1.00
F10 0.00,0.00,0.10,0.20 0.50,0.60,0.70,0.80 0.00,0.00,0.10,0.20 0.00,0.00,0.10,0.20 0.50,0.60,0.70,0.80 0.00,0.00,0.10,0.20
F11 0.30,0.40,0.50,0.60 0.50,0.60,0.70,0.80 0.30,0.40,0.50,0.60 0.70,0.80,0.90,1.00 0.00,0.00,0.10,0.20 0.00,0.00,0.10,0.20
F12 0.00,0.00,0.10,0.20 0.50,0.60,0.70,0.80 0.70,0.80,0.90,1.00 0.00,0.00,0.10,0.20 0.00,0.00,0.10,0.20 0.00,0.00,0.10,0.20
55 Page 12 of 15 Sådhanå (2019) 44:55

References
[1] Kamath K, Shabaraya A R and Subramanyam E V S 2014
Role of environment health and safety (EHS) in pharma-
ceutical industry, vol. 46, pp. 34–35
[2] Bond R G, Michaelsen G S and Deroos R (Eds.) 1973 En-
vironmental health and safety in health-care facilities
[3] Bourbonnais R, Brisson C, Vinet A, Vezina M and Lower A
2006 Development and implementation of a participative
intervention to improve the psychosocial work environment
and mental health in an acute care hospital. Occupational
and Environmental Medicine 63(5): 326–334
[4] Lundstrom T, Pugliese G, Bartley J, Cox J and Guither C
2002 Organizational and environmental factors that affect
worker health and safety and patient outcomes. American
Journal of Infection Control 30(2): 93–106
[5] Nieva V F and Sorra J 2003 Safety culture assessment: a tool
for improving patient safety in healthcare organizations. BMJ
Quality & Safety 12(Suppl 2): ii17–ii23
[6] Baicker K, Cutler D and Song Z 2010 Workplace wellness
programs can generate savings. Health Affairs 29(2):
304–311
[7] Govindarajulu N and Daily B F 2004 Motivating employees
for environmental improvement. Industrial Management &
Data Systems 104(4): 364–372
[8] Hignett S, Fray M, Rossi M A, Tamminen-Peter L, Hermann
S, Lomi C and Johnsson C 2007 Implementation of the
Manual Handling Directive in the healthcare industry in the
European Union for patient handling tasks. International
Journal of Industrial Ergonomics 37(5): 415–423
[9] Duijm N J, Fievez C, Gerbec M, Hauptmanns U and Kon-
standinidou M 2008 Management of health, safety and
environment in process industry. Safety Science 46(6):
908–920
[10] Phimister J R, Oktem U, Kleindorfer P R and Kunreuther H
2003 Near miss incident management in the chemical pro-
cess industry. Risk Analysis 23(3): 445–459
[11] Shen L Y and Tam V W 2002 Implementation of environ-
mental management in the Hong Kong construction industry.
International Journal of Project Management 20(7):
535–543
[12] Lee J, Mahendra S and Alvarez P J 2010 Nanomaterials in
the construction industry: a review of their applications and
environmental health and safety considerations. ACS Nano
4(7): 3580–3590
[13] Ilangkumaran M, Karthikeyan M, Ramachandran T,
Boopathiraja M and Kirubakaran B 2015 Risk analysis and
warning rate of hot environment for foundry industry using
hybrid MCDM technique. Safety Science 72: 133–143
[14] Reyes J P, San-Jose J T, Cuadrado J and Sancibrian R 2014
Health & Safety criteria for determining the sustainable
value of construction projects. Safety Science 62: 221–232
[15] Hatami-Marbini A, Tavana M, Moradi M and Kangi F 2013
A fuzzy group Electre method for safety and health assess-
ment in hazardous waste recycling facilities. Safety Science
51(1): 414–426
Table B4. The fuzzy assessment data provided by Expert 4.
F1 F2 F3 F4 F5 F6
F1 0.00,0.00,0.10,0.20 0.70,0.80,0.90,1.00 0.70,0.80,0.90,1.00 0.70,0.80,0.90,1.00 0.30,0.40,0.50,0.60 0.00,0.00,0.10,0.20
F2 0.50,0.60,0.70,0.80 0.00,0.00,0.10,0.20 0.00,0.00,0.10,0.20 0.70,0.80,0.90,1.00 0.10,0.20,0.30,0.40 0.30,0.40,0.50,0.60
F3 0.70,0.80,0.90,1.00 0.00,0.00,0.10,0.20 0.00,0.00,0.10,0.20 0.30,0.40,0.50,0.60 0.00,0.00,0.10,0.20 0.00,0.00,0.10,0.20
F4 0.70,0.80,0.90,1.00 0.00,0.00,0.10,0.20 0.00,0.00,0.10,0.20 0.00,0.00,0.10,0.20 0.00,0.00,0.10,0.20 0.00,0.00,0.10,0.20
F5 0.30,0.40,0.50,0.60 0.00,0.00,0.10,0.20 0.00,0.00,0.10,0.20 0.00,0.00,0.10,0.20 0.00,0.00,0.10,0.20 0.70,0.80,0.90,1.00
F6 0.10,0.20,0.30,0.40 0.00,0.00,0.10,0.20 0.00,0.00,0.10,0.20 0.00,0.00,0.10,0.20 0.70,0.80,0.90,1.00 0.00,0.00,0.10,0.20
F7 0.70,0.80,0.90,1.00 0.00,0.00,0.10,0.20 0.30,0.40,0.50,0.60 0.50,0.60,0.70,0.80 0.30,0.40,0.50,0.60 0.30,0.40,0.50,0.60
F8 0.50,0.60,0.70,0.80 0.00,0.00,0.10,0.20 0.30,0.40,0.50,0.60 0.70,0.80,0.90,1.00 0.00,0.00,0.10,0.20 0.00,0.00,0.10,0.20
F9 0.30,0.40,0.50,0.60 0.00,0.00,0.10,0.20 0.00,0.00,0.10,0.20 0.30,0.40,0.50,0.60 0.30,0.40,0.50,0.60 0.70,0.80,0.90,1.00
F10 0.00,0.00,0.10,0.20 0.00,0.00,0.10,0.20 0.00,0.00,0.10,0.20 0.00,0.00,0.10,0.20 0.00,0.00,0.10,0.20 0.30,0.40,0.50,0.60
F11 0.30,0.40,0.50,0.60 0.00,0.00,0.10,0.20 0.50,0.60,0.70,0.80 0.30,0.40,0.50,0.60 0.00,0.00,0.10,0.20 0.00,0.00,0.10,0.20
F12 0.00,0.00,0.10,0.20 0.30,0.40,0.50,0.60 0.00,0.00,0.10,0.20 0.00,0.00,0.10,0.20 0.70,0.80,0.90,1.00 0.70,0.80,0.90,1.00
F7 F8 F9 F10 F11 F12
F1 0.50,0.60,0.70,0.80 0.70,0.80,0.90,1.00 0.30,0.40,0.50,0.60 0.50,0.60,0.70,0.80 0.70,0.80,0.90,1.00 0.00,0.00,0.10,0.20
F2 0.30,0.40,0.50,0.60 0.00,0.00,0.10,0.20 0.30,0.40,0.50,0.60 0.00,0.00,0.10,0.20 0.30,0.40,0.50,0.60 0.50,0.60,0.70,0.80
F3 0.70,0.80,0.90,1.00 0.70,0.80,0.90,1.00 0.00,0.00,0.10,0.20 0.30,0.40,0.50,0.60 0.70,0.80,0.90,1.00 0.00,0.00,0.10,0.20
F4 0.70,0.80,0.90,1.00 0.70,0.80,0.90,1.00 0.50,0.60,0.70,0.80 0.00,0.00,0.10,0.20 0.50,0.60,0.70,0.80 0.10,0.20,0.30,0.40
F5 0.30,0.40,0.50,0.60 0.30,0.40,0.50,0.60 0.50,0.60,0.70,0.80 0.30,0.40,0.50,0.60 0.30,0.40,0.50,0.60 0.70,0.80,0.90,1.00
F6 0.30,0.40,0.50,0.60 0.30,0.40,0.50,0.60 0.70,0.80,0.90,1.00 0.50,0.60,0.70,0.80 0.10,0.20,0.30,0.40 0.50,0.60,0.70,0.80
F7 0.00,0.00,0.10,0.20 0.70,0.80,0.90,1.00 0.30,0.40,0.50,0.60 0.00,0.00,0.10,0.20 0.00,0.00,0.10,0.20 0.10,0.20,0.30,0.40
F8 0.70,0.80,0.90,1.00 0.00,0.00,0.10,0.20 0.30,0.40,0.50,0.60 0.70,0.80,0.90,1.00 0.70,0.80,0.90,1.00 0.50,0.60,0.70,0.80
F9 0.50,0.60,0.70,0.80 0.30,0.40,0.50,0.60 0.00,0.00,0.10,0.20 0.00,0.00,0.10,0.20 0.50,0.60,0.70,0.80 0.70,0.80,0.90,1.00
F10 0.00,0.00,0.10,0.20 0.50,0.60,0.70,0.80 0.00,0.00,0.10,0.20 0.00,0.00,0.10,0.20 0.50,0.60,0.70,0.80 0.00,0.00,0.10,0.20
F11 0.30,0.40,0.50,0.60 0.50,0.60,0.70,0.80 0.30,0.40,0.50,0.60 0.70,0.80,0.90,1.00 0.00,0.00,0.10,0.20 0.00,0.00,0.10,0.20
F12 0.00,0.00,0.10,0.20 0.50,0.60,0.70,0.80 0.70,0.80,0.90,1.00 0.00,0.00,0.10,0.20 0.00,0.00,0.10,0.20 0.00,0.00,0.10,0.20
Sådhanå (2019) 44:55 Page 13 of 15 55

[16] Jozi S A, ShoshtaryMT and ZadehA RK 2015 Environmental
risk assessment of dams in construction phase using a multi-
criteria decision-making (MCDM) method. Human and Eco-
logical Risk Assessment: An International Journal 21(1): 1–16
[17] Zheng G, Zhu N, Tian Z, Chen Y and Sun B 2012 Appli-
cation of a trapezoidal fuzzy AHP method for work safety
evaluation and early warning rating of hot and humid envi-
ronments. Safety Science 50(2): 228–239
[18] Gupta V K and Thakkar J J 2018 A quantitative risk
assessment methodology for construction project. Sadhana
43(7): 116
[19] Rajak A K, Niraj M and Kumar S 2016 Designing of fuzzy
expert heuristic models with cost management toward
coordinating AHP, fuzzy TOPSIS and FIS approaches.
Sadhana 41(10): 1209–1218
[20] Messelbeck J and Whaley M 1999 Greening the health care
supply chain: triggers of change, models for success. Cor-
porate Environmental Strategy 6(1): 39–45
[21] Roberts V 2001 Managing strategic outsourcing in the
healthcare industry. Journal of Healthcare Management 46:
239–249
[22] Hale A R and Hovden J 1998 Management and culture: the
third age of safety. A review of approaches to organizational
aspects of safety, health and environment. Occupational
injury: risk, prevention and intervention, pp. 129–165
[23] Kagermann H 2015 Change through digitization—value
creation in the age of industry 4.0. In: Management of per-
manent change. Wiesbaden: Springer Gabler, pp. 23–45
[24] Lam C W, James J T, McCluskey R, Arepalli S and Hunter R
L 2006 A review of carbon nanotube toxicity and assessment
of potential occupational and environmental health risks.
Critical Reviews in Toxicology 36(3): 189–217
[25] Koller G, Fischer U and Hungerbuhler K 2000 Assessing
safety, health, and environmental impact early during process
development. Industrial & Engineering Chemistry Research
39(4): 960–972
[26] Marx D A and Slonim A D 2003 Assessing patient safety risk
before the injury occurs: an introduction to sociotechnical
probabilistic risk modelling in health care. BMJ Quality &
Safety 12(Suppl 2): ii33–ii38
[27] Bates D W, Saria S, Ohno-Machado L, Shah A and Escobar
G 2014 Big data in health care: using analytics to identify
and manage high-risk and high-cost patients. Health Affairs
33(7): 1123–1131
[28] Sauter S L, Murphy L R and Hurrell J J 1990 Prevention of
work-related psychological disorders: a national strategy
proposed by the National Institute for Occupational Safety
and Health (NIOSH). American Psychologist 45(10): 1146
[29] Quinlan R J 2007 Human parental effort and environmental
risk. Proceedings of the Royal Society of London B: Bio-
logical Sciences 274(1606): 121–125
[30] Betancourt J R, Green A R, Carrillo J E and Owusu Ananeh-
Firempong I I 2016 Defining cultural competence: a practical
framework for addressing racial/ethnic disparities in health
and health care. Public Health Reports 118(4): 293–302
[31] Plog B A, Niland J and Quinlan P 1996 Fundamentals of
industrial hygiene. Ithaca, NY: National Safety Council,
pp. 1–7
[32] Stern P C, Dietz T and Black J S 1985 Support for envi-
ronmental protection: the role of moral norms. Population
and Environment 8(3–4): 204–222
[33] Begun J W, Zimmerman B and Dooley K 2003 Health care
organizations as complex adaptive systems. Advances in
health care organization theory, pp. 253, 288
[34] Morrow D and Rondinelli D 2002 Adopting corporate
environmental management systems: motivations and results
of ISO 14001 and EMAS certification. European Manage-
ment Journal 20(2): 159–171
[35] Judge W Q and Ryman J A 2001 The shared leadership
challenge in strategic alliances: lessons from the US
healthcare industry. The Academy of Management Executive
15(2): 71–79
[36] Lundgren R E and McMakin A H 2018 Risk communication:
a handbook for communicating environmental, safety, and
health risks. John Wiley & Sons
[37] Reynolds B and Seeger M W 2005 Crisis and emergency risk
communication as an integrative model. Journal of Health
Communication 10(1): 43–55
[38] Wisner B and Adams J (Eds.) 2002 Environmental health in
emergencies and disasters: a practical guide. Geneva: World
Health Organization
[39] Kawakami T, Kogi K, Toyama N and Yoshikawa T 2004
Participatory approaches to improving safety and health
under trade union initiative. Industrial Health 42(2):
196–206
[40] Zadeh L A 1965 Information and control. Fuzzy Sets 8(3):
338–353
[41] Luthra S, Govindan K, Kharb R K and Mangla S K 2016
Evaluating the enablers in solar power developments in the
current scenario using fuzzy DEMATEL: an Indian per-
spective. Renewable and Sustainable Energy Reviews 63:
379–397
[42] Altuntas S, Selim, H and Dereli T 2014 A fuzzy DEMATEL-
based solution approach for facility layout problem: a case
study. The International Journal of Advanced Manufacturing
Technology 73(5–8): 749–771
[43] Patil S K and Kant R 2014 A fuzzy AHP–TOPSIS frame-
work for ranking the solutions of Knowledge Management
adoption in Supply Chain to overcome its barriers. Expert
Systems with Applications 41(2): 679–693
[44] Sangaiah A K, Gopal J, Basu A and Subramaniam P R 2017
An integrated fuzzy DEMATEL, TOPSIS, and ELECTRE
approach for evaluating knowledge transfer effectiveness
with reference to GSD project outcome. Neural Computing
and Applications 28(1): 111–123
[45] Govindan K, Kannan D and Shankar K M 2014 Evaluating
the drivers of corporate social responsibility in the mining
industry with multi-criteria approach: a multi-stakeholder
perspective. Journal of Cleaner Production 84: 214–232
[46] Chang B, Chang C W and Wu C H 2011 Fuzzy DEMATEL
method for developing supplier selection criteria. Expert
Systems with Applications 38(3): 1850–1858
[47] Zhou Q, Huang W and Zhang, Y. 2011 Identifying critical
success factors in emergency management using a fuzzy
DEMATEL method. Safety Science 49(2): 243–252
[48] BaykasogLu A, KaplanogLu V, DurmusOgLu Z D and Sahin
C 2013 Integrating fuzzy DEMATEL and fuzzy hierarchical
TOPSIS methods for truck selection. Expert Systems with
Applications 40(3): 899–907
[49] Lin R J 2013 Using fuzzy DEMATEL to evaluate the green
supply chain management practices. Journal of Cleaner
Production 40: 32–39
55 Page 14 of 15 Sådhanå (2019) 44:55

[50] Tseng M L and Lin Y H 2009 Application of fuzzy
DEMATEL to develop a cause and effect model of munic-
ipal solid waste management in Metro Manila. Environ-
mental Monitoring and Assessment 158(1–4): 519
[51] Tadic S, Zecevic S and Krstic M 2014 A novel hybrid
MCDM model based on fuzzy DEMATEL, fuzzy ANP and
fuzzy VIKOR for city logistics concept selection. Expert
Systems with Applications 41(18): 8112–8128
[52] Govindan K, Khodaverdi R and Vafadarnikjoo A 2015
Intuitionistic fuzzy based DEMATEL method for developing
green practices and performances in a green supply chain.
Expert Systems with Applications 42(20): 7207–7220
Sådhanå (2019) 44:55 Page 15 of 15 55