A fuzzy algorithm for color quantization of images
7
Pattern Recognition 35 (2002) 1785–1791 www.elsevier.com/locate/patcog A fuzzy algorithm for color quantization of images Do gan Ozdemir, Lale Akarun ∗ Department of Computer Engineering, Bo gazic i University, 80815 Bebek, Istanbul, Turkey Received 5 July 2001 Abstract In this paper, we review a number of techniques for fuzzy color quantization. We show that the fuzzy membership paradigm is particularly suited to color quantization, where color cluster boundaries are not well dened. We propose a new fuzzy color quantization technique which incorporates a term for partition index. This algorithm produces better results than fuzzy C-means at a reduced computational cost. We test the results of the fuzzy algorithms using quality metrics which model the perception of the human visual system and illustrate that substantial quality improvements are achieved. ? 2002 Pattern Recognition Society. Published by Elsevier Science Ltd. All rights reserved. Keywords: Color quantization; Fuzzy membership function; Human visual system 1. Introduction Most color image printing and display devices do not have the capability of reproducing true color images, which may contain up to 16.6 million colors. Prior to dis- play or printing of true color images, the number of colors in an image is reduced by a process called color quantiza- tion. The reduced colors constitute a color palette, which typically contains 256 or fewer entries. The fastest color quantization methods produce a color palette by iteratively partitioning the color space with planes perpendicular to the color axes [1]. These techniques produce images with mediocre quality; how- ever, due to their tree structured palettes, they aord fast execution. Orchard and Bouman have devised a better tree-based approach which partitions the color space with planes perpendicular to the principal axis of the color covariance matrix [2]. Techniques based on clus- tering schemes such as the C-means algorithm produce better quality palettes at higher computational cost [3]. ∗ Corresponding author. Tel.: +90-212-263-1500; fax: +90-212-287-2461. E-mail address: [email protected] (L. Akarun). Fuzzy quantization is a generalization of hard quan- tization schema and the best known and most widely used fuzzy quantization technique is the fuzzy C-means (FCM) algorithm [4]. In the FCM algorithm, each data point belongs to a cluster with a degree specied by a membership grade between zero and one. Since the color space of the images and the color clusters contained in this color space are irregular in shape and density, nd- ing representative colors for color clusters is a suitable application area for fuzzy techniques. The FCM algo- rithm produces locally optimal solutions and generally produces better palettes than the hard C-means algorithm. Recently, new fuzzy quantization techniques for joint quantization and dithering have been proposed [5]. In combined approaches, the basic idea is introducing the dithering error to the quantizer to output an optimized codebook that is more suitable for dithering. Therefore, the dithering error aects the resultant codebook the quantizer produces. This paper presents a short summary of fuzzy color quantization techniques [4,5] and presents a new tech- nique for fuzzy color quantization. We propose a fuzzy color quantization technique that incorporates a partition index term to more eciently quantize images. Our 0031-3203/02/$22.00 ? 2002 Pattern Recognition Society. Published by Elsevier Science Ltd. All rights reserved. PII:S0031-3203(01)00170-4
-
Upload
dogan-oezdemir -
Category
Documents
-
view
220 -
download
1
Transcript of A fuzzy algorithm for color quantization of images

Pattern Recognition 35 (2002) 1785–1791www.elsevier.com/locate/patcog
A fuzzy algorithm for color quantization of images
Do'gan (Ozdemir, Lale Akarun∗
Department of Computer Engineering, Bo�gazic�i University, 80815 Bebek, Istanbul, Turkey
Received 5 July 2001
Abstract
In this paper, we review a number of techniques for fuzzy color quantization. We show that the fuzzy membershipparadigm is particularly suited to color quantization, where color cluster boundaries are not well de2ned. We proposea new fuzzy color quantization technique which incorporates a term for partition index. This algorithm produces betterresults than fuzzy C-means at a reduced computational cost. We test the results of the fuzzy algorithms using qualitymetrics which model the perception of the human visual system and illustrate that substantial quality improvements areachieved. ? 2002 Pattern Recognition Society. Published by Elsevier Science Ltd. All rights reserved.
Keywords: Color quantization; Fuzzy membership function; Human visual system
1. Introduction
Most color image printing and display devices do nothave the capability of reproducing true color images,which may contain up to 16.6 million colors. Prior to dis-play or printing of true color images, the number of colorsin an image is reduced by a process called color quantiza-tion. The reduced colors constitute a color palette, whichtypically contains 256 or fewer entries.
The fastest color quantization methods produce acolor palette by iteratively partitioning the color spacewith planes perpendicular to the color axes [1]. Thesetechniques produce images with mediocre quality; how-ever, due to their tree structured palettes, they a@ord fastexecution. Orchard and Bouman have devised a bettertree-based approach which partitions the color spacewith planes perpendicular to the principal axis of thecolor covariance matrix [2]. Techniques based on clus-tering schemes such as the C-means algorithm producebetter quality palettes at higher computational cost [3].
∗ Corresponding author. Tel.: +90-212-263-1500; fax:+90-212-287-2461.
E-mail address: [email protected] (L. Akarun).
Fuzzy quantization is a generalization of hard quan-tization schema and the best known and most widelyused fuzzy quantization technique is the fuzzy C-means(FCM) algorithm [4]. In the FCM algorithm, each datapoint belongs to a cluster with a degree speci2ed by amembership grade between zero and one. Since the colorspace of the images and the color clusters contained inthis color space are irregular in shape and density, 2nd-ing representative colors for color clusters is a suitableapplication area for fuzzy techniques. The FCM algo-rithm produces locally optimal solutions and generallyproduces better palettes than the hard C-means algorithm.
Recently, new fuzzy quantization techniques for jointquantization and dithering have been proposed [5]. Incombined approaches, the basic idea is introducing thedithering error to the quantizer to output an optimizedcodebook that is more suitable for dithering. Therefore,the dithering error a@ects the resultant codebook thequantizer produces.
This paper presents a short summary of fuzzy colorquantization techniques [4,5] and presents a new tech-nique for fuzzy color quantization. We propose a fuzzycolor quantization technique that incorporates a partitionindex term to more eGciently quantize images. Our
0031-3203/02/$22.00 ? 2002 Pattern Recognition Society. Published by Elsevier Science Ltd. All rights reserved.PII: S0031-3203(01)00170-4
1786 D. )Ozdemir, L. Akarun / Pattern Recognition 35 (2002) 1785–1791
partition index term is based on the cluster validity idea.Cluster validity is concerned with checking the qualityof clustering results [4]. It has been mainly used to eval-uate and compare the resultant partitions from di@erentalgorithms or from the same algorithm under di@erentparameters [7,8]. Generally, cluster validity measuresare used to evaluate the groupings of data into clustersto see if any grouping reJects the actual structure of thedata. Less commonly, they have been used to judge thequality of the individual clusters. In Ref. [9], it is usedfor the re-clustering of a 2xed number (c) of clustersthrough a split and merge approach to obtain a bettercodebook. In our work, we used the cluster validity ideato establish a partition index criterion. The resultingalgorithm has an improved quantization performanceand a reduced computational cost compared to the fuzzyC-means algorithm. It can be coupled with any dither-ing technique, preferably fuzzy dithering [6], to obtainvisually high quality images.
The present paper is organized as follows: Section 2reviews the fuzzy algorithms for quantization of colorimages. Section 3 introduces the newly proposed fuzzyquantization method, the partition index maximization(PIM) algorithm. Finally, Section 4 reports on simulationresults of the PIM algorithm.
2. Fuzzy algorithms for color quantization
2.1. Fuzzy quantization
The 2rst attempt for fuzzy quantization has been theadaptation of the fuzzy C-means algorithm for this pur-pose. In the FCM algorithm, n vectors are partitionedinto c fuzzy groups. Sum of membership values is equalto unity:
c∑i=1
uij = 1 ∀j = 1; : : : ; n: (1)
Let the pixels of a color image be represented by 3×1vectors xj for 1 6 j 6 n where n is the total numberof pixels in the image. To simplify the equations, doubleindices denoting the location of the pixels have beenreplaced by the single index j. For an image of sizeM1 × M2, the pixel at location (m1; m2) corresponds tothe index j = m1 + m2M1. With these de2nitions, theobjective function is de2ned as
J =n∑
j=1
c∑i=1
(uij)md(xj ; yi); (2)
where m is the parameter of fuzziness, yi denotes the setof quantization colors and d(xj ; yi) is the L2 norm. Usingthe Lagrange multipliers method, the minimization of the
objective function results in the membership function
uij =[
1∑ck=1 d(xj ; yi)=d(xj ; yk)
]1=(m−1)
(3)
and the update function is
yi =
∑nj=1 (uij)mxj∑nj=1 (uij)m
: (4)
2.2. Previous work on FCM quantization
In Ref. [5], the FCM algorithm is modi2ed by incor-porating a separation term into the objective functionJ to minimize the fuzzy Euclidean distance and to max-imize the inter-cluster separation (ICS). The separation(si) of a fuzzy cluster (i) is de2ned as the sum of thedistances from its cluster center (yi) to the center of theother (c − 1) clusters:
si =c∑
t=1
||yi − yt ||2: (5)
Then si is incorporated into the objective function Jto settle the quantization centers to local minima suchthat they will be closer to the convex hull of the imagecolor space than their FCM converged counterparts. Theexamination of the resultant palettes for test images ob-tained from the FCM and the ICS algorithms shows thatthe color space covered by the palette produced by theICS algorithm is larger. This enlargement provides thecreation of the illusion of more colors after dithering isapplied.
3. Partition index maximization
In this section, we propose a new extension of theFCM algorithm which minimizes an objective functionincorporating a validity index. Therefore, validity indexis used not to judge the resultant partitions, but to formbetter partitions with respect to the validity index used. Inthe proposed approach, we minimize an objective func-tion including a term for partition index. This algorithmattempts to place the cluster centers such that the mem-bership values of the pixels are maximized. The goal isto obtain better partitions faster than the FCM algorithm.Although the intended application domain is image quan-tization, it is applicable to any classi2cation scheme.
Partition index is a measure of validity similar to par-tition coeGcient, based on using Pj =
∑ci=1 (uij)m as a
measure of how well the jth data point has been classi-2ed. The closer a pixel is to a codebook entry, the closerPj is to one. If a pixel becomes an outlier to all clus-ter centers, the value of Pj approaches 1=cm−1, which
D. )Ozdemir, L. Akarun / Pattern Recognition 35 (2002) 1785–1791 1787
is the minimum value it can have. Therefore, if we aimto minimize the fuzzy Euclidean distance measure andmaximize the membership values of the partitions, theobjective function becomes
J (u; y) =n∑
j=1
c∑i=1
(uij)md(xj ; yi) − �n∑
j=1
c∑i=1
(uij)m (6)
under the constraint of Eq. (1). The parameter � controlsthe weight of the second term and will be further exam-ined. Using the standard technique of Lagrange multipli-ers, the equation to be minimized is
Jj(uj; �) =c∑
i=1
(uij)md(xj ; yi) − �c∑
i=1
(uij)m
− �
(c∑
i=1
uij − 1
); (7)
where � is the Lagrange multiplier. The minimization ofJj(uj; �) proceeds as follows:
@Jj@uij
= m(uij)m−1d(xj ; yi) − �m(uij)m−1 − � = 0: (8)
Solving for uij yields
uij =[�m
1d(xj ; yi) − �
]1=(m−1)
: (9)
From Eq. (1)
�m
=1∑c
k=1 1=(d(xj ; yk) − �(10)
and substituting Eq. (10) into Eq. (9) we obtain
uij =[
1∑ck=1 d(xj ; yi) − �=d(xj ; yk) − �
]1=(m−1)
: (11)
Since Pj is independent of yi, the update equation isthe same as in the FCM and it is given in Eq. (4).
Note that if �=0, the proposed extension of the FCMreduces to the standard algorithm. Since the terms of theform d(xj ; yi)− � in Eq. (11) may take zero or negativevalues, resulting in unde2ned or negative membershipvalues, we should de2ne
uij = 1 for d(xj ; yi) 6 �: (12)
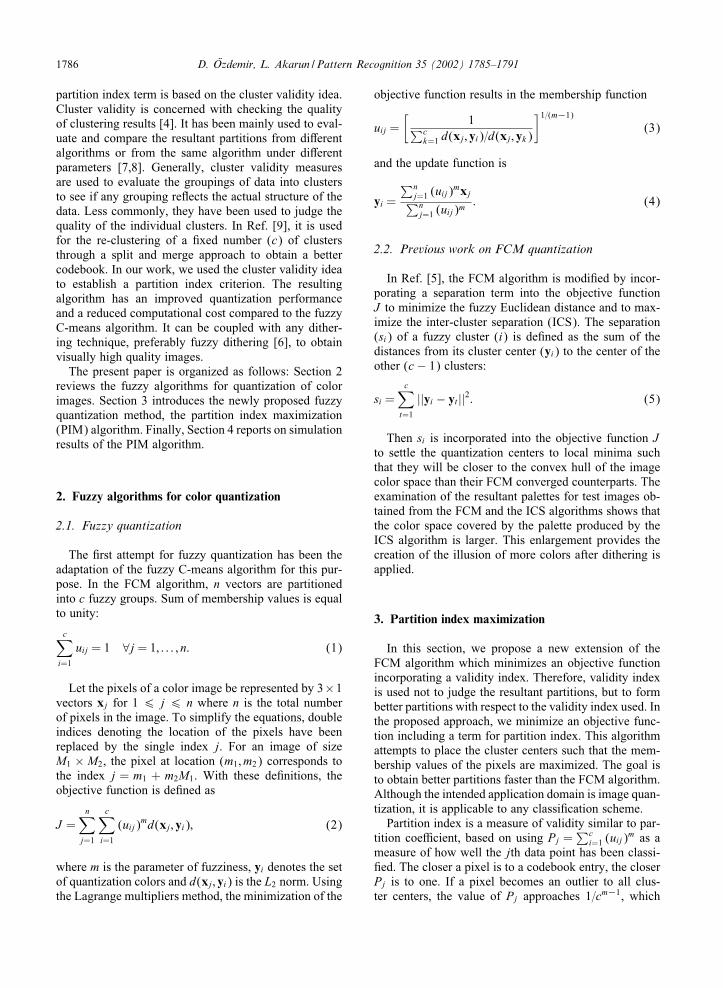
The physical interpretation of Eq. (12) is to de2ne ahard region around quantization centers with radius � asin Fig. 1. Therefore, any pixel value contained in thesehard regions will be classi2ed in a hard manner and thoseoutside the hard regions will go through fuzzy quanti-zation according to the membership function de2ned inEq. (11). Since no membership value needs to be calcu-lated for those pixels staying in the hard region, the al-gorithm will work faster depending on the distribution ofthe color vectors and the radius of the hard region. The
Fig. 1. Two dimensional representation of the hard regions.The circles represent hard regions around quantization centers.
more the pixels contained in the hard region, the fasterthe quantization. On the other hand, if too many pixelsare contained in the hard region, we lose the bene2tsof the fuzzy quantization and improvement over hardquantization becomes less signi2cant. A natural solutionis to set the radius of the hard regions to a fraction of thedistance between the closest two quantization centers.
4. Results
PIM algorithm is implemented for color quantizationof images. First, we need to determine the value of �used in Eq. (6) that controls the amount of contributionof partition index to fuzzy quantization. Eq. (12) dictatesthat the value of � should not exceed halfway betweentwo cluster centers. Therefore, it is dependent on thedistribution of the cluster centers.
A straightforward approach is to set � to a fraction ofthe distance between the closest two quantization centers,that is � = �min[d(yi ; yj)], where 0 6 �¡ 0:5. Hence,� is dynamically determined. In Figs. 2(a) and 3(a), per-centage change in mse versus � for 100 test images isshown. �=0 corresponds to classical fuzzy quantizationand as � increases, the hard region around the quantiza-tion centers grows. In Fig. 2(a), the fuzziness parameterm is set to 1.3 and in Fig. 3(a) it is set to 1.5. It is seenthat the PIM algorithm yields about 10% decrease in msewith respect to FCM for m = 1:5, while the decrease inmse is close to 5% for m = 1:3.
It is interesting to see that the percentage decreasein mse is greatly a@ected by the choice of m. That is,the fuzzier the quantizer is, the more the improvementobtained in mse as � approaches 0.5. The reason can beexplained as follows: If a pixel xj is in the � region ofthe quantization color yi, there is not much doubt aboutwhich quantization center it belongs to. Therefore, PIMalgorithm assigns xj to yi in a hard manner, that is uij=1.If xj is outside the � region of all quantization centers, itsmembership value is calculated by the fuzzy membershipfunction de2ned in Eq. (11). If m is small, the degree

1788 D. )Ozdemir, L. Akarun / Pattern Recognition 35 (2002) 1785–1791
Fig. 2. Quantization to 8 levels using PIM algorithm setting m= 1:3: (a) comparison of the percentage increase in mse versus � for100 test images; (b) percentage increase in mse for 100 test images setting � = 0:49.
Fig. 3. Quantization to 8 levels using PIM algorithm setting m= 1:5: (a) comparison of the percentage increase in mse versus � for100 test images; (b) percentage increase in mse for 100 test images setting � = 0:49.
Fig. 4. Mse versus � for di@erent m values for the image“peppers”. Quantization level is 16 and dotted line representsthe mse obtained after C-means quantization.
of fuzziness is already low and the e@ect of introducinga hard region around quantization centers is also small.If m is larger, the degree of fuzziness is larger and thee@ect of the hard region de2ned by � increases. Therefore,better codebooks are obtained by fuzzy quantization withrespect to hard quantization, but even better codebooksare obtained by a semi-fuzzy quantization schema.
This result brings out the question of the e@ect of mand how � contributes to the resultant mse for color im-age quantization. In Fig. 4, the change in mse versus � fordi@erent m parameters is shown for the image “peppers”.It is seen that the value of m plays an important role in
fuzzy quantization, and our experiments show that set-tingm=1:3 produces satisfactory results for most images.However, introducing a hard region around quantizationcenters further reduces mse, more for relatively higherm values. Therefore, quantization process becomes lesssensitive to the m parameter and lower mse values areobtained for any m value with respect to the FCM algo-rithm.
We also measured the error after applying the mod-ulation transfer function (MTF) of the human visualsystem (HVS) to the resulting images as suggested inRefs. [10–12]. We di@erentiated the color image into itsluminance and chrominance components by transformingit into YCRCB color coordinate system [13]. Both compo-nents of the image are then 2ltered with the HVS 2lter,and we computed the frequency weighted mean squarederror (fwmse) afterwards as in Ref. [6].
The results are presented for luminance in Fig. 5(c) and(d) and for chrominance in Fig. 5(e) and (f) for 100 testimages. The images for which the performance is best,worst and average are also indicated. The comparison ofthe percentage increase in mse is also given in Fig. 5(a)and (b). It is seen that there is a perceptual improvementin 90 images for quantization to 16 levels using m= 1:3:
The color di@erences (SE) of the test images inL∗a∗b∗ color coordinate system [14] are also calculated:
SE = [(SL∗)2 + (Sa∗)2 + (Sb∗)2]1=2: (13)

D. )Ozdemir, L. Akarun / Pattern Recognition 35 (2002) 1785–1791 1789
Fig. 5. The comparison of the percentage increase in mse and fwmse for the PIM algorithm. The results are obtained from 100 testimages (quantization level=16; m= 1:3): (a) percentage increase in mse versus �; (b) percentage increase in mse for �= 0:49; (c)application of the HVS MTF to the luminance component; (d) percentage increase in luminance fwmse for �=0:49; (e) applicationof the HVS MTF to the chrominance component; (f) percentage increase in chrominance fwmse for � = 0:49.
Fig. 6. (a) The percentage increase in SE versus � for the PIM algorithm relative to the FCM algorithm; (b) the percentage increasein SE obtained by using 100 test images.
The results are seen in Fig. 6 for 100 test images.In general, there is a decrease in color di@erences withrespect to FCM quantization for most images, resultingin perceptually better quantized images.
Introducing a hard region also a@ects the speed ofthe quantization. In Fig. 1, two dimensional representation
of the hard regions is shown. The membership valuesof the pixels in the hard region need not be calculated:they are simply set to one. In Fig. 7, the percentage ofthe pixels classi2ed in a hard manner for some speci2c� values are seen. If � is chosen to be close to 0.5, about40–50% of the pixels are classi2ed in a hard manner on

1790 D. )Ozdemir, L. Akarun / Pattern Recognition 35 (2002) 1785–1791
Fig. 7. The percentage of the pixels in the hard region versus �. The results are obtained by using 100 test images. The most, leastand average cases refering to images are indicated for: (a) quantization to 16 levels using m = 1:3; (b) quantization to eight levelsusing m = 1:3; (c) quantization to eight levels using m = 1:5.
Fig. 8. Comparison of the relative computation times: (a) the percentage increase in rct=iteration versus � for 2ve test images;(b) the percentage increase in rct for � = 0:49 obtained from 100 test images.
Fig. 9. Two partitions obtained by the FCM and the PIM algorithms. + and ◦: instances of two separate classes; ∗: quantizationcenters. (a) FCM (m=1:3): the FCM algorithm tries to partition the feature space into equal size clusters; (b) PIM (m=1:3; �=0:4):a better performance is obtained by the PIM algorithm if the clusters are relatively compact.
the average. This schema has an accelerating e@ect formost images. The more the pixels contained in the hardregion, the faster the algorithm gets.
In Fig. 8, percentage increase in relative computationtimes (rct) with respect to the FCM algorithm is givenfor test images. In general, the algorithm converges fasteras hard region grows out. The increase in rct per itera-tion versus � is given in Fig. 8(a). As � approaches 0.5,each iteration gets about 10% faster than it is in FCM.The percentage increase in rct per iteration for �=0:49 is8.1% with # = 2:1 for 100 test images as shown inFig. 8(b).
We also implemented the PIM algorithm for clusteringof two dimensional test data given in Ref. [9]. The data inFig. 9 consist of two clusters which are distinctly apart.
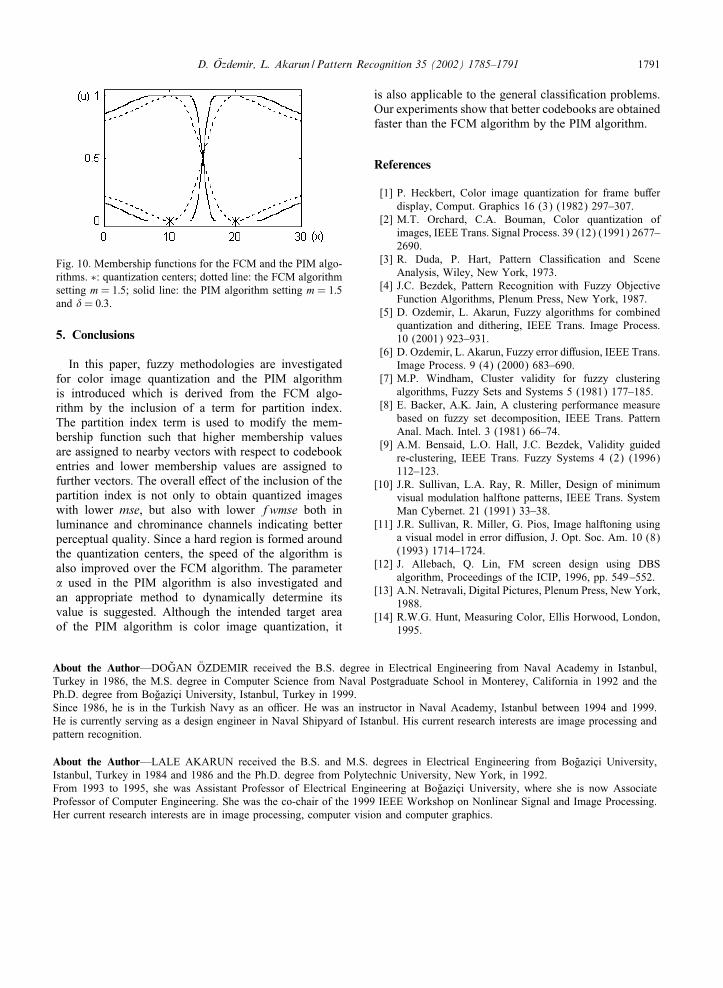
Fig. 9(a) shows the partition imposed by the FCM algo-rithm with two clusters for m= 1:3. The FCM algorithmtries to partition the feature space into equal size clus-ters. The classi2cation imposed by the PIM algorithmwith � = 0:4 is seen in Fig. 9(b). The PIM algorithmassigns higher membership values to nearby vectorsand lower membership values to further vectors. Thisis seen in Fig. 10, where the membership functions ofboth the FCM and the PIM algorithms are sketched intwo dimensions. Therefore, a better performance is ob-tained by the PIM algorithm if the clusters are relativelycompact.
Example color images related to the performanceof the PIM algorithm can be found underhttp:==www.cmpe.boun.edu.tr= ∼ akarun=examples.ppt
D. )Ozdemir, L. Akarun / Pattern Recognition 35 (2002) 1785–1791 1791
Fig. 10. Membership functions for the FCM and the PIM algo-rithms. ∗: quantization centers; dotted line: the FCM algorithmsetting m = 1:5; solid line: the PIM algorithm setting m = 1:5and � = 0:3.
5. Conclusions
In this paper, fuzzy methodologies are investigatedfor color image quantization and the PIM algorithmis introduced which is derived from the FCM algo-rithm by the inclusion of a term for partition index.The partition index term is used to modify the mem-bership function such that higher membership valuesare assigned to nearby vectors with respect to codebookentries and lower membership values are assigned tofurther vectors. The overall e@ect of the inclusion of thepartition index is not only to obtain quantized imageswith lower mse, but also with lower fwmse both inluminance and chrominance channels indicating betterperceptual quality. Since a hard region is formed aroundthe quantization centers, the speed of the algorithm isalso improved over the FCM algorithm. The parameter� used in the PIM algorithm is also investigated andan appropriate method to dynamically determine itsvalue is suggested. Although the intended target areaof the PIM algorithm is color image quantization, it
is also applicable to the general classi2cation problems.Our experiments show that better codebooks are obtainedfaster than the FCM algorithm by the PIM algorithm.
References
[1] P. Heckbert, Color image quantization for frame bu@erdisplay, Comput. Graphics 16 (3) (1982) 297–307.
[2] M.T. Orchard, C.A. Bouman, Color quantization ofimages, IEEE Trans. Signal Process. 39 (12) (1991) 2677–2690.
[3] R. Duda, P. Hart, Pattern Classi2cation and SceneAnalysis, Wiley, New York, 1973.
[4] J.C. Bezdek, Pattern Recognition with Fuzzy ObjectiveFunction Algorithms, Plenum Press, New York, 1987.
[5] D. Ozdemir, L. Akarun, Fuzzy algorithms for combinedquantization and dithering, IEEE Trans. Image Process.10 (2001) 923–931.
[6] D. Ozdemir, L. Akarun, Fuzzy error di@usion, IEEE Trans.Image Process. 9 (4) (2000) 683–690.
[7] M.P. Windham, Cluster validity for fuzzy clusteringalgorithms, Fuzzy Sets and Systems 5 (1981) 177–185.
[8] E. Backer, A.K. Jain, A clustering performance measurebased on fuzzy set decomposition, IEEE Trans. PatternAnal. Mach. Intel. 3 (1981) 66–74.
[9] A.M. Bensaid, L.O. Hall, J.C. Bezdek, Validity guidedre-clustering, IEEE Trans. Fuzzy Systems 4 (2) (1996)112–123.
[10] J.R. Sullivan, L.A. Ray, R. Miller, Design of minimumvisual modulation halftone patterns, IEEE Trans. SystemMan Cybernet. 21 (1991) 33–38.
[11] J.R. Sullivan, R. Miller, G. Pios, Image halftoning usinga visual model in error di@usion, J. Opt. Soc. Am. 10 (8)(1993) 1714–1724.
[12] J. Allebach, Q. Lin, FM screen design using DBSalgorithm, Proceedings of the ICIP, 1996, pp. 549–552.
[13] A.N. Netravali, Digital Pictures, Plenum Press, New York,1988.
[14] R.W.G. Hunt, Measuring Color, Ellis Horwood, London,1995.
About the Author—DO 'GAN (OZDEMIR received the B.S. degree in Electrical Engineering from Naval Academy in Istanbul,Turkey in 1986, the M.S. degree in Computer Science from Naval Postgraduate School in Monterey, California in 1992 and thePh.D. degree from Bo'gaziXci University, Istanbul, Turkey in 1999.Since 1986, he is in the Turkish Navy as an oGcer. He was an instructor in Naval Academy, Istanbul between 1994 and 1999.He is currently serving as a design engineer in Naval Shipyard of Istanbul. His current research interests are image processing andpattern recognition.
About the Author—LALE AKARUN received the B.S. and M.S. degrees in Electrical Engineering from Bo'gaziXci University,Istanbul, Turkey in 1984 and 1986 and the Ph.D. degree from Polytechnic University, New York, in 1992.From 1993 to 1995, she was Assistant Professor of Electrical Engineering at Bo'gaziXci University, where she is now AssociateProfessor of Computer Engineering. She was the co-chair of the 1999 IEEE Workshop on Nonlinear Signal and Image Processing.Her current research interests are in image processing, computer vision and computer graphics.