A Funny Thing Happened… Brian Paradis. A Funny Thing Happened…Emergency Department Enterprise.
26
A Funny Thing Happened… Brian Paradis
-
Upload
alfred-elliott -
Category
Documents
-
view
234 -
download
1
Transcript of A Funny Thing Happened… Brian Paradis. A Funny Thing Happened…Emergency Department Enterprise.

A Funny Thing Happened…
Brian Paradis

A Funny Thing Happened…Emergency Department Enterprise

“As is” State…
• Not fixable• Agency high (40-50% Some Campus’)• 6.3% (20,000 people) - Left w/o seeing Doctor• Patient Satisfaction – 20th%tile• Costs Climbing - 20-30%• Front door effectively closed (walk-in &
ambulance)

Approach Design Drivers
• Patient Driven• Core process based “Fundamentals” (3D’s)• Frontline Engagement• Physician – Partnered/Led• Team Work (Enterprise wide)• Fact based (Data Key)• RELENTLESS

ED Performance
• Red Slide
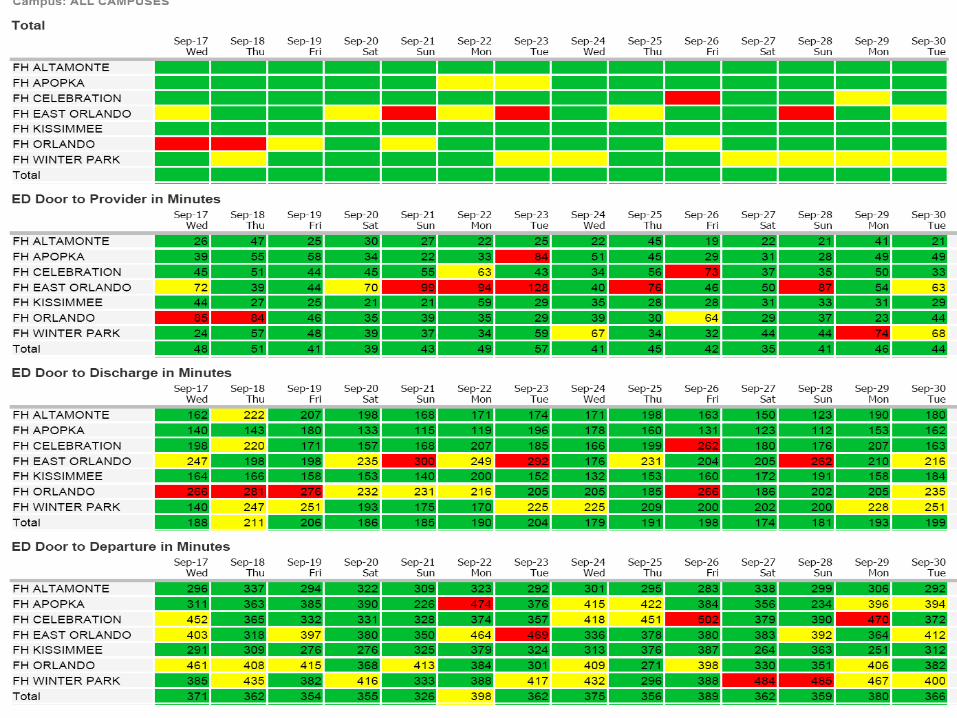
ED Performance

Performance Outcomes
As isAs is NowNow StatsStats
Door to DoctorDoor to Doctor 120 min120 min 50 min50 min
EMS Offload TimeEMS Offload Time 70 min70 min 8 min8 min
Cost per VisitCost per Visit $142$142 $132$132
Perceptions of SafetyPerceptions of Safety 41%41% 51%51%
AgencyAgency 40%40% 5%5%

ED Patient SatisfactionGallup Patient Satisfaction
Emergency Department: Overall Satisfaction Top Box
55%
52%52%50%
47%
49%
41%
47%
30%
35%
40%
45%
50%
55%
60%
Jan 2008 Feb 2008 Mar 2008 Apr 2008 May 2008 Jun 2008 Jul 2008 Aug 2008
99th 69%95th 63%90th 59%80th 55%70th 53%60th 51%50th 49%40th 48%30th 46%20th 44%10th 41%1st 35%
Percentile Comparison
80thpercentile

Our team is telling us something…Our team is telling us something…Are we listening?Are we listening?

Engagement Trend
3.5 GM52nd
3.72 GM65th
3.76 GM66th
3.9 GM64th
3.97 GM64th
4.0 GM65th
4.0 GM59th
50%
55%
60%
65%
70%
75%
2001 2002 2003 2004 2005 2006 2007
Gra
nd
Mean

2008 Gallup Engagement
Actual Goal
4.10 4.07
However . . . . .However . . . . .

Gallup EngagementClinical & Non-Clinical Comparison (2007)
Mean %tile E / D
Clinical 3.90 51% 3.7 : 1
Non-Clinical 4.10 66% 5.5 : 1

Safety Culture Survey Results
‘Overall perceptions of Safety’ (Positive Responses)
• Nursing 52%
• Physician 50%
(or 35th percentile)

Critical Survey Questions(% Positive Responses)
Nurses Physicians Avg.Management Support 58 64 64Non-punitive response 42 26 42Teamwork Across Units 50 56 56Hand-offs and transitions 41 41 48
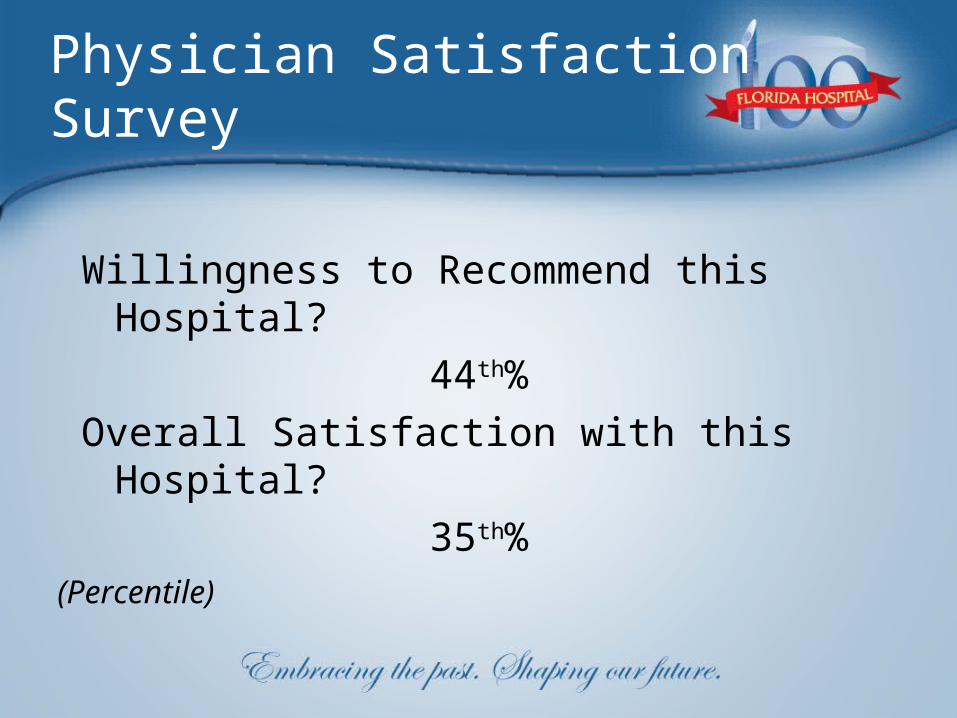
Physician Satisfaction Survey
Willingness to Recommend this Hospital?
44th%
Overall Satisfaction with this Hospital?
35th%
(Percentile)

Critical Survey Questions (%tile)
Actual
Efficiency of Hospital (Transfers, Turnarounds, etc) 18th
Promptly/Accurately respond to Physician Orders 24th
Ease of Scheduling/Performing IP Surgery 21st
Ability to manage admission process 23rd
(Percentile)

Our patients agree…Do we care?

HCAHPS Patient Experience Survey
(Definitely Yes)
Recommend this hospital to family & friends
Definitely Yes %tile
58% 23rd

Critical Survey Questions
(Always)
Actual1. Got bathroom help as soon as wanted 49%
2. Pain was well controlled 56%
3. Staff described side effect of Meds 32%
4. Nurses listened carefully to you 55%
5. Discharge information communicated and written
75%
6. Room clean and quiet 50%
Is it getting warm in here?. . .Or is it just me?

What is the Point?
• Our mission demands much better that our reality
• There is no place to hide (facts are the facts)• This is fixable, there is much hope• Patient Safety/Quality and Patient Experience
are ALMOST the same thing• Process, Process, Process . . .
Fundamentals, Fundamentals, Fundamentals

Approach Design Drivers
• Patient Driven• Core process based “Fundamentals” (3D’s)• Frontline Engagement• Physician – Partnered/Led• Team Work (Enterprise wide)• Fact based (Data Key)• RELENTLESS

ED Performance
• Red Slide

ED Performance

ED Patient SatisfactionGallup Patient Satisfaction
Emergency Department: Overall Satisfaction Top Box
55%
52%52%50%
47%
49%
41%
47%
30%
35%
40%
45%
50%
55%
60%
Jan 2008 Feb 2008 Mar 2008 Apr 2008 May 2008 Jun 2008 Jul 2008 Aug 2008
99th 69%95th 63%90th 59%80th 55%70th 53%60th 51%50th 49%40th 48%30th 46%20th 44%10th 41%1st 35%
Percentile Comparison
80thpercentile