A Fully Automatic Method to Extract the Heart Rate from ... training data. ... Manual or...
6
Abstract This work deals with non-invasive and non-intrusive measurements of the human facial vasculature from thermal IR to measure cardiovascular vital signs. A robust, fully automatic measurement system is developed to study infrared videos of 32 under three imaging scenarios. Vascular mapping, blood perfusion modeling, and wavelet analysis are used to calculate heart rate from 512 video frames in near real time. Multiple measurement locations are considered to analyze accuracy and sensitivity in a novel approach, revealing that the 60% of vessel segments in the forehead region are capable of producing 85% accuracy of measurement or better. 1. Introduction In this paper, we combine, build upon and improve the works of [4,5,7,8,13,14], to develop an accurate, sensitive and fully automatic method (see Fig. 1) to extract heart rate and the arterial pulse waveforms from thermal video at a distance of 3- 5 ft from subjects under three physiological states: normal, mild pain, and after mild exercise. This requires elements of thermal computer vision, fingerprint analysis, tracking, and scale-space filtering to render the final outputs. Applications of a fully automatic vital signs extraction method can be implemented in hospitals, for use in human interface devices, monitoring uncooperative subjects, intent detection, etc. Fig. 1: Overall automatic vital signs extraction process. Chekmenev, Farag and Essock [5,6] use wavelet-based techniques for extracting the pulse waveform, yielding average accuracies of 86.3% for heart rate calculation. That implementation requires subjects to be attached to a chin rest and the user must identify the region of interest. The dataset is also small, using only 8-10 subjects. The filtering technique, which isolates and returns results with a fixed set of scales only, in essence creates a complicated band-pass filter. Gault et al. [7] in 2010 expand on that work by adding semi- automatic manual vessel selection and a more accurate filtering technique, using wavelets and FFT analysis. They use more subjects than in [5,6], but only examine one arterial selection per subject. They report 93% accuracy. The works of Sun et al. [13,14] in 2005-06 use an adaptive Fourier-based signal filtering method with motion tracking which achieved an average accuracy of 88.5% across 34 trials. However, their work uses 2000-3000 video frames at 30 fps, whereas our proposed approach can extract the heart rate with 512 frames, and the pulse reconstruction in as few as 256. Recent work from MIT [16] proposes the concept of color magnification to determine the heart rate from color video by magnifying the color contributions from the red regions of the color spectrum, which reveal the pulsating (red) blood perfusion in the skin. The waveform output of this technology is able to determine the pulse rate from a strong amplitude signal in the time domain. Imaging in the visible spectrum is limited by the reflectance of skin in the visible spectrum and can suffer from changes in illumination conditions, giving thermal infrared an advantage in varying or absent lighting. This work fully automates the cardiovascular vital signs extraction process. The primary element missing from related work to accomplish this goal lies in automatic region of measurement (ROM) identification, which should be located on a blood vessel. The closest attempt is by Zhu et al. [18], whom have developed a method to automatically identify the supra orbital arteries on the forehead using template matching with training data. The forehead segmentation method used for this document comes from [8] and accurately segments the forehead region with a sensitivity of 96% without training. 1.1. Contributions and document organization This work improves on previous attempts by other authors mentioned previously in this section in these ways: 1. Manual or semi-automatic regional analysis is replaced A Fully Automatic Method to Extract the Heart Rate from Thermal Video Travis R. Gault University of Louisville Louisville, KY 40292 [email protected] Aly A. Farag University of Louisville Louisville, KY 40292 [email protected] 336 336 336 336
Transcript of A Fully Automatic Method to Extract the Heart Rate from ... training data. ... Manual or...

Abstract
This work deals with non-invasive and non-intrusive measurements of the human facial vasculature from thermal IR to measure cardiovascular vital signs. A robust, fully automatic measurement system is developed to study infrared videos of 32 under three imaging scenarios. Vascular mapping, blood perfusion modeling, and wavelet analysis are used to calculate heart rate from 512 video frames in near real time. Multiple measurement locations are considered to analyze accuracy and sensitivity in a novel approach, revealing that the 60% of vessel segments in the forehead region are capable of producing 85% accuracy of measurement or better.
1. Introduction In this paper, we combine, build upon and improve the
works of [4,5,7,8,13,14], to develop an accurate, sensitive and fully automatic method (see Fig. 1) to extract heart rate and the arterial pulse waveforms from thermal video at a distance of 3-5 ft from subjects under three physiological states: normal, mild pain, and after mild exercise. This requires elements of thermal computer vision, fingerprint analysis, tracking, and scale-space filtering to render the final outputs. Applications of a fully automatic vital signs extraction method can be implemented in hospitals, for use in human interface devices, monitoring uncooperative subjects, intent detection, etc.
Fig. 1: Overall automatic vital signs extraction process.
Chekmenev, Farag and Essock [5,6] use wavelet-based
techniques for extracting the pulse waveform, yielding average accuracies of 86.3% for heart rate calculation. That implementation requires subjects to be attached to a chin rest and the user must identify the region of interest. The dataset is also small, using only 8-10 subjects. The filtering technique, which isolates and returns results with a fixed set of scales only, in essence creates a complicated band-pass filter. Gault et al. [7] in 2010 expand on that work by adding semi-automatic manual vessel selection and a more accurate filtering technique, using wavelets and FFT analysis. They use more subjects than in [5,6], but only examine one arterial selection per subject. They report 93% accuracy.
The works of Sun et al. [13,14] in 2005-06 use an adaptive Fourier-based signal filtering method with motion tracking which achieved an average accuracy of 88.5% across 34 trials. However, their work uses 2000-3000 video frames at 30 fps, whereas our proposed approach can extract the heart rate with 512 frames, and the pulse reconstruction in as few as 256.
Recent work from MIT [16] proposes the concept of color magnification to determine the heart rate from color video by magnifying the color contributions from the red regions of the color spectrum, which reveal the pulsating (red) blood perfusion in the skin. The waveform output of this technology is able to determine the pulse rate from a strong amplitude signal in the time domain. Imaging in the visible spectrum is limited by the reflectance of skin in the visible spectrum and can suffer from changes in illumination conditions, giving thermal infrared an advantage in varying or absent lighting.
This work fully automates the cardiovascular vital signs extraction process. The primary element missing from related work to accomplish this goal lies in automatic region of measurement (ROM) identification, which should be located on a blood vessel. The closest attempt is by Zhu et al. [18], whom have developed a method to automatically identify the supra orbital arteries on the forehead using template matching with training data. The forehead segmentation method used for this document comes from [8] and accurately segments the forehead region with a sensitivity of 96% without training.
1.1. Contributions and document organization This work improves on previous attempts by other authors
mentioned previously in this section in these ways: 1. Manual or semi-automatic regional analysis is replaced
A Fully Automatic Method to Extract the Heart Rate from Thermal Video
Travis R. Gault
University of Louisville Louisville, KY 40292
Aly A. Farag University of Louisville Louisville, KY 40292
2013 IEEE Conference on Computer Vision and Pattern Recognition Workshops
978-0-7695-4990-3/13 $26.00 © 2013 IEEE
DOI 10.1109/CVPRW.2013.57
336
2013 IEEE Conference on Computer Vision and Pattern Recognition Workshops
978-0-7695-4990-3/13 $26.00 © 2013 IEEE
DOI 10.1109/CVPRW.2013.57
336
2013 IEEE Conference on Computer Vision and Pattern Recognition Workshops
978-0-7695-4990-3/13 $26.00 © 2013 IEEE
DOI 10.1109/CVPRW.2013.57
336
2013 IEEE Conference on Computer Vision and Pattern Recognition Workshops
978-0-7695-4990-3/13 $26.00 © 2013 IEEE
DOI 10.1109/CVPRW.2013.57
336
with full automation; 2. Combined wavelet/FFT filtering is replaced solely with
wavelet-based filtering and analysis; 3. Generic blood-perfusion modeling is incorporated to
improve accuracy and sensitivity; 4. Subjects are tested under normal conditions, while
eliciting pain, and during mild exercise; and 5. All vessel segments in the forehead region are
systematically analyzed via full automation. This document is divided as follows: Section 2 covers the
relevant steps needed to automate work by previous authors; Section 3 expands on blood-perfusion and the wavelet-based filtering to calculate the heart rate; Section 4 presents experimental results; and Section 5 concludes this paper.
2. Regions and Vessels of Interest Full automation requires isolating an overall region of
interest on the face, further isolating arterial locations likely to produce a strong signal, tracking, converting the data to a 1D temporal signal and filtering the signal. Automation is achieved in this work by splitting vascular maps into vessel segments, which focuses the measurements on anatomical features easily revealed from thermal IR. These steps are facilitated and aided by incorporating blood-perfusion enhancements.
Incorporating a blood-perfusion model such as from [15] (see their Eq. 2) helps to identify the heat contributions to the thermal video from blood—the primary means for heat transfer to the capillary bed from the body’s core. The model defines a pixel-wise transform from the thermal to the blood perfusion domain. Wu [15], Buddharaju [4], and others use blood perfusion data or approximations to improve facial recognition rates. Wu reports increases in facial recognition rates between 40-75% for time-lapsed sessions. Blood perfusion is applied to increase accuracy here in three areas: creating vascular maps, segmenting the forehead, and enhancing the raw thermal data. The latter increases in accuracy and sensitivity when compared to using unenhanced thermal data, which is discussed in Section 4. In this model, temperatures are set: Ta = Tb = 102F for the arteries/blood, Te = 70F for the environment, and Ts for the skin is from IR.
Vascular maps are created using the techniques from [4] and [15], resulting in binary lines one pixel wide over the approximate area of the underlying vasculature. The vessels on the forehead serve as the primary regions of interest. The vessels are anatomically interconnected and need to be divided into segments, achieved by splitting the vasculature at its branches. However, one challenge in analysis is that subjects have unique arrangements and numbers of vessel segments of varying size in each forehead region, such that they can be used in facial recognition applications as in [4].
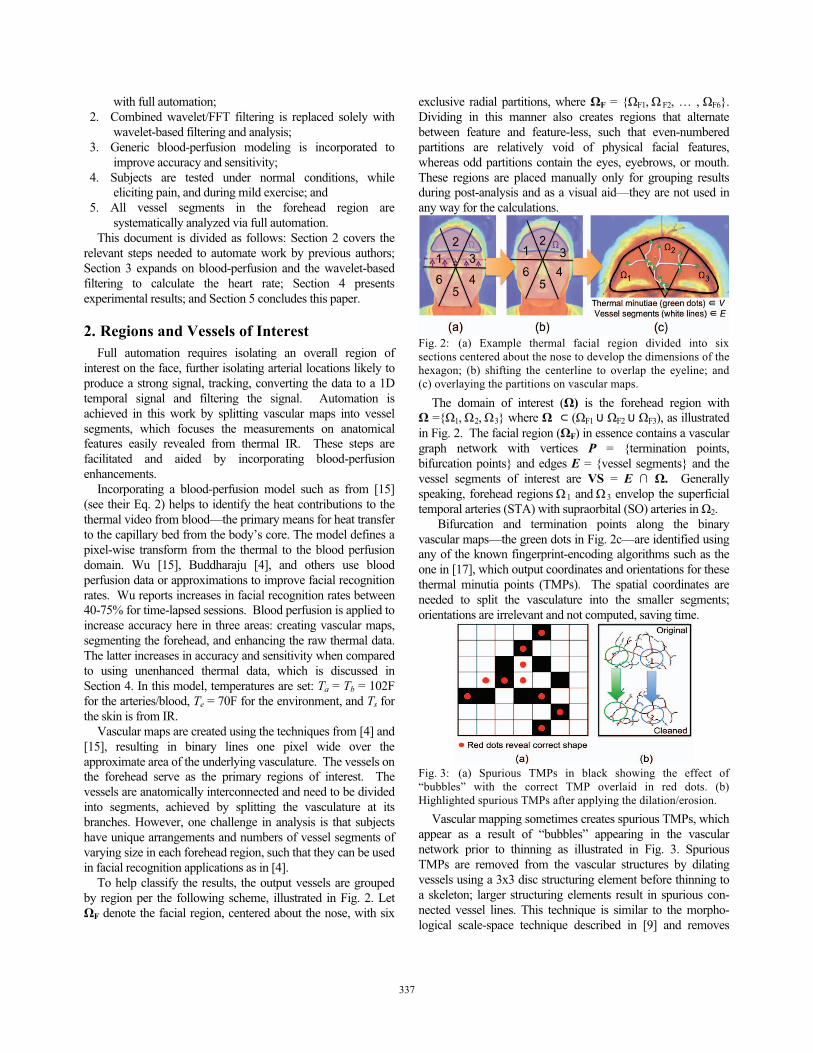
To help classify the results, the output vessels are grouped by region per the following scheme, illustrated in Fig. 2. Let ΩF denote the facial region, centered about the nose, with six
exclusive radial partitions, where ΩF = {ΩF1, Ω F2, … , ΩF6}. Dividing in this manner also creates regions that alternate between feature and feature-less, such that even-numbered partitions are relatively void of physical facial features, whereas odd partitions contain the eyes, eyebrows, or mouth. These regions are placed manually only for grouping results during post-analysis and as a visual aid—they are not used in any way for the calculations.
Fig. 2: (a) Example thermal facial region divided into six sections centered about the nose to develop the dimensions of the hexagon; (b) shifting the centerline to overlap the eyeline; and (c) overlaying the partitions on vascular maps.
The domain of interest (Ω) is the forehead region with Ω ={Ω1, Ω2, Ω3} where Ω ⊂ (ΩF1 ∪ ΩF2 ∪ ΩF3), as illustrated in Fig. 2. The facial region (ΩF) in essence contains a vascular graph network with vertices P = {termination points, bifurcation points} and edges E = {vessel segments} and the vessel segments of interest are VS = E ∩ Ω. Generally speaking, forehead regions Ω1 and Ω3 envelop the superficial temporal arteries (STA) with supraorbital (SO) arteries in Ω2.
Bifurcation and termination points along the binary vascular maps—the green dots in Fig. 2c—are identified using any of the known fingerprint-encoding algorithms such as the one in [17], which output coordinates and orientations for these thermal minutia points (TMPs). The spatial coordinates are needed to split the vasculature into the smaller segments; orientations are irrelevant and not computed, saving time.
Fig. 3: (a) Spurious TMPs in black showing the effect of “bubbles” with the correct TMP overlaid in red dots. (b) Highlighted spurious TMPs after applying the dilation/erosion.
Vascular mapping sometimes creates spurious TMPs, which appear as a result of “bubbles” appearing in the vascular network prior to thinning as illustrated in Fig. 3. Spurious TMPs are removed from the vascular structures by dilating vessels using a 3x3 disc structuring element before thinning to a skeleton; larger structuring elements result in spurious con-nected vessel lines. This technique is similar to the morpho-logical scale-space technique described in [9] and removes
337337337337

most of these spurious TMPs as seen in Fig. 3. The advantage to this method is the shape of the vascular structures removes the TMPs instead of just Euclidean distance as in [17].
2.1. Automatic vessel segment selection Vessels are split into segments and labeled by removing the
bifurcation points from the vascular maps. Splitting the vessels into smaller segments makes the segments selectable via their physical and/or thermal characteristics, or directly selected by label number; classification criteria are application-specific. Segments are analyzed with the classification criteria that some part of the vessel segment must exist inside the forehead region and have minimum length of 5 pixels. Candidates not meeting these criteria are discarded until all vessel segments are consi-dered. Successful automatic vessel selection depends on the quality of the vascular maps, how well the TMPs are identified, and the selection criteria. Errors in these steps result in useful segments being discarded. Fig. 5 illustrates two cases.
Fig. 4: Proposed algorithm for automatic vessel selection.
Fig. 5: Green vessel segments meeting classification criteria; adjacent white label numbers. Left: Good selection of forehead vessel candidates. Right: Candidates with un-identified segments in Ω1 and Ω2 and two non-segments, i.e.15 & 16.
2.2. Tracking Tracking the vessel segments creates the 1D time-domain
signals. Since subject movements are small, a simple tracking method can be used to save execution time—using the coord-inates of the binary vessel segments in the forehead region. The iterative closest point (ICP) tracking method [3] is used for this work. ICP is much faster than the tracking approach in [7], requiring only 1-2 seconds to track across 512 frames of vascular maps derived from thermal video. ICP also produces heart rate results that are more accurate than the error-minimization approach in [7]. For the experimental portion of this work, ICP is used exclusively to facilitate comparing
different filtering approaches independent of tracking methods.
3. Wavelet-based Heart Rate Analysis The arterial pulse signals are created from sampling the
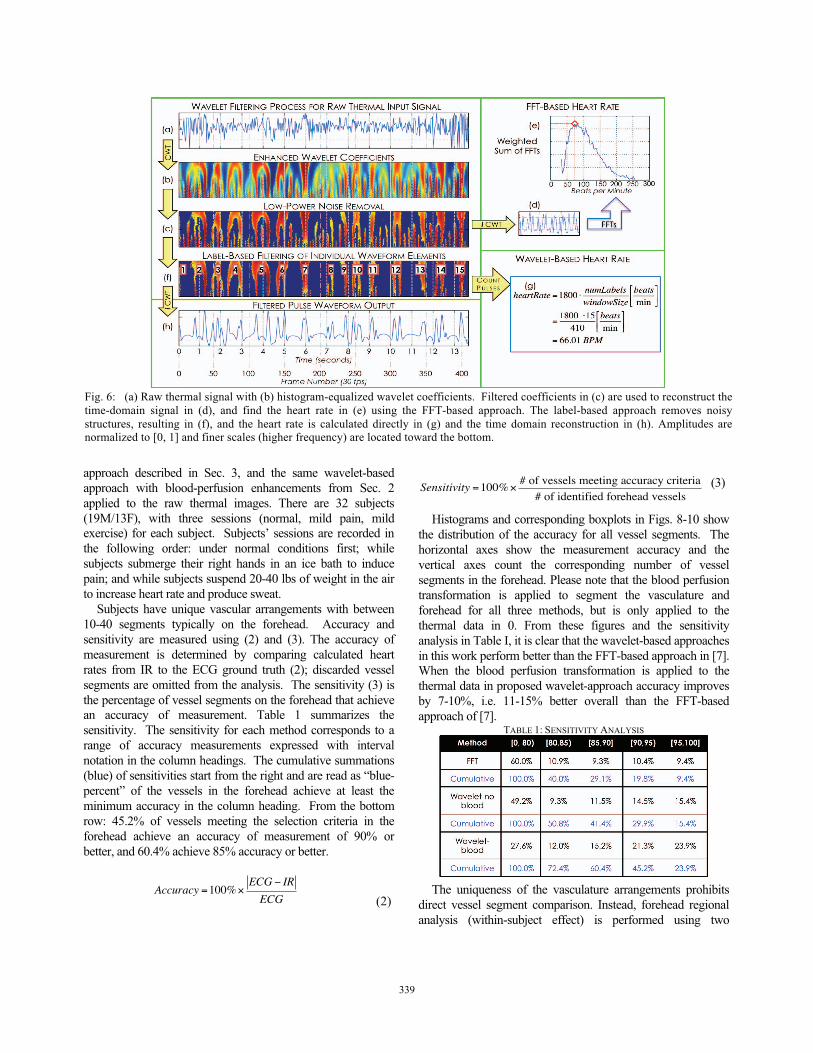
thermal values along the tracked vessel segments. Arterial pulse signals have high-energy components that contain high- and low-frequency elements, where higher frequency components coincide to peaks of the signal in time domain. These elements manifest in coarse (low freq.) and fine scales (high freq.) and must be considered in tandem [10]. Noise from the 1D signal is high frequency, low power. The continuous wavelet transform (CWT) and its inverse (ICWT) are used to filter unwanted signal elements using a Mexican hat mother wavelet [5,6,7,10]. In practice, the mother wavelet is discretized to facilitate this analysis, but is done differently than with the traditional discrete wavelet transform. In the wavelet coefficients, higher frequencies appear in the finer scales, whereas lower frequencies appear in coarser scales [10,11]. These low-energy components are reliably discarded by thresholding the enhanced coefficients (Fig. 6c).
The first step before filtering is to enhance the wavelet coefficients (Wf) using histogram equalization, so that scale-space structures are more apparent. These enhanced coefficients (WfH) are used to generate a binary mask via thresholding to reveal the scale-space structures, some of which will be discarded. The mask can be applied to either the original or enhanced set of the wavelet coefficients, depending on the needs of the application. Remaining non-zero enhanced coefficients (greater than zero) create a binary mask revealing the remaining scale-space structures, which are then labeled numerically. The characteristics of these structures are analyzed such that those represented in the coarse and fine scales (i.e. the pulse waveforms) are retained and those that only manifest themselves in the finer scales (i.e. noise) are discarded for a given position in time as in Fig. 6c. This result is illustrated in Fig. 6f.
heartRate
beats
min
⎡
⎣ ⎢ ⎤
⎦ ⎥ = f sampling
frames
min
⎡
⎣ ⎢ ⎤
⎦ ⎥ ⋅numLabels
windowSize
beats
frames
⎡
⎣ ⎢ ⎤
⎦ ⎥
(1)
The heart rate for the temporal window is calculated from the filtered wavelet coefficients as in Fig. 6fg by forming the ratio in (1) of the number of remaining labeled heartbeat structures (numLabels) in the window to its size (windowSize) in terms of number of frames, where fsampling = 30fps = 1800 frames/min. By omitting FFTs in [7], equation (1) saves a computational complexity of size(vessel segment) * O(N log N), where N = 512 frames.
4. Experiment and Analysis This experiment compares the heart rate from every vessel
segment in the forehead (Sec. 2) to the ECG ground truth for that subject. Three filtering methods are explored: the CWT/FFT-based approach from [7], the wavelet-based
338338338338
approach described in Sec. 3, and the same wavelet-based approach with blood-perfusion enhancements from Sec. 2 applied to the raw thermal images. There are 32 subjects (19M/13F), with three sessions (normal, mild pain, mild exercise) for each subject. Subjects’ sessions are recorded in the following order: under normal conditions first; while subjects submerge their right hands in an ice bath to induce pain; and while subjects suspend 20-40 lbs of weight in the air to increase heart rate and produce sweat.
Subjects have unique vascular arrangements with between 10-40 segments typically on the forehead. Accuracy and sensitivity are measured using (2) and (3). The accuracy of measurement is determined by comparing calculated heart rates from IR to the ECG ground truth (2); discarded vessel segments are omitted from the analysis. The sensitivity (3) is the percentage of vessel segments on the forehead that achieve an accuracy of measurement. Table 1 summarizes the sensitivity. The sensitivity for each method corresponds to a range of accuracy measurements expressed with interval notation in the column headings. The cumulative summations (blue) of sensitivities start from the right and are read as “blue-percent” of the vessels in the forehead achieve at least the minimum accuracy in the column heading. From the bottom row: 45.2% of vessels meeting the selection criteria in the forehead achieve an accuracy of measurement of 90% or better, and 60.4% achieve 85% accuracy or better.
Accuracy =100%×
ECG − IR
ECG (2)
Sensitivity =100%×# of vessels meeting accuracy criteria
# of identified forehead vessels (3)
Histograms and corresponding boxplots in Figs. 8-10 show the distribution of the accuracy for all vessel segments. The horizontal axes show the measurement accuracy and the vertical axes count the corresponding number of vessel segments in the forehead. Please note that the blood perfusion transformation is applied to segment the vasculature and forehead for all three methods, but is only applied to the thermal data in 0. From these figures and the sensitivity analysis in Table I, it is clear that the wavelet-based approaches in this work perform better than the FFT-based approach in [7]. When the blood perfusion transformation is applied to the thermal data in proposed wavelet-approach accuracy improves by 7-10%, i.e. 11-15% better overall than the FFT-based approach of [7].
TABLE 1: SENSITIVITY ANALYSIS
The uniqueness of the vasculature arrangements prohibits direct vessel segment comparison. Instead, forehead regional analysis (within-subject effect) is performed using two
Fig. 6: (a) Raw thermal signal with (b) histogram-equalized wavelet coefficients. Filtered coefficients in (c) are used to reconstruct thetime-domain signal in (d), and find the heart rate in (e) using the FFT-based approach. The label-based approach removes noisystructures, resulting in (f), and the heart rate is calculated directly in (g) and the time domain reconstruction in (h). Amplitudes are normalized to [0, 1] and finer scales (higher frequency) are located toward the bottom.
339339339339
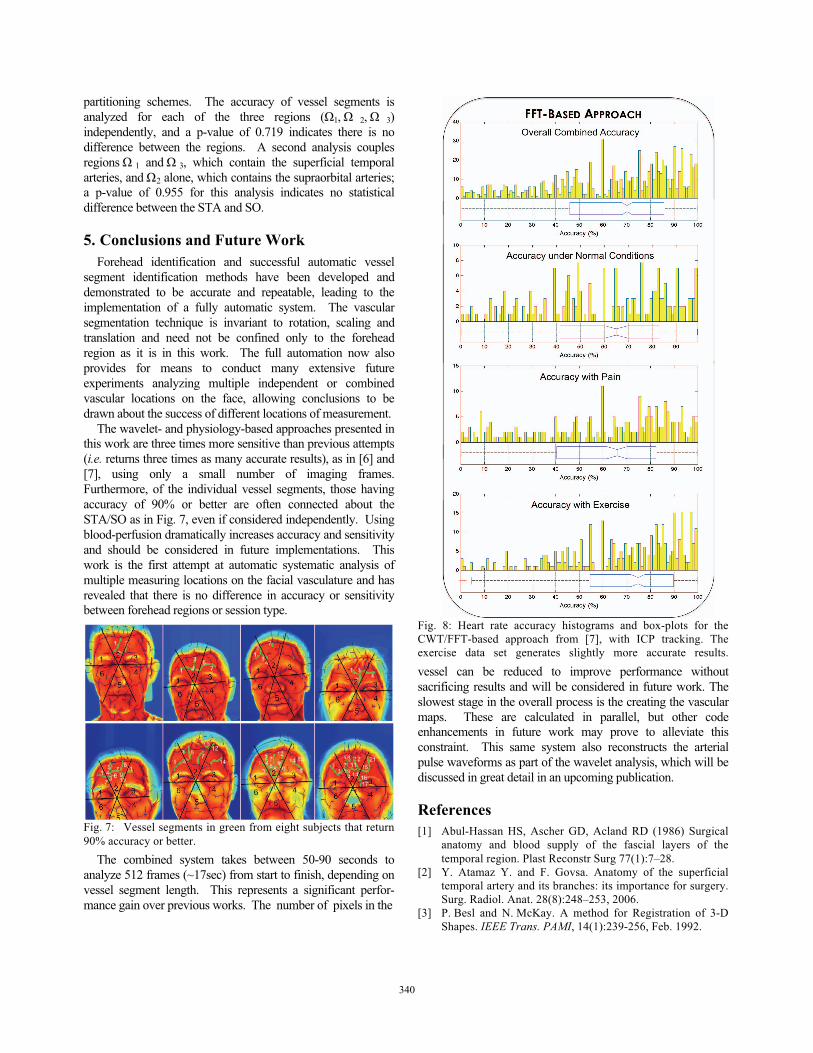
partitioning schemes. The accuracy of vessel segments is analyzed for each of the three regions (Ω1, Ω 2, Ω 3) independently, and a p-value of 0.719 indicates there is no difference between the regions. A second analysis couples regions Ω 1 and Ω 3, which contain the superficial temporal arteries, and Ω2 alone, which contains the supraorbital arteries; a p-value of 0.955 for this analysis indicates no statistical difference between the STA and SO.
5. Conclusions and Future Work Forehead identification and successful automatic vessel
segment identification methods have been developed and demonstrated to be accurate and repeatable, leading to the implementation of a fully automatic system. The vascular segmentation technique is invariant to rotation, scaling and translation and need not be confined only to the forehead region as it is in this work. The full automation now also provides for means to conduct many extensive future experiments analyzing multiple independent or combined vascular locations on the face, allowing conclusions to be drawn about the success of different locations of measurement.
The wavelet- and physiology-based approaches presented in this work are three times more sensitive than previous attempts (i.e. returns three times as many accurate results), as in [6] and [7], using only a small number of imaging frames. Furthermore, of the individual vessel segments, those having accuracy of 90% or better are often connected about the STA/SO as in Fig. 7, even if considered independently. Using blood-perfusion dramatically increases accuracy and sensitivity and should be considered in future implementations. This work is the first attempt at automatic systematic analysis of multiple measuring locations on the facial vasculature and has revealed that there is no difference in accuracy or sensitivity between forehead regions or session type.
Fig. 7: Vessel segments in green from eight subjects that return 90% accuracy or better.
The combined system takes between 50-90 seconds to analyze 512 frames (~17sec) from start to finish, depending on vessel segment length. This represents a significant perfor-mance gain over previous works. The number of pixels in the
Fig. 8: Heart rate accuracy histograms and box-plots for the CWT/FFT-based approach from [7], with ICP tracking. The exercise data set generates slightly more accurate results.
vessel can be reduced to improve performance without sacrificing results and will be considered in future work. The slowest stage in the overall process is the creating the vascular maps. These are calculated in parallel, but other code enhancements in future work may prove to alleviate this constraint. This same system also reconstructs the arterial pulse waveforms as part of the wavelet analysis, which will be discussed in great detail in an upcoming publication.
References [1] Abul-Hassan HS, Ascher GD, Acland RD (1986) Surgical
anatomy and blood supply of the fascial layers of the temporal region. Plast Reconstr Surg 77(1):7–28.
[2] Y. Atamaz Y. and F. Govsa. Anatomy of the superficial temporal artery and its branches: its importance for surgery. Surg. Radiol. Anat. 28(8):248–253, 2006.
[3] P. Besl and N. McKay. A method for Registration of 3-D Shapes. IEEE Trans. PAMI, 14(1):239-256, Feb. 1992.
340340340340

Fig. 9: Heart rate accuracy histograms and box-plots for the CWT-based approach (Sec. 3), without blood-perfusion. [4] P. Buddharaju, et al. Physiology-Based Face Recognition in the
Thermal Infrared Spectrum. TPAMI. 29(9):613-26, 2007. [5] S. Chekmenev, A. Farag, and E. Essock. Multi-resolution
Approach for Non-Contact Measurements of Arterial Pulse using Thermal Imaging. Proc. CVPR. 2006.
[6] S. Chekmenev, A. Farag, and E. Essock. Thermal Imaging of the Superficial Temporal Artery: An Arterial Pulse Recovery Model. Proc. CVPR. 2007.
[7] T. Gault, N. Blumenthal, A. Farag and T. Starr. "Extraction of the Superficial Facial Vasculature, Vital Signs Waveforms and Rates Using Thermal Imaging," Proc. IEEE OTCBVS’10. San Francisco, CA. June 2010.
[8] T. Gault and A. Farag. “Computationally Light Forehead Segmentation from Thermal Images.” Proc. ICIP’12 Orlando, FL. Oct. 2012.
[9] Jackway, P. and M. Deriche (1996). Scale-Space Properties of the Multiscale Morphological Dilation-Erosion. IEEE TPAMI. 18(1); 38-51. Jan 1996.
[10] S. Mallat. A theory for multiresolution signal decom-position: The wavelet representation. IEEE Trans. Pattern Anal. Machine Intell., 11(7):674–693, 1989.
Fig. 10: Accuracy histograms and box-plots for the CWT-based approach with blood-perfusion applied to the thermal images. Normal and exercise conditions are more accurate than pain; all are more accurate than the same tests without blood-perfusion.
[11] A. Ramakrishnan and S. Saha (1997). ECG Coding by Wavelet-Based Linear Prediction. IEEE Trans. Biomed. Engr. 44(12): 1253-1261. Dec. 1997.
[12] J. Steketee. Spectral Emissivity of Skin and Pericardium. Phys. Med. Biol., 18(10):686-94, 1973.
[13] N. Sun, M. Garbey, A. Merla, and I. Pavlidis. Imaging the cardiovascular pulse. Proc. CVPR. 2005.
[14] N. Sun and I. Pavlidis. Counting Heartbeats at a Distance. Conf Proc IEEE Eng Med Biol Soc. 2006;1:228-31.
[15] S. Wu, W. Lin, and S. Xie. Skin Heat Transfer Model of Facial Thermograms and its Application in Face Recognition. Pattern Recognition. 41(2008): 2718-729.
[16] H.-Y. Wu et al. Eulerian Video Magnification for Revealing Subtle Changes in the World. SIGGRAPH 2012.S.
[17] Yang and I. Verbauwhede. A Secure Fingerprint Matching Technique. WBMA. Nov. 2003
[18] Z. Zhu, P. Tsiamyrztis, I. Pavlidis. “The Segmentation of the Supra orbital Vessels in Thermal Imagery.” IEEE 5th Intl. Conf. AVSS’08. pgs: 237-244. Dec. 2008.
341341341341