A Framework for the Analysis of the Kuznets- Kaldor … · A Framework for the Analysis of the...
90
1 A Framework for the Analysis of the Kuznets- Kaldor-Puzzle by Denis Stijepic (Corresponding Author) and Helmut Wagner University of Hagen (Department of Economics), Universitaetsstr. 41, D-58084 Hagen, Germany, Phone: +49(0)2331/987-2640, Fax: +49(0)2331/987-391 E-mail: [email protected] , [email protected] This version: March 2011 Abstract The Kuznets-Kaldor stylized facts are one of the most striking empirical observations about the development process in the industrialized countries: While massive factor reallocation across technologically distinct sectors takes place, the aggregate ratios of the economy behave in a quite stable manner. This implies that cross-technology factor reallocation has a relatively weak impact on the aggregates, which is a puzzle from a theoretical point of view. I provide a model that can explain the Kuznets-Kaldor-puzzle by independent preferences and technologies. Furthermore, I show by empirical evidence that this model is in line with 55% of structural change. Keywords: Kaldor facts, Kuznets facts, structural change, factor reallocation, sectors, balanced growth, unbalanced growth
Transcript of A Framework for the Analysis of the Kuznets- Kaldor … · A Framework for the Analysis of the...

1
A Framework for the Analysis of the Kuznets-Kaldor-Puzzle
by Denis Stijepic (Corresponding Author) and Helmut Wagner
University of Hagen (Department of Economics), Universitaetsstr. 41, D-58084
Hagen, Germany, Phone: +49(0)2331/987-2640, Fax: +49(0)2331/987-391
E-mail: [email protected], [email protected]
This version: March 2011
Abstract
The Kuznets-Kaldor stylized facts are one of the most striking empirical observations
about the development process in the industrialized countries: While massive factor
reallocation across technologically distinct sectors takes place, the aggregate ratios of the
economy behave in a quite stable manner. This implies that cross-technology factor
reallocation has a relatively weak impact on the aggregates, which is a puzzle from a
theoretical point of view.
I provide a model that can explain the Kuznets-Kaldor-puzzle by independent preferences
and technologies. Furthermore, I show by empirical evidence that this model is in line with
55% of structural change.
Keywords: Kaldor facts, Kuznets facts, structural change, factor reallocation, sectors,
balanced growth, unbalanced growth

2
1. Introduction As shown by Kongsamut et al. (1997, 2001), the development process of the
industrialized countries during the last century satisfies two types of stylized facts:
“Kuznets facts” and “Kaldor facts”.
Generally speaking, Kuznets facts state that massive structural change takes place
during the development process.1 Especially, in the early stages of economic
development factors are primarily reallocated from the agricultural sector to the
industrial sector and in later stages of development factors are primarily reallocated
from the manufacturing sector to the services sector. (It has also been shown, that
structural change takes place at more disaggregated level.)
On the other hand, the Kaldor facts state that some key aggregate measures of the
economy are quite stable during the development process; especially, the aggregate
capital-to-output ratio and the aggregate income shares of capital and labor are
quite stable whereas the aggregate capital-to-labor ratio increases (at a fairly
constant rate) in the industrialized countries.2 That is, the growth process seems to
be “balanced” at the aggregate level.
As discussed by Kongsamut et al. (2001) and Acemoglu and Guerrieri (2008), the
coexistence of Kuznets and Kaldor facts seems to be a puzzle, since strong factor-
reallocations across sectors in general imply that Kaldor-facts are not satisfied
1 Papers that provide empirical evidence for the massive labor reallocation across sectors during the
growth process are e.g. Kuznets (1976), Maddison (1980), Kongsamut et al. (1997, 2001) and Ngai
and Pissarides (2004). Kongsamut et al. (1997, 2001) formulate the following stylized facts of
structural change for the last hundred years: 1.) the employment share of agriculture decreases
during the growth process; 2.) the employment share of services increases during the growth
process; 3.) the employment share of manufacturing is constant. Ngai and Pissarides (2007) note
that the development of the manufacturing employment-share can be regarded as “hump-shaped” in
the longer run. 2 In detail, Kaldor’s stylized facts state that the growth rate of output per capita, the real rate of
return on capital, the capital-to-output ratio and the income distribution (between labor and capital)
are nearly constant in the long run; capital-to-labor ratio increases in the long run. It is widely
accepted that these facts are an accurate shorthand description of the long run growth process (at the
aggregate level) in industrialized countries. A discussion of these facts can be found in the paper by
Kongsamut et al. (1997, 2001) and in the books by Maußner and Klump (1996) and Barro and Sala-
i-Martin (2004).

3
(“unbalanced” growth of aggregates). Therefore, I name the empirically observable
coexistence of Kuznets and Kaldor facts “Kuznets-Kaldor-puzzle”.
The literature, which deals with the Kuznets-Kaldor-Puzzle more or less explicitly,
includes Kongsamut et al. (1997, 2001), Meckl (2002), Foellmi and Zweimueller
(2008), Ngai and Pissarides (2007), Acemoglu and Guerrieri (2008) and Boppart
(2010).
We learn from this literature, in general, that the solution of the Kuznets-Kaldor-
Puzzle in neoclassical growth frameworks requires the use of some knife-edge
conditions. In fact, all papers used very severe restrictions to solve the Kuznets-
Kaldor-Puzzle: all of them omitted some structural change determinants (which is
the same as imposing some implicit knife-edge conditions) and/or imposed some
explicit knife-edge parameter restrictions (like Kongsamut et al. (1997, 2001) and
Meckl (2002)). Such (implicit and explicit) knife-edge conditions are severe
restrictions, if their validity is not proven by empirical and/or theoretical reasoning.
(For a discussion of structural change determinants see section 2.2.)
I include all key structural change determinants into analysis and then try to
analyze whether the knife-edge conditions, which are required for the solution of
the Kuznets-Kaldor-Puzzle, are empirically reasonable. Furthermore, I point to a
possible theoretical micro-foundation of these knife-edge conditions.
The starting point of my analysis is the following fact: The key challenge to
solving the Kuznets-Kaldor-Puzzle is already known since Baumol (1967): If
production technology differs across sectors, the reallocation of factors across
sectors causes unbalanced growth, i.e. Kaldor-facts are not satisfied.
Then, I approach as follows:
First, I show that Kaldor facts can be satisfied despite the fact that factors are
reallocated across technologically distinct sectors. In this sense my results postulate

4
that structural change across technology can be irrelevant regarding the
development of aggregate ratios. I name this type of factor reallocation “neutral
(cross-capital-intensity) structural change”. Of course, the existence of neutral
structural change requires some knife-edge conditions (which will be analyzed
below). Previously, Ngai and Pissarides (2007) have shown that neutral structural
change can arise when all sectors have the same capital-intensity. However,
Acemoglu and Guerrieri (2008) have shown that their results do not hold if capital-
intensities differ across sectors, i.e. they show that in this case growth is in general
unbalanced. In some sense, my result contradicts Acemoglu and Guerrieri (2008),
since neutral structural change arises despite the fact that capital-intensities differ
across sectors in my model. I am able to obtain my results, since, in contrast to
Acemoglu and Guerrieri (2008), I assume a utility function that has non-unitary
price elasticity of demand (i.e. each good has its own specific price elasticity) and
since I assume that at least one of the three sectors uses two technologies. (As I
will discuss in my essay, the latter assumption is consistent with empirical
evidence, which postulates that e.g. the services sector is quite technologically
heterogeneous.) Furthermore, in contrast to Acemoglu and Guerrieri (2008), I
model sectors that feature non-constant output-elasticities of inputs.
Second, I study the empirically observable patterns of structural change and
analyze whether they were neutral or non-neutral. In this sense, I analyze implicitly
whether the knife-edge conditions, which ensure the satisfaction of the Kuznets-
Kaldor-facts in my model, are given in reality. I develop an index of neutrality of
structural change and show with the data for the US between 1948 and 1987 that
about 55% of structural change was neutral structural change. Hence, neutrality of
structural change seems to be a relatively large explanatory variable regarding the
Kuznets-Kaldor-puzzle. I argue as well that this result applies to the most of the

5
previous literature, implying that the previous literature can explain (maximally)
55% of structural change.
Third, I argue that low (no) correlation between preference parameters and
technology parameters can explain the prevalence (existence) of neutral structural
change in reality (my model).3 I also argue that the assumption of uncorrelated
preferences and technologies may be theoretically reasonable in long run growth
models. In this sense, the independency between preferences and technologies can
be a theoretical foundation of the knife-edge conditions that are necessary for the
solution of the Kuznets-Kaldor-Puzzle.
In the next section (section 2) I provide some evidence on sectoral structures that
are observed in reality, in order to provide an empirical basis for my discussion and
model assumptions. Then, in section 3, I provide a PBGP-model of structural
change in order to show the existence of neutral structural change. (There I also
generalize some of the model results in Proposition 4.) Section 4 is dedicated to the
empirical analysis, where among others I develop an index of neutrality of
structural change and analyze the cross-capital-intensity structural change patterns
in detail. In section 5 I discuss the assumption of low correlation between
technology and preferences. Finally, in section 6 I provide some concluding
remarks and hints for further research.
3 It should be noted here that previously it has been mentioned by Foellmi and Zweimueller (2008)
that some type of independency between technology and preferences may be useful for generating
aggregate balanced growth. However, this topic has not been studied further by them.
6
2. Stylized facts of sectoral structures
2.1 Stylized facts regarding cross-sector-heterogeneity in
production-technology
Empirical evidence implies the following stylized facts of sectoral production
functions:
1. TFP-growth differs across sectors. Empirical evidence implies that TFP-growth
rates differ strongly across sectors. For example, Bernard and Jones (1996) (pp.
1221f.), who analyze sectoral TFP-growth in 14 OECD countries between 1970
and 1987, report that e.g. the average TFP-growth rate in agriculture (3%) was
more than three times as high as in services (0.8%). Similar results are obtained by
Baumol et al. (1985), who report the TFP-growth-rates of US-sectors between
1947 and 1976.
2. Capital intensity differs across sectors. Empirical evidence implies that factor
income shares differ strongly across sectors (hence, capital intensities differ
strongly across sectors as well4). For example, Kongsamut, Rebelo and Xie (1997)
provide evidence for the USA for the period 1959-1994. Their data implies that, for
example, the labor income share was relatively high in manufacturing and
construction (around 70%) in this period. At the same time, e.g. the labor income
share in agriculture, finance, insurance and real estate was relatively low (around
20%). Similar results for the USA are obtained by Close and Shulenburger (1971)
for the period 1948-1965 and by Acemoglu and Guerrieri (2008) for the period
1987-2004. Some new evidence for the USA (presented by Valentinyi and
Herrendorf (2008)) supports these results as well. Gollin (2002) (p. 464) analyzes
4 If labor income shares (or: output elasticities of labor) differ across sectors, it follows that capital
intensities differ across sectors as well, since in optimum capital intensity is determined by factor
prices and by output elasticities of capital and labor. We will see later that this is true within my
model.

7
the data from 41 countries reported in the U.N. National Statistics. He confirms
that factor income shares vary widely across sectors.
A model that analyzes structural change across sectors should be consistent with
these “stylized” facts of sectoral production functions. This is especially important,
since these stylized facts have an impact on structural change (and hence on
aggregate balanced growth), as we will see now.
2.2 Structural change determinants
There a four main determinants of structural change. I recapitulate them here, since
they are important for the following discussion:
1. Non-homothetic preferences across sectors – relevance for structural change
analyzed empirically and theoretically, e.g., by Kongsamut et al. (1997, 2001).
2. Differences in TFP-growth across sectors – empirical relevance for structural
change shown, e.g., by Baumol (1985); theoretical relevance for structural change
shown, e.g., by Ngai and Pissarides (2007).
3. Differences in capital intensities across sectors – relevance for structural change
analyzed empirically and theoretically, e.g., by Acemoglu and Guerrieri (2008).
4. Shifts in intermediates production across sectors – relevance for structural
change analyzed empirically and theoretically, e.g., by Fixler and Siegel (1998).
So I can conclude that all these determinants influence the structural change
patterns. Since the aggregate economy is the weighted average of its sectors, the
aggregate behavior depends on the structural change patterns. That is, all four
structural change determinants influence the behavior of the aggregate economy.

8
Hence, only if I include all four structural change determinants into a model, I can
adequately analyze whether balanced growth with respect to aggregates can coexist
with structural change.
3. Model of neutral cross-capital-intensity structural change
3.1 Model assumptions
3.1.1 Production
I assume an economy where two technologies exist (the model could be modified
such that it includes more technologies; the key results would be the same). The
technologies differ by capital intensity (i.e. output elasticities of inputs differ across
technologies) and by total factor productivity (TFP) growth. TFP-growth rates are
constant and exogenously given. Goods ni ,...1= are produced in the economy.
Goods mi ,...1= are produced by using technology 1 and goods nmi ,...1+= are
produced by using technology 2 ( )mn > . I assume that three inputs are used for
production: capital (K), labor (L) and intermediates (Z). All capital, labor and
intermediates are used in the production of goods ni ,...1= . The amount of
available labor grows at constant rate ( Lg ). Since I want to model TFP-growth, I
assume Hicks-neutral technological progress. It is well known that the existence of
a balanced growth path in standard balanced growth frameworks requires the
assumption of Cobb-Douglas production function(s) when technological progress
is Hicks-neutral. (Later, we will see that the aggregate production function
“inherits” the attributes of sectoral production functions along the PBGP, i.e. the
aggregate production function is of type Cobb-Douglas.) These assumptions imply
the following production functions:

9
(1) miZzKkLlAY iiii ,...1,)()()( == γβα
where .;0,,;1 constgA
AA ==>=++
&
γβαγβα
(2) nmiZzKkLlBY i
v
iii ,...1,)()()( +== µχ
where .;0,,;1 constgB
BB ==>=++
&
µνχµνχ
(3) ∑∑∑===
===n
i
i
n
i
i
n
i
i zkl111
1;1;1
(4) .constgL
LL =≡
&
where iY denotes the output of good i; ii kl , and iz denote respectively the fraction
of labor, capital and intermediates devoted to production of good i; K is the
aggregate capital; L aggregate labor; Z aggregate intermediate index. Note that I
omit here the time index. Furthermore, note that the index i denotes not sectors but
a good or a group of similar goods. I will define sectors later.
Of course, it is not “realistic” that there are only two technologies and that some
goods are produced by identical production functions. However, every model
simplifies to some extent and it is only important that the simplification does not
affect the meaningfulness of the results. My assumption is only a “technical
assumption”, which is necessary to make my argumentation as simple as possible.
My key arguments (namely the existence of neutral structural change) could also
be derived in a framework where each good is produced by a unique production
function. (I show this fact in Proposition 4.) However, it would be much more

10
difficult to formulate the independency assumptions (which are formulated in the
next subsection). Instead of the simple restrictions, which I use in the next
subsection, I would have to derive complex restrictions which would not be such
transparent. Anyway, later my focus will be on the analysis of only three sectors
(which are aggregates of the products i=1,…n); thus, two technologies are
sufficient to generate technological heterogeneity between these three sectors. In
this sense, I have introduced technological diversity into my framework in the
simplest manner (by assuming that there are only two technologies).
It may be easier to accommodate with my assumption of only two technologies by
imagining that an economist divides the whole set of products of an economy into
two groups (a technologically progressive and a technologically backward) and
estimates the average production function for the two groups. Such approaches are
prominent in the literature: e.g. Baumol et al. (1985) and Acemoglu and Guerrieri
(2008) approach in similar way in the empirical parts of their argumentation.
Furthermore, note that much of the new literature on the Kuznets-Kaldor-puzzle
assume very similar sectoral production functions (e.g. Kongsamut et al. (2001)
and Ngai and Pissarides (2007)) or assume even identical sectoral production
functions (e.g. Foellmi and Zweimueller (2008)). Hence, my assumption of only
two (completely distinct) technologies is an improvement in comparison to some
previous literature. Note that the empirical study of my paper (section 4) uses the
more general assumption, i.e. each good is produced by a unique production
function.
I assume that all goods can be consumed and used as intermediates. Furthermore, I
assume that only the good m can be used as capital. (Note, that the model could be
modified such that more than one good is used as capital e.g. in the manner of Ngai
and Pissarides (2007).) This assumption implies:

11
(5) mihCY iii ≠∀+= ,
(6) KKhCY mmm δ+++= &
where iC denotes consumption of good i; δ denotes the constant depreciation rate
of capital; ih is the amount of good i that is used as intermediate input.
I assume that the intermediate-inputs-index Z is a Cobb-Douglas function of ih ’s
which is necessary for the existence of a PBGP (see Ngai and Pissarides 2007):
(7) ∏=
=n
i
iihZ
1
ε
where ∑=
=∀>n
i
ii i1
1;,0 εε
3.1.2 Utility function
I assume the following utility function, which is quite similar to the utility function
used by Kongsamut et al. (1997, 2001):
(8) ∫∞
−=0
1 ),...( dteCCuUt
n
ρ , 0>ρ
where
(9)
−= ∏
=
n
i
iiniCCCu
1
1 )(ln),...(ωθ
(10) ∑=
=m
i
i
1
0θ

12
(11) ∑+=
=n
mi
i
1
0θ
where U denotes the life-time utility of the representative household and iω , iθ
and ρ are constant parameters. In contrast to the model by Ngai and Pissarides
(2007), the assumption of logarithmic utility function (equation (9)) is not
necessary for my results, i.e. I could have assumed a constant intertemporal
elasticity of substitution function of the consumption composite in equation (9).
We can see that this utility function is based on the Stone-Geary preferences.
Without loss of generality I assume that iθ s are not equal to zero and that they
differ across goods i. The key reason why I use this utility function is that it
features non-unitary income-elasticity of demand and non-unitary price-elasticity
of demand. That is, each good has its own income elasticity of demand and its own
price elasticity of demand (as long as iθ differs across goods). For example, the
good i=4 has another price elasticity of demand than good i=7 (provided that
74 θθ ≠ ). Due to this feature, I can determine the own price elasticity and the own
income elasticity for groups of goods. For example, by setting the iθ in a specific
pattern I can determine that the (average) price elasticity of demand for the goods
i=7,…14 is larger than for goods i= 56,…79.
This is the key to my argumentation about preference and technology correlation
later: By setting parameter restrictions (10) and (11) I determine that
1.) on average, the income elasticity of demand for technology-1-goods is not
larger or smaller in comparison to the income elasticity of demand for technology-
2-goods.

13
2.) on average, the “relative price elasticity of demand” (i.e. elasticity of
substitution) between technology-1-goods and technology-2-goods is equal to one.
Hence, preferences and technologies are not correlated on average. This means for
example, that demand for some of the goods that are produced by technology 1 can
be price-inelastic and for some of the technology-1-goods price-elastic, while at the
same time the demand for some goods that are produced by technology 2 can be
price-elastic and for some of the technology-2-goods price inelastic. However, on
average, the elasticity of stubstitution between technology-1-goods and
technology-2-goods is equal to unity.
This restriction (equations (10) and (11)) reduces the generality of my model.
Nevertheless, for my further argumentation it does not matter. It is simply a
technical assumption in order to show in the simplest manner the existence of
neutral-cross-capital-intensity structural change. That is, due to this assumption I
can pursue my analysis along a PBGP, which is technically simple. Without this
assumption, I would have to numerically solve the model and the distinction
between neutral and non-neutral cross-capital-intensity structural change would be
quite difficult. Nevertheless, I will discuss theoretical reasonability of this
restriction later and I will show empirically that the largest part of structural change
is in line with this restriction.
Overall, my utility function allows for structural change caused by all structural
change determinants: In general the goods have a price elasticity of demand that is
different from one (as discussed above). Hence, changing relative prices can cause
structural change in this model (see also Ngai and Pissarides 2007 on price
elasticity and structural change). Intertemporal elasticity of substitution differs
across goods i and is not equal to unity, despite of the fact that equation (9) is
logarithmic. Equations (8)-(11) imply that the utility function is non-homothetic

14
across goods i, i.e. income elasticity of demand differs across goods i (depending
on the parameterization of the iθ ’s).
3.1.3 Aggregates and sectors
I define aggregate output (Y), aggregate consumption expenditures (E) and
aggregate intermediate inputs (H) as follows:
(12) ∑=
≡n
i
iiYpY1
; ∑=
≡n
i
iiCpE1
; ∑=
≡n
i
iihpH1
where ip denotes the price of good i. I chose the good m as numéraire, hence:
(13) 1=mp
Note that in reality the manufacturing sector is not the numérarire in the real GDP
calculations. Hence, my definition of aggregate output Y is not the same as real
GDP. However, the choice of numérarie is irrelevant when discussing ratios or
shares (see e.g. Ngai and Pissarides (2004, 2007)), since the numérarire of the
numerator and the denominator of a ratio offset each other. Therefore, I focus my
discussion on the shares and ratios in my paper (e.g. aggregate capital-intensity,
capital-to-output ratio, income-share of capital and labor), where the numérarire
choice is irrelevant. My results regarding the other Kaldor-facts, which are dealing
with the development of the real-GDP-growth rate and the real interest rate, should
be considered with caution. However, as discussed by Barro and Sala-i-Martin
(2004), the constancy of the real interest rate (as a Kaldor fact) may anyway be

15
questionable. Furthermore, as shown by Ngai and Pissarides (2004, 2007) the real
GDP as measured in reality and the real GDP in manufacturing terms seem to
behave quite similar. Therefore, possibly my results regarding the real GDP
development may be to some extent related to the real GDP as measured in reality.
Last but not least I have to define the sectors of our economy. Without loss of
generality I assume here that there are three sectors which I name for reasons of
convenience (according to the tree sector hypothesis): agriculture, manufacturing
and services. Furthermore, I assume that without loss of generality
• agricultural sector maai <<= 1;,...1
• manufacturing sector includes goods nsmsai <<+= ;,...1
• services sector includes goods nsi ,...1+= .
Hence, the agricultural sector uses only technology 1, the manufacturing sector
uses technology 1 and 2 and the services sector uses only technology 2. Note, that
this whole division is not necessary for my argumentation, neither the naming of
the sectors. I could also assume that the capital-producing manufacturing sector
uses only one technology (and the services sector both technologies). I could even
assume that there are more sectors (and more technologies). In all these cases my
key results would be the same. Furthermore, note that the assumption that a sector
uses both technologies is plausible. For example, the service sector includes
services that feature high TFP-growth and/or high capital intensity, e.g. ICT-based
services, as well as services that feature low TFP-growth and/or low capital
intensity, e.g. some personal services like counseling and consulting (for discussion
and empirical evidence see e.g. Baumol et al. 1985 and Blinder 2007). Similar
examples can be found in the manufacturing sector (e.g. a traditional clock maker
vs. a car producer). Furthermore, my sector-division implies that only sector M (the
manufacturing sector) produces capital. This is consistent with the empirical

16
evidence, which implies that most capital goods are produced by the manufacturing
sector (see e.g. Kongsamut et al. 1997).
According to my classification, I can define the outputs of the agricultural, services
and manufacturing sector ( .agrY , .manY and .serY ) and the consumption expenditures
on agriculture, manufacturing and services ( .agrE , .manE and .serE ) as follows:
(14) ∑∑∑+=+==
≡≡≡n
si
iiser
s
ai
iiman
a
i
iiagr YpYYpYYpY1
.
1
.
1
. ;;
(15) ∑∑∑+=+==
≡≡≡n
si
iiser
s
ai
iiman
a
i
iiagr CpECpECpE1
.
1
.
1
. ;;
Furthermore, note that employment shares ( .agrl , .manl and .serl ), capital shares
( .agrk , .mank and .serk ) and intermediate shares ( .agrz , .manz and .serz ) of sectors
agriculture, manufacturing and services are given by:
(16)
∑∑∑
∑∑∑
∑∑∑
+=+==
+=+==
+=+==
≡≡≡
≡≡≡
≡≡≡
n
si
iser
s
ai
iman
a
i
iagr
n
si
iser
s
ai
iman
a
i
iagr
n
si
iser
s
ai
iman
a
i
iagr
zzzzzz
kkkkkk
llllll
1
.
1
.
1
.
1
.
1
.
1
.
1
.
1
.
1
.
;;
;;;
;;;

17
3.2 Model equilibrium
3.2.1 Optimality conditions
I have now specified the model completely. The intertemporal and intratemporal
optimality conditions can be obtained by maximizing the utility function (equations
(8)-(11)) subject to the equations (1)-(7) and (12)-(16) by using e.g. the
Hamiltonian. When there is free mobility of factors across goods and sectors these
(first order) optimality conditions are given by:
(17) ih
Z
Zz
Y
ZzY
ZzY
KkY
KkY
LlY
LlYp
im
m
ii
mm
ii
mm
ii
mmi ∀
∂
∂
∂
∂=
∂∂
∂∂=
∂∂
∂∂=
∂∂
∂∂= ,
)()(/
)(/
)(/
)(/
)(/
)(/
(18) iCu
Cup
m
ii ∀
∂∂
∂∂= ,
/(.)
/(.)
(19) ρδ −−=− ru
u
m
m&
where mm Cuu ∂∂≡ /(.) and )(/ KkYr mm ∂∂≡ is the real interest rate (see
APPENDIX A for proofs). I show in APPENDIX A that these are the sufficient
conditions for an optimum (together with the transversality condition).
3.2.2 Development of aggregates in equilibrium
To be able to derive some theoretical arguments from the model, we have to insert
equations (1) to (16) into optimality conditions (17) to (19) in order to transform
the optimality conditions into some explicit functions of model-variables and
model-parameters. To get an impression of how this is done, see the corresponding
derivations in my Ageing-model (especially there APPENDIX A). In fact the

18
derivations there are very similar to the derivations which are necessary to obtain
the following equations. Therefore, I present the following equations, which
describe the optimal aggregate structure of the economy, without explicit proof:
(20) HEKKY +++= δ&
(21) qq
q
m
m KGLl
kY
−
= 1~
(22) ρδβ −−
= −−
−
11
1
q
m
m KGLk
l
E
E&
(23)
+=
m
m
k
lccYH 21
~γ
(24) Y
Hc
Y
Ec
k
l
m
m~~1 43 −−=
where
(25)
m
m
k
lcc
YY
65
~
+
≡
(27) 0)1(1
)1(>
−−−
+−≡
µεεγ
γνεµεβq
(28)
εµεγ
γ
ε
εµν
εε εχγ
αµ
χβ
αν
α
χγ
−−−
=
−
≡ ∏
)1(1
1
1n
i
iiBAAG
(29) ∑+=
≡n
mi
i
1
εε
and

19
21 1 cc −≡ ,
χβ
ανχγ
αµ
−
−
≡
1
1
2c ,
∑
∑
=
+
−≡
n
i
i
n
m
i
c
1
13 1
ω
ω
α
χ
χβ
αν, ∑
+=
−≡
n
mi
ic1
4 1 εα
χ
χβ
αν,
65 1 cc −≡ and
χβ
ανχ
α
−
−
≡
1
1
6c .
Note that G grows at positive constant rate, q is positive and 1<ε .5
Equations (20)-(28) look actually more complicated than they are. As we will see
soon they are quite the same as in the standard one-sector Ramsey-Cass-
Koopmans-model6 or Solow-model. The key difference is that my equations
feature the term mm kl / , which reflects the impact of cross-capital intensity
structural change on the development of aggregates. However, before discussing
these facts I start with my definition of an equilibrium growth path which is quite
similar as the definition used by Ngai and Pissarides (2007).
Definition 1: A partially balanced growth path (PBGP) is an equilibrium growth
path where aggregates (Y, Y~
, K, E and H) grow at a constant rate.
Note that this definition does require balanced growth for aggregate variables.
However, it does not require balanced growth for sectoral variables (e.g. for
sectoral outputs). Hence, it allows for structural change.
5 The term within the -brackets in equation (28) grows at constant positive rate since ε is
positive and smaller than one (see equation (29)). Furthermore, the exponent of the -brackets is
positive as well, since 1)1( <+− εµεγ (a weighted average of numbers that are smaller than one
(γ and µ ) is always smaller than one). As well, q>0, since 1)1( <+− εµεγ . 6 For a discussion of the Ramsey-model see e.g. Barro, Sala-i-Martin (2004) pp. 85ff.

20
Lemma 1: Equations (20) to (28) imply that there exists a unique PBGP, where
aggregates (Y, Y~
, K, E and H) grow at constant rate *g and where mm kl / is
constant. The PBGP-growth rate is given by LBA g
ggg +
+−
+−=
χεγαεµ
εγεµ
)1(
)1(*.
Proof: See APPENDIX B.
Proposition 1a: A saddle-path, along which the economy converges to the PBGP,
exists in the neighborhood of the PBGP.
Proposition 1b: If intermediates are omitted (i.e. if 0== µγ ), the PBGP is locally
stable.
Proof: See APPENDIX C.
Proposition 1 ensures that the economy will approach to the PBGP even if the
initial capital level is not such that the economy starts on the PBGP.
Proposition 2: Along the PBGP the aggregate dynamics of the economy are
represented by the following equations: EKKY ++= δ&ˆ ; qq
KLGY−= 1~ˆ and
ρδλ −−=K
Y
E
E ˆ&
, where G~
is a parameter growing at constant rate (“Hicks-
neutral technological progress”), Y denotes aggregate output without
intermediates production (i.e. Y-H) and λ is a constant (see APPENDIX B for
details of these parameters).
Proof: See APPENDIX B.
21
In fact Proposition 2 implies that the aggregate structure of our economy is quite
the same as the structure of the standard Ramsey-Cass-Koopmans- or Solow-model
(with Cobb-Douglas production function and logarithmic utility).
Now, the question arises, whether structural change takes place along the PBGP. I
discuss this question in the following.
3.2.3 Development of sectors in equilibrium
By inserting equations (1) to (16) into optimality conditions (17) to (19), the
following equations that describe the optimal sector structure of the economy
(represented by the employment shares) can be obtained:
(30a) ∑=
+Λ=a
i
iagragrY
l1
.. ~1
θ
(30b) ∑∑+=+=
Γ++Λ=s
mi
i
m
ai
imanmanY
l11
.. ~1
θθ
(30c) ∑+=
Γ+Λ=n
si
iserserl1
.. θ
where
(31a) ∑∑
∑
=
=
= +≡Λa
i
in
i
i
a
i
i
agrY
H
Y
E
1
1
1. ~~ ε
ω
ω
(31b) Y
KK
Y
H
Y
E s
mi
i
m
ai
in
i
i
s
mi
i
m
ai
i
man ~~~11
1
11.
δε
α
χε
ω
ωα
χω
++
++
+
≡Λ ∑∑∑
∑∑
+=+=
=
+=+=&

22
(31c) ∑∑
∑
+=
=
+= +≡Λn
si
in
i
i
n
si
i
serY
H
Y
E
1
1
1. ~~ ε
α
χ
ω
ω
α
χ
(31d)
εµε
εεµβγµµ
χγ
αµ
χβ
αν −−(−
+−+
≡Γ)11
)1(/
1v
v
m
m
v
Ll
KkL
A
GB
Again, to get an impression of how these equations can be derived, see the
derivations in my Ageing-model (especially APPENDIX A).
Note that ... ,, sermanagr ΛΛΛ and Γ can be easily derived as functions of exogenous
parameters along the PBGP.7 However, I omit here the explicit proof, since it is
trivial and irrelevant for further discussion (for a sketch of the proof see footnote
7).
Lemma 2: Structural change takes place along the PBGP. That is, the employment
shares of sectors agriculture ( .agrl ), manufacturing ( .manl ) and services ( .serl ) are
changing along the PBGP.
7 In APPENDIX B (equation (B.17)) I have derived mm kl / as function of exogenous model
parameters. This function can be used to derive Y~
and Y as functions of exogenous model
parameters by using equations (21) and (25). Then, when I have Y~
and mm kl / as functions of
exogenous model parameters, I can derive H as a function of exogenous model parameters by
using equation (23). Finally, I can use Y and H to derive E as function of exogenous model
parameters (via equation (20); note that the initial capital endowment 0K is exogenously given;
hence K can be calculated by using 0K and the equilibrium growth rate of capital *g , where
*g
is a function of exogenous model parameters as shown in Lemma 1). When I have mm kl / , Y~
, K
and E as functions of exogenous model parameters, I can derive ... ,, sermanagr ΛΛΛ and Γ as
functions of exogenous model parameters.

23
Proof: This Lemma is implied by equations (30) and (31). Note that .., managr ΛΛ ,
and .serΛ are constant along the PBGP (due to Lemma 1); Y~
grows at rate *g
along the PBGP (see Lemma 1). Γ decreases at constant rate along the PBGP. The
latter fact comes from Lemma 1 and equation (28). Note that G/A grows at positive
constant rate; see equation (28) and footnote 5. Furthermore, note that the exponent
εµγε
εεµβ
−−(−
+−+
)11
)1( vv is positive, since 1)1( <+− εµεγ as explained in footnote 5. Q.E.D.
Now, the remaining exercise is to show that along the PBGP my model is indeed
consistent with all the stylized facts mentioned in the introduction and section 2 of
my paper.
3.2.4 Consistency with stylized facts
Lemma 3: The PBGP of my model satisfies the Kaldor facts regarding the
development of the great ratios. That is, the aggregate capital intensity (K/L) is
increasing; the aggregate capital-income-share ( YrK / or )/( HYrK − ), the
aggregate labor-income-share ( YwL / or )/( HYwL − ) and the aggregegate
capital-to-output ratio (K/Y or K/(Y-H)) are constant (where r is the real rate of
return on capital and w is the real wage rate).
Proof: The constancy of K/Y and K/(Y-H) as well as the increasing capital-intensity
(K/L) are directly implied by Lemma 1. Since I assume perfect polypolisitic
markets, the marginal productivity of capital (of labor) in a sub-sector i is equal to
the real rate of return on capital (real wage rate) for all i. This implies for example
for mi = :

24
(32) K
Y
k
l
Kk
Yr
m
m
m
m
~
)(β=
∂
∂=
(33) L
Y
Ll
Yw
m
m
~
)(α=
∂
∂=
Hence, Lemma 1 and equations (32) and (33) imply that Y
rK,
HY
rK
−,
Y
wL and
HY
wL
− are constant. Q.E.D.
Note that there are two further Kaldor-facts: namely Kaldor stated that the
aggregate volume of production grows at a non-decreasing rate and that the real
rate of return on capital is constant. As discussed in section 3.1, due to numéraire
choice I cannot say whether these two Kaldor-facts are satisfied approximately in
my model. However, as mentioned before, the constancy of the real interest rate
seems to be rather not a fact in reality. Furthermore, the results by Ngai and
Pissarides (2004, 2007) imply that the aggregate output expressed in manufacturing
terms (as in my model) behaves quite similar as the aggregate output that is
measured in reality (by using some compound numéraire). Hence, my model could
be consistent with a constant real rate of aggregate output.
Lemma 4: Along the PBGP the development of sectoral employment shares over
time (equations (30)-(31)) can be monotonous (monotonously increasing,
monotonously decreasing or constant) or non-monotonous (“hump-shaped” or
“U-shaped”), depending on the parameterization of the model.
Proof: This Lemma is implied by equations (30)-(31). In the proof of Lemma 2 I
have shown that .., managr ΛΛ , and .serΛ are constant along the PBGP, Y~
grows at

25
rate *g along the PBGP (see Lemma 1) and Γ decreases at constant rate along the
PBGP. Hence, since Y~
/1 and Γ grow at different rates, equation (30b) implies that
the development of the manufacturing-employment-share over time ( .manl ) can be
non-monotonous, provided that ∑+=
m
ai
i
1
θ has not the same sign as ∑+=
s
mi
i
1
θ . That is, it
can be hump-shaped or U-shaped depending on the parameterization. Hence, the
model can reproduce a “hump-shaped” development of the manufacturing-
employment share over time, which has been emphasized by Ngai and Pissarides
(2007) and Maddison (1980). Note that only sectors, which use at least two
technologies, can feature non-monotonous development of their employment share
over time. However, as discussed in section 3.1 the manufacturing sector (i.e. the
capital producing sector) need not using two technologies, i.e. the model could be
set up such that the agricultural sector or the services sector uses two technologies.
Hence, in fact any of the sectors could feature non-monotonous dynamics of its
employment-share over time. The proof that
• .agrl can be monotonously increasing, monotonously decreasing or constant,
• .manl can be monotonously increasing or monotonously decreasing, and
• .serl can be monotonously increasing, monotonously decreasing or constant
is obvious when taking into account that ∑=
a
i
i
1
θ , ∑∑+=+=
s
mi
i
m
ai
i
11
, θθ and ∑+=
n
si
i
1
θ can be
negative, positive or equal to zero respectively. Q.E.D.
Lemma 5: Agriculture, manufacturing and services have different production
functions in my model. Especially, the optimal capital intensity differs across these
sectors.
26
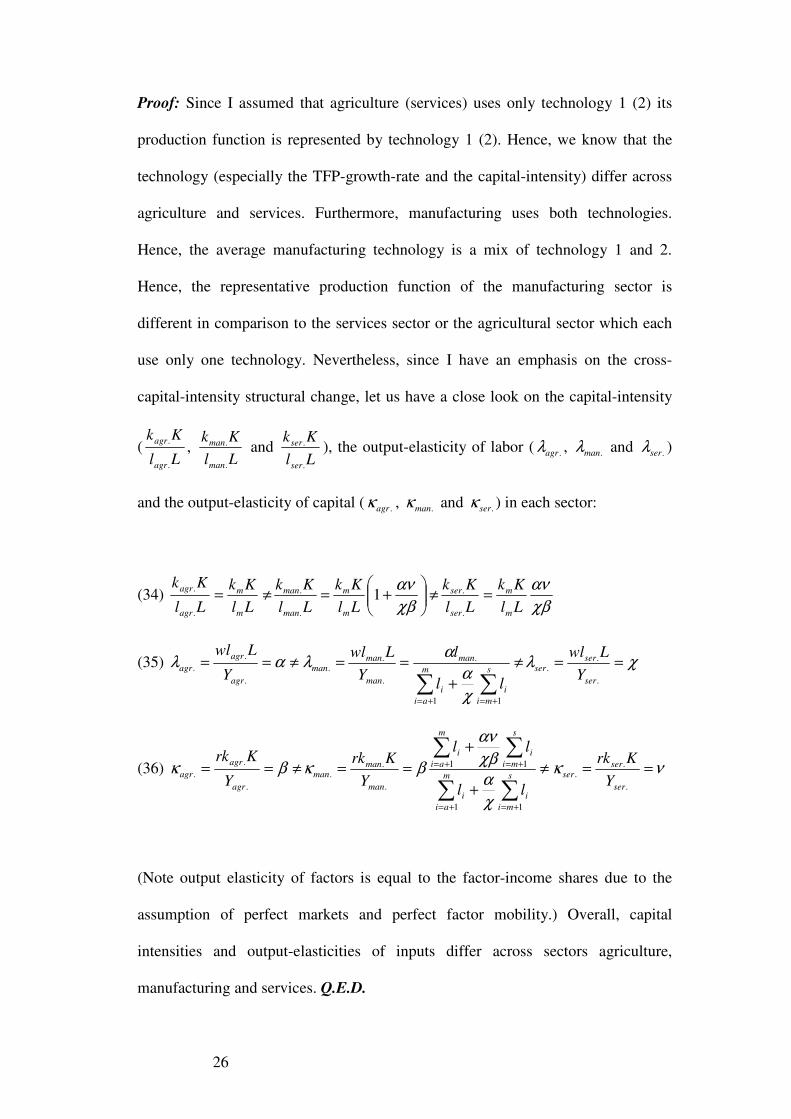
Proof: Since I assumed that agriculture (services) uses only technology 1 (2) its
production function is represented by technology 1 (2). Hence, we know that the
technology (especially the TFP-growth-rate and the capital-intensity) differ across
agriculture and services. Furthermore, manufacturing uses both technologies.
Hence, the average manufacturing technology is a mix of technology 1 and 2.
Hence, the representative production function of the manufacturing sector is
different in comparison to the services sector or the agricultural sector which each
use only one technology. Nevertheless, since I have an emphasis on the cross-
capital-intensity structural change, let us have a close look on the capital-intensity
(Ll
Kk
Ll
Kk
man
man
agr
agr
.
.
.
., and
Ll
Kk
ser
ser
.
. ), the output-elasticity of labor ( .agrλ , .manλ and .serλ )
and the output-elasticity of capital ( .agrκ , .manκ and .serκ ) in each sector:
(34) χβ
αν
χβ
αν
Ll
Kk
Ll
Kk
Ll
Kk
Ll
Kk
Ll
Kk
Ll
Kk
m
m
ser
ser
m
m
man
man
m
m
agr
agr=≠
+=≠=
.
.
.
.
.
.1
(35) χλ
χ
α
αλαλ ==≠
+
==≠==
∑ ∑+= +=
.
..
1 1
.
.
..
.
.
.
ser
serserm
ai
s
mi
ii
man
man
manman
agr
agr
agrY
Lwl
ll
l
Y
Lwl
Y
Lwl
(36) νκ
χ
α
χβ
αν
βκβκ ==≠
+
+
==≠==
∑ ∑
∑ ∑
+= +=
+= +=
.
..
1 1
1 1
.
..
.
.
.
ser
serserm
ai
s
mi
ii
m
ai
s
mi
ii
man
manman
agr
agr
agrY
Krk
ll
ll
Y
Krk
Y
Krk
(Note output elasticity of factors is equal to the factor-income shares due to the
assumption of perfect markets and perfect factor mobility.) Overall, capital
intensities and output-elasticities of inputs differ across sectors agriculture,
manufacturing and services. Q.E.D.

27
Lemma 6: Along the PBGP the factor reallocation across the agricultural,
manufacturing and services sector is determined by cross-sector-TFP-growth
disparity, by cross sector capital-intensity-disparity and by non-homothetic
preferences.
Proof: As discussed above, the TFP-growth rates and the capital-intensities differ
across the sectors agriculture, manufacturing and services; see also Lemma 5.
Equations (30)-(31) (and equations (21) and (28)) imply that cross-sector-
differences in TFP-growth-rates and cross-sector-differences in output-elasticities
of inputs (which determine the capital-intensities) determine the strength of the
factor reallocation between the sectors agriculture, manufacturing and services.
Especially, they affect the sectoral employment shares ( .agrl , .manl and .serl ) via the
terms Y~
and Γ , which are among others functions of the parameters that
determine the sectoral TFP-growth rates and sectoral capital intensities (see
equations (21), (31d) and (28) and Lemma 5).
Furthermore, equations (8) to (11) imply that preferences are non-homothetic
across sectors agriculture, manufacturing and services. A detailed proof is in
APPENDIX D, where I show among others that the terms ∑=
a
i
i
1
θ , ∑∑+=+=
s
mi
i
m
ai
i
11
, θθ and
∑+=
n
si
i
1
θ determine the pattern of non-homotheticity across sectors agriculture,
manufacturing and services. Equations (30)-(31) imply that this non-homotheticity
determines the strength and direction of structural change (via terms ∑=
a
i
i
1
θ ,
∑∑+=+=
s
mi
i
m
ai
i
11
, θθ and ∑+=
n
si
i
1
θ ). Q.E.D.

28
Lemma 7: Intersectoral outsourcing (i.e. shifts in intermediates production across
sectors) takes place along the PBGP. That is, along the PBGP manufacturing-
sector-producers shift more and more intermediates production to services-sector-
producers (i.e. ji hh / changes), provided that services-sector-production becomes
cheaper and cheaper (or less and less expensive) in comparison to manufacturing-
sector-production (i.e. provided that relative prices change), and vice versa. Any
direction of relative price changes (and hence any direction of intermediate-
production shifts between the manufacturing and the services sector) can be
generated along the PBGP, depending on the parameterization.
Proof: See APPENDIX E.
Theorem 1: The PBGP satisfies simultaneously the following stylized facts:
• Kaldor-facts regarding the development of the great ratios,
• Kuznets facts regarding structural change patterns,
• “stylized facts regarding cross-sector-heterogeneity in production-
technology” (see section 2 as well), and
• empirical evidence on structural change determinants in industrialized
countries (see section 2).
Proof: The consistency of the PBGP with the Kaldor facts is implied by Lemma 3.
Note that empirical evidence on structural change between agriculture,
manufacturing and services in industrial countries implies the following stylized
facts for the development of the employment shares over the last century:
• the agricultural sector featured a monotonously decreasing employment
share,
• the services sector featured a monotonously increasing employment share,
and

29
• the manufacturing sector featured a constant or “hump-shaped” employment
share (depending on the length of the period considered).
These stylized facts have been formulated by Kongsamut et al. (1997, 2001); on
the “humped shape” of the manufacturing-employment share see e.g. Ngai and
Pissarides (2004, 2007) and Maddison (1980). In the proof of Lemma 4 I have
shown that my model can reproduce these stylized facts regarding the development
of the agricultural, manufacturing and services employment shares. Hence, the
PBGP is consistent with the Kuznets-facts.
The consistency of the PBGP with the “stylized facts regarding cross-sector-
heterogeneity in production-technology” is shown in Lemma 5, where I show that
production technology differs across agriculture, manufacturing and services in my
model.
Finally the consistency of the PBGP with the empirical evidence on structural-
change-determinants in industrialized countries is shown in Lemmas 6 and 7.
Q.E.D.
3.2.5 The relationship between structural change and aggregate-dynamics
Now I turn to the question about the relationship between structural change and
aggregate growth, i.e. I ask how structural change affects aggregate growth, which
is important for understanding the Kuznets-Kaldor-puzzle. In the following I will
show that there are two types of cross-capital-intensity structural change, which are
distinguished according to their impact on the aggregate structure of the economy.
Definition 2: The term “cross-capital-intensity structural change” stands for
factor reallocation across sectors that differ by capital intensity.

30
It can be shown that
(37)
++=≡ .
.
..
.
..
.
.
ser
ser
serman
man
managr
agr
agr
m
m
m
m lllk
ll
λ
κ
λ
κ
λ
κ
α
β
where .agrλ ( .agrκ ), .manλ ( .manκ ) and .serλ ( .serκ ) are respectively the income-share
of labor (capital) in sectors agriculture, manufacturing and services. Equation (37)
follows from the assumption of factor mobility across sectors and from the
assumption of perfect markets.
Equation (37) and Lemma 1 imply that there are two sorts of cross-capital-
structural change:
(1) Cross-capital-intensity structural change where l is not constant. Lemma 1
implies that the economy is on a PBGP, only if mm kl / is constant; furthermore,
equation (37) implies that the constancy of l is required for the constancy of
mm kl / . Hence, as long as l is not constant, the economy is not on a PBGP and the
Kaldor-facts are not satisfied (exactly). That is, this type of structural change is not
compatible with the Kaldor facts (unless structural change is very weak such that
its impact via l is weak which would imply that Kaldor facts are approximately
satisfied).
(2) Cross-capital-intensity structural change that is compatible with a constant l .
Hence, an economy can be on a PBGP, even when cross-capital-intensity factor
reallocation takes place, provided that this factor reallocation is such that l = const.
(see also Lemma 1).
So I can give the following definition and theorem:

31
Definition 3: “Neutral structural change” stands for cross-capital-intensity
structural change that satisfies the following condition:
(38) ..
.
..
.
..
.
.constllll ser
ser
serman
man
managr
agr
agr=
++≡
λ
κ
λ
κ
λ
κ
Theorem 2: Along the PBGP, the cross-capital-intensity structural change
(between agriculture, manufacturing and services) is “neutral” in the sense of
Definition 3.
Proof: Note that I have shown in Lemma 5 that sectors agriculture, manufacturing
and services differ by technology, and especially by capital intensity and by output-
elasticities of inputs/income-shares of inputs. Lemma 2 implies that structural
change takes place across these sectors. Equation (37), Definition 3 and Lemma 1
(necessity of a constant mm kl / for a PBGP) imply the rest of the theorem. Q.E.D.
Theorem 3: Neutral structural change is an explanation for the Kuznets-Kaldor-
Puzzle in my model.
Proof: Remember that the Kuznets-Kaldor-puzzle was about the empirical
question why cross-capital-intensity structural change is compatible with the
stability of the great ratios (Kaldor facts). Theorem 2 implies that neutral-cross-
capital-intensity structural change takes place along the PBGP, while Theorem 1
shows that the PBGP is consistent with the Kaldor facts. Thus, Kaldor-facts are
satisfied, since cross-technology structural change needs not necessarily to
contradict the Kaldor facts, which is satisfied in my model only neutral cross-
capital-intensity structural change patterns. Furthermore, Theorem 1 shows the

32
generality of my proof: neutral cross-technology structural change is not only
consistent with the Kaldor facts about the great ratios but also with the other
stylized facts which are relevant for the analysis of the relationship between
structural change and aggregates. Hence, Theorem 1 shows that I solved the
Kuznets-Kaldor-puzzle under consideration of the most important structural change
determinants and under assumption of sectoral cross-technology disparities
observed in reality. Q.E.D.
The convenient feature regarding latter two theorems is that I can use them to test
my theory empirically: I can calculate l , and then decompose which share of
structural change does not change the value of l and which share of structural
change changes the value of l . In this way I can evaluate the quantitative
significance of my model-explanation for the Kuznets-Kaldor-Puzzle, since my
explanation focuses only on structural change that does not change l (due to
Theorem 2).
However, before doing so I show two further interesting results
Proposition 3: The output-elasticity of inputs ( .manλ , .manκ ) is not constant in the
manufacturing sector along the PBGP, but changes according to the amount of
inputs used in this sector.
Proof: This is implied by equations (35) and (36). Note, that any sector that uses
two technologies has a non-constant output-elasticity of inputs in my model setting.
Q.E.D.

33
This result is interesting: in fact it implies that observed technology changes in
sectors need not necessarily resulting form technological progress at sector level,
but can also result from structural change. Of course this requires that sectors use
several technologies, which seems to be a reasonable assumption. This fact could
be of importance for further research, especially when analyzing endogenous
technological progress at sector level. That is, Proposition 3 implies that such
research will require considering technology change at sector level with caution,
since some technology change may not result from technological progress at sector
level.
As argued in section 3.1 I assume that there are only two technologies in my
model, but that there is an arbitrary number of subsectors. Hence, some subsectors
have to use identical technologies. As explained there, I use this assumption to
explain the concept of “uncorrelated preferences and technologies” in a traceable
way, which will be of interest later in this paper. However, the assumption of partly
identical production functions is not necessary for the key results of the actual
section: the following proposition shows that the key result of this section (namely
for the existence of neutral cross-capital-intenstity structural change) can be
derived even all (sub-)sectors have completely different production functions.
Proposition 4: Generalization of my results: In a framework where
• all sub-sectors (i) have sub-sector-specific production functions,
• sub-sector production functions are general neoclassical production
functions
• and intermediate production is omitted
a necessary condition for neutrality of cross-capital-intensity structural change
and for the satisfaction of Kaldor-facts is

34
(39) .~
constl
li i
i =≡∑λ
where iλ is the output-elasticity of labor in subsector i which is equal to the labor-
income share in sector i.
Proof: See APPENDIX F.
4. A measure of neutrality of cross-capital-intensity structural change In the previous section, I have presented a model that explains the Kuznets-Kaldor-
puzzle with a certain structural change pattern which I name “neutral structural
change”. In Theorem 2 and Proposition 4 I have shown that this structural change
pattern must satisfy condition (38). Due to lack of data I cannot consider
intermediates production explicitly. Therefore, I assume that capital and labor are
the only inputs in the production function in this section. In this case condition (38)
transforms into condition (39).
In proposition 4 I have generalized the validity of condition (39) to a more general
framework than that that of section 3. Hence, the development of this condition is
not only of interest for my model, but for all models that analyze PBGP’s.
I can use condition (39) to asses to what extent neutral structural change takes
place in reality.
For the calculations in this section I use the data for the U.S.A., which is available
at the web-site of the U.S. Department of Commerce (Bureau of Economic
Analysis). I use the U.S.-Gross-Domestic-Product-(GDP)-by-Industry-Data, which

35
is based on the sector-definition from the “Standard Industrial Classification
System”, which defines the following sectors:
(1) Agriculture, forestry, and fishing
(2) Mining
(3) Construction
(4) Manufacturing
(5) Transportation and public utilities
(6) Wholesale trade
(7) Retail trade
(8) Finance, insurance, and real estate
(9) Services
My calculations are based on the data for the period 1948-1987. Uniform data for
longer time-periods is not available, since the “Standard Industrial Classification
System” has been modified over time (hence, the sector definition after 1987 is not
the same as the sector definition before 1987).
To calculate the sectoral labor income shares ( iλ ) I divided “(Nominal)
Compensation of Employees” by “(Nominal) Value Added by Industry” in each
sector. The sectoral employment shares ( il ) are calculated by using the sectoral
data on “Full-time Equivalent Employees”. (This approach is similar to that used
by Acemogu and Guerrieri (2008)).
Figure 1 depicts the development of l~
, calculated by these data:

36
Figure 1: Development of l~
over time
1,65
1,7
1,75
1,8
1,85
1,9
1,95
2
2,05
2,1
2,15
1948
1950
1952
1954
1956
1958
1960
1962
1964
1966
1968
1970
1972
1974
1976
1978
1980
1982
1984
1986
We can see that l~
is decreasing and not constant. The question is, how small the
decline of l~
is. The decline in l~
could have been much stronger or much weaker.
If the decline is relatively small, I could postulate that l~
is “approximately”
constant from a theoretical point of view, hence the model of neutral structural
change would be relatively good in explaining the Kuznets-Kaldor puzzle. Hence, I
have to develop an index which indicates how strong the decline is. In the
following I develop such an index. This index is based on calculating the strongest
possible decline in l~
and then relating the actual decline to it.
Any actual l~
can be expressed as a unique combination of neutral and “maximally
non-neutral structural change”. “Maximally non-neutral structural change” is the
pattern of factor reallocation that causes the maximal decline in l~
for a given
amount of reallocated labor over a period. Hence, maximally non-neutral structural
change is a diametric concept of neutral structural change: while neutral structural
change is defined upon no change in l~
, maximally non-neutral structural change is

37
defined upon maximal change in l~
. This allows me to create an index that shows
us whether a given amount of reallocated labor has been reallocated rather in the
neutral way or rather in the maximally non-neutral way. According to this
discussion the following relation must be true:
(40) max)~
()~
)(1()~
( lIlIl N
neutral
N
actual ∆+∆−=∆
where NI is a weighting factor between neutral and maximally non-neutral
structural change, i.e. it indicates whether structural change was rather neutral or
non-neutral; if NI =1, structural change is maximally non-neutral over the
observation period; if NI =0 structural change is neutral over the observation
period. actuall )~
(∆ measures the change in l~
that really took place between 1948
and 1987; max)~
( l∆ measures the maximal change in l~
, that would be
(hypothetically) possible with the given amount of cross-sector factor reallocation
between 1948 and 1987, i.e. max)~
( l∆ stands for “completely non-neutral structural
change”. neutrall )~
(∆ measures the change in l~
that is caused by neutral structural
change. Since per definition neutrall )~
(∆ is equal to zero, I can rearrange the
condition from above as follows:
(41) max)
~(
)~
(
l
lI
actual
N∆
∆≡
where max)~
( l∆ and actuall )~
(∆ are defined as follows:

38
(42) ∑∑ −=−≡∆i i
i
i i
iactual lllll
1948
1948
1987
1987
19481987
~~)
~(
λλ
(43) ∑∑ −=−≡∆i i
i
i i
i lllll
1948
1948
1987
max1987
1948
max
1987
max ~~)
~(
λλ
where 1948
il , 1987
il , 1948
iλ and 1987
iλ denote respectively the employment share of
sector i in 1948, the employment share of sector i in 1987, the labor-share of
income in sector i in 1948 and the labor-share of income in sector i in1987. max1987
il
stands for the hypothetical employment share of sector i, which would result, if the
labor, which has been reallocated between 1948 and1987, were reallocated in such
a manner that the maximal decrease in l~
was accomplished between 1948 and
1987. That is, the max1987
il ’s stand for the hypothetical factor allocation in 1987,
which yields the maximally non-neutral structural change between 1948 and 1987.
Last but not least, since my definition of max1987
il requires knowing how much labor
has been reallocated between 1948 and 1987, I propose the following index of
observable factor reallocation between 1948 and 1987:
∑ −≡∆i
ii lll 19481987
2
1
This measure indicates how much labor has been reallocated between 1948 and
1987. This measure is set up as follows: First, the change in the employment share
in each sector is measured. The absolute values (modulus) of these changes are
summed up (otherwise, without taking absolute values, that sum of the sectoral
changes would always be equal to zero, since ∑ =i
il 1 per definition). Since the

39
change in the employment share in one sector has always a corresponding change
in the employment shares of the other sectors (labor is reallocated across sectors),
the sum of the absolute values of the changes must be divided by two to avoid
double-counting.
It is possible that between 1948 and 1987 in some sectors the employment share
increased first and decreased then. Hence, the pure difference 19481987
ii ll − would
indicate less reallocation than actually took place. My index of factor reallocation
( l∆ ) neglects such non-monotonousity in sectoral employment shares. Hence, it
underestimates the real amount of labor reallocated between 1948 and 1987.
Therefore, my index NI underestimates the neutrality of structural change: if more
labor were reallocated during the period, the hypothetical maximal change in l~
( max)~
( l∆ ) would be larger; hence, NI would be smaller, which would imply more
neutrality. Overall, for these reasons, my index NI indicates less neutrality than
actually is.
Note that it is important that my measure of maximally non-neutral structural
change ( max)~
( l∆ ) is based on the actual amount of reallocated labor ( l∆ ). In this
way I distinguish between strength and direction of structural change. Strength of
structural change implies how much labor has been reallocated (e.g. as measured
by l∆ ). The direction of structural change implies how the labor has been
reallocated across technology. Neutrality of structural change is not related to
strength but only to direction, since condition (39) can be satisfied by more or less
strong structural change patterns. What counts for satisfying condition (39) is the
direction of structural change. If there is no significant direction of structural
change (39) is satisfied. Therefore, when calculating the neutrality index it is
important to be cautious about not defining max)~
( l∆ such that it features stronger

40
structural change than actual structural change is. Therefore, I calculate max)~
( l∆ by
using the actual amount of reallocated labor ( l∆ ).
The data that I need for my calculations is given in the following table:
Table 1
Now, by using these data, I have to do the following steps to calculate NI :
1.) Calculate the amount of reallocated labor between 1948 and (1987), which
results in ≈∆l 0.23.
2.) Calculate max
1987
~l . According to my definition of max
1987
~l , I have to do the following
steps:
a.) Find the sector that has the smallest 1987/1 iλ . This is actually sector (9).
b) Make a ranking of the remaining sectors according to their 1987/1 iλ . This ranking
is given by (8)-(1)-(2)-(5)-(6)-(7)-(3)-(4), where sector (8) has the largest 1987/1 iλ
and sector (4) has the smallest 1987/1 iλ in this ranking.
Sector 1948/1 iλ 1987/1 iλ
1948
il 1987
il
(8) 5.248981966 3.997781119 0.039609477 0.077711379
(1) 6.874359747 3.921756596 0.05019623 0.019310549
(2) 2.62541713 3.240100098 0.024056398 0.008630482
(5) 1.632072868 2.20691581 0.099835263 0.063265508
(6) 1.937362752 1.72651328 0.062648384 0.070192118
(7) 1.988458748 1.649066345 0.141770435 0.191092947
(3) 1.495168451 1.505702087 0.056228499 0.059919498
(4) 1.505805486 1.447391372 0.376011435 0.229516495
(9) 1.681140684 1.444831355 0.149643878 0.280361023

41
c) By using the ranking from b) reallocate the labor from the sectors with the
largest 1987/1 iλ to sector (9). I first use the whole amount of labor, that has been
employed in sector (8) in 1948, then the whole amount of labor, that has been
employed in sector (1) in 1948, and so on, stepping up in the ranking until I have
hypothetically reallocated the whole ≈∆l 0.23. Hence, I obtain the following
maximally non-neutral factor allocation for the year 1987
Table 2
Sector max1987
il
(8) = 0
(1) = 0
(2) = 0
(5) = 0
(6) = )( 1948
)8(
1948
)5(
1948
)2(
1948
)1(
1948
)6( llllll −−−−∆− = 0.046969461
(7) = 1948
)7(l = 0.141770435
(3) = 1948
)3(l = 0.056228499
(4) = 1948
)4(l = 0.376011435
(9) = ll ∆+1948
)9( = 0.37902017
3.) The rest of the calculations is quite simple: by inserting the data from Tables 1
and 2 into equations (41)-(43), we can obtain NI .
My calculations imply an index NI = 0.45. This implies that actual structural
change was slightly closer to its neutral extreme than to its non-neutral extreme. In

42
other words, the actual structural change between 1948 and 1987 was by 55%
neutral and by 45% maximally non-neutral.
In this sense, my model can explain 55% of the structural change between 1948
and 1987.
Note that my measure underestimates the neutrality of structural change. That is, in
reality more than 55% of structural change can be regarded as neutral. There are
two reasons: as discussed above, my measure assumes monotonousity of factor
reallocation; furthermore, as will be discussed close to the end of next section, the
period, which I used for analysis, is quite short and structural change is more
neutral over very long periods of time.
5. On correlation between preferences and technologies In section 3.1 I have assumed that preferences and technologies are uncorrelated in
my model. In detail, I have assumed that
• on average the income elasticity of demand is equal when comparing
technology-1-goods and technology-2-goods
• on average the elasticity of substitution is equal to unity when comparing
technology-1-goods and technology-2-goods.
In the following I will discuss the rationale for these assumptions. I focus here on
the elasticity of substitution, but the corresponding arguments apply for the income
elasticity of demand.
Assuming that the relative price-elasticity of demand between two goods is
different from unity implies that the household has a certain preference for the one
good over the other: Imagine that there are only two goods (good A and good B). If
the relative price of the good A increases by one percent and the relative demand

43
for this good decreases by less than one percent, good A is regarded as more
important than good B by the household in the dynamic context. That is, the price
change causes a weaker reaction than it would be if the two goods were regarded as
equivalents. Only if two goods are regarded as equivalents, a one-percent-change
in the relative price between these goods would yield a (minus) one-percent-change
in the demand-relation between these goods (hence, elasticity of substitution
between these goods being equal to one).
Now, the same argument could be applied to two groups of goods (group A and
group B): if the household regards the two groups as equivalents, the average
elasticity of substitution between the two groups is equal to unity. Otherwise, we
would have to postulate that on average group A includes goods that are preferred
over group B (or the other way around).
Now, imagine that the whole range of products in an economy is divided into two
groups according to their production technology. Group A includes goods that are
regarded as technologically progressive and group B includes goods that are
produced by a backward technology. Furthermore, let us make the following
assumptions:
(a) The household doesn’t know anything about the production process, i.e. the
household’s preference depends only on the “objective taste” of the goods (but not
on the knowledge that the good is produced at e.g. high-capital-intensity).
“Objective taste” means the taste which depends only on the physical/chemical
properties of the good or on the basic properties (i.e. actual quality) of the service,
but not on the knowledge about the production process of the good or service. For
example, if two goods are produced by different capital intensities, but if the two
goods are basically the same (i.e. have the same physical and chemical properties),
the objective taste of the two goods is the same. A further example is the following

44
experiment: imagine that a live concert is recorded and then later replayed as a
playback to a similar audience (while the original musicians pretend performing
music). The labor-intensity of the original concert is higher in comparison to the
playback concert, since pretending is easier (i.e. less labor-intense) in comparison
to performing live music. The objective taste of the two concerts would be the
same. (However, the “subjective taste” of the two concerts would differ, if the
audience knew that the second concert is only a playback.)
(b) The “objective taste” of a good is on average not dependent on the technology
that is used to produce it. That is, some very tasty goods are produced by
progressive technology and some very tasty goods are produced by backward
technology; as well, some less tasty goods are produced by progressive technology
and some less tasty goods are produced by backward technology.
With these assumptions we would conclude that on average group-A-goods are not
preferred over group-B-goods and group-B-goods are not preferred over group-A-
goods. That is, the groups are regarded as equivalents; hence, on average the
elasticity of substitution between these two groups will be close to one (according
to the discussion above).
Now let us make a further assumption:
(c) I look only on the averages over very long periods of time and I assume that
there are many technologies and goods.
Hence, from this perspective due to the law of large numbers the elasticity of
substitution between the two groups is equal to unity.
In other words, if preferences and technologies are uncorrelated (i.e. if the taste
does not depend on production technology), the household behavior will not
display any preference for the technology-level (group A or group B), provided

45
that very long periods of time are considered and provided that there are many
goods.
This is what I assumed in section 3.1: I assumed that there are two technologies
and that there are many goods that are produced with these technologies and that
the preference structure does not display any preference for a certain technology.
This is what I did by assumptions (10) and (11). These assumptions ensure that on
average the relative price-elasticity between technology-1-goods and technology-2-
goods is equal to unity.
Now the question is whether the assumptions (a), (b) and (c) are suitable in long
run growth models.
Assumption (c) seems not to be problematic, since the long-run growth theory is
anyway based on analyzing long-run-averages (e.g. the time preference rate is
assumed to be constant in standard neoclassical growth models). Furthermore,
since I look at very long run, any accidental correlations between technology and
preferences, which may arise from a relatively low number of products, may as
well offset each other over the period’s average.
Assumption (b) is less problematic in comparison to assumption (a). In fact, the
technological progress during the last century has implicitly shown that the basic
physical/chemical properties of a good are not necessarily dependent on its capital-
intensity. In industrialized countries nearly all goods featured some technological
progress that substituted labor by capital, while the basic physical properties of the
goods remained the same basically. The most obvious example is agriculture. Food
has for the most part the same basic physical properties today as earlier in the
century, while the capital-intensity of agriculture increased significantly. Such
developments are also apparent in manufacturing (e.g. regarding the increasing
capital-intensity of car-production) and services (e.g. cash-teller-machines).

46
Furthermore, today we can imagine for nearly every good or service a relatively
realistic technology that could substitute the labor by capital, without changing the
basic physical properties of the good. It is not plausible to assume that in the very
long run technological progress is restricted to certain types of goods. In the last
two decades many service-jobs, which were regarded as labor-intensive, were
replaced by computer-machines and the substitutability of human by machines in
services is increasing. Hence, when developing a long run theory of structural
change, the dependency between technology and certain types of goods (and hence
certain preferences) seems to be difficult to defend. Therefore, overall, the
assumption that the “objective taste” of a good is independent of the capital-
intensity of the production process seems to be acceptable to some degree,
especially when assuming (c).
It is more difficult to evaluate assumption (a) a priori. Assumption (a) requires that
the representative household behaves like he doesn’t know about the actual capital
intensity of a good, i.e. it is required that the household’s demand reaction to a
price and/or income change is based only on physical/chemical properties of a
good. What we know from basic microeconomics (e.g. form the discussion about
“Giffen-goods”) is that the price elasticity (and income elasticity) depends on the
basic physical/chemical properties of the good, i.e. whether the physical/chemical
properties of a good are such that it is feasible to satisfy the basic needs of a
household. (The price elasticity for such goods is low.) On the other hand, there is
also a discussion about a “snob” effect, where some very labor-intensity services
(like a full time servant) are used to signal the wealth of the household. Such
services have a relatively high income-elasticity and price-elasticity. However, as
well, there are many high-capital-intensity-goods that have high price-elasticity of
demand and high income-elasticity of demand, like very expensive cars. Hence,

47
there is both: capital-intensive and labor-intensive goods that feature a relatively
high price-elasticity and a relative high income-elasticity. My model requires that
on average (i.e. when looking at the average of all consumption goods) the income
(price) elasticity of demand does not depend on the capital-intensity of a good.
Last not least, the increasing complexity of the products and of the production
process, international outsourcing and increasing variety of products make it
increasingly unlikely that the household has clear information about the capital-
intensity of a large part of its consumption bundle.
All in all, the empirical evidence from the previous section implies that the
assumption of no/low correlation between technology and preferences can explain
a part of the Kuznets-Kaldor-puzzle. The fact that there is some correlation
between technology and preferences results probably from the fact that assumption
(a) has not been satisfied over the time-period of my sample. That is, probably high
labor-intensity of a service has been regarded as an aspect of quality and/or luxury.
Hence, high-labor-intensity services have probably had high income-elasticity of
demand on average, which caused the correlation between technology and
preferences in the past.
The fact that there has been some correlation between preferences and technologies
in my sample does not necessarily imply that we can presume such correlation in
future:
I analyzed only a 40 year period. This is a very short period to satisfy assumption
(c) and to study growth theory empirically in general. Remember that Kaldor-facts
(which I seek to explain in my paper) do not necessarily apply to such a short
period. The probability is very high that over such a short period “accidental”
correlation between technology and preferences arises, which does not persist over
the long run. It seems that this was the case: The technological innovation between

48
1940 and 1980 allowed to a big part an increase in capital-intensity in non-service-
sectors (such as manufacturing and agriculture). That is, the technological break-
throughs were such that they were easy to implement in non-services sectors but
they were hardly implementable in the services sector8. Hence, if services have
high income-elasticity of demand, some correlation between technology and
preferences may have been arisen due to such biased technological progress.
However, new sorts of technological break-through occurred after this period,
especially in the information and communication technology. Such break-throughs
have increased the capital-intensity in the services sector and have a high potential
for increasing the capital-intensity of the services sector drastically (e.g. by
progress in computers and robotics, which is implementable in services).
Hence, my empirical results probably over-estimate the long-run degree of
correlation between preferences and technologies; the long-run correlation between
preferences and technologies is probably very low or even inexistent. In this sense,
my model of independent preferences and technologies predicts quite well the
future structural change impacts on aggregates.
6. Concluding remarks In this essay I have searched for a solution of the Kuznets-Kaldor-puzzle. In fact,
the Kuznets-Kaldor-puzzle states that aggregate ratios behaved in a quite stable
manner in industrialized countries, while at the same time massive factor
reallocation took place across sectors, which differ by technology (and especially
by capital-intensity).
8 Of course, the term “services” means here rather personal services (i.e. services which require
face-to-face contact, e.g. counselling) and rather not such services as transportation. The latter
featured strong increases in capital-intensity. See for example Baumol et al. (1985) on discussion
and empirical evidence about progressive and stagnant services.

49
For the first time in the literature, I have shown that a PBGP can exist even when
factors are reallocated across sectors that differ by capital intensity. I name the
cross-capital-intensity structural change that is compatible with a PBGP “neutral
structural change”.
To test the actual neutrality of structural change I developed an index of neutrality.
In fact, my measure of neutrality indicates the weighting between two measures
( )neutral
l~
∆ and ( )max~l∆ . ( )neutral
l~
∆ measures the hypothetical change in l~
that would
result, if the empirically observed amount of reallocated labor ( l∆ ) were
reallocated in the neutral way. ( )max~l∆ measures the hypothetical change in l
~ that
would result, if l∆ were reallocated in the maximally non-neutral way. Hence, the
weighting between these two measures implies how much labor has been
reallocated in the neutral way and how much labor has been reallocated in the non-
neutral way between 1948 and 1987. This index implies that 55% of structural
change can be regarded as neutral. I provided also some theoretical/verbal
arguments which imply that over the (very) long run significantly more than 55%
of the structural change is neutral (see section 5).
I also made a first step towards a micro-foundation of neutrality of structural
change by showing that neutral structural change can arise if preferences and
technologies are uncorrelated. Therefore, my neutrality index could also be
interpreted as an index of correlation between technology and preferences. In this
sense, my empirical findings imply that the correlation between preferences and
technologies is rather low. (Exactly speaking, the actual correlation was closer to
the extreme of “no correlation” than to the extreme of “maximal correlation”).
Note that I could try to assess the degree of correlation between preferences and
technologies in an alternative way: First I would have to estimate the price

50
elasticity of demand, the income elasticity of demand and the production functions
for all sectors and then I would have to try to somehow figure out the degree of
correlation between the estimated preference and technology parameters. This
approach would be problematic for two reasons:
(1) Estimation of preference parameters (and especially of income elasticity of
demand) is very difficult, since there are problems in measuring the changes in
quality of goods and services. Hence, it is difficult to isolate whether demand for a
good increased due to relatively high income-elasticity of demand or due to an
increase in quality of the service; see e.g. Ngai and Pissarides (2007).
(2) Even if I could measure the preference and technology parameters exactly there
would be a problem in defining a measure of correlation between preferences and
technologies, since we have actually two sorts of preference parameters (income
elasticity of demand and price elasticity of demand). Hence, if we have two
economies (A and B), which are identical except for their correlation between
income elasticity and technology and between price elasticity and technology, it
would be difficult to say in which economy the correlation between preferences
and technologies is lower: For example, if the correlation between income elasticity
and technology is slightly lower in country A in comparison to country B and if the
correlation between price elasticity and technology is slightly lower in country B in
comparison to country A, we could not say whether preferences and technologies
are more or less correlated in country A in comparison to country B. My approach
omits this problem by focusing on the factor reallocation across technology, which,
as modeled in my paper, reflects the degree of correlation between preferences and
technologies.
Furthermore, note that my empirical findings are valid for all the literature that
analyses structural change along PBGP’s (and where capital is included into

51
analysis): I have shown in Proposition 4 that every PBGP, that satisfies the Kaldor-
facts (exactly), must feature neutral structural change. Hence, we can say that the
papers by Kongsamut et al. (2001), Ngai and Pissarides (2007) and Foellmi and
Zweimueller (2008) are compatible with 55% of structural change observed.
Overall, my explanation for the Kuznets-Kaldor-puzzle is the following: There is a
certain degree of independency between technologies and preferences. As
discussed in the previous section, over the very long run such independency comes
from the assumption that the household’s consumption decisions are based on the
physical and chemical properties of the goods, but not on the capital-intensity (i.e.
households are not interested in the production process of the consumption goods
but only on the “taste” of the goods). If preferences and technologies are
uncorrelated (or independent), structural change patterns can arise that satisfy all
the empirical observations associated with the Kuznets-Kaldor-puzzle (especially
factors are reallocated across sectors that differ by capital intensity). I show that
this explanation is compatible with 55% of the structural change.
The remaining task is to answer the question why the remaining 45% of the
structural change are compatible with the Kuznets-Kaldor-Puzzle. One answer may
be that these 45% are quantitatively small hence their aggregate impact is relatively
low (in comparison to the other aggregate-growth determinants, e.g. technological
progress) at least at the level of stylized facts. In fact, this is implied by the paper
by Acemogly and Guerrieri (2008). However, there may be other explanations as
well. For example, the aggregate effect of these 45% of structural change may be
offset by the aggregate effects of other growth determinants, e.g. some sort of
“economy-wide technological progress” may have accelerated between 1948 and
1987 which would have offset the (negative) impacts of non-neutral structural
change. Further research could analyze this question in more detail. Furthermore, it

52
seems interesting to search for other micro-foundations of neutral structural
change: I explained the parameter restrictions, which are necessary for the
existence of neutral structural change, by uncorrelated preferences and
technologies; however, there are certainly other micro-foundations that can explain
these parameter restrictions.

53
APPENDIX A There are two approaches to solve my model, which are known from the literature
on the Ramsey-Cass-Koopmans model: (1) I can assume that there is a social
planer who maximizes the welfare of the representative household (“benevolent
dictator”); or (2) I can assume that there are many marginalistic households and
entrepreneurs who maximize their life-time utility and profits in perfect markets.
Both ways of solution lead to the same first order optimality conditions. I explain
approach (1) in short and focus on the approach (2).
APPROACH (1):
Necessary (first order) conditions for an optimum
The benevolent dictator maximizes the utility function of the representative
household (equations (8)-(11)) subject to the equations (1)-(7) and (12)-(16).
The Hamiltonian for this control problem is given by:
( ) )(,..., 21 mmmHn hCKYCCCuHAM −−−+= δψ
where Hψ is the co-state variable.
The variables of this Hamiltonian are determined as follows:
iC are given by mihYC iii ≠∀−= , (cf. (5)),
iY are given by (1) and (2),
Z is given by (7)
mk is given by ∑≠
−=mi
im kk 1 (cf. (3)),
ml is given by ∑≠
−=mi
im ll 1 (cf. (3)),
mz is given by ∑≠
−=mi
im zz 1 (cf. (3))

54
Control variables are:
m
n
nmm
nmm
nmm
C
hh
zzzzz
kkkkk
lllll
,,...
,,...,,...,
,,...,,...,
,,...,,...,
1
1121
1121
1121
+−
+−
+−
K is state variable.
The first order optimality condition can be derived by
• setting the first derivatives of the Hamiltonian with respect to the control
variables equal to zero
• setting the first derivative of the Hamiltonian with respect to the state
variable equal to HH ψρψ &− .
Then after some algebra, the first order optimality conditions (17)-(19) can be
obtained. Q.E.D. I omit this derivation, since it is trivial.
Proof that sufficient (second order) conditions are satisfied
Note that the proof that the first order conditions are sufficient for an optimum is
quite difficult in this APPROACH (1). Especially the proof of concavity in Step 1
becomes quite “impossible” as we will see. Therefore, the following proof of
sufficiency of the optimality conditions may be regarded as incomplete. As we
will see, in APPROACH (2) this problem does not arise.
To prove the sufficiency of these necessary conditions I use the Arrow-Kurz-
criterion, which can be applied in three steps. Note that in the following I omitted
intermediates production, i.e. 0== µγ , for simplicity. (Analogous results can be
obtained with intermediate production.)

55
Step 1: Maximize the Hamiltonian with respect to the control variables for
given state variable, co-state variable and time.
In fact, this implies 0!
=∂
∂
mC
HAM and (17). The latter together with (1), (2), (3) and
(12) implies (21), (24) and (25).
From (9) and (17) I obtain
(A.1) ip
CC i
i
mm
m
ii ∀+
−= θ
θ
ω
ω
Inserting this equation into (12) yields
(A.2) m
mmCE
ω
θ−=
Inserting (A.1) and (A.2) into (9) yields after some algebra:
(A.3) ωω +−= nn pEu lnln(.)
where ∑+=
≡n
mi
in
1
ωω and ∑≡i
ii )ln(ωωω
and where I have obtained from (1), (2) and (17)
(A.4)
νβ
αχ
νχ
ν
β
χ
α−
−
≡
m
m
nLl
KkABp
/1
Equations (9) and (A.2) and condition 0!
=∂
∂
mC
HAM imply
(A.5) E
H
1=ψ
Now note that we have just derived the first order conditions for a maximum.
These conditions are sufficient only if the Hamiltonian is jointly concave in the
control variables for given state variable, co-state variable and time. This requires
determining the signs of the first minors of the Hessian determinant of the
Hamiltonian (with respect to the control variables for given state variable, co-state

56
variable and time); see e.g. Chiang 1984, p.336. Since we have an arbitrary (and
large) number of state variables this becomes impossible (at least for me), due to
the difficulties in calculating determinants. (Note that sometimes these difficulties
do not arise if the Hessian is a diagonal matrix. However, in my model it is not.)
Therefore, Step 1 may be regarded as incomplete. I have not researched for a
solution of this problem, since, as mentioned above, the model can be solved by
using APPROACH (2). The proofs of sufficiency in APPROACH (2) are feasible
for me.
Step 2: Insert the optimality conditions from Step 1 into the Hamiltonian, in
order to obtain ),,(~~
timeKMAHMAH Hψ= !
Inserting (A.3) and (A.5) into the Hamiltonian yields:
(A.6)
−−++−
= KYptKMAH
H
Hnn
H
H δψ
ψωωψ
ψ1
ln1
ln),,(~
where np can be derived as (implicit) function of Hψ by using equations (A.4),
(24), (21) and (A.5) (remember that in equation (24) H=0, due to (23) and
0== µγ ) and
where Y can be derived as (implicit) function of Hψ by using equations (25), (21),
(24) and (A.5) (again, remember that in equation (24) H=0, due to (23) and
0== µγ ).
Step 3: Show that ),,(~~
tKMAHMAH Hψ= is concave in K for given Hψ and
time, by showing that 0)(
),,(~
2
2
<∂
∂
K
tKMAH Hψ.

57
This step is quite lengthy and includes calculating implicit derivatives, but straight
forward. After some algebra it can be shown that
(A.7) 0)1(
1
)(
)(
),,(~
2
2
2
2
<+
−
+
−−=
∂
∂β
αβ
αχωψ
m
m
m
m
nH
l
k
l
kK
K
tKMAH
This relation is true, since equation (24) implies that 0)(1 <>−m
m
l
k if 0)(<>−αχ
(remember that in equation (24) H=0, due to (23) and 0== µγ ).
Since we have accomplished all three steps, the Arrow-Kurz-criterion implies
that conditions (17)-(19) are sufficient for an optimum (together with the
transversality condition). Q.E.D. (Remember, however, that there are some
difficulties in Step 1, as explained there.)
APPROACH (2)
As mentioned above in this section I assume that there exist many marginalistic
and identical households and producers. (Of course the producers are identical
within a sector, while they differ across sectors.) The assumption of marginalistic
agents implies that all agents consider the prices and factor prices as exogenous;
i.e. all agents are “price-takers”. The prices, factor prices and quantities are
determined by laws of (aggregate) demand and (aggregate) supply on the
corresponding markets (where market clearing is assumed).
This interpretation of the Ramsey-Cass-Koopmans model is suggested by Cass
(1965) and it is well known in the literature (see any book on growth economics,
e.g. Barro and Sala-i-Martin (2004), pp.86ff).

58
Remember, however, that although APPROACH (1) and APPROACH (2) interpret
my model in different ways, both approaches yield the same first order optimality
conditions (and results in general).
For simplicity I omit intermediates production in this section, i.e. I set 0== µγ .
(Analogous results can be obtained with intermediate production.)
Producers
Since I have assumed that each sector is polypolistic and since there is perfect
mobility of factors across sectors, we know that the value of marginal factor-
productivity in each sector must be equal to the (economy-wide) factor-price, i.e.
(A.8) iwLl
Yp
i
ii ∀=∂
∂,
)(
(A.9) irKk
Yp
i
ii ∀=∂
∂,
)(
where w is the real wage rate and r is the real rate of return on capital; see also,
e.g., Kongsamut et al. (2001). These conditions can be obtained by maximizing the
sector-profit function KrkLwlYp iiii −− with respect to factor inputs Lli and
Kki , while sector demand, sector-price and factor-prices are exogenous. (That is,
the sector behaves like a price-taker; the reason for this fact is that all entrepreneurs
of the sector are price-takers. This fact could be proved by modeling explicitly each
sector as consisting of identical marginalistic profit-maximizing producers; then
conditions (A.8) and (A.9) could be obtained by calculating the first-order
conditions for profit-maximization of each individual producer and by aggregating
over all producers of a sector.)
We know that the wage rate and the rental rate of capital are equal across sectors
due to the following fact: differences in factor-prices across sectors are eliminated

59
instantly by cross-sector factor-migration due to the assumption of perfect cross-
sector factor-mobility.
Equations (A.8) and (A.9) imply jiLl
Yp
Ll
Yp
j
j
j
i
ii ,,
)()(∀
∂
∂=
∂
∂ and
jiKk
Yp
Kk
Yp
j
j
j
i
ii ,,
)()(∀
∂
∂=
∂
∂. This in turn implies for mj = due to (13):
(A.10) iKkY
KkY
LlY
LlYp
ii
mm
ii
mmi ∀
∂∂
∂∂=
∂∂
∂∂= ,
)(/
)(/
)(/
)(/
which is part of optimality condition (17) (Q.E.D.).
Inserting (1) and (2) into (A.10) yields
(A.11) mipi ,...1,1 ==
(A.12) nmipLl
KkABp n
m
mi ,...1,/1 +=≡
=
−
−
νβ
αχ
νχ
ν
β
χ
α
Households
In this section the index ι denotes the corresponding variable of the individual
household. For example, while E stands for consumption expenditures of the
whole economy, ιE stands for consumption expenditures of the household ι . I
assume that there is an arbitrary and large number of households ( x,...1=ι ),
sufficiently large to constitute marginalistic behavior of households. Hence, it
follows from equations (8)-(11) that each household has the following utility
(A.13) ιριιι ∀= ∫∞
− ,),...(0
1 dteCCuUt
n , 0>ρ
where
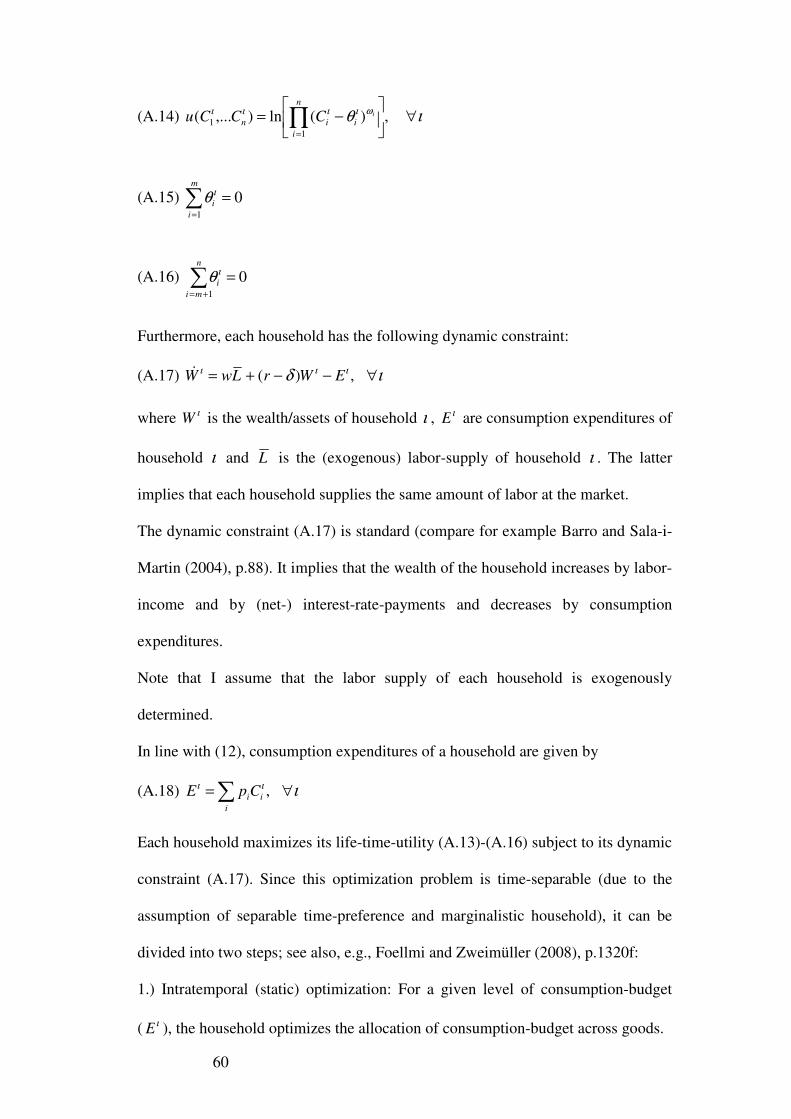
60
(A.14) ιθ ωιιιι ∀
−= ∏
=
,)(ln),...(1
1
n
i
iiniCCCu
(A.15) ∑=
=m
i
i
1
0ιθ
(A.16) ∑+=
=n
mi
i
1
0ιθ
Furthermore, each household has the following dynamic constraint:
(A.17) ιδ ιιι ∀−−+= ,)( EWrLwW&
where ιW is the wealth/assets of household ι , ιE are consumption expenditures of
household ι and L is the (exogenous) labor-supply of household ι . The latter
implies that each household supplies the same amount of labor at the market.
The dynamic constraint (A.17) is standard (compare for example Barro and Sala-i-
Martin (2004), p.88). It implies that the wealth of the household increases by labor-
income and by (net-) interest-rate-payments and decreases by consumption
expenditures.
Note that I assume that the labor supply of each household is exogenously
determined.
In line with (12), consumption expenditures of a household are given by
(A.18) ιιι ∀=∑ ,i
iiCpE
Each household maximizes its life-time-utility (A.13)-(A.16) subject to its dynamic
constraint (A.17). Since this optimization problem is time-separable (due to the
assumption of separable time-preference and marginalistic household), it can be
divided into two steps; see also, e.g., Foellmi and Zweimüller (2008), p.1320f:
1.) Intratemporal (static) optimization: For a given level of consumption-budget
( ιE ), the household optimizes the allocation of consumption-budget across goods.

61
2.) Intertemporal (dynamic) optimization: The household determines the optimal
allocation of consumption-budget across time.
Intratemporal optimization:
The household maximizes its instantaneous utility (A.14)-(A.16) subject to the
constraint (A.18), where it regards the consumption-budget ( ιE ) and prices ( ip ) as
exogenous. (Remember that the household is price-taker.) The corresponding
Lagrange-function is given by
ιψθ ιιωιι ∀
−−
−= ∑∏
=
,)(ln1 i
iiL
n
i
ii CpECLG i
where Lψ is the LaGrange-multiplier (shadow-price).
The first order necessary optimality conditions are given by
(A.19) ιψθ
ωιι
,,0 ipC
iL
ii
i ∀=−−
These conditions are also sufficient for an optimum (maximum), since the target
function is concave and the restriction linear. (The non-negativity constraints are
studied in the phase diagram in APPENDIX C.)
From (A.19) and (13), we have
(A.20) ιθθ
ω
ω ιιι
ι ,, ip
CC i
i
mm
m
ii ∀+
−=
Inserting (A.20) into (A.18) yields
(A.21) ιω
θιι ∀
−= ,
m
mmCE
Intertemporal optimization

62
Inserting (A.11), (A.12), (A.20) and (A.21) into (A.14)-(A.16) yields after some
algebra:
(A.22) ιωωι ∀+−= ,lnln(.) nn pEu
where ∑+=
≡n
mi
in
1
ωω and ∑≡i
ii )ln(ωωω
Now, we have determined the instantaneous utility as function of consumption-
budget (and prices). (Remember that the household is price-taker, i.e. prices are
exogenous from the household’s point of view.) Inserting (A.22) into (A.13) yields
(A.23) ( ) ιωω ριι ∀+−= ∫∞
− ,lnln0
dtepEUt
nn
Thus, the intertemporal optimization problem is to optimize (A.23) subject to the
dynamic constraint (A.17). This is a typical optimal control problem. The
Hamiltonian for this problem is as follows:
(A.24) [ ] ιδψωω ιιι ∀−−+++−= ,)(lnln EWrLwpEHAM Hnn
where Hψ is the co-state variable. ιE is control-variable and ιW is state variable.
The prices ( np ) and factor prices ( w and δ−r ) are regarded by the household as
exogenous (since the household is marginalistic and thus price-taker.) Remember
that L is exogenous. It may be confusing that np is time varying (while being
regarded as exogenous in the optimal control problem of the household). However,
this fact does not prevent us from using the Hamiltonian, since the Hamiltonian
function allows in general that time enters the target function explicitly (i.e. via
exogenous “parameters”); see e.g. Gandolfo (1996), p.375, on a general
formulation of the control-problems that are solvable by using the Hamiltonian.

63
The first order optimality conditions are given by 0!
=∂
∂ι
E
HAM and
HHW
HAMρψψ
ι+=
∂
∂− &
!
. These conditions imply (after some algebra) that
(A.25) ιρδι
ι
∀−−= ,rE
E&
Note that this first order condition is also a sufficient condition for an optimum.
This can be immediately concluded from the Hamiltonian. Equation (A.25) has the
same concavity features as the Hamiltonian of the standard one-sector Ramsey-
Cass-Koopmans model. Especially, the target function is concave in the control-
variable and the restriction (i.e. the term within the squared brackets) is linear in
the control and the state variable. Therefore, we know that the Hamiltonian is
concave; therefore, the optimality conditions are sufficient. Q.E.D.
Relationship between individual variables and economy-wide aggregates
Aggregate consumption expenditures are given by
(A.26) ∑∑ ==i
iiCpEE ι
ι
ι
where the following relation holds:
(A.27) iCC ii ∀=∑ ,ι
ι
There is no unemployment, i.e.
(A.28) ∑=ι
LL
Last not least, since the wealth/assets can only be invested in production-capital
(K), the following relation must be true
(A.29) ∑=ι
ιWK

64
(see also, e.g. Barro and Sala-i-Martin (2004), p.97). That is, all assets are invested
in capital (capital-market-clearing).
Furthermore, the “subsistence needs” of the whole economy are simply equal to the
sum of the subsistence needs of its individuals, i.e.
(A.30) iii ∀=∑ ,ι
ιθθ
Equation (A.20), (A.27) and (A.30) imply
(A.31) ip
CC i
i
mm
m
ii ∀+
−= ,θ
θ
ω
ω
This equation corresponds to equation (18). Q.E.D. Exactly speaking, inserting
(9) into (18) yields (A.31).
(A.25) and (A.26) imply
(A.32) ρδ −−= rE
E&
This equation corresponds to equation (19). Q.E.D. Exactly speaking, (19) can
be transformed into (A.32) by using (1), (2), (8)-(12), (17) and (18).

65
APPENDIX B Equations (20) to (29) are relevant for aggregate analysis. Now let us search, like in
the “normal” Ramsey model, for a growth path where E and K grow at constant
rate, i.e.
(B.1) EgE
E !
=&
(B.2) KgK
K !
=&
Equations (B.1) and (22) imply that
(B.3) .constL
L
l
l
K
K
k
k
m
m
m
m =−−+&&&&
Requirement (B.3) and equation (21) imply that
(B.4) .~
~
constY
Y=
&
(B.2) and (B.3) imply
(B.5) ( )
./
/const
lk
lk
mm
mm =&
(B.1), (B.2) and (B.4) imply
(B.6) ( )
.~/
~/
constYE
YE=
&
and ( )
.~/
~/
constYK
YK=
&
Equations (B.2), (20) and (25) imply
(B.7) Y
Kg
Y
H
Y
E
k
lcc K
m
m~)(~~65 δ+++=+

66
Solving equation (24) for Y
H~ and inserting it into equation (B.7) yields after some
algebra:
(B.8) Y
Kg
k
l
cc
Y
E
c
c
cc K
m
m~)(
1~1
1
4
6
4
3
4
5 δ++
+−
−=−
Remember that Kgcccc ,,,, 6543 and δ are constants. Furthermore, note that
(B.5) and (B.6) imply that m
m
k
l
Y
E,~ and
Y
K~ grow at constant rate. Hence, equation
(B.8) can be satisfied at any point of time only if m
m
k
l
Y
E,~ and
Y
K~ are constant (i.e.
they grow at the constant rate zero), i.e.
(B.9) ..,~ constk
lconst
Y
E
m
m == , .~ constY
K=
Equations (B.9), (23), (25) imply
(B.10) .~
~
constH
H
Y
Y
K
K
Y
Y
E
E=====
&&&&&
Q.E.D.
Let *g denote the constant growth rate from equation (B.10). Hence, (B.9), (B.10),
(21) and (26) imply
(B.11) Lgq
G
G
g +−
=1
*
&
Inserting equations (27) and (28) into equation (B.11) yields after some algebra:
(B.12) LBA g
ggg +
+−
+−=
χεγαεµ
εγεµ
)1(
)1(*
Q.E.D.

67
Note that in all the calculations from above I searched for an equilibrium growth
path where E and K grow at constant rate. As a result I obtained that H grows at
constant rate along this growth path. Hence, I can treat H like exogenous
technological progress along this growth path. Let HYY −≡ˆ . In this case equation
(20) can be written as follows:
(B.13) EKKY ++= δ&ˆ
Q.E.D.
Inserting equations (21), (23) and (25) into HYY −≡ˆ yields:
(B.14) qqKLGY
−= 1~ˆ
where
−+−
≡
m
m
q
m
m
k
lcccc
l
kGG )(
~2615 γγ grows at constant positive rate due to
(B.9) ( G~
grows at constant positive rate). Q.E.D.
Inserting equation (B.14) into equation (22) yields:
(B.15) ρδλ −−=K
Y
E
E ˆ&
where
−+−≡
m
m
m
m
k
lcccc
k
l)( 2615 γγβλ is constant due to (B.9). Q.E.D.
Equations (B.14) and (B.15) include the term mm kl / . This term is constant along
the equilibrium growth path and can be derived as function of model parameters by
setting equation (22) equal to *g and solving afterwards for mm kl / :
(B.16) K
LG
g
l
k qq
m
m −−
++= 1
11
1*
β
ρδ

68
Note that the term LG q−1
1
is a function of exogenous parameters and grows at rate
*g (see equation (B.11) for *g ). K grows at rate *g along the equilibrium growth
path as well (see Lemma 1). Hence, the term K
LG q−1
1
is constant along the
equilibrium growth path, so that I can rewrite equation (B.16) in terms of initial
values of exogenous parameters (the index zero denotes the initial value of the
corresponding variable):
(B.17) 0
01
1
0
1
1*
)(K
LG
g
l
k qq
m
m −−
++=
β
ρδ
where q, 0G and *g are given by equations (27), (28) and (B.12). Q.E.D.
I have shown now that along an equilibrium growth path where E and K grow at
constant rate H grows at constant rate as well and mm lk / is constant. When this
fact is taken into account, the economy in aggregates is represented by equations
(B.13)-(B.15). These equations are similar to the Ramsey-model regarding all
relevant features; hence, they imply that this equilibrium growth path exists and is
unique. Q.E.D.

69
APPENDIX C First, I show by using linear approximation that the saddle-path-feature of the
PBGP is given (Proposition 1a). Then I prove local stability by using a phase
diagram (Proposition 1b).
Existence of a saddle-path (Proposition 1a)
First I rearrange the aggregate equation system (20)-(29) as follows:
(C.1) Kq
ggEK
k
l
k
lK G
L
q
m
m
q
m
m ˆ)1
(ˆˆ)(ˆ−
++−−+
=
−
δβα&
(C.2) q
ggK
k
l
E
E G
L
q
q
m
m
−−−−−
= −
−
1ˆ
ˆ
ˆ1
1
ρδβ&
(C.3)
α
χεγεµ
ωαβ
ανχβ
β
νεγεµ
+−
−−+−
=
−
1
ˆ
ˆ1
q
m
mq
n
m
mk
lK
E
k
l
where aggregate variables are expressed in “labor-efficiency units”, i.e. they are
divided by qLG −1
1
; hence
qLG
KK
−
≡1
1ˆ and
qLG
EE
−
≡1
1ˆ . Furthermore, Gg is the
growth rate of G given by (28) and ∑+=
≡n
mi
in
1
ωω .
These equations imply that EK ˆ,ˆ and mm kl / have the following values along the
PBGP
(C.4)
*
1
1
*ˆ
= −
m
mq
k
lK σ
(C.5)
*
1
1
1*ˆ
+= −−
m
mqq
q
k
lE ρσασ

70
(C.6)
σβ
ρωανχβεµαχγα
ωανχβεµβνγβ
β
α
n
n
m
m
k
l
)()(
)()(*
−+−+
−−−+=
where
q
gg G
L−
+++
≡
1ρδ
βσ
where an asterisk denotes the PBGP-value of the corresponding variable.
The proof of local saddle-path-stability of the PBGP is analogous to the proof by
Acemoglu and Guerrieri (2008) (see there for details and see also Acemoglu
(2009), pp. 269-273, 926).
First, I have to show that the determinant of the Jacobian of the differential
equation system (C.1)-(C.2) (where mm kl / is given by equation (C.3)) is different
from zero when evaluated at the PBGP (i.e. for
*
** ,ˆ,ˆ
m
m
k
lEK from equations
(C.4)-(C.6)). This implies that this differential equation system is hyperbolic and
can be linearly approximated around
*
** ,ˆ,ˆ
m
m
k
lEK (Grobman-Hartman-Theorem;
see as well Acemoglu (2009), p. 926, and Acemoglu and Guerrieri (2008)). The
determinant of the Jacobian is given by:
(C.7) E
K
K
E
E
E
K
K
E
E
K
E
E
K
K
K
Jˆ
ˆ
ˆ
ˆ
ˆ
ˆ
ˆ
ˆ
ˆ
ˆ
ˆ
ˆ
ˆ
ˆ
ˆ
ˆ
∂
∂
∂
∂−
∂
∂
∂
∂=
∂
∂
∂
∂
∂
∂
∂
∂
=&&&&
&&
&&
The derivatives of equations (C.1)-(C.2) are given by:
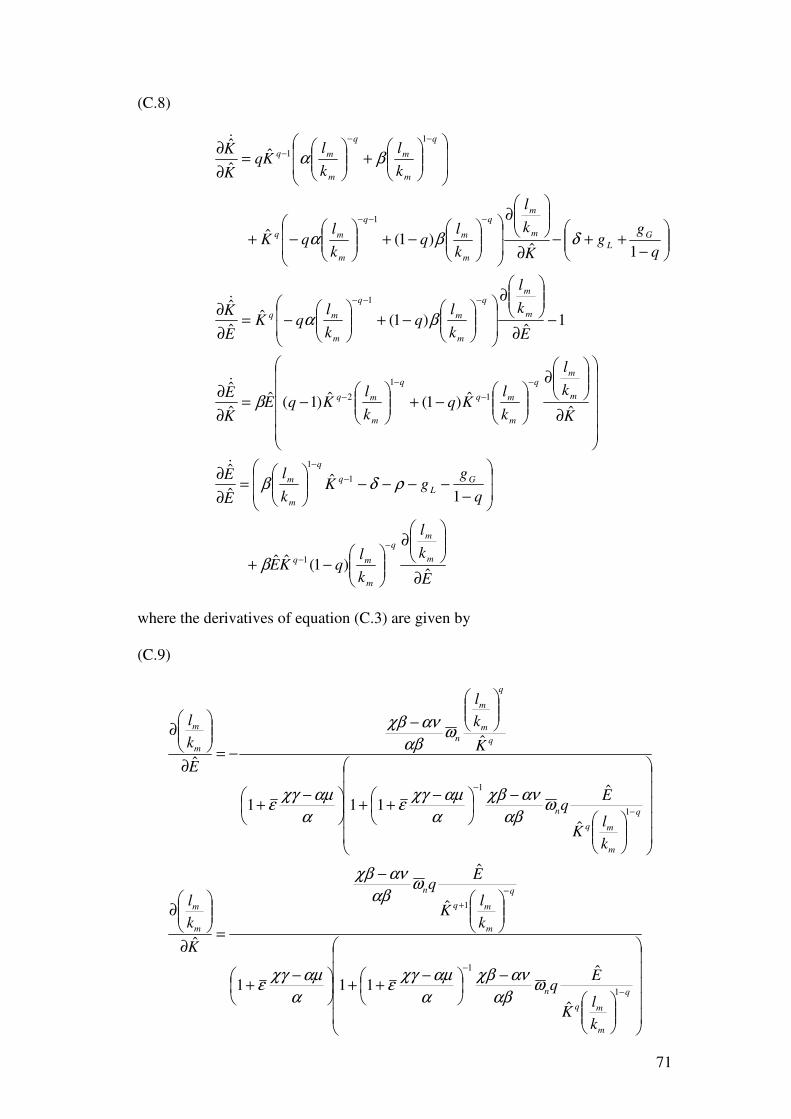
71
(C.8)
E
k
l
k
lqKE
q
ggK
k
l
E
E
K
k
l
k
lKq
k
lKqE
K
E
E
k
l
k
lq
k
lqK
E
K
q
gg
K
k
l
k
lq
k
lqK
k
l
k
lKq
K
K
m
mq
m
mq
G
L
q
q
m
m
m
mq
m
mq
q
m
mq
m
mq
m
m
q
m
mq
G
L
m
mq
m
m
q
m
mq
q
m
m
q
m
mq
ˆ)1(ˆˆ
1ˆ
ˆ
ˆ
ˆˆ)1(ˆ)1(ˆ
ˆ
ˆ
1ˆ
)1(ˆˆ
ˆ
1ˆ)1(ˆ
ˆˆ
ˆ
1
1
1
1
1
2
1
1
1
1
∂
∂
−+
−−−−−
=
∂
∂
∂
∂
−+
−=
∂
∂
−∂
∂
−+
−=
∂
∂
−++−
∂
∂
−+
−+
+
=
∂
∂
−
−
−
−
−
−
−
−
−−−
−−−
−−
−
β
ρδβ
β
βα
δβα
βα
&
&
&
&
where the derivatives of equation (C.3) are given by
(C.9)
−
−++
−+
−
=∂
∂
−
−++
−+
−
−=∂
∂
−
−
−
+
−
−
q
m
mq
n
q
m
mq
n
m
m
q
m
mq
n
q
q
m
m
nm
m
k
lK
Eq
k
lK
Eq
K
k
l
k
lK
Eq
K
k
l
E
k
l
1
1
1
1
1
ˆ
ˆ111
ˆ
ˆ
ˆ
ˆ
ˆ111
ˆ
ˆ
ωαβ
ανχβ
α
αµχγε
α
αµχγε
ωαβ
ανχβ
ωαβ
ανχβ
α
αµχγε
α
αµχγε
ωαβ
ανχβ

72
Inserting the derivatives (C.8) and (C.9) into (C.7) and inserting the PBGP-values
from equations (C.4)-(C.6) yields after some algebra the following value of the
determinant of the Jacobian evaluated at the PBGP:
(C.10)
( )
q
m
mq
n
n
n
k
lK
Eq
K
Eq
J
−
−+
−+−−−
=
1*
*
*
*
*
*
)ˆ(
ˆ
)(ˆ
ˆ)1(
ωβ
ανχβα
σ
β
ωανχβ
αρωανχβ
where ( ) 0>−+≡ αµχγεαα and q is given by equation (27).
This equation can be transformed further by using equations (27) and (C.4)-(C.6):
(C.11)
( )[ ]
α
β
β
αα
ωανχββσ
α
2*
*
*
* ˆ
ˆ
+
−−−=
m
m
n
k
l
K
E
J
where ( ) 0>−+≡ βµνγεββ . Note that *
*
ˆ
ˆ
K
E and
*
m
m
k
lare positive and are given
by equations (C.4)-(C.6). Furthermore, note that following relations, which are
useful for deriving equation (C.11), are true: εµγγβα )(1 −+−=+ , βα
β
+=q
(from (27)) and
σβ
ρωανχβα
ωανχββ
β
α
n
n
m
m
k
l
)(
)(*
−+
−−=
(from (C.6)).
We can see that the determinant evaluated at PBGP is different form zero. Hence,
the PBGP is hyperbolic. Furthermore, equations (C.10) and (C.11) imply that
0*
<J . (Equation (C.10) implies that 0*
<J , if 0>− ανχβ ; equation (C.11)
implies that 0*
<J , if 0<− ανχβ as well.)
Our differential equation system consists of two differential equations ((C.1) and
(C.2)) and of two variables ( E and K ), where we have one state and one control-

73
variable. Hence, saddle-path-stability of the PBGP requires that there exist one
negative (and one positive) eigenvalue of the differential equation system when
evaluated at PBGP (see also Acemoglu and Guerrieri (2008) and Acemoglu (2009),
pp. 269-273). Since 0*
<J we can be sure that this is the case. ( 0*
<J can exist
only if one eigenvalue is positive and the other eigenvalue is negative. If both
eigenvalues were negative or if both eigenvalues were positive, the determinant
*J would be positive.) Therefore, the PBGP is locally saddle-path-stable, i.e.
Proposition 1a is proved. Q.E.D.
Local stability (Proposition 1b)
In the following, I omit intermediates for simplicity, i.e. I set 0== µγ .
Furthermore, I study here only the case where output-elasticity of capital in
investment goods industries (i=m) is relatively low in comparison to the output-
elasticity of capital in the consumption goods industries ( mi ≠∀ ), i.e. I assume
αχ < . This is consistent with the empirical evidence presented and discussed in
Valentinyi and Herrendorf (2008) (see there especially p.826). Note, however, that
the qualitative stability results for the other case (i.e. αχ > ) are the same.
To show the stability-features of the PBGP, the three-dimensional system (C.1)-
(C.3) has to be transformed into a two dimensional system, in order to allow me
using a phase-diagram. By defining the variable m
m
l
kK≡κ , the system (C.1)-(C.3)
can be reformulated as follows (after some algebra):
(C.12)
−+++−= −
βρδβκ β
1ˆ
ˆ1 G
L
gg
E
E&

74
(C.13)
β
ββ
κω
β
χα
ρκωαβ
χα
κβδκ
κ
κ
E
Egg
n
n
G
L
ˆ1
1ˆ
)1
( 11
−+
−−−
−++−
=
−−
&
where ∑+=
≡n
mi
in
1
ωω
I can focus attention on showing that the stationary point of this differential
equation system is stable: The discussion in APPENDIX B implies that κ and E
are jointly in steady state only if K , E and mm lk / are jointly in steady state and
that K , E and mm lk / are jointly in steady state only if κ and E are jointly in
steady state. Therefore, the proof of stability of the stationary point of system
(C.12)-(C.13) implies stability of the stationary point of system (C.1)-(C.3). Hence,
in the following I will prove stability of the stationary point of system (C.12)-
(C.13).
It follows from equations (C.12) and (C.13) that the steady-state-loci of the two
variables are given by
(C.12a)
β
βρδ
βκ
−
−+++
==
1
1
*
1
:0ˆ
ˆ
GL
ggE
E&
(C.13a) κ
κωαβ
χαρ
βδκ
κ
κ
β
β
κ−
−
= −−
−++−
==1
1
0
1
)1
(ˆ:0
n
G
L
gg
E&
&
Now, I could depict the differential equation system (C.12)-(C.13) in the phase
space ( κ,E ). Before doing so, I show that not the whole phase space ( κ,E ) is
economically meaningful. The economically meaningful phase-space is restricted
by three curves ( 321 ,, tt RRR ), as shown in the following figure and as derived below:

75
Figure C.1: Relevant space of the phase diagram
Only the space below the 1R -line is economically meaningful, since the
employment-share of at least one sub-sector i is negative in the space above the
1R -line. This can be seen from the following fact:
It follows from equations (1), (2), (3) and (17) after some algebra that
(C.14) ∑+=
−−=
n
mi
i
m
m lk
l
1
1χβ
ανχβ
Note that αχανχβ −=− when 0== µγ .
Since, il cannot be negative (hence , 101
≤≤ ∑+=
n
mi
il ) this equation implies that
(C.15) χβ
αν<
m
m
k
l
Inserting equation (24) into this relation yields
(C.16) βκωχ
α
n
ER1ˆ:1 <
κ
E
1R
3
0=tR
2
0=tR

76
(remember that in equation (24) H=0, due to (23) and 0== µγ ).
Hence, the space above 1R is not feasible. When the economy reaches a point on
1R , no labor is used in sub-sectors i=1,…m. If I impose Inada-conditions on the
production functions, as usual, this means that the output of sub-sectors i=1,…m is
equal to zero, which means that the consumption of these sectors is equal to zero.
Our utility function implies that life-time utility is infinitely negative in this case.
Hence, the household prefers not to be at the 1R -curve. Note that actually the 1R -
curve is only an outer limit: Since we have existence-minima in our utility
function, the utility function becomes infinitely negative when the consumption of
one of these goods falls below its subsistence level. Hence, even when the
consumption of all goods is positive, it may be the case that the utility function is
infinitely negative due to violation of some existence minima. Therefore, the actual
constraint is somewhere below the 1R -curve. However, this fact does not change
the qualitative results of the stability analysis.
Now I turn to the 2
tR and 3
tR -curves. I have to take account of the non-negativity-
constraints on consumption ( iCi ∀> 0 ), since our Stone-Geary-type utility
function can give rise to negative consumption. By using equations (A.1), (A.2)
(A.11) and (A.12) from APPENDIX A and equations (27) and (28) the non-
negativity-constraints ( iCi ∀> 0 ) can be transformed as follows (remember that I
assume here 0== µγ ):
(C.17) mi
LA
Ei
i ,...11ˆ
1=
−>
αω
θ
(C.18) nmi
LBA
Ev
i
i ,...111ˆ
2+=
−>
−− β
α
βν
χ
κν
β
χβ
αν
ω
θ

77
This set of constraints implies that at any point of time only two constraints are
binding, namely those with respectively the largest i
i
ω
θ−. Hence, the set (C.17),
(C.18) can be reduced to the following set:
(C.19) α
ω
θ1
2 1ˆ:
LA
ERj
j
t
−>
where mii
i
j
j,...1=
−>
−
ω
θ
ω
θ
and mj ≤≤1 .
(C.20) β
α
βν
χ
κν
β
χβ
αν
ω
θ−−
−>
v
x
xt
LBA
ER11ˆ:
2
3
where nmii
i
x
x ,...1+=−
>−
ω
θ
ω
θ
and nxm ≤≤+1
These constraints are time-dependent. It depends upon the parameter setting
whether 2
tR or whether 3
tR is binding at a point of time. In Figure C.1 I have
depicted examples for these constraints for the initial state of the system. Only the
space above the constraints is economically meaningful, since below the
constraints the consumption of at least one good is negative. Last not least, note
that equations (C.19)/(C.20) imply that the 2
tR -curve and the 3
tR -curve converge to
the axes of the phase-diagram as time approaches infinity.
Now, I depict the differential equation system (C.12)-(C.13) in the phase space
( κ,E ).

78
Figure C.2: The differential equation system (C.12)-(C.13) in the phase-space for
βδχαρω
αβ
−++
<−
1
1
)( GL
ng
g
Note that I have depicted here only the relevant (or: binding) parts of the
restriction-set of Figure C.1 as a bold line R.
As we can see, the 0=κ& -locus has a pole at β
χαρω
αβκ
−
−=
1
1
)(n
pole .
The phase diagram implies that there must be a saddle-path along which the system
converges to the stationary point S (where S is actually the PBGP). The length of
the saddle-path is restricted by the restrictions of the meaningful space 321 ,, tt RRR
(bold line). In other words, only if the initial κ ( 0κ ) is somewhere between 0κ and
κ
E
*κ
0=κ& 0ˆ =E
&
S
saddle-path
κ T poleκ
0=κ&
0κ
R

79
κ 9, the economy can be on the saddle-path. Therefore, the system can be only
locally saddle-path stable. Now, I have to show that the system will be on the
saddle-path if κκκ << 00 . Furthermore, I have to discuss what happens if 0κ is
not within this range.
Every trajectory, which starts above the saddle-path or left from 0κ , reaches the
1R -curve in finite time. As discussed above, the life-time utility becomes infinitely
negative if the household reaches the 1R -curve. These arguments imply that the
representative household will never choose to start above the saddle path if
κκκ << 00 , since all the trajectories above the saddle-path lead to a state where
life-time-utility is infinitely negative.
Furthermore, all initial points that are situated below the saddle-path or right from
κ converge to the point T. If the system reaches one of the constraints ( 32 , tt RR )
during this convergence process, it moves along the binding constraint towards T.
However, the transversality condition is violated in T. Therefore, T is not an
equilibrium. To see that the transversality condition is violated in T consider the
following facts: The transversality condition is given by 0lim >−
∞→
t
tKe
ρψ , where ψ
is the costate variable in the Hamiltonian function (shadow-price of capital; see
also APPENDIX A). By using the equations from APPENDIX A this transversality
condition can be reformulated such that we obtain: 01
lim 1 >−
−−−−
→∞ βδβκ β G
Lt
gg ,
which is equivalent to:
β
βδ
βκ
−
∞→
−++
<
1
1
1
limG
L
t gg
. However, equation (C.13a)
9 Note that κ must be somwhat smaller than depicted in this diagram, since, as discussed above,
1R -curve is only an „outer limit“.

80
implies that in point T in Figure C.2
β
βδ
κ
−
−++
=
1
1
1
1
GL
gg
. Hence, the
transversality condition is violated if the system converges to point T.
Overall, we know that, if κκκ << 00 , the household always decides to be on the
saddle-path. Hence, we know that for κκκ << 00 the economy converges to the
PBGP. In this sense, the PBGP is locally stable (within the range κκκ << 00 ).
If the initial capital is to small ( 00 κκ < ), the economy converges to a state where
some existence minima are not satisfied (curve 1R ) and thus utility becomes
infinitely negative. This may be interpreted as a development trap. For example,
Malthusian theories imply that in this case some part of the population dies, which
would yield an increase in per-capita-capital (and hence an increase in 0κ ).
On the other hand, if initial capital-level is too large ( κκ >0 ), all trajectories
violate the transversality condition. Therefore, in this case, the representative
household must waste a part of its initial capital to come into the feasible area
( κκκ << 00 ).
Furthermore, note that there are always some happenings that reduce the capital
stock, e.g. wars (like the Second World War) or natural catastrophes. These
happenings could shift the economy into feasible space ( κκκ << 00 ). These
thoughts could be analyzed further in order to develop a theory that the Second
World War is the reason for the fact that many economies satisfy the Kaldor-facts
today.

81
The alternative is to assume that the transversality condition needs not to hold
necessarily. In this case the point T would be an equilibrium. All economies, that
start at κκ >0 , would converge to this equilibrium. However, I have no idea of
how I could omit the transversality condition. We know that the transversality
condition implies that the value of capital is not allowed to be negative at the
household’s death (at infinity). In the actual model, there seems to be no adequate
theory of allowing for the violation of the transversality condition.
Note that Figure C.2 depicts the phase diagram for parameter constellations, which
satisfy the condition
βδχαρω
αβ
−++
<−
1
1
)( GL
ng
g
. For parameter constellations,
which satisfy the condition
βδχαρω
αβ
−++
>−
1
1
)( GL
ng
g
, the discussion and the
qualitative results are nearly the same. The only difference is that the 0=κ& -locus
is humpshaped (concave) for poleκκ < . However, all the qualitative results remain
the same (local stability of PBGP for some range κκκ << 00 and “infeasibility”
for 00 κκ < and κκ >0 ). Q.E.D.
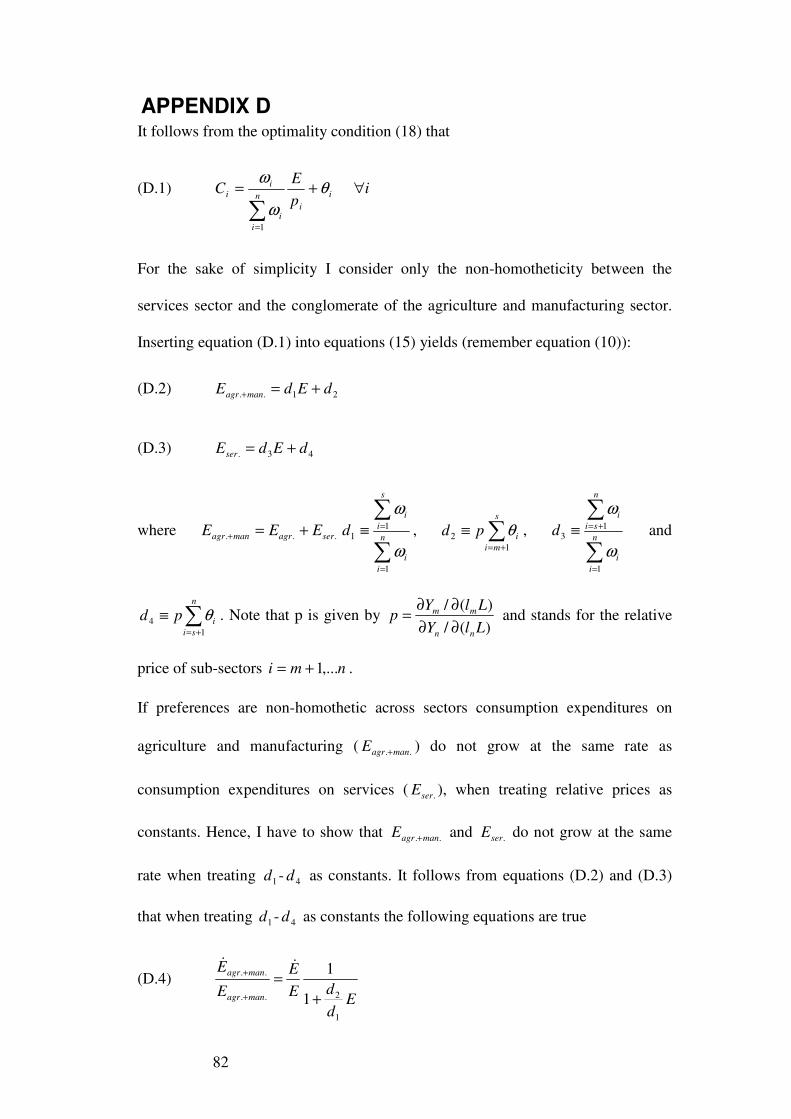
82
APPENDIX D It follows from the optimality condition (18) that
(D.1) ip
EC i
i
n
i
i
i
i ∀+=
∑=
θ
ω
ω
1
For the sake of simplicity I consider only the non-homotheticity between the
services sector and the conglomerate of the agriculture and manufacturing sector.
Inserting equation (D.1) into equations (15) yields (remember equation (10)):
(D.2) 21.. dEdE managr +=+
(D.3) 43. dEdEser +=
where ... seragrmanagr EEE +=+
∑
∑
=
=≡n
i
i
s
i
i
d
1
11
ω
ω
, ∑+=
≡s
mi
ipd1
2 θ ,
∑
∑
=
+=≡n
i
i
n
si
i
d
1
13
ω
ω
and
∑+=
≡n
si
ipd1
4 θ . Note that p is given by )(/
)(/
LlY
LlYp
nn
mm
∂∂
∂∂= and stands for the relative
price of sub-sectors nmi ,...1+= .
If preferences are non-homothetic across sectors consumption expenditures on
agriculture and manufacturing ( .. managrE + ) do not grow at the same rate as
consumption expenditures on services ( .serE ), when treating relative prices as
constants. Hence, I have to show that .. managrE + and .serE do not grow at the same
rate when treating 1d - 4d as constants. It follows from equations (D.2) and (D.3)
that when treating 1d - 4d as constants the following equations are true
(D.4)
Ed
dE
E
E
E
managr
managr
1
2..
..
1
1
+
=+
+&&
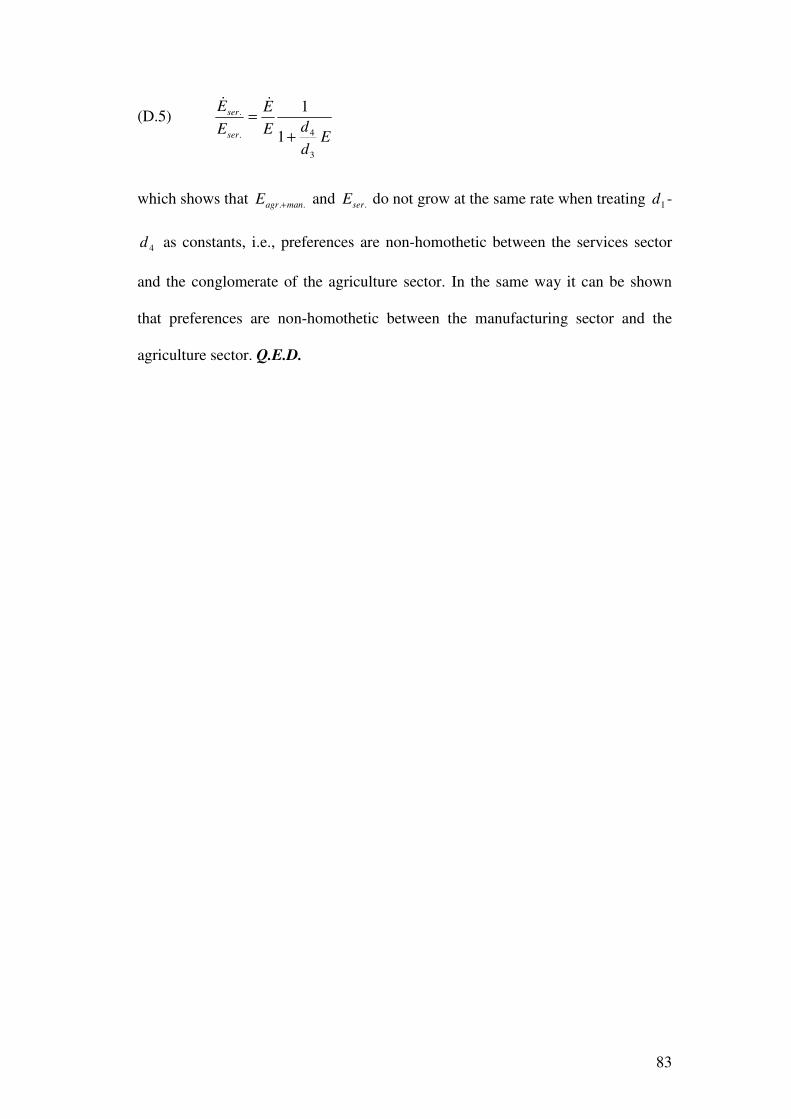
83
(D.5)
Ed
dE
E
E
E
ser
ser
3
4.
.
1
1
+
=&&
which shows that .. managrE + and .serE do not grow at the same rate when treating 1d -
4d as constants, i.e., preferences are non-homothetic between the services sector
and the conglomerate of the agriculture sector. In the same way it can be shown
that preferences are non-homothetic between the manufacturing sector and the
agriculture sector. Q.E.D.

84
APPENDIX E The optimality condition (17) implies after some algebra that
(E.1) ip
Hh
i
ii ∀= ,ε
Hence,
(E.2) i
j
j
i
j
i
p
p
h
h
ε
ε= for sai ,...1+= and nsj ,...1+=
In equation (E.2) i stands for the manufacturing sector and j for the services sector.
Let us now take a look at an arbitrary producer of the manufacturing sector, e.g. the
producer i = 3, where a+1<3 < s. I rewrite equation (E.2) as follows to show the
viewpoint of “producer 3”:
(E.3) 3
33
p
p
h
h j
jj ε
ε= for nsj ,...1+=
From the view point of “producer 3” equation (E.3) determines the ratio between
the input of own intermediates (i.e. the amount of intermediates that is produced by
“producer 3” and used by “producer 3”) and input of services-sector-produced
intermediates (i.e. the amount of intermediates that is produced by “producer j”
from the services sector and used by “producer 3”). (Remember that 3h and jh
enter the production function of “producer 3” via equations (1) and (7).) Hence, for
example, a decrease in jh
h3 means that “producer 3” increases the input of
producer-j-intermediates relatively more strongly than the input of own
intermediates, i.e. “producer 3” substitutes own intermediate inputs by external
intermediate inputs, i.e. “producer 3” outsources additional intermediates
production to producer j. Therefore, I can conclude from equation (E.3) that

85
“producer 3” outsources more and more to “producer j” (i.e. jh
h3 decreases),
provided that 03
3 <−p
p
p
p
j
j && (i.e. provided that the price for the good j in terms of
the good 3 )(3p
p jdecreases; or in other words: provided that the output of “producer
j” becomes cheaper and cheaper (or less and less expensive) in comparison to the
output of “producer 3”).
From this discussion and from equation (E.2) I can conclude the following:
manufacturing-sector-producers ( sai ,...1+= ) shift more and more intermediates
production to services-sector-producers ( nsj ,...1+= ), i.e. j
i
h
h decreases, provided
that services-sector-production becomes cheaper and cheaper (or less and less
expensive) in comparison to manufacturing-production, i.e. provided that
0<−i
i
j
j
p
p
p
p &&, and vice versa. Q.E.D.
Note that relative prices are determined by exogenous parameters. Hence, which
producers outsource and whether outsourcing from manufacturing to services
increases (or the other way around) depends on the parameterization of the model.
In general both cases are possible. By using optimality condition (17) the relative
prices can be calculated, so that I can reformulate equation (E.2) after some algebra
as follows
(E.4) µγ
µγϖνβ
ϑχ
α
ε
ε −
−+−
= D
L
K
l
k
B
A
h
h
m
m
j
i
j
i
)(
1 for mai ,...1+= and
nsj ,...1+=
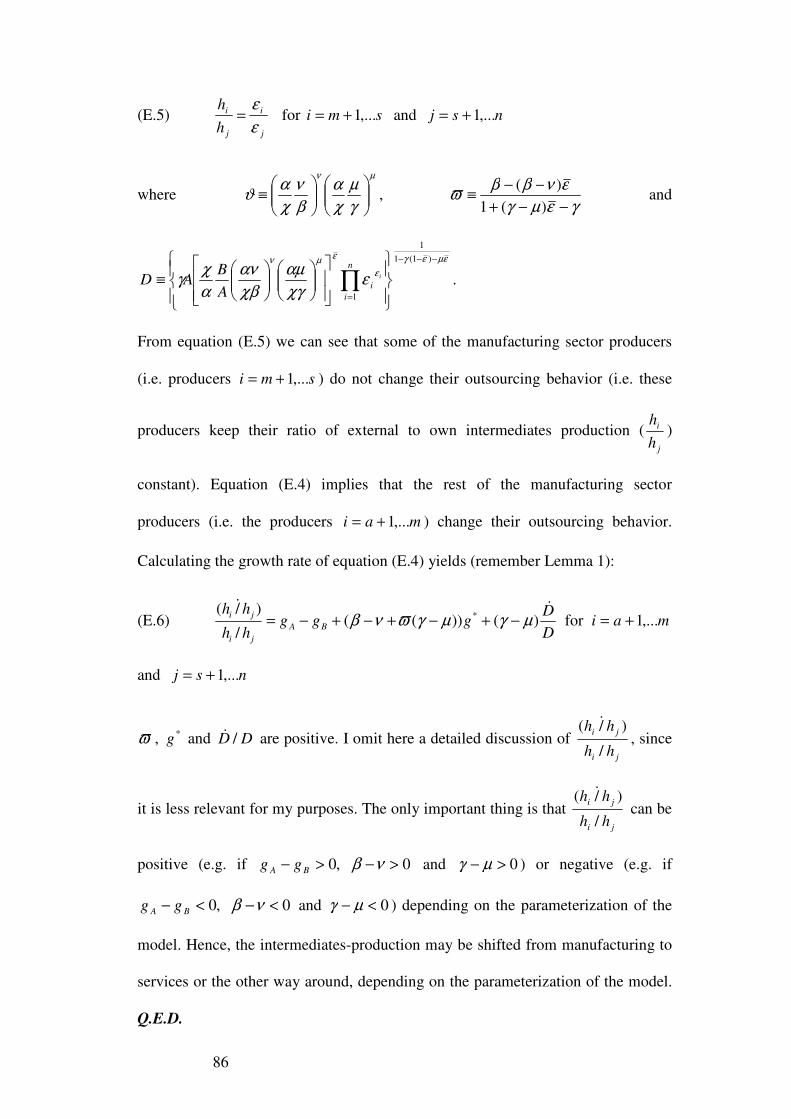
86
(E.5) j
i
j
i
h
h
ε
ε= for smi ,...1+= and nsj ,...1+=
where
µν
γ
µ
χ
α
β
ν
χ
αϑ
≡ ,
γεµγ
ενββϖ
−−+
−−≡
)(1
)( and
εµεγ
ε
εµν
εχγ
αµ
χβ
αν
α
χγ
−−−
=
≡ ∏
)1(1
1
1
n
i
ii
A
BAD .
From equation (E.5) we can see that some of the manufacturing sector producers
(i.e. producers smi ,...1+= ) do not change their outsourcing behavior (i.e. these
producers keep their ratio of external to own intermediates production (j
i
h
h)
constant). Equation (E.4) implies that the rest of the manufacturing sector
producers (i.e. the producers mai ,...1+= ) change their outsourcing behavior.
Calculating the growth rate of equation (E.4) yields (remember Lemma 1):
(E.6) D
Dggg
hh
hhBA
ji
ji&&
)())((/
)/(* µγµγϖνβ −+−+−+−= for mai ,...1+=
and nsj ,...1+=
ϖ , *g and DD /& are positive. I omit here a detailed discussion of ji
ji
hh
hh
/
)/( &
, since
it is less relevant for my purposes. The only important thing is that ji
ji
hh
hh
/
)/( &
can be
positive (e.g. if 0,0 >−>− νβBA gg and 0>− µγ ) or negative (e.g. if
0,0 <−<− νβBA gg and 0<− µγ ) depending on the parameterization of the
model. Hence, the intermediates-production may be shifted from manufacturing to
services or the other way around, depending on the parameterization of the model.
Q.E.D.

87
APPENDIX F It is well known that balanced growth requires either labor-augmenting
technological progress (or production function(s) of type Cobb-Douglas.)
Furthermore, a standard assumption in macroeconomic models is that the
production function has constant returns to scale. (Later, we will see that the
aggregate production function has the same structure as the sectoral production
functions.) Since I want to reassess the standard growth theory I do not depart from
these assumptions. Therefore, I assume now that sectoral production functions are
given by:
(1)’ ( ) niLflBY iiiii ,...1 =∀Ω=
where
(26)’ niLBl
Kk
ii
ii ,...1 =∀≡Ω
iB stands for the level of sector-specific and labor augmenting technological
progress; )( iif Ω is a sector-specific function of iΩ ; it is the intensive form of a
“standard” constant returns to scale function, where in this appendix iΩ denotes
the capital-to-labor ratio in efficiency units in sector i.
The sectoral growth rates of labor-augmenting technological progress ( ig ) are
constant, i.e. igBB iii ∀=/& . The following equations remain the same as in the
previous discussion:
(3)’ ∑ =i
ik 1
(3)’’ ∑ =i
il 1
(12)’ ∑≡i
iiYpY

88
I still assume that sector m is numéraire (m<n) (although I do not make here any
assumptions about which sector produces capital). Hence, equation (13) holds.
When labor and capital are mobile across sectors and markets are polypolistic the
following efficiency conditions must be true:
(17)’ jiLlY
LlY
KkY
KkY
p
p
ii
jj
ii
jj
j
i ,)(/
)(/
)(/
)(/∀
∂∂
∂∂=
∂∂
∂∂=
(32)’ iKkYpr iii ∀∂∂=+ )(/δ
Note, that I do not make here any assumption about the household behavior. The
assumptions above are sufficient to derive Proposition 4.
The capital share of income in sector i (or: the elasticity of capital with respect to
output in sector i) is given by:
(F.1) ( )
)(
)()(
ii
iii
i
iiiii
f
f
Y
KkKkY
Ω
Ω′Ω=
∂∂≡Ωκ
where i
iiii
ff
Ω∂
Ω∂≡Ω′
)()( .
By inserting equations (1)’, (26)’ and (13) into equation (32)’ I obtain:
(F.2) )( mmfr κδ ′=+
Inserting first equations (1)’ and (26)’ into equation (17)’ and then inserting
equation (F.1) into this term yields:
(F.3) ( )
( )( )
( )i
l
k
l
k
mm
mm
m
m
ii
ii
i
i ∀Ω
Ω−=
Ω
Ω−
κ
κ
κ
κ 11
Solving this term for ik and inserting it into equation (3)’ yields (remember that
11
1
1−
−=
− ii
i
κκ
κ and ∑ =
i
il 1):
(F.4) ( )
( ) ( )
1
11
1−
−
Ω−=
Ω
Ω−∑
i ii
i
mm
mm
m
m l
l
k
κκ
κ
Equations (13) and (17)’ imply:

89
(F.5) ( )
( )i
ffB
ffBp
iiiiii
mmmmmmi ∀
Ω′Ω−Ω
Ω′Ω−Ω=
)()(
)()(
Inserting equations (1)’, (F.1) and (F.5) into equation (12)’ yields:
(F.6) ( )∑−
Ω−Ω=i ii
immmmm
lLfBY
)(1)(1)(
κκκ
Inserting equation (F.4) into equation (F.6) yields equation
(F.7) [ ]
Ω−+Ω
Ω
Ω=
m
mm
tmmm
m
mm
l
kf
K
Y)(1)(
)(κκ
Definition F.1: A PBGP is a growth path where K
Y and
Y
rK are constant.
Definition F.1 is consistent with Definition 1 (and with the Kaldor facts). In fact
both definitions yield the same equilibrium growth path (but Definition 1 is
stronger than necessary). However, now I use Definition F.1 in order to
demonstrate that the necessary condition for the PBGP is independent of the
numéraire. (Remember that, since K
Y and
Y
rK are ratios, they are always the same
irrespective of the choice of the numérarire.)
Lemma F.1: A necessary condition for the existence of a PBGP (according to
Definition F.1) is ./ constkl mm = or equivalently .)(1
constl
i ii
i =Ω−
∑κ
.
Proof: Definition F.1 requires that K
Y and
Y
rK are constant; hence r must be
constant; hence mΩ must be constant (due to equation (F.2)). Due to equation
(F.7), .constm =Ω and .constK
Y= require ./ constkl mm = . ./ constkl mm = and
.constm =Ω require .)(1
constl
i ii
i =Ω−
∑κ
(due to equation (F.4)). Note that
iii λκ =Ω− )(1 , since I assume that there are only two production factors capital

90
and labor. ( iλ stands for the output-elasticity of labor in sector i or equivalently for
the labor-income share in sector i.) Q.E.D.