A FRAMEWORK FOR DEVELOPING OPTIMAL TENSILE STRENGTH ...
126
A FRAMEWORK FOR DEVELOPING OPTIMAL TENSILE STRENGTH RELATIONSHIPS BASED ON CHARACTERIZATION TOOLS WITH FOCUS ON: PARTICLE SIZE, LUBRICANT SENSITIVITY, AND TABLET SHAPE BY SONIA MODARRES RAZAVI A dissertation submitted to the Graduate School—New Brunswick Rutgers, The State University of New Jersey in partial fulfillment of the requirements for the degree of Doctor of Philosophy Graduate Program in Mechanical And Aerospace Engineering Written under the direction of Alberto M. Cuiti˜ no and approved by New Brunswick, New Jersey OCTOBER, 2017
Transcript of A FRAMEWORK FOR DEVELOPING OPTIMAL TENSILE STRENGTH ...

A FRAMEWORK FOR DEVELOPING OPTIMALTENSILE STRENGTH RELATIONSHIPS BASED ONCHARACTERIZATION TOOLS WITH FOCUS ON:
PARTICLE SIZE, LUBRICANT SENSITIVITY, ANDTABLET SHAPE
BY
SONIA MODARRES RAZAVI
A dissertation submitted to the
Graduate School—New Brunswick
Rutgers, The State University of New Jersey
in partial fulfillment of the requirements
for the degree of
Doctor of Philosophy
Graduate Program in Mechanical And Aerospace Engineering
Written under the direction of
Alberto M. Cuitino
and approved by
New Brunswick, New Jersey
OCTOBER, 2017

ABSTRACT OF THE DISSERTATION
A Framework for Developing Optimal Tensile Strength
Relationships Based on Characterization Tools with Focus
on: Particle Size, Lubricant Sensitivity, and Tablet Shape
by
SONIA MODARRES RAZAVI
Dissertation Director: Alberto M. Cuitino
This work is a collection of problems all focused on mechanical strength of pharmaceuti-
cal tablets. The first problem focuses on relating material strength to the breaking force
of non-flat faced tablets. We propose a general framework for determining optimal re-
lationships for tensile strength of doubly convex tablets under diametrical compression.
This approach is based on the observation that tensile strength is directly proportional
to the breaking force and inversely proportional to a non-linear function of geometric
parameters and materials properties. This generalization reduces to the analytical ex-
pression commonly used for flat faced tablets, i.e., Hertz solution, and to the empirical
relationship currently used in the pharmaceutical industry for convex-faced tablets, i.e.,
Pitt’s equation. Under proper parameterization, optimal tensile strength relationship
can be determined from experimental results by minimizing a figure of merit of choice.
This optimization is performed under the first-order approximation that a flat faced
tablet and a doubly curved tablet have the same tensile strength if they have the same
relative density and are made of the same powder, under equivalent manufacturing
conditions. Furthermore, we provide a set of recommendations and best practices for
ii

assessing the performance of optimal tensile strength relationships in general. Based on
these guidelines, we identify two new models, namely the general and mechanistic mod-
els, which are effective and predictive alternatives to the tensile strength relationship
currently used in the pharmaceutical industry.
The second problem targets the utilization of a non-destructive technique to assess
tablet strength. An ultrasound measurement system was employed as a non-destructive
method to evaluate its reliability in predicting the tensile strength of tablets and inves-
tigate the benefits of incorporating it in a continuous line, manufacturing solid dosage
forms. Tablets containing lactose, acetaminophen, and magnesium stearate were man-
ufactured continuously and in batches. The effect of two processing parameters, com-
paction force and level of shear strain were examined. Elastic modulus and tensile
strength of tablets were obtained by ultrasound and diametrical mechanical testing,
respectively. It was found that as the blend was exposed to increasing levels of shear
strain, the speed of sound in the tablets decreased and the tablets became both softer
and mechanically weaker. Moreover, the results indicate that two separate tablet ma-
terial properties (e.g., relative density and elastic modulus) are necessary in order to
predict tensile strength. A strategy for tensile strength prediction is proposed that
uses the existing models for elastic modulus and tensile strength of porous materials.
Ultrasound testing was found to be very sensitive in differentiating tablets with similar
formulation but produced under different processing conditions (e.g., different level of
shear strain), thus, providing a fast and non-destructive method for hardness prediction
that could be incorporated to a continuous manufacturing process.
The third problem aims to adopt a Quality by Design paradigm to better control the
mechanical strength of tablets as a critical quality attribute by understanding the ef-
fects of critical process parameters and critical material attributes. To this end, the
effect of particle size distribution, lubricant concentration, and mixing time on the
tensile strength and stiffness of tablets were studied. Two grades of lactose, lactose
α-monohydrate and spray-dried lactose, were selected. Tablets were compressed to
different relative densities ranging from 0.8 to 0.94 using an instrumented compactor
iii

simulator, and compaction curves showing the force-displacement profiles during com-
paction were obtained. The total work input during the compaction process is found
to be higher for spray-dried lactose compared to lactose monohydrate. We propose a
general model, which predicts the elastic modulus and tensile strength envelope that
a specific powder can obtain based on its lubrication sensitivity for different particle
size distributions. This was possible by introducing a new parameter in the existing
tensile strength and elastic modulus models. A wide range of lubrication conditions was
explored and the model exhibited a good predictability. The mechanical properties of
lactose monohydrate tablets were noticeably dependent on particle size, unlike spray-
dried lactose where little to almost no sensitivity to initial particle size was observed.
The model is designed in a general fashion that can capture all the possible mechanical
integrity behaviors in response to different lubrication conditions and initial particle
size. Our model can be extended to all the powders that undergo different deformation
mechanisms and is applicable for more complex pharmaceutical formulations.
iv

Acknowledgements
This dissertation is a result of the contribution of many individuals, which I have had
the pleasure to work with. I have to first start by thanking my supportive and kind
advisor, Prof. Alberto Cuitino. I am forever indebted to him for making me a more
confident person by giving me a lot of opportunities, yet letting me find my way freely.
I would like to thank Prof. Marcial Gonzalez, who has helped me tremendously without
any hesitation. I have learnt a lot from him both scientifically and personally and for
that I am truly grateful. I would also like to express my gratitude toward my other
committee members, Prof. Mina Pelegri, who is an inspirational role model for all the
women engineers and Prof. German Drazer, whom I had the pleasure to work with. I
have always admired his attention to details.
I want to thank the Engineering Research Center for Structured Organic Particulate
Systems (C-SOPS) for the financial support and providing an excellent environment to
understand and address industry needs and interact with both academic and industrial
collaborators. To the C-SOPS members, I was privileged to be surrounded by so many
dedicated and talented colleagues. I will always cherish the friendships and memories
I have made with each and every one of you. I would like to specifically thank Golshid
Keyvan, Bereket Yohannes, Gerardo Callegari, Savitha Panikar, Pallavi Pawar, Yifan
Wang, Zhanjie Liu, and Sarang Oka.
I want to express my appreciation to my amazing officemates and my dear friends,
especially Mahsa and Shirin, for all the discussions and laughs over the coffee breaks.
You made my PhD life much more fun and meaningful.
Words cannot describe my endless love and gratitude I have for my family. My parents
have been my rock in life. My mom, Farzaneh, who has always been by my side despite
the long distance through good and rough days. My dad, Reza, whom our phone
v

conversations may have not lasted more than 5 minutes but the positive energy would
have kept me going through the day. I am so fortunate to have my biggest role models
as my parents and always strive to make them feel proud and happy. My big sister,
Sara, whom I always look up to. I am the proudest sister to have her in my life. My
niece, Nila, who brings joy to my life and holds a special place in my heart. I dream of
a day when we all live at least in the same time zone!!
Last but not least, my lifelong partner, Navid, I cannot imagine passing one moment of
my life without you. I know these couple of sentences cannot deliver my feelings toward
you. Throughout all these years you have stood beside me and have always encouraged
me to move forward and never give up. What I am and where I am today was definitely
not possible without you in my life. I love you honey.
vi
Dedication
To my spectacular parents, Farzaneh & Reza
my lovely sister, Sara
&
my better half, Navid
vii
Table of Contents
Abstract . . . . . . . . . . . . . . . . . . . . . . . . . . . . . . . . . . . . . . . . ii
Acknowledgements . . . . . . . . . . . . . . . . . . . . . . . . . . . . . . . . . v
Dedication . . . . . . . . . . . . . . . . . . . . . . . . . . . . . . . . . . . . . . . vii
List of Figures . . . . . . . . . . . . . . . . . . . . . . . . . . . . . . . . . . . . xi
List of Tables . . . . . . . . . . . . . . . . . . . . . . . . . . . . . . . . . . . . . xv
1. Introduction . . . . . . . . . . . . . . . . . . . . . . . . . . . . . . . . . . . 1
1.1. Background . . . . . . . . . . . . . . . . . . . . . . . . . . . . . . . . . . 1
1.2. Powder Compaction . . . . . . . . . . . . . . . . . . . . . . . . . . . . . 1
1.3. Compaction Cycle . . . . . . . . . . . . . . . . . . . . . . . . . . . . . . 3
1.4. Mixing Mechanisms . . . . . . . . . . . . . . . . . . . . . . . . . . . . . 4
1.5. Tablet Tensile Strength . . . . . . . . . . . . . . . . . . . . . . . . . . . 6
1.6. Compressibility, Compactibility, and Tabletability . . . . . . . . . . . . 7
1.7. Organization of the Dissertation . . . . . . . . . . . . . . . . . . . . . . 8
2. General and Mechanistic Optimal Relationships for Tensile Strength
of Doubly Convex Tablets Under Diametrical Compression . . . . . . . 9
2.1. Introduction . . . . . . . . . . . . . . . . . . . . . . . . . . . . . . . . . . 9
2.2. Material and Methods . . . . . . . . . . . . . . . . . . . . . . . . . . . . 13
2.3. Results . . . . . . . . . . . . . . . . . . . . . . . . . . . . . . . . . . . . . 16
2.3.1. Optimal Tensile Strength Relationships . . . . . . . . . . . . . . 16
General Model . . . . . . . . . . . . . . . . . . . . . . . . . . . . 21
Role of Flat Faced Tablets in the Optimization Process . . . . . 24
Mechanistic Interpretation . . . . . . . . . . . . . . . . . . . . . . 25
viii
2.4. Summary and Conclusion . . . . . . . . . . . . . . . . . . . . . . . . . . 28
3. Toward Predicting Tensile Strength of Pharmaceutical Tablets by Ul-
trasound Measurement in Continuous Manufacturing . . . . . . . . . . . 33
3.1. Introduction . . . . . . . . . . . . . . . . . . . . . . . . . . . . . . . . . . 33
3.1.1. Batch vs. Continuous Manufacturing . . . . . . . . . . . . . . . . 33
3.1.2. Principle of Ultrasonics . . . . . . . . . . . . . . . . . . . . . . . 34
3.1.3. Ultrasonics in Pharmaceutics . . . . . . . . . . . . . . . . . . . . 35
3.2. Materials and Methods . . . . . . . . . . . . . . . . . . . . . . . . . . . . 37
3.2.1. Materials . . . . . . . . . . . . . . . . . . . . . . . . . . . . . . . 37
3.2.2. Continuous Manufacturing . . . . . . . . . . . . . . . . . . . . . 38
3.2.3. Batch Production . . . . . . . . . . . . . . . . . . . . . . . . . . 40
Blend Preparation . . . . . . . . . . . . . . . . . . . . . . . . . . 40
Tablet Compaction . . . . . . . . . . . . . . . . . . . . . . . . . . 41
3.2.4. Tablet Characterization . . . . . . . . . . . . . . . . . . . . . . . 42
Density . . . . . . . . . . . . . . . . . . . . . . . . . . . . . . . . 42
Acoustic Measurements . . . . . . . . . . . . . . . . . . . . . . . 45
Tensile Strength Measurements . . . . . . . . . . . . . . . . . . . 48
3.3. A Strategy for Tensile Strength Prediction of Tablets . . . . . . . . . . . 48
3.3.1. Elastic Modulus-Porosity Correlation . . . . . . . . . . . . . . . . 49
3.3.2. Tensile Strength-Porosity Correlation . . . . . . . . . . . . . . . 50
3.4. Results and Discussion . . . . . . . . . . . . . . . . . . . . . . . . . . . . 50
3.5. Conclusion . . . . . . . . . . . . . . . . . . . . . . . . . . . . . . . . . . 55
3.6. Appendix . . . . . . . . . . . . . . . . . . . . . . . . . . . . . . . . . . . 56
4. Quantification of Lubrication and Particle Size Distribution Effects on
Tensile Strength and Stiffness of Tablets . . . . . . . . . . . . . . . . . . . 58
4.1. Introduction . . . . . . . . . . . . . . . . . . . . . . . . . . . . . . . . . . 58
4.2. Material and Methods . . . . . . . . . . . . . . . . . . . . . . . . . . . . 61
4.2.1. Materials . . . . . . . . . . . . . . . . . . . . . . . . . . . . . . . 61
ix

4.2.2. Blend Preparation . . . . . . . . . . . . . . . . . . . . . . . . . . 61
4.2.3. Tablet Compaction . . . . . . . . . . . . . . . . . . . . . . . . . . 63
4.2.4. Tablet Characterization . . . . . . . . . . . . . . . . . . . . . . . 63
4.3. Results and discussion . . . . . . . . . . . . . . . . . . . . . . . . . . . . 64
4.3.1. Effect of Particle Size and Lubrication on Compaction Properties 67
4.3.2. Effect of Particle Size and Lubrication on Tensile Strength and
Stiffness of Tablets . . . . . . . . . . . . . . . . . . . . . . . . . . 73
4.3.3. Proposed Model . . . . . . . . . . . . . . . . . . . . . . . . . . . 83
4.4. Summary and Conclusion . . . . . . . . . . . . . . . . . . . . . . . . . . 93
5. Conclusions and Recommendations . . . . . . . . . . . . . . . . . . . . . 95
5.1. Remarks . . . . . . . . . . . . . . . . . . . . . . . . . . . . . . . . . . . . 95
5.2. Future Work . . . . . . . . . . . . . . . . . . . . . . . . . . . . . . . . . 96
References . . . . . . . . . . . . . . . . . . . . . . . . . . . . . . . . . . . . . . . 98
x

List of Figures
1.1. Schematic of a compaction curve; upper punch force vs. upper punch
displacement [1]. . . . . . . . . . . . . . . . . . . . . . . . . . . . . . . . 2
1.2. Tablet compression cycle stages. Courtesy of Kikusui Seisakusho Ltd.,
Kyoto, Japan. . . . . . . . . . . . . . . . . . . . . . . . . . . . . . . . . . 3
1.3. Geometry and failure behavior in a flat faced cylindrical tablet. . . . . . 6
2.1. Geometry and failure behavior in a doubly convex tablet under diamet-
rical compression. . . . . . . . . . . . . . . . . . . . . . . . . . . . . . . . 10
2.2. Presster, a linear mechanical replicator of any rotary tablet press. . . . . 13
2.3. Instron 4411- 5kN tension compression test machine, used for diametrical
compression tests. . . . . . . . . . . . . . . . . . . . . . . . . . . . . . . 14
2.4. Relationship between tensile strength and relative density of flat faced
tablets. . . . . . . . . . . . . . . . . . . . . . . . . . . . . . . . . . . . . 18
2.5. Failure modes of doubly convex MCC tablets [2]. . . . . . . . . . . . . . 22
2.6. The relationship between tensile strength and relative density of the
experimental data using σ−norm. . . . . . . . . . . . . . . . . . . . . . . 28
2.7. Error distribution plots for 1-parameter, 4-parameter, general, and mech-
anistic models. . . . . . . . . . . . . . . . . . . . . . . . . . . . . . . . . 29
3.1. Particle motion vs. the direction of ultrasound wave propogation [3]. . . 35
3.2. Accupyc II 1340 Pycnometer, which uses the gas displacement method
to measure volume/density accurately. . . . . . . . . . . . . . . . . . . . 38
3.3. Continuous direct compaction manufacturing line [4]. . . . . . . . . . . . 39
3.4. V-blender, a tumbling mixer and shearing device used to impart uniform
shear to the blend. . . . . . . . . . . . . . . . . . . . . . . . . . . . . . . 40
3.5. Laboratory scale resonant acoustic mixer (LabRAM). . . . . . . . . . . 41
xi

3.6. The acoustic experimental setup showing ultrasound transducers, pulser/receiver
unit, and a digitizing oscilloscope. . . . . . . . . . . . . . . . . . . . . . 46
3.7. Time of flight measurement of a US waveform. . . . . . . . . . . . . . . 47
3.8. Calibration of the ultrasound testing using steel and aluminum samples. 47
3.9. Standard hardness tester used to measure the breaking force of tablets. 48
3.10. The relationship between relative density and tensile strength following
the Kuentz and Leuenberger [5] model. . . . . . . . . . . . . . . . . . . . 51
3.11. Elastic modulus as a function of relative density. . . . . . . . . . . . . . 52
3.12. Tensile strength as a function of elastic modulus. Mean values are shown
for the continuous tablets. . . . . . . . . . . . . . . . . . . . . . . . . . . 53
3.13. σt as a function of ρ and E and the projection of datapoints on each plane. 54
3.14. A one-to-one relationship between E0 and σ0 for tablets with the same
formulation but different processing history. E0 values are derived from
Eq. (3.6). Note that 0 rev, 160 rev, and 640 rev tablets have experienced
a 2-minute mixing with MgSt in the V-blender. . . . . . . . . . . . . . . 55
4.1. Endecotts sieve shaker with multiple pans stacked and clamped. . . . . 62
4.2. Beckman Coulter LS 13320 laser diffraction particle size analyzer. . . . . 63
4.3. MultiTest 50 - manual tablet hardness tester. . . . . . . . . . . . . . . . 64
4.4. Particle size distribution of (a) lactose monohydrate and (b) spray-dried
lactose. Red lines show the Gaussian fitting for each distribution. . . . . 65
4.5. Lubrication effect on compaction pressure vs. in-die relative density
of lactose monohydrate for different particle size distributions: (a) as-
recieved, (b) 0-75 µm, (c) 75-106 µm, and (d) 106-150 µm. . . . . . . . . 68
4.6. Particle size effect on compaction pressure vs. in-die relative density of
lactose monohydrate for different lubrication parameters: (a) 0.25%MgSt-
120sec, (b) 0.25%MgSt-1200sec, and (c) 2%MgSt-1200sec. . . . . . . . . 69
xii

4.7. (a) Compaction pressure vs. in-die relative density for as-received spray-
dried lactose. (b) Comparison of compaction curves of as-received lactose
monohydrate and spray-dried lactose for two extreme lubrication condi-
tions. . . . . . . . . . . . . . . . . . . . . . . . . . . . . . . . . . . . . . . 70
4.8. Elastic recovery vs. in-die maximum relative density for different particle
size distributions of lactose monohydrate. . . . . . . . . . . . . . . . . . 72
4.9. Elastic modulus and tensile strength vs. out-of-die relative density of all
the lactose monohydrate tablets with PSD of 0-75 µm. . . . . . . . . . . 74
4.10. Elastic modulus and tensile strength vs. out-of-die relative density for
different PSDs of lactose monohydrate; (a,b) 75-106 µm, (c,d) 106-150
µm, and (e,f) as-received. . . . . . . . . . . . . . . . . . . . . . . . . . . 75
4.11. Particle size effect on elastic modulus and tensile strength of lactose
monohydrate tablets at different lubrication conditions (a,b) 0.25%MgSt-
2min, (c,d) 0.25%MgSt-20min, and (e,f) 2%MgSt-20min. . . . . . . . . . 77
4.12. Elastic modulus and tensile strength vs. out-of-die relative density for
different PSDs of spray-dried lactose; (a,b) 0-75 µm, (c,d) 75-106 µm,
(e,f) 106-150 µm, (g,h) 150-212 µm, and (i,j) as-received. . . . . . . . . 78
4.13. Particle size effect on elastic modulus and tensile strength of spray-dried
lactose tablets at different lubrication conditions (a, b) 0.5%MgSt-30sec,
(c, d) 1%MgSt-2min, (e, f) 0.5%MgSt-10min, and (g, h) 2%MgSt-20min. 80
4.14. The measured and predicted values of E0 and σ0 as a function of param-
eter “C” for lactose monohydrate. A validation point, in blue, is also
provided. . . . . . . . . . . . . . . . . . . . . . . . . . . . . . . . . . . . 87
4.15. The measured and predicted values of E0 and σ0 as a function of pa-
rameter “C” for spray-dried lactose. Two validation points, in blue, are
provided. . . . . . . . . . . . . . . . . . . . . . . . . . . . . . . . . . . . 88
xiii
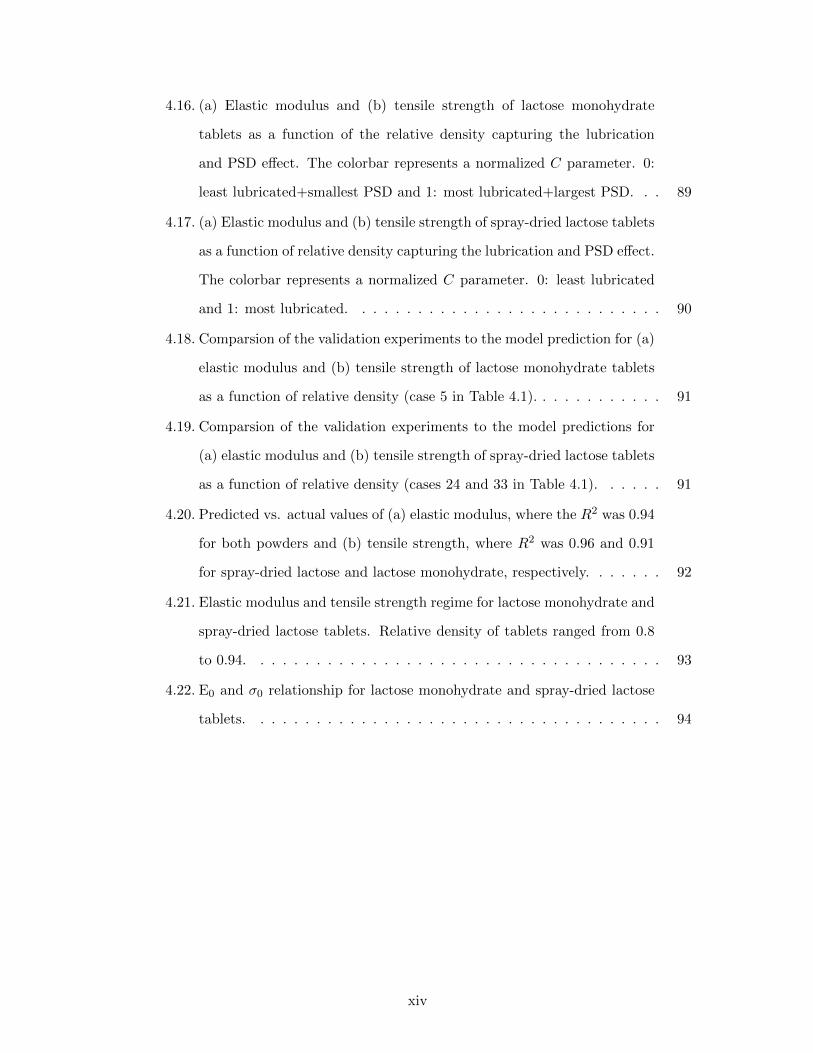
4.16. (a) Elastic modulus and (b) tensile strength of lactose monohydrate
tablets as a function of the relative density capturing the lubrication
and PSD effect. The colorbar represents a normalized C parameter. 0:
least lubricated+smallest PSD and 1: most lubricated+largest PSD. . . 89
4.17. (a) Elastic modulus and (b) tensile strength of spray-dried lactose tablets
as a function of relative density capturing the lubrication and PSD effect.
The colorbar represents a normalized C parameter. 0: least lubricated
and 1: most lubricated. . . . . . . . . . . . . . . . . . . . . . . . . . . . 90
4.18. Comparsion of the validation experiments to the model prediction for (a)
elastic modulus and (b) tensile strength of lactose monohydrate tablets
as a function of relative density (case 5 in Table 4.1). . . . . . . . . . . . 91
4.19. Comparsion of the validation experiments to the model predictions for
(a) elastic modulus and (b) tensile strength of spray-dried lactose tablets
as a function of relative density (cases 24 and 33 in Table 4.1). . . . . . 91
4.20. Predicted vs. actual values of (a) elastic modulus, where the R2 was 0.94
for both powders and (b) tensile strength, where R2 was 0.96 and 0.91
for spray-dried lactose and lactose monohydrate, respectively. . . . . . . 92
4.21. Elastic modulus and tensile strength regime for lactose monohydrate and
spray-dried lactose tablets. Relative density of tablets ranged from 0.8
to 0.94. . . . . . . . . . . . . . . . . . . . . . . . . . . . . . . . . . . . . 93
4.22. E0 and σ0 relationship for lactose monohydrate and spray-dried lactose
tablets. . . . . . . . . . . . . . . . . . . . . . . . . . . . . . . . . . . . . 94
xiv

List of Tables
2.1. A comparison of existing models according to their optimal coefficients,
confidence intervals, and residual errors obtained from each figure of
merit, for all flat and doubly convex tablets. . . . . . . . . . . . . . . . . 12
2.2. Characteristics of flat faced tablets and their calculated tensile strength
values. . . . . . . . . . . . . . . . . . . . . . . . . . . . . . . . . . . . . . 15
2.3. Tensile strength and relative density of flat faced tablets extracted from
[2]. . . . . . . . . . . . . . . . . . . . . . . . . . . . . . . . . . . . . . . . 19
2.4. A comparison between all models according to their optimal coefficients,
confidence intervals and residual errors obtained from each figure of
merit, for only those flat and doubly convex tablets that failed under
pure tensile stress. . . . . . . . . . . . . . . . . . . . . . . . . . . . . . . 23
2.5. Recalibration of optimal coefficients, confidence interval and residual er-
rors for flat and doubly convex tablets that failed under pure tensile
stress, using a larger group of flat faced tablets in the optimization pro-
cess. . . . . . . . . . . . . . . . . . . . . . . . . . . . . . . . . . . . . . . 26
2.6. Mechanistic model optimal coefficients, confidence bound, and residual
errors from each figure of merit, for those tablets in the extended dataset
that failed under pure tensile stress. . . . . . . . . . . . . . . . . . . . . 27
2.7. A systematic comparison of the proposed and existing models based on
four different performance criteria. . . . . . . . . . . . . . . . . . . . . . 30
3.1. Blend constituents, nominal mean particle size, and true density. . . . . 37
3.2. Compaction force, mass, thickness, relative density, speed of sound, ten-
sile strength, and elastic modulus of the labRAM tablets. . . . . . . . . 43
xv

3.3. Compaction force, mass, thickness, relative density, speed of sound, ten-
sile strength, and elastic modulus of the of the batch tablets mixed in
the V-blender and then experienced different shear strain environments. 44
3.4. Mean values and standard deviations of mass, thickness, relative density,
speed of sound, tensile strength, and elastic modulus of the continuously
manufactured tablets compacted at various nominal compaction forces. . 45
3.5. Tensile strength at zero porosity and critical relative density found from
Eq. (3.8) for all the differently produced tablets. . . . . . . . . . . . . . 51
3.6. Elastic modulus at zero porosity and other fitting coefficients according
to Eqs. (3.4), (3.5), and (3.6) for all the group of tablets. . . . . . . . . 53
3.7. Mass, thickness, relative density, speed of sound, tensile strength, and
elastic modulus of each individual continuously manufactured tablet com-
pacted at a nominal compaction force. . . . . . . . . . . . . . . . . . . . 56
4.1. Mean (µ) and standard deviation (σ) for each particle size distribution,
MgSt concentration, and the mixing time for all the cases studied. . . . 66
4.2. Percentage elastic recovery and the maximum relative density for differ-
ent particle size distribution and three lubrication conditions of lactose
monohydrate. . . . . . . . . . . . . . . . . . . . . . . . . . . . . . . . . . 72
4.3. Tensile strength and elastic modulus at zero porosity together with the
critical relative density determined for each mechanical property for all
cases studied. . . . . . . . . . . . . . . . . . . . . . . . . . . . . . . . . . 82
4.4. Optimal coefficients and their residual error of elastic modulus optimiza-
tion problem for lactose monohydrate and spray-dried lactose. . . . . . . 85
4.5. Optimal coefficients and their residual error of tensile strength optimiza-
tion problem for lactose monohydrate and spray-dried lactose. . . . . . . 85
xvi

1
Chapter 1
Introduction
1.1 Background
Solid dosage forms account for almost 80% of all marketed pharmaceutical products in
the United States [6]. Tablets are the most common dosage form, due to their relatively
low manufacturing cost, high production rates, acceptable shelf life, dosage accuracy,
and contolled drug release [7, 8]. Tablets are mainly fabricated by pressing powders into
various shapes and geometries. The compacted powder is always a mixture of two or
more powder ingredients. The ingredients are classified into two groups: active pharma-
ceutical ingredients (APIs) and excipients. API, which delivers the therapeutic effect,
is formulated with excipients to ensure desirable tablet behavior from its production to
release in human body.
1.2 Powder Compaction
Direct compression, compared to dry granulation and wet granulation, is the simplest
and preferred route to produce oral solid dosage forms, which refers to the compaction
of the dry mixed of the individual ingredients [9]. Tableting (i.e., powder compaction)
is the last stage in a tablet production, if coating is not required.
The compaction mechanism starts with particle re-arrangement, which refers to parti-
cles moving into closer packing and volume reduction. With an increase in the com-
paction pressure particles deform either plastically, elastically, or fracture into smaller
particles (i.e., fragmentation) [10]. In most cases, more than one of the aforementioned
mechanisms occur [11]. The applied energy is completely recovered in elastic defor-
mation, unlike plastic deformation and fragmentation where the the particles undergo

2
irreversible deformation. Interparticulate attraction occurs between the particles as
their surfaces are brought closer together resulting in bond formation. Finally, elas-
tic recovery occurs during the decompression stage [12]. There are three dominating
bonding mechansims that act between particulate solids: solid bridges, intermolecular
forces, and mechanical interlocking [13]. The sum of number of bonds remained af-
ter the decompression stage and the strength of each bond are reflected in the tablet
strength.
Figure 1.1: Schematic of a compaction curve; upper punch force vs. upper punch displacement[1].
Single station compaction simulators are the ideal devices to study powder deformation
behavior by accurate recording of upper punch force and displacement, if the die wall
friction is negligible [14]. This profile depends on the material and equipment. Fig.
1.1 schematically shows how the forces evolve during powder compression. Ideally, the
force-displacement cruve follows the triangle ABC. However, in reality compression
takes place along curve AB followed by decompression along curve BD. Area A1
represents the work of friction and area A3 is the work recovered during decompression
stage. The area under the curve AB, (A2 +A3) represents the net work of compaction.
The bigger the area A2 is, the better the compressibility. Materials that undergo a
large irreversible deformation are expected to yield a large net work [14].
3
Both powder properties (e.g., particle size [15] and crystal structure of the material
[16]) and processing parameters (e.g., compression force, compression speed [17, 18])
affect the compaction behavior and tablet properties [19].
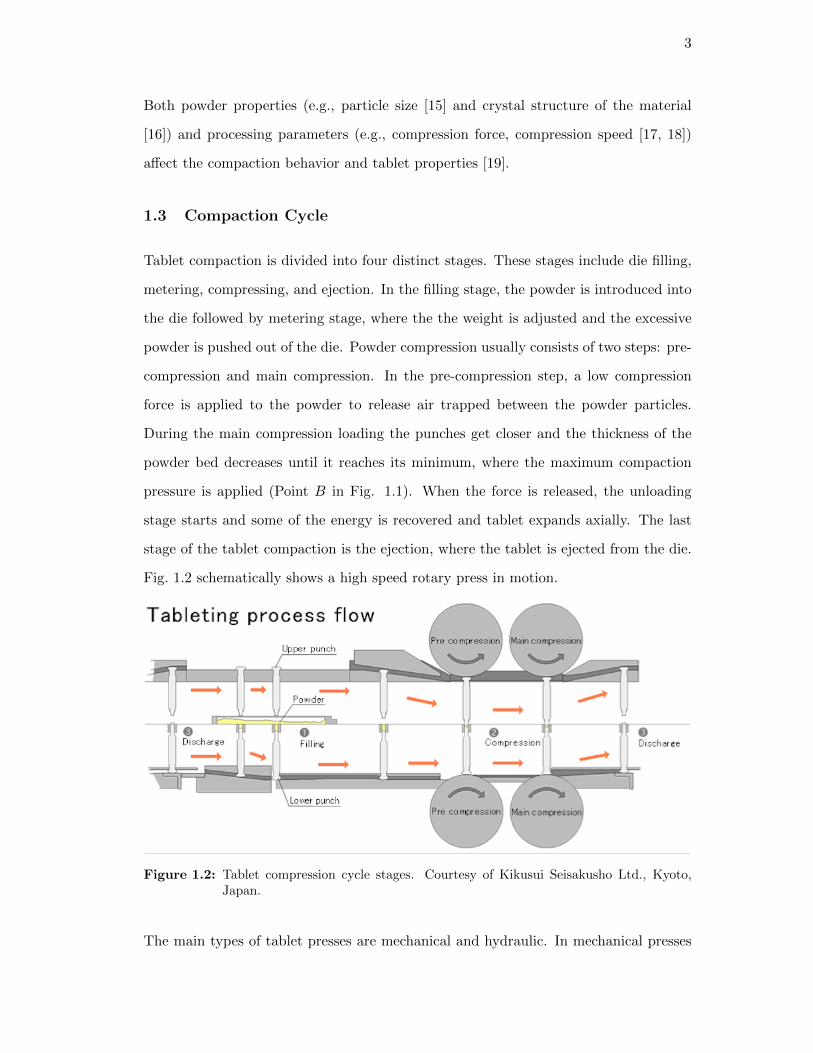
1.3 Compaction Cycle
Tablet compaction is divided into four distinct stages. These stages include die filling,
metering, compressing, and ejection. In the filling stage, the powder is introduced into
the die followed by metering stage, where the the weight is adjusted and the excessive
powder is pushed out of the die. Powder compression usually consists of two steps: pre-
compression and main compression. In the pre-compression step, a low compression
force is applied to the powder to release air trapped between the powder particles.
During the main compression loading the punches get closer and the thickness of the
powder bed decreases until it reaches its minimum, where the maximum compaction
pressure is applied (Point B in Fig. 1.1). When the force is released, the unloading
stage starts and some of the energy is recovered and tablet expands axially. The last
stage of the tablet compaction is the ejection, where the tablet is ejected from the die.
Fig. 1.2 schematically shows a high speed rotary press in motion.
Figure 1.2: Tablet compression cycle stages. Courtesy of Kikusui Seisakusho Ltd., Kyoto,Japan.
The main types of tablet presses are mechanical and hydraulic. In mechanical presses
4
the distance between the punches can be controlled and powders are compressed to
constant thickness. In hydraulic presses the force exerted on powders is the processing
variable and powders are compressed to constant force.
In order to adequately characterize the mechanical properties of powders, properties
during and after compaction of tablets are extracted and analyzed. Although powder
mixing is not the focus of this disseration, but since different mixing techniques were
employed that affect the powder properties and their compaction behavior, a section is
dedicated to briefly introduce mixing mechanisms and techniques.
1.4 Mixing Mechanisms
Mixing mechanism can be categorized in two ways: the scale at which mixing occurs
and the driving force. The former can be classified as macro-mixing and micro-mixing
and the latter is classified into convective, dispersive, and shear mixing [20, 21, 22].
Macro-mixing refers to the transportation and mixing of group of particles, while micro-
mixing focuses on the mixing at individual particle level. The two classifications are
obviously correlated; convective mixing is a macro-mixing and dispersive and shear
mixing are micro-mixing. Shearing occurs in all the mixers. Shear mixing is caused
by slipping planes within the powder bed. There exists velocity gradients between
individual particles or particle planes [23]. Three types of mixers that were used in this
work are: V-blender, Resonant Acoustic Mixing (RAM), and Glatt GCG-70 continuous
blender. A brief description of each blender is provided as follows:
V-blender
V-blender, a popular tumble mixer, uses tumbling motion of a vessel containing pow-
der ingredients. A combination of all the aforementioned mixing mechanisms exists.
However, faster convective mixing occurs compared to dispersive mixing. The charging
method of the material into the V-blender, the volume of the loaded material, mixer
speed, and the number of revolutions may all affect the mixing efficiency.
For understanding the performance and mechanism of this type of mixer the reader is

5
referred to [24, 25, 26].
Resonant Acoustic Mixer (RAM)
RAM, which is rather a new and not thoroughly studied mixer, transfers low frequency,
high-intensity acoustic energy to the material to be mixed. There are no impellers used
in RAM technology, so a wide range of mixing conditions can be achieved with a simple
vessel design [27]. All three mixing mechanisms (convection, dispersion, and shear)
are expected to be present. Micro-mixing zones as well as the bulk movement of the
materials take place throughout the entire vessel.
The total mixing power, Pmix, which is independent of the material properties, can be
calculated by the following empirical equiation:
Pmix = 0.707 Frms
(∆P
100
)(apeak g
2πf
)= Emix ×
m
tmix(1.1)
where ∆P is the difference in power intensity of the loaded from the unloaded masses,
Frms is the machine force constant (' 70 N), g is the gravitational constant, apeak is
the peak acceleration experienced at the specific power intensity and f is the frequency
of (61 Hz) at which the resonant acoustic mixer operates. The value of 0.707 is the
correction factor. Measuring the total mixing time, tmix, and the total powder mass,
m, the total energy per unit mass, Emix can be determined. Fill level, blending time,
and acceleration are the key parameters that affect the RAM performance [28].
For more information regarding the performance and technology of RAM, please refer
to [27, 28, 29].
Glatt Continuous Blender
Continuous powder mixing has received more attention by the increasing interest toward
continuous pharmaceutical oral solid dose manufacturing. Continuous blenders use
rotating blades that force the ingredients to transport and mix along the way. Like
RAM, continuous blenders are independent of material properties. Blade configuration
(i.e., orientation and number of blades) and impeller speed, which determines the mass

6
flow rate, affect the mixing performance [30, 31, 32, 33].
1.5 Tablet Tensile Strength
It is important to assure that tablets have sufficient strength to endure post-compaction
loading such as coating, packaging, handling, and storage. The dissolution profile of
a drug tablet is also influenced by its mechanical properties [34]. Hardness is thus an
important quality factor that is tested during tablet production [35]. The mechanical
strength of tablets is typically measured by traditional destructive tests, such as three-
point bending, four-point bending, diametrical compression, and axial tensile strength
tests [36, 37, 38, 39].
Figure 1.3: Geometry and failure behavior in a flat faced cylindrical tablet.
Among these experimental techniques, the diametrical compression test, also referred
to as Brazilian test [40], is the most conventional method used in the pharmaceutical
industry to measure the breaking force of a tablet. The test consists in placing and
compressing a tablet along its diameter between two rigid platens as shown in Fig. 1.3.
Hertz [41] developed a mathematical description for the stress states of an elastic disk
under point loading diametrical compression, where here the equations are presented
considering a tablet as the sample:
σx =−2F
πt
[x2(D − y)
((D − y)2 + x2)2+
x2(D + y)
((D + y)2 + x2)2− 1
2D
](1.2)

7
σy =−2F
πt
[(D − y)3
((D − y)2 + x2)2+
(D + y)3
((D + y)2 + x2)2− 1
2D
](1.3)
σxy =2F
πt
[x(D − y)2
((D − y)2 + x2)2+
x(D + y)2
((D + y)2 + x2)2
](1.4)
where F is the breaking force, D is the diameter of the tablet, and t is its thickness.
Maximum principal tensile stress occuring in the center of the disc and along the x-
direction is predicted to be the cause of failure assuming the maximum stress criterion
(σy = σxy = 0). Thus, by replacing x and y with zero, corresponding to the center of
the tablet, in Eq. (1.2), Hertz solution is obtained:
σt =2F
πDt(1.5)
where σt is the tensile strength. The above expression is only valid for flat cylindrical
tablets that fail in tension across the symmetry plane of the loaded diameter.
Hardness (i.e., breaking force) has been traditionally reported and still used as a critical
quality attribute (CQA). However, tensile strength is a better representative of the
tablet strength, which actually is a measure of tablet strength and is independent of
the tablet dimensions [42, 43].
1.6 Compressibility, Compactibility, and Tabletability
Tye et al. [44] introduced three important terms that give a lot of information about
tablet compaction: Tabletability (tensile strength vs. compaction pressure), compress-
ibility (relative density vs. compaction pressure), and compactability (tensile strength
vs. relative density). There is a big difference between compressibility and compactabil-
ity of powders. Compressibility refers to the ability of the powder to undergo volume
reduction under pressure, whereas compactibility is the ability of a powder to form a
coherent compact.
Relative density is used to characterize powders at different stages of densification. By
applying more force to the powder bed the relative density of the tablet increases.

8
There are two main factors that affect the tablet properties (e.g., hardness, disintegra-
tion, and dissolution profiles): (i) material properties (e.g., constituents of the powder
mixture, particle size and shape) and (ii) processing parameters (e.g., mixing conditions,
compaction force, compaction speed, etc.). By understanding the behavior of process-
ing parameters on the performance of the tablet, the tablet properties can actually be
engineered.
1.7 Organization of the Dissertation
Given the brief introduction of powder compaction and some relevant terminologies in
Chapter 1, the three specific objectives of this dissertation are summarized as follows:
1. Finding an optimal relationship for tensile strength of doubly convex tablets under
diametrical compression.
2. Predicting tensile strength of pharmaceutical tablets by ultrasound measurement
in continuous manufacturing.
3. Quantifying the lubrication and particle size distribution effects on tensile strength
and stiffness of tablets.
A chapter has been dedicated for each specific objective. Each chapter starts with the
background of the problem and relevant published literature. Materials and methods
used in the work are provided followed by the results and key findings. Each chapter
ends with a summary and concluding remarks. Chapter 5 provides an overall conclusion
and a set of recommendations for future studies.

9
Chapter 2
General and Mechanistic Optimal Relationships for
Tensile Strength of Doubly Convex Tablets Under
Diametrical Compression
2.1 Introduction
Diametrical compression test was first implemented by Carneiro and Barcellos [40]
to measure the tensile failure of flat cylindrical concrete samples using the equation
Eq. (1.5) developed by Timoshenko and Goodier [45] and Frocht [46]. In 1968, the
test was employed on lactose tablets to determine their tensile strength [47] and has
been used ever since. There has been controversy about the applicability of the Hertz
solution. For example, Procopio et al. [48] discussed that the strain at which failure
occurs under diametrical load is an important crtierion for the validity of Hertz solution.
It bears emphasis that all compacted powders are brittle [37] and, in sharp contrast to
ductile materials, they do not exhibit significant permanent deformations before failure.
Nowadays, tablets are no longer produced only in a flat cylindrical shape and are manu-
factured in different shapes and dimensions to aid identification, subsequent processing
or to just simply enhance marketability. In this chapter, the tensile strength determi-
nation of a doubly convex cylindrical tablet is presented.
The diametrical compression test can still be used for non-flat faced tablets. However,
the conversion of a breaking force to tensile strength is not that simple. In sharp
contrast to flat faced tablets, there is no closed-form analytical solution that relates
tensile strength and breaking force for curved faced tablets.
Tensile strength and breaking force increase exponentially with increasing relative den-
sity for typical pharmaceutical powders, tableting speeds, and tablet shapes (see, e.g.,
10
[44, 49, 50, 51]). In addition, the breaking force exhibits a strong dependence on the
shape of the tablet and only a mild dependence on the diametrical compression speed.
In order to find an optimal tensile strength relationship for curved faced tablets, Pitt
et al. [52] used a photoelastic method to measure the stress distribution of doubly con-
vex tablets subject to diametrical load. For doubly convex cylindrical gypsum discs,
they established the following empirical relationship [53] between geometric parameters,
breaking force and tensile strength:
σt =10F
πD2[2.84
(tD
)− 0.126
(tW
)+ 3.15
(WD
)+ 0.01
] (2.1)
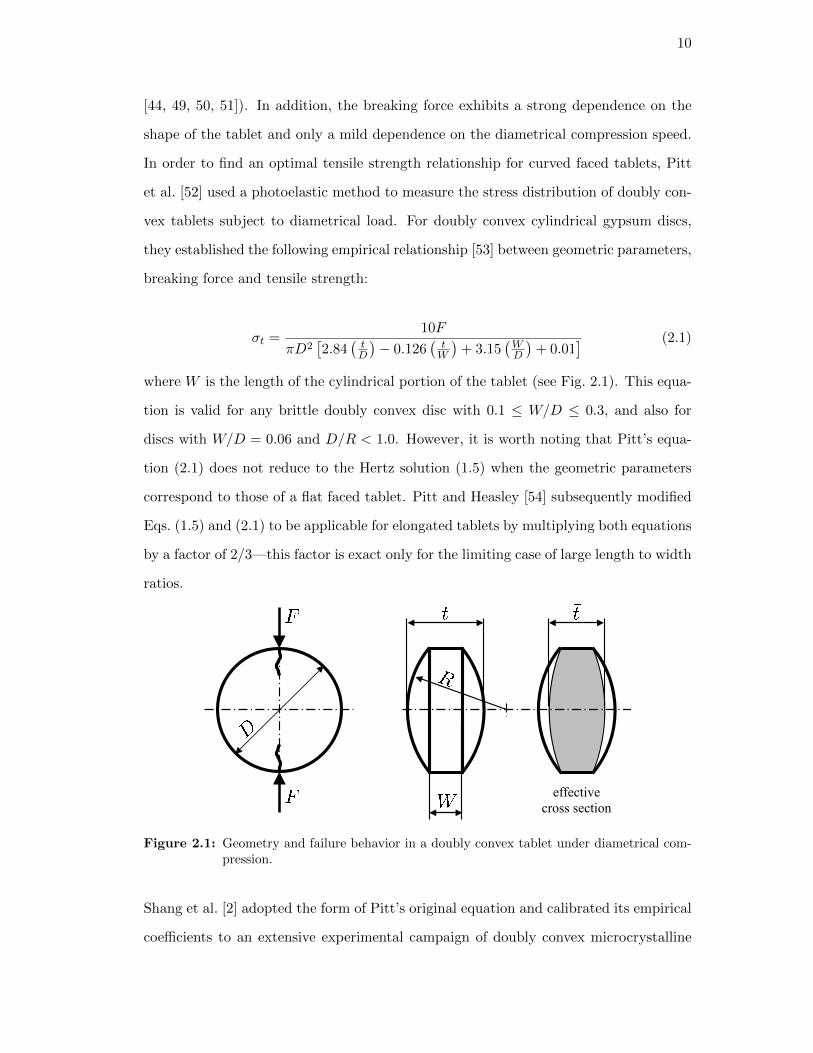
where W is the length of the cylindrical portion of the tablet (see Fig. 2.1). This equa-
tion is valid for any brittle doubly convex disc with 0.1 ≤ W/D ≤ 0.3, and also for
discs with W/D = 0.06 and D/R < 1.0. However, it is worth noting that Pitt’s equa-
tion (2.1) does not reduce to the Hertz solution (1.5) when the geometric parameters
correspond to those of a flat faced tablet. Pitt and Heasley [54] subsequently modified
Eqs. (1.5) and (2.1) to be applicable for elongated tablets by multiplying both equations
by a factor of 2/3—this factor is exact only for the limiting case of large length to width
ratios.
effective cross section
Figure 2.1: Geometry and failure behavior in a doubly convex tablet under diametrical com-pression.
Shang et al. [2] adopted the form of Pitt’s original equation and calibrated its empirical
coefficients to an extensive experimental campaign of doubly convex microcrystalline
11
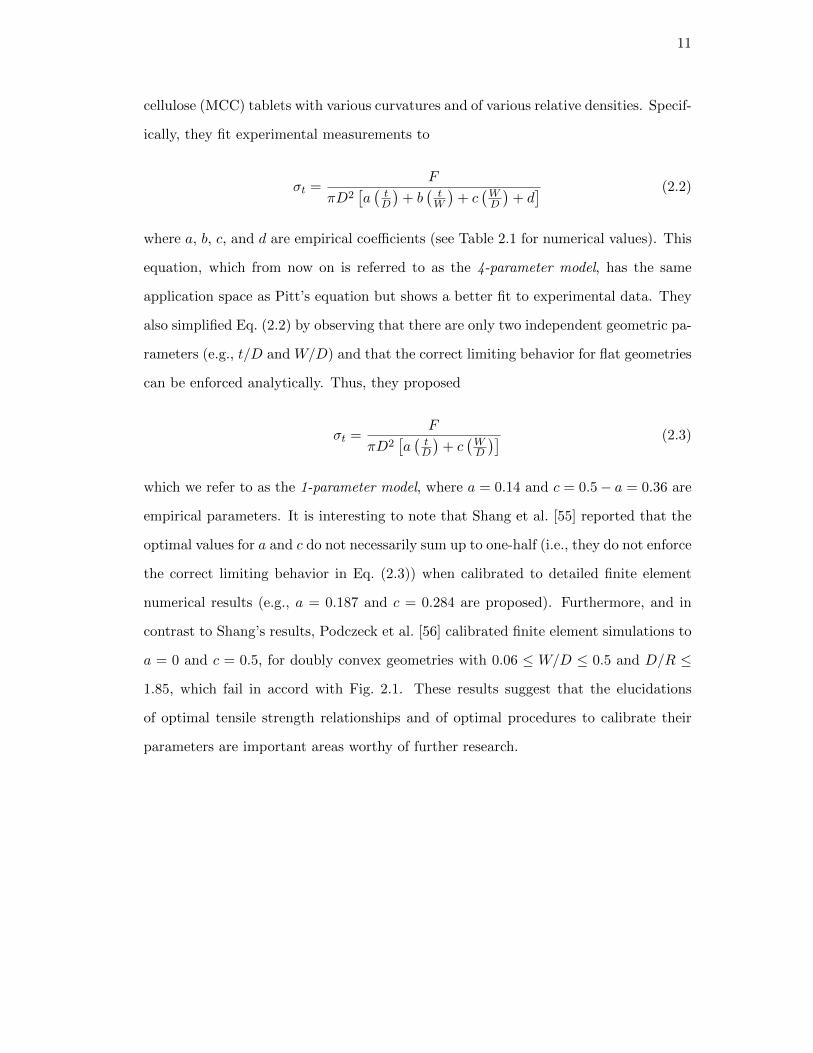
cellulose (MCC) tablets with various curvatures and of various relative densities. Specif-
ically, they fit experimental measurements to
σt =F
πD2[a(tD
)+ b
(tW
)+ c
(WD
)+ d] (2.2)
where a, b, c, and d are empirical coefficients (see Table 2.1 for numerical values). This
equation, which from now on is referred to as the 4-parameter model, has the same
application space as Pitt’s equation but shows a better fit to experimental data. They
also simplified Eq. (2.2) by observing that there are only two independent geometric pa-
rameters (e.g., t/D and W/D) and that the correct limiting behavior for flat geometries
can be enforced analytically. Thus, they proposed
σt =F
πD2[a(tD
)+ c
(WD
)] (2.3)
which we refer to as the 1-parameter model, where a = 0.14 and c = 0.5− a = 0.36 are
empirical parameters. It is interesting to note that Shang et al. [55] reported that the
optimal values for a and c do not necessarily sum up to one-half (i.e., they do not enforce
the correct limiting behavior in Eq. (2.3)) when calibrated to detailed finite element
numerical results (e.g., a = 0.187 and c = 0.284 are proposed). Furthermore, and in
contrast to Shang’s results, Podczeck et al. [56] calibrated finite element simulations to
a = 0 and c = 0.5, for doubly convex geometries with 0.06 ≤ W/D ≤ 0.5 and D/R ≤
1.85, which fail in accord with Fig. 2.1. These results suggest that the elucidations
of optimal tensile strength relationships and of optimal procedures to calibrate their
parameters are important areas worthy of further research.
12
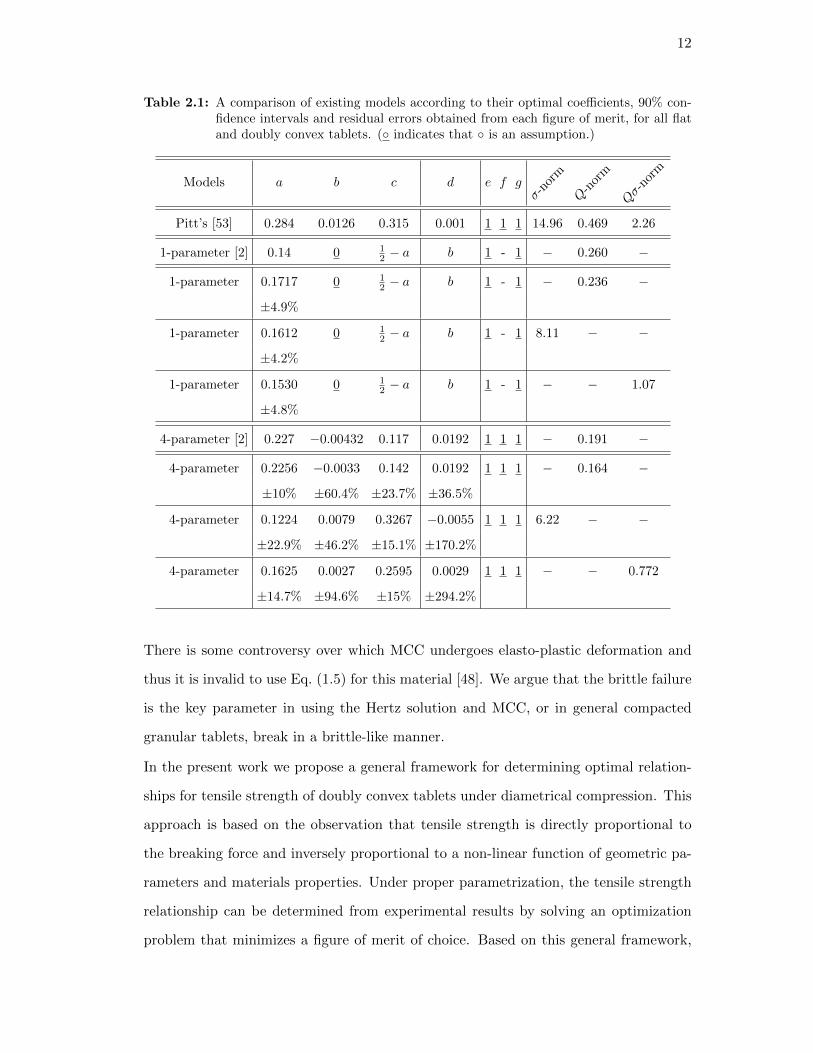
Table 2.1: A comparison of existing models according to their optimal coefficients, 90% con-fidence intervals and residual errors obtained from each figure of merit, for all flatand doubly convex tablets. (◦ indicates that ◦ is an assumption.)
Models a b c d e f gσ-
norm
Q-n
orm
Qσ-
norm
Pitt’s [53] 0.284 0.0126 0.315 0.001 1 1 1 14.96 0.469 2.26
1-parameter [2] 0.14 0 12 − a b 1 - 1 − 0.260 −
1-parameter 0.1717 0 12 − a b 1 - 1 − 0.236 −
±4.9%
1-parameter 0.1612 0 12 − a b 1 - 1 8.11 − −
±4.2%
1-parameter 0.1530 0 12 − a b 1 - 1 − − 1.07
±4.8%
4-parameter [2] 0.227 −0.00432 0.117 0.0192 1 1 1 − 0.191 −
4-parameter 0.2256 −0.0033 0.142 0.0192 1 1 1 − 0.164 −
±10% ±60.4% ±23.7% ±36.5%
4-parameter 0.1224 0.0079 0.3267 −0.0055 1 1 1 6.22 − −
±22.9% ±46.2% ±15.1% ±170.2%
4-parameter 0.1625 0.0027 0.2595 0.0029 1 1 1 − − 0.772
±14.7% ±94.6% ±15% ±294.2%
There is some controversy over which MCC undergoes elasto-plastic deformation and
thus it is invalid to use Eq. (1.5) for this material [48]. We argue that the brittle failure
is the key parameter in using the Hertz solution and MCC, or in general compacted
granular tablets, break in a brittle-like manner.
In the present work we propose a general framework for determining optimal relation-
ships for tensile strength of doubly convex tablets under diametrical compression. This
approach is based on the observation that tensile strength is directly proportional to
the breaking force and inversely proportional to a non-linear function of geometric pa-
rameters and materials properties. Under proper parametrization, the tensile strength
relationship can be determined from experimental results by solving an optimization
problem that minimizes a figure of merit of choice. Based on this general framework,

13
we develop three new optimal tensile strength relationships and three different figures
of merit to determine their optimal parameters. We also provide a set of guidelines
for assessing the performance of optimal tensile strength relationships, with which we
compare the new models with two models previously proposed in the literature (i.e.,
equations (2.2) and (2.3)). This analysis reveals that two of the new models, namely the
general and mechanistic models, are effective and predictive alternatives to the tensile
strength relationship currently used in the pharmaceutical industry.
2.2 Material and Methods
In the current study, microcrystalline cellulose MCC (Batch no. 1H59965, Avicel Ph102,
FMC biopolymer, Newark, DE) was employed. The true density of the pure MCC was
provided by the manufacturer and equal to 1540 kg/m3 and the original powder has
particle sizes between 0.23 µm and 700 µm.
Figure 2.2: Presster, a linear mechanical replicator of any rotary tablet press.
Tablets were manufactured using a 10 mm flat faced B tooling in a linear compaction
emulator (The Metropolitan Computing Corporation of East Hanover, NJ) to simulate
a Fette 2080 press (Fig. 2.2). A dwell time of 28.88 ms, corresponding to a production
speed of 38, 700 tablets per hour, was used. Tablets were stored for two weeks at ambient

14
room temperature and inside a sealed, clear plastic bag prior to the determination of
the breaking force.
The thickness and diameter of the tablets were carefully measured by a digital caliper
(±0.01 mm, Absolute digimatic Caliper), and the mass was recorded by a precision
balance (±0.001 g, Adventurer Ohaus). From these measurements, the volume and bulk
density of tablets were caluclated. The relative density of the tablets was determined
by the following equation
ρ =ρbρt
(2.4)
where ρb is the bulk density of the tablet and ρt is the true density of the powder.
As depicted in Fig. 2.3, the tablets were diametrically compressed using an Instron
testing machine (Model 4411, Instron, MA, USA) at a loading rate of 10 mm/min (see
Table 2.2 for numerical values). All tablets exhibited failure under pure tensile stress
with no significant permanent deformations during diametrical loading—verifying the
assumption of brittle fracture.
Figure 2.3: Instron 4411- 5kN tension compression test machine, used for diametrical com-pression tests. Compression platens are not installed in the figure.

15
Table 2.2: Characteristics of flat faced tablets and their calculated tensile strength values.Tensile strength values were calculated using Hertz solution Eq. (1.5).
Actual mass (g) Thickness (mm) Actual diameter (mm) Break force (N) Tensile strength (MPa)
1 0.2969 2.79 10.04 339.4 7.71
2 0.272 2.55 10.03 323.1 8.04
3 0.2718 2.58 10.05 299.1 7.34
4 0.2706 2.84 10.06 193.1 4.30
5 0.268 3 10.06 136.7 2.88
6 0.2687 3.03 10.08 141.4 2.95
7 0.267 3.42 10.08 84.2 1.55
8 0.2428 3.66 10.1 38.7 0.67
9 0.2416 3.61 10.09 39.3 0.69
10 0.2828 3.03 10.07 189.6 3.96
11 0.2696 3.02 10.06 150.2 3.15
12 0.2701 2.96 10.06 159.6 3.41
13 0.3022 2.8 10.04 372.7 8.44
14 0.2995 2.8 10.04 299.9 6.79
15 0.2999 2.8 10.04 365.6 8.28
16 0.3105 2.82 10.02 472.0 10.63
17 0.3261 2.9 10.02 483.1 10.58
18 0.3249 2.86 10.01 553.4 12.30
19 0.3584 3.17 10.03 588.5 11.78
20 0.357 3.2 10.03 606.2 12.02
21 0.3592 3.15 10.01 610.3 12.32
22 0.3626 3.19 10.02 616.1 12.27
23 0.3661 3.24 10.02 621.0 12.18
24 0.3775 3.28 10.01 645.4 12.51
25 0.3726 3.28 10.02 620.5 12.02
26 0.2716 3.58 10.08 59.2 1.04
27 0.2693 3.56 10.07 78.8 1.40
28 0.2659 3.05 10.06 110.6 2.29

16
2.3 Results
2.3.1 Optimal Tensile Strength Relationships
The tensile strength σt is related to the breaking force F under diametrical compression
by the following general equation
σt =F
πD2Q(2.5)
where Q is a non-linear function of geometric parameters and material properties. For
example, for flat faced elastic isotropic cylindrical tablets, Q = t/2D when the tablet
is under concentrated loads [45] and Q = t/2D[1− (b/D)2]3/2 when the tablet is under
loads uniformly distributed on a stripe of width b [57]. Analytical expressions for
Q can also be derived under the assumption of radial pressures acting on the tablet
(see, e.g., [58] for uniform radial pressure and [59] for parabolic radial pressure) and for
flattened cylinders subject to uniform diametrical compression [60]. The functionQmay
additionally account for the effect of anisotropy [61] and plastic behavior [48], among
other material behavior. It may also account for the lack of plane stress conditions,
and the size and shape of the tablet, among other geometric characteristics.
For given powder and manufacturing conditions, we firstly presume that the tensile
strength σt depends on the relative density, ρ, the size s and shape S of the tablet,
σt := σt(ρ, s, S) (2.6)
Basically, there is an inevitable variability in the strength of tablets with same size,
shape and relative density distribution. In addition, the relative density distribution
depends on the shape of the tablet. These factors will statisitcally condition the spatial
distribution and severity of the microscopic and material defects within the region of
the tablet subject to the higher stresses where fracture will initiate and propagate from
[37].
Here as a first order approximation, we assume that σt is a material property that solely
depends on the relative density ρ of the tablet, for given powder and manufacturing

17
conditions, as also shown in [44] and [62]. To this end, several assumptions are taken
into consideration. First, the spatial distribution of density is assumed to have a second
order effect. Second, the size-dependency of tablet strength is not taken into account
for flat and doubly convex tablets with very similar diameters. This simplification is
based on the observation that the region of the tablet subject to the higher stresses
under diametrical compression is centered in the cross section. Third, the variability
of tablet strength is assumed negligible, that is the Weibull modulus m of the material
(i.e., a reciprocal measure of the strength variability of the brittle material) is assumed
to have a very large value and thus the distribution of measured strength to be very
narrow [63].
The function σt(ρ) can then be readily obtained from an experimental campaign of
flat faced cylindrical tablets. We also assume that Q is strictly a geometric function,
for given powder properties or manufacturing variables. Based on such assumptions,
the function Q can be determined from experimental results by solving the following
optimization problem
minQ:S→R
∑{Si,ρi}∈S×D
(σt(ρi)−
Fiπ D2
i Q(Si)
)21/2
=: minQ:S→R
σ−norm
where S is the space of all possible tablet shapes that fail in tension under diametrical
compression, D is an interval of tablet relative densities (e.g., from the smallest density
at which a solid tablet free of macroscopic defects is formed, to full compaction or rela-
tive density of 1.00), and Di is the diameter of shape Si along which the breaking force
Fi is applied. In the above expression, σt(ρi) is obtained from a flat faced cylindrical
made with the same powder and under the same manufacturing conditions is employed
for making the tablet with shape Si and relative density ρi. Alternatively, the function
Q can be determined by solving any of the following equivalent problems
minQ:S→R
∑{Si,ρi}∈S×D
(Q(Si)−
Fiπ D2
i σt(ρi)
)21/2
=: minQ:S→R
Q−norm

18
minQ:S→R
∑{Si,ρi}∈S×D
(Q(Si) σt(ρi)−
Fiπ D2
i
)21/2
=: minQ:S→R
Qσ−norm
It bears emphasis that these equivalent optimization problems determine Q by enforc-
ing Eq. (2.5), that is they determine an optimal tensile strength relationship. If there
were no experimental uncertainty and second order effects mentioned above were neg-
ligible, these three optimization problems behave similarly and have the same solution.
However, in reality, experimental uncertainty is unavoidable and the form of Q has to
be approximated and parametrized. Thus, our goal is to find the optimal form for Q
and the most stable optimization problem to determine its fitting parameters (i.e., for
example, the minimization of the Q-norm, the σ-norm, or the Qσ-norm).
0.5 0.6 0.7 0.8 0.9 1
Relative density
0
2
4
6
8
10
12
Tensile
str
ength
, M
Pa
Shang et al. (2013a)
Our experiments
Figure 2.4: Relationship between tensile strength and relative density of flat faced tablets.According to Eq. (2.4), A and B are 24.68 kPa and 6.516 for the full curve and20.65 kPa and 6.787 for the dashed curve, respectively.
In the interest of applicability, we restrict attention to doubly convex tablets whose
shapes can be parametrized by t/D, t/W , W/D as depicted in Fig. 2.1. Specifically, we
consider MCC tablets for which Shang et al. [2] have obtained the relationship between
tensile strength and relative density using flat faced tablets (see Fig. 2.4 and Table 2.3
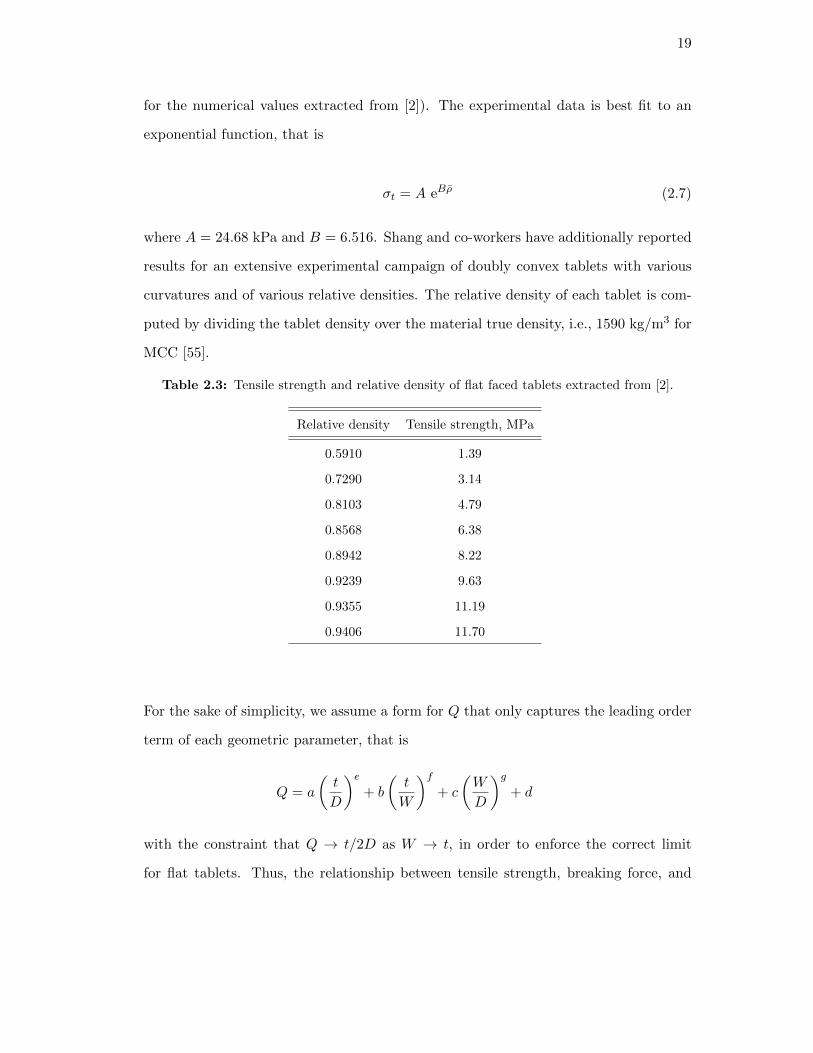
19
for the numerical values extracted from [2]). The experimental data is best fit to an
exponential function, that is
σt = A eBρ (2.7)
where A = 24.68 kPa and B = 6.516. Shang and co-workers have additionally reported
results for an extensive experimental campaign of doubly convex tablets with various
curvatures and of various relative densities. The relative density of each tablet is com-
puted by dividing the tablet density over the material true density, i.e., 1590 kg/m3 for
MCC [55].
Table 2.3: Tensile strength and relative density of flat faced tablets extracted from [2].
Relative density Tensile strength, MPa
0.5910 1.39
0.7290 3.14
0.8103 4.79
0.8568 6.38
0.8942 8.22
0.9239 9.63
0.9355 11.19
0.9406 11.70
For the sake of simplicity, we assume a form for Q that only captures the leading order
term of each geometric parameter, that is
Q = a
(t
D
)e+ b
(t
W
)f+ c
(W
D
)g+ d
with the constraint that Q → t/2D as W → t, in order to enforce the correct limit
for flat tablets. Thus, the relationship between tensile strength, breaking force, and

20
geometric parameters, i.e., Eq. (2.5), simplifies to
σt =F
πD2[a(tD
)e+ b
(tW
)f+ c
(WD
)g+ d] (2.8)
where the parameters {a, b, c, d, e, f, g} are either assumed known or optimally estimated
from a set of experimental observations (e.g., Shang’s dataset [2]) using different figures
of merit (e.g., σ-norm, Q-norm, and Qσ-norm). If e = f = g = 1, the 4-parameter
model is recovered, i.e., Eq. (2.2). However, if Pitt’s coefficients are used in the 4-
parameter model then the correct limit for flat tablets is not attained, indicating that
there is a different set of coefficients that further minimizes the problem presented
above. Similarly, if b = 0, c = 1/2 − a and e = g = 1, the 1-parameter model is
recovered, i.e., Eq. (2.3). Table 2.1 summarizes the optimal values for the parameters
of these two particular forms of Q when determined from the dataset reported in [2]
using MATLAB multistart algorithm [64] and each of the three figures of merit. In
addition, the 90% confidence bound of each optimal parameter and the residual error
obtained from each optimization are reported in the table. It bears emphasis that the
optimization is performed under the assumption that a flat faced tablet and doubly
curved tablet have the same tensile strength if they have the same relative density.
The minimization of the Q-norm has been used by previous authors and therefore the
corresponding fitted parameters are close to those reported in [2]. It is interesting to
note that our optimal values for the parameters result in a smaller residual error than
that obtained with previously reported values. This may be attributed to the good
performance of the multistart algorithm employed or to rounding errors in the values
of σt(ρ) retrieved from [2]. In the case of the 4-parameter model, the improvement over
Pitt’s equation is evident. These results also reveal that the 1-parameter model leads
to a well-defined stable optimization problem (i.e., error bounds are small and solutions
are less sensitive to the figure of merit) and that the 4-parameter model leads to a better
physical description of the tensile strength (i.e., the residual errors are systematically
smaller than those obtained with the 1-parameter model).
It is important to note that the fidelity and robustness of these optimal tensile strength

21
relationships can be further improved by: (i) considering a more general, mechanisti-
cally informed expression for Q, (ii) extending the size and variety of the experimental
dataset, (iii) restricting attention to those tablets which failed under pure tensile stress
(see, e.g., [2, 55, 56] for other failure mechanisms). These three aspects are examined
next in turn.
General Model
The correct limit of Q for flat tablets, i.e., Q → t/2D as W → t, can be imposed
analytically by writing Eq. (2.8) as follows
σt =F
πD2[a(WD
)e+ b
(tW
)f+ 1
2
(tD
)− a
(tD
)e − b] (2.9)
where {a, b, e, f} are the fitting parameters. We note that Eq. (2.9), referred to as
the general model, not only exhibits the correct limit for flat geometries and captures
the leading order behavior of Q but it also reduces the dimension of the search space
from 7 to 4. Coincidentally, the general model and the 4-parameter model (i.e., any
re-calibration of Pitt’s equation) have a search space of dimension 4. Therefore, the
general model requires a computation effort for the optimization of its parameters
similar to that of previous models but it allows for a better physical description of the
tensile strength. Moreover, by imposing e = f = 1 on Eq. (2.9)—or the correct limit
on Eq. (2.2)—a new 2-parameter model is recovered
σt =F
πD2[a(tD
)+ b
(tW
)+(
12 − a
)WD − b
] (2.10)
where {a, b} are the fitting parameters.

22
Figure 2.5: Failure modes of doubly convex MCC tablets [2].
In order to assess the behavior of the proposed models, we restrict attention to those
tablets with diameter D = 10.318 mm reported in [2], which exhibited crack formation
and propagation under pure tensile stress. Fig. 2.5 illustrates the change in the failure
mode under diametrical load as the radius of curvature incerases in the doubly convex
tablets. Specifically, we excluded ball (D/R = 1.842), extra deep (D/R = 1.374) and
some deep tablets (D/R = 0.988) having W/D ≈ 0.2 and t/D ≈ 0.45.
The optimal values for the parameters of the 1-parameter (2.3), 2-parameter (4.5), 4-
parameter (2.2), and general (2.9) models are reported in Table 2.4. Confidence bounds
and residual errors are also reported in the table.

23
Table 2.4: A comparison between all models according to their optimal coefficients, 90% confi-dence intervals and residual errors obtained from each figure of merit, for only thoseflat and doubly convex tablets that failed under pure tensile stress. (◦ indicatesthat ◦ is an assumption.)
Models a b c d e f gσ-
norm
Q-n
orm
Qσ-
norm
Pitt’s [53] 0.284 0.0126 0.315 0.001 1 1 1 13.3 0.43 2.13
1-parameter 0.1316 0 12− a b 1 - 1 − 0.196 −
±10.1%
1-parameter 0.1236 0 12− a b 1 - 1 6.43 − −
±7.5%
1-parameter 0.1016 0 12− a b 1 - 1 − − 0.739
±9.5%
2-parameter −0.0202 0.0285 12− a −b 1 1 1 − 0.16 −
±164.7% ±20.7%
2-parameter −0.0538 0.0278 12− a −b 1 1 1 4.71 − −
±51.3% ±16%
2-parameter −0.0550 0.0278 12− a −b 1 1 1 − − 0.568
±50.1% ±16.9%
4-parameter 0.1406 0.0077 0.2626 −0.0037 1 1 1 − 0.139 −
±35% ±107.7% ±28.8% ±430.5%
4-parameter −0.0382 0.0296 0.5615 −0.0390 1 1 1 4.5 − −
±114.8% ±24.9% ±13.3% ±37.2%
4-parameter −0.0132 0.0262 0.5193 −0.0332 1 1 1 − − 0.539
±328.5% ±29.5% ±14% ±46.5%
general 0.3231 0.0240 a 12tD− b 1.6963 −263.5 e − 0.146 −
±10.9% ±36% ±12% ±∞%
general 0.0484 0.8688 a 12tD− b −0.8553 −0.3147 e 3.85 − −
±267.6% ±83% ±82.7% ±43.4%
general 0.7289 2.3185 a 12tD− b −0.3151 −0.2156 e − − 0.463
±689.1% ±409% ±283.8% ±209.9%
The residual errors for 1-parameter and 4-parameter models are noticeably reduced in
comparison to Table 2.1, confirming that those tablets that did not fail under tensile
stress should not be included and treated as the rest of the tablets. Furthermore, it
is evident from the table that the 2-parameter outperforms the 1-parameter model,
24
suggesting that t/W is required in the expression for Q—though perhaps to a power
f different from 1. Finally, the 4-parameter and the general models have very similar
residual errors for all three figures of merit and, in particular, the 4-parameter model
exhibits a better performance for the Q-norm.
This last observation provides additional insight into the role of flat faced tablets in
the optimization process. The 4-parameter model does not have the correct limiting
behavior for flat faced tablets. However, only 5.7% are flat faced tablets in the dataset
and thus their contribution to the overall residual error is negligible. In other words,
the optimization process reduces the error for doubly convex tablets in detriment to
the predictability of the model for shallow/flat tablets. Specifically, the 4-parameter
model exhibits, in average, a 65% larger error for flat faced tablets and a 5% smaller
error for curved tablets than the general model. The inclusion of more flat tablets in
the dataset may, however, have the opposite effect. We further study this issue in the
next subsection.
Role of Flat Faced Tablets in the Optimization Process
We extended the experimental dataset in [2] with a new series of tests on flat faced
tablets. Specifically, 28 flat tablets of pure MCC were manufactured according to the
description explained in Section 2.2. The new fitting parameters to the exponential
function (2.4) are A = 20.65 kPa and B = 6.787, as depicted in Fig. 2.4. We specif-
ically tested few tablets with relatively low and high relative densities to capture a
wider range. Even though, the manufacturing conditions were different, the two fitting
exponential curves are very close to each other. Thus, combining the data points is
acceptable for the purpose of this study.
Table 2.5 shows the optimal values for the parameters of the 1-parameter (2.3), 2-
parameter (4.5), 4-parameter (2.2), and general (2.9) models when calibrated with the
extended experimental campaign. Flat faced tablets now represent 21.3% of the total
number of tablets (cf. 5.7% in the previous section). In contrast to results in Table 2.4,
the general model exhibits smaller residual errors than those of the 4-parameter model
for all the figures of merit. This result confirms that, by including more flat faced

25
tablets in the dataset, the limiting behavior of the 4-parameter model is improved only
in detriment of its overall behavior. Specifically, the 4-parameter model now exhibits,
in average, a 1% smaller error for flat faced tablets and a 17% larger error for curved
tablets than the general model. The general model, however, automatically exhibits
the correct limit, rendering the unnecessary need of a large number of experiments for
flat geometries. The cost- and time-effectiveness of using the general model is evident.
It bears emphasis that experimental errors and uncertainty in the functionality of the
geometric function Q render the problem ill-posed (i.e., the solution is not unique,
sensitive to errors, and dependent on the norm which is minimized). Experimental
errors cannot be eliminated but one can minimize the figure of merit that provides
more stability to the optimization process. According to our case study, this is the case
of the σ−norm and thus the optimization problem reduces to
mina,b,e,f
∑i∈P
σt(ρi)− Fi
π D2i
[a(WiDi
)e+ b
(ti/DiWi/Di
)f+ 1
2
(tiDi
)− a
(tiDi
)e− b]
21/2
where P is a set of experimental points and σt(ρi) is obtained from a small number of
flat faced tablets.
Mechanistic Interpretation
A major source of uncertainty is the fact that the functionality of Q is unknown in
general. However, further insight can be gained by recasting the problem in terms of
an effective cross-sectional surface area, A, associated with strength, that is
σt =2F
πA(2.11)
where A = tD for flat-faced tablets (cf. Eq. (1.5)). For doubly convex tablets, we
parametrize A by an effective thickness t (see Fig. 2.1) as follows
A = D2
[2
(t
D− W
D
)[1
3+
1
15
(t
D− W
D
)2]
+W
D
]+O
((t−W )5
D3
)(2.12)

26
Table 2.5: Recalibration of optimal coefficients, 90% confidence interval and residual errors forflat and doubly convex tablets that failed under pure tensile stress, using a largergroup of flat faced tablets in the optimization process. (◦ indicates that ◦ is anassumption.)
Models a b c d e f gσ-
norm
Q-n
orm
Qσ-
norm
1-parameter 0.1145 0 12− a b 1 - 1 − 0.229 −
±12.4%
1-parameter 0.0949 0 12− a b 1 - 1 8.95 −
±11%
1-parameter 0.0654 0 12− a b 1 - 1 − − 1.025
±17.7%
2-parameter −0.0380 0.0287 12− a −b 1 1 1 − 0.200 −
±99% ±23.3%
2-parameter −0.1117 0.0321 12− a −b 1 1 1 6.90 − −
±29.4% ±16.6%
2-parameter −0.1205 0.0330 12− a −b 1 1 1 − − 0.838
±29.1% ±18.2%
4-parameter 0.0442 0.0198 0.4183 −0.0185 1 1 1 − 0.187 −
±109% ±46.6% ±18.1% ±99.5%
4-parameter −0.1187 0.0415 0.6975 −0.0655 1 1 1 6.26 − −
±31.2% ±15.7% ±7.9% ±18.8%
4-parameter −0.1316 0.0444 0.7211 −0.0720 1 1 1 − − 0.776
±29.2% ±16.6% ±8% ±20.8%
general 3.0992 3.9923 a 12tD− b −0.1640 −0.2006 e − 0.178 −
±1313% ±972.5% ±593.1% ±508.3
general 0.0342 0.6553 a 12tD− b −0.9648 −0.436 e 5.54 − −
±278.9% ±76.4% ±82% ±41.1
general 0.1344 0.8150 a 12tD− b −0.6065 −0.4411 e − − 0.687
±517.8% ±199.8% ±182.4% ±186.3
This parametrization is made only in the interest of simplicity. However, a geometric
interpretation of the above equation suggests that t/D may be a function of D/R, which
we postulate to be
t
D=W
D+ α
(D
R
)β ( t
D− W
D
)

27
where α > 0 and β ≥ 0 are fitting parameters. As a result, a new relationship between
geometric parameters, breaking force, and tensile strength is obtained, i.e.,
σt =2F
πD2[2α(DR
)β ( tD −
WD
) [13 + α2
15
(DR
)2β ( tD −
WD
)2]+ W
D
] (2.13)
which is referred to as the mechanistic model. It is interesting to note that the mech-
anistic model has a substantially different functionality compared to the one of the
general model (2.9). In the case of t = (t + W )/2, however, the 1-parameter model
is approximately recovered with a = 1/6, which is very close to the optimal value ob-
tained in our case study (see Table 2.1). Thus, a more clear connection between the
mechanistic model and the general model is desirable, which is beyond the scope of this
work.
Table 2.6: Mechanistic model optimal coefficients, 90% confidence bound and residual errorsfrom each figure of merit, for those tablets in the extended dataset that failed underpure tensile stress.
Model α βσ-
norm
Q-n
orm
Qσ-
norm
mechanistic 0.5817 3.9736 − 0.172 −
±8.6% ±25.5%
mechanistic 0.5562 3.9877 5.97 − −
±9.4% ±15.4%
mechanistic 0.5377 5.0030 − − 0.699
±9.4% ±18.3%
The optimal values for α and β, determined from the extended dataset with four dif-
ferent shapes of tablets (Section 2.3.1) using each of the three figures of merit, are
presented in Table 2.6. The residual errors are comparable to those of the general
model and the stability is remarkable, as shown by the tight confidence bounds. The
optimal values are clearly insensitive to the figure of merit. In addition, the search space
of the mechanistic model is of dimension 2 whereas the one of the general model is of
dimension 4. Fig. 2.6 compares the predictability between the four models discussed
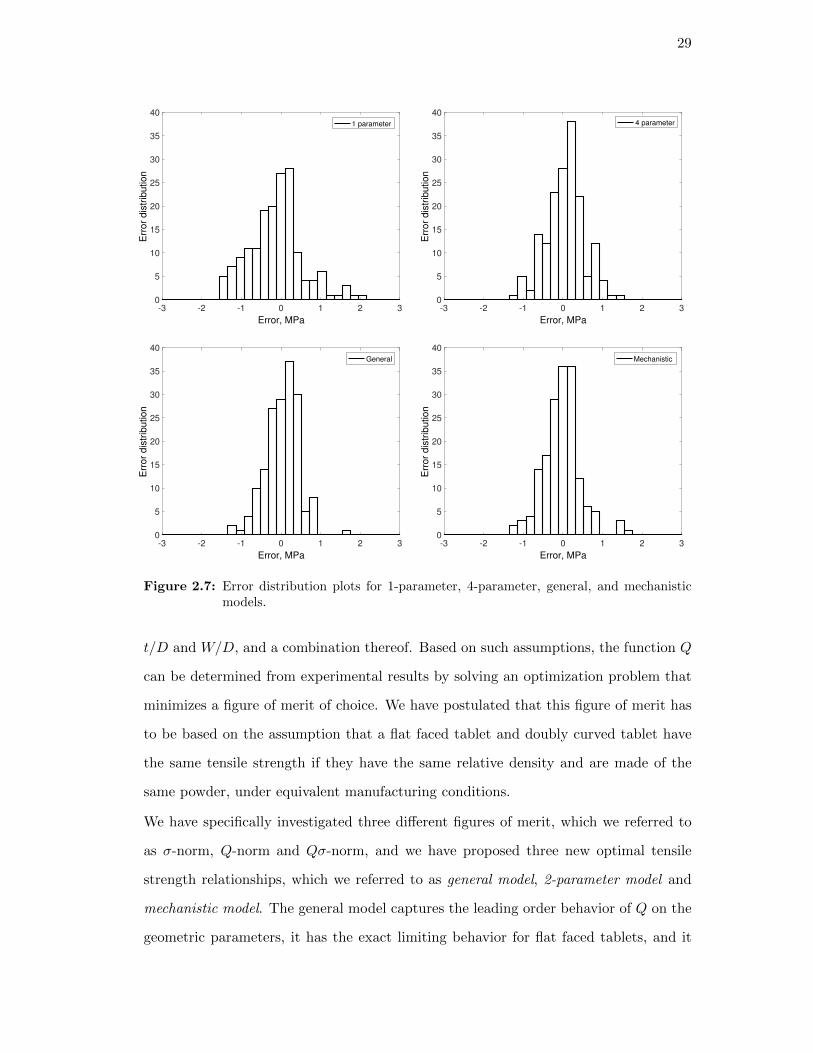
in this study. The error distributioin plot for each model is presented in Fig. 2.7. The

28
mechanistic model has the largest number of small errors compared to the other models.
Thus, the mechanistic model is preferable both in terms of efficacy and efficiency.
0.5 0.6 0.7 0.8 0.9 1
Relative density
0
2
4
6
8
10
12
14
Tensile
str
ength
, M
Pa
1 parameter
Experimental
0.5 0.6 0.7 0.8 0.9 1
Relative density
0
2
4
6
8
10
12
14
Tensile
str
ength
, M
Pa
4 parameter
Experimental
0.5 0.6 0.7 0.8 0.9 1
Relative density
0
2
4
6
8
10
12
14
Tensile
str
ength
, M
Pa
General
Experimental
0.5 0.6 0.7 0.8 0.9 1
Relative density
0
2
4
6
8
10
12
14
Tensile
str
ength
, M
Pa
Mechanistic
Experimental
Figure 2.6: The relationship between tensile strength and relative density of the experimentaldata using σ−norm.
2.4 Summary and Conclusion
We have proposed a general framework for determining optimal relationships for tensile
strength of doubly convex tablets under diametrical compression. The approach is based
on the observation that tensile strength is directly proportional to the breaking force and
inversely proportional to Q, a non-linear function of geometric parameters and materials
properties. This generalization reduces to the analytical expression commonly used for
flat faced tablets, i.e., Hertz solution, for Q = t/2D. Here, we have assumed that Q
is solely a function of geometric parameters that, for doubly convex tablets, reduces to
29
-3 -2 -1 0 1 2 3
Error, MPa
0
5
10
15
20
25
30
35
40
Err
or
dis
trib
ution
1 parameter
-3 -2 -1 0 1 2 3
Error, MPa
0
5
10
15
20
25
30
35
40
Err
or
dis
trib
ution
4 parameter
-3 -2 -1 0 1 2 3
Error, MPa
0
5
10
15
20
25
30
35
40
Err
or
dis
trib
ution
General
-3 -2 -1 0 1 2 3
Error, MPa
0
5
10
15
20
25
30
35
40
Err
or
dis
trib
ution
Mechanistic
Figure 2.7: Error distribution plots for 1-parameter, 4-parameter, general, and mechanisticmodels.
t/D and W/D, and a combination thereof. Based on such assumptions, the function Q
can be determined from experimental results by solving an optimization problem that
minimizes a figure of merit of choice. We have postulated that this figure of merit has
to be based on the assumption that a flat faced tablet and doubly curved tablet have
the same tensile strength if they have the same relative density and are made of the
same powder, under equivalent manufacturing conditions.
We have specifically investigated three different figures of merit, which we referred to
as σ-norm, Q-norm and Qσ-norm, and we have proposed three new optimal tensile
strength relationships, which we referred to as general model, 2-parameter model and
mechanistic model. The general model captures the leading order behavior of Q on the
geometric parameters, it has the exact limiting behavior for flat faced tablets, and it

30
has four optimal parameters to be determined. The 2-parameter model simplifies the
general model by assuming that Q is linear on the geometric parameters, and thus the
number of parameters is reduced to two while the correct limiting behavior is retained.
The mechanistic model is based on an effective cross-sectional surface area associated
with strength (i.e., in contrast to previous models, it has a well-defined mechanistic
interpretation), it exhibits the exact limiting behavior for flat geometries, and it only
has two optimal parameters.
Here, we present guidelines for assessing the performance of optimal tensile strength
relationships. Under this framework, other expressions for the non-linear function Q
can be explored and the assumption that Q only depends on geometric parameters can
even be relaxed. Similarly, figures of merit other than those studied here (i.e., σ-norm,
Q-norm and Qσ-norm) can be examined. It bears emphasis that, regardless of the
choice of Q and the optimization procedure, the performance of a new model can be
assessed following the same procedure presented here. A desirable model needs to have
a small number of optimal parameters to make it less computationally expensive. It
has to have the correct analytical limiting behavior for flat tablets (i.e., Hertz solution),
so that the tensile strength can be obtained from a small number of flat faced tablets.
It has to be predictive, i.e., the optimization has to result in a narrow and symmetric
distribution of errors around zero, for a given figure of merit. This figure of merit
in turn has to render the optimization problem stable, i.e., it has to provide optimal
parameters with tight confidence bounds.
Table 2.7: A systematic comparison of the proposed and existing models based on four differ-ent performance criteria.
Model Equation Number of Limiting Stability Predictability
Parameters Behavior (1:best–5:worst) (1:best–5:worst)
1-parameter (2.3) 1 X 1(σ-norm) 5
2-parameter (4.5) 2 X 3 (σ, Qσ-norm) 4
4-parameter (2.2) 4 × 4 (σ, Qσ-norm) 3
general (2.9) 4 X 5 (σ-norm) 1
mechanistic (2.13) 2 X 2 (σ-norm) 2
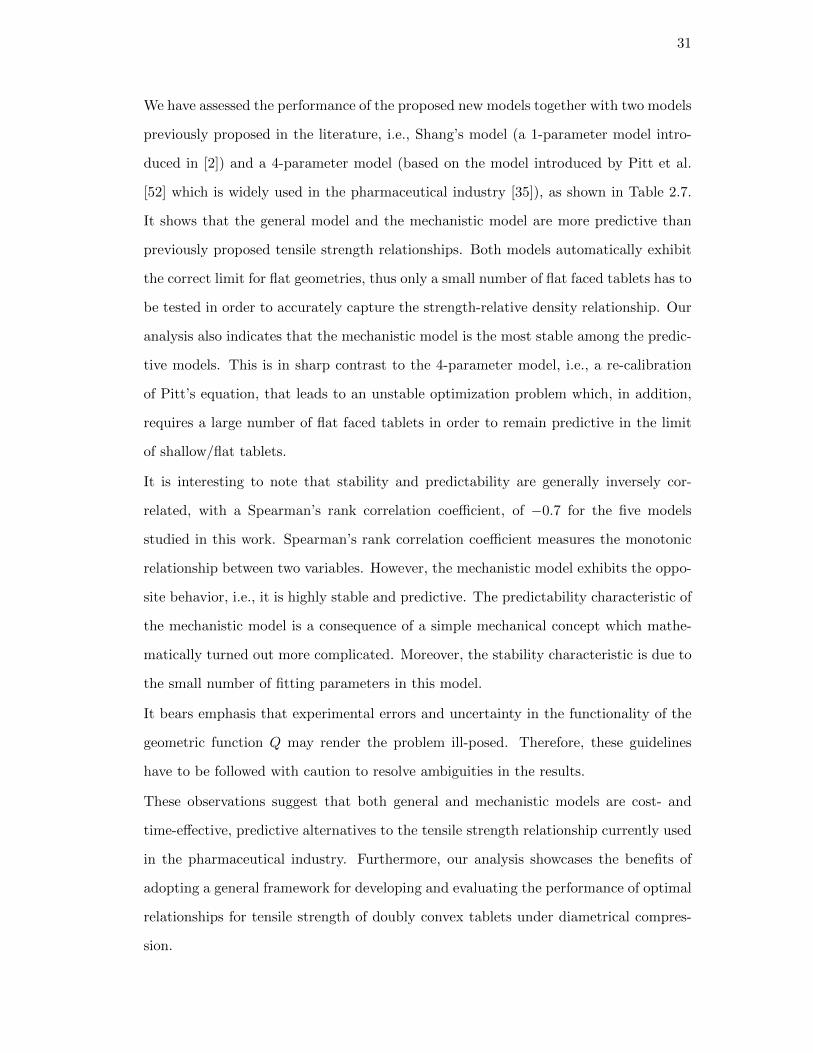
31
We have assessed the performance of the proposed new models together with two models
previously proposed in the literature, i.e., Shang’s model (a 1-parameter model intro-
duced in [2]) and a 4-parameter model (based on the model introduced by Pitt et al.
[52] which is widely used in the pharmaceutical industry [35]), as shown in Table 2.7.
It shows that the general model and the mechanistic model are more predictive than
previously proposed tensile strength relationships. Both models automatically exhibit
the correct limit for flat geometries, thus only a small number of flat faced tablets has to
be tested in order to accurately capture the strength-relative density relationship. Our
analysis also indicates that the mechanistic model is the most stable among the predic-
tive models. This is in sharp contrast to the 4-parameter model, i.e., a re-calibration
of Pitt’s equation, that leads to an unstable optimization problem which, in addition,
requires a large number of flat faced tablets in order to remain predictive in the limit
of shallow/flat tablets.
It is interesting to note that stability and predictability are generally inversely cor-
related, with a Spearman’s rank correlation coefficient, of −0.7 for the five models
studied in this work. Spearman’s rank correlation coefficient measures the monotonic
relationship between two variables. However, the mechanistic model exhibits the oppo-
site behavior, i.e., it is highly stable and predictive. The predictability characteristic of
the mechanistic model is a consequence of a simple mechanical concept which mathe-
matically turned out more complicated. Moreover, the stability characteristic is due to
the small number of fitting parameters in this model.
It bears emphasis that experimental errors and uncertainty in the functionality of the
geometric function Q may render the problem ill-posed. Therefore, these guidelines
have to be followed with caution to resolve ambiguities in the results.
These observations suggest that both general and mechanistic models are cost- and
time-effective, predictive alternatives to the tensile strength relationship currently used
in the pharmaceutical industry. Furthermore, our analysis showcases the benefits of
adopting a general framework for developing and evaluating the performance of optimal
relationships for tensile strength of doubly convex tablets under diametrical compres-
sion.

32
We close by pointing out some limitations of our analysis and possible avenues for
extensions of the general framework.
First, it is clear that the proposed parametric approximations for Q are not the only
non-linear functions of geometric parameters that exhibit the correct limit for flat faced
tablets. In addition, tensile strength of flat faced tablets may not be optimally described
by an exponential function of the relative density. It is also possible that the function
Q has to depend on powder properties or manufacturing variables in some cases of
industrial relevance. The systematic investigation of functions Q of the type proposed
here, the elucidation of their properties and the determination of the best optimal
relationships in each area of application, are worthwhile directions of future research.
Second, our general framework relies on the assumption that, for given powder and
manufacturing conditions, a flat faced tablet and doubly curved tablet have the same
tensile strength if they have the same relative density. This is indeed a good first order
approximation for the case study presented here (i.e., pure microcrystalline cellulose
pressed at low compaction speeds). There are experimental techniques that can as-
sess the density distribution of a tablet such as gamma-ray attenuation, x-ray micro
computed tomography, or solid-state nuclear magnetic resonance. However, there is
a lack of experimental technique that can test directly the point-to-point strength of
the material. Most techniques perform indirect measurements of effective properties,
with the exception of a beam-bending test that suffers from the difficulty of requiring
ad-hoc geometries for the specimen. Thus, particle mechanics simulations capable of de-
scribing strength formation and evolution during the compaction process are desirable
[65, 66, 67], but are beyond the scope of this work.
33
Chapter 3
Toward Predicting Tensile Strength of Pharmaceutical
Tablets by Ultrasound Measurement in Continuous
Manufacturing
3.1 Introduction
3.1.1 Batch vs. Continuous Manufacturing
Batch manufacturing consists of multiple discrete steps, which typically involves “hold
times” between steps. On the other hand, in continuous manufacturing (CM) the
material is processed in one step and sent directly and continuously to the next one
[68]. There are many advantages to CM, including: (i) integrated processing with
fewer steps, which results in minimal manual handling and increased safety; (ii) smaller
facilities (i.e., reduced cost); and (iii) on-line monitoring and control for enhanced
product quality assurance in real-time [69]. Many industries, such as petrochemical,
household goods, and food technologies, have shifted to CM. In the pharmaceutical
industry, CM has been introduced [68], but products are still manufactured mainly in
batches due to heavy regulations. The major barriers to CM are replacing old equipment
with new technology, which requires extensive training and employing reliable sensors
for quality assurance and control [70].
In an attempt to explore and address the manufacturing issues in the pharmaceutical
industry, the U.S. Food and Drug Administration (FDA) has released the Process Ana-
lytical Technology (PAT) initiative [71]. Designing and developing rapid techniques and
ultimately improving the quality of pharmaceutical products are the goals of the PAT
initiative. Quality by Design (QbD) initiative is a more recent attempt [72] to have a
34
better control on the critical quality attributes (CQAs) by understanding and explor-
ing the effects of critical material attributes (CMAs) or/and critical process parameters
(CPPs) [73]. Real time release testing (RTRT) is another terminology defined as “the
ability to evaluate and ensure the quality of in-process and/or final product based on
process data, typically include a valid combination of measured material attributes
and process controls” [74]. All these initiatives gear toward measuring techniques to
be rapid, robust, and preferably non-invasive. Just recently, FDA has approved two
continuously manufactured products [75].
Many researchers have explored and studied utilizing non-destructive techniques (e.g.,
Near Infrared (NIR) spectroscopy [76], NIR chemical imaging [77], Raman spectroscopy
[78], ultrasound and photoacoustic measurements [79, 80], and terahertz pulsed imaging
[81, 82, 83]) to predict or measure CQAs.
As discussed in the previous chapter, the mechanical strength of tablets is typically
measured by traditional destructive tests. The time spent to test the tablets destruc-
tively is in the order of minutes, which is not suitable for an on-line monitoring process.
Perhaps, the biggest drawback of these destructive tests is that they damage the tablet
structure and cause loss of product, not allowing measurement of final attribute - tablet
dissolution, which is also destructive. Moreover, they also provide limited information
about the mechanical state of a tablet. In recent past, ultrasound (US) testing has been
introduced as a fast, non-invasive technique to measure tablet strength [80, 84, 85]. In
the following section the fundamentals of ultrasonics are provided.
3.1.2 Principle of Ultrasonics
Ultrasound is sound waves pitched above human range with frequencies beyond 20 kHz.
Sound waves are transmitted through any substance, solid, liquid, or gas having elas-
tic properties [86] and travel through the material by vibrating the molecules. Based
on the motion pattern, ultrasound waves are classified into four groups: longitudi-
nal/compressional, transverse/shear, surface/Rayleigh, and plate/Lamb waves [87]. In
ultrasound testing, longitudinal and shear waves are the two modes of propagation
most widely used. The direction of particle motion is the same as the wave traveling

35
through the medium in longitudinal wave, whereas in shear wave the particle motion
is perpendicular to the direction of propogation, shown in Fig. 3.1.
Figure 3.1: Particle motion vs. the direction of ultrasound wave propogation [3].
An ultrasonic wave displaces the particles of a medium from their equilibrium positions
and as a result elastic restoring forces arise. Inertial and elastic restoring forces between
the particles lead to the oscillatory motions of the medium [88].
There are two modes of ultrasound setup: pulse-echo (PE) and through-tranmission
(TT). In PE, the sound wave is sent and received with the same transducer. In TT
setup, two transducers are used and placed on two opposite sides of the sample, one
tranmitting and the other receiving.
3.1.3 Ultrasonics in Pharmaceutics
US testing has been introduced as a non-invasive technique to gain information about
the microstructure and mechanical state of tablets (e.g., capping tendency) [89, 80, 84,
85, 90, 91]. Amongst its other applications, we focus on the measurement of the elastic
properties of tablets. This requires measuring time of flight (TOF) of a low intensity
mechanical wave propagating in a medium. Elastic modulus, E, can be extracted by
measuring the longitudinal speed of sound (SOS) of this transmitted US signal for a
known sample size [80]. Hakulinen et al. [92] have observed that SOS decreases as the
porosity of the tablet increases. In addition, the SOS in a tablet was found to increase

36
with its tensile strength [93, 85]. The ease of implementation, fast computing time, and
low cost of this method make it possible to be placed on-line for real-time mechanical
characterization of tablets.
Akseli et al. [94] evaluated the potential of a real-time acoustic technique as an on-line
compaction monitoring tool. Good correlation between elastic properties, determined
using US, and compaction profiles was observed. Leskinen et al. [84] introduced an in-
die US measurement system by incorporating US transducers inside the upper and lower
punches. US attenuation was found to be a good approach to detect defective tablets.
In a later study, they measured the SOS in binary mixtures (i.e., mixtures of an active
ingredient with an excipient) during tableting using the same system. They found that
SOS is sensitive to the mixing time of magnesium stearate and the dwell time of the
compaction cycle [95]. The in-die real-time tablet monitoring system has also been used
by Liu et al. [96] to determine the thickness and integrity of the coating layer of dry-
coated tablets and by Stephens et al. [97] to evaluate the tablet mechanical integrity and
the presence of defects, and validate its applicability as a control system. Although the
in-die measurement provides valuable information, the mechanical strength of a tablet
is different if measured out-of-die. After compaction and in-die unloading the tablet
experiences ejection forces, as well as radial and axial elastic relaxation, which might
siginificantly affect the mechanical integrity of the tablet [12, 98, 99]. Only recently,
Akseli et al. [100] presented a novel methodology to predict the breaking force and
disintegration time of pharmaceutical tablets using US and machine learning tools.
In this study, we focused on evaluating the mechanical integrity of tablets after com-
paction via US testing. Cylindrical tablets were prepared either continuously or in
batch. The formulation was kept constant (90% lactose monohydrate, 9% acetaminophen
(APAP), and 1% MgSt), while the compaction force and level of shear strain varied. US
testing was used to evaluate the strength of tablets by measuring the TOF. The tensile
strength of the same tablets was then determined using a mechanical hardness tester. It
was observed that, as the blend was exposed to an increasing level of total shear strain,
the speed of sound decreased and the tablets became both softer and mechanically
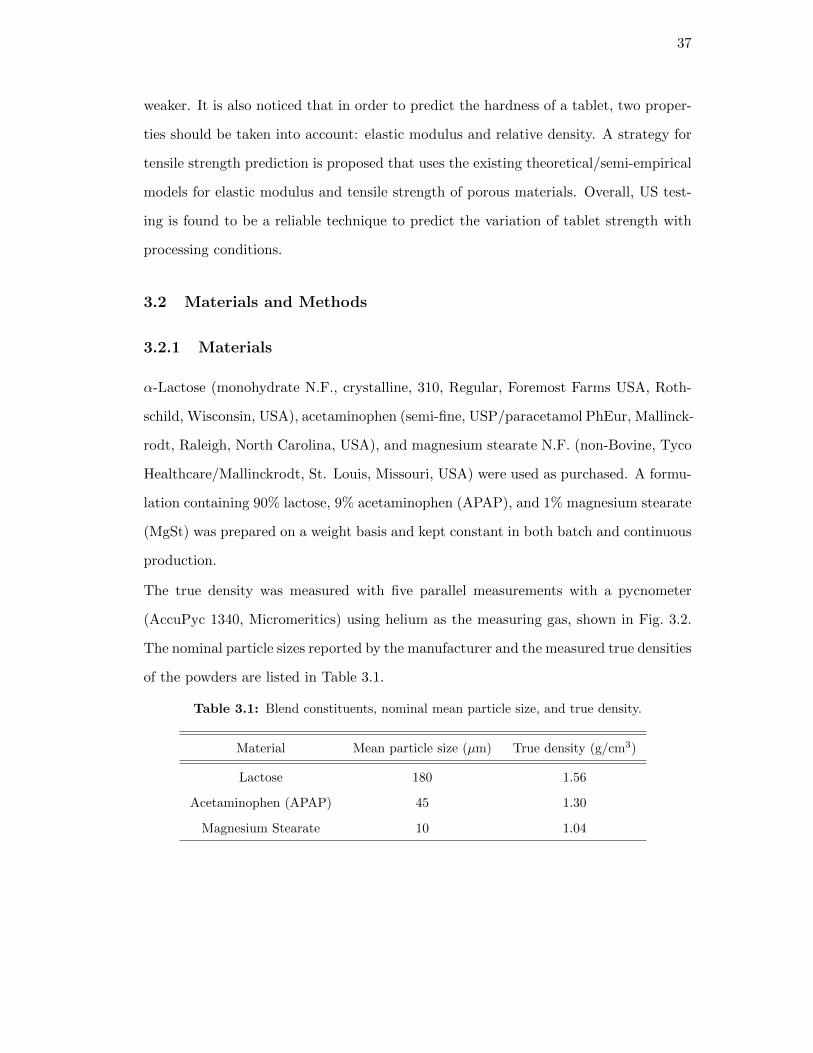
37
weaker. It is also noticed that in order to predict the hardness of a tablet, two proper-
ties should be taken into account: elastic modulus and relative density. A strategy for
tensile strength prediction is proposed that uses the existing theoretical/semi-empirical
models for elastic modulus and tensile strength of porous materials. Overall, US test-
ing is found to be a reliable technique to predict the variation of tablet strength with
processing conditions.
3.2 Materials and Methods
3.2.1 Materials
α-Lactose (monohydrate N.F., crystalline, 310, Regular, Foremost Farms USA, Roth-
schild, Wisconsin, USA), acetaminophen (semi-fine, USP/paracetamol PhEur, Mallinck-
rodt, Raleigh, North Carolina, USA), and magnesium stearate N.F. (non-Bovine, Tyco
Healthcare/Mallinckrodt, St. Louis, Missouri, USA) were used as purchased. A formu-
lation containing 90% lactose, 9% acetaminophen (APAP), and 1% magnesium stearate
(MgSt) was prepared on a weight basis and kept constant in both batch and continuous
production.
The true density was measured with five parallel measurements with a pycnometer
(AccuPyc 1340, Micromeritics) using helium as the measuring gas, shown in Fig. 3.2.
The nominal particle sizes reported by the manufacturer and the measured true densities
of the powders are listed in Table 3.1.
Table 3.1: Blend constituents, nominal mean particle size, and true density.
Material Mean particle size (µm) True density (g/cm3)
Lactose 180 1.56
Acetaminophen (APAP) 45 1.30
Magnesium Stearate 10 1.04

38
Figure 3.2: Accupyc II 1340 Pycnometer, which uses the gas displacement method to measurevolume/density accurately.
3.2.2 Continuous Manufacturing
The pilot plant employed for continuous direction compaction is situated at the En-
gineering Research Center for Structured Organic Particulate Systems (ERC-SOPS),
Rutgers University (Fig. 3.3). A detailed description of this plant can be found in
[101]. There are four main unit operations when tablets are produced by direct powder
compression: feeding, delumping, blending, and compacting. We will present a brief
overview of each of these operations next.
Feeding and delumping : First, gravimetric feeders from Coperion-KTron (Sewell, NJ),
KT20 for APAP and KT35 for lactose were used for feeding. The powders were sepa-
rately fed into a Quadro S197 Comil, which was used to delump the powders. MgSt was
added using an MT12 feeder after the mill to prevent overlubrication of the formulation.
Blending : The blend was then sent to a continuous blender (Glatt GCG-70) with a
speed set at 200 rpm. The blade configuration is described in [102, 4]. Chemical
composition of the powder was monitored using a Bruker Matrix near-infrared (NIR)
spectrometer.
Compaction: The desired formulation was sent through a hopper into the fill-o-matic
with a speed set at 25 rpm. Finally, the blend was compressed using a 36-station
Kikusui Libra-2 double layer tablet press with a 10 mm tooling at a compaction speed

39
of 20 rpm.
Figure 3.3: Continuous direct compaction manufacturing line [4].
The overall flow rate and the tablet mass were set to 20 kg/h and 350 mg, respectively.
The tablets made in the continuous line will be referred to as continuous tablets. The
compaction force (Fc) was varied during the run by changing the distance between
punches. Since the individual Fc values are not recorded for each tablet, we categorize
the tablets based on their nominal compaction force values (Fn). Tablets were collected
after all the processing parameters reached steady state. 6 different Fn settings were
selected ranging from 8 to 28 kN. 12 tablets for each of 8, 20, and 28 kN and 18 tablets
for each of 12, 16, and 24 kN Fn conditions were analyzed.

40
3.2.3 Batch Production
Blend Preparation
Two different powder mixing equipments were used in the batch production of tablets:
a V-blender (Patterson-Kelley Co., East Stroudsburg, PA) and a laboratory scale res-
onant acoustic mixer (labRAM) (Resodyn Acoustic Mixers, Butte, Montana, USA).
Figure 3.4: V-blender, a tumbling mixer and shearing device used to impart uniform shear tothe blend.
In the V-blender mixer, a 15-minute pre-blending step was applied at a rotation rate
of 15 rpm to reduce the stickiness of APAP and improve its flowability. MgSt was
added and mixed with the blend for 2 additional minutes. The blended powder was
then unloaded from the V-blender and subjected to a controlled shear environment in
a modified Couette cell at a shear rate of 80 rpm (Fig. 3.4). For additional information
about this instrument, the reader is referred to [103, 104]. Three different shear strain
environments were selected in this study: 0, 160 and 640 revolutions, corresponding
to 0, 2, and 8 minutes in the shear device. As we increase the number of revolutions
in the shear cell, the degree of MgSt coverage on the particles increases. The effect of
lubricant on powder properties is highlighted in more detail in the following chapter.
The tablets made using this mixing method will be named according to the strain level
experienced by the blend in the shear cell i.e., 0 rev, 160 rev, and 640 rev tablets.

41
Figure 3.5: Laboratory scale resonant acoustic mixer (LabRAM).
The low frequency and high intensity acoustic field in labRAM facilitate the movement
of the loose powder mass to induce mixing. In the labRAM mixer (Fig. 3.5), 80% fill
level was selected. Lactose and APAP were first blended for 2 minutes at an acceleration
of 40 g, followed by the lubrication stage, where MgSt was added and the blend was
mixed for an additional 1 minute at an acceleration of 60 g. These tablets will be
referred to as labRAM tablets.
Tablet Compaction
The blends were compacted using a Presster tablet press simulator equipped with a
10 mm flat-face, B-type tooling. A Kikusui Libra-2 tablet press was emulated at a
press speed of 20 rpm. A dwell time of 22.2 ms, corresponding to a production speed
of 43, 100 tablets per hour, was used. No pre-compression force was applied. These
parameters in the Presster (e.g., tooling type and dwell time) were selected based on
those employed in the tablet press of the continuous line. A total of 36 tablets for 0
rev, 160 rev, and 640 rev conditions and 25 labRAM tablets were analyzed.
42
3.2.4 Tablet Characterization
All the compacted tablets were stored at ambient room temperature and inside a sealed,
clear plastic bag and kept for at least one week to allow for elastic relaxation prior to
any characterization.
Density
All the tablets (made in batch or continuous) were weighed with a precision balance
(±0.001 g, Adventurer Ohaus). Their thickness was carefully measured by a digital
caliper (±0.01 mm, Absolute digimatic Caliper). The relative density of the tablets
was calculated using Eq. (2.4). The true density of the blend was determined by
1
ρt=
3∑i=1
niρt,i
(3.1)
n and ρt represent the concentration and true density of each ingredient. The thickness,
mass, and relative density of all the batch tablets are listed in Tables 3.2 and 3.3. For
continuous tablets, the mean values and standard deviations of all the measured param-
eters are provided in Table 3.4. It can be seen that some of the continuous tablets have
masses significantly different from the targeted value (350mg) which resulted in devi-
ations in their relative density. Detailed information about each individual continuous
tablet is provided in the appendix.

43
Table 3.2: Compaction force (Fc), mass (m), thickness (t), relative density (ρ), speed of sound(SOS), tensile strength (σt), and elastic modulus (E) of the labRAM tablets.
Fc (kN) m (mg) t (mm) ρ (%) SOS (m/s) σt (MPa) E (GPa)
5.2 359.2 3.67 81.7 614 0.24 0.47
6.1 352.8 3.55 83 677 0.28 0.58
6.6 344.6 3.43 83.9 681 0.33 0.59
10.6 349.5 3.34 87.4 823 0.64 0.9
8.3 354.4 3.46 85.5 783 0.43 0.8
8.6 349.6 3.4 85.9 787 0.48 0.81
6.6 348.5 3.46 84.1 721 0.32 0.67
10.3 343.3 3.28 87.4 808 0.61 0.87
13.5 355.3 3.34 88.8 831 0.88 0.93
12.1 353.2 3.33 88.6 816 0.81 0.9
11 345 3.28 87.8 812 0.72 0.88
15.6 350.7 3.24 90.4 920 1.06 1.17
15.6 345.4 3.21 89.8 907 1.13 1.13
21 350.4 3.17 92.3 955 1.48 1.28
22.9 348.9 3.15 92.5 972 1.66 1.33
29.5 354.3 3.14 94.2 1006 2.09 1.45
23.6 352.9 3.18 92.7 1013 1.83 1.45
23.1 357.7 3.22 92.7 1006 1.74 1.43
24.8 353.7 3.17 93.2 991 1.99 1.39
19.5 351.1 3.2 91.6 958 1.44 1.28
17.5 353.7 3.26 90.6 931 1.26 1.2
15.9 359.7 3.35 89.6 936 1.06 1.2
9.5 336.5 3.26 86.2 799 0.55 0.84
23.2 340.7 3.06 93 974 1.77 1.35
25.3 346.2 3.11 92.9 972 1.85 1.34

44
Table 3.3: Compaction force (Fc), mass (m), thickness (t), relative density (ρ), speed of sound(SOS), tensile strength (σt), and elastic modulus (E) of the batch tablets mixed inthe V-blender and then experienced different shear strain environments.
Fc (kN) m (mg) t (mm) ρ (%) SOS (m/s) σt (MPa) E (GPa)
0rev 8.2 318.4 3.14 84.7 969 0.74 1.21
10.7 343.1 3.32 86.3 1012 1.01 1.35
14.3 347 3.28 88.3 1116 1.43 1.68
17.1 363.2 3.37 90 1138 1.74 1.78
16 351 3.28 89.3 1131 1.71 1.74
18.6 354.2 3.25 91 1169 1.96 1.9
21.4 359.1 3.26 92 1216 2.41 2.07
23.1 351.3 3.18 92.2 1252 2.59 2.2
23.8 346.4 3.12 92.7 1200 2.62 2.04
13.7 348.2 3.28 88.6 1108 1.37 1.66
6.2 327.1 3.32 82.3 878 0.49 0.97
9.3 334.5 3.28 85.1 1000 0.84 1.3
160rev 17.3 383.2 3.54 90.4 1066 1.46 1.57
14.4 367.2 3.45 88.9 975 1.25 1.29
13 360.4 3.4 88.5 971 1.08 1.27
8.2 325.6 3.22 84.4 852 0.54 0.93
14 346.9 3.27 88.6 962 1.18 1.25
16.6 352.6 3.27 90 1035 1.47 1.47
22.9 352.5 3.19 92.3 1139 2.07 1.83
25.4 347.8 3.14 92.5 1113 2.25 1.75
23.2 346.8 3.15 91.9 1064 2.2 1.59
9.5 342.4 3.35 85.3 872 0.67 0.99
6 343.7 3.48 82.4 756 0.39 0.72
16.5 343.6 3.2 89.6 1039 1.4 1.48
640rev 24.4 382.5 3.46 92.3 925 1.55 1.2
22.2 371.8 3.39 91.6 897 1.29 1.12
18.9 353.8 3.26 90.6 867 1.11 1.04
9.1 350 3.41 85.7 682 0.42 0.61
7 339.9 3.38 84 663 0.26 0.56
12.1 350.5 3.35 87.3 761 0.6 0.77
16.8 349.8 3.24 90.1 853 0.96 1
13.4 336.6 3.18 88.4 799 0.69 0.86
17.2 332.7 3.08 90.2 865 0.97 1.03
22.1 355.3 3.23 91.8 892 1.28 1.11
25.9 356.7 3.22 92.5 894 1.61 1.13
8 354.9 3.49 84.9 712 0.34 0.66

45
Table 3.4: Mean values and standard deviations of mass (m), thickness (t), relative density(ρ), speed of sound (SOS), tensile strength (σt), and elastic modulus (E) of thecontinuously manufactured tablets compacted at various nominal compaction forces(Fn).
Fn (kN) m (mg) t (mm) ρ (%) SOS (m/s) σt (MPa) E (GPa)
8 343.9±8 3.35±0.03 85.6±1.3 1147±50 1±0.16 1.72±0.17
12 350.5±14 3.31±0.07 88.4±1.9 1222±82 1.34±0.44 2.03±0.34
16 347.8±11.6 3.21±0.07 90.5±1.1 1330±39 1.83±0.28 2.45±0.17
20 345.8±8.3 3.13±0.04 92.4±1 1378±27 2.43±0.31 2.68±0.13
24 344.9±10.1 3.11±0.06 92.7±0.8 1389±28 2.5±0.31 2.73±0.13
28 342.9±5.4 3.05±0.03 94±0.6 1407±26 3.12±0.19 2.84±0.12
Acoustic Measurements
The experimental setup for the US measurements consisted of a pulser/receiver unit
(Panametrics, 5077PR), a pair of protected-face longitudinal wave contact transducers
(Panametrics, V606-RB) with a central frequency and diameter of 2.25 MHz and 13 mm,
respectively, a digitizing oscilloscope (Tektronix TDS3052), and a computer controlling
the data acquisition (Fig. 3.6). During experiments, the pulser/receiver unit was set to
a pulse repetition frequency (PRF) of 500 Hz, a pulser voltage of 100 V, an amplification
gain of +10, a central frequency of 2-2.25 MHz, and the entire frequency spectrum of
the transducers was allowed to pass through the tablets.

46
Figure 3.6: The acoustic experimental setup showing ultrasound transducers, pulser/receiverunit, and a digitizing oscilloscope.
In this method, the tablet is placed in direct contact between two piezoelectric transduc-
ers (TT geometry). A square electrical pulse from the pulser/receiver unit is launched
into the transmitting transducer. Electrical signal is converted into ultrasound and
propagates through the tablet as mechanical waves and is captured by the receiving
transducer at the other end and digitized as a waveform by the oscilloscope. The time
that it takes for the high frequency pressure pulses to pass through the tablet will be
measured (i.e., TOF). From the acquired data, the TOF was obtained using the first
peak of the received US signal, according to Fig. 3.7. The SOS was calculated as follows:
SOS =t
TOF(3.2)
where t is the tablet thickness. The US transmission measurement system was tested
using steel and aluminum samples with four different thicknesses for each case, as
shown in Fig. 3.8. A delay time of 1.1 µs was measured for the setup independent of
the material used. Subsequently, this delay time was subtracted from the measured
TOF in this study.

47
The elastic modulus (E) of each tablet was then calculated from the SOS assuming the
material is isotropic [90, 91]:
E = SOS2ρb. (3.3)
Figure 3.7: Time of flight measurement of a US waveform.
1 1.5 2 2.5 3 3.5 4 4.5 5 5.50
0.5
1
1.5
2
2.5
3
3.5
4
4.5
steel
aluminum
Figure 3.8: Calibration of the ultrasound testing using steel and aluminum samples.

48
We note that in this study, the US measurements of the continuous tablets were con-
ducted off-line. However, the micro-second TOF of the US signal shows that in principle
the US methodology is sufficiently fast to be placed as an in-line measurement.
Tensile Strength Measurements
The diametrical compression test was performed using a standard mechanical hardness
tester (Dr. Schleuniger, Pharmatron, model 6D) (Fig. 3.9). The tensile strength of
tablets, σt, is calculated using Eq. (1.5). Diameter of the tablets are assumed to be
constant and equal to 10 mm as radial relaxation was minimal.
Figure 3.9: Standard hardness tester used to measure the breaking force of tablets.
3.3 A Strategy for Tensile Strength Prediction of Tablets
The mechanical properties of a pharmaceutical tablet not only depend on the material
but also on the porosity of the compact. Finding these properties at zero porosity
would make it possible to compare blends and predict their maximum strength in com-
pact form. In this study, the fundamental assumption is the existence of a correlation
between the elastic modulus and tensile strength at zero porosity of the powder, E0
and σ0, respectively. US testing enables us to indirectly measure E0 and, analogously
diametrical compression testing allows us to indirectly measure σ0. These two param-
eters serve as mechanical characteristics of tablets, which are a function of material
properties and processing history. Once we find the relationship between E0 and σ0,
we can predict hardness, using US measurements alone.

49
In the following sections, the existing theoretical/semi-empirical models to determine
E0 and σ0 are summarized.
3.3.1 Elastic Modulus-Porosity Correlation
The relationship between E and porosity, φ, is well established in the literature, and
both empirical correlations as well as analytical results have been reported. The porosity
is defined as φ = 1 − ρ, and Phani and Niyogi [105] derived a semi-empirical relation
with the elastic modulus:
E
E0= (1− aφ)n = f(φ), (3.4)
where a and n are material constants, providing information about the packing geom-
etry and pore structure of the material. The constant a is equal to 1/φc,E , where φc,E
is defined as the porosity of which E vanishes. The minimum value that a can take is
1 corresponding to the maximum value of φc,E = 1.
Bassam et al. [106] explored the elastic modulus of fifteen representative tableting
excipient powders for different porosities using a four-point beam bending technique
and analyzed the data following an empirical function proposed by Spinner et al. [107]:
E = E0(1−Bφ+ Cφ2), (3.5)
where B and C are fitting coefficients. Note that Eq. (3.5) is equivalent to a second-
order Taylor series approximation of Eq. (3.4) around zero porosity, with B = an and
C = a2
2 n(n−1). The model can be further approximated by a linear regression (C = 0):
E = E0(1−mφ), (3.6)
where m = an. According to Rossi [108], m accounts for the stress concentration factor
around pores in the material and depends on pore geometry and orientation, which is
consistent with the description by Phani and Niyogi [105].

50
3.3.2 Tensile Strength-Porosity Correlation
We considered a theoretical model based on percolation theory proposed by Kuentz
and Leuenberger [5] to relate σt and ρ:
ln(1− σtσ0
) = ρ− ρc,σt + ln(1− ρ
1− ρc,σt), (3.7)
Eq. (3.7) can be rewritten as follows
σt = σ0
[1− (
φ
φc,σt)e(φc,σt−φ)
], (3.8)
where φc,σt is the porosity at which σt goes to zero.
The relationship between σt and ρ is generally presented by an exponential form [49,
109, 44, 110]. Although this relationship usually provides a good fit to the data, it
is empirical and does not provide the limiting values (i.e., φc,σt and σ0) needed to
implement the strategy discussed above.
3.4 Results and Discussion
The calculated SOS, σt, and E values for continuous and batch tablets are listed in
Tables 3.2, 3.3, and 3.4.
In Fig. 3.10, we present the relationship between ρ and σt for all the continuous and
batch tablets. The diametrical compression test results were fitted to Eq. (3.8) using
the nonlinear regression method based on the Trust-Region algorithm [111]. Table 3.5
lists the fitted parameters and R2 values. We found a reasonable agreement between
the model and the experimental results as shown by the R2 values. Blends with the
same formulation but experiencing different level of shear strain resulted in different
mechanical properties. As expected, the strength of tablets decreased with the level of
shear strain.

51
Relative density0.8 0.82 0.84 0.86 0.88 0.9 0.92 0.94 0.96
Tensile
str
ength
, M
Pa
0
0.5
1
1.5
2
2.5
3
3.5
Continuous0rev160revLabRAM640rev
Figure 3.10: The relationship between relative density and tensile strength following theKuentz and Leuenberger [5] model.
Table 3.5: Tensile strength at zero porosity (σ0) and critical relative density (ρc,σt) found from
Eq. (3.8) for all the differently produced tablets.
cases σ0 (MPa) ρc,σt (%) R2
continuous 4.60 82.2 0.911
0rev 4.36 80.9 0.966
160rev 3.46 81.0 0.921
640rev 2.65 82.4 0.954
labRAM 3.19 82.8 0.944
Fig. 3.11 shows a linear relationship between ρ and E in agreement with Eq. (3.6).
We also fitted the experimental data to Eqs. (3.4) and (3.5). Table 3.6 lists the
fitted coefficients and R2 values of all the tablets. Bassam et al. [106] reported that
lactose monohydrate resulted in a linear regression in terms of porosity, with a vanishing
quadratic term (i.e., C = 0 in Eq. (3.5)). However, in our study the C values are not
negligibly small and change noticeably from one case to the other. The E0 values

52
are almost the same for all the three models. It is worthwhile to note that the fitting
coefficients are dependent on many parameters selected in the optimization process, and
for the same R2 values we can find a different set of fitting parameters. In addition, we
are considering a relatively small range of relative densities and thus, it is acceptable
to use a linear regression to estimate E0. It bears emphasis that these results might
change for a wider range of relative densities but the methodology would still hold.
Relative density0.7 0.75 0.8 0.85 0.9 0.95 1
Young's
modulu
s, G
Pa
0
0.5
1
1.5
2
2.5
3
3.5
Continuous0rev160revLabRAM640rev
Figure 3.11: Elastic modulus as a function of relative density.
It is worth to mention that φc,σt and φc,E describe two different phenomena, and can be
different for the same material and processing conditions. For the material studied here,
at a certain relative density we can start to see tensile stiffness in the blend without
forming a bond between the particles.
Figs. 3.10 and 3.11 allow us to estimate the effective shear strain level corresponding
to labRAM and continuous tablets. The selected parameters in labRAM mixer make
the hardness of labRAM tablets fall between the 160 rev and 640 rev tablets, indicating
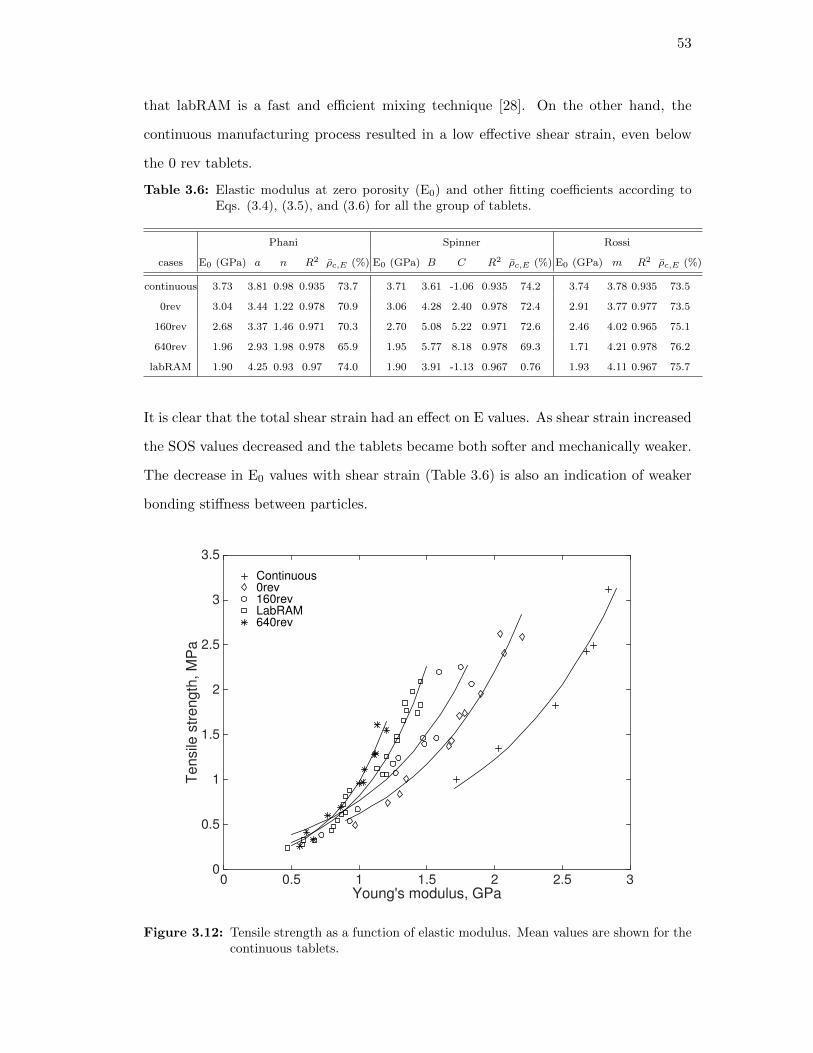
53
that labRAM is a fast and efficient mixing technique [28]. On the other hand, the
continuous manufacturing process resulted in a low effective shear strain, even below
the 0 rev tablets.
Table 3.6: Elastic modulus at zero porosity (E0) and other fitting coefficients according toEqs. (3.4), (3.5), and (3.6) for all the group of tablets.
Phani Spinner Rossi
cases E0 (GPa) a n R2 ρc,E (%) E0 (GPa) B C R2 ρc,E (%) E0 (GPa) m R2 ρc,E (%)
continuous 3.73 3.81 0.98 0.935 73.7 3.71 3.61 -1.06 0.935 74.2 3.74 3.78 0.935 73.5
0rev 3.04 3.44 1.22 0.978 70.9 3.06 4.28 2.40 0.978 72.4 2.91 3.77 0.977 73.5
160rev 2.68 3.37 1.46 0.971 70.3 2.70 5.08 5.22 0.971 72.6 2.46 4.02 0.965 75.1
640rev 1.96 2.93 1.98 0.978 65.9 1.95 5.77 8.18 0.978 69.3 1.71 4.21 0.978 76.2
labRAM 1.90 4.25 0.93 0.97 74.0 1.90 3.91 -1.13 0.967 0.76 1.93 4.11 0.967 75.7
It is clear that the total shear strain had an effect on E values. As shear strain increased
the SOS values decreased and the tablets became both softer and mechanically weaker.
The decrease in E0 values with shear strain (Table 3.6) is also an indication of weaker
bonding stiffness between particles.
Young's modulus, GPa0 0.5 1 1.5 2 2.5 3
Tensile
str
en
gth
, M
Pa
0
0.5
1
1.5
2
2.5
3
3.5
Continuous0rev160revLabRAM640rev
Figure 3.12: Tensile strength as a function of elastic modulus. Mean values are shown for thecontinuous tablets.
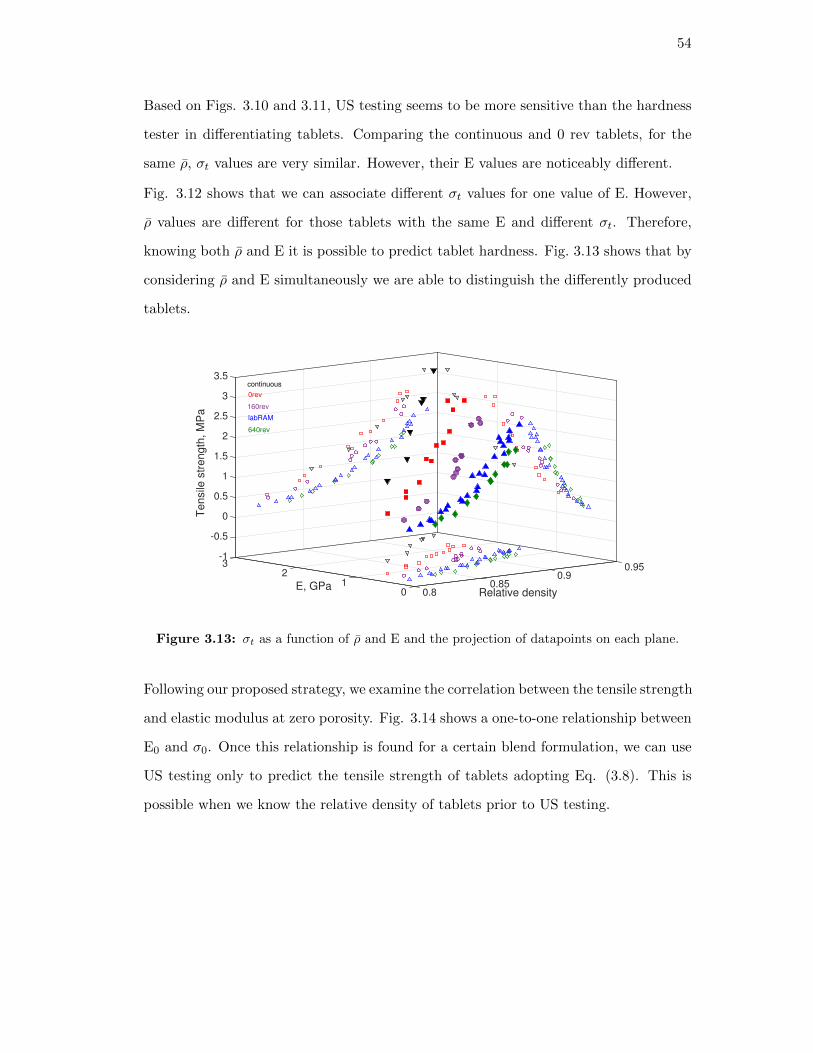
54
Based on Figs. 3.10 and 3.11, US testing seems to be more sensitive than the hardness
tester in differentiating tablets. Comparing the continuous and 0 rev tablets, for the
same ρ, σt values are very similar. However, their E values are noticeably different.
Fig. 3.12 shows that we can associate different σt values for one value of E. However,
ρ values are different for those tablets with the same E and different σt. Therefore,
knowing both ρ and E it is possible to predict tablet hardness. Fig. 3.13 shows that by
considering ρ and E simultaneously we are able to distinguish the differently produced
tablets.
0.950.9
Relative density0.85
0.801E, GPa
2
3.5
3
2.5
2
1.5
1
0.5
0
-0.5
-13
Te
nsile
str
en
gth
, M
Pa
0rev
continuous
160rev
labRAM
640rev
Figure 3.13: σt as a function of ρ and E and the projection of datapoints on each plane.
Following our proposed strategy, we examine the correlation between the tensile strength
and elastic modulus at zero porosity. Fig. 3.14 shows a one-to-one relationship between
E0 and σ0. Once this relationship is found for a certain blend formulation, we can use
US testing only to predict the tensile strength of tablets adopting Eq. (3.8). This is
possible when we know the relative density of tablets prior to US testing.

55
E0, GPa
1.5 2 2.5 3 3.5 4 4.5
σ0,
MP
a
2
2.5
3
3.5
4
4.5
5
5.5
continuous
0rev
labRAM
640rev
160rev
Figure 3.14: A one-to-one relationship between E0 and σ0 for tablets with the same formula-tion but different processing history. E0 values are derived from Eq. (3.6). Notethat 0 rev, 160 rev, and 640 rev tablets have experienced a 2-minute mixing withMgSt in the V-blender.
3.5 Conclusion
We successfully used ultrasound (US) measurement system on tablets. The effect of two
processing parameters, compaction force and level of shear strain were examined. US
speed of sound was found to be sensitive to the relative density and the level of shear
strain. US testing could detect even small differences between tablets that a hardness
tester failed to do so. This is an added advantage of using this technique to monitor
mechanical properties, because a slight change could have a significant consequence on
dissolution.
A strategy for hardness prediction is proposed that uses the existing models for elastic
modulus and tensile strength of porous materials. A clear correlation between elastic
modulus and tensile strength at zero porosity is presented. Thus, US testing is a
good candidate to be placed on/at-line to measure the mechanical integrity of tablets

56
non-destructively. These results provide information about the behavior of processing
parameters on the performance of tablets and the ability to engineer product properties.
3.6 Appendix
Table 3.7: Mass (m), thickness (t), relative density (ρ), speed of sound (SOS), tensile strength(σt), and elastic modulus (E) of each individual continuously manufactured tabletcompacted at a nominal compaction force (Fn).
Fn (kN) m (mg) t (mm) ρ (%) SOS (m/s) σt (MPa) E (GPa)
8 344 3.37 85.23 1154 1.07 1.73341.2 3.33 85.55 1117 0.97 1.63332.7 3.32 83.67 1092 0.81 1.52352.4 3.37 87.31 1178 1.17 1.85341 3.35 84.99 1139 0.89 1.68
346.3 3.35 86.31 1147 0.97 1.73341.6 3.34 85.40 1106 1.03 1.59330.4 3.3 83.60 1058 0.74 1.43338.6 3.35 84.39 1139 0.82 1.67348.4 3.38 86.06 1207 1.16 1.91354 3.39 87.19 1219 1.14 1.98
356.2 3.4 87.47 1206 1.19 1.94
12 351.3 3.29 89.15 1183 1.42 1.90376 3.41 92.07 1421 2.43 2.83
342.8 3.26 87.80 1148 1.15 1.76338.9 3.23 87.61 1122 1.16 1.68341.8 3.24 88.08 1165 1.12 1.82366.5 3.34 91.62 1315 2.02 2.42342 3.28 87.41 1188 0.93 1.88
331.8 3.26 85.32 1156 0.88 1.74343.6 3.29 87.38 1183 1.10 1.87346.4 3.3 88.00 1196 1.14 1.92343.7 3.29 87.40 1201 1.18 1.92340.2 3.29 86.68 1183 1.06 1.85350.8 3.33 88.13 1224 1.26 2.01371.6 3.43 90.46 1319 1.91 2.40352.8 3.34 88.37 1256 1.33 2.12357.2 3.35 89.21 1232 1.29 2.06334.1 3.27 85.48 1112 0.88 1.61377.7 3.47 90.88 1399 1.91 2.71
16 340.1 3.13 90.72 1249 1.80 2.52330.1 3.09 89.20 1309 1.56 2.33340.3 3.15 90.20 1346 1.76 2.49343.6 3.16 90.79 1374 1.90 2.61354.6 3.21 92.23 1408 2.29 2.79345.3 3.16 91.24 1374 2.0 2.63340.2 3.18 89.5 1303 1.79 2.32341.8 3.17 90.03 1299 1.48 2.32337.7 3.17 89.13 1278 1.56 2.22369.7 3.34 92.42 1358 2.22 2.6352 3.24 90.71 1361 1.97 2.56

57
Table 3.7 Continued
347.4 3.21 90.36 1338 1.69 2.47347.1 3.23 89.90 1292 1.55 2.29342.2 3.2 89.29 1280 1.54 2.23341 3.19 89.43 1297 1.63 2.29
347.7 3.22 90.34 1278 1.67 2.25364.7 3.33 91.63 1343 2.25 2.52375.2 3.38 92.87 1363 2.27 2.63
20 344.1 3.11 92.38 1401 2.37 2.76334 3.06 91.14 1354 2.04 2.55
336.9 3.08 91.33 1375 2.17 2.63363 3.22 94.13 1438 2.81 2.97
337.8 3.1 90.98 1360 2.05 2.56351.6 3.15 93.20 1358 2.54 2.62351.5 3.15 93.17 1406 2.72 2.81341.1 3.11 91.58 1341 2.15 2.51348.1 3.14 92.56 1389 2.51 2.72352.2 3.16 93.06 1386 2.73 2.73340 3.09 91.87 1343 2.14 2.53
349.6 3.14 92.96 1389 2.90 2.74
24 378.6 3.31 95.50 1465 3.11 3.12339 3.06 92.50 1366 2.69 2.63
352.7 3.15 93.49 1394 2.81 2.77327.8 2.99 91.54 1384 2.0 2.67347.6 3.13 92.72 1410 2.83 2.81341.3 3.08 92.52 1413 2.68 2.82341 3.09 92.14 1392 2.36 2.72343 3.08 92.98 1400 2.09 2.78
341.8 3.08 92.66 1375 2.11 2.67343.9 3.08 93.23 1351 2.39 2.59342.3 3.09 92.49 1392 2.53 2.73340 3.08 92.17 1363 2.47 2.61
345.2 3.11 92.68 1341 2.61 2.54350.6 3.15 92.23 1419 2.85 2.85347.6 3.13 92.72 1397 2.67 2.76345.4 3.12 92.43 1381 2.38 2.69334.9 3.06 91.38 1366 2.06 2.60346.3 3.13 92.38 1397 2.41 2.75
28 354.2 3.11 95.09 1427 3.39 2.95340.2 3.03 93.75 1390 3.17 2.76347.5 3.07 94.51 1448 3.17 3.02340.8 3.01 94.54 1433 3.05 2.96345.3 3.07 93.91 1435 3.01 2.95338 3.01 93.76 1394 3.30 2.78
339.3 3.02 93.81 1398 2.96 2.80337 3.04 92.56 1382 3.16 2.70
349.4 3.1 94.11 1422 3.30 2.90343.3 3.04 94.29 1407 2.98 2.85343.4 3.06 93.70 1378 3.22 2.71336.7 3.01 93.40 1368 2.70 2.67
58
Chapter 4
Quantification of Lubrication and Particle Size
Distribution Effects on Tensile Strength and Stiffness of
Tablets
4.1 Introduction
Lubricants are one of the key ingredients in the pharmaceutical formulations to im-
prove flowability, increase bulk powder density, and reduce die wall friction and ejec-
tion forces [112, 113, 114, 115, 116, 117, 118, 119]. Magnesium stearate (MgSt) is the
most frequently used lubricant [9]; typically added to the formulation in small amounts
(0.25% − 1.0% (w/w)) [120, 116]. It has been shown that MgSt can adversely affect
the physical and chemical properties of tablets [121, 122]. Hypothetically, MgSt forms
a layer on the host particles weakening the interparticle bonding [123, 124, 125]. The
lubricant type and concentration, type of mixer and its operation method, and mixing
time are all important processing variables that affect the tablet compactibility, inter-
particle bonding and thus, final mechanical properties [126, 127, 128, 115, 129, 130, 131].
However, the deformation mechanism of host particles also play a role [123]. For exam-
ple, brittle materials that undergo fragmentation are said to be unaffected by MgSt due
to the creation of unexposed surfaces during compression [124, 132]. In contrast, plasti-
cally deformable powders are significantly impacted by lubricant mixing [133, 134, 135].
Mollan and Celik [136] ascribed the reduction in the total work of compaction by in-
creasing the lubricant concentration to decreased particle cohesiveness. Zuurman et al.
[137] argued that the decrease in tablet strength of pharmaceutical powders such as
microcrystalline cellulose mixed with MgSt is caused by a more extensive relaxation of
the lubricated tablets corresponding to a weaker interparticle bonding.

59
There has been growing interest in quantifying what the powder experiences in mixing
with lubricant to enable a more robust prediction of tablet quality attributes. Over a
decade ago, the blender parameters were translated to a more relevant and fundamental
variables, strain and shear rate, using a modified Couette shear cell to better quantify
lubrication effect [103, 138]. Shear rate is proportional to the energy input rate per
unit mass and total strain is proportional to the total energy input per unit mass.
Narang et al. [139] derived a dimensionless equation to quantify total shear imparted
by the force feeder on the granulation in terms of a shear number, which provides
guidance to the scale-up and interchangeability of tablet presses. Kushner and Moore
[140] proposed an empirical model, which can describe the impact of both formulation
and process parameters on the extent of lubrication in a pharmaceutical powder blend.
Just recently, Nakamura et al. [141] suggested to use Carr’s flowaibility index (FI),
which showed a strong correlation with MgSt mixing time, as an effective index to
control physical properties of tablets like friability and hardness.
Particle size distribution (PSD) also plays an important role on the compaction and
tablet properties [142]. A decrease in particle size of the powdered material has been
shown to increase tablet porosity [43, 143]. Smaller particles are inclined to be more
cohesive since the interparticle cohesive forces are comparable to the weight of the
particles making them more compressible [144, 145]. Reduction in particle size typically
results in an increase in the mechanical strength of tablets [146, 147, 43, 148]. This is
attributed to a greater packing density after the particle rearrangement and an increase
in the surface area available for interparticulate attractions [149, 150, 143]. Attempts
were made to correlate specific surface area to the mechanical strength of tablets and a
linear relationship was found for different types of lactose [150, 143]. However, Nystrom
et al. [10] suggested that the intermolecular forces are the dominating mechanism in
the compactibility of powders and only in some cases the available surface area could
be used to establish a model to correlate with mechanical strength of tablets. On the
contrary, sodium chloride tablets have been reported to become stronger as their particle
size increased associated to more bonding between particles through solid bridges [151].

60
Katikaneni et al. [152] investigated the tableting properties and predominant consoli-
dation mechanism of ethylcellulose as lubricant concentration and particle size varied
individually. The concurrent effect of lubrication and particle size on mechanical prop-
erties of pharmaceutical tablets during and after compaction has also been explored.
Van der Watt [153] was the first to show that tablet properties change after the same
MgSt mixing time for different particle sizes of Avicel PH 102. In more recent years,
Almaya and Aburub [154] examined the effect of particle size on lubricant sensitivity
for different types of materials (e.g., plastic, brittle, and viscoelastic). They concluded
that for MCC (a plastically deforming material) particle size impacts tablet strength
only in the presence of lubricant. For starch (a viscoelastic material) tablet strength
is affected by the particle size with or without added lubricant. Finally, for dibasic
calcium phosphate dihydrate (a brittle material) particle size has no effect on tablet
strength with or without the lubricant. However, there is no previous work that goes
beyond the qualitative predictions.
The primary goal of the present study is to quantify the lubrication effect combined
with the particle size on the tensile strength and elastic modulus of tablets. To this
end, the tablet strength envelope of two grades of lactose, lactose α-monohydrate (LM)
and spray-dried lactose (SDL), caused by different PSD and lubrication conditions was
explored. Creating this tablet strength (i.e., stiffness and tensile strength) spectrum
allows for optimal selection of lubricant concentration, mixing time, and particle size
range with respect to the resources available. Tablets were compressed to different
relative densities ranging from 0.8 to 0.94 using an instrumented compactor simulator.
We have introduced a new parameter in the existing optimal tensile strength and elastic
modulus relationships that accounts for the PSD, lubricant concentration and its mixing
time with the host particles. The new model is predictive and effective and can be
expanded to include other blend properties or processing parameters effects. Moreover,
it can be explored for other quality attributes of tablets as well.

61
4.2 Material and Methods
4.2.1 Materials
The materials used in this study include α-lactose monohydrate (Foremost Farms, Wis-
consin, USA), spray-dried Fast-Flo lactose monohydrate N.F. (Foremost Farms, Wis-
consin, USA) and magnesium stearate N.F. non-Bovine (Mallinckrodt, Missouri, USA)
as lubricant. Lactose monohydrate (LM) exhibits relatively poor binding properties.
Spray drying is a method used to enhance its binding properties [14]. Spray-dried lac-
tose (SDL) (i.e., Fast-Flo lactose) is a mixture of crystalline and amorphous lactose,
which is a more common direct compression ingredient compared to LM.
The true density of LM, SDL, and MgSt powders was measured using the AccuPyc
Pycnometer (Accupyc II 1340, Micromeritics) with helium as density medium (Fig. 3.2).
The powders were dried at 50◦C for 24 hours before the test.
4.2.2 Blend Preparation
Each powder was sieved through a vibrational sieve shaker (Octagon 2000, Endecotts
Ltd., England) into different particle size distributions (Fig. 4.1). LM was divided into
three particle size fractions 0-75, 75-106, and 106-150 µm. SDL was divided into four
particle size fractions 0-75, 75-106, 106-150, and 150-212 µm. The sieve shaker was
operated at amplitude of 8. The as-received powder was poured in the top pan of the
clamped sieve stack. The powders on the lower pan (corresponding to 0-75 µm) were
collected at an interval of approximately 15 min. This procedure was repeated until
the powder in the lower pan was a negligible amount.

62
Figure 4.1: Endecotts sieve shaker with multiple pans stacked and clamped.
The particle size distribution (PSD) was measured using a Beckman Coulter LS 13 320
laser diffraction particle size analyzer (Fig. 4.2) to ensure if the desired distribution was
achieved. The measurement is based on the principles of light scattering [155]. The
instrument measures particle size over the range of 0.017 µm to 2000 µm.
MgSt was pre-sieved through a #50 mesh (300 µm opening) prior to mixing with
powders using a LabRAM. As discussed in section 1.4, the mixing intensity (0− 100%)
is the parameter that can be controlled in the LabRAM, which determines the amplitude
of the mechanical vibration, translating into acceleration values (0−100 g’s) depending
on the load mass [28]. In all the experimental work presented here the acceleration of
40 g was used. In other words, for each blending condition, based on the powder mass
and powder properties, the mixing intensity was adjusted to give the same apeak (cf.
Eq. (1.1)). Regardless, the variations in powder mass were kept minimal.
Overall, MgSt concentration and mixing time varied from 0.25% to 2% and 30 sec
to 2400 sec, respectively, aiming to produce tablets with a wide range of mechanical
properties. Samples were stored in airtight plastic bags until used.

63
Figure 4.2: Beckman Coulter LS 13320 laser diffraction particle size analyzer.
4.2.3 Tablet Compaction
The samples were compacted using a Presster tablet press simulator equipped with an
8 mm flat round face, B-type tooling. A Fette 1200 tablet press was emulated at a
constant speed of 25 rpm. A dwell time of 26 ms, corresponding to a production speed
of 36, 000 tablets per hour, was used. Compression force and punch displacement are
measured via strain gauges placed on the compression roll pins and a linear variable
displacement transducer connected to each punch, respectively. No pre-compression
force was applied. The total number of tablets per case varied from 8 to 17. All the
compacted tablets were stored at ambient room temperature and inside a sealed plastic
bag and kept for at least 24 hours prior to any characterization.
4.2.4 Tablet Characterization
The mass of tablets was measured with a precision balance (±0.001 g, Adventurer
Ohaus). The thickness and diameter of tablets were measured using a MultiTest 50
(MT50) tablet hardness tester (±0.01 mm, Sotax, Allschwil, Switzerland) (Fig. 4.3).
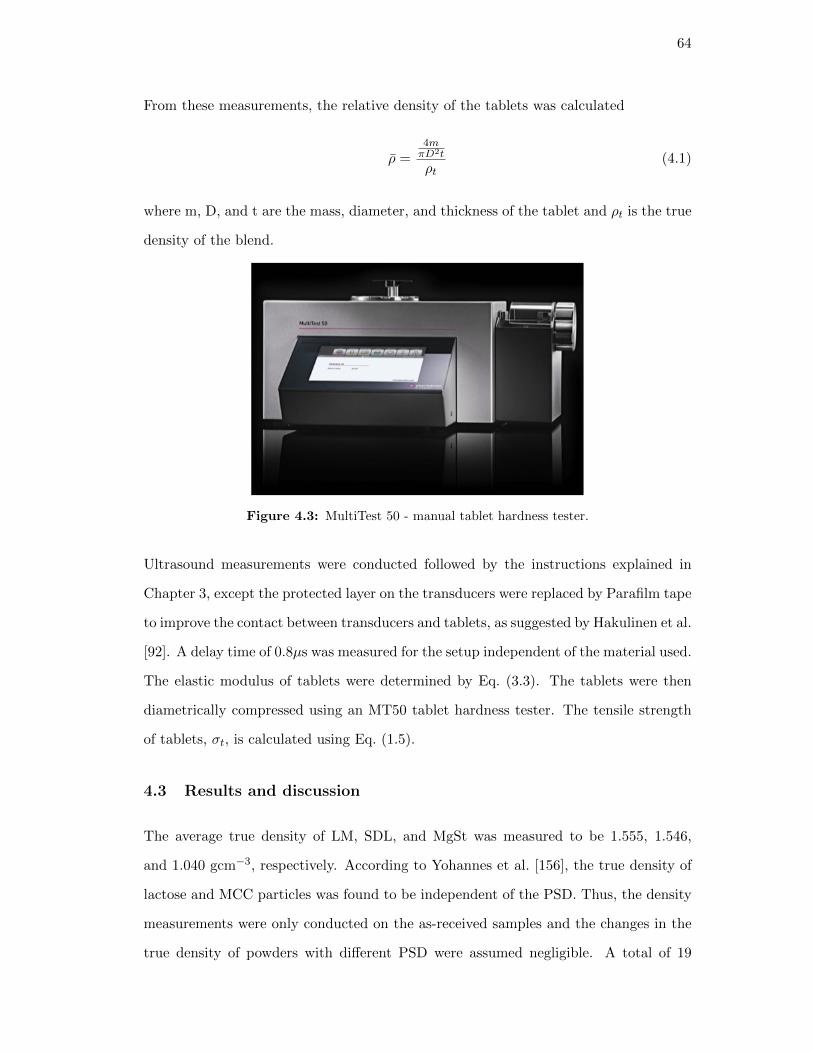
64
From these measurements, the relative density of the tablets was calculated
ρ =4mπD2t
ρt(4.1)
where m, D, and t are the mass, diameter, and thickness of the tablet and ρt is the true
density of the blend.
Figure 4.3: MultiTest 50 - manual tablet hardness tester.
Ultrasound measurements were conducted followed by the instructions explained in
Chapter 3, except the protected layer on the transducers were replaced by Parafilm tape
to improve the contact between transducers and tablets, as suggested by Hakulinen et al.
[92]. A delay time of 0.8µs was measured for the setup independent of the material used.
The elastic modulus of tablets were determined by Eq. (3.3). The tablets were then
diametrically compressed using an MT50 tablet hardness tester. The tensile strength
of tablets, σt, is calculated using Eq. (1.5).
4.3 Results and discussion
The average true density of LM, SDL, and MgSt was measured to be 1.555, 1.546,
and 1.040 gcm−3, respectively. According to Yohannes et al. [156], the true density of
lactose and MCC particles was found to be independent of the PSD. Thus, the density
measurements were only conducted on the as-received samples and the changes in the
true density of powders with different PSD were assumed negligible. A total of 19

65
blends of LM and 23 blends of SDL were prepared varying in lubricant concentration
(cl), mixing time (tm), and PSD, listed in Table 4.1.
0 50 100 150 200 250 300
Diameter, µm
0
2
4
6
8
10
12
14
16
18
20
Volu
me, %
0-75 µm
75-106 µm
106-150 µm
as-received
(a)
0 50 100 150 200 250 300
Diameter, µm
0
2
4
6
8
10
12
14
16
18
20
Volu
me, %
0-75 µm
75-106 µm
106-150 µm
150-212 µm
as-received
(b)
Figure 4.4: Particle size distribution of (a) lactose monohydrate and (b) spray-dried lactose.Red lines show the Gaussian fitting for each distribution.

66
Table 4.1: Mean (µ) and standard deviation (σ) for each particle size distribution, MgStconcentration, and the mixing time for all the cases studied.
Powder Cases PSD (µm) µ (µm) σ (µm) cl (%) tm (sec)
Lactose monohydrate 1 0-75 62.83 22.87 0.5 302 0-75 62.83 22.87 0.25 1203 0-75 62.83 22.87 0.5 1204 0-75 62.83 22.87 1 1205 0-75 62.83 22.87 2 1206 0-75 62.83 22.87 2 3007 0-75 62.83 22.87 0.25 12008 0-75 62.83 22.87 0.25 24009 0-75 62.83 22.87 2 1200
10 75-106 114 26.89 0.25 12011 75-106 114 26.89 0.25 120012 75-106 114 26.89 2 1200
13 106-150 149.3 25.6 0.25 12014 106-150 149.3 25.6 0.5 12015 106-150 149.3 25.6 0.25 120016 106-150 149.3 25.6 2 1200
17 as-received 77.72 31.85 0.25 12018 as-received 77.72 31.85 0.25 120019 as-received 77.72 31.85 2 1200
Spray-dried lactose 20 0-75 65.14 17.15 0.5 3021 0-75 65.14 17.15 2 3022 0-75 65.14 17.15 1 12023 0-75 65.14 17.15 0.5 60024 0-75 65.14 17.15 2 60025 0-75 65.14 17.15 2 1200
26 75-106 89.39 17.74 1 3027 75-106 89.39 17.74 0.5 12028 75-106 89.39 17.74 2 12029 75-106 89.39 17.74 1 600
30 106-150 120.9 27.04 0.5 3031 106-150 120.9 27.04 2 3032 106-150 120.9 27.04 1 12033 106-150 120.9 27.04 0.5 60034 106-150 120.9 27.04 2 60035 106-150 120.9 27.04 2 1200
36 150-212 171.9 33.91 0.5 3037 150-212 171.9 33.91 2 3038 150-212 171.9 33.91 1 12039 150-212 171.9 33.91 0.5 60040 150-212 171.9 33.91 2 600
41 as-received 128.3 39.5 0.25 12042 as-received 128.3 39.5 2 1200
Figs. 4.4(a) and 4.4(b) show PSD measured for the sieved and as-received samples of
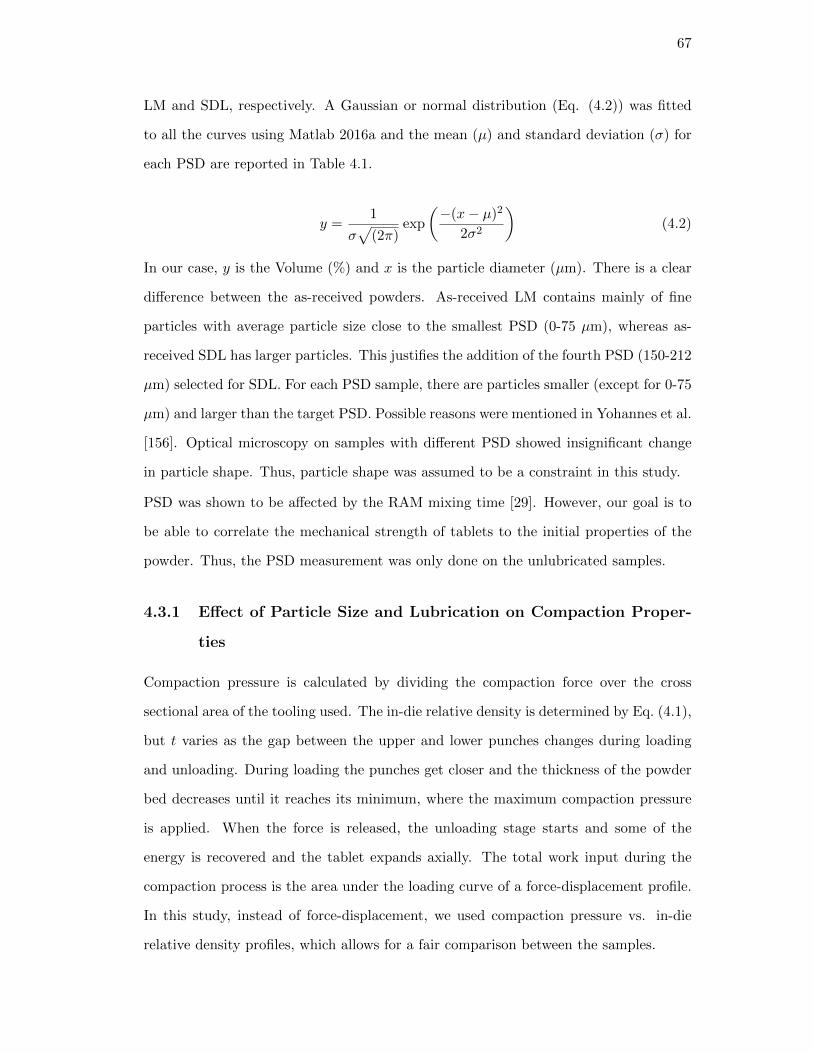
67
LM and SDL, respectively. A Gaussian or normal distribution (Eq. (4.2)) was fitted
to all the curves using Matlab 2016a and the mean (µ) and standard deviation (σ) for
each PSD are reported in Table 4.1.
y =1
σ√
(2π)exp
(−(x− µ)2
2σ2
)(4.2)
In our case, y is the Volume (%) and x is the particle diameter (µm). There is a clear
difference between the as-received powders. As-received LM contains mainly of fine
particles with average particle size close to the smallest PSD (0-75 µm), whereas as-
received SDL has larger particles. This justifies the addition of the fourth PSD (150-212
µm) selected for SDL. For each PSD sample, there are particles smaller (except for 0-75
µm) and larger than the target PSD. Possible reasons were mentioned in Yohannes et al.
[156]. Optical microscopy on samples with different PSD showed insignificant change
in particle shape. Thus, particle shape was assumed to be a constraint in this study.
PSD was shown to be affected by the RAM mixing time [29]. However, our goal is to
be able to correlate the mechanical strength of tablets to the initial properties of the
powder. Thus, the PSD measurement was only done on the unlubricated samples.
4.3.1 Effect of Particle Size and Lubrication on Compaction Proper-
ties
Compaction pressure is calculated by dividing the compaction force over the cross
sectional area of the tooling used. The in-die relative density is determined by Eq. (4.1),
but t varies as the gap between the upper and lower punches changes during loading
and unloading. During loading the punches get closer and the thickness of the powder
bed decreases until it reaches its minimum, where the maximum compaction pressure
is applied. When the force is released, the unloading stage starts and some of the
energy is recovered and the tablet expands axially. The total work input during the
compaction process is the area under the loading curve of a force-displacement profile.
In this study, instead of force-displacement, we used compaction pressure vs. in-die
relative density profiles, which allows for a fair comparison between the samples.

68
0.6 0.7 0.8 0.9 1 1.1
Relative density
0
50
100
150
200
250
300
350
400
450
Com
paction p
ressure
, M
Pa
as-received-0.25%MgSt-120sec
as-received-0.25%MgSt-1200sec
as-received-2%MgSt-1200sec
(a)
0.6 0.7 0.8 0.9 1 1.1
Relative density
0
50
100
150
200
250
300
350
400
450
Com
paction p
ressure
, M
Pa
0-75-0.25%MgSt-120sec
0-75-0.25%MgSt-1200sec
0-75-2%MgSt-1200sec
(b)
0.6 0.7 0.8 0.9 1 1.1
Relative density
0
50
100
150
200
250
300
350
400
450
Com
paction p
ressure
, M
Pa
75-106-0.25%MgSt-120sec
75-106-0.25%MgSt-1200sec
75-106-2%MgSt-1200sec
(c)
0.6 0.7 0.8 0.9 1 1.1
Relative density
0
50
100
150
200
250
300
350
400
450
Com
paction p
ressure
, M
Pa
106-150-0.25%MgSt-120sec
106-150-0.25%MgSt-1200sec
106-150-2%MgSt-1200sec
(d)
Figure 4.5: Lubrication effect on compaction pressure vs. in-die relative density of lactosemonohydrate for different particle size distributions: (a) as-recieved, (b) 0-75 µm,(c) 75-106 µm, and (d) 106-150 µm.
Fig. 4.5 compares the axial compaction pressure vs. in-die relative density profiles of
three similar lubrication conditions for the as-received and sieved LM powders. It has
been reported that better packing can be achieved during die filling, in particles exposed
to higher shear strain levels causing higher initial relative densities (i.e., the die-fill
relative density) [103, 157]. In this study, this phenomenon was noticeably observed in
the as-received LM. For the sieved samples, by keeping the MgSt concentration constant,
the mixing time did hardly affect the loading and unloading path as a function of relative
density. On the other hand, in all the cases, the increase in MgSt concentration results in
a different compaction profile, moving toward the right-hand side. This shift is partially
caused by the decrease in the true density of the blend. Fig. 4.5(b) discernibly shows

69
that the forces evolved during compression are slightly lower when more lubrication was
used, i.e. less work was needed. It has been reported that with increase in lubricant
level lower input work is expected attributing it to reduced particle cohesiveness and
decreased frictional effects at the punch faces and die wall [136, 158].
0.6 0.7 0.8 0.9 1 1.1
Relative density
0
50
100
150
200
250
300
350
400
450
Co
mp
actio
n p
ressu
re,
MP
a
0.25%MgSt-120sec
0-75
75-106
106-150
as-received
(a)
0.6 0.7 0.8 0.9 1 1.1
Relative density
0
50
100
150
200
250
300
350
400
450
Co
mp
actio
n p
ressu
re,
MP
a
0.25%MgSt-1200sec
0-75
75-106
106-150
as-received
(b)
0.6 0.7 0.8 0.9 1 1.1
Relative density
0
50
100
150
200
250
300
350
400
450
Co
mp
actio
n p
ressu
re,
MP
a
2%MgSt-1200sec
0-75
75-106
106-150
as-received
(c)
Figure 4.6: Particle size effect on compaction pressure vs. in-die relative density of lac-tose monohydrate for different lubrication parameters: (a) 0.25%MgSt-120sec,(b) 0.25%MgSt-1200sec, and (c) 2%MgSt-1200sec.
Fig. 4.6 was plotted to better compare the compaction profiles for different PSD with
the same lubrication history. There is no significant difference among the compaction
profiles for each condition, indicating that PSD does not affect the deformation behavior
of LM with the presence of lubrication. The high initial relative density in the as-
received sample compared to the sieved samples, may be explained by its relatively
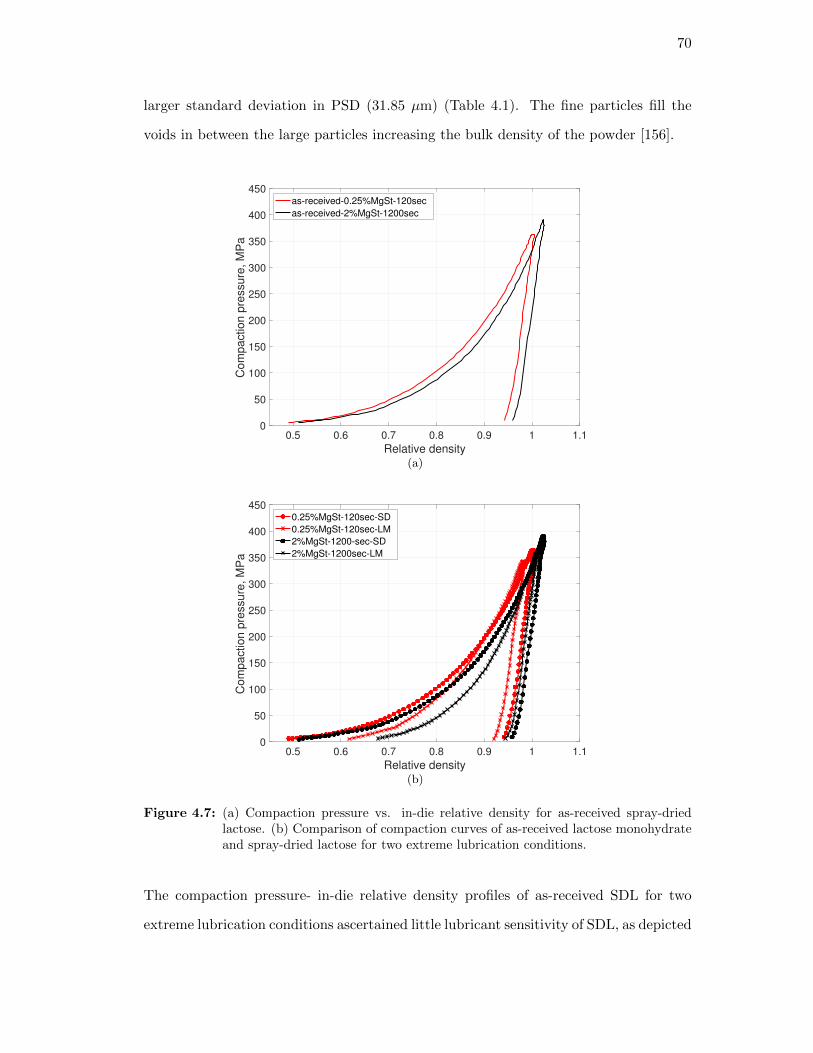
70
larger standard deviation in PSD (31.85 µm) (Table 4.1). The fine particles fill the
voids in between the large particles increasing the bulk density of the powder [156].
0.5 0.6 0.7 0.8 0.9 1 1.1
Relative density
0
50
100
150
200
250
300
350
400
450
Com
paction p
ressure
, M
Pa
as-received-0.25%MgSt-120sec
as-received-2%MgSt-1200sec
(a)
0.5 0.6 0.7 0.8 0.9 1 1.1
Relative density
0
50
100
150
200
250
300
350
400
450
Com
paction p
ressure
, M
Pa
0.25%MgSt-120sec-SD
0.25%MgSt-120sec-LM
2%MgSt-1200-sec-SD
2%MgSt-1200sec-LM
(b)
Figure 4.7: (a) Compaction pressure vs. in-die relative density for as-received spray-driedlactose. (b) Comparison of compaction curves of as-received lactose monohydrateand spray-dried lactose for two extreme lubrication conditions.
The compaction pressure- in-die relative density profiles of as-received SDL for two
extreme lubrication conditions ascertained little lubricant sensitivity of SDL, as depicted

71
in Fig. 4.7(a). Fig. 4.7(b) compares the compaction behavior between the two as-
received powders. The total work input during the compaction process is much higher
for SDL. Mollan and Celik [136] argued that as the total work input increases, the
compacted powder is expected to be stronger as a result of higher energies used to
form bonds between particles. If this hypothesis holds, we expect SDL tablets to be
much stronger than LM tablets. We should be mindful that the energy of a tablet
formation that affects the bond strength, according to the first law of thermodynamics,
is associated with both the work done on the powder to form a tablet and the heat
released by the system [159].
It is also interesting to mention that for the same lubrication condition the difference
in the compaction profiles between the two powders almost disappears when it reaches
its maximum. This happens at relative densities beyond 0.9, where the area of true
contact between particles is large.
Figs. 4.5 and 4.7(a) suggest that for the two materials studied, PSD and lubrication
history have no impact on the unloading curve. One way to characterize the decom-
pression phase is to measure the axial elastic recovery (ER%) [160], which is computed
byρmax−ρf
ρf× 100%, where ρmax is the relative density at maximum compaction force
and ρf is the final in-die relative density. According to Table 4.2, the computed values
were in agreement with the observations and showed no trend. Fig. 4.8 is depicted to
ease the comparison between the cases. Clearly, more data points should probably be
used to determine if such a trend exists or not. Moreover, determining ER% alone is
not sufficient for comparing the unloading curves.
It bears emphasis that the upper punch force-displacement curves were used to charac-
terize the powder compaction behavior under the assumption that the die wall friction
was negligible. Since in this work the lubrication of the powder has been changed con-
siderably it may have resulted in different die wall frictions. To investigate the effect
of die wall friction the lower punch force readings should be studied. Therefore, in
order to better understand and characterize the compaction behavior of powders more
information needs to be extracted from the compaction profiles, which is outside the

72
scope of this dissertation.
Table 4.2: Percentage elastic recovery and the maximum relative density for different particlesize distribution and three lubrication conditions (in consecutive order: 0.25%MgSt-2min, 0.25%MgSt-20min, and 2%MgSt-20min) of lactose monohydrate.
PSD Cases (cf. Table 4.1) ER% ρmax
0-75 µm 2 0.995 6.72
7 0.9997 7.37
9 1.002 6.36
75-106 µm 10 1.0113 7.73
11 0.9983 6.99
12 1.023 7.09
106-150 µm 13 1.005 6.83
15 1.018 7.29
16 1.026 6.95
as-received 17 0.9802 6.52
18 0.9955 5.97
19 1.0084 6.8
0.98 0.99 1 1.01 1.02 1.03
Maximum relative density
5.5
6
6.5
7
7.5
8
Ela
stic r
ecovery
, %
0-75
75-106
106-150
as-received
Figure 4.8: Elastic recovery vs. in-die maximum relative density for different particle sizedistributions of lactose monohydrate.

73
4.3.2 Effect of Particle Size and Lubrication on Tensile Strength and
Stiffness of Tablets
Elastic modulus and tensile strength vs. out-of-die relative density for different PSDs
of LM tablets are depicted in Figs. 4.9 and 4.10. Since there were more cases studied
for 0-75 µm, the results are plotted separately.
As was expected, both the elastic modulus and tensile strength decreased by adding
more lubricant and/or mixing time. Although, the effect is more significant in smaller
PSD compared to large PSD. This can be attributed to smaller particles having more
available surface area to be covered by MgSt coating. For all the PSD levels, the lubri-
cation affects the strength and stiffness level until it reaches a saturation regime, where
the powder would no longer be affected with the addition of lubricant concentration
or mixing time, in accordance with Kikuta and Kitamori [130]. It should be noted
that the lubricant concentration and mixing time do not affect the tensile strength
and elastic modulus of tablets by the same rate. The results demonstrate an envelope
for tensile strength and elastic modulus obtainable for tablets with relative densities
ranging between 0.8 and 0.94 considering different PSDs and lubricant conditions.

74
0.8 0.82 0.84 0.86 0.88 0.9 0.92 0.94 0.96
Relative density
0
0.5
1
1.5
2
2.5
3
3.5
4
4.5
5
Ela
stic m
od
ulu
s,
GP
a
0.5%MgSt-30sec
0.25%MgSt-120sec
0.5%MgSt-120sec
1%MgSt-120sec
2%MgSt-120sec
2%MgSt-300sec
0.25%MgSt-1200sec
0.25%MgSt-2400sec
2%MgSt-1200sec
(a)
0.8 0.82 0.84 0.86 0.88 0.9 0.92 0.94 0.96
Relative density
0
0.5
1
1.5
2
2.5
3
3.5
4
Te
nsile
str
en
gth
, M
Pa
0.5%MgSt-30sec
0.25%MgSt-120sec
0.5%MgSt-120sec
1%MgSt-120sec
2%MgSt-120sec
2%MgSt-300sec
0.25%MgSt-1200sec
0.25%MgSt-2400sec
2%MgSt-1200sec
(b)
Figure 4.9: Elastic modulus and tensile strength vs. out-of-die relative density of all thelactose monohydrate tablets with PSD of 0-75 µm.

75
0.82 0.84 0.86 0.88 0.9 0.92 0.94 0.96
Relative density
0
0.5
1
1.5
2
2.5
3
3.5
4
4.5
5
Ela
stic m
odulu
s, G
Pa
0.25%MgSt-120sec
0.25%MgSt-1200sec
2%MgSt-1200sec
(a)
0.82 0.84 0.86 0.88 0.9 0.92 0.94 0.96
Relative density
0
0.5
1
1.5
2
2.5
3
3.5
4
Tensile
str
ength
, M
Pa
0.25%MgSt-120sec
0.25%MgSt-1200sec
2%MgSt-1200sec
(b)
0.82 0.84 0.86 0.88 0.9 0.92 0.94 0.96
Relative density
0
0.5
1
1.5
2
2.5
3
3.5
4
4.5
5
Ela
stic m
odulu
s, G
Pa
0.25%MgSt-120sec
0.5%MgSt-120sec
0.25%MgSt-1200sec
2%MgSt-1200sec
(c)
0.82 0.84 0.86 0.88 0.9 0.92 0.94 0.96
Relative density
0
0.5
1
1.5
2
2.5
3
3.5
4
Tensile
str
ength
, M
Pa
0.25%MgSt-120sec
0.5%MgSt-120sec
0.25%MgSt-1200sec
2%MgSt-1200sec
(d)
0.82 0.84 0.86 0.88 0.9 0.92 0.94 0.96
Relative density
0
0.5
1
1.5
2
2.5
3
3.5
4
4.5
5
Ela
stic m
odulu
s, G
Pa
0.25%MgSt-120sec
0.25%MgSt-1200sec
2%MgSt-1200sec
(e)
0.82 0.84 0.86 0.88 0.9 0.92 0.94 0.96
Relative density
0
0.5
1
1.5
2
2.5
3
3.5
4
Tensile
str
ength
, M
Pa
0.25%MgSt-120sec
0.25%MgSt-1200sec
2%MgSt-1200sec
(f)
Figure 4.10: Elastic modulus and tensile strength vs. out-of-die relative density for differentPSDs of lactose monohydrate; (a,b) 75-106 µm, (c,d) 106-150 µm, and (e,f)as-received.
The reduction in strength of large particles (106-150 µm), even for the least lubricated

76
tablets (case 13), was to a degree that hardly particles formed a solid and the tablets
were extremely weak. In fact, the elastic modulus measurements of highly lubricated
tablets with high relative densities (case 16) failed, indicating that there was not suf-
ficient bonding stiffness to pass the ultrasound wave. Obviously, in practical purposes
this level of strength is not desirable but since our goal is to have a model based on
lubrication sensitivity we created a vast collection of data.
The initial particle size of LM affects the mechanical strength of tablets, as depicted
in Fig. 4.11. Large mean particle sizes exhibited faster response to tablet strength
saturation by increasing lubricant concentration and/or mixing time. For 0.25%MgSt-
2min case, the difference between each PSD is noticeable. This may be due to the more
available surface area in smaller particles requiring more mixing time to fully be coated
by MgSt. The as-received tablets in the low lubrication condition show high elastic
modulus and tensile strength because of having a large population of small particles.
However, as the shear strain increases, the larger particles are overlubricated causing
a significant drop in the elastic modulus and tensile strength. Altogether, we have
observed that the lubricant and PSD sensitivity of LM are more pronounced in the
tablet properties than in its deformation behavior during compaction.
The elastic modulus and tensile strength of all the SDL tablets are plotted against
their relative densities for different PSD levels in Fig. 4.12. SDL shows a non-negligible
sensitivity to lubrication. As expected by the compaction profiles, SDL tablets showed
higher values of elastic modulus and tensile strength compared to LM tablets. This
difference is more remarkable between the stiffness of tablets compared to the their
tensile strength.
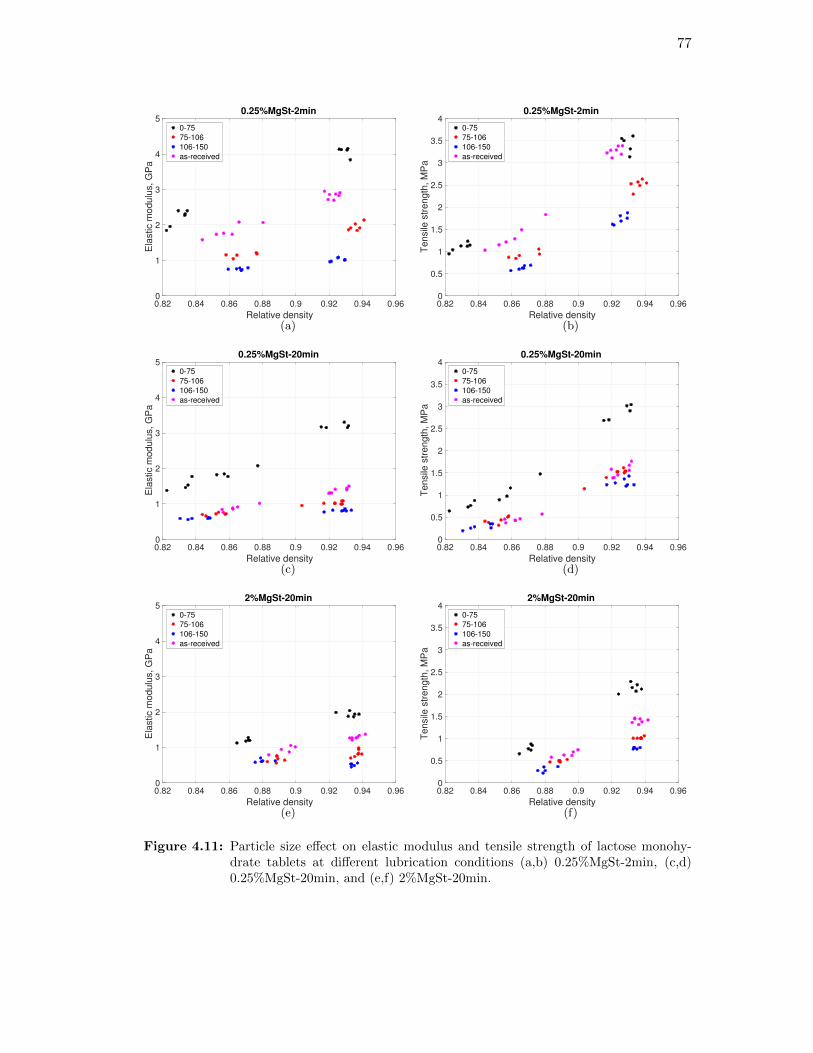
77
0.82 0.84 0.86 0.88 0.9 0.92 0.94 0.96
Relative density
0
1
2
3
4
5
Ela
stic m
od
ulu
s,
GP
a
0.25%MgSt-2min
0-75
75-106
106-150
as-received
(a)
0.82 0.84 0.86 0.88 0.9 0.92 0.94 0.96
Relative density
0
0.5
1
1.5
2
2.5
3
3.5
4
Te
nsile
str
en
gth
, M
Pa
0.25%MgSt-2min
0-75
75-106
106-150
as-received
(b)
0.82 0.84 0.86 0.88 0.9 0.92 0.94 0.96
Relative density
0
1
2
3
4
5
Ela
stic m
od
ulu
s,
GP
a
0.25%MgSt-20min
0-75
75-106
106-150
as-received
(c)
0.82 0.84 0.86 0.88 0.9 0.92 0.94 0.96
Relative density
0
0.5
1
1.5
2
2.5
3
3.5
4
Te
nsile
str
en
gth
, M
Pa
0.25%MgSt-20min
0-75
75-106
106-150
as-received
(d)
0.82 0.84 0.86 0.88 0.9 0.92 0.94 0.96
Relative density
0
1
2
3
4
5
Ela
stic m
od
ulu
s,
GP
a
2%MgSt-20min
0-75
75-106
106-150
as-received
(e)
0.82 0.84 0.86 0.88 0.9 0.92 0.94 0.96
Relative density
0
0.5
1
1.5
2
2.5
3
3.5
4
Te
nsile
str
en
gth
, M
Pa
2%MgSt-20min
0-75
75-106
106-150
as-received
(f)
Figure 4.11: Particle size effect on elastic modulus and tensile strength of lactose monohy-drate tablets at different lubrication conditions (a,b) 0.25%MgSt-2min, (c,d)0.25%MgSt-20min, and (e,f) 2%MgSt-20min.

78
0.8 0.82 0.84 0.86 0.88 0.9 0.92 0.94 0.96
Relative density
0
1
2
3
4
5
6
7
8
9
Ela
stic m
odulu
s, G
Pa
0.5%MgSt-30sec
2%MgSt-30sec
1%MgSt-120sec
0.5%MgSt-600sec
2%MgSt-600sec
2%MgSt-1200sec
(a)
0.8 0.82 0.84 0.86 0.88 0.9 0.92 0.94 0.96
Relative density
0
0.5
1
1.5
2
2.5
3
3.5
4
4.5
5
Tensile
str
ength
, M
Pa
0.5%MgSt-30sec
2%MgSt-30sec
1%MgSt-120sec
0.5%MgSt-600sec
2%MgSt-600sec
2%MgSt-1200sec
(b)
0.8 0.82 0.84 0.86 0.88 0.9 0.92 0.94 0.96
Relative density
0
1
2
3
4
5
6
7
8
9
Ela
stic m
odulu
s, G
Pa
1%MgSt-30sec
0.5%MgSt-120sec
2%MgSt-120sec
1%MgSt-600sec
(c)
0.8 0.82 0.84 0.86 0.88 0.9 0.92 0.94 0.96
Relative density
0
0.5
1
1.5
2
2.5
3
3.5
4
4.5
5
Tensile
str
ength
, M
Pa
1%MgSt-30sec
0.5%MgSt-120sec
2%MgSt-120sec
1%MgSt-600sec
(d)
0.8 0.82 0.84 0.86 0.88 0.9 0.92 0.94 0.96
Relative density
0
1
2
3
4
5
6
7
8
9
Ela
stic m
odulu
s, G
Pa
0.5%MgSt-30sec
2%MgSt-30sec
1%MgSt-120sec
0.5%MgSt-600sec
2%MgSt-600sec
2%MgSt-1200sec
(e)
0.8 0.82 0.84 0.86 0.88 0.9 0.92 0.94 0.96
Relative density
0
0.5
1
1.5
2
2.5
3
3.5
4
4.5
5
Tensile
str
ength
, M
Pa
0.5%MgSt-30sec
2%MgSt-30sec
1%MgSt-120sec
0.5%MgSt-600sec
2%MgSt-600sec
2%MgSt-1200sec
(f)
Figure 4.12: Elastic modulus and tensile strength vs. out-of-die relative density for differentPSDs of spray-dried lactose; (a,b) 0-75 µm, (c,d) 75-106 µm, (e,f) 106-150 µm,(g,h) 150-212 µm, and (i,j) as-received.
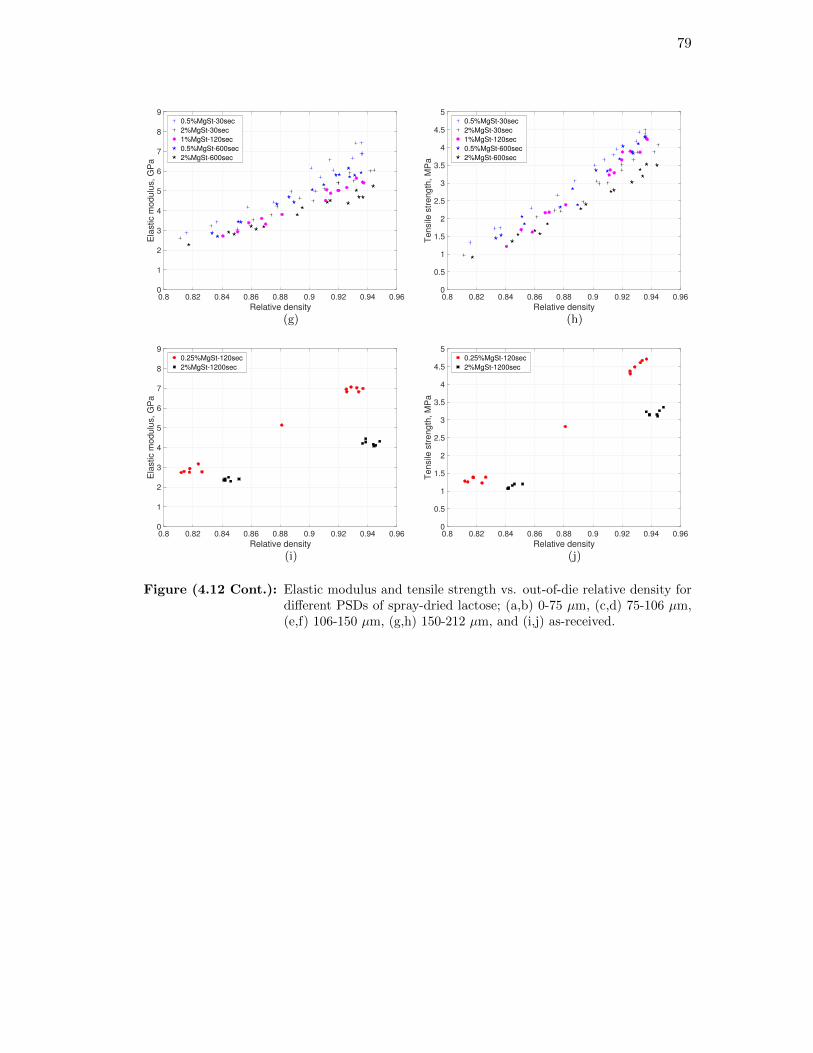
79
0.8 0.82 0.84 0.86 0.88 0.9 0.92 0.94 0.96
Relative density
0
1
2
3
4
5
6
7
8
9
Ela
stic m
odulu
s, G
Pa
0.5%MgSt-30sec
2%MgSt-30sec
1%MgSt-120sec
0.5%MgSt-600sec
2%MgSt-600sec
(g)
0.8 0.82 0.84 0.86 0.88 0.9 0.92 0.94 0.96
Relative density
0
0.5
1
1.5
2
2.5
3
3.5
4
4.5
5
Tensile
str
ength
, M
Pa
0.5%MgSt-30sec
2%MgSt-30sec
1%MgSt-120sec
0.5%MgSt-600sec
2%MgSt-600sec
(h)
0.8 0.82 0.84 0.86 0.88 0.9 0.92 0.94 0.96
Relative density
0
1
2
3
4
5
6
7
8
9
Ela
stic m
odulu
s, G
Pa
0.25%MgSt-120sec
2%MgSt-1200sec
(i)
0.8 0.82 0.84 0.86 0.88 0.9 0.92 0.94 0.96
Relative density
0
0.5
1
1.5
2
2.5
3
3.5
4
4.5
5
Tensile
str
ength
, M
Pa
0.25%MgSt-120sec
2%MgSt-1200sec
(j)
Figure (4.12 Cont.): Elastic modulus and tensile strength vs. out-of-die relative density fordifferent PSDs of spray-dried lactose; (a,b) 0-75 µm, (c,d) 75-106 µm,(e,f) 106-150 µm, (g,h) 150-212 µm, and (i,j) as-received.
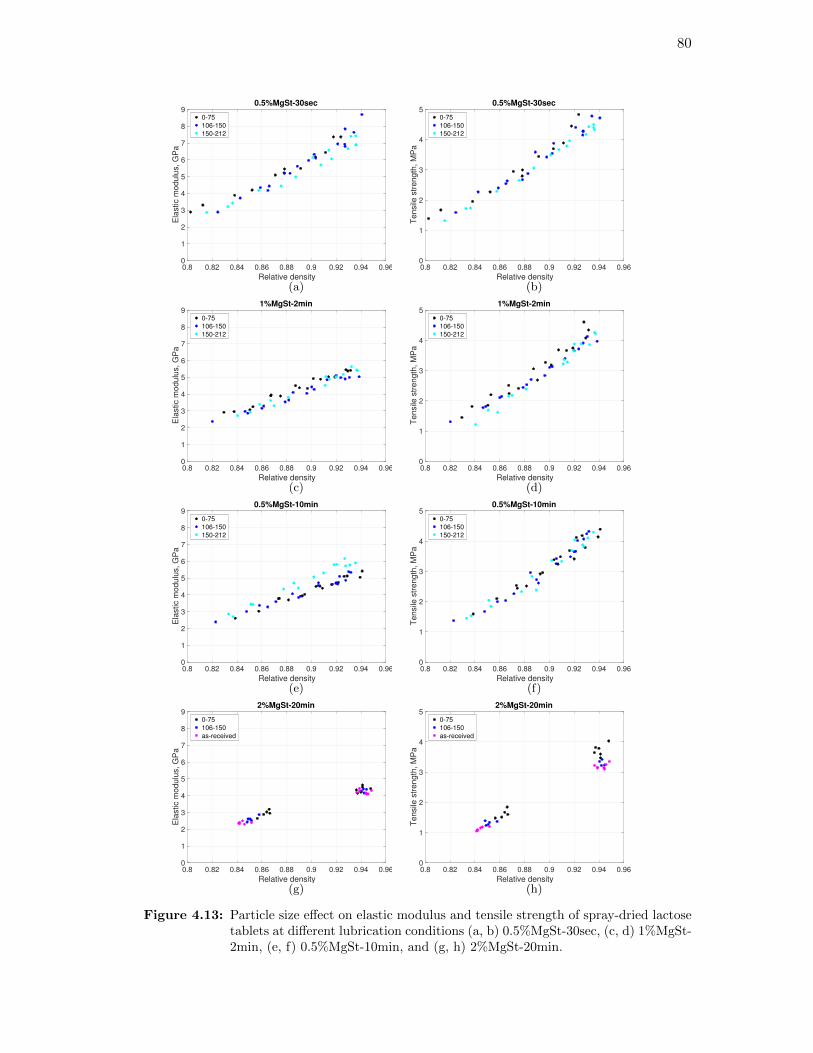
80
0.8 0.82 0.84 0.86 0.88 0.9 0.92 0.94 0.96
Relative density
0
1
2
3
4
5
6
7
8
9
Ela
stic m
od
ulu
s,
GP
a
0.5%MgSt-30sec
0-75
106-150
150-212
(a)
0.8 0.82 0.84 0.86 0.88 0.9 0.92 0.94 0.96
Relative density
0
1
2
3
4
5
Te
nsile
str
en
gth
, M
Pa
0.5%MgSt-30sec
0-75
106-150
150-212
(b)
0.8 0.82 0.84 0.86 0.88 0.9 0.92 0.94 0.96
Relative density
0
1
2
3
4
5
6
7
8
9
Ela
stic m
od
ulu
s,
GP
a
1%MgSt-2min
0-75
106-150
150-212
(c)
0.8 0.82 0.84 0.86 0.88 0.9 0.92 0.94 0.96
Relative density
0
1
2
3
4
5
Te
nsile
str
en
gth
, M
Pa
1%MgSt-2min
0-75
106-150
150-212
(d)
0.8 0.82 0.84 0.86 0.88 0.9 0.92 0.94 0.96
Relative density
0
1
2
3
4
5
6
7
8
9
Ela
stic m
od
ulu
s,
GP
a
0.5%MgSt-10min
0-75
106-150
150-212
(e)
0.8 0.82 0.84 0.86 0.88 0.9 0.92 0.94 0.96
Relative density
0
1
2
3
4
5
Te
nsile
str
en
gth
, M
Pa
0.5%MgSt-10min
0-75
106-150
150-212
(f)
0.8 0.82 0.84 0.86 0.88 0.9 0.92 0.94 0.96
Relative density
0
1
2
3
4
5
6
7
8
9
Ela
stic m
od
ulu
s,
GP
a
2%MgSt-20min
0-75
106-150
as-received
(g)
0.8 0.82 0.84 0.86 0.88 0.9 0.92 0.94 0.96
Relative density
0
1
2
3
4
5
Te
nsile
str
en
gth
, M
Pa
2%MgSt-20min
0-75
106-150
as-received
(h)
Figure 4.13: Particle size effect on elastic modulus and tensile strength of spray-dried lactosetablets at different lubrication conditions (a, b) 0.5%MgSt-30sec, (c, d) 1%MgSt-2min, (e, f) 0.5%MgSt-10min, and (g, h) 2%MgSt-20min.
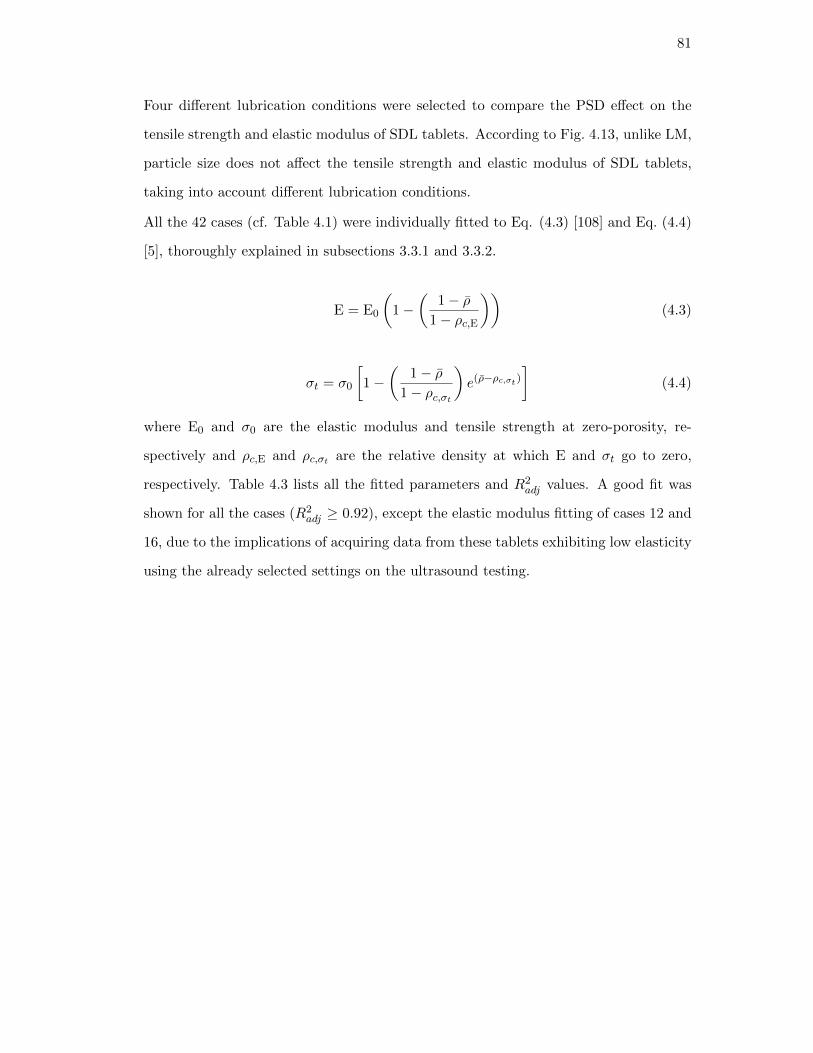
81
Four different lubrication conditions were selected to compare the PSD effect on the
tensile strength and elastic modulus of SDL tablets. According to Fig. 4.13, unlike LM,
particle size does not affect the tensile strength and elastic modulus of SDL tablets,
taking into account different lubrication conditions.
All the 42 cases (cf. Table 4.1) were individually fitted to Eq. (4.3) [108] and Eq. (4.4)
[5], thoroughly explained in subsections 3.3.1 and 3.3.2.
E = E0
(1−
(1− ρ
1− ρc,E
))(4.3)
σt = σ0
[1−
(1− ρ
1− ρc,σt
)e(ρ−ρc,σt )
](4.4)
where E0 and σ0 are the elastic modulus and tensile strength at zero-porosity, re-
spectively and ρc,E and ρc,σt are the relative density at which E and σt go to zero,
respectively. Table 4.3 lists all the fitted parameters and R2adj values. A good fit was
shown for all the cases (R2adj ≥ 0.92), except the elastic modulus fitting of cases 12 and
16, due to the implications of acquiring data from these tablets exhibiting low elasticity
using the already selected settings on the ultrasound testing.

82
Table 4.3: σ0, ρc,σt , E0, and ρc,E together with their R2adj values for all the cases.
Powder Cases σ0 (MPa) ρc,σt (%) R2adj(%) E0 (GPa) ρc,E (%) R2
adj(%)
Lactose monohydrate 1 5.6 76.16 97.83 6.47 72.93 95.842 5.36 77.27 98.41 5.4 71.29 97.363 6.19 78.07 97.88 5.77 73.7 93.824 5.64 79.61 98.81 4.86 74.42 98.55 4.99 79.7 97.12 4.28 73.14 97.986 4.21 82.47 99.42 3.69 75.3 94.97 4.92 80.08 98.13 4.52 75.12 96.938 3.31 81.26 96.7 2.4 75.68 98.229 3.79 82.9 98.28 2.73 76.68 95.89
10 4.18 82.13 98.22 2.69 76.82 95.9811 2.81 81.9 99.03 1.36 68.71 95.9512 1.78 83.72 99.37 1.06 70.27 48.36
13 3.3 82.78 99.29 1.36 69.58 92.4414 2.47 82.34 96.89 1.16 72.02 96.3215 2.26 81.22 97.63 1.01 61.14 97.0616 1.45 84.28 97.78 - - -
17 6.01 81.05 98.94 4.07 74.52 96.2918 3.02 83.38 97.65 2 75.6 97.8719 2.62 85.1 96.59 1.84 78.37 92.92
Spray-dried lactose 20 6.91 74.65 95.83 9.8 72.78 96.1621 6.49 77.13 96.11 7.23 74.09 95.5822 6.56 76.89 95.42 7.29 72.45 97.0323 6.23 76.76 95.56 6.85 73.55 96.7724 5.7 79.32 97.22 5.76 74.42 98.225 5.58 79.22 98.29 5.48 70.42 95.82
26 6.15 75.09 94.81 8.74 72.71 97.2227 6.49 76.39 94.75 7.98 74.2 96.8228 5.39 76.86 94.56 6.7 74.06 96.9929 5.67 76.87 97.63 6.54 72.75 97.13
30 6.71 75.2 96.37 10.66 76.53 95.9231 5.6 76.17 94.33 7.5 72.96 96.4532 5.97 76.19 98.65 6.85 73.25 96.5533 6.42 77.87 96.53 6.94 73.27 95.934 5.13 77.73 96.27 5.57 72.62 96.8635 4.77 77.87 99.11 5.39 71.23 98.53
36 6.47 75.51 99.59 9.43 74.48 96.1737 5.66 76.74 98.12 7.65 73.37 96.0538 6.44 79.05 98.41 7.37 74.81 97.3139 6.29 77.22 96.35 8.27 74.77 97.640 4.95 76.83 98.75 6.31 71.99 96.39
41 6.91 76.36 99.5 9.47 73.97 99.2442 4.63 78.08 99.49 5.3 71.68 97.89

83
4.3.3 Proposed Model
Toward quantifying the PSD and lubricant sensitivity effects on mechanical properties
of tablets, we introduce a parameter “C” into the tensile strength and elastic modulus
relationships with relative density. For the sake of simplicity and generality, we assume
a form for C that captures the leading order term of the variables, that is
C =clx1 tm
x2 µx3
x4(4.5)
where {x1, x2, x3, x4} are the fitting coefficients. The coefficient x4 serves as a “normal-
ization” parameter to make C dimensionless. C will depend on the response variable
(i.e., tensile strength and elastic modulus) and material properties. Thus, we define
four distinct C parameters, referred to as CE,LM and Cσ,LM for lactose monohydrate
and CE,SPD and Cσ,SPD for spray-dried lactose.
In order to introduce C into the Eqs. (4.3) and (4.4), we need to find the relationships
between C and E0, σ0, ρc,E, and ρc,σt (the fitting parameters in those relationships).
Figs. 4.9, 4.10 and 4.12 show that the data points converge as ρ decreases, in agreement
with what authors observed in Razavi et al. [161]. Thus, to keep the optimization
problem simpler and mathematically less complex, we assume constant ρc,E and ρc,σt
for each powder, regardless of its PSD, lubricant concentration or/and mixing time.
Thus, as a first order approximation only E0 and σ0 were considered as functions of C.
We parameterize E0 and σ0 as follows:
E0 =E0,∅ − E0,∞
1 + CE+ E0,∞, where CE =
clb1 tb2m µb3
b4(4.6)
σ0 =σ0,∅ − σ0,∞
1 + Cσ+ σ0,∞, where Cσ =
cld1 td2m µd3
d4(4.7)
where {b1, b2, b3, b4} and {d1, d2, d3, d4} are the fitting parameters presented in
function C for E0 and σ0, respectively. (E0,∅ and E0,∞) and (σ0,∅ and σ0,∞) correspond
to properties for when C = 0 and C = ∞, respectively. Thus, E0,∅ and E0,∞ are the
maximum and minimum values E0 can obtain, which are determined by fitting the

84
experimental data to the above equation. The same holds for σ0. For most materials,
E0,∞ (or σ0,∞) will go to zero. However, it has been reported that materials, which
experience significant fracture may develop some tablet strength even if they are fully
lubricated [153, 130]. Therefore, the limit of infinite lubrication does not necessarily
need to be zero strength and stiffness.
The functionality of E0 and σ0 is in fact unknown. In this study, we parameterized these
two functions only in the interest of simplicity and generality. Other functionalities may
be explored, which falls outside the scope of this dissertation.
E0 and σ0 were predicted from experimental results by solving the following general
optimization problems
min{b1,...,E0,∞,ρc,E}
[∑i∈P
(E(ρi)− E0{b1,...,b4,E0,∅,E0,∞}
(1− 1− ρi
1− ρc,E
))2]1/2
min{d1,...,σ0,∞,ρc,σt}
[∑i∈Q
(σt(ρi)− σ0{d1,...,d4,σ0,∅,σ0,∞}
(1− 1− ρi
1− ρc,σt
)e(ρi−ρc,σt )
)2]1/2
where P and Q are a set of experimental points obtained from ultrasound and diamet-
rical compression tests, respectively. In this study, P and Q consisted of 316 points for
SPD and 204 and 214 points for LM, respectively. It is noted that those 10 observations
that were removed from the set for the elastic modulus optimization correspond to case
16 in Table 4.3. Case 5 from LM dataset and cases 24 and 33 from SDL dataset were
randomly taken out and adopted later to evaluate the validity of the model.
The solution to the optimization problems forced E0,∞ and σ0,∞ to go to zero for both
materials. Thus, Eqs. (4.6) and (4.7) were reduced to
E0 =E0,∅
1 + clb1 t
b2m µb3b4
σ0 =σ0,∅
1 + cld1 t
d2m µd3d4

85
Table 4.4: Optimal coefficients and their residual error of elastic modulus optimization prob-lem for lactose monohydrate and spray-dried lactose.
Powder E0,∅ (GPa) b1 b2 b3 b4 ρc,E E-norm (GPa)
Lactose monohydrate 28.1221 0.1491 0.2645 1.7082 841.377 0.7316 3.31
Spray-dried lactose 390932.897 0.1654 0.0859 -0.0179 0.0000266 0.7354 5.529
Table 4.5: Optimal coefficients and their residual error of tensile strength optimization prob-lem for lactose monohydrate and spray-dried lactose.
Powder σ0,∅ (MPa) d1 d2 d3 d4 ρc,σt σ-norm (MPa)
Lactose monohydrate 14.9186 0.1982 0.301 1.2984 498.924 0.7924 3.739
Spray-dried lactose 10.0276 0.3342 0.1237 0.2154 7.5374 0.7653 3.31
The optimal values together with the residual errors for the optimization problems are
in Tables 4.4 and 4.5. For LM, b3 and d3 values indicate that changes in PSD result
in more drastic changes in elastic modulus and tensile strength of tablets compared
to cl and tm. On the other hand, cl seems to be the most influential variable on the
mechanical properties of SDL (see, b1 and d1 values in Tables 4.4 and 4.5). E0,∅ of
SDL resulted in an unrealistic prediction. Hence, we attempted to produce tablets of
SDL with no lubrication, but the compaction was not successful due to extremely high
frictional and ejection forces. Overall, caution must be taken in interpreting E0,∅ and
σ0,∅.
In summary, our proposed strategy shows that elastic modulus (or, tensile strength)
not only depends on the relative density of tablets, it is also inversely proportional to a
non-linear function of material and blending properties and can be presented as follows:
E =E0,∅
1 + clb1 t
b2m µb3b4
(1− 1− ρ
1− ρc,E
)(4.8)
σt =σ0,∅
1 + cld1 t
d2m µd3d4
(1− 1− ρ
1− ρc,σt
)e(ρ−ρc,σt ) (4.9)

86
The groundwork of our model was to relate the variables that contribute to parameter
C, to E0 and σ0. Figs. 4.14 and 4.15 demonstrate the functionality of the proposed rela-
tionship. The model fitted the data well for both materials. The validation points were
in good agreement with the predicted curves. It should be noted that our optimization
problems were constructed to minimize the experimental and predicted values of elastic
modulus and tensile strength of tablets. Thereby, the fitting coefficients presented in
Tables 4.4 and 4.5 are not the optimal values for predicting E0 and σ0.
The measured and predicted elastic modulus and tensile strength as a function of rela-
tive density for all the LM and SDL tablets are plotted in Figs. 4.16 and 4.17, respec-
tively. The colorbar represents a normalized parameter C. The model well captured
the lubrication trend with respect to PSD in the elastic modulus and tensile strength
for the two compacted powders.
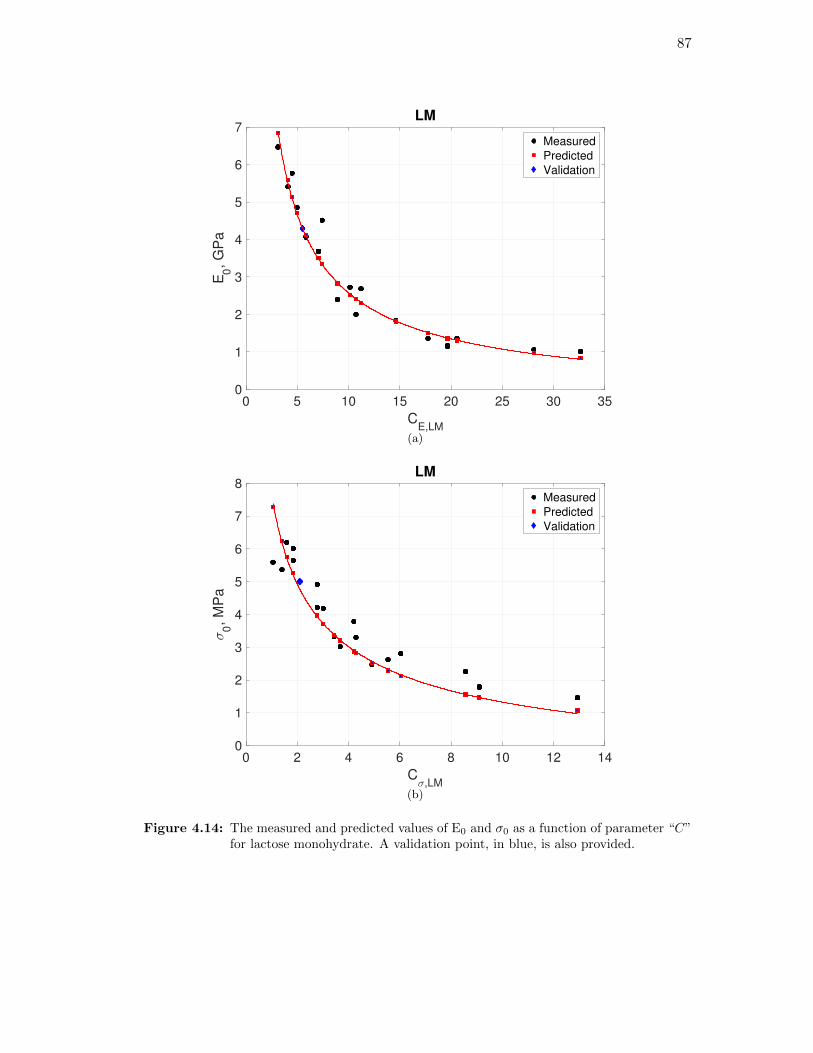
87
0 5 10 15 20 25 30 35
CE,LM
0
1
2
3
4
5
6
7
E0, G
Pa
LM
Measured
Predicted
Validation
(a)
0 2 4 6 8 10 12 14
Cσ,LM
0
1
2
3
4
5
6
7
8
σ0, M
Pa
LM
Measured
Predicted
Validation
(b)
Figure 4.14: The measured and predicted values of E0 and σ0 as a function of parameter “C”for lactose monohydrate. A validation point, in blue, is also provided.

88
4 4.5 5 5.5 6 6.5 7 7.5
CE,SDL ×10
4
5
6
7
8
9
10
11
E0, G
Pa
SDL
Measured
Predicted
Validation
(a)
0.3 0.4 0.5 0.6 0.7 0.8 0.9 1 1.1
Cσ,SDL
4.5
5
5.5
6
6.5
7
7.5
σ0, M
Pa
SDL
Measured
Predicted
Validation
(b)
Figure 4.15: The measured and predicted values of E0 and σ0 as a function of parameter “C”for spray-dried lactose. Two validation points, in blue, are provided.
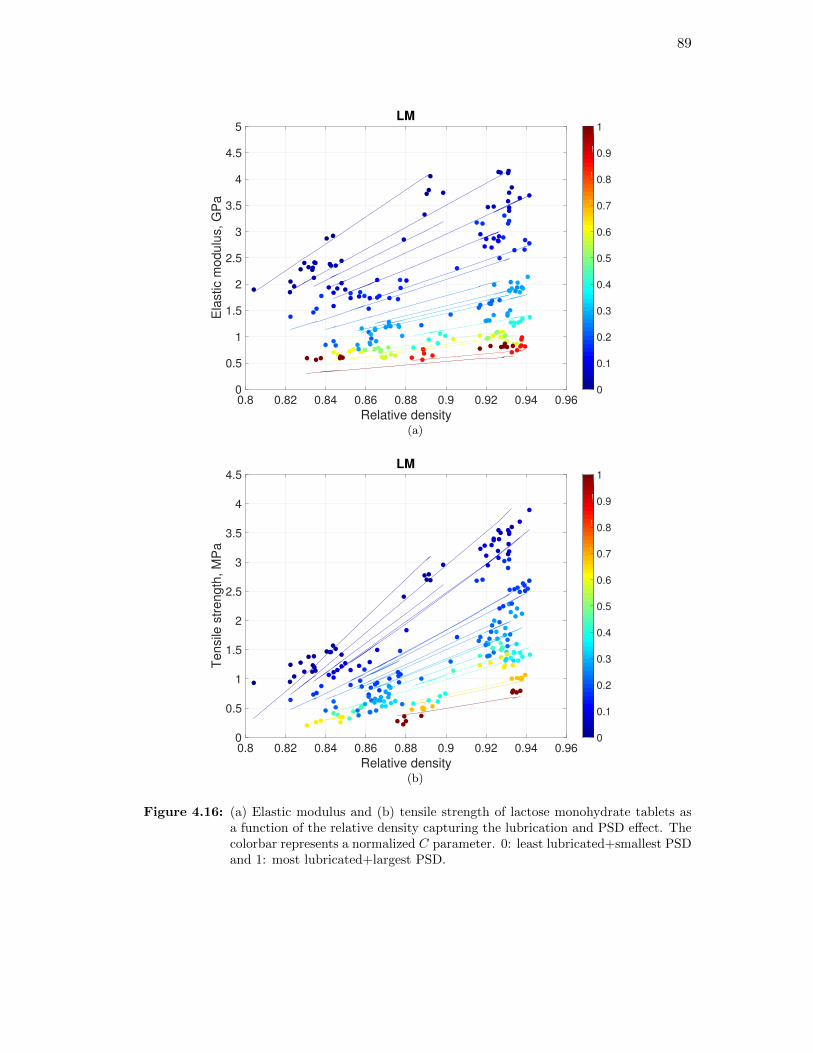
89
0.8 0.82 0.84 0.86 0.88 0.9 0.92 0.94 0.96
Relative density
0
0.5
1
1.5
2
2.5
3
3.5
4
4.5
5
Ela
stic m
od
ulu
s,
GP
a
LM
0
0.1
0.2
0.3
0.4
0.5
0.6
0.7
0.8
0.9
1
(a)
0.8 0.82 0.84 0.86 0.88 0.9 0.92 0.94 0.96
Relative density
0
0.5
1
1.5
2
2.5
3
3.5
4
4.5
Te
nsile
str
en
gth
, M
Pa
LM
0
0.1
0.2
0.3
0.4
0.5
0.6
0.7
0.8
0.9
1
(b)
Figure 4.16: (a) Elastic modulus and (b) tensile strength of lactose monohydrate tablets asa function of the relative density capturing the lubrication and PSD effect. Thecolorbar represents a normalized C parameter. 0: least lubricated+smallest PSDand 1: most lubricated+largest PSD.

90
0.8 0.82 0.84 0.86 0.88 0.9 0.92 0.94 0.96
Relative density
0
1
2
3
4
5
6
7
8
9
10
Ela
stic m
od
ulu
s,
GP
a
SDL
0
0.1
0.2
0.3
0.4
0.5
0.6
0.7
0.8
0.9
1
(a)
0.8 0.82 0.84 0.86 0.88 0.9 0.92 0.94 0.96
Relative density
0
0.5
1
1.5
2
2.5
3
3.5
4
4.5
5
Te
nsile
str
en
gth
, M
Pa
SDL
0
0.1
0.2
0.3
0.4
0.5
0.6
0.7
0.8
0.9
1
(b)
Figure 4.17: (a) Elastic modulus and (b) tensile strength of spray-dried lactose tablets asa function of relative density capturing the lubrication and PSD effect. Thecolorbar represents a normalized C parameter. 0: least lubricated and 1: mostlubricated.
Figs. 4.18 and 4.19 compare the validation measurements with predicted lines for elastic
modulus and tensile strength of LM and SDL tablets, respectively (case 5 for LM and

91
cases 24 and 33 for SDL). The agreement between the validations and model predictions
are very promising.
0.8 0.82 0.84 0.86 0.88 0.9 0.92 0.94 0.96
Relative density
1
1.5
2
2.5
3
3.5
4
Ela
stic m
odulu
s, G
Pa
LM
Validation
Predicted
(a)
0.8 0.82 0.84 0.86 0.88 0.9 0.92 0.94 0.96
Relative density
0
0.5
1
1.5
2
2.5
3
3.5
4
Tensile
str
ength
, M
Pa
LM
Validation
Predicted
(b)
Figure 4.18: Comparsion of the validation experiments to the model prediction for (a) elasticmodulus and (b) tensile strength of lactose monohydrate tablets as a function ofrelative density (case 5 in Table 4.1).
0.8 0.82 0.84 0.86 0.88 0.9 0.92 0.94 0.96
Relative density
0
1
2
3
4
5
6
7
Ela
stic m
odulu
s, G
Pa
SDL
Validation
Predicted
Validation
Predicted
(a)
0.8 0.82 0.84 0.86 0.88 0.9 0.92 0.94 0.96
Relative density
0
0.5
1
1.5
2
2.5
3
3.5
4
4.5
5
Tensile
str
ength
, M
Pa
SDL
Validation
Predicted
Validation
Predicted
(b)
Figure 4.19: Comparsion of the validation experiments to the model predictions for (a) elasticmodulus and (b) tensile strength of spray-dried lactose tablets as a function ofrelative density (cases 24 and 33 in Table 4.1).
Figs. 4.20(a) and 4.20(b) show the relationship between actual (measured) and predicted
elastic modulus and tensile strength for all the LM and SDL tablets. Good correlations
were observed between the predicted and actual values. For elastic modulus predictions,
R2 of 0.94 for both powders was found and for tensile strength predictions R2 was 0.96
and 0.91 for SDL and LM, respectively.

92
Therefore, our proposed model can be successfully adopted to predict the mechanical
strength of tablets capturing the lubricant sensitivity and PSD effects.
0 2 4 6 8 10
Actual elastic modulus, GPa
0
1
2
3
4
5
6
7
8
9
10
Pre
dic
ted
ela
stic m
od
ulu
s,
GP
a
spray-dried lactose
lactose monohydrate
y = 0.9952x
R2 = 0.9379
y = 0.9861x
R2 = 0.9385
(a)
0 1 2 3 4 5
Actual tensile strength, MPa
0
0.5
1
1.5
2
2.5
3
3.5
4
4.5
5
Pre
dic
ted
te
nsile
str
en
gth
, M
Pa
spray-dried lactose
lactose monohydrate
y = 0.9782x
R2 = 0.9117
y = 0.9964x
R2 = 0.964
(b)
Figure 4.20: Predicted vs. actual values of (a) elastic modulus, where the R2 was 0.94 for bothpowders and (b) tensile strength, where R2 was 0.96 and 0.91 for spray-driedlactose and lactose monohydrate, respectively.

93
4.4 Summary and Conclusion
We have proposed a general framework for predicting a wide range of elastic modulus
and tensile strength that a specific powder can attain based on its lubricant sensitivity
and considering different particle size distributions. This was possible by introducing
a new parameter in the existing tensile strength and elastic modulus models of porous
materials. The model showed a good predictability for two grades of lactose. Our model
can be extended to all the powders that undergo different deformation mechanisms and
explored for ternary or more complex mixtures.
Figure 4.21: Elastic modulus and tensile strength regime for lactose monohydrate and spray-dried lactose tablets. Relative density of tablets ranged from 0.8 to 0.94.
We have covered a wide, if not the widest, strength level of lactose monohydrate and
spray-dried lactose tablets with respect to particle size distributions and lubrication
conditions. Fig. 4.21 depicts the measured tensile strength vs. elastic modulus of
all the lactose monohydrate and spray-dried lactose tablets. The data points show a
pattern, which can be identified by zones. An elliptic zone for LM and a trapezoidal zone
for SPD are sketched. These zones provide an “accessible” regime, which is ideal for

94
design strategies. For a certain formulation, creating such a zone will help to optimize
the processing variables for the desirable mechanical properties of tablets and to keep
away from the boundaries.
As a validation of the proposed strategy in the previous chapter, we plotted σ0 vs. E0
(Fig. 4.22). The correlation is still clear with more number of observations and it seems
to follow a nonlinear behavior.
0 2 4 6 8 10 12
E0, GPa
1
2
3
4
5
6
7
8
σ0,
MP
a
SDL
LM
Figure 4.22: E0 and σ0 relationship for lactose monohydrate and spray-dried lactose tablets.
95
Chapter 5
Conclusions and Recommendations
5.1 Remarks
In Chapter 2, we proposed a general framework for determining optimal relationships
for tensile strength from the breaking force of doubly convex tablets under diametrical
compression. The approach is based on the observation that tensile strength is directly
proportional to the breaking force and inversely proportional to Q, a nonlinear function
of geometric parameters and materials properties.
We have proposed three new optimal tensile strength relationships, which we referred
to as general model, 2-parameter model and mechanistic model. The general model
captures the leading order behavior of Q on the geometric parameters, it has the exact
limiting behavior for flat faced tablets, and it has four optimal parameters to be de-
termined. The 2-parameter model simplifies the general model by assuming that Q is
linear on the geometric parameters, and thus the number of parameters is reduced to
two while the correct limiting behavior is retained. The mechanistic model is based on
an effective cross-sectional surface area associated with strength and exhibits the exact
limiting behavior for flat geometries with only two optimal parameters.
We provided a set of recommendations on how to compare the models based on their
number of parameters, stability, predictability, and having the correct limiting be-
havior. Our observations suggest that both general and mechanistic models are cost-
and time-effective, predictive alternatives to the tensile strength relationship currently
used in the pharmaceutical industry. Furthermore, our analysis showcases the bene-
fits of adopting a general framework for developing and evaluating the performance of
optimal relationships for tensile strength of doubly convex tablets under diametrical
compression.

96
Chapter 3 demonstrated that ultrasound (US) measurement system can be successfully
used to attain information about the mechanical integrity of pharmaceutical tablets.
The effect of two processing parameters, compaction force and level of shear strain
were examined. US speed of sound was found to be sensitive to the relative density
and the level of shear strain. US testing could detect even small differences between
tablets that a hardness tester failed to do so. This is an added advantage of using
this technique to monitor mechanical properties, because a slight change could have a
significant consequence on dissolution.
A strategy for hardness prediction was proposed that uses the existing models for
elastic modulus and tensile strength of porous materials. A clear correlation between
elastic modulus and tensile strength at zero porosity was presented. Thus, US testing
was found to be a good candidate to be placed on/at-line to measure the mechani-
cal integrity of tablets non-destructively. These results provide information about the
behavior of processing parameters on the performance of tablets and the ability to engi-
neer product properties. The extension of this work was continued in Chapter 4, where
a general methodology was proposed for predicting a wide range of elastic modulus and
tensile strength that a specific powder can attain based on its lubricant sensitivity and
considering different particle size distributions. This was possible by introducing a new
parameter in the existing tensile strength and elastic modulus models of porous mate-
rials. The empirical model showed a good predictability for two grades of lactose. Our
model can be extended to all the powders that undergo different deformation mecha-
nisms and explored for ternary or more complex mixtures. This quantitative strategy
will enable formulators to better understand the formulation compaction behavior and
select optimal processing parameters.
5.2 Future Work
Based on the work presented in this dissertation, several potential areas are discussed
here for future study.
1. Chapters 3 and 4 demonstrated the efficacy of ultrasound measuring system to
97
analyze the mechanical integrity of tablets in a fast and non-destructive fashion.
As a future plan, building a tablet testing toolbox is pursued, which consists
of weight, hardness using ultrasound, thickness, diameter or length, chemical
composition using NIR or Raman testing stations. This toolbox will ensure quick,
automated, non-destructive testing to ensure all the critical quality attributes are
measured for individual tablets.
2. To cut the amount of experimental work needed to characterize every new phar-
maceutical formulation, it is necessary to study the effect of material properties
on the tablet press performance. Thus, a general methodoloy for hardness model
needs to be developed considering material properties and tablet press variables.
3. In this dissertation we have only tested flat faced cylindrical tablets for ultrasound
testing. It would be of interest to study the stiffness of doubly convex tablets
and investigate if the framework presented in Chapter 2 can be applied for the
ultrasound measurements.
4. The particle size effect on lubrication sensitivity of an excipient was explored in
Chapter 4. The model can be extended and generalized for pharmaceutical for-
mulations taking into account other powder properties (e.g., bulk density) and/or
processing parameters (e.g., compaction speed). We can also use the Quette
shearing device to impart uniform shear to the powders and replace the mixing
time in the model to shear rate and mechanical strain.
5. In Chapter 4, we briefly presented the possible particle size effect and lubrication
sensitivity of powders on compaction profiles. More rigorous studies on the final
stage of the unloading curves are favorable, which is thought to have a good
correlation with tablet strength and are areas worthy of further investigation.
98
Acknowledgement of Previous Publications
Portion of this thesis is based on previously published work of the student. Publications
in support of this thesis have been summarized below.
Publications in support of this thesis
1. Razavi, S. M., Gonzalez, M., & Cuitino, A. M. (2015). General and mecha-
nistic optimal relationships for tensile strength of doubly convex tablets under
diametrical compression. International journal of pharmaceutics, 484(1), 29-37.
2. Razavi, S. M., Callegari, G., Drazer, G., & Cuitino, A. M. (2016). Toward
predicting tensile strength of pharmaceutical tablets by ultrasound measurement
in continuous manufacturing. International journal of pharmaceutics, 507(1), 83-
89.

99
References
[1] A. Devay. The theory and practice of pharmaceutical technology. University ofPecs, Pecs, 2013.
[2] C. Shang, I. C. Sinka, B. Jayaraman, and J. Pan. Break force and tensile strengthrelationships for curved faced tablets subject to diametrical compression. Inter-national journal of pharmaceutics, 442(1):57–64, 2013.
[3] NDT Olympus. Ultrasonic transducers technical notes. Accessed on March, 2006.
[4] P. Pawar, Y. Wang, G. Keyvan, G. Callegari, A. Cuitino, and F. J. Muzzio.Enabling real time release testing by nir prediction of dissolution of tablets madeby continuous direct compression (cdc). International Journal of Pharmaceutics,512(1):96–107, 2016.
[5] M. Kuentz and H. Leuenberger. A new model for the hardness of a compactedparticle system, applied to tablets of pharmaceutical polymers. Powder technol-ogy, 111(1):145–153, 2000.
[6] F. J. Muzzio, T. Shinbrot, and B. J. Glasser. Powder technology in the phar-maceutical industry: the need to catch up fast. Powder technology, 124(1):1–7,2002.
[7] M. H. Rubinstein and M. E. Aulton. Pharmaceutics, the science of dosage formdesign. Edinburgh London Melbourne and New York: Churchill Livingstone, 2000.
[8] M. K. Kottke and E. M. Rudnic. Tablet dosage forms. Modern pharmaceutics, 4:291–333, 2002.
[9] R. F. Shangraw and D. A. Demarest. A survey of current industrial practices inthe formulation and manufacture of tablets and capsules. Pharmaceutical tech-nology, 17(1):32–32, 1993.
[10] C. Nystrom, G. Alderborn, M. Duberg, and P. Karehill. Bonding surface areaand bonding mechanism-two important factors fir the understanding of powdercomparability. Drug development and industrial pharmacy, 19(17-18):2143–2196,1993.
[11] M. Duberg and C. Nystrom. Studies on direct compression of tablets xvii. poros-itypressure curves for the characterization of volume reduction mechanisms inpowder compression. Powder Technology, 46(1):67–75, 1986.
[12] D. Train. An investigation into the compaction of powders. Journal of Pharmacyand Pharmacology, 8(1):745–761, 1956.

100
[13] C. Fuhrer. Substance behaviour in direct compression. Labo-Pharma Probi.Techn, 25:759–762, 1977.
[14] G. Alderborn and C. Nystrom. Pharmaceutical powder compaction technology.Drugs and the pharmaceutical sciences, 71:71–71, 1996.
[15] R. J. Roberts, R. C. Rowe, and K. Kendall. Brittleductile trasitions in die com-paction of sodium chloride. Chemical engineering science, 44(8):1647–1651, 1989.
[16] N. Rasenack and B. W. Muller. Crystal habit and tableting behavior. Interna-tional journal of pharmaceutics, 244(1):45–57, 2002.
[17] R. J. Roberts and R. C. Rowe. The effect of punch velocity on the compactionof a variety of materials. Journal of pharmacy and pharmacology, 37(6):377–384,1985.
[18] R. Ishino, H. Yoshino, Y. Hirakawa, and K. Noda. Influence of tabletting speedon compactibility and compressibility of two direct compressible powders underhigh speed compression. RN, 38(7), 1990.
[19] B. Van Veen, K. Van der Voort Maarschalk, G. K. Bolhuis, K. Zuurman, andH. W. Frijlink. Tensile strength of tablets containing two materials with a differ-ent compaction behaviour. International journal of pharmaceutics, 203(1):71–79,2000.
[20] P. M. C. Lacey. Developments in the theory of particle mixing. Journal of appliedchemistry, 4(5):257–268, 1954.
[21] J. Bridgwater. Fundamental powder mixing mechanisms. Powder Technology, 15(2):215–236, 1976.
[22] L. T. Fan, Y. Chen, and F. S. Lai. Recent developments in solids mixing. PowderTechnology, 61(3):255–287, 1990.
[23] T. Elperin and A. Vikhansky. Granular flow in a rotating cylindrical drum. EPL(Europhysics Letters), 42(6):619, 1998.
[24] D. Brone, A. Alexander, and F. J. Muzzio. Quantitative characterization ofmixing of dry powders in v-blenders. AIChE Journal, 44(2):271–278, 1998.
[25] A. Alexander, T. Shinbrot, B. Johnson, and F. J. Muzzio. V-blender segrega-tion patterns for free-flowing materials: effects of blender capacity and fill level.International journal of pharmaceutics, 269(1):19–28, 2004.
[26] M. Lemieux, F. Bertrand, J. Chaouki, and P. Gosselin. Comparative study ofthe mixing of free-flowing particles in a v-blender and a bin-blender. ChemicalEngineering Science, 62(6):1783–1802, 2007.
[27] Resonant Acoustic Mixer. Resonant acoustic® mixing. URI:http://www.resodynmixers.com/wp-content/uploads/2009/05/ram-technical-white-paper1.pdf, 2009.
[28] J. G. Osorio and F. J. Muzzio. Evaluation of resonant acoustic mixing perfor-mance. Powder Technology, 2015.

101
[29] Juan G Osorio, Koushik Sowrirajan, and Fernando J Muzzio. Effect of resonantacoustic mixing on pharmaceutical powder blends and tablets. Advanced PowderTechnology, 27(4):1141–1148, 2016.
[30] C. F. Harwood, K. Walanski, E. Luebcke, and C. Swanstrom. The performanceof continuous mixers for dry powders. Powder Technology, 11(3):289–296, 1975.
[31] R. Weinekotter and L. Reh. Continuous mixing of fine particles. Particle &particle systems characterization, 12(1):46–53, 1995.
[32] L. Pernenkil and C. L. Cooney. A review on the continuous blending of powders.Chemical Engineering Science, 61(2):720–742, 2006.
[33] S. Oka, A. Sahay, W. Meng, and F. J Muzzio. Diminished segregation in contin-uous powder mixing. Powder Technology, 309:79–88, 2017.
[34] M. Saravanan, K. S. Nataraj, and K. S. Ganesh. The effect of tablet formulationand hardness on in vitro release of cephalexin from eudragit l100 based extendedrelease tablets. Biological and Pharmaceutical Bulletin, 25(4):541–545, 2002.
[35] USP. The United States Pharmacopeia. 34th ed. US Pharmacopeial Convention,Rockville, Maryland, 2011.
[36] J. T. Fell and J. M. Newton. Determination of tablet strength by the diametral-compression test. Journal of Pharmaceutical Sciences, 59(5):688–691, 1970.
[37] P. Stanley. Mechanical strength testing of compacted powders. Internationaljournal of pharmaceutics, 227(1):27–38, 2001.
[38] F. Podczeck. Methods for the practical determination of the mechanical strengthof tabletsaıfrom empiricism to science. International journal of pharmaceutics,436(1):214–232, 2012.
[39] C. Nystrom, W. Alex, and K. Malmqvist. A new approach to tensile strengthmeasurement of tablets. Acta Pharmaceutica Suecica, 14(3):317, 1977.
[40] F. Carneiro and A. Barcellos. Tensile strength of concrete. Rilem Bulletin, 13:97–123, 1953.
[41] H. R. Hertz. Gesammelte werke, band iii: Die prinzipien der mechanik in neuemzusammenhange dargestellt. Barth, Leipzig, 1894.
[42] K. Ridgway, C. Lazarou, and E. E. Thorpe. The properties of tablets manufac-tured on an automatically-controlled rotary machine. Journal of Pharmacy andPharmacology, 24(4):265–271, 1972.
[43] A. McKenna and D. F. McCafferty. Effect of particle size on the compaction mech-anism and tensile strength of tablets. Journal of Pharmacy and Pharmacology,34(6):347–351, 1982.
[44] C. K. Tye, C. C. Sun, and G. E. Amidon. Evaluation of the effects of tabletingspeed on the relationships between compaction pressure, tablet tensile strength,and tablet solid fraction. Journal of pharmaceutical sciences, 94(3):465–472, 2005.
102
[45] S. P. Timoshenko and J. N. Goodier. Theory of Elasticity. Mcgraw-hill, NewYork, 1970.
[46] M. M. Frocht. Vol. ii. Wiley, New York, 1:948, 1948.
[47] J. T. Fell and J. M. Newton. The tensile strength of lactose tablets. Journal ofPharmacy and Pharmacology, 20(8):657–659, 1968.
[48] A. T. Procopio, A. Zavaliangos, and J. C. Cunningham. Analysis of the diamet-rical compression test and the applicability to plastically deforming materials.Journal of Materials Science, 38(17):3629–3639, 2003.
[49] E. Ryshkewitch. Compression strength of porous sintered alumina and zirconia.Journal of the American Ceramic Society, 36, 1953.
[50] I. Haririan and M. Newton. Tensile strength of circular flat and convex-facedavicel ph102 tablets. DARU Journal of Pharmaceutical Sciences, 7(3):36–40,1999.
[51] I. C. Sinka, F. Motazedian, A. C. F. Cocks, and K. G. Pitt. The effect of processingparameters on pharmaceutical tablet properties. Powder Technology, 189(2):276–284, 2009.
[52] K. G. Pitt, J. M. Newton, and P. Stanley. Stress distributions in doubly convexcylindrical discs under diametral loading. Journal of Physics D: Applied Physics,22(8):1114, 1989.
[53] K. G. Pitt, J. M. Newton, and P. Stanley. Tensile fracture of doubly-convexcylindrical discs under diametral loading. Journal of materials science, 23(8):2723–2728, 1988.
[54] K. G. Pitt and M. G. Heasley. Determination of the tensile strength of elongatedtablets. Powder Technology, 238:169–175, 2013.
[55] C. Shang, I. C. Sinka, and J. Pan. Modelling of the break force of tablets underdiametrical compression. International journal of pharmaceutics, 445(1):99–107,2013.
[56] F. Podczeck, K. R. Drake, and J. M. Newton. Investigations into the tensilefailure of doubly-convex cylindrical tablets under diametral loading using finiteelement methodology. International journal of pharmaceutics, 454(1):412–424,2013.
[57] T. Tang. Effects of load-distributed width on split tension on unnotched andnotched cylindrical specimens. Journal of testing and Evaluation, 22(5):401–409,1994.
[58] G. Hondros. The evaluation of poissonaos ratio and the modulus of materialsof a low tensile resistance by the brazilian (indirect tensile) test with particularreference to concrete. Australian Journal of Applied Science, 10(3):243–268, 1959.

103
[59] S. K. Kourkoulis, C. F. Markides, and P. E. Chatzistergos. The brazilian discunder parabolically varying load: theoretical and experimental study of the dis-placement field. International Journal of Solids and Structures, 49(7):959–972,2012.
[60] Q. Z. Wang, X. M. Jia, S. Q. Kou, Z. X. Zhang, and P. A. Lindqvist. The flattenedbrazilian disc specimen used for testing elastic modulus, tensile strength andfracture toughness of brittle rocks: analytical and numerical results. InternationalJournal of Rock Mechanics and Mining Sciences, 41(2):245–253, 2004.
[61] C. Bagault, D. Nelias, M. Baietto, and T. C. Ovaert. Contact analyses foranisotropic half-space coated with an anisotropic layer: Effect of the anisotropyon the pressure distribution and contact area. International Journal of Solids andStructures, 50(5):743–754, 2013.
[62] R. Iyer, S. Hegde, Y. Zhang, J. Dinunzio, D. Singhal, A. Malick, and G. Amidon.The impact of hot melt extrusion and spray drying on mechanical properties andtableting indices of materials used in pharmaceutical development. Journal ofpharmaceutical sciences, 102(10):3604–3613, 2013.
[63] J. W. Kennerley, J. M. Newton, and P. Stanley. A modified weibull treatment forthe analysis of strength-test data from non-identical brittle specimens. Journalof Materials Science, 17(10):2947–2954, 1982.
[64] MATLAB. Release 2012b. The MathWorks Inc., Natick, Massachusetts, 2012.
[65] M. Gonzalez and A. M. Cuitino. A nonlocal contact formulation for confinedgranular systems. Journal of the Mechanics and Physics of Solids, 60(2):333–350,2012.
[66] M. Gonzalez and A. M. Cuitino. Microstructure evolution of compressible gran-ular systems under large deformations. Journal of the Mechanics and Physics ofSolids, 93:44–56, 2016.
[67] B. Yohannes, M. Gonzalez, A. Abebe, O. Sprockel, F. Nikfar, S. Kiang, and A. M.Cuitino. Evolution of the microstructure during the process of consolidation andbonding in soft granular solids. International journal of pharmaceutics, 503(1):68–77, 2016.
[68] S. L. Lee, T. F. OConnor, X. Yang, C. N. Cruz, S. Chatterjee, R. D. Madurawe,C. M. V. Moore, X. Y. Lawrence, and J. Woodcock. Modernizing pharmaceuticalmanufacturing: from batch to continuous production. Journal of PharmaceuticalInnovation, 10(3):191–199, 2015.
[69] S. Chatterjee. FDA perspective on continuous manufacturing. In IFPAC AnnualMeeting, Baltimore, Baltimore, 2012.
[70] S. Byrn, M. Futran, H. Thomas, E. Jayjock, N. Maron, R. F. Meyer, A. S.Myerson, M. P. Thien, and B. L. Trout. Achieving continuous manufacturingfor final dosage formation: Challenges and how to meet them. may 20–21, 2014continuous manufacturing symposium. Journal of pharmaceutical sciences, 104(3):792–802, 2015.

104
[71] FDA. Guidance for industry: Pat-a framework for innovative pharmaceuticaldevelopment, manufacturing, and quality assurance. DHHS, Rockville, MD, 2004.
[72] FDA. Guidance for industry: Q8(r2). Pharmaceutical Development, 2009.
[73] L. Yu. Pharmaceutical quality by design: product and process development,understanding, and control. Pharmaceutical research, 25(4):781–791, 2008.
[74] ICH Harmonised Tripartite Guideline. Pharmaceutical development q8 (r2). Cur-rent step, 4, 2009.
[75] Yu L. Continuous manufacturing has a strong impact on drugquality. URI: https://blogs.fda.gov/fdavoice/index.php/2016/04/continuous-manufacturing- has-a-strong-impact-on-drug-quality, 2016.
[76] J. D. Kirsch and J. K. Drennen. Near-infrared spectroscopy: applications in theanalysis of tablets and solid pharmaceutical dosage forms. Applied SpectroscopyReviews, 30(3):139–174, 1995.
[77] H. Ma and C. A. Anderson. Characterization of pharmaceutical powder blendsby nir chemical imaging. Journal of pharmaceutical sciences, 97(8):3305–3320,2008.
[78] T. Vankeirsbilck, A. Vercauteren, W. Baeyens, G. Van der Weken, F. Verpoort,G. Vergote, and J. P. Remon. Applications of raman spectroscopy in pharmaceu-tical analysis. TrAC trends in analytical chemistry, 21(12):869–877, 2002.
[79] J. Ketolainen, M. Oksanen, J. Rantala, J. Stor-Pellinen, M. Luukkala, andP. Paronen. Photoacoustic evaluation of elasticity and integrity of pharmaceuticaltablets. International journal of pharmaceutics, 125(1):45–53, 1995.
[80] I. Akseli, B. C. Hancock, and C. Cetinkaya. Non-destructive determination ofanisotropic mechanical properties of pharmaceutical solid dosage forms. Interna-tional journal of pharmaceutics, 377(1):35–44, 2009.
[81] R. P. Cogdill, R. N. Forcht, Y. Shen, P. F. Taday, J. R. Creekmore, C. A. Ander-son, and J. K. Drennen. Comparison of terahertz pulse imaging and near-infraredspectroscopy for rapid, non-destructive analysis of tablet coating thickness anduniformity. Journal of Pharmaceutical Innovation, 2(1):29–36, 2007.
[82] Y. C. Shen. Terahertz pulsed spectroscopy and imaging for pharmaceutical ap-plications: a review. International journal of pharmaceutics, 417(1):48–60, 2011.
[83] R. K. May, K. Su, L. Han, S. Zhong, J. A Elliott, L. F. Gladden, M. Evans,Y. Shen, and J. A. Zeitler. Hardness and density distributions of pharmaceuticaltablets measured by terahertz pulsed imaging. Journal of pharmaceutical sciences,102(7):2179–2186, 2013.
[84] J. T. T. Leskinen, S. P. Simonaho, M. Hakulinen, and J. Ketolainen. In-line ul-trasound measurement system for detecting tablet integrity. International journalof pharmaceutics, 400(1):104–113, 2010.

105
[85] S. P. Simonaho, T A. Takala, M. Kuosmanen, and J. Ketolainen. Ultrasoundtransmission measurements for tensile strength evaluation of tablets. Interna-tional journal of pharmaceutics, 409(1):104–110, 2011.
[86] F. P. Capote and M. D. L. de Castro. Analytical applications of ultrasound,volume 26. Elsevier, 2007.
[87] B. Raj, V. Rajendran, and P. Palanichamy. Science and technology of ultrasonics.Alpha Science Int’l Ltd., 2004.
[88] B. A. Auld. Acoustic fields and waves in solids, volume 1. 1973.
[89] I. Akseli and C. Cetinkaya. Air-coupled non-contact mechanical property deter-mination of drug tablets. International journal of pharmaceutics, 359(1):25–34,2008.
[90] I. Akseli, N. Ladyzhynsky, J. Katz, and X. He. Development of predictive tools toassess capping tendency of tablet formulations. Powder technology, 236:139–148,2013.
[91] I. Akseli, A. Stecu la, X. He, and N. Ladyzhynsky. Quantitative correlation ofthe effect of process conditions on the capping tendencies of tablet formulations.Journal of pharmaceutical sciences, 103(6):1652–1663, 2014.
[92] M. A. Hakulinen, J. Pajander, J. Leskinen, J. Ketolainen, B. Van Veen, K. Ni-inimaki, K. Pirskanen, A. Poso, and R. Lappalainen. Ultrasound transmissiontechnique as a potential tool for physical evaluation of monolithic matrix tablets.AAPS PharmSciTech, 9(1):267–273, 2008.
[93] I. Akseli, S. Iyer, H. P. Lee, and A. M. Cuitino. A quantitative correlation of theeffect of density distributions in roller-compacted ribbons on the mechanical prop-erties of tablets using ultrasonics and x-ray tomography. AAPS PharmSciTech,12(3):834–853, 2011.
[94] I. Akseli, C. Libordi, and C. Cetinkaya. Real-time acoustic elastic property mon-itoring of compacts during compaction. Journal of Pharmaceutical Innovation, 3(2):134–140, 2008.
[95] J. T. T. Leskinen, S. P. Simonaho, M. Hakulinen, and J. Ketolainen. Real-timetablet formation monitoring with ultrasound measurements in eccentric singlestation tablet press. International journal of pharmaceutics, 442(1):27–34, 2013.
[96] J. Liu, J. D. Stephens, B. R. Kowalczyk, and C. Cetinkaya. Real-time in-die com-paction monitoring of dry-coated tablets. International journal of pharmaceutics,414(1):171–178, 2011.
[97] J. D. Stephens, B. R. Kowalczyk, B. C. Hancock, G. Kaul, and C. Cetinkaya.Ultrasonic real-time in-die monitoring of the tablet compaction process. a proofof concept study. International journal of pharmaceutics, 442(1):20–26, 2013.
[98] W. M. Long. Radial pressures in powder compaction*. Powder Metallurgy, 3(6):73–86, 1960.

106
[99] K. V. D. V. Maarschalk, H. Vromans, G. K. Bolhuis, and C. F. Lerk. Influence ofplasticizers on tableting properties of polymers. Drug development and industrialpharmacy, 24(3):261–268, 1998.
[100] I. Akseli, J. Xie, L. Schultz, N. Ladyzhynsky, T. Bramante, X. He, R. Deanne,K. R. Horspool, and R. Schwabe. A practical framework toward prediction ofbreaking force and disintegration of tablet formulations using machine learningtools. Journal of Pharmaceutical Sciences, 106(1):234–247, 2017.
[101] R. Singh, A. Sahay, F. J. Muzzio, M. Ierapetritou, and R. Ramachandran. Asystematic framework for onsite design and implementation of a control system ina continuous tablet manufacturing process. Computers & Chemical Engineering,66:186–200, 2014.
[102] A. U. Vanarase and F. J. Muzzio. Effect of operating conditions and designparameters in a continuous powder mixer. Powder Technology, 208(1):26–36,2011.
[103] A. Mehrotra, M. Llusa, A.l Faqih, M. Levin, and F. J. Muzzio. Influence of shearintensity and total shear on properties of blends and tablets of lactose and celluloselubricated with magnesium stearate. International journal of pharmaceutics, 336(2):284–291, 2007.
[104] K. Pingali, R. Mendez, D. Lewis, B. Michniak-Kohn, A. Cuitino, and F. J. Muzzio.Mixing order of glidant and lubricant–influence on powder and tablet properties.International journal of pharmaceutics, 409(1):269–277, 2011.
[105] K. K. Phani and S. K. Niyogi. Young’s modulus of porous brittle solids. Journalof materials science, 22(1):257–263, 1987.
[106] F. Bassam, P York, R. C. Rowe, and R. J. Roberts. Young’s modulus of powdersused as pharmaceutical excipients. International journal of pharmaceutics, 64(1):55–60, 1990.
[107] S. Spinner, F. P. Knudson, and L. Stone. Elastic Constant-Porosity Relation forPolycrystalline Thoria. Defense Technical Information Center, 1964.
[108] R. C. Rossi. Prediction of the elastic moduli of composites. Journal of theAmerican Ceramic Society, 51(8):433–440, 1968.
[109] F. P. Knudsen. Dependence of mechanical strength of brittle polycrystalline spec-imens on porosity and grain size. Journal of the American Ceramic Society, 42(8):376–387, 1959.
[110] S. M. Razavi, M. Gonzalez, and A. M. Cuitino. General and mechanistic opti-mal relationships for tensile strength of doubly convex tablets under diametricalcompression. International Journal of Pharmaceutics, 2015.
[111] MATLAB. version 8.4.0 (R2014b). The MathWorks Inc., Natick, Massachusetts,2014.
[112] L. Lachman, H. A. Lieberman, J. L. Kanig, et al. The theory and practice ofindustrial pharmacy. Lea & Febiger Philadelphia, 1976.

107
[113] G. Moody, M. H. Rubinstein, and R. A. FitzSimmons. Tablet lubricants I. theoryand modes of action. International Journal of Pharmaceutics, 9(2):75–80, 1981.
[114] Y. Hirai and J. Okada. Effect of lubricant on die wall friction during the com-paction of pharmaceutical powders. Chemical and Pharmaceutical Bulletin, 30(2):684–694, 1982.
[115] R. Dansereau and G. E. Peck. The effect of the variability in the physicaland chemical properties of magnesium stearate on the properties of compressedtablets. Drug Development and Industrial Pharmacy, 13(6):975–999, 1987.
[116] T. A. Miller and P. York. Pharmaceutical tablet lubrication. International journalof pharmaceutics, 41(1-2):1–19, 1988.
[117] P. J. Sheskey, R. T. Robb, R. D. Moore, and B. M. Boyce. Effects of lubricantlevel, method of mixing, and duration of mixing on a controlled-release matrixtablet containing hydroxypropyl methylcellulose. Drug development and indus-trial pharmacy, 21(19):2151–2165, 1995.
[118] F. Podczeck and Y. Mia. The influence of particle size and shape on the angleof internal friction and the flow factor of unlubricated and lubricated powders.International Journal of Pharmaceutics, 144(2):187–194, 1996.
[119] A. M. N. Faqih, A. Mehrotra, S. V. Hammond, and F. J. Muzzio. Effect ofmoisture and magnesium stearate concentration on flow properties of cohesivegranular materials. International journal of pharmaceutics, 336(2):338–345, 2007.
[120] N. O. Lindberg. Evaluation of some tablet lubricants. Acta Pharmaceutica Sue-cica, 9(3):207–214, 1972.
[121] M. E. Johansson. Granular magnesium stearate as a lubricant in tablet formula-tions. International journal of pharmaceutics, 21(3):307–315, 1984.
[122] J. Wang, H. Wen, and D. Desai. Lubrication in tablet formulations. EuropeanJournal of Pharmaceutics and Biopharmaceutics, 75(1):1–15, 2010.
[123] G. K. Bolhuis, C. F. Lerk, H. T. Zijlstra, and A. H. De Boer. Film formation bymagnesium stearate during mixing and its effect on tabletting. Pharm. Weekbl,110:317–325, 1975.
[124] A. H. De Boer, G. K. Bolhuis, and C. F. Lerk. Bonding characteristics by scan-ning electron microscopy of powders mixed with magnesium stearate. PowderTechnology, 20(1):75–82, 1978.
[125] M. S. H. Hussain, P. York, P. Timmins, and P. Humphrey. Secondary ion massspectrometry (sims) evaluation of magnesium stearate distribution and its effectson the physico-technical properties of sodium chloride tablets. Powder Technology,60(1):39–45, 1990.
[126] A. F. Asker, K. M. Saied, and M. M. Abdel-Khalek. Investigation of some mate-rials as dry binders for direct compression in tablet manufacture. part 5: Effectsof lubricants and flow conditions. Die Pharmazie, 30(6):378–382, 1975.

108
[127] A. C. Shah and A. R. Mlodozeniec. Mechanism of surface lubrication: Influenceof duration of lubricant-excipient mixing on processing characteristics of powdersand properties of compressed tablets. Journal of pharmaceutical sciences, 66(10):1377–1382, 1977.
[128] J. Bossert and A. Stains. Effect of mixing on the lubrication of crystalline lactoseby magnesium stearate. Drug Development and Industrial Pharmacy, 6(6):573–589, 1980.
[129] M. Otsuka, J. I. Gao, and Y. Matsuda. Effects of mixer and mixing time onthe pharmaceutical properties of theophylline tablets containing various kinds oflactose as diluents. Drug development and industrial pharmacy, 19(3):333–348,1993.
[130] J. I. Kikuta and N. Kitamori. Effect of mixing time on the lubricating propertiesof magnesium stearate and the final characteristics of the compressed tablets.Drug development and industrial pharmacy, 20(3):343–355, 1994.
[131] M. Otsuka, I. Yamane, and Y. Matsuda. Effects of lubricant mixing on com-pression properties of various kinds of direct compression excipients and physicalproperties of the tablets. Advanced Powder Technology, 15(4):477–493, 2004.
[132] P. J. Jarosz and E. L. Parrott. Effect of lubricants on tensile strengths of tablets.Drug Development and Industrial Pharmacy, 10(2):259–273, 1984.
[133] G. K. Bolhuis and Z. T. Chowhan. Materials for direct compaction. In Pharma-ceutical Powder ComPattion Technology, pages 419–500. CRC Press, 1995.
[134] A. Mitrevej, N. Sinchaipanid, and D. Faroongsarng. Spray-dried rice starch: com-parative evaluation of direct compression fillers. Drug development and industrialpharmacy, 22(7):587–594, 1996.
[135] E. Doelker, D. Mordier, H. Iten, and P. Humbert-Droz. Comparative tabletingproperties of sixteen microcrystalline celluloses. Drug Development and IndustrialPharmacy, 13(9-11):1847–1875, 1987.
[136] M. J. Mollan and M. Celik. The effects of lubrication on the compaction andpost-compaction properties of directly compressible maltodextrins. Internationaljournal of pharmaceutics, 144(1):1–9, 1996.
[137] K. Zuurman, K. Van der Voort Maarschalk, and G. K. Bolhuis. Effect of mag-nesium stearate on bonding and porosity expansion of tablets produced frommaterials with different consolidation properties. International journal of phar-maceutics, 179(1):107–115, 1999.
[138] M. Llusa, M. Levin, R. D. Snee, and F. J. Muzzio. Measuring the hydrophobicityof lubricated blends of pharmaceutical excipients. Powder Technology, 198(1):101–107, 2010.
[139] A. S. Narang, V. M. Rao, H. Guo, J. Lu, and D. S. Desai. Effect of force feederon tablet strength during compression. International journal of pharmaceutics,401(1):7–15, 2010.

109
[140] J. Kushner and F. Moore. Scale-up model describing the impact of lubricationon tablet tensile strength. International journal of pharmaceutics, 399(1):19–30,2010.
[141] S. Nakamura, S. Yamaguchi, Ri. Hiraide, K. Iga, T. Sakamoto, and H. Yuasa. Set-ting ideal lubricant mixing time for manufacturing tablets by evaluating powderflowability. AAPS PharmSciTech, pages 1–9, 2017.
[142] R. J. Roberts and R. C. Rowe. The effect of the relationship between punchvelocity and particle size on the compaction behaviour of materials with varyingdeformation mechanisms. Journal of pharmacy and pharmacology, 38(8):567–571,1986.
[143] A. H. De Boer, H. Vromans, C. F. Leur, G. K. Bolhuis, K. D. Kussendrager, andH. Bosch. Studies on tableting properties of lactose. Pharmacy World & Science,8(2):145–150, 1986.
[144] A. Castellanos. The relationship between attractive interparticle forces and bulkbehaviour in dry and uncharged fine powders. Advances in Physics, 54(4):263–376, 2005.
[145] A. M. Faqih, B. Chaudhuri, A. W. Alexander, C. Davies, F. J. Muzzio, and M. S.Tomassone. An experimental/computational approach for examining unconfinedcohesive powder flow. International journal of pharmaceutics, 324(2):116–127,2006.
[146] E. Shotton and D. Ganderton. The strength of compressed tablets. Journal ofPharmacy and Pharmacology, 13(S1):144T–152T, 1961.
[147] J. A. Hersey, G. Bayraktar, and E. Shotton. The effect of particle size on thestrength of sodium chloride tablets. The Journal of pharmacy and pharmacology,19:Suppl–24S, 1967.
[148] G. Ragnarsson and J. Sjogren. Force-displacement measurements in tableting.Journal of pharmacy and pharmacology, 37(3):145–150, 1985.
[149] F. N. Rhines. Seminar on pressing of metal powders. AIME Trans., 171:518–534,1947.
[150] H. Vromans, A. H. De Boer, G. K. Bolhuis, C. F. Lerk, K. D. Kussendrager, andH. Bosch. Studies on tableting properties of lactose. Pharmacy World & Science,7(5):186–193, 1985.
[151] G. Alderborn and C. Nystrom. Studies on direct compression of tablets. iv. theeffect of particle size on the mechanical strength of tablets. Acta PharmaceuticaSuecica, 19(5):381, 1982.
[152] P. R. Katikaneni, S. M. Upadrashta, C. E. Rowlings, S. H. Neau, and G. A.Hileman. Consolidation of ethylcellulose: effect of particle size, press speed, andlubricants. International journal of pharmaceutics, 117(1):13–21, 1995.

110
[153] J. G. Van der Watt. The effect of the particle size of microcrystalline cellulose ontablet properties in mixtures with magnesium stearate. International journal ofpharmaceutics, 36(1):51–54, 1987.
[154] A. Almaya and A. Aburub. Effect of particle size on compaction of materials withdifferent deformation mechanisms with and without lubricants. AAPS Pharm-SciTech, 9(2):414–418, 2008.
[155] Beckman Coulter. Ls 13 320 laser diffraction particle size analyzer: Instructionsfor use. URI: https://www. beckmancoulter. com/wsrportal/techdocs, 2011.
[156] B. Yohannes, M. Gonzalez, A. Abebe, O. Sprockel, F. Nikfar, S. Kang, andA. M. Cuitino. The role of fine particles on compaction and tensile strength ofpharmaceutical powders. Powder Technology, 274:372–378, 2015.
[157] P. Pawar, H. Joo, G. Callegari, G. Drazer, A. M. Cuitino, and F. J. Muzzio.The effect of mechanical strain on properties of lubricated tablets compacted atdifferent pressures. Powder Technology, 301:657–664, 2016.
[158] V. Velasco, A. Munoz-Ruiz, C. Monedero, and R. Jimenez-Castellanos. Force-displacement parameters of maltodextrins after the addition of lubricants. Inter-national journal of pharmaceutics, 152(1):111–120, 1997.
[159] D. P. Coffin-Beach and R. G. Hollenbeck. Determination of the energy of tabletformation during compression of selected pharmaceutical powders. Internationaljournal of pharmaceutics, 17(2-3):313–324, 1983.
[160] NA Armstrong and RF Haines-Nutt. Elastic recovery and surface area changesin compacted powder systems. The Journal of pharmacy and pharmacology, 24:Suppl–135P, 1972.
[161] S. M. Razavi, G. Callegari, G. Drazer, and A. M. Cuitino. Toward predicting ten-sile strength of pharmaceutical tablets by ultrasound measurement in continuousmanufacturing. International journal of pharmaceutics, 507(1):83–89, 2016.