Heavy duty gas turbine monitoring based on adaptive neuro ...

A Framework for Adaptive Monitoring
and Performance Management of
Component-Based Enterprise
Applications
Adrian Mos, BEng
Ph.D. Thesis
Dublin City University
Dr. John Murphy
School of Electronic Engineering
August 2004

I hereby certify that this material, which I now submit for assessment on
the programme of study leading to the award of Ph.D. is entirely my own
work and has not been taken from the work of others save and to the
extent that such work has been cited and acknowledged within the text of
my work.
Signed:
(Candidate) ID No.: / 6 *
Date: ^ i ° » Ï
II

Abstract
Most large-scale enterprise applications are currently built using
component-based middleware platforms such as J2EE or .NET. Developers
leverage enterprise services provided by such platforms to speed up
development and increase the robustness of their applications. In addition,
using a component-oriented development model brings benefits such as
increased reusability and flexibility in integrating with third-party systems.
In order to provide the required services, the application servers
implementing the corresponding middleware specifications employ a
complex run-time infrastructure that integrates with developer-written
business logic. The resulting complexity of the execution environment in
such systems makes it difficult for architects and developers to understand
completely the implications of alternative design options over the resulting
performance of the running system. They often make incorrect assumptions
about the behaviour of the middleware, which may lead to design decisions
that cause severe performance problems after the system has been
deployed. This situation is aggravated by the fact that although application
servers vary greatly in performance and capabilities, many advertise a
similar set of features, making it difficult to choose the one that is the most
appropriate for their task.
The thesis presents a methodology and tool for approaching performance
management in enterprise component-based systems. By leveraging the
component platform infrastructure, the described solution can non-
intrusively instrument running applications and extract performance
statistics. The use of component meta-data for target analysis, together
with standards-based implementation strategies, ensures the complete
portability of the instrumentation solution across different application
servers. Based on this instrumentation infrastructure, a complete

performance management framework including modelling and performance
prediction is proposed.
Most instrumentation solutions exhibit static behaviour by targeting a
specified set of components. For long running applications, a constant
overhead profile is undesirable and typically, such a solution would only be
used for the duration of a performance audit, sacrificing the benefits of
constantly observing a production system in favour of a reduced
performance impact.
This is addressed in this thesis by proposing an adaptive approach to
monitoring which uses execution models to target profiling operations
dynamically on components that exhibit performance degradation; this
ensures a negligible overhead when the target application performs as
expected and a minimum impact when certain components under-perform.
Experimental results obtained with the prototype tool demonstrate the
feasibility of the approach in terms of induced overhead. The portable and
extensible architecture yields a versatile and adaptive basic instrumentation
facility for a variety of potential applications that need a flexible solution for
monitoring long running enterprise applications.
iv

Acknowledgements
To John Murphy, my supervisor for his openness and flexibility in relation to
my research, for his constant support at both professional and personal
levels, and for creating a relaxed, high-quality working environment.
To Peter Hughes for his many useful comments and suggestions; to Andrew
Lee for his industrial perspective on my work and his magic tricks; To
Michael Stal and Petr Tuma for their evaluation of my work and for their
ideas and helpful feedback.
To Misha Dmitriev and Mario Wolczko for providing valuable suggestions for
my thesis and for giving me the opportunity to experience a high-quality
industrial research environment by supporting my internship in Sun Labs.
To Ada Diaconescu and Mircea Trofin for the constant flow of ideas and
suggestions, for the detailed and sometimes overheated discussions
regarding our research area and for making our common living room the
best place to do after-hours research. To Ada also for her patience and
support, in particular during the final stages of my write-up and for
believing that I would have no problems sustaining my thesis defence.
To Trevor Parsons for his contribution to my understanding of the Dublin
accent and for being a fun colleague; To Doru Todinca for his suggestions
and discussions during the time we were colleagues and flat-mates; To all
my other colleagues in the Performance Engineering Lab for the great
working environment and their suggestions during our meetings.
To my family for fully supporting my decision to enrol in the PhD
programme and for their constant encouragements during all this time.
v

Table of Contents
A B ST R A C T ............................................................................................................................................................................ I l l
A C K N O W L E D G E M E N T S................................................................................................................................................V
TABLE O F C O N T E N T S...................................................................................................................................................VI
LIST OF F IG U R E S ............................................................................................................................................................ IX
LIST OF T A B L E S .............................................................................................................................................................X II
LIST OF PU B L IC A T IO N S A N D A W ARDS A R ISIN G FR O M TH IS T H E S IS ................................. XH I
C H A PTER 1 IN T R O D U C T IO N ..................................................................................................................................1
1.1 B ackground a n d M otivation ....................................................................... 2
1.1.1 Complexity in Enterprise Applications ................. 2
1.1.2 Performance Challenges......................................................... 3
1.2 Co nt r ib u tio n s ....................... *.........................................................................................................................6
1.3 Thesis Overview ................................................................................................................................................ 8
C H A PTER 2 R E L A T E D W O R K ................................................................................................................................ 9
2.1 Introduction to J2EE................................................................................................................................... 10
2.2 P erformance of Software Syst em s ......................................................................................................18
2.3 Generic M onitoring Appro aches...........................................................................................................20
2.4 A daptive M onitoring A pproaches..................................... 24
C H A PTER 3 A FR A M E W O R K FO R PE R FO R M A N C E M A N A G E M E N T O F ENTERPRISESO FTW A R E A P PL IC A T IO N S......................................................................................................................................26
3.1 COMPAS Overview ............................................................................................... . ...............................27
3.2 M onitoring Ove rview ..................................................................................... 31
3.3 P roposed M odelling and Prediction A ppro ac h ..................... 33
3.3.1 M odel Driven Architecture (M D A)......................................................................................................................33
3.3.2 Performance Modelling Ontology........................................................................................................................ 35
3.3.3 Performance M anagement Functionality .........................................................................................................36
C H A PTER 4 M O N IT O R IN G IN F R A S T R U C T U R E ......................................................................................41
4.1 Introduction a n d Functional Go a l s .................................................................... 42
4.1.1 Portability and Non-Intrusiveness ................................................... *................................................................42
4.1.2 Low Overhead and Adaptive Monitoring .................................... 43
4.1.3 JM X Overview ..................................................................................................................................................................44
4.1.4 COMPAS and J2EE Management Specification ........................................................................................ 45
4.2 A rchitecture of COMPAS M onitoring ....................................................................................... 48
4.2.1 Overview o f COMPAS M onitoring Architecture ............................... 48

4.2.2 COMPAS Deployment..................................................................................................................................................50
4.2.3 COMPAS Instrumentation Layer: Probes.............................. 51
4.2.4 COMPAS JM X Repository ........................................................... 55
4.2.5 COMPAS Client-Side ...................................................................................................................................................57
4.3 D esign Co nsider atio n s .......................................................... 60
4.3.1 Design o f Monitoring Probes.................................................................................................................................. 60
4.3.2 Extracting Timestamps Using Monitoring Probes ................................... *....................... 62
4.3.3 Receiving Data from Monitoring P robes ................................................................. 63
4.4 Extensibility: COMPAS Extension Po in t s ............................... 66
4.4.1 Client-Side FEPs.............................................................................................................................................................67
4.4.2 Server-Side F E P s ...........................................................................................................................................................68
4.4.3 List o f FEPs ........................................................................................................................................................................70
4.5 V ertical a nd H orizontal Integratio n ..............................................................................................72
4.6 M onitoring Infrastructure Su m m a r y ..............................................................................................77
C H A PTER 5 IN SE R T IO N O F P R O B E S ............................................................................................................ 78
5.1 Inserting the M onitoring Pr o b e s ......................................................................................................... 79
5.1.1 COMPAS Probe Insertion Process D escription ...........................................................................................79
5.1.2 The CPI Process in J2E E ...........................................................................................................................................82
5.1.3 COMPAS Probe Insertion Process Code Exam ple . ........ 83
5.1.4 The CPI Process Using JSR77 ................................................................................................................................85
5.2 Instrum enting J2EE A pplications U sing JVM P ro filing ........................................................ 88
5.2.1 Instrumentation Levels ................................................................................ 89
5.2.2 The Instrumentation Mapping ..................................................................................................................................91
5.2.3 Usage Example and Results ........................................................................................... 94
5.3 Probe Insertion Su m m a r y .........................................................................................................................99
C H A PTER 6 A D A PT IV E M O N IT O R IN G AN D D IA G N O SIS .............................................................100
6.1 Int ro duc tio n ................................................................................................................................................101
6.2 The N eed for M o d e l l in g ........................................................................................................................103
6.3 Obtaining M o dels: Interaction Recorder ........................................... ........................................105
6.3.1 Interaction Recorder Functionality................................................................................................................../ 05
6.3.2 Advantages & Disadvantages ............................................................................................................................ / 09
6.4 Generating Alerts: D etecting Performance A n o m a lies .....................................................111
6.4.1 D etection .............................................................................................................................................. 11!
6.4.2 Design and Customisation ...................................................................................................................................113
6.5 M o d e l B ased A daptation: Ov e r v ie w ................................................................................................ 116
6.6 Collaborative D iagnosis a n d A d a pt a t io n ....................................................................................120
6.6.1 Probes as Independent Collaborative A gents .............................................................................................. 120
6.6.2 Emergent Alert M anagement and Generation ...................................................................... 124
6.6.3 Advantages and Disadvantages .................................................................................................................. 124
6.6.4 Applicability .................................................................................................................................................................... 125
6.7 Centralised D iagnosis and A da pta t io n .......................................................................................... 126
vii

6.7.1 Probes as Quasi-Independent A g en ts .............................................................................................................. 126
6.7.2 Orchestrated A lert Management and Generation ......................................................................................128
6.7.3 Advantages and Disadvantages ........................................................... ^ ................ 129
6.7.4 Applicability ....................................................................................................................................................................130
6.7.5 Design o f Centralised Logic ............................................................................ 130
6.8 D iagnosis an d A daptation Su m m a r y .............................................................................................. 136
C H A PTER 7 T E ST IN G A N D R E S U L T S .........................................................................................................137
7.1 COMPAS A daptation Test-bed Fram ew ork .................................................................................138
7.1.1 Executing Test Configurations in CAT ................................................... 140
7.1.2 Test Bean Cell D esign .......................................... , ................................. 142
7.2 COMPAS Pro t o t y pe ...................................................................................................................................144
7.2.1 COMPAS Implementation ............................................................................................................................... 144
7.2.2 COMPAS in the Real World....................................................................................................................................145
7.2.3 Using COMPAS with the Adaptation Test-bed ............................................................................................146
7.2.4 CAT in Adaptation Test Case .............................................................................................................................. 151
7.2.5 COMPAS in Use............................................................................................................................................................ 155
7.3 Performance M easurem ents ....................... 158
7.3.1 Test Environm ent.......................................................................................................................................................158
7.3.2 Setting-Up and Running Tests............................................................................................................................... 160
7.3.3 Multiple EJBs Interaction ....................................................................................................................................... 161
7.3.4 Single E JB .........................................................................................................................................................................167
C H A PTER 8 C O N C L U SIO N S...............................................................................................................................170
8.1 Problems A d d r e sse d ................................................................................................................................. 171
8.2 Review of Co ntributio ns .........................................................................................................................173
8.3 Comparison with A cademic A pproaches......................................................................................... 176
8.4 Comparison with Commercial A ppro ac h es .............. 181
8.5 V a l id a t io n ...................................................................................................................................................... 186
8.6 L imitations a n d Further Ex pl o r a t io n ........................................................................................... 188
B IB L IO G R A P H Y ...............................................................................................................................................................190
viii

List of Figures
Figure 2-1. EJB Containment Hierarchy................................................... 12
Figure 2-2. EJB Structure and Invocation Path.........................................14
Figure 2-3. Different EJB to EJB Invocation Options................................. 16
Figure 3-1. COMPAS Overview.................................................. 30
Figure 3-2. Mapping a simple PIM to an EJB PSM .................................... 35
Figure 3-3. Scenarios with probability and performance parameters.........37
Figure 3-4. Top level PIM showing a performance alert............................38
Figure 3-5. Identifying performance degrading steps............................... 39
Figure 4-1. COMPAS Non-Intrusive Approach......................................... 43
Figure 4-2. The Main Elements in JM X ..................................... 45
Figure 4-3. Main Monitoring Subsystems.................................................48
Figure 4-4. Major Monitoring Modules..................................................... 49
Figure 4-5. COMPAS Deployment............................................................51
Figure 4-6. COMPAS Probe Architectural Overview.................................. 54
Figure 4-7. COMPAS Transparent Management using JM X ........................56
Figure 4-8. COMPAS Client Architectural Overview.................................. 58
Figure 4-9. Handling JMX Notifications.................................................... 59
Figure 4-10. The Monitoring Probe......................................................... 60
Figure 4-11. Probe Sending Events........................................................ 61
Figure 4-12. Time Extraction Strategies.................................................62
Figure 4-13. Receiving Events from COMPAS Probes............................... 64
Figure 4-14. Client-Side Framework Extension Points.............................. 68
Figure 4-15. Server-Side Framework Extension Points.............................69

igure 4-16. Vertical and Horizontal Integration...................................... 73
igure 5-1. COMPAS Probe Insertion...................................................... 81
igure 5-2. Modified Component Containing the Proxy Layer................... 82
igure 5-3. Using JSR77 to Extract J2EE Deployment Data...................... 87
igure 5-4. Sample J2EE deployment structure....................................... 95
igure 5-5. In-depth instrumentation of selected EJB methods................ 96
igure 6-1. Model Information Not Available..........................................103
igure 6-2. Model Information Is Available............................................ 104
igure 6-3. Interaction Recorder Overview............................................ 106
igure 6-4. Enclosing Methods.............................................................. 107
igure 6-5. Sample Use Case................................................................ 109
igure 6-6. Design of Anomaly Detection Logic......................................114
igure 6-7. Adaptive Probe States.........................................................117
igure 6-8. Dynamic Activation of Probes.............................................. 117
igure 6-9. Probes communicate with other probes and dispatcher........ 121
igure 6-10. Collaborative Diagnosis and Adaptation............................ 122
igure 6-11. All probes communicate with the dispatcher......................126
igure 6-12. Probe in Centralised Diagnosis and Adaptation..................127
igure 6-13. Dispatcher in Centralised Diagnosis and Adaptation.......... 128
igure 6-14. Centralised Control Entities.............................................. 131
igure 6-15. Centralised Diagnosis and Adaptation Design Overview 132
igure 7-1. Sample Test-bed Configuration........................................... 140
igure 7-2. Sample CAT Configuration S e t............................................ 141
igure 7-3. CAT Test Bean Cell Structure.............................................. 143
igure 7-4. Output of Probe Insertion Procedure for CAT........................147
igure 7-5. Monitoring Console............................................................. 148
igure 7-6. Real-Time Response Time Chart.......................................... 148
igure 7-7. Interaction Recorder GUI.................................................... 149

Figure 7-8. Automatically Generated UML Diagram................................ 150
Figure 7-9. Selecting Interactions for Diagnosis and Adaptation............. 150
Figure 7-10. Configuration Selection using the CAT Front-end.............. 151
Figure 7-11. Structure of Configuration co n fig l....................................152
Figure 7-12. UML Representation of Configuration co n fig l....................152
Figure 7-13. Execution History of configl without Adaptation................152
Figure 7-14. Selecting configl for Adaptation.......................................153
Figure 7-15. Execution History of configl with Adaptation.....................153
Figure 7-16. Structure of Configuration config4....................................154
Figure 7-17. UML Representation of Configuration config4....................154
Figure 7-18. Execution History of config4................. 155
Figure 7-19. Execution History of configl with Adaptation and Hotspot... 155
Figure 7-20. EJB Express Functionality................................................ 157
Figure 7-21. Environment for Performance Tests ..................................159
Figure 7-22. CAT Configuration for Multiple EJBs Interaction.................162
Figure 7-23. Web Response Time Evolution for Multiple EJBs.................163
Figure 7-24. Multiple EJBs: Web Overhead Difference Evolution.............163
Figure 7-25. EJB Response Time Evolution for Multiple EJBs..................164
Figure 7-26. Full Instrumentation: Contribution of EJB Tier to Web Tier
Response T im e.................................................................................... 165
Figure 7-27. Partial Instrumentation: Contribution of EJB Tier to Web Tier
Response T im e..................................................... 166
Figure 7-28. Percentile Instrumentation Overhead................................167
Figure 7-29. CAT Configuration for Single EJB Interaction..................... 167
Figure 7-30. Web Response Time Evolution for Single EJB..................... 168
Figure 7-31. Single EJB: Contribution of EJB Tier to Web Tier Response Time
...........................................................................................................169

List of Tables
Table 5-1. Top-level call graph.............................. 93
Table 5-2. In-depth call graph..................... .......................................... 94
Table 5-3. JVM-Level Instrumentation Results........................................ 97
Table 6-1. Sample Collected Data Buffer............................................... I l l
Table 8-1. COMPAS vs. J2EE Performance Management Products.............185

List of Publications and Awards
Arising from this Thesis
Publications (reverse chronological order):
[1] A. Mos, J. Murphy. "COMPAS: Adaptive Performance Monitoring of Component-Based Systems". Proceedings of Workshop on Remote Analysis and Measurement of Software Systems (RAMSS) at 26th International Conference on Software Engineering (ICSE), May 24 2004, Edinburgh, Scotland, UK.
[2] A. Diaconescu, A. Mos, J. Murphy. "Automatic Performance Management in Component Based Software Systems". Proceedings of IEEE International Conference on Autonomic Computing (ICAC), May 2004, New York.
[3] A. Mos. "A Framework for Performance Management of Component Based Distributed Applications". In the 2003 ACM Student Research Competition Grand Finals (second place).http://www.acm.org/src/subpages/AdrianMos/compas.html
[4] A. Mos, "A Framework for Performance Management of Component Based Distributed Applications" Proceedings Companion Doctoral Symposium of the 17th ACM SIGPLAN Conference on Object-Oriented Programming, Systems, Languages, and Applications (OOPSLA), Seattle, November 2002
[5] A. Mos, "A Framework for Performance Management of Component Based Distributed Applications" Proceedings Companion ACM Student Research Competition of the 17th ACM SIGPLAN Conference on Object-Oriented Programming, Systems, Languages, and Applications (OOPSLA), Seattle, November 2002
[6] A. Mos, J. Murphy /'Performance Management in Component-Oriented Systems using a Model Driven Architecture Approach", Proceedings of the 6th IEEE International Enterprise Distributed Object Computing Conference (EDOC), Lausanne, Switzerland, September 2002
[7] A. Mos, J. Murphy, "Understanding Performance Issues in Component- Oriented Distributed Applications: The COMPAS Framework", Poster in the 16th European Conference on Object-Oriented Programming (ECOOP) Malaga, Spain, June 2002
[8] A. Mos, J. Murphy, "Understanding Performance Issues in Component- Oriented Distributed Applications: The COMPAS Framework", Position Paper at Seventh International Workshop on Component-Oriented Programming (WCOP) of the 16th European Conference on Object-Oriented Programming (ECOOP) Malaga, Spain, June 2002
[9] A. Mos, J. Murphy, "A Framework for Performance Monitoring, Modelling and Prediction of Component Oriented Distributed Systems" Proceedings of the Third ACM International Workshop on Software and Performance (WOSP), Rome, Italy, July 2002
xiii

[10] A. Mos, J. Murphy, "A Framework for Performance Monitoring and Modelling of Enterprise Java Beans Applications", Proceedings Companion Poster of the 16th Annual ACM SIGPLAN Conference on Object-Oriented Programming, Systems, Languages, and Applications (OOPSLA), Tampa Bay, Florida, USA, October 2001
[11] A. Mos, J. Murphy, "Performance Monitoring of Java Component-Oriented Distributed Applications", Proceedings of the 9th IEEE International Conference on Software, Telecommunications and Computer Networks (SoftCOM), Croatia-Italy, October 2001)
[12] A. Mos, J. Murphy, "New Methods for Performance Monitoring of J2EE Application Servers", Proceedings of the 8th IEEE International Conference on Telecommunications (ICT), Bucharest, Romania, June 2001
Awards:
Second Place, 2003 ACM Student Research Competition Grand Finals
Third Place, 2002 ACM SIGPLAN Student Research Competition
xiv

Chapter 1 Introduction
Large-scale enterprise applications have complex performance
characteristics
There is a need for dynamic, adaptive monitoring
Performance information must be presented at the same conceptual
level as the development constructs
Thesis contributions:
Complete framework for performance management
Non-intrusive, portable, component-level monitoring platform
that can be extended vertically or horizontally
Model-based, low-overhead adaptive monitoring techniques for
long running production systems

1.1 Background and Motivation
1.1.1 Complexity in Enterprise Applications
As companies continue to expose their business processes over the Internet
for Business-to-Business (B2B) or Business-to-Consumer (B2C)
interactions, the software systems they rely upon become increasingly
complex. The speed at which these software systems must be developed is
also increasing due to the interest of each company to achieve a
competitive advantage in their markets.
It can be argued that increasing the complexity and the time-to-market for
software systems are two conflicting requirements. Other major conflicting
requirements are ensuring that systems meet performance goals and
reducing the costs at which these systems are developed.
Outsourcing parts of system development is a solution often used by
enterprises to deal with development budget cuts. Even mission critical
developments such as financial or military applications [2] increasingly need
to resort to this approach. Another solution to the same problem is using
Commercial-Off-The-Shelf (COTS) software. Both solutions may lead to
situations where the developers responsible for the entire system do not
fully understand the resulting software application. When the application is
not clearly understood, it is often hard if not impossible to ensure that
performance goals are met, especially if the system was not engineered for
performance from the start.
Component oriented development [97][16] is gaining momentum mostly
because it speeds up the development process for large enterprise systems.
In addition, it forces developers to design with future changes in mind,
which increases flexibility and reusability. A number of frameworks such as
Sun's Enterprise Java Beans [82], OMG's Corba Component Model (CCM)
[57] or Microsoft .NET [97] are available. They can help reduce the
development time and even help with performance and reliability issues
such as scalability, fault-tolerance and availability by offering a consistent
set of systemic services ready to be integrated in the enterprise application.
Such services and additional lifecycle support offered by the component
application servers account for orders of magnitude increases in the

complexity of the resulting systems which have rather complex performance
characteristics.
In addition, the dynamic nature of component frameworks (e.g. dynamic
inter-component bindings, component versioning) as well as runtime
changes of the execution context (e.g. incoming workload, available
resources), adds to the complexity of the performance perspective on the
enterprise system.
Most of the time, the complexity of such enterprise systems is not
approached with tools that operate at the appropriate level of granularity.
1.1.2 Performance Challenges
This thesis proposes a framework for performance management of large-
scale distributed enterprise applications. Such applications have
comprehensive performance, reliability and scalability requirements. Since
businesses depend on them, they must typically operate continuously and
flawlessly 99.999% of the time (also known as the 5 9's availability). In
addition, they must handle peak loads effectively, which can be orders of
magnitude higher than the average loads.
Due to the complexity of performance aspects in enterprise systems and the
failure to use appropriate monitoring and testing tools, most enterprises will
use at least 25% more time than needed in troubleshooting applications
before 2005, according to a Gartner study [35]. The same study indicates
that 20% of enterprise mission-critical applications will experience severe
performance problems that could have been avoided by appropriate
modelling and monitoring practices.
A Standish survey [80] indicates that when developing complex enterprise
distributed systems without using advance middleware such as J2EE, only
16% of the projects are finished on time, while 33% are abandoned. The
study also indicates that 53% of such projects exceed their budgets by an
average of 90%.
J2EE has proven to be one of the best solutions to developing and deploying
such systems, holding a growing and decisive market lead [54]. It allows for
faster and more reliable application development by ensuring that the
3
developers do not spend time on system infrastructure development and
can concentrate on application logic where they have the domain
knowledge. From a performance perspective, there are several points of
interest in such applications:
Poor understanding: component-based development facilitates reuse
and outsourcing, as well as designing for change in future application
versions [97]. Enterprise applications can become composites of
different in-house component versions, third-party components and
legacy systems. In addition, the inherent complexity of the business
logic in such systems is typically rather significant. Development
teams change or are reassigned often and it is usually difficult in such
circumstances to keep track and fully understand the functionality of
the resulting system from a performance perspective. However, since
performance is usually dependent on the design of the application
rather than its code (e.g. intercommunication patterns between
components) [17], it is crucial that a consistent design view of the
application is maintained.
Runtime Infrastructure: Component platforms such as J2EE
implementations provide comprehensive functionality, which often
exceeds the complexity of the enterprise application logic that uses
them. They implement enterprise system services such as threading,
pooling, caching, persistence, transactionality, access to resources,
and security. The mapping of development concepts such as
components and high-level communication patterns such as "local
calls" to their actual infrastructure realisation raises multiple
problems. It is therefore difficult to understand the performance
implications of different design decisions and developers typically rely
on experience, anecdotic evidence and server-specific tips in order to
generate the most appropriate designs.
Platform Variation: Component technologies such as J2EE or CCM do
not mandate particular implementation techniques or rules. As long
as the functional specifications are met, vendors are free to choose
any implementations and provide any optimisations they see fit. Most
commercial vendors use their operating system and middleware
expertise to optimise the performance of their J2EE server product.
4

Some vendors have particular expertise in developing fault-tolerant
solutions, others may provide better object to database mapping for
container-managed persistence. The result is that there could be
major differences between different server implementations in terms
of their performance footprint in realising different parts of the J2EE
Specification. Particular application design options that are optimal
for one application server might prove less than optimal when the
application is deployed on another application server. For instance,
using particular combinations of session and entity beans in parts of
an application may affect the overall performance differently when
the application is deployed on different application servers [15].
5

1.2 Contributions
This dissertation proposes a solution for performance management of large-
scale enterprise systems built on component based platforms.
The solution called COMPAS is a framework that uses a component-centric
approach to match the development concepts used by developers of such
systems. The purpose of the framework is to enable rapid problem
diagnosis and isolation by presenting performance data to developers at the
appropriate conceptual level. The three main contributions of the thesis are
related to different aspects of the COMPAS framework.
The first main contribution is a distributed monitoring infrastructure that
leverages metadata in component platforms to inject instrumentation code
into applications built on such platforms. Built for J2EE, the monitoring
infrastructure uses a non-intrusive approach to instrumentation that does
not require changes to application code or runtime infrastructure and is
completely portable across J2EE application servers and operating systems.
The COMPAS Monitoring Platform is architected for extensibility and
provides extension points for vertical and horizontal integration of third-
party plug-ins. A related contribution is an instrumentation procedure for
J2EE systems based on dynamic bytecode manipulation. This can replace or
enhance the default non-intrusive instrumentation approach.
The second main contribution of the thesis is an adaptive approach to
monitoring component platforms that leverages model information
extracted from the target applications to automatically adjust the target
coverage and therefore maintain an optimum overhead. The presented
adaptation algorithms facilitate the diagnosis of the performance hotspots
by automatically narrowing the instrumentation on the appropriate
components.
The third contribution is a proposed performance management methodology
that comprises monitoring, modelling and prediction as interrelated
modules. Using information extracted from the instrumented application,
execution and performance models are created and used to facilitate
performance prediction. The system performance is predicted and
6
performance-related issues are identified in different scenarios by
generating workloads and simulating the performance models.
Other contributions are a non-intrusive approach to extract execution
models from component-based systems and a flexible framework for
behavioural and performance testing of the monitoring infrastructure. In
addition, this framework can be used to test middleware implementations
by providing a means to inject faults in component-applications accurately.
COMPAS can be used as a foundation for elaborate performance
management solutions, as it is completely portable and extendable. It
provides the necessary infrastructure to extract and process complex
performance information non-intrusively from target applications without
affecting the operational performance significantly in production
environments.
A completely functional prototype for the adaptive monitoring infrastructure
has been implemented. It is proposed to release COMPAS as open-source to
facilitate its adoption and extension by the academic and practitioner
communities. It has been tested on the leading J2EE application servers and
operating systems.
7

1.3 Thesis Overview
Chapter 2 presents an introduction to J2EE and related work in the area of
software performance engineering. General approaches to performance
management are presented and analysed. Generic monitoring techniques
and tools as well as adaptive monitoring approaches are presented and their
applicability and disadvantages identified.
Chapter 3 presents an overview of a proposed performance management
methodology comprising monitoring, modelling and performance prediction.
The monitoring module is placed in the context of a complete framework
that targets continuous application performance improvement.
Chapters 4, 5 and 6 describe the main contributions of the thesis. Chapter 4
presents the COMPAS monitoring infrastructure for component-based
applications. The framework's architecture and its capability to be extended
and integrated in third-party systems are illustrated.
Chapter 5 describes the non-intrusive and portable instrumentation process.
In addition, alternative instrumentation methods that can be used by
COMPAS are presented.
Another major contribution is described in Chapter 6 where two approaches
to adaptive monitoring and diagnosis are presented. Both approaches,
aimed at reducing the monitoring overhead, depend on the availability of
execution models of the target applications. A tool that can extract such
models is proposed.
The framework prototype and experimental results are presented in Chapter
7. The functionality of the prototype is illustrated by presenting a functional
use case and the performance impact of the prototype is measured in
different scenarios. The testbed application used to extract the results is
described as well.
Chapter 8 concludes the thesis by reviewing the contributions, the
limitations of the thesis, and presenting possible avenues for further
exploration. Related work introduced in Chapter 2 is reviewed and
compared to COMPAS. In addition, this chapter contains a feature
comparison between commercial J2EE performance management tools and
COMPAS, highlighting the main differences and similarities.
Chapter 2 Related Work
J2EE Overview
COMPAS Monitoring and Related Monitoring Approaches
COMPAS Adaptation and Diagnostics and Related Adaptive
Approaches
General Approaches in Performance Modelling and Prediction
9

2.1 Introduction to J2EE
Java 2 Enterprise Edition [85] is Sun Microsystems' architecture for large-
scale multi-tier applications. It comprises a set of documents containing
coordinated specifications and practices for development, deployment and
management of component-oriented applications.
J2EE specifies four types of components that can be used in enterprise
applications. Each type of component has an associated container, which is
responsible for providing the required runtime context, resource access and
lifecycle management. The containers enable a separation of the business
logic and platform infrastructure by providing a coherent and federated view
of the underlying J2EE APIs [85]. J2EE components never call each other
directly; rather they use the container protocols, allowing the containers to
transparently provide required context services specified by the
components' deployment descriptors.
• Application Clients: Stand-alone Java programs that require access to
server-side components. They reside in an Application Client Container.
• Applets [86]: Java components that typically run in a web browser and
can provide a complex GUI front-end for server-side applications. They
reside in an Applet Container.
• Servlets [95] and JSPs [94]\ Dynamic web component used to
generate complex HTML presentation elements or XML data for inter
business interactions. They usually connect to legacy systems or EJB
containers in order to fulfil their business logic. Servlets and JSPs
execute in a Web Container, usually included in a web server that
provides the required J2EE services such as security.
• Enterprise Java Beans [82]\ Server-side business components that
execute in a managed environment provided by the EJB Container.
They usually provide the business logic in a J2EE application and make
extensive use of container-provided services such as persistence,
transactionality and security.
J2EE infrastructure vendors must fully implement the J2EE specifications in
order to be certified as J2EE Compatible [83]. The products that implement
the J2EE specification are J2EE Application Servers. A large number of such
servers are available both as fully featured commercial enterprise products
10

and as free and flexible open-source implementations. In addition, the J2EE
Software Development kit (SDK) provides a fully featured and free J2EE
implementation.
The COMPAS Platform, proposed in this thesis, addresses performance
issues related to the EJB layer in J2EE applications. It can however be
extended to include JSPs and Servlets in the monitoring scope by adapting
the probe generation logic (see Section 5.1). The runtime monitoring
infrastructure need not be changed in order to support JSPs or Servlets.
The Enterprise JavaBeans architecture [82] is a component architecture for
the development of scalable, transactional and secure business applications.
Such applications can be developed once and then deployed on any EJB
compliant application server.
The low-level runtime support (distributed transactions management and
distributed object middleware) for EJB components (EJBs) are provided by
an EJB Server. High-level runtime management of EJB components is
provided by an EJB Container, typically running as part of an EJB Server.
The EJB Container is an abstract entity that provides a clear separation
between EJBs and the services implemented by the EJB Server through the
realisation of the standard EJB API [82], representing the EJB component
contract.
Commercial EJB Server implementations are usually part of fully featured
J2EE Application Servers but they can also be provided as stand-alone
products.
Figure 2-1 illustrates the containment relationships related to the EJB
runtime environment. EJB Components run in EJB Containers whose role is
to provide an abstraction of the underlying platform services, in the form of
the EJB APIs. The containers must fulfil the EJB component contracts by
implementing the required services and lifecycle management operations.
In addition, they must expose consistent client-views of the contained EJB
components. The EJB Server contains the basic middleware implementation
for providing the common low-level services such as distributed object
management, transaction management and distributed security policy
enforcement. The J2EE Application Server implements the common J2EE
Services and provides enterprise-level management operations. It typically
11

uses an administrative domain which can span multiple machines and
provides consistent management, load-balancing and fault-tolerance
features.
J2EE Client / J2EE Component
Figure 2-1. EJB Containment Hierarchy
The EJB Specification does not describe the interfaces between the EJB
Container, the EJB Server and the J2EE Server. Consequently, the mapping
of the functionalities presented above to the runtime entities may differ
among commercial implementations. For instance, a vendor may decide to
implement load balancing at the EJB Server level, while another vendor may
implement this functionality at the J2EE Application Server level.
Low-level middleware services
object distribution, transaction management, security
EJB Container
EJB APIs Implementation
componentcontract

Figure 2-2 describes the main constituents of an EJB component as well as
the steps required to fulfil a client request. The client can be any of the J2EE
component types, or indeed any standalone application.
The bean provider (developer) must package the following constructs into
the ejb-jar application archive [82] (a .jar file):
• EJB bean class'. This Java class contains the business logic of the
component. It must follow the EJB specification constraints [82] but
may use any number of additional classes to fulfil its logic.
• EJB Component Interface-. This Java interface must contain all the
methods that are to be exposed to the bean clients. This is necessary
so that the container can generate the E j B O b j e c t artefact.
• EJB Home: This Java interface contains the declarations of methods
that can be used to create instances of the bean. They are of the form
create<METHOD> (...) and f ind<METHOD> depending on the bean type.
Clients choose one of the home methods to obtain an EJB instance that
corresponds to their needs.
• XML Deployment Descriptor, the contract between the bean provider
and the container, this document describes the structure of the bean as
well as the required services (such as security or persistence). In
addition, this document can contain parameters that can be customised
at deployment time to suit individual application needs. For instance,
the number of rows to be returned from a database can be
parameterised.
13

J2EE Client /
J2EEComponent
1 1 1EJB Contract Description
(Metadata)
Figure 2-2. EJB Structure and Invocation Path
The container has the responsibility of using the bean provider's artefacts
(interfaces and deployment descriptors) and providing the appropriate
implementations at runtime. The reason for having a separation between
bean provider artefacts and container artefacts is that this allows the bean
provider to lack expertise in system-level services. The bean provider
specifies the required services in the deployment descriptor and provides
the "skeleton" of the component as it should be exposed to the outside
clients. The container generates the artefacts that enforce this view, thus
realising the component contract. The container artefacts essentially wrap
the bean implementation and add layers of service enforcement and
lifecycle management to the business logic provide by the bean's
developers.
The container must provide an implementation of the EJB Home interface in
the form of a bean factory object that uses the specified construction
methods. This implementation, bound to the component name is available
at runtime in the system's naming directory accessed through the Java
14

Naming and Directory Interface (JNDI) [92]. In addition, it must implement
the EJB Component Interface and provide an E J B O b j e c t class that clients
will access when they require services from the bean implementation. This
"proxy" [34][82] approach enables the container to intercept the client calls
and execute the necessary management and service code.
In Figure 2-2, the bean client is requesting a service from the depicted EJB
in the following steps:
1) It first obtains a reference to the E JB H om e implementation that the container
has generated. The reference is looked up in the system-naming directory via
JNDI. On the obtained factory (the E JB H om e implementation) object, the client
will call the required construction method.
2) The E JB H om e implementation instructs the container to create a new instance or
retrieve an existing instance of the component, and returns it to the client. The
actual Java object returned is an instance of the container-generated
E J B O b j e c t class that corresponds to the bean's component interface.
3) The client invokes the business method on the container object, transparently,
through the component interface. The container object performs the required
services and calls the corresponding business method on the bean's
implementation object, instance of the bean provider's bean class.
Session and entity EJBs can expose local or remote views to their clients.
Clients of EJBs can be other EJBs or arbitrary Java objects such as applets
or servlets or standalone applications.
A remote view can be used by any local or remote client to access an EJB.
The exposed object must comply with the Java Remote Method Invocation
(RMI) specification [93]. Remote operations incur the overhead of
serialising and de-serialising arguments.
A local view is non-remotable and can only be used by clients residing the
same JVM as the bean. This view is used when it is known that all clients of
an EJB are always running in the same JVM, typically other beans deployed
in the same container. Since this view is non-remotable, it allows faster
access by avoiding serialisation operations.
Figure 2-3 illustrates different scenarios in which EJBs can call each other.
15

._____
EJB InstanceEJB Instance
EJB Instance
m*A\* p l a si ifcl
EJB Instance
Figure 2-3. Different EJB to EJB Invocation Options
An EJB Server Instance is a machine-bound entity and manages the
realisation of low-level services on that machine's platform. An enterprise-
scale system typically uses several federated EJB Server instances
aggregated into one or more administrative domain.
An EJB Container Instance typically corresponds to a JVM instance on the
EJB Server Instance. Some EJB Servers create one JVM per container,
others run several containers in the same JVM and others use a combination
of both. EJBs calling each other in the same JVM may use either a local or a
remote view. EJBs calling each other between JVMs must use remote views.
The EJB specification describes three types of EJB components [82]:
• Session beans: Short-lived business components that execute on
behalf of individual clients. They typically execute business operations
and can access and update the enterprise database but do not
correspond to shared business data. They can take part in transactions.
Session beans do not survive a server crash and their clients must re
16
establish a new connection under such circumstances. There are two
types of session beans:
o Stateless session bean\ does not preserve conversational state;
can be shared between clients. Subsequent calls from a client to
a bean may be handled by different instances. A typical
example is a stock component that retrieves the current stock
value for a given index,
o Stateful session bean-, has conversational state on behalf of its
client; cannot be shared between clients. All calls from a client
to a stateful session bean are handled by the same instance. A
typical example is a shopping cart containing items to be
purchased from an online store.
• Entity beans'. Long-lived business components that provide an object
view of data in the enterprise database. They can be shared by multiple
users and survive server crashes.
• Message-driven beans'. Short-lived components, invoked
asynchronously, that execute upon reception of a single client
message. They can access and update data in the enterprise database
but are not persisted and do not survive a server crash. They can take
part in transactions.
The COMPAS Platform presented in this thesis, targets Session and Entity
beans only. Such beans use a synchronous invocation style and have non-
ambiguous call-semantics, facilitating the determination of each bean's
position in the appropriate interaction contexts. In contrast, the call
semantics of the message-driven beans is significantly weaker because the
invocation model is based on messages sent to messaging queues and
topics, rather than directly to the beans.
17

2.2 Performance of Software Systems
The field of software performance modelling and prediction is vast. A
comprehensive survey of modelling approaches for performance prediction
is presented in [9]. Important contributions have been presented in
[110][75][76] reporting significant results in the improvement of the
software development process, specifically the use of Software Performance
Engineering methods aided by related tools such as SPE-ED [75] . The
techniques and the supporting tools require developers to create software
and/or system models of the application under development. These models
must have performance parameters such as I/O utilisation, CPU cycles or
network characteristics, specified by the developers in order for the
performance predictions to generate meaningful results. It has been proved
that such techniques and tools like SPE-ED help in achieving performance
goals and reducing performance related risks for general object-oriented
systems and even for distributed systems [75]. However, middleware such
as EJB and other component-oriented platforms, exhibit an inherent
complexity, which developers find hard if not impossible to quantify even in
simple models. Automated services such as caching, pooling, replication,
clustering, persistence or Java Virtual Machine optimisations, provided by
EJB application servers, for example, contribute to an improved and at the
same time highly unpredictable run-time environment. Furthermore,
application server implementation can vary greatly from vendor to vendor in
respect to these services. Similarly, in CORBA (or CCM) based systems the
search for performance improvements of the underlying framework under
variable workloads leads to increased complexity [1]. It is therefore
impossible for developers building such applications to create performance
models where they specify the mapping of methods to processes or
instances to processors, I/O characteristics or CPU utilisation.
An approach to modelling systems in UML is presented in [43]. OAT is a tool
that implements a framework for performance modelling of distributed
systems using UML. It consists of a method for decomposition of models
and performance modelling techniques. UML models, created at different
development stages can be mapped to queuing networks and solved to
predict application performance. System developers must create the models
18

and augment them with performance annotations leading to a similar
disadvantage with that of the SPE-ED [75] approach. In addition, it is not
clear how this approach can be used for large systems, as it does not
address issues such as model management.
Predicting the performance of middleware-based systems has been
approached in the past. Among the most common techniques are Petri-Nets
[24] and Layered Queuing Network [110][51][63][62] models. It is
envisaged that models created automatically by monitoring the system with
COMPAS can be simulated and predictions derived for different workloads
using queuing networks or Markov chains [24] techniques.
A case study for performance prediction of J2EE systems is presented in
[46]. The authors study various prediction techniques and report successful
application of queuing networks to predict the performance of a realistic
J2EE application. They focus however on the aggregate behaviour of the
system and model the deployment configuration including the application
server cluster, the network topology and the database server. The authors
do not focus on modelling application-level components such as EJBs. Using
a non-product-form queuing network of the system, and different workload
intensities, the authors successfully predict response time, throughput and
CPU utilisation for the J2EE system.
19

2.3 Generic Monitoring Approaches
There is a significant amount of research and work in monitoring CORBA
systems; however, there are no existing generic component-based (in the
acceptance of the component term as defined in [97]) monitoring
frameworks that can provide design level performance information (i.e.
component method and component lifecycle performance data).
OrWell [109] is a monitoring environment for CORBA distributed
applications. It uses an event class hierarchy to notify a number of
observers about the interactions in a system. It provides detailed analysis of
the monitored system; however, the authors do not present how the event
distribution units (EDP) are dynamically attached to the existing objects. It
is also not specified whether the monitoring environment is portable across
different operating systems or not. The main similarity with this thesis is in
the instrumentation concepts of using one additional component (in case of
COMPAS, the probe) for each monitored object in order to obtain dynamic
run-time information.
Wabash [78][79] is a tool for testing, monitoring and control of CORBA
distributed systems. It uses CORBA interceptors to capture run-time
information and therefore is similar to the preferred approach in this thesis,
in that it is non-intrusive. However, Wabash uses geographical information
to group monitoring components, which is not applicable in EJB
environments where the application server controls the distribution of
components.
JEWEL [48] is another monitoring environment for distributed applications.
Because it uses a hybrid sensor-based approach to monitoring that requires
dedicated external monitoring entities as well as internal hooks, it is more
likely to be used in LANs where additional monitoring resources are
available. In order to avoid system's sensors affecting the original system's
behaviour, it requires a separate physical LAN. The main advantages of this
system is that a large amount of data is filtered and analysed, however the
analysis and results are presented at the communication protocol level and
provide information such as mean bytes per packet or protocol usage, which
do not give an object-oriented view of the system.
20

In [69] and [68], the authors propose Remote Reflection as a technique for
general-purpose monitoring, debugging and visualisation of distributed Java
applications. Using Remote Reflection, distributed systems could be
inspected and acted upon from a central location, enabling a management
model for enterprise applications. The focus of reflective techniques is to
enable applications to discover facts about their structure at runtime and
potentially make changes that can dynamically alter their behaviour.
In [20] the authors present a generic conformance-testing framework for
distributed systems. The framework uses instrumentation probes that can
be instantiated and activated by remote controllers, and a distributed event
publication and transport system that enables listeners to register interest
in receiving certain types of monitoring events from the probes. In addition,
a testing language is used to create online test cases that drive the activity
of the probes.
Aspect-oriented programming (AOP) techniques [8] can provide an
alternative means of inserting instrumentation functionality in target
application components. Pointcuts [45] can be defined before and after
important method calls such as component business methods or container
lifecycle callbacks. The main disadvantages of AOP are the requirement for
a special compiler and the increased runtime footprint due to the use of
separate aspect-related objects.
JBoss interceptors [41] provide an efficient means of inserting call-related
and lifecycle-related functionality for J2EE applications running in the JBoss
application server. Since custom interceptors can be created and placed
automatically in call-paths, they can be considered a suitable alternative for
the insertion of monitoring functionality. The main advantage of using this
approach is that a clear separation between instrumentation logic and
application logic, and the capability to inject instrumentation code
dynamically in applications at runtime. The major disadvantage of the
interceptor approach is the dependence on the JBoss runtime environment,
making it impossible to build a portable J2EE instrumentation solution,
which is one of the goals of the COMPAS framework.
A number of application servers provide a limited degree of monitoring but
most of them do so at a network/protocol level, giving little help to 00
21
developers who want to understand which component/method is having the
scalability problem.
Commercial J2EE profiling tools such as Veritas' Indepth [104], Wily
Technologies' Introscope [111], Quest Software's PerformaSure [66],
Borland's Optimizeit Enteprise Suite [12], Mercury Interactive's Monitoring
and Diagnosis for J2EE [53] or Cyanea/ONE [19] provide performance
information about the instrumented applications at different abstraction
levels including component-level and object-level. They all offer the
capability to see different levels of performance metrics about the target
system and extract useful statistics. One of the main issues with such tools
is that they typically require the users to start the server in a special
monitoring mode which results in parts of the application server being
monitored at all times without the possibility of easily removing the
monitoring code from the target. This translates into a constant overhead
imposed on the running applications, which can only be completely removed
by restarting the server in standard mode. Another major disadvantage is
that they are targeted at specific application servers, on specific platform,
offering reduced flexibility in choosing the development environment.
Pure JVM profiling tools such as Optimizeit [12], JProbe [65] or JProfiler
[30] can be used for J2EE instrumentation as well. When J2EE applications
are typically instrumented at the JVM level, large amounts of data are
collected and presented to the developer; however, the intended
component-level semantics of the application is lost in the details. The
conceptual hierarchy enabled by using a component platform is flattened
and developers are presented with large sets of method calls, representing
a mix of internal EJB container functionality, business application code and
Java core functionality.
In a different category are EJB testing tools [31],[74] that perform stress
testing on EJB components and provide information on their behaviour.
Such tools automatically create test clients for each EJB and run scripts with
different numbers of simultaneous such clients to see how the EJBs
perform. The main disadvantage of such a solution is the fact that it does
not gather information from a real-life system but from separated
components. Without monitoring the actual deployed system, it is difficult to
obtain an accurate performance model for the entire system.
22

An interesting initiative in obtaining standardised performance data for EJB
systems is the ECPerf [81] process. It defines a standard workload and
standard business applications that are generated during the testing
process in order to determine the performance of application servers.
Metrics like transaction throughput and response time are derived from the
testing process and the results can be used by vendors to showcase their
application server products. Although this approach does not involve
monitoring of an arbitrary application, it is relevant to the research of this
thesis because it defines workload and metrics of interest to performance
management of EJB systems.
23
2.4 Adaptive Monitoring Approaches
COMPAS aligns with the IBM autonomic computing initiative [44], which
represents a major direction of research aimed at managing complex
systems. The initiative outlines the need for independent and adaptive
monitoring solutions that can instrument complex long-running applications.
COMPAS is such a solution due to its adaptive capabilities. Having a minimal
overhead when the system is performing well and a low overhead when
performance problems are detected, positions COMPAS as a good candidate
for monitoring long-running systems.
Another goal of the initiative is to promote self-adaptive systems, which can
optimize their run-time footprint based on the existing environmental
conditions.
A discussion about using agents for monitoring distributed systems is
presented in [36]. The authors argue that the increasing complexity of
distributed applications account for major difficulties in obtaining meaningful
performance information; in addition the monitoring infrastructure must
adapt to the application's environment in order to minimise the runtime
performance footprint. Typical issues occurring in large distributed
applications and mentioned in [36] such as non-determinism and the lack of
a global clock.
In [98], the authors focus on an adaptive monitoring infrastructure (JAMM)
in a grid-computing environment. Using an RMI infrastructure, monitoring
programs such as netstat, iostat and vmstat are executed in order to obtain
vital statistics for the running nodes in the cluster. Monitoring is started
after detection of activity on some ports, by a port monitoring agent. There
is no concept of software components or objects in JAMM, therefore no
monitoring at method level or component level, as it is performed in
COMPAS. JAMM measures CPU, network usage and memory, and can also
be customized for some UNIX specific call-backs or events. Monitoring data
is archived and can be used by third-party performance prediction systems
that are not covered by the paper.
An interesting approach for lightweight monitoring of deployed systems is
software tomography [14] which uses subtask probes optimally assigned to
24

program instances in order to minimise the total overhead of monitoring.
The information obtained from the subtask probes is eventually aggregated
into overall monitoring information. The research presented in the thesis is
partially similar in intent to software tomography in that the reduction of
total overhead is realised by partial monitoring with optimally placed
probes.
An interesting application of agent-based monitoring concepts is presented
in [108]. The authors have implemented a lightweight agent-based financial
monitoring system that monitors and reports on transactions within an
organisation, focusing on banking and trading operations. The main purpose
of the monitoring system is the detection of fraud issues or trading
problems. One of the similarities with COMPAS is the use of knowledge
about the transactions in order to focus the monitoring efforts of the
agents. Another one is the collaboration between the agents in order to
infer monitoring results and generating alerts when needed.
25

Chapter 3 A Framework for
Performance Management of
Enterprise Software Applications
COMPAS proposes three interrelated modules: monitoring, modelling
and performance prediction
Strong connection between modules ensures consistency and data
accuracy
Reduces the need for assumptions in performance prediction: real
data obtained from monitoring is used
Modelling enhances the understanding of the target system
Monitoring uses modelling to reduce overhead
26

3.1 COMPAS Overview
This thesis describes the COMPAS infrastructure that could be used to
detect and understand performance problems in distributed component-
oriented applications based on technologies such as Enterprise Java Beans.
COMPAS provides basic performance management functionality and can be
specialised to produce arbitrary-complexity custom performance
management applications. COMPAS therefore satisfies the conditions of a
framework as presented in defining literature[42][73]. It provides black-
box type extensibility by enforcing communication and architectural
protocols for custom functionality. Although in the framework literature, the
points of extensibility are called "hot-spots" [73], this thesis uses the term
COMPAS Framework Extension Points (FEPs). This is necessary in order to
avoid terminology overload due to the use of the term "performance
hotspot" in the context of performance degradations.
Chapter 3 places the main contributions of the thesis into the wider context
of performance management and proposes a complete framework for
monitoring, modelling and prediction of component based applications.
The COMPAS Framework can potentially be used to correct performance
problems, by providing means for comparison between different possible
design solutions. The following issues are considered:
• Performance can be critical for large-scale component oriented
applications.
• A poor architecture, a bad choice of COTS components or a
combination of both can prevent the application from achieving the
performance goals.
• Performance problems are more often caused by bad design rather
than bad implementation.
• Often, performance is "a function of the frequency and nature of inter
component communication, in addition to the performance
characteristics of the components themselves" [17].
• Fixing performance problems late in the development process is
expensive.
27

To address these issues, this thesis proposes a possible framework-
architecture, structured into three main functional parts or modules that are
interrelated:
• Monitoring: obtains real-time performance information from a running
application without interfering with the application code or the
application run-time infrastructure (i.e. the application server
implementation). In addition, in order to minimise the overhead
incurred on the target system, the monitoring probes can adaptively be
activated and deactivated.
• Modelling: generates UML models of the target application using
information from the monitoring module. The models are augmented
with performance indicators and can be presented at different
abstraction levels to improve the understanding of the application from
a performance perspective.
• Performance Prediction: the generated models of the application are
simulated with different workloads (e.g. corresponding to different
business scenarios); simulation results can be used to identify design
problems or poor performing COTS components.
The monitoring and modelling modules are covered by the thesis, while the
prediction module is presented as a possible component of the COMPAS
framework. The proposed functionality of the prediction module can be
achieved using the extensibility capabilities of the framework
There is a logical feedback loop connecting the monitoring and modelling
modules. It refines the monitoring process by continuously and
automatically focusing the instrumentation on those parts of the system
where the performance problems originate.
The intent of the presented framework is not to suggest a development
process that prevents the occurrence of performance issues in the design,
but rather to enable early discovery of such issues and suggest corrections.
Because model generation in the presented framework is dependent on
monitoring information extracted from a running application, the approach
presented in this thesis integrates well within development environments
that adhere to iterative development processes such as Rational Unified
Process [47] or Extreme Programming [11]. Such processes demand that a
28

running version of the application exists at the end of every iteration,
making monitoring possible.
Models are represented in UML, with which many enterprise-scale
application developers are familiar. The use of Model Driven Architecture
(MDA) [58] and Enterprise Distributed Object Computing (EDOC) [59]
concepts facilitates navigation between different layers of abstraction. The
top-level models are represented using a technology independent profile,
the Enterprise Collaboration Architecture (ECA) from EDOC, in order to
benefit from a standardized form of representation for business modelling
concepts. Lower level models are represented using UML specialized profiles
such as the UML Profile for EJB [59] which provide means to illustrate
technology specific details. Regardless of the level of abstraction, each
model is augmented with performance information extracted by the
monitoring module and presented using the UML Profile for Schedulability,
Performance, and Time Specification [60].
The Performance Prediction Module uses executable versions of the
generated modules and simulates them with different workloads as inputs,
displaying performance information in the same manner as in the modelling
phase.
It is envisaged that both in the modelling phase as well as in the prediction
phase, developers will navigate through the generated models in a top-
down manner. If a performance alert is attached to a design element
(during modelling or simulation), that element can be "zoomed into" and a
lower-level, more detailed model that includes that element is then
inspected. This approach is highly intuitive, primarily because it is
conceptually integrated with a typical design process in which high-level
abstractions are found first, and then later refined into more-detailed
abstractions, in an iterative manner.
A high-level overview of the entire framework is depicted in Figure 3-1.
29

M O H J T Q 3 1 N.S
T hs i'> the application server ihat
«wTOOdMfiSUK> original components
(EJBiJ together with the proxy
required for mom ton ng
^ Moniton no Subsystem
P E B P O B M A N C E PR E D IC T IO N
« m o d e l»
PIW/PSM
i v i
« m o d e l» Runnable Scenario
«D atabase» Simulation Result
"v> % analyses
gets wortdoad i displays results
M
±3 S s â s ô ite v w
ïiii
w ra c s k ¡Wwrm&oosuch as classrtflm*s;slatrcrelationships
{*8vnhoflunc»)
d tá r& o x raftónttoapplicationcomponents(archives)
M O D E L L IN G
listener
M M data
corrente!» «m o d e l»PIM/PSM Scenario
I IM.GJ
Figure 3-1. CO M PA S Overview
The monitoring block in the diagram presents the data extraction
functionality and contains the monitoring infrastructure (Chapter 4)
deployed in a target system. Run-time data obtained from the application is
analysed by the modelling module, which employs a model generator
(Section 6.3) in order to extract the execution models from the running
system. The execution models can be presented visually using MDA
concepts (Section 3.3.1) and analysed with the purpose of driving the
adaptation process of the monitoring infrastructure (Section 6.2). The
automation broker is the entity responsible for using model data to adapt
the monitoring process. Presentation of models can benefit from statically
acquired data by enhancing the model elements with component metadata
and application resource usage. The performance prediction block illustrates
proposed functionality in the context of the performance management
framework. A model-migration element is responsible for using the models
generated by the modelling module and transforming them to performance
models required in the performance prediction phase. The performance
models can then be simulated leading to simulation results that can be
presented similarly to the execution models (using UML and MDA).
30

3.2 Monitoring Overview
The proposed monitoring infrastructure (COMPAS Monitoring) leverages the
underlying properties of component-based platforms in order to enable non-
intrusive instrumentation of enterprise applications. Using model-based
adaptive activation of the monitoring probes, the overhead incurred on the
target application is minimal. In addition, the mechanism for the generation
of the monitoring alerts automatically eliminates most of the false alerts,
thus contributing to the overhead reduction. As the infrastructure is
designed to be used as a foundation for performance management tools, its
design is extensible and based on decoupled communication mechanisms.
The most important functional entity of the monitoring infrastructure is the
monitoring probe. The probe is conceptually a proxy element with a 1 to 1
relationship with its target component. In J2EE, target components are the
EJBs deployed in a target application.
It is implemented as a proxy layer surrounding the target component with
the purpose of intercepting all method invocations and lifecycle events. The
process of augmenting a target component with the proxy layer is referred
to as probe insertion.
Non-Intrusive and Portable
COMPAS uses component meta-data to derive the internal structure of the
target entities. For J2EE, the component meta-data is placed in deployment
descriptors that contain structural as well as behavioural information about
the encompassing EJBs. By leveraging this data, it is possible to obtain the
internal class-structure of each component, which is needed for the
generation of the proxy layer.
As all the information needed for probe insertion is obtained from the meta
data, there is no need for source code or proprietary application server
hooks. Therefore, the effect on the target environment is minimal and user
intervention in the probe insertion process not required.
COMPAS is in this respect non-intrusive, as it does not require changes to
the application code or to the runtime environment.
31
A desirable effect of the probe insertion approach is that the process is
completely portable across all platform implementations. Considering J2EE
as the target platform, any J2EE application running on any J2EE application
server can be instrumented.
Adaptive and Low-Overhead
Two main techniques are used to minimise the overhead of the monitoring
infrastructure, asynchronous communication and adaptive activation. The
former is employed in the entire infrastructure by the use of an event-based
architecture with robust message handling entities that prevent the
occurrence of locks in the target application. The latter technique uses
execution models captured from the target application to drive the
activation and deactivation of the monitoring probes. By appropriately
minimising the number of active probes, the total overhead is reduced while
preserving complete target coverage.
Extensible
COMPAS Monitoring contains an instrumentation core and a set of
extensions for coordinating and handling the instrumentation events. The
extensions are built upon the pluggable architecture of the instrumentation
core by leveraging the COMPAS Framework Extension Points based on
loosely coupled asynchronous communication.
Possible extensions include adding support for low-level instrumentation
sources such as virtual machine profiling data, as well as high-level
functional extensions such as elaborate data processing capabilities for
performing complex analysis of the monitoring data. Decision policies for
improving the alert management and adaptive monitoring process can be
implemented as extensions also.
32

3.3 Proposed Modelling and Prediction
Approach
The main goal of the complete COMPAS framework is to help developers of
large enterprise component-oriented applications find and predict
performance problems in their systems, using concepts and visual
representations that they easily understand.
Based on information extracted by the monitoring module, UML models are
generated which show where performance problems are located. By
simulating such models, predictions are made that help understand the
implications of changes in workload or changes in QoS characteristics for
particular components. Having such prediction data, developers can make
informed design decisions and choose the best COTS components to meet
the application needs. Models are also used to increase the efficiency of the
monitoring process by activating monitoring only for those components that
are responsible for performance problems, and deactivating the monitoring
of the other components. This activation/deactivation process is continuous
and it is envisaged that as models are being refined, the monitoring
overhead decreases.
The next two sub-sections briefly present the Model Driven Architecture and
the performance ontology that the framework uses. The remainder of the
section describes the modelling and prediction functionality of the
framework.
3.3.1 Model Driven Architecture (MDA)
The Model Driven Architecture [58] proposes a new approach to the
development and understanding of complex systems and promotes
portability across the main platforms that are currently in use now or will be
used in the future.
MDA introduces two important concepts, the Platform Independent Model
(PIM) and the Platform Specific Model (PSM). A PIM would generally be used
in the earlier stages of development and it consists of a detailed UML model
of the business logic without any technological details. For example, at the
beginning of a development process, developers would model business
33
entities such as <Account>, <Bank> and their behaviour which are all
completely platform independent there is no need for any platform specific
information, such as EJB Home Objects. Note however that a platform can
be anything from a hardware platform, to operating system to middleware
to another PIM. Therefore, the notion of platform and platform
independence are relative, which makes it possible to have an arbitrary
number of PIMs for the same problem space, each representing a different
level of abstraction. A PSM has platform specific information in the model,
such as EJB or CORBA stubs. Again, taking into consideration the relative
aspect of a platform, a PSM can be just a more detailed description of a
PIM, with more technical details.
A major advantage of using MDA is that models at different levels of
abstraction can be implemented for different platforms, that is, from a set
of PIMs, a large combination of PSMs could be realized, and the entire
application would preserve its integrity. For example, for a business
application, for the same set of PIMs (the suite of models that describe the
system at a platform independent level), different combinations of PSMs
could be derived for each PIM. An internal banking PIM could be realized by
using an EJB mapping [59] to generate EJB PSMs. The B2B PIMs could be
realized by using XML and SOAP PSMs. All these PSMs would interoperate
with each other as specified in the PIMs. If for some reason, there is a need
to generate the B2B PSMs in CORBA, that would not affect any other models
and the generated system would be cohesive.
MDA facilitates "zooming in" and "zooming out" at different
abstraction/realization levels. A PIM can be "zoomed into" to browse the
PSMs that realize it, or a PSM could be "zoomed out of" to inspect the upper
layer of abstraction. This facility is central to the presented performance
management framework because it enables navigation between different
refinement application layers when increased precision is needed for
pinpointing a performance issue presented at the top levels of the
application models hierarchy.
A simple illustration of MDA concepts is provided by Figure 3-2 which
illustrates a basic MDA refinement process. A Platform Independent Model
(PIM) of a component, in this case a s h o p p i n g c a r t component is refined
into a Platform Specific Model (PSM) of the same component, for the EJB
34

technology. The PIM representation contains only the "business logic" of the
component, while the PSM contains EJB-specific artefacts, corresponding to
the same component (the EJB interface, the EJB bean implementation and
the EJB Home interface). Navigation between PIMs and PSMs can prove
beneficial in particular for large models where the complexity of PSMs may
become difficult to manage in the absence of higher-level abstractions.
Figure 3-2. Mapping a simple PIM to an EJB PSM
3.3.2 Performance Modelling Ontology
The UML Profile for Schedulability, Performance, and Time Specification [60]
defines the ontology used for performance models in the presented
framework. Some of the main concepts in the ontology are:
Performance context: "specifies one or more scenarios that are used to
explore various dynamic situations involving a specific set of
resources."[60]
Scenario: "...a sequence of one or more scenario steps. The steps are
ordered and conform to a general precedence/successor relationship. Note
35

that, in the general case, a scenario may involve multiple threads due to
forking within the scenario."[60]
Step: "An increment in the execution of a particular scenario that may use
resources to perform its function. In general, a step takes finite time to
execute. It is related to other steps in predecessor/successor
relationships."[60]
Resource: "An abstraction view of passive or active resource, which
participates in one or more scenarios of the performance context."[60]
To simplify the presentation of performance models and increase visibility of
generated sequence diagrams, anonymous timing marks [60] are used,
which are effectively shorthand notations for time measurements.
3.3.3 Performance Management Functionality
This section describes potential performance management functionality that
can be achieved by using the COMPAS framework.
In the proposed functionality, performance models are generated at run
time based on measurements taken by the monitoring module. Two major
sets of data are obtained during the monitoring process:
• Model generation data: component instances [97], [70] are monitored
for method invocations and lifecycle events. Time-stamps are used
together with component instance IDs, method names and method
execution times to order events and build statistical dynamic models of
the running application.
• Performance information: metrics such as response times and
throughput are determined for the runtime entities and are used to
augment the generated UML models.
When using model generation data to detect models in the monitored
application, techniques such as Markov chains, Petri Nets and queuing
networks can be used. Statistical results based on a significant number of
measurements are used to determine scenarios in the system, starting at
previously determined points of entry. For example, in an EJB system, such
a point of entry could be a web layer component such as a product selection
list in a retail application. Such a determined scenario could be one
36I

corresponding to a "buying an item" use-case. Another could correspond to
a "write a product review" use-case.
Figure 3-3. Scenarios with probability and performance parameters
Models representing these scenarios would have performance related
information in addition to probabilities.
Figure 3-3 illustrates this example. The first scenario starts with step "1.
addltem" and the second scenario with step "2. addReview". Please note
that these scenarios do not illustrate a real design, but rather a very
simplistic imaginary example.
To reduce visual cluttering, there are only two annotations regarding
performance and probabilities in the example diagram, however it is
envisaged that a framework implementation will feature an efficient way of
dealing with such visual elements by selectively hiding or showing elements
depending on user preferences. Scenario 2 has a probability of occurrence
of 30% and a mean execution time of 200ms. One of the steps in scenario
2, step "2.1 updateMarketingDB" has an associated mean execution time of
180ms, representing 90% of the total scenario execution time. Even though
the example diagram is a UML collaboration diagrams, models can be
presented using sequence and activity diagrams as well. To improve
understanding of such diagrams, Object Constraint Language [71] (OCL)
notations may be used together with statistic data to explain the conditions,
37

in which a particular scenario occurs, not just the probability of occurrence.
For example it can be statistically determined that a scenario is followed
only when a parameter passed to the top-level scenario component, has a
particular value.
Models such as the one presented in Figure 3-3 are generated during the
monitoring process or by a later analysis of the monitoring logs. They are
augmented with performance attributes such as "mean response time".
Based on user-defined rules, performance alerts are issued by the modelling
environment, when certain conditions such as "too much growth in
execution time" or "scenario throughput > user defined value" are met. If
the user defines values such as expected mean and maximum values for a
particular scenario response time, the models will show alerts in those areas
exceeding these values. If the user does not specify such values, the
framework can still suggest possible performance problems when certain
conditions like "the response time increases dramatically when small
numbers of simultaneous scenario instances are executed" are encountered.
If a particular step in the affected scenario is mainly responsible for the
degradation of scenario performance parameters, that step is identified and
the alert narrowed down to it. Figure 3-4 and Figure 3-5 illustrate how a
performance problem can be narrowed down using the MDA approach. Both
diagrams are PIMs, however, developers could proceed to lower levels such
as EJB PSMs to identify technology specific events such as lifecycle events
that can cause performance degradation.
Figure 3-4. Top level PIM showing a performance alert
38
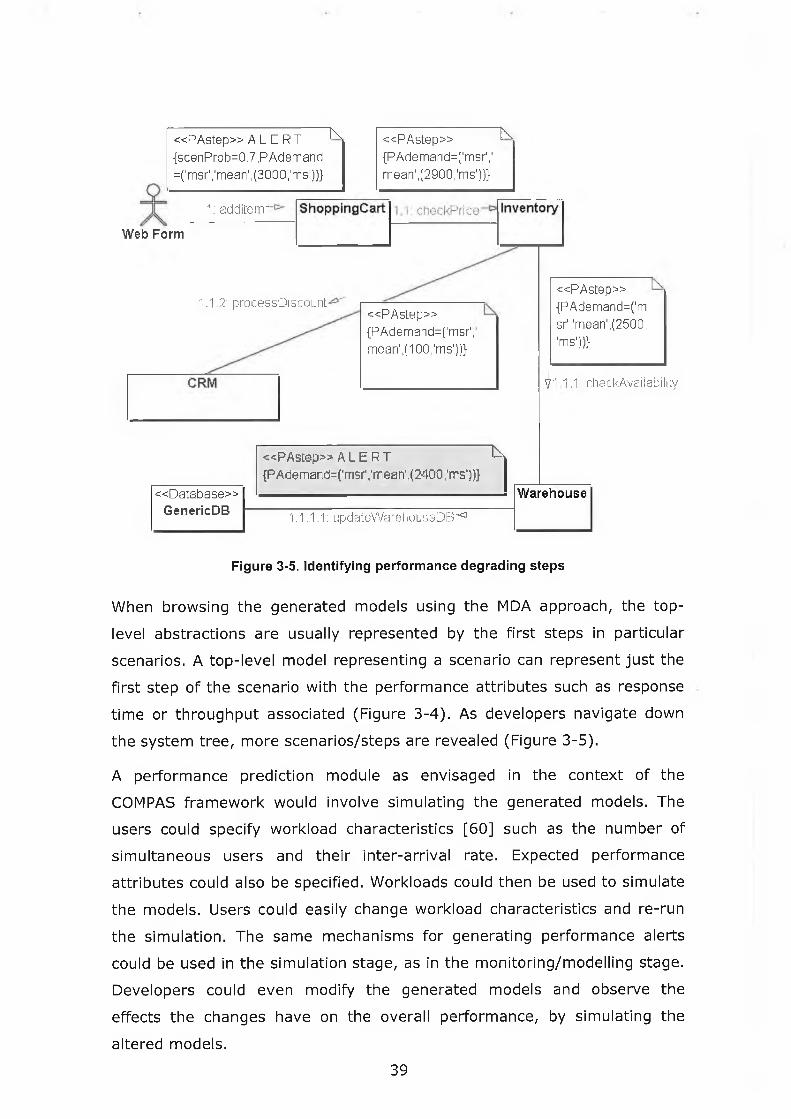
« P A s t e p » A L E R T{scenProb=0.7,PAdem and=(lm srl,lm ean,l(3 0 0 0 1lm s1))}
K « P A s t e p »{PAdem and=('m sr,1'
m earT.^goo.'m s'))}
TH
1: a d d ite n r
Web Form
1.1.2: processD iscount« P A s t e p »
{PAdem and=('m sr',m ea n '.n o o /m s '))}
«PAstep» A L E R T {PAdemand=('msr','mean',(2400,'ms'))}
1
« P A s t e p »{PAdem and=('msr'/m ean'.^SOO,'ms'))}
^1 1.1 checkAvailability
« D a ta b a s e » WarehouseGenericDB 1.1.1.1: updateW arehouseDB-*3 -
Figure 3-5. Identifying performance degrading steps
When browsing the generated models using the MDA approach, the top-
level abstractions are usually represented by the first steps in particular
scenarios. A top-level model representing a scenario can represent just the
first step of the scenario with the performance attributes such as response
time or throughput associated (Figure 3-4). As developers navigate down
the system tree, more scenarios/steps are revealed (Figure 3-5).
A performance prediction module as envisaged in the context of the
COMPAS framework would involve simulating the generated models. The
users could specify workload characteristics [60] such as the number of
simultaneous users and their inter-arrival rate. Expected performance
attributes could also be specified. Workloads could then be used to simulate
the models. Users could easily change workload characteristics and re-run
the simulation. The same mechanisms for generating performance alerts
could be used in the simulation stage, as in the monitoring/modelling stage.
Developers could even modify the generated models and observe the
effects the changes have on the overall performance, by simulating the
altered models.
39
COMPAS does not propose the detailed design of such a solution, instead it
focuses on providing a monitoring infrastructure that can be leveraged by
performance prediction tools that can offer the functionality presented
above, such as EJB Express [49][56] (Section 7.2,5).
In both the monitoring/modelling stage and prediction stage, models could
be used to detect bad design practices. For example, an EJB PSM could
show a performance alert when an entity bean [70] finder method returns a
large result set. In such a situation, a pattern [34] such as Value List
Handler [18] could be suggested by the framework to alleviate the
performance problem.
40

Chapter 4 Monitoring Infrastructure
Non-intrusive monitoring, no changes required in the runtime
environment or the target application's code
Portable monitoring infrastructure: does not depend on the
middleware implementation
Probes act as component platform interceptors without requiring
access to platform implementation
Uses distributed monitoring probes attached to target components
Automatic infrastructure deployment based on component metadata
Extensible probe behaviour
Extensible architecture allowing third-party plug-ins to process
filtered information from probes
41

4.1 Introduction and Functional Goals
The COMPAS Monitoring Platform Is Intended as a foundation for building
enterprise-level performance management solutions for component-based
applications. Although it targets J2EE applications, the conceptual structure
applies to other component-based frameworks such as CCM [97][57] or
.NET [97] as well.
The following general goals of the monitoring infrastructure have been
phrased in J2EE terminology to leverage the presented technological
background.
4.1.1 Portability and Non-Intrusiveness
COMPAS was designed to provide a common monitoring platform across
different application server implementations. The existing tools (Section
8.4) use server-specific and JVM-specific hooks in order to obtain
performance measurements and management data from the target
applications. This constrains the users of such tools to using particular
execution platforms. In contrast, COMPAS aims to use a higher-level
approach to monitoring, by augmenting the deployed components with an
instrumentation layer. This approach does not require hooks or changes in
the application server, nor does it require changing the source code of the
target application. Figure 4-1 illustrates the different instrumentation
techniques. Two possible techniques involve either changing the source
code of the target application, or using container-specific hooks. COMPAS
however, uses a proxy layer that "wraps" the original component while
preserving the J2EE compatibility.
42

Figure 4-1. CO M PAS Non-lntrusive Approach
4.1.2 Low Overhead and Adaptive Monitoring
In order to achieve a low performance overhead when deployed in the
target system, most tools employ selective monitoring based on user
choices and can reduce the overhead by reducing the number of classes
that are instrumented. COMPAS aims to reduce overhead by automatically
adapting its target coverage while preserving complete hotspot detection
capabilities. Based on application interactions, COMPAS actively monitors
only top-level components without completely shutting down the data
43

gathering capabilities of the other components, which can still analyse their
performance and issue alerts when necessary. Monitoring Probes are
automatically switched into active or passive monitoring (Section 6.5) by
performing a diagnosis analysis each time an alert is generated. This
capability ensures that the system maintains an optimum overhead level,
without requiring user intervention. This aligns with the requirements for
autonomic management of long-running systems, as outlined in [44].
4.1.3 JMX Overview
The technology used by the monitoring module for managing the
instrumentation of EJB components is Java Management Extensions (JMX)
[33], which offers a lightweight, standardized way for managing Java
objects. The inclusion of JMX in the J2EE standard assures that any J2EE
compliant application server provides a JMX implementation.
The JMX architecture has three levels:
• Instrumentation level: provides instant manageability to a
manageable resource (any device, application or Java object) by using
a corresponding MBean. A managed bean, or MBean for short, is a Java
object that represents a JMX manageable resource. MBeans follow the
JavaBeans components model, thus providing a direct mapping
between JavaBeans components and manageability. Because MBeans
provide instrumentation of managed resources in a standardized way,
they can be plugged into any JMX agent.
• Agent level: provides management agents. JMX agents are containers
that provide core management services which can be dynamically
extended by adding JMX resources. A JMX Agent is composed of an
MBean server, a set of MBeans representing managed resources, and
at least one protocol adaptor or connector. Protocol adaptors create a
representation of the MBeans into another protocol, such as HTML or
SNMP. Connectors include a remote component that provides end-to-
end communications with the agent over a variety of protocols (for
example HTTP, HTTPS, HOP).
• Manager level: provides management components that can operate
as a manager or agent for distribution and consolidation of
management services. A JMX manager provides an interface for
management applications to interact with the agent, distribute or

consolidate management information, and provide security. JMX
managers can control any number of agents, thereby simplifying highly
distributed and complex management structures.
Figure 4-2 shows that the MBeans are managed by an application through
the MBean Server. In addition, they can be monitored by a special type of
MBeans, called a Monitor that can observe changes in the state of a
monitored MBean and notify the registered listeners. An MBean corresponds
to a managed resource and it can interact with that particular resource.
Figure 4-2. The Main Elements in JM X
4.1.4 COMPAS and J2EE Management Specification
Java Specification Request (JSR) 77 [84] defines a specification of a
common framework for management and monitoring services in the context
of Java 2 Enterprise Edition platforms. The J2EE Management Specification
[84] includes a management model that contains a set of manageable
entities in the J2EE context. In addition, it contains standard mappings of
the model to the Common Information Model (CIM) [25], to an SNMP
Management Information Base (MIB), and to a Java API through an EJB
component, the J2EE Management EJB (MEJB) component.
The JSR77 management model contains the set of attributes, operations
and architecture of managed objects that compliant platforms must provide.
It describes a hierarchy of manageable entities that matches the runtime
hierarchy in J2EE environments. It contains elements such as J2EE Server,
J2EE Application, EJB Module, EJB, Web Module, Servlet etc. In addition, it
contains elements corresponding to JVMs and resources such as JDBC, JNDI
or JMS connections. For each entity, there are attributes and operations
45

that can be used to obtain management and performance information. In
addition, naming guidelines for the manageable objects allow the creation of
JMX queries that can be used for navigating the management hierarchy. For
instance, the set of EJB modules contained in a deployed J2EE Application
s a m p ie J 2 E E A p p is obtained by retrieving the results of query
" * : j 2 e e T y p e = E J B M o d u l e , J 2 E E A p p l i c a t i o n = s a m p l e J 2 E E A p p , * " .
The specification includes a standard mapping to Java APIs by defining the
MEJB entity, which is an EJB component. This component provides an
abstraction layer over the JMX interface to the manageable entities,
allowing any J2EE component access to J2EE management and performance
information. Clients of the MEJB session EJB can invoke operations similar
to those of JMX server implementations [33][90] in order to access the
attributes and operations of the required manageable MBean objects.
The main similarity between COMPAS and JSR77 stems from the fact that
they both aim at providing a basic means for extracting management and
performance information from J2EE environments. COMPAS however is an
extendable platform whereas JSR77 defines a specification. The J2EE
Management Specification must be realised by the compliant J2EE Servers,
so for each product, a different implementation is provided. COMPAS is a
portable platform that can be deployed Into any J2EE environment. Both
COMPAS and JSR77 employ JMX as the underlying infrastructure for
exposing management data. In addition, they both use an abstraction layer
(monitoring dispatcher in COMPAS and the MEJB component in JSR77) that
facilitates access to information from an external client. COMPAS however
provides a more runtime performance-focused view of J2EE applications
than JSR77. The COMPAS monitoring probes instrument existing application
and continuously extract performance data from component instances. Such
a facility does not exist in JSR77, as it does not mandate instance-level
manageable entities; this constitutes a key difference between the two
approaches. In addition, JSR77 is oriented towards obtaining statistics over
long periods and not towards identifying performance hotspots. COMPAS
employs adaptive monitoring and diagnosis techniques in order to improve
detection of hotspots and reduce overhead. JSR77 does not specify any
such features being concerned primarily with providing a static
management layer that is occasionally queried by external clients. There is
46

no concept of dynamic interaction in JSR77, unlike in COMPAS. The
interaction recording capabilities used by COMPAS allow the association of
performance data to different use-case realisation interactions. In addition,
UML diagrams can be generated by COMPAS to illustrate these associations.
These capabilities are not within the JSR77 scope.
COMPAS can leverage some facilities offered by JSR77 implementations. For
instance, the probe insertion process (Section 5.1) can use application
discovery techniques facilitated by the JSR77 hierarchical view (Section
5.1.4).
It is envisaged that enterprise-level tools would use both JSR77 and
COMPAS in order to avail of the complete spectrum of performance and
management data. Detailed statistics about J2EE components and
resources, including database connections and JVM memory parameters,
could be obtained using JSR77 APIs. COMPAS could be used for runtime
monitoring and diagnosis capabilities as well as for extracting dynamic
performance models that accurately represent system interactions.
47

4.2 Architecture of COMPAS Monitoring
4.2.1 Overview of COMPAS Monitoring Architecture
The main subsystems of the COMPAS Monitoring Infrastructure are
presented in Figure 4-3.
«subsystem»Probes
A \
!
‘s..
j1 V-..
Î!
— 1
«subsystem»
1■Installation
\
1
!;:r
i !
«subsystem»Monitoring Clients
Figure 4-3. Main Monitoring Subsystems
The Installation Subsystem is responsible for generating and inserting the
proxy layer into target applications. It sits on the client-side.
The Probes Subsystem represents the server-side, distributed
instrumentation infrastructure of COMPAS Monitoring. It is responsible for
capturing and transmitting performance data from the target applications
and generating performance alerts.
The Monitoring Clients Subsystem represents the client-side, centralised
part of the COMPAS Monitoring infrastructure. It is responsible for collecting
and processing performance data from the probes.
The major modules of these subsystems are illustrated in Figure 4-4.
48

Figure 4-4. Major Monitoring Modules
The Monitoring Probes, Time Extraction and Anomaly Detection modules are
parts of the Probes subsystem in Figure 4-3. The Probe Insertion &
Installation and the Server Adapters modules are part of the Installation
Subsystem In Figure 4-3. The Server Adapters module Is also shared by the
Probes subsystem. The Dispatcher/Collector, Interaction Recorder and
Monitoring Consoles are part of the Monitoring Clients Subsystem in Figure
4-3. The Hotspot Detection module can be part of the Probes subsystem or
the Monitoring Clients subsystem, or, In complex cases that require server-
side and client-side processing, both.
The monitoring probes module is the Implementation of the proxy layer
Inserted Into target application components. It contains logic for extracting
timestamps and generating alerts upon detection of performance anomalies.
Both tlmestamp-extractlon and anomaly-detectlon modules are designed for
49

extensibility to allow third-party plug-ins be added for functionality that is
more complex.
Server adapters contain functionality for mapping JMX-level operations used
in COMPAS to different JMX implementations. One server adapter
corresponds to one applications server type. They are needed for two
reasons: firstly, the JMX standard still has inconsistencies and incomplete
specifications for remote management; and secondly to take advantage of
advanced features In particular application server implementations. For
instance, some commercial application servers provide optimisations for
some JMX operations, which COMPAS can use. Since the server adapters
can be added by third parties using a common mechanism, different optimal
server-specific Implementations can be used. As all JMX implementations
become fully compatible, the use of server adapters will be optional and
focused solely on taking advantage of particular server-optimisations.
The Dispatcher / Collector module is responsible for collecting all the event
notifications from the monitoring probes. After filtering and pre-processing
the notifications, the dispatcher emits events richer in semantics to any
monitoring client that has registered an Interest in monitoring events.
COMPAS provides two such listeners, the Interaction recorder and the
monitoring console. The Interaction recorder can capture and store
component interactions in the live target application, and store them on
physical storage. In addition, it can display UML sequence diagrams
representing the captured interactions. The monitoring console can display
real-time monitoring information received from the probes. Such
information includes component instance data, method invocation and alert
data, and real-time charts showing the evolution of response time for
particular component methods.
4.2.2 COMPAS Deployment
The COMPAS monitoring probes reside in their target component containers.
Several containers, residing In separate application server nodes, may be
remote in relation to each other, as illustrated In Figure 4-5.
50

COMPAS Console
Figure 4-5. CO M P A S Deployment
Typically, the application server nodes are connected via high-speed
networking, such as optical fibre. In some cases, they can also be located at
different physical sites. The deployment of COMPAS probes mirrors exactly
the target application deployment. The COMPAS clients typically reside on
separate machines, used for application monitoring and management. They
do not share the processing and memory resources with the application
server machines. This allows remote monitoring of target systems to which
they usually are connected via LANs. Multiple remote clients can receive
notifications and control monitoring probes.
4.2.3 COMPAS Instrumentation Layer: Probes
The COMPAS Instrumentation Layer consists of the entities responsible for
extracting and reporting performance and lifecycle data from the target
components.
For each Target Component X, the following COMPAS entities exist in the
running system:
51

Proxy Layer: The proxy layer for Component X Is generated automatically
by the Installation procedure (see Section 5.1). It consists of a lightweight
Implementation of the Component X Business Interface. This
implementation is responsible for obtaining time-stamps and sending
invocation and lifecycle events to the associated Probe Dispatcher.
Probe: An instance of the Proxy Layer represents a Probe. In a running
system, there is always one probe for each Component X instance. All
probes for Component X are associated with the same Probe Dispatcher
Instance and forward their collected measurements and lifecycle data to this
probe dispatcher instance.
Probe Dispatcher: The probe dispatcher is an entity responsible for
collecting, analysing and forwarding events received from all the probes
corresponding to Component X. For each Component X, there is always a
single probe dispatcher instance. The probe dispatcher maintains a history
of aggregated performance and lifecycle data, representing the activity of
its associated probes. In addition, the probe dispatcher is responsible for
using any of the available anomaly detection strategies in order to issue
performance alerts at appropriate times (Section 6.4).
In parts of the thesis, the term "probe" is used as a simplification for ''probe
and its associated dispatcher".
Figure 4-6 presents the overall architecture the COMPAS instrumentation
layer corresponding to a Target Component X. Two instances of X are
illustrated, Xj and Xk. Each of the Instances is surrounded by an instance of
the proxy layer, the probe. Both probes communicate with the same
associated probe dispatcher. They capture invocations from the applicatlon-
cllent layer as well as lifecycle (e.g. creation, deletion) event notifications
received from the container. For each event (invocation or lifecycle), each
probe performs measurement operations and sends data containing event
and performance information to the probe dispatcher. The probe dispatcher
stores and analyses each event. It sends JMX notifications containing
processed events to the JMX Layer. These notifications can be received and
interpreted by any JMX consumers that register their interest in receiving
COMPAS notifications from the COMPAS probes. The following basic
notifications can be emitted by the probes in a default COMPAS deployment
(i.e. without custom behaviour added to the probes):
52

• Method invocation (i.e. a method exposed through the component
interface has been called). The notification includes collected
performance data, in addition to method identifiers.
• Component instance creation: This refers to an Instance creation in
the component-based system development terminology. Such an
instance is an entity that a client has access to and can invoke methods
on. This is sometimes in contrast to a language construct (such as a
Java object) as containers may hold object pools that contain "empty"
component instances. Such instances are ready to be "filled in" with
appropriate contextual and business data and be used in client
interactions. Only after this operation has occurred, do these object
Instances become component instances. The notification includes the
name of the component whose Instance is being created as well as the
total number of instances of this component.
• Component instance deletion: this refers to the container removing
a component instance from the list of "ready-to-use" instances. The
notification includes the name of the component whose instance Is
being removed, as well as the remaining number of instances.
• Performance Alert: this is issued whenever an anomaly Is detected in
the performance response of a component Instance (see Section 6.4).
The notification includes the invocation data corresponding to the
method Invocation that triggered the anomaly detection, as well as the
alert message, as composed by the alerting mechanism in use (see
Section 6.4.2).
• Synchronisation Update: this is used when the monitoring dispatcher
registers with the application server, or whenever a monitoring listener
requires an update of the performance parameters corresponding to a
component. The notification includes the total number of instances of
the component as well as the method execution history for each
method exposed by the component. The synchronisation should only be
used rarely as its aggregating nature implies significantly more
communication overhead than other notifications.
53

Figure 4-6. CO M P A S Probe Architectural Overview
Probes can also be controlled from external clients such as the monitoring
dispatcher. The clients can invoke control operations on the probes (via
their associated MBeans) to alter the monitoring process or to set
operational parameters.
The following control operations are available to execute on a probe:
• start monitoring and stop monitoring (if monitoring is on, the probe can
operate; if monitoring is off, the probe does not perform any
operations)
• start logging and stop logging (controls the logging behaviour of the
probes; when logging is active, probes can display some information in
the server console)
54

• enter active mode and enter standby mode (controls the monitoring
mode of the probe) (Section 6.5)
• induce delay (used by the interaction recorder, Section 6.3)
• request synchronisation (listeners may request that an update be sent
from the probe with aggregated historical data, useful when a listener
has lost connection, or when a listener has been initiated after the
probe has been instantiated)
4.2.4 COMPAS JMX Repository
The JMX Layer is the main COMPAS distributed communication medium
used to transfer events from the Instrumentation Layer to the Monitoring
Dispatcher and other COMPAS Listeners and to transfer control commands
from the Monitoring Dispatcher and other COMPAS Listeners to the
Instrumentation Layer.
The following default JMX notification types are emitted by the COMPAS
Probes (see Section 4.2.3 fora description of each of them):
• compas.ejb.invocation
• compas.ejb.creation
• compas.ejb.deletion
• compas.ejb.alert
• compas.ejb.update
Figure 4-7 illustrates the usage of JMX in COMPAS. The location
transparency is illustrated by different probes residing in separate
component containers and communicating with the COMPAS Listeners via
the distributed JMX Server.
55

Figure 4-7. CO M PAS Transparent Management using JM X
The JMX model enables COMPAS entitles to communicate transparently in
distributed environments and to expose management and event-distrlbution
functionality. Probes can send events of particular types and all registered
listeners can receive them. The COMPAS Listeners must register their
interest with events from particular COMPAS Probes and they will
automatically receive the appropriate events. This functionality is similar to
what could be achieved with a messaging-based architecture such as Java
Message Service (JMS) [91]. However, in addition, JMX enables distributed
management via the Probe MBean operations. COMPAS Listeners can
56
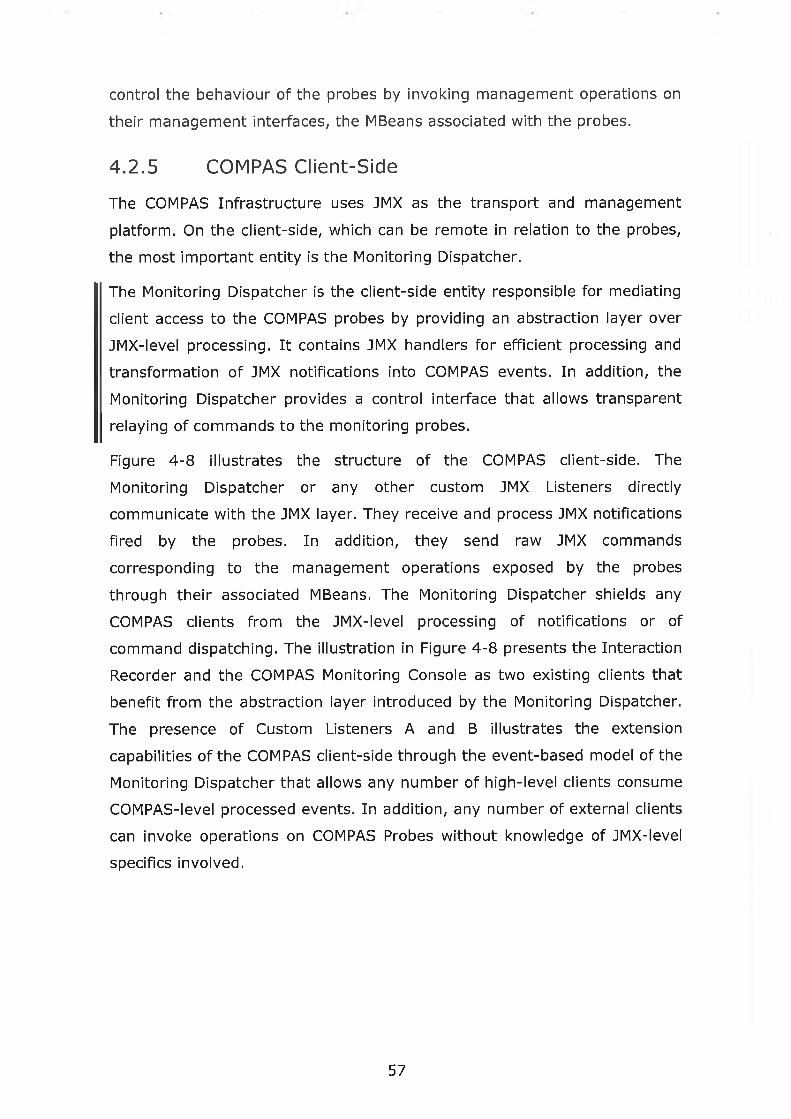
control the behaviour of the probes by Invoking management operations on
their management interfaces, the MBeans associated with the probes.
4.2.5 COMPAS Client-Side
The COMPAS Infrastructure uses JMX as the transport and management
platform. On the client-side, which can be remote in relation to the probes,
the most important entity is the Monitoring Dispatcher.
The Monitoring Dispatcher is the client-side entity responsible for mediating
client access to the COMPAS probes by providing an abstraction layer over
JMX-level processing. It contains JMX handlers for efficient processing and
transformation of JMX notifications into COMPAS events. In addition, the
Monitoring Dispatcher provides a control interface that allows transparent
relaying of commands to the monitoring probes.
Figure 4-8 Illustrates the structure of the COMPAS client-side. The
Monitoring Dispatcher or any other custom JMX Listeners directly
communicate with the JMX layer. They receive and process JMX notifications
fired by the probes. In addition, they send raw JMX commands
corresponding to the management operations exposed by the probes
through their associated MBeans. The Monitoring Dispatcher shields any
COMPAS clients from the JMX-level processing of notifications or of
command dispatching. The Illustration in Figure 4-8 presents the Interaction
Recorder and the COMPAS Monitoring Console as two existing clients that
benefit from the abstraction layer introduced by the Monitoring Dispatcher.
The presence of Custom Listeners A and B illustrates the extension
capabilities of the COMPAS client-side through the event-based model of the
Monitoring Dispatcher that allows any number of high-level clients consume
COMPAS-level processed events. In addition, any number of external clients
can invoke operations on COMPAS Probes without knowledge of JMX-level
specifics involved.
57

JM.XNotifications troni Probes
Custom COMPAS JMX Listener
X
COMPASMonitoring
Console
COMPAS Filtered - Events
Listener A
Raw Control Com m ands from CO M PA S
MonitoringDispatcher
rCustom COMPAS
JMX Listener Y
Notifications and ControlCommands withCOMPASSemantics
COMPASInteractionRecorder
COMPAS Filtered - Events
Listener B
Figure 4-8. CO M PA S Client Architectural Overview
Figure 4-9 shows how COMPAS JMX notifications are handled by the client-
side. All notifications are received and the JMX Handler Chooser selects the
appropriate handler for each notification. For each notification type, there
exists one pre-initiallsed handler. Each handler can schedule the processing
of the notifications in a background thread, essentially placing the tasks of
handling each notification in a queue. Consequently, there are as many
background threads as notification types. This enables the efficient pre
processing of notifications without blocking the external JMX server process.
58

The illustration shows only the basic COMPAS notification types and their
handlers, however, any number of custom notifications and handlers can be
added using the COMPAS Framework Extension Points (see Section 4.4).
JMX Handler Chooser
Figure 4-9. Handling JM X Notifications
After each notification is pre-processed In the appropriate handler, a
COMPAS flltered-event is sent to the Monitoring Dispatcher, which can relay
it to any registered COMPAS Listener, as Illustrated in Figure 4-8.
59
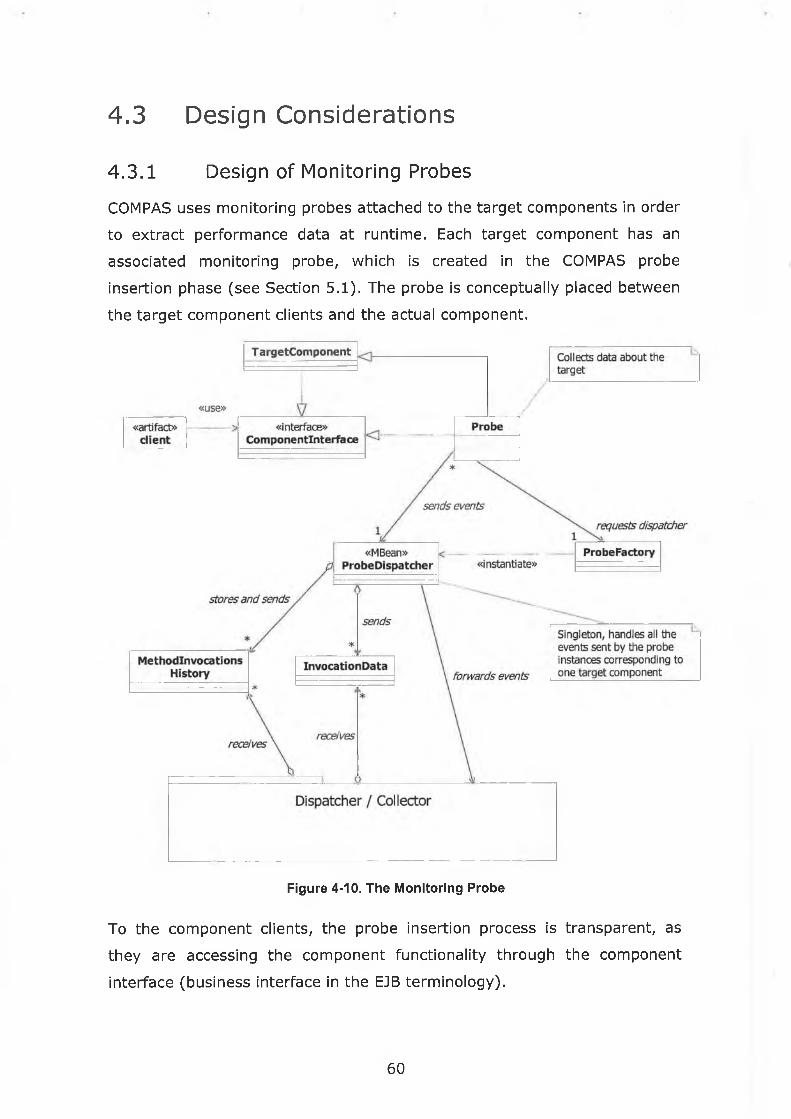
4.3 Design Considerations
4.3.1 Design of Monitoring Probes
COMPAS uses monitoring probes attached to the target components in order
to extract performance data at runtime. Each target component has an
associated monitoring probe, which is created in the COMPAS probe
insertion phase (see Section 5.1). The probe is conceptually placed between
the target component clients and the actual component.
Figure 4-10. The Monitoring Probe
To the component clients, the probe Insertion process is transparent, as
they are accessing the component functionality through the component
interface (business interface in the EJB terminology).
60

The probe extends the component implementation class thus Inheriting all
the interface (business) methods as well as the lifecycle methods (Figure
4-10). The probe acts as and inheriting adaptor, a specialisation of the
adaptor pattern [34]. When receiving a method call from a client, the probe
will perform performance-measuring operations (i.e. timestamps, see
Section 4.3.2). In addition, it will notify the Dispatcher / Collector
subsystem of all of the events (Section 4.2.3), as they occur or as being
requested by the dispatcher.
The sequence diagram in Figure 4-11 describes the steps taking place when
the monitoring probe captures events from Its target component.
/ Probe Factory / Probe Dispatcher / JMX Server
3 : \request d ispatcherI
4 : \create or find\ t [op|y at aeation Ume]
\ r e g is t e r in r e p o s i t o r y
Hreturn dispatcher
■6 : \ s e n d creation e v e n t \
7 : \ s t o r e creation data\
ff3 : \ e m i t c r e a t io n n o t i f i c a t io n
1?
11 : \send invocation event\I
12 : \store invocation data\
Ì12 : \stc
1 3 : \ e m it I n v o c a ito n e v e n t^ |
Figure 4-11. Probe Sending Events
61

4.3.2 Extracting Timestamps Using Monitoring Probes
COMPAS Probes can extract performance and lifecycle data from their
associated components. In order to measure execution times for a
component method, timestamps are obtained before and after the method
has been executed. COMPAS currently uses two time-extraction techniques:
the default timestamp-extraction technique and the precise timestamp-
extraction technique (described below). COMPAS probes can be extended to
use additional timestamp-extraction techniques via the Time Extraction
Server FEP (see Section 4.4.2).
«creates»
Figure 4-12. Time Extraction Strategies
Figure 4-12 illustrates the design of the time extraction subsystem. Each
probe must obtain the required time extraction strategy from the
P r o b e S e r v i c e L o c a t o r factory. Based on system availability and probe
requirements, the appropriate strategy Is returned to the probe.
The default time extraction strategy is used mostly when no other strategies
are available. It employs portable Java timestamp extraction techniques,
using the S y s t e m . c u r r e n t T i m e M i i l i s () system call. The resolution of this
time stamping method is dependant on the operating system and it ranges
from 1ms on Linux to 50ms on some Windows systems [40]. The poor
resolution of this method makes it rather impractical particularly In
situations where the average execution time of business methods is within
the resolution range. However, If remote business method calls dominate,
62

then this strategy may be utilised as usually the cost of remote calls is
significantly higher than the resolution.
In addition to the default time stamping scheme, COMPAS provides a high
precision, nanosecond precision time extraction strategy. This strategy uses
the jtimer native library [26] obtained in collaboration with the Distributed
Systems Group at Charles University, Prague. This strategy requires that a
compiled version of the jtimer library exists in the system path for the
operating system used by the application server running the components.
Binary versions are available for Linux, Windows and Solaris and the library
code can be easily compiled for other operating systems. When using this
library, the timestamps recorded by the COMPAS probes are in
nanoseconds. In order for monitoring clients to properly use the timestamps
scale (nanosecond or millisecond), a Boolean parameter Indicating the
appropriate scale Is sent together with invocation data. If the jtimer library
Is not available on a server machine, the probes will automatically use the
default time stamping scheme, without requiring explicit configuration
operations.
4.3.3 Receiving Data from Monitoring Probes
The COMPAS Probes generate JMX notifications that can be received by any
client registered as a listener for the probe MBeans in the JMX server.
COMPAS provides a central point for receiving all notifications from the
Probe MBeans, the Monitoring Dispatcher. This facilitates the access by third
parties to probe-emitted events without the need to write JMX code. The
Monitoring Dispatcher uses the Observer [34] pattern to allow any number
of external clients to consume events from COMPAS probes. The steps
presented in the sequence diagram in Figure 4-13 are taken by the
Monitoring Dispatcher (referred to as the COMPAS Client in the following
paragraphs, as they apply to any standalone JMX COMPAS Client) when it
initialises.
In order to be able to receive events from new probes, the COMPAS Client
must register as a listener to the JMX server. This allows future creation
events for new probe dispatchers to be received. The COMPAS Client may
connect and disconnect to the application server at arbitrary moments in
time, without being coupled to the probes' lifecycle. As such, when the
63

COMPAS Client initialises, It must search for probe dispatchers that have
already been created. The JMX server will return a list of all previously
registered probe dispatchers.
/ Operator : Actorl /JM X Server / Probe Dispatcher
1 : \initialize\/ COMPAS Client
i
2 : \connect\
I
r
3 : \search for existing probe dispatchers\
r t : \lookup each dispatcher
I probe dispatchers returned | 5 : \register as listener to
probe\
I
>r^> : \register client as listener^ 1
7 : \request data ""p synchronisation\
89 : \process synchronisation
data\
z z n
Lr
\sends synchronisation notification
10 : \regular invocation or creation notifcation\
Figure 4-13. Receiving Events from CO M PA S Probes
For each existing probe dispatcher, the COMPAS Client will register as a
listener in order to be able to receive all future events from the associated
probe instances. After registration, the COMPAS Client requests a data
synchronisation operation in order to receive information about past events
regarding probes associated with this probe dispatcher. For instance, the
history of method calls and number of instances for the component
represented by the probe dispatcher are returned. This allows the COMPAS
64

Client to display immediately an overview of the operational history of the
targeted component system.
All future invocations from existing probe dispatchers as well as new probe
dispatchers can be received after the above steps complete.
65I'

4.4 Extensibility: COMPAS Extension Points
COMPAS is a platform for adaptive monitoring of component-based
applications. Its purpose is to provide a rich set of functionalities for
extracting and processing runtime data from enterprise systems. It employs
low overhead monitoring techniques based on adaptive instrumentation in
order to enable long-term monitoring of production systems. To aid the
discovery of performance hotspots origins, COMPAS uses a diagnosis model
that leverages model information from the running system in order to infer
causality relationships.
These facilities are provided as part of the COMPAS framework. It is
important however that more complex and complete solutions for
performance management be built using COMPAS.
COMPAS exposes a set of Framework Extension Points (FEP) that can be
utilised by external tools. There are two types of extension points:
Input FEP: third-party functionality can be added to COMPAS to enhance its
already existing functionalities. COMPAS is a consumer of information
through the input FEPs. Usage examples of input FEPs include better time
stamp extraction techniques or advanced anomaly detection algorithms
used in the problem diagnosis processes.
Output FEP\ third-party functionality can be added that uses and processes
information extracted by COMPAS. COMPAS is a producer of information
exposed through output FEPs. Such FEPs are usually event sources that
COMPAS provides for any external tools. Usage examples of output FEPs
include specialised GUI consoles or integration into wider-scope
performance tools.
As well as third-party functionality, the functionality that COMPAS provides
relies heavily on the usage of FEPs. For instance, the COMPAS Monitoring
Console uses a FEP, in an identical fashion to which an external GUI would
behave.
All FEPs can be further classified into server-side FEPs and client-side FEPs.
A server-side FEP facilitates the extension of the functionality available to or
provided by a COMPAS Monitoring Probe.
66

A client-side FEP facilitates the extension of the functionality available to or
provided by the COMPAS Monitoring Dispatcher.
4.4.1 Client-Side FEPs
In Figure 4-14, the layered structure of the COMPAS client is presented. The
top layer, JMX Event Dispatcher, is responsible for receiving and ordering
the JMX notifications sent by the COMPAS server-side part composed of the
Monitoring Probes. The following JMX notification types can be emitted by
the Probes as part of their basic functionality (Section 4.2.4):
compas. ejb.in vocation, com pas. ejb. deletion, compas. ejb. creation,
compas.ejb.update and compas.ejb.alert. All such notifications are received
by this layer and forwarded to the middle layer.
The JMX Event Handlers layer matches each Invocation type with its
appropriate JMX event handler. Matching is performed upon inspection of
the invocation type. Consequently, the available handlers are invocation
handler, deletion handler, creation handler, update handler and alert
handler. This layer contains an output FEP that allows horizontal integration
with COMPAS to be realised. In Figure 4-14, a custom handler is presented
to indicate the possibility for a third party to provide additional event
handlers for any number of additional event types. The already existing
event handlers use the output FEP as well, In the same manner as a third
party event handler would.
67

/r
=>CD
COMPAS JMX notification
JMX Event Dispatcher
JMX Event Handlers
invocation creation deletion update alert
Processed I Filtered Event Dispatcher/
Figure 4-14. Client-Side Framework Extension Points
The third layer contains the event dispatcher for processed and filtered
events received from the middle layer. The events this layer operates with
are more semantically rich than the JMX notifications. They have been
processes by the middle layer and wrapped into events that are more
meaningful to the application logic. This layer exposes an output FEP that
can be used by any number of third party plug-ins. This FEP is a source of
semantically reach events presented in a standard manner, as a coherent
interface. The COMPAS Monitoring Console GUI, the Interaction Recorder
and the Alert Manager are all users of this FEP. They all consume COMPAS
application events and process subsets of them for different purposes. For
instance, the Interaction Recorder is in particular concerned with method
Invocation events whereas the Alert Manager processes alerting events
only.
4.4.2 Server-Side FEPs
Figure 4-15 presents the architectural layers for the server-side COMPAS
Instrumentation infrastructure. The bottom layer corresponds to the
monitoring probes. The probe functionality is realised by the proxy layer
Implementation. COMPAS uses automatically injected component-level
hooks that capture invocation and essential lifecycle events from the
68

component instances, and send them to proxy layer instances. There is one
proxy layer instance (probe instance) for each component instance. This
layer exposes an input FEP, the instrumentation FEP, which can be used by
alternative instrumentation techniques. For instance, a JVM level profiler
could extract invocation and lifecycle events by modifying the bytecode of
the component classes. Such a profiler could then use the instrumentation
FEP to benefit from the extensive COMPAS infrastructure.
COMPAS JMX notification
JMX Event Dispatcher
custom
invocation instantiation
custom
deletion
Proxy Layer Instance
COMPAS Proxy Code (Generated Hook)
Custom Hook
V i
0Time Extraction Strategy
precise default custom
Proxy Layer Instance
/ ' ■ —
Figure 4-15. Server-Side Framework Extension Points
The probes extract timestamps for performing measurements by using
extensible strategies (Section 4.3.2). COMPAS provides two time extraction
implementations: a precise, platform-dependent technique and a fully
portable Java default mechanism that offers less precision. In addition, an
input FEP, the time-stamping FEP, allows third-party time extraction
strategies to be used. For instance, a high precision, hardware-software
hybrid could be used to provide accurate measurements to the COMPAS
platform, for demanding, distributed environments.
69

Performance measurements extracted by the instrumentation layer of the
probes are sent to the Probe Dispatcher (Section 4.2.3). There are three
event handlers In the probe dispatchers corresponding to method
invocation, instance creation and instance deletion. Others can be added to
process other lifecycle events, for example such passivation or activation.
Each of the handlers' default behaviour is to generate a COMPAS JMX
notification and dispatch It to the client listeners using the JMX
Infrastructure. Additionally, the invocation handler uses extensible alert
detection strategies (Section 6.4) to detect potential performance hotspots.
In addition to the basic alert-detection strategies (absolute value and
relative, see Section 6.4), an input FEP, the alert FEP, allows third parties to
add more complex implementation of alert-detection strategies. An example
is an alerting algorithm that takes into account the history of the calls and
workload information to reason about potential performance problems. Such
an algorithm has been developed and integrated with COMPAS [21] in a
project related to application adaptation using component redundancy
[23][22].
The behaviour of each dispatcher event handler can be extended to
accommodate custom requirements. This extension point, the probe-
handier output FEP can be used for instance to enable server-side
enterprise logging functionality. Therefore, by leveraging the COMPAS probe
insertion technology, third parties could avoid writing their own logging
component-hooks.
The JMX event dispatcher layer used by the probes emits the appropriate
JMX notifications (see Section 4.2.4 for the list of default COMPAS
notifications). If the probe-handier FEPs are used, custom JMX notifications
can be emitted as well, as required by the additional logic.
4.4.3 List of FEPs
This section presents a complete list of the predefined COMPAS Framework
Extension Points. The list Is divided into client-side and server-side FEPs.
Client-Side FEPs
• Client-Handier: can be used to add additional JMX handlers,
corresponding to custom JMX server notifications: used by the default
COMPAS implementation for Invocation, creation, deletion, update and
70

alert events (Section 4.2.3); can be used to add more handlers for
events such as activation and passivation of beans; this FEP is
illustrated In the middle layer in Figure 4-14
• Event-Consumer: can be used to add additional client-side processing
logic of COMPAS monitoring events: used by the default COMPAS
implementation for the graphical consoles, the Interaction Recorder
(Section 6.3) and the centralised Alert Manager (Section 6.7); potential
added functionality Includes data-mlnlng logic for determining anti
patterns or IDE integration; this FEP is illustrated in the bottom layer In
Figure 4-14
Server-Side FEPs
• Instrumentation: can be used to add alternative instrumentation
capabilities to replace the current probe Insertion process that is based
on code-generation; JVM-level bytecode instrumentation technology
(Section 5.2) can be used to insert the monitoring probes, as illustrated
in the bottom layer of Figure 4-15
• Time-Stamping: alternative time-stamping strategies can be used in
order to obtain variable precision time-stamps (Section 4.3.2);
COMPAS uses a platform-specific strategy and a platform independent,
less precise strategy; other strategies such as software/hardware
techniques can be added, as illustrated in Figure 4-15
• Alert: can be used to add additional anomaly-detection logic in the
probes (Section 6.4); COMPAS uses the threshold based strategy;
strategies involving complex workload-dependent anomaly detection
logic could be added
• Probe-Handier: if additional target information is provided by the
monitoring probes (for instance by using JVM-level hooks), custom
probe handlers can be added to the probe dispatcher (the middle layer
in Figure 4-15; this FEP is used by default handlers for invocation,
instantiation and deletion; in addition to adding other handlers for
different events, all handlers can be enhanced to provide common
functionality such as a consistent enterprise-logging strategy for
storing all events in a remote database
71
4.5 Vertical and Horizontal Integration
COMPAS is built on an open architecture that facilitates extension of its
functionality through Framework Extension Points (FEPs) (Section 4.4).
The term vertical integration in respect to a COMPAS FEP is used to refer to
the capability to add information sources or consumers at different layers of
the information flow in which the FEP participates.
The term horizontal integration in respect to a COMPAS FEP refers to the
capability of adding more information sources or consumers at the same
layer of the information flow in which the FEP participates.
Information flows and Information flow layers are presented as columns and
rows in Figure 4-16 which illustrates both the horizontal and the vertical
extension capabilities by presenting Integration options in a two-
dimensional space. The vertical axis traverses different Information flow
layers. The horizontal axis corresponds to information flow types. The
central row in the chart is occupied by the COMPAS Core Monitoring
Infrastructure. This contains the most basic functionality of COMPAS, in
particular the distributed event collection and processing infrastructure (the
monitoring probes, the monitoring dispatcher and the communication
infrastructure). There are six information flow layers depicted in Figure
4-16. Three layers ( + 1, +2 and +3) are above the core monitoring
infrastructure level, and three are below (-1, -2 and -3). There are nine
information flow types depicted in Figure 4-16. Four flow types (A, B, C and
D) are above the core monitoring infrastructure level, and five are below (E,
F, G, H and K).
72

F. . L E GEND
Custom .______ _Producer / Consumer Default Consumer
DefaultProducer / Consumer Ü Default Producer
Figure 4-16. Vertical and Horizontal Integration
The client-side of the monitoring infrastructure is represented by the area
above level 0, and is mostly involved in data collection, while the client-
side, represented by the area below level 0 is mostly involved in data
processing.
The elements in Figure 4-16 correspond to information producers or
consumers participating in the COMPAS information flow types. There are
four types of elements:
• the default consumer is a COMPAS provided element that can only
receive and process information, such as a data analyser
73

• the default producer is a COMPAS provided element that can only
produce and send information, such as an event generator
• the default producer / consumer Is a COMPAS provided element that
can produce and consume information
• the custom producer / consumer Is a third-party element that provides
custom functionality. There are no custom consumer or producer
elements in Figure 4-16 as for Illustrating purposes they can both be
represented by the custom producer / consumer.
Horizontal integration is Illustrated In Figure 4-16 by elements situated in
the same Information flow layer. Vertical integration is illustrated by
elements situated at different information flow layers and in the same
information flow type. Note however that information flow types In the
client area and information flow types In the server-side area, are not
directly related. For instance, there is no direct correspondence between
information flow types B and F.
Level 0 contains, in addition to the core monitoring infrastructure, a custom
producer / consumer element. This Illustrates the possibility to extend the
monitoring Infrastructure core In order to add more core functionality. For
Instance, a different processing and relaying mechanism for COMPAS
notifications can be added In cases where the monitoring dispatcher does
not provide adequate functionality.
Levels +1 and -1 contain COMPAS default producers and consumers
respectively, corresponding to the basic monitoring dispatcher and
monitoring probes' functionality. Elements in level +1 dispatch COMPAS-
level events, while elements In level -1 receive server-side information and
dispatch it to the monitoring dispatcher.
The following eight information flow types exist in the COMPAS
infrastructure:
• Client flow type A: composed only of COMPAS default elements, no
vertical extension is possible. A default consumer In level +2 processes
the information from level 1. An example of flow type A is the COMPAS
graphical console. The console could be extended horizontally, by
adding more GUI elements in level +2.
• Client flow type B: the default consumer / producer element in level +2
allows vertical integration with a custom element in level +3. Default
74

processing takes place in level +2 but more functionality can be added
by a third party. Examples: the Interaction Recorder can generate UML
models (level +2) and can be extended by modules that read the UML
modules and perform further processing (level +3); the logging
mechanism of COMPAS stores monitoring events (level +2) but further
processing of the log files can be performed for data mining purposes
(level +3).
• Client flow type C: there is no default processing of level +1
information and the custom consumer / producer in level +2 provides
all the required functionality. For instance, a different, complex
COMPAS GUI can be added, or a different alert handling mechanism
could be provided at the client side.
• Client flow type D: corresponds to the custom extension at the core
infrastructure level. Consumer / producer functionality must be
provided for information generated by the extended Infrastructure.
• Server flow type E: composed only of COMPAS default elements, no
vertical extension is possible. A default producer in level -2 generates
the information captured and processed by level -1. An example Is the
default portable instrumentation facility, which uses generated code to
insert hooks in the target components. This facility can be extended
horizontally by adding more instrumentation capabilities but not
vertically by using lower-level information sources such as the JVM.
Note that if the default Instrumentation is extended horizontally, such
extensions can be then extended vertically, as in information flow type
F.
• Server flow type F: A custom producer / consumer can generate
Information for level -1. An example Is a different instrumentation
mechanism or an extension of the instrumentation mechanism
available in COMPAS. For instance, JVM-level hooks can be used
Instead of portable generated hooks, In order to extract runtime data
from the target system (e.g. method invocation or instance creation
events).
• Server flow type G: default and custom producer / consumers in level -
3 can be used to send information to the default consumer / producer
in level -2. A typical example of this type of information flow is the time
extraction functionality (Section 4.3.2). Custom time extraction
75

strategies and default time extraction strategies can be used to
generate timestamps which are sent to the probe instances that in turn
forward the complete invocation data objects to the probe dispatcher.
• Server flow type H: default and custom producer / consumers in level -
3 can be used to send information to a custom consumer / producer In
level -2. A typical example of such an information flow is the alert
generation functionality (Section 6. 4.2). Default and custom
invocation-event producers send Information to customisable alert-
generatlon strategies. Third-party providers can transparently add
alert-generatlon strategies (in level -2) without affecting the
functionality of elements in level -3.
• Server flow type K: corresponds to the custom extension at the core
infrastructure level. Producer / consumer functionality must be
provided to generate information for the extended infrastructure.
76

4.6 Monitoring Infrastructure Summary
Chapter 4 described the functional goals, architecture and design of the
COMPAS monitoring infrastructure. The structure and functionality of the
monitoring probes and the monitoring dispatcher were presented.
Monitoring probes are server-side entities attached to each target
component and they communicate using a management layer with the
client-side monitoring dispatcher.
The COMPAS Framework Extension Points can be used to enhance and
reuse the monitoring infrastructure. Examples of extensions are the time
stamping FEP, or additional monitoring events listeners.
77

Chapter 5 Insertion of Probes
Portable insertion process
Component metadata used to generate the probes
Alternative probe insertion: dynamic bytecode instrumentation
78

5.1 Inserting the Monitoring Probes
COMPAS instruments component-based applications without making
changes to their source code. In addition, COMPAS does not employ
changes to the runtime environment to support instrumentation. The
instrumentation is performed by a "proxy layer" attached to the target
application through a process called COMPAS Probe Insertion (CPI).
5.1.1 COMPAS Probe Insertion Process Description
The CPI process examines the Target Application's structure and uses
component metadata to generate the proxy layer. For each component in
the target application, a monitoring probe is specifically generated based on
the component's functional and structural properties.
The CPI process leverages deployment properties of contextual composition
component-frameworks [97] to discover and analyse target applications.
Therefore, CPI is conceptually portable across component frameworks such
as EJB, .NET or CCM.
The following metadata is extracted and used to generate a monitoring
probe for a target component:
• Component Name (bean name, for EJB)
• Component Interface (Java interface implementing the services
exposed to clients, for EJB)
• Locality (local or remote, for EJB)
• Component Type (stateless session, stateful session, entity or
message-driven, for EJB)
• Component Interface Methods (Java methods in the business interface,
for EJB)
• Component Creation Methods (ejbCreate(...) methods, for EJB)
Using the Probe Code Template (PCT) and the extracted metadata, the CPI
process generates one probe for each Target Application Component. The
placeholders in the template are replaced with the values extracted from
the metadata. The following is a listing of the PCT written in the Velocity
Template Language [5].
• * TrJ s is 5 f.fe ate f'.-r ofc:: * r.rt r.e .• •• u.r a c- • E • r.t COMPASt-roxies
79

i .'hr- tcnp ait* i p a r k e d . ¡ vio . •_ •'•.l-ocr ■ ' ■ %C.ii v ,1 rci ar y|i h ; i. p : / / . * 1*»?^’ e . o ' - . j / ' - e ' C > yV
package $package;
import javax.ejb.CreateException; import javax.ejb.EJBException; import javax.ejb.EntityContext;
import edu.dcu.pel.compas.monitoring.proxy.*;
$modifiers class _COMPAS_$target_class extends $target_class {S . . . ... | . . . - i T r* ’ l * y - . * I t t - L C i , . . r , . ,. .* *. 1 C/ » 1 i ■ L *v \i . •. r*-z U lifiN*: / t* '*5 1 ) J
$G\'±Q# t*-J -.O * L .
private Proxylmplementor proxylmpl = new Proxylmplementor( "$appserver_name", "_COMPAS_$target_class", "$id_name", "$bean_type" ) ;
#if( $bean_type=="entity" )
public void setEntityContext(EntityContext ctx) throws EJBException {
super.setEntityContext( ctx ); proxylmpl.postSetContext();
}
public void unsetEntityContext() throws EJBException {
super.unsetEntityContext(); proxylmpl.postUnsetContext();
}
#end
#foreach( $creator in $allCreateMethods ) #set( $returnType = $creator. getReturnType () .getName() )
public $returnType $creator.getName() ($generator.getParameterDeclarationList($creator) )$generator.getThrowsList($creator) {
proxylmpl.preEjbCreate();#if( $returnType != "void" ) $returnType returnValue
= #end super.$creator.getName()($generator.getParameterCallingList($creator) );
proxylmpl.postEjbCreate();#if( $returnType != "void" ) return returnValue;
#end
}
#end

#foreach( $method in $allBusinessMethods ) #set ( $returnType = $method. getReturnType ( ) . getNameO )
public $returnType $method.getName() ($generator.getParameterDeclarationList($method) )$generator.getThrowsList($method) {
proxylmpl.preMethodlnvocation();#if( $returnType != "void" ) $returnType returnValue
= #end super.$method.getName()($generator.getParameterCallingList($method) );
proxylmpl.postMethodlnvocation( "$method.getName()") ;
#if( $returnType != "void" ) return returnValue;#end
}#end
Figure 5-1 illustrates the entities involved in the CPI process. Each Target
Component (TC) is identified after parsing the Enterprise Target
Application's metadata. After examining the TC, COMPAS generates the
proxy layer that will be attached to the TC. The proxy layer is an
instantiation of the Proxy Code template, using the TC metadata values.
Figure 5-1. CO M PA S Probe Insertion
The proxy layer (probe) is a thin layer of indirection directly attached to the
TC (see Section 4.3.1). To fulfil its instrumentation functionality, the Probe
employs the Instrumentation Layer that has the capability of processing the
data captured by the Probe and performing such operations as event
81

notifications. The Instrumentation Layer uses the COMPAS Probe Libraries
for implementing most if its logic.
A Modified Component (MC) results after the CPI process has been applied
to a TC (see Figure 5-2), and this will enclose the original TC. In addition, it
will contain the Probe and Instrumentation Layer artefacts. In order to
ensure a seamless transition from the TC to the MC, the CPI transfers the
TC metadata to the MC, The MC metadata will only be updated so as to
ensure the proper functionality of the proxy layer (e.g. for EJB, the bean
class property must be updated to indicate the Probe class).
business original
'
proxy layer
Figure 5-2. Modified Component Containing the Proxy Layer
5.1.2 The CPI Process in J2EE
As the COMPAS prototype has been implemented for the J2EE platform, the
COMPAS CPI process implementation follows the J2EE characteristics. The
following steps describe the process of inserting COMPAS probes into a J2EE
Application.
1) The Target Application's EAR file is analysed and all the EJB jar files extracted.
2) For each EJB jar file, the deployment descriptor is parsed and, for each declared
EJB bean,:
a) The corresponding declarative metadata (bean name, bean interface, locality -
remote or local, bean type - session, entity or message driven, bean class) Is
extracted.
b) Java Reflection operations are performed on the bean interface to extract all
the business methods.
c) Java Reflection operations are performed on the bean class to extract all the
ejbCreate methods
82

d) The Velocity [5] engine is used to generate the Probe code by instantiating the
Probe Code Template with all the extracted values.
e) A new bean class is generated, the Probe, which inherits from the original bean
class and performs the instrumentation operations. In addition, the Probe
forwards all invocations to the original bean class.
3) The new bean classes (Probes) are packaged in the modified jar file together
with all the original classes that already existed in the original jar file. The
deployment descriptor is modified as to include the updated entries for the bean
class fields that will now point to the Probe class.
4) All the modified jars are packaged into a new EAR file. The required shared
COMPAS Probe Libraries are also packaged into the EAR.
5) The new Modified Enterprise Application EAR is ready for deployment into any
J2EE application server.
5.1.3 COMPAS Probe Insertion Process Code Example
An example of the resulted probe code (part of the MC) from the CPI
process follows:
package com.sun.j2ee.blueprints.creditcard.ejb;
import javax.ejb.CreateException;import javax.ejb.EJBException;import javax.ejb.EntityContext;
import edu.dcu.pel.compas.monitoring.proxy.*;
public abstract class _COMPAS_CreditCardEJB extends CreditCardEJB {
private Proxylmplementor proxylmpl = new Proxylmplementor("JBOSS", "_COMPAS_CreditCardEJB", "CreditCardEJB", "entity" );
public void setEntityContext(EntityContext ctx) throws EJBException {
super.setEntityContext( ctx ); proxylmpl.postSetContext();
}
public void unsetEntityContext() throws EJBException {
83

super.unsetEntityContext(); proxylmpl.postünsetContext();
}
/ / b h o i ' - c r ' f.1r *. ? jt'C tue !•■
public java.lang.Object ejbCreate ( java.lang.String valueO, java.lang.String valuel, java.lang.String value2 ) throws javax.ejb.CreateException {
proxylmpl.preEjbCreate(); java.lang.Object returnValue = super.ejbCreate(
valueO, valuel, value2 );proxylmpl.postEjbCreate (); return returnValue;
}
public java.lang.Object ejbCreate ( com.sun.j2ee.blueprints.creditcard.ejb.CreditCard valueO ) throws javax.ejb.CreateException {
proxylmpl.preEjbCreate(); java.lang.Object returnValue = super.ejbCreate(
valueO );proxylmpl.postEjbCreate(); return returnValue;
}
public java.lang.Object ejbCreate ( ) throwsjavax.ejb.CreateException {
proxylmpl.preEjbCreate(); java.lang.Object returnValue = super.ejbCreate(
) ;proxylmpl.postEjbCreate(); return returnValue;
}
public com.sun.j2ee.blueprints.creditcard.ejb.CreditCard getData ( ) {
proxylmpl.preMethodlnvocation();com.sun.j 2ee.blueprints.creditcard.ejb.CreditCard
returnValue = super.getData( ) ;proxylmpl.postMethodlnvocation( "getData" ); return returnValue;
}
public java.lang.String getExpiryYear ( ) {
proxylmpl.preMethodlnvocation(); java.lang.String returnValue =
super.getExpiryYear( );proxylmpl.postMethodlnvocation( "getExpiryYear" ); return returnValue;
}
public java.lang.String getExpiryMonth ( ) {
84

proxylmpl.preMethodlnvocation();java.lang.String returnValue =
super.getExpiryMonth( );proxylmpl.postMethodlnvocation( "getExpiryMonth" ); return returnValue;
}
} _______________________________________________________
The code example above shows the result of the CPI process when applied
to one of the components (CreditCard EJB) of the Sun Java Blueprints
Petstore Application [88].
5.1.4 The CPI Process Using JSR771
This section discusses an alternative mechanism for extracting the
metadata needed by the CPI process. It does not require access to the EAR
file containing the Target Application. In contrast, it employs server
introspection based on an open standard for application server management
[84]. Although the current COMPAS prototype does not currently use this
mechanism, the implementation is available and can be used as an
alternative strategy. It is highly .probable that similar mechanisms to the
one presented here will be available for other component-based runtime
platforms such as .NET or CCM. As COMPAS monitoring operates internally
with more abstract concepts than EJBs, it is possible that by marginally
adapting the CPI process to a different component platform (e.g. .NET), the
same benefits can be obtained as for EJB.
The process of extracting the deployment structure of the target system by
using JSR77 is illustrated in Figure 5-3. It is based on widely available
technologies that are either recently standardised or are in the final stages
of standardisation. This makes the process compatible with a large variety
of operating environments. The following steps are taken:
1 Based on work performed during the author's internship in Sun Microsystems
Laboratories (July 2003 - November 2003, Mountain View, CA). As part of the
author's internship work on the JFIuid Project
(http://research.sun.com/projects/jfluid), EJBs as well as Web artefacts such as
Servlets and JSPs were processed for instrumentation. Similarly, this chapter takes
into account both EJB and Web modules, as supporting all types of components
consistently is one of the COMPAS goals.
85

1) The deployment Information made available by the JSR77 management model is
parsed (a JMX query is sent to the JSR77 compliant server). This results in a set
of J2EE applications that have been deployed in the target application server.
Using JSR77, the deployment structure of the J2EE applications residing in the
target server can be obtained.
2) For each J2EE application, a query for all its associated modules (EJB JARs or
Web Application Archives (WARs)) is sent to the JSR77 compliant JMX server.
3) For each module (Web or EJB), the deployment descriptor is obtained using the
JSR77 attributes available for each J2EE element. The deployment descriptor is
an XML document required by the J2EE specification and contains deployment
information for each J2EE element. For EJBs, it contains such information as the
bean classes, type of bean (e.g. entity, session, message-driven) and required
services such as security and transactions. For Web modules, it contains the
name of the Servlet class or, for JSPs, the file name containing the JSP code.
4) Using the JAXB [87] framework, the deployment descriptor for each J2EE module
is parsed and the list of the corresponding EJBs or Servlets is obtained, together
with their associated information. JAXB [87], the Java Architecture for XML
Binding provides an abstraction layer for working with XML files. Developers need
not work with XML parsers and their low-level events and objects, such as a text
node In an XML document. Instead, they use an object model of the XML
document and the standard Java object collection APIs to deal with containment
hierarchies. For COMPAS, this would ensure a smoother integration with the
internal object model of the J2EE applications, as the mapping of information
from the XML deployment descriptors to the internal J2EE deployment hierarchy
is more direct and the mapping code easier to maintain and understand.
5) For each J2EE component, it is important to know the "business methods" which
implement the logic. The business methods are the Java methods which are
written by the developers and which implement the application logic. The
discovery of these methods is realised through Java Reflection, a standard
mechanism to inspect Java classes. The same operation is performed for the
existing Servlets, as It is important to determine which of the two possible HTTP
handler methods (GET or POST) Is used.
6) By using knowledge about the container-generated artefacts, it is possible to
determine which container classes correspond to the EJB or JSP currently
inspected. The EJB Object class name for a particular EJB can be determined and
86

can be later used In the instrumentation stage. For JSPs, using knowledge about
the web container behaviour, It is possible to determine the name of the class
implementing the JSP code, when it is compiled at run-time, thus allowing it to
be instrumented. Although COMPAS does not currently support dynamic
bytecode instrumentation, a prototype tool that does has been designed and
implemented (see 5.2). Integration with COMPAS is feasible as the
instrumentation layer can be realised at lower levels with bytecode
Instrumentation, instead of source code generation.
7) This step is optional: if knowledge about the container-generated artefacts is not
available, the instrumentation will proceed by targeting the developer-written
artefacts (the bean classes for EJBs, and the Servlets, however the JSPs will not
be monitored). This results in less information being collected as the container
services cannot be measured.
8) Finally, the collected information is stored in the Internal object model, which can
be later used by the COMPAS instrumentation.
Figure 5-3. Using JSR77 to Extract J2EE Deployment Data
87

5.2 Instrumenting J2EE Applications Using
JVM Profiling
This section presents an alternative method for inserting the monitoring
probes2. It uses the JFIuid dynamic bytecode instrumentation technology
[27][28] and can be integrated with COMPAS using a server flow type F
extension point (Section 4.5), the instrumentation FEP (Section 4.4.2).
The proposed method (implemented as a prototype tool) enables dynamic
insertion and removal of profiling code. A graphical console has been
implemented (separately from the COMPAS monitoring console) to allow
direct control of instrumentation and data collection operations.
The profiling tool can attach to a running application server (currently only
Sun ONE Application Server [96] instances), inject instrumentation code in
the target components (EJBs, Servlets), collect, and aggregate the JVM
performance data corresponding to these entities.
When instrumentation is no longer required, the instrumentation code can
be removed dynamically from the application server and the application
continues to run unaffected. This operation does not preclude the use of
adaptive monitoring techniques (Chapter 6) for overhead reduction.
Instead, it is used when there is either no further need for performance
management or else when it is critical that the target application runs
completely unaffected.
The dynamic bytecode instrumentation approach has two main advantages
over the default COMPAS Instrumentation approach, based on portable,
high-level probes. Monitoring probes can be dynamically inserted and
removed from the running application, without the need for application
2 Based on work performed during the author's internship in Sun Microsystems
Laboratories (July - November 2003, Mountain View, CA). As part of the author's
internship work on the JFIuid Project (http://research.sun.com/proiects/ifluidy a
J2EE monitoring tool was developed that used dynamic bytecode instrumentation
techniques to transparently inject monitoring code into J2EE applications running on
the Sun ONE Application Server. Most parts of the tool have been transferred into a
Sun Microsystems enterprise performance-management product.
88

redeployment. By default, COMPAS Induces varying degrees of overhead
(depending on the monitoring scheme) in target applications. Using
dynamic bytecode instrumentation, COMPAS can be extended to support
dynamic Insertion and removal of instrumentation logic in certain parts of
the target application, leading to the capability of completely removing
overhead In certain parts of the target application. This extension can be
achieved by using the instrumentation FEP (Section 4.4.3).
The second advantage of the dynamic bytecode instrumentation approach is
that information about the performance of container services can be
obtained from the instrumented container generated artefacts, since any
class can be instrumented at runtime. This can help in determining whether
performance hotspots originate in business logic or in configuration
parameters driving the behaviour of container-provided enterprise services.
5.2.1 Instrumentation Levels
Using dynamic bytecode insertion, two instrumentation levels can be used
and dynamically alternated:
Complete top-level instrumentation: a high level, low-overhead,
Instrumentation operation across the entire target J2EE system can help In
quickly identifying the potential performance hotspots. This capability is
implemented in the prototype tool and It Is used when developers choose to
perform a complete top-level profiling operation of the target system. This
instrumentation level is similar to the default portable instrumentation
capability of COMPAS, which can extract data only from methods exposed
by component interfaces.
The top-level profiling mode has a significantly lower overhead than the
recursive instrumentation mode described below and is therefore
appropriate for obtaining an overall performance profile of the entire
system. Section 5.2.2 gives a more detailed description of the top-level
instrumentation mode.
Using the dynamic bytecode injection technique described in [27][28], the
top-level instrumentation code is inserted into the running J2EE system,
without the need for a server restart. This is a completely transparent
operation, making it particularly useful in production environments.
89

Developers can choose to view performance metrics associated with J2EE
elements at any level In the hierarchy. For Instance, they can see how much
time is spent in servicing a particular EJB method, or they can see how
much time is spent servicing all the methods of a particular EJB or indeed
an entire application.
Starting with a top-down approach, developers can see which application
takes the most resources; they can then browse the hierarchy and
understand which modules In the application generate the performance
problem; the browsing process can continue until the leaves (EJB methods
or Servlet / JSP handlers) are identified. These features can be accessed in
the prototype tool based on JFIuld, and are not part of the COMPAS
graphical console. However, similar functionality Is available in COMPAS
with the exception that the COMPAS consoles assume the existence of a
single target J2EE application, and not an arbitrary number of J2EE
applications, as the JFIuid-based prototype does. Another difference Is the
lack of support for web-tler components in COMPAS, which focuses on the
EJB tier.
Partial in-depth instrumentation: When a set of hotspots has been
identified, developers can choose to initiate the recursive instrumentation
process for all the methods contained in the set. For example, if the set
contains an EJB, all Its business methods are selected for recursive
instrumentation. If the set contains an entire J2EE application, all the
methods corresponding to all the EJBs and all the HTTP handlers
corresponding to all the Servlets and JSPs In the application are selected for
recursive instrumentation.
The results obtained from the recursive Instrumentation can help in focusing
the search for the origin of the performance problem Identified using the
top-level Instrumentation. Call-graphs with EJB and Servlet / JSP methods
as roots can reveal the causes for poor performance at the J2EE level.
These causes can vary from internal business logic problems to bad
configuration of container services.
This instrumentation level is essentially a refinement of the top-level
instrumentation level. While top-level Instrumentation offers a system-wide,
shallow performance profile, in in-depth instrumentation a narrow subset of
the system is examined in detail. The functionality of the in-depth
90

instrumentation level can be accessed In the prototype tool based on JFIuid,
and are not part of the COMPAS graphical console. However, using the
COMPAS FEPs, this functionality can be easily migrated or replicated to
COMPAS.
5.2.2 The Instrumentation Mapping
This section describes the process of mapping the high-level component
constructs to the level at which the dynamic bytecode instrumentation
operates. Upon selection of different J2EE elements for Instrumentation, the
tool must generate lower level Instrumentation events that eventually result
in the dynamic bytecode instrumentation code being Injected Into the
appropriate classes.
When instrumentation is required for Java Servlets [95], the Intent is
translated into an instrumentation event for the corresponding doGet or
doPost handler of the Servlet. The correct handler is determined in step 3
of the JSR77-based discovery process (Section 5.1.4).
For JSPs [94], instrumentation Is performed for the container-generated
class which will implement the JSP code. For Sun ONE AS [96], this class is
HttpJspBase and the implementing method is _jspService.
For EJBs, based on their deployment descriptor, the container generates
classes implementing the two interfaces (EJB Object and EJB Home)
(Section 2.1). Clients of an EJB component will work with references of
these container generated objects. After creating or finding an EJB instance
using the EJB Home object, clients will call methods on the EJB Object
implementation, which ensures that the required services are provided for
the calling context, before dispatching the call to the actual bean class
instance (Section 2.1).
When selecting EJBs for instrumentation in the J2EE view, the tool must
map such actions to instrumentation events for the appropriate class of the
EJB. The EJB Object implementation class Is the appropriate location for the
instrumentation bytecode because its methods wrap the bean-class
Implementation methods with the required services. For each method
methodX from the bean class, there Is a corresponding method methodX In
the EJB Object implementation. The latter will contain calls to different
container services in addition to the call to the bean class methodX. This
91

applies in general to most J2EE application servers and in particular to Sun
ONE AS.
If the tool is used in an environment where the container generated classes
are not known (i.e. with an unsupported application server), the only
classes that can be Instrumented are the Servlets and the EJB bean classes.
This results In the JSPs and the EJB container services not being
instrumented, which Is similar to the default portable Instrumentation level
available in COMPAS.
To address this issue, the dynamic bytecode instrumentation tool will
expose an external API that will allow third parties to develop connectors for
other application servers. The connectors would consist of sets of classes
and methods corresponding to container services, in a standard format, as
required by the tool.
In top-level instrumentation, only the EJB, Servlet and JSP methods (or
container-generated artefact methods where appropriate) selected for
Instrumentation (the instrumentation roots) are instrumented. Subsequent
calls from such a method to non-root methods are not considered for
dynamic bytecode instrumentation (as would be the case with recursive
Instrumentation [27][28]). This leads to a low-overhead profiling scheme
suitable for finding potential performance hotspots at a high-level. After
performing top-level instrumentation, performance results can be collected
and displayed. Each J2EE element has an associated performance data
structure, which aggregates the performance results (average execution
time, number of invocations, percentage of execution time) for its contained
elements. For example, the percentage of time spent in the element
represents the sum of all the percentages of its Included elements. An EJB
for instance will show the percentage of time spent in all of Its methods. A
J2EE application will present a percentage that includes all the percentages
of is Web and EJB modules which In turn contain all the percentages of their
JSPs, Servlets and EJBs.
Let us consider the following sample call-graph representing an EJB
business method calling two other EJB business methods.
92

Table 5-1. Top-level call graph
EJBl.methodX
-> EJB2.methodY
EJB3.methodZ
Using top-level Instrumentation, the only instrumented methods will be
methodX, methodY and methodZ.
When searching for the root cause of a performance problem observed at
the top-level, a deeper understanding of the call patterns that comprise the
context of the performance problem Is useful. Therefore, observing the
detailed call trees of each of the root methods can be particularly useful
when the methods that are Instrumented belong to the container-generated
artefacts. These artefacts have complex infrastructure logic that augments
the business logic of the bean class.
In this case, the recursive instrumentation technique presented in
[27][28] is used. Considering the top-level sample call-graph in Table 5-1,
its corresponding recursive instrumentation call-graph would contain the
elements presented in the call graph from Table 5-2 (for a simplified
hypothetical scenario).
In real scenarios, the call graph in Table 5-2 is more complex, as each of
the container services can have a complex calling tree associated. The
display of such call-graphs can reduce the time needed to understand the
origin of a performance issue: an EJB run-time entity can perform poorly
because of bad configuration choices for container services or because of
bad business logic, or a combination of both.
Understanding where the problem originates (container or business logic) is
crucial in adopting a strategy for solving it. If it is a container induced
overhead, tuning the configuration parameters (for example the
transactional attributes for a method) could solve it. If it is a business-logic
implementation problem, understanding the context it occurs in might lead
to a decision to alter the design (for example adopting a suitable J2EE core
pattern [18]).
93

Table 5-2. In-depth call graph
EJBl.methodX
Container, preinvoke
Container.securityCheck
EJB2.methodY
Container, preinvoke
Container.securityCheck
Container, postlnvoke
EJB3.methodZ
Container, preinvoke
Container.securityCheck
Container, postlnvoke
-> Container, postlnvoke
5.2.3 Usage Example and Results
A prototype of the proposed tool has been built and It currently supports the
Sun ONE Application Server. EJBs and Servlets are currently supported. The
following screenshots obtained from the running tool illustrate the process
of finding a performance problem In a J2EE system (here the "samples"
domain of the Sun ONE Application Server).
The first step illustrated In Figure 5-4 completes when the tool has attached
to the J2EE application server and obtained the deployment structure of the
existing applications, together with all the required information for the J2EE
elements.
94

JFIuid: Dynamic Profiling ToolFile Run Profile Instrument J2EE Profiling Help
Souice code and Selected Methods | CPU results | Memory lesults \ J2EE Profiling
3 Bun ONE AS <<? C 3 J2EE Application: jdbc-simplf
<5> (Z3#ser/er/jtibc-simple
Q SeivletGreeterDBSer
Q Servlet GreelerDBLog
9 C!] jdbc-slnipleEJb.jar
®- [ 3 EJB jdbc-simpls
9 C 3 J2EE Application: rml-slmpie
//serverirml-llop-simple
9 C3 rml-stmpleE)b.)ar
9 Q EJB RMIConverlerApp
Q public abstractjav
0 public abstractJav
Figure 5-4. Sample J2EE deployment structure
After performing the second step (complete top-level instrumentation) the
user identifies a potential performance bottleneck and decides that in-depth
instrumentation of a particular EJB is needed (in this example, the
Converter EJB).
After selecting the doiiarToYen business method for in-depth
instrumentation, interactions with the system are performed and
performance results are collected.
In Figure 5-5, the results collected when performing full recursive
Instrumentation of the selected method are displayed. Note that although
the user selects the doiiarToYen method of the Converter bean to be
instrumented, the tool selects the corresponding method from the
container-generated artefact, the EJB Object wrapper implementation of the
Converter bean. This results In the container services being captured in the
call graph, giving the user more information about the execution context of
the bean.
[ Infuimatian Performance Results
RM IConverterApp e je
Type: remote session bean EJB Class: samples.rml.simple.ejb.ConverterBean Home Interface: samples.rmi.slmple.eJb.ConverterHome Business interface: samples.rmi.siinple.ejti,Converter
{ Number of Business Methods: 2
95

J riijid : Dynamic Profiling Tool t- ilflJH f]
F i le g u n Profile In s t ru m e n t J 2 E E P ro f i l in g H e lp
Source coite and Selected Methods C P U lesults Memoiy lesults J2EE Profiting
0 M e t 110(1 g r o u p C P U i « s u i t s T o r t h r e a d M t p 8 0 9 Q - P r o c a s s o r 4 ■ ( to ta l p u r e a b s o lu t e t im e 4 .5 3 m s ) ■ ( t o t a l p u r e t h r e a d C P U t im e 1 0 .0 m s ) C Î
l_ j 100,0% • 3 Inv • samples.rnusimple,ejb.Conver1erBean_EJBObjectlmpl.dollarToYen(Lj3va/ma1WBIgDeclinal;)LJava/nnatWBisDeclmal, ■ [0 54(
C 3 62 4%- 3 Inv - com.sun.ejb.cDntain9rs.BaseContairier.prelnvoke(Uom/sun/ejb,NnvocallDn;)V- [0.158 net ms. - 2.82 total net ms) - (0.000 r
9 O 43 4% - 3 Inv. - com.sun.ejb.contalners.BassContaii-<er.autl-iortee(Uom/surVe)Wlnvocation;)Z- [0 782 net ms. -1.86 total net ms] - (0,06
9 C 3 25.6% - ,3 Inv, - com.sun.snterprlse.security.applicatlan EJBSecui1tyManager.aulhDrize(Uom/sun/enlerpriseiAulhorKationConte>tt;
®" £ 3 12 8%- 3 inv.- com sun.enterprise sccuntif ipplicatton EJBSecutllyManagorselPollcyCoiiloxKUava/langfSUlngjIjaYaflanii/Sl'if
» C 5 4 1 % - 3 Inv. - com.sun enterprise security,provider Polic\Wiapperlmplies(U3va/secuillyiProlecltonDomaln.liava/securltY/Pefm
Q 3,3%- 3 Inv. - corn sun.enterpiise.seCLirlty application EJBSecurityManager getCachedProtecltonDomatn(l.|3va/util/Set;Z)Ll3va/i
» C 3 1 3% - 3 Inv. - com sun enterprise securlty.application.EJBSecurltyManager lesetPollcyContertttjava/langfSliing.Llavanans/Strir
Q 0 8% - 3 inv, - corn sun.enterprise securltf.SecurltyContext getCurrentQLcomfeun/enterprise/securiWSecurltiContext; - W 036 m
Q 0.7% - 3 Inv. - com sun.enterprise.securttfauthortea.PollcyConlexlHandlerlnipl tielHandleiDataouomfsun/entaiprlsefsecunlv/e
Q 0,0%- 3 inv. - com sun.enterprise,securlty.SecurityCoritext.getPrlnclpalSet0Ljava/utll/3el,- [0 001 net ms, - 0.001 total nel ms|
©■C3 0.5%- 3 inv,- com sun enlerprlse.secuntyAulhorlzatlonComextlmpl gsllnstanceOLcorn/sun/enlerprlse/AulliorlzallonContext, - ¡0.00
9 C 3 71% ■ 3 inv. - com.sun.ejb,containers BaseContaIrier.pmlnvokeTx<Lcom/sun/ejb/lnvoca1ion;)V- [0.074 net m s.-0.323 total net ms] - (0
© ■ O 2 8% - 3 Inv, - corn.sun.enterprlse distribuletibi.J2EETransactionManagerlmpUsNullTransactionOZ- [0 041 net ms - 0.126 total pel
©- C 3 2.6% - 3 inv, - comsun.enlerprise.distributedlx J2EETransactionManagerOpt.getStatus0l - 10 072 nel ms. - 0,119 total net ms] - (0.C
O 0.1%- 3 inv. - com sun.ejb containers,BaseContainer gBtT)£A1tr(LcoinisunfejWlnvoca1ion;)l - [0.004 net ms, - 0.004 total net m s]-(0.
C *C 3 4 ,9% - 3 inv. - com.sun.enlerprise.utII-lnYacationManageilmpl.prelriVoke(Lcom/suitfenterprise/Componentlnvocation;)V-10.186 net ms.
®" (Z3 3.5% - 3 inv. - com.sun.ejb.conlainers.BaseContamer.getConterttLcom/suri/ejWlnvocation^Lcom/sunfeib/ComponentConrexI,- [0.042
$ □ 116% • 3 Inv. - com sun.enterprise iecuritySetuntyUiii iunMethoil(Llava)lann;ieflect>Method;L|ava/lano/Obiecl.lLlava/lanyOblei:l;L<om/sm
■ -■
[ 3 Accumulateti nel lim e per method tur (liread littp8090Pracessor 4 (total o f 49 methods, 315 Jnvocalfons) tzf
17,3% - 3 inv, - com.sun,ejb.container« BaseContainer*uìhorize(Uom/sun/ejb/invocallQn;)Z- [0 732 net ms] • (0.000 netms) E11 8%- 3 inv. - sampies rmi,sinopie eJb.Converter8ean_EJBObiedlmpi,dollarToYen(Ljava/math/BlgDecìmal;)Ljava/math/8lgOecimal;- [0.540 ne<|il 8.9% - 27 Inv,- com sun.enterprise.securify.proYicfer PolicvWrapper.ìmplies(L]ava/sacuritv/PiotectionDomain;Ljava/security/Permission;)Z-10.40 6.8% -12 inv, - com.eun.enterprise.security.applicalioriEJBSeeurit^anagsr re3e1PolicyCùntexi(Ljava/ìangi3tring:Ljava/larig/8tring;)V- [0.398 nei 5,8% • 3 inv - com-s(jn,enlarprise.secimly.3pplic alioiì.EJBSac(.iiitiManager,floA5Privlleged(Ljava;iecunlyiPrìvllegeclExce(rtiohActionJL|wì/lartgfC 4.1% - 3 inv com.sun enterprise.util,lnvocalionWanaflerlmpl,pr®lnvoke(Uom/sun/enterprise/Comporienllnvoc9lion;)V- [0,186 nel ms] - (0,000 r 3.9% - 3 inv, * ctm.sun.enterpnse,u1il.]nvocatlonManageilmpl,postlnvcke(Uam/suritenteiprise/Componen1lnvocatlon;)V-10.177 net ms] - (0.000 3.5% - 3 inv. - com sun.ejb .eonrtalnsrs.BassComainet, prelnvoke(Lcom.<sun/ejbilnvocation,)V- [0.158 net ms]- (0 000 netms)3.3%- 3 Inv • com.sun enterpri$e.securlty.applica1ion.EJBSecuriìyManagerge1CachetiProtectìonDomaln{ljava/ulil/Set;Z)L)avaisecuiily/Prole<tioi 2.6% - 6 Inv. • com sur,en1arprise,distributadt>!,J2EETiansactionManagerOpt gelStatusQI -10 119 net ms] - (0.000 net ms)2.5% - 3 inv. • com.sun.enterprlse.securlty.application.EJBSecuntyManager authorlzefUom/suntenlerprise/AuthoiIzatioriConlexOZ- [0.114 net m 2.4% - 6 inv. • com.sun enterpNse.secutily.SecurìtyConlexl.setCurientQUDm/sun/enteriirìseisecurlty/Seci.irityConlex1; - [0,110 net ms] - (0 000 ne 2.1%- 27 inv - com.sun.enlerprise sscurilyprowderPolicWVrapper getPollCjiConflgForCont6xt(UaYa/lang/Slring;)LconVsun/enterprlse/securlty/pi 1.8%- 3 inv. - com.sun jtspl.Interceptortmpl.isTxCMNullOZ- (0,081 rie tm sl- (0,000 netms)
1.7%- 6 Inv. - com.sdn.enterprise.distribulee)teJ2EETransactlonManafleilrnpl.gelStatusOi-10.075 netms] - (0 ,000 netms)1.6%- 3 inv,- com.sun.ejb eontainers.BaseCoiita!nerprelnvokeTx(Lconi/si,in/e)b/lnvocalion;!1/- [0.074 rietm sl - (0.000 nel ms)1.5%- 3 inv - com.sun e)li.containers.u1il.pool.NonBlockingPijol,g8tOb|ect(Liav3flangiObÌ8Cl;)LJava/lang/Obiect;- [0.087 netms] - (0.000 netms)1,4% - 3 Inv - c o m .s u n .e n te rp n s e ,s e c u i it y .S e c u i it iU ll l . r u n M e th o d ( L ja v a / ia n B ir e t le c tM o th o d ;L la v ii/ la n B / O b ] 8 c U lJ a v a / la n g ;O b ] e c t ,L c o m / s u n ie jW C o
i.3% - 3 inv - c o m sun.ejb containers BaseContainei.postlnvoke(Lcoinrsun/ejWlnvocation;)V- [0.059 netms] - (0 000 netms)1 2% -1 5 inv, - com sun.enlerprtse security provider PolicyConflgiiraUoriFaclorytmpI gelPollcyCOnfiauratlonlmpl(L)avanaii(|/Sliing;)Uorrt/s«n/anl< 1,2%- 3 inv - com sun.ejb containers Sla1elessS8SsionContaInei.releaseConl8Xt(Lcom/sun/ejbJlnvocatIon3V-10,053 netm s]- (0.000 net ms) 1.1% - 3 inv -_com sun.ejb conUìlneis StatelessSess ionConlamer, aetContext(Lcom/sunfeib/lnvocatlon.)Uom)sunfeiWComponeniConleiil: - IQ.i " " - . . . . ^ .
TargetApp Status: Active, Running___________________________________ Instrumentation: Method group. 375 methods
Figure 5-5. In-depth instrumentation of selected EJB methods
Experiments have been performed to determine the overhead the tool
Incurs when used to Instrument J2EE applications. The Sun Petstore [88]
sample application was chosen for experiments due to its wide-acceptance
and relevance. Two of the most common interactions In the application, a
browsing interaction and an account update interaction were analyzed.
The browsing interaction consists of a sequence of web pages that the user
typically follows when looking for a product. The account update Interaction
consists of account retrieval and update pages followed by an action to save
the new data on the persistent storage.
The test environment was composed of Sun ONE Application Server 7
Standard Edition, running on a Sun E420R server with four 450MHz
96
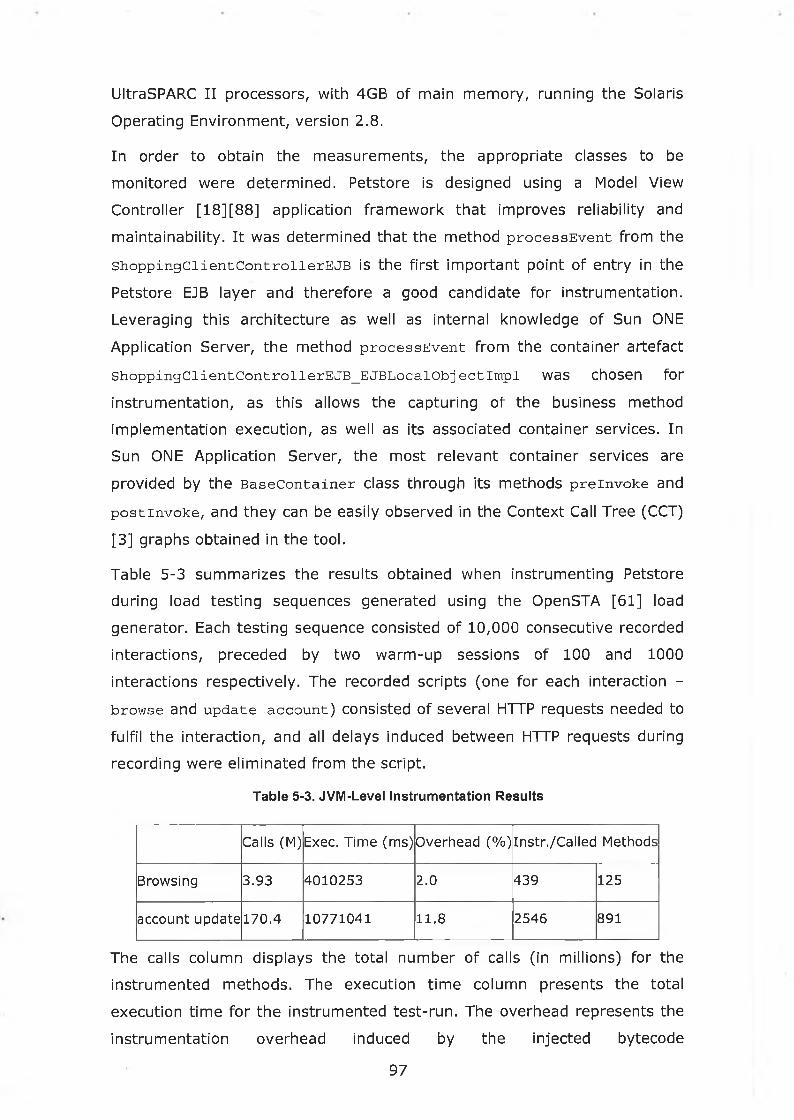
UltraSPARC II processors, with 4GB of main memory, running the Solaris
Operating Environment, version 2.8.
In order to obtain the measurements, the appropriate classes to be
monitored were determined. Petstore is designed using a Model View
Controller [18][88] application framework that improves reliability and
maintainability. It was determined that the method p r o c e s s E v e n t from the
s h o p p i n g C i i e n t C o n t r o l i e r E j b is the first important point of entry in the
Petstore EJB layer and therefore a good candidate for instrumentation.
Leveraging this architecture as well as Internal knowledge of Sun ONE
Application Server, the method p r o c e s s E v e n t from the container artefact
S h o p p i n g C i i e n t C o n t r o l i e r E J B _ E J B L o c a l O b j e c t l m p l was chosen for
instrumentation, as this allows the capturing of the business method
implementation execution, as well as its associated container services. In
Sun ONE Application Server, the most relevant container services are
provided by the B a s e C o n t a i n e r class through Its methods p r e i n v o k e and
p o s t i n v o k e , and they can be easily observed In the Context Call Tree (CCT)
[3] graphs obtained in the tool.
Table 5-3 summarizes the results obtained when instrumenting Petstore
during load testing sequences generated using the OpenSTA [61] load
generator. Each testing sequence consisted of 10,000 consecutive recorded
interactions, preceded by two warm-up sessions of 100 and 1000
Interactions respectively. The recorded scripts (one for each interaction -
b r o w s e and u p d a t e a c c o u n t ) consisted of several HTTP requests needed to
fulfil the Interaction, and all delays induced between HTTP requests during
recording were eliminated from the script.
Table 5-3. JVM-Level Instrumentation Results
Calls (M) Exec. Time (ms) Overhead (%) Instr./Called Methods
Browsing 3.93 4010253 2.0 439 125
account update 170.4 10771041 11.8 2546 891
The calls column displays the total number of calls (In millions) for the
Instrumented methods. The execution time column presents the total
execution time for the instrumented test-run. The overhead represents the
instrumentation overhead Induced by the injected bytecode
97

instrumentation; it was obtained by comparing the response times in the
instrumented system with the response times in the non-instrumented
system. The last two columns show the number of instrumented methods
and the number of methods actually executed (called at least once) as part
of the test run.
The overhead is acceptable considering the fact that all the called methods
were instrumented (excepting the ones In the Java core classes). Having
such call graphs can prove particularly useful as they cover the entire J2EE
stack (from the component level to the container services) and can help
discover the reasons for performance degradations. Note that the overhead
induced when performing only top-level instrumentation used In system
wide performance scanning is negligible. The results presented in Table 5-3
apply only when further investigations are required and in-depth
instrumentation is selected.
98

5.3 Probe Insertion Summary
Chapter 5 presented the procedure used by COMPAS to insert monitoring
probes in target applications, the COMPAS Probe Insertion (CPI) process. It
uses component metadata to extract essential deployment information
needed to generate the probes. This guarantees that the insertion process
is portable across different platforms.
In addition, a JVM-level instrumentation approach that can offer an
alternative to the COMPAS probe insertion process was presented. This
approach can be integrated in COMPAS using the instrumentation FEP.
99

Chapter 6 Adaptive Monitoring and
Diagnosis
Automatic alert detection based on user-definable policies
Models are used to drive the monitoring target coverage
Automatic focusing of monitoring probes on performance hotspots
Collaborative approach to adaptation using inter-probe collaboration
Centralised approach to adaptation using global model knowledge
Automatic Diagnostics based on model knowledge
Rich semantics in diagnosis from user-recordable interactions
100
6.1 Introduction
COMPAS provides a monitoring infrastructure that uses monitoring probes
to instrument components in target applications.
In order to minimise the monitoring overhead imposed on the running
application, the target coverage can dynamically change at runtime. This
adaptation process is based on the ability of probes to be switched into
active and standby monitoring states.
Diagnosing the performance problems in an interaction involves identifying
the particular components that are directly responsible for performance
degradation observed by multiple components participating In the
Interaction.
The monitoring adaptation process is related to the diagnosis process
because the target coverage profile is directly dependent on the distribution
of diagnosed performance hotspots. The activation and deactivation of
monitoring probes are correlated with positive and negative diagnosticatlon
of performance Issues by the probes.
This chapter proposes two adaptation-and-dlagnosls schemes that both aim
at reducing the monitoring overhead and discovering the origins of
performance problems in the target systems.
The first scheme employs collaborative decision-making processes between
the monitoring probes. By communicating with each other, probes can
automatically detect the origins of performance problems and can switch
themselves Into standby and active states as necessary.
The second scheme involves a centralised approach in which the diagnosis
and adaptation processes are coordinated by the centralised monitoring
dispatcher. Probes do not have a high degree of independence and rely on
control commands from the monitoring dispatcher to switch into standby or
active states. In addition, the monitoring dispatcher discovers the source of
performance problems by performing analysis on the alerts received from
the probes.
The main difference between the collaborative and the centralised decision
schemes lies in the degree of probe independence mapping to CPU and
101

bandwidth overhead attributed to the probes and dispatcher; the
advantages and disadvantages of both schemes follow the effects of this
difference. In the former, more communication occurs between the probes
that also use more CPU time and this may not be applicable In highly
distributed, low-cost deployments. On the other hand, less communication
occurs between the probes and the dispatcher and less processing takes
place In the dispatcher; this favours the case of a remote dispatcher
running on a slow machine with a poor network connection, possibly over
the Internet. The latter scheme targets the opposite scenario where EJBs
are heavily distributed across nodes and the dispatcher runs on a powerful
machine connected to the application cluster via high-speed network.
102

6.2 The Need for Modelling
COMPAS adopts a model based adaptation methodology for reducing the
overhead of monitoring. In COMPAS terminology, a dynamic model (or
model) consists of the monitored components (EJBs) and the dynamic
relationships (interactions) between them. Each interaction is a set of
ordered method-calls through the EJB system, corresponding to a business
scenario (or use case) such as "buy an Item" (Figure 3-5) or "login". The
UML representation of an Interaction is a sequence diagram.
Models are essential In reducing the monitoring overhead without the risk of
missing performance hotspots in the system. If no models have been
obtained for an application, all components must be monitored in order to
Identify a potential problem. In contrast, when the interactions are known,
It is sufficient to monitor the top-level components for each interaction.
The following example illustrates the need for models In reducing the
monitoring Impact.
Figure 6-1 shows a system with four EJBs, where no model is known. In
order to be able to capture any potential performance problems, monitoring
would have to be active for each individual EJB.
Figure 6-1. Model Information Not Available
In contrast, the Illustration in Figure 6-2 shows the same system with the
added model knowledge, in this case one interaction involving all four EJBs.
103

Figure 6-2. Model Information Is Available
In the above-represented interaction, EJB 1 is the top-level component.
Considering the calls between components as synchronous (i.e. the caller of
an EJB will be blocked until the EJB finishes executing the call), all the
performance degradations in any of the four EJBs will be observable in EJB
1. In the example, if EJB 3 exhibits an execution time increase, this increase
will be measured in EJB 1 as well. All calls in EJB systems with the
exception of messages sent to Message Driven Beans are synchronous. It
can be observed that in the case where the dynamic model is known, the
only EJB that needs to be instrumented in order to detect a performance
decrease is EJB 1. This represents a 75% reduction of monitoring overhead
for the presented scenario. For complex, long running systems, a significant
overhead reduction is possible using adaptive monitoring.
Theses models can be generated using the interaction recorder, which is
described in section 6.3.

6.3 Obtaining Models: Interaction Recorder
COMPAS uses non-intrusive probes to extract method execution events
from the running application. It then orders the events into complete
interactions by using time stamps collected by the probes. During training
sessions, developers "record" the required scenarios (such as "buy a book")
by going through the required steps in the system while the interaction
recorder obtains and stores the generated data. They can then visualise the
interactions in automatically generated UML sequence diagrams. This
approach has the advantage that the recorded interactions directly mirror
business scenarios in the system and therefore the monitoring adaptation
process can be based on the system design and has good chances of
indicating the meaningful context for potential problems. To overcome clock
synchronisation and precision issues in multi-node heterogeneous
environments or even on locally deployed applications, the interaction
recorder instructs the probes to induce a custom artificial delay into the
target methods, thus guaranteeing the order of the received events.
6.3.1 Interaction Recorder Functionality
The COMPAS Interaction Recorder provides the functionality of extracting
and ordering method invocation events from the COMPAS Monitoring
Framework. It uses the event-consumer client-side FEP (Section 4.4.3) in
order to be able to consume method invocation events processed and
dispatched by the COMPAS Monitoring Dispatcher. Figure 6-3 illustrates the
main functional elements of the Interaction Recorder.
105

The Interaction Recorder uses the Model Sequencer to coordinate the
ordering of received invocation events into interaction models (stored in the
form of interaction trees). The default state of the Model Sequencer is the
off mode. Developers can record execution models by switching the
sequencer in the recording mode.
In recording mode, the sequencer receives and stores processed invocation
events from the monitoring probes via the Monitoring Dispatcher. The data
carried by the invocation events includes the invoked method ID, invocation
start time and invocation end time. An important consideration in the
recording process is that simultaneous interactions are not allowed in order
to facilitate the extraction of the interaction trees. The sequencing process
commences when the user decides to terminate recording mode. The
following steps are executed as part of the sequencing process:
106

1) The data set containing the stored method invocation events is ordered in the
ascending order of the method invocation start timestamps (i.e. methods that
started execution earlier are placed at the beginning of the data set).
2) Parsing the method invocations data set for each method 8 the list of methods
preceding it in the sorted data set is analysed to find a possible enclosing
method. As illustrated in Figure 6-4, method (p encloses method 8 only in
situation c) where the start and end time of method 8 are included in the interval
created by the start and end time of method cp.
start (p end
Figure 6-4. Enclosing Methods
3) If an enclosing method cp is found that satisfies the case presented in Figure 6-4
c), then method 8 is added as a child to method cp in the interaction tree that
represents the recorded interaction model.
The sequencing process uses method invocation timestamps recorded by
the monitoring probes. For methods with considerable execution times (in
the order of hundreds of milliseconds or more), time measuring imprecision
is not an issue as containment relationships can be observed easily. For
methods with small execution times, however, the method duration might
be reported as 0 ms because of the inherently imprecise Java time API [40].
When more methods report a duration of zero and an identical starting
time, it is impossible to determine their sequence precisely. To overcome
this deficiency, the probes can introduce an artificial delay into their target
components. Users can select a delay value (in ms) to be induced in the
executing target components' methods. The probes are instructed to induce
the delay when the state of the Model Sequencer is changed into recording
mode. When the state is reverted to the off mode, the probes are instructed
to reset the induced delay to zero in order to remove the effect on
application functionality in normal operating conditions. This mechanism
ensures that the target application is artificially slowed down only for the
period of interaction recording and does not require the server to restart or
107

the application to be redeployed when resuming its normal operational
status. This mechanism is however not required when high-precision
timestamps can be obtained (Section 4.3.2).
The output of the sequencing process is the interaction tree, which is a data
structure that corresponds to the recorded call sequence. Caller methods
(that call other methods) will be represented as the parent nodes of the
nodes representing the called methods. All the leaves of this tree are
methods that do not call other methods. Determining the methods that call
other methods is realised using the above-mentioned determination of
enclosing methods.
The interaction tree is represented visually by the Interaction Recorder, as
shown in Figure 6-3. In addition, interaction models can be saved to
physical storage using the XML format. This enables future processing of the
saved interaction models by the adaptation process (Section 6.5) as well as
by the UML sequence diagram generator. In addition, the interaction models
can be used by third party processes that require an understanding of the
runtime behaviour of the enterprise system.
The Document Type Definition (DTD) [107] file for an interaction is
presented in the code snippet below:
<?xml version=" 1. 011 encoding="UTF-8"?><!ELEMENT interaction (call+)><!ATTLIST interaction
name CDATA #IMPLIED ><!ELEMENT call (call+)><!ATTLIST call
ejb CDATA #REQUIRED method CDATA #REQUIRED timestamp CDATA #REQUIRED duration CDATA #IMPLIED>
Based on this DTD, XML files containing the inter-component calls for each
interaction in the system can be produced. Each XML file corresponds to
exactly one interaction.
Figure 6-5 presents a collaboration diagram depicting a sample scenario in a
fictional e-commerce environment that is the addition of an item to a virtual
client-shopping cart. The UML notes attached to the elements of the
diagram contain performance annotations as standardized by the UML
Profile for Performance [60].
108

« P A s te p » A L E R T ^ {scenProb=0 7,PAdemand ={'msr','mean'.(3000 ,'ms'))}
« P A s te p » ^ {PAdemand=('msr7 mearï.(2900,'ms'))}
1: addltenr ShoppingCart
« a c to r» Web Form
1.1: chéckPrice-^ Inventory
1.1.2: processDiscount^« P A s te p »{PAdemand=('msr7 mean',(100 ,'ms'))}
« P A s te p » A L E R T {PAdemand=(,msr','mean'.(2400,‘ms'))}
« P A s te p » ^ {PAdemand=('m sr'.'mean'^SOO, 'ms'))}
^1.1.1: checkAvailability
« D a ta b as e»GenericDB
Warehouse
1.1 1 1: updateWarehouseDB"0 -
Figure 6-5. Sample Use Case
The following code snippet presents the addltem interaction as recorded by
the COMPAS Interaction Recorder.
<?xml version="l.0" encoding="UTF-8"?><!DOCTYPE interaction SYSTEM "interaction.dtd" >■«interaction name= "Adding an Item to the User Shopping Cart"> ccall ejb="ShoppingCart" method="addltem" timestamp="0" durât ion="3 0 0 0">ccall ejb="Inventory" method="checkPrice" timestamp="50" duration="2 900" >ccall ejb="Warehouse" timestamp="12 0" method="checkAvailability" duration="2500">c/call>ccall ejb="CRM" timestamp="2700" method="processDiscount" duration="100">c/call></call>c/call>c/interaction>
6.3.2 Advantages & Disadvantages
The main advantage of the Interaction Recorder approach is that the
developers conduct the recording processes themselves, therefore
associating business semantics to the recorded interactions. This increases
the likelihood of understanding perform ance problems in their business
context.
109

If the interactions were automatically recorded at runtime, without
developer intervention, they could contain method calls that are irrelevant
for understanding the origins of performance problems. This issue could be
exacerbated in the case of complex interactions where isolating the
performance hotspots is especially sensitive to identifying the appropriate
execution context.
One of the disadvantages is that for interactions that the developers have
not recorded, no information is extracted for presentation in UML or for the
adaptation processes.
Other disadvantages of this approach are that interactions can only be
recorded during training sessions in "clean" environments where developers
have total control of the system; and the process does not support multiple
concurrent interactions. The reason for this limitation is related to the
inability to associate and order events corresponding to a particular
interaction, when multiple interactions are executing.
With this approach, a trade-off is made between the static, more
semantically rich Interaction Recorder approach and the dynamic interaction
discovery of other, more intrusive approaches such as VisOK [50] and Form
[77]. VisOK [50] uses a modified RMI compiler to insert instrumentation
code in the RMI client stubs in order to extract execution traces. The traces
contain calls between distributed objects but they do not provide
component-level information because the approach is not targeted at
component-based platforms. When dealing with EJB components, VisOK
suffers from the same conceptual mismatch as all other JVM level profiling
tools such as [65] and [30]. Similarly, the Form [77] framework can
generate UML execution models from object interaction traces, by using JVM
instrumentation. It poses the same problems as VisOK and it does not
provide deliberate support for distributed interactions.
The COMPAS Interaction Recorder benefits from component-level semantics
and inherently supports distributed calls since the probes are attached
directly to the remote EJBs. In addition it does not mandate any changes to
the JVMs or application server implementations.
110

6.4 Generating Alerts: Detecting
Performance Anomalies
6.4.1 Detection
This section presents a simple means of detecting anomalies in the
performance data collected by COMPAS proxies. This is not intended to be
an exhaustive discussion of the methods for performance anomalies'
detection, but rather as an example of how it could be done. The detection
of performance anomalies is the basis upon which the alerts are raised;
however, the exact means to detect anomalies accurately is out of the
scope of this section.
Let us consider an internal data buffer present in each COMPAS proxy. It
can be a stack-like structure of collected execution times for each method in
the target EJB of the proxy. An illustration of such a stack is presented in
Table 6-1.
Table 6-1. Sample Collected Data Buffer
Execution
ime(ms)
3
2
46
52
54
Method
m
221
230
233
2209
2350
2345
Each column marked Method x (1 <= x <= m) represents the execution
time history for one of the methods in the target EJB. Each row represents
111

the performance data associated with a recorded method-call event. The
first non-greyed row contains the last recorded execution data for each
method. In the example below, Method 2 has one less recorded call than
Method 1, which has n-recorded executions.
Note that the actual implementation of the call stack might consist of
several one-dimensional arrays of recorded execution times, one for each
method, rather than one single multi-dimensional array, as Table 6-1
suggests.
In the example, the last recorded execution of Method 1 is highlighted to
emphasize the fact that it is considered a performance anomaly. One of the
simplest ways to detect an anomaly such as the one illustrated, is to
consider performance thresholds for each method.
The thresholds for a method can be:
• Absolute: at any time, the execution time t for the method must not
exceed X ms, where X is a custom value.
• Relative: at any time, the execution time t for the method must not
exceed the execution the nominal execution time N of the method by
more than a factor F times N, where F is a custom value. Nominal
execution time is a loose term here; it can denote the execution time of
a method in a warmed-up system with a minimal workload for
example.
• Arbitrary complexity: at any time, the execution time t for the
method must satisfy the relationship:
a) t < f(k); f : {0, 1, 2, ... n-1, n} -> Q, where
i) k is the discrete event counter, increasing with each
method call, 0 < k < n
ii) n is the size of the buffer
iii) Q is the interval of acceptable performance values (e.g.
execution times)
iv) f is the custom "acceptable performance" function
mapping the current call (with index k) to an acceptable
performance value (e.g. execution time) and it can use
the previous history of the method's performance.
112

In the example illustrated by Table 6-1, a relative threshold set to 3 times
the nominal execution time of 50ms yields the nth execution of Method 1 as
a performance anomaly.
The historical call data (the internal data buffer) in the proxies can be used
to make complex associations about detected performance anomalies. For
instance, the monitoring dispatcher (which in case of alerts receives the
buffers from the proxies regardless of the adaptive management model) can
correlate performance anomalies from different proxies and infer causality
relationships. In addition, it can correlate such data with workload
information in the system or database information in order to make
associations that are more complex.
Anomaly detection has been approached by the research community and
there is a significant body of work in particular for intrusion detection
systems. Such systems typically use a combination of access-control and
resource utilisation policies in order to detect potential threats [72]. Other
systems use state transition [39] or call-stack [32] analysis to determine
the occurrence of potential intrusions. COMPAS provides the mechanism to
include anomaly detection policies that work optimally for particular
environments. The alert FEP (Section 4.4.3) in combination with other input
FEPs (Section 4.4) can be used to enforce complex policies that take into
account several data sources. In addition, since anomaly detection
techniques can impose significant overhead [52], such logic can be added at
the client-side by using output FEPs (Section 4.4.1) and executed
asynchronously.
6.4.2 Design and Customisation
The design of the anomaly detection logic, presented in Figure 6-6, supports
the addition of external strategies through the alert FEP (Section 4.4.2).
COMPAS provides the basic infrastructure to be used by such strategies by
enforcing communication and structural rules.
113

forwards events
«uses»
«MBean»ProbeDispatcher
+ alert ( )
«uses»
ProbeService Locator
«creates»
stores and sends
MethodExecutionsHistory
0..1«interface»
Anoma ly DetectionStrategy
+ methodlnvoked ( )
\
i
«inspects»
«creates»/
' ' If«strategy» «strategy» «strategy»
AbsoluteValueStrategy RelativeStrategy CustomStrategy------- -—_ ---------------- .. - ■ ---- ... -
«creates»
at any time, the execution time t for the method must not exceed X ms, where X is a user-defined value.
at any time, the execution time t for the method must not exceed the nominal execution time N of the method by more than a factor F times N, where F is a user-defined value.
Figure 6-6. Design of Anom aly Detection Logic
The probe dispatcher handles each invocation received from the probe
instances. It stores the invocation data in a M e t h o d E x e c u t i o n s H i s t o r y
114

instance, corresponding to each method of the target component
corresponding to the probe dispatcher instance. The execution history is a
circular buffer of a customisable size. In addition to containing the execution
times for each method invocation (see Section 6.4.1), it stores the total
number of invocations since the instance was created, as well as the overall
average execution time for the entire lifetime of the instance. The method
history object is sent to the appropriate anomaly detection strategy, for
each method invocation. This is a high-performance operation, as the probe
dispatcher and the anomaly-detection strategy instance are co-located in
the same JVM, and the history object is passed by reference. If, for the
method currently being executed, an alert is detected by the strategy in
use, a description of the alert must be returned. In order to determine the
strategy that must be used, the probe dispatcher uses the
ProbeServiceLocator factory, which returns the required strategy.
The use of the strategy pattern [34] facilitates the exposure of the alert FEP
(Section 4.4.3) which can be extended with custom alert-generation logic
from third-party providers. In addition to the history of method executions,
such plug-ins could take into account physical resource usage and workload
information when identifying non-linear performance values.
115
6.5 Model Based Adaptation: Overview
In order to reduce the total overhead of monitoring component-based
applications, the use of adaptive monitoring techniques is proposed. This is
aimed at maintaining the minimum amount of monitoring at any moment in
time while still providing enough data collection to identify performance
bottlenecks.
Adaptive monitoring probes can be in two main states, illustrated in Figure
6-7: active monitoring and passive monitoring (or stand-by monitoring). In
the former, probes collect performance metrics from their target
components and report the measurements to the monitoring dispatcher.
The second state defines the light-weight monitoring capability of probes as
it employs much less communication overhead. When monitoring passively,
probes collect performance metrics and store them locally. In this case,
measurements are not sent to the monitoring dispatcher unless a
performance anomaly has been detected (Section 6.4), or the local storage
capacity (the monitoring buffer) has been depleted. When the buffer
capacity is exceeded, the probes send only a summary of the data in the
buffer, which can be store at the client-side for future reference. The
summary includes the total number of invocations of each of the methods
and an average response time. Therefore, the operation of sending data
occasionally to the dispatcher is inexpensive.
116

Figure 6-8 presents an example with several components in an application,
each enhanced with the proxy layer (the probe).
i»
IIII
active stand-by call
Figure 6-8. Dynamic Activation of Probes
117

Some of the probes are active and some are in stand-by. The arrows
indicate the calls between the components. The components are organised
into levels of depth considered from the Entry Level (in a J2EE scenario, the
entry level could correspond to the Web components such as Servlets or
JSPs). LI contains components called only from the Entry Level while each
subsequent level contains components called from the previous level only.
The illustration does not depict real components rather it contains
component views. One real component can exist in several different levels,
depending on the interactions in which it participates. Component (p, for
instance, is in both Level 2 and Level 3 since it participates at different call
depths in two different interactions.
Only the components a and |3 in Level 1 have their probes in active
monitoring mode by default. All the performance anomalies in L2 and L3
can be observed in LI, as only synchronous calls are being considered.
Using the collaborative approach (Section 6.6), performance alerts are
transmitted from higher levels to lower levels and the probes corresponding
to the components diagnosed as the problem originators will be
automatically activated. In the centralised approach (Section 6.7), the
alerts will follow the same logical direction (higher levels to lower levels) but
the decision to diagnose and activate probes is the responsibility of the
monitoring dispatcher. In the example, the activated probe in Level 2
corresponds to the 8 component where the performance problem observed
in Level 1 originates.
The COMPAS Probes can be considered as monitoring agents [112] that
have varying degrees of autonomy (Section 6.6.1 and Section 6.7.1).
Probes are able to perceive their environment (by extracting performance
data from their target EJBs). They can respond to changes occurring in the
environment by taking actions such as switching themselves into stand-by
mode or alerting the monitoring dispatcher. The goal of COMPAS probes is
to minimise the monitoring overhead and they take appropriate action to
achieve it (depending on the management scheme - local or centralised).
Finally the COMPAS probes exhibit a degree of collaboration with external
entities (depending on the management scheme - collaborative or
centralised, the proxies can collaborate with each other or with the
monitoring dispatcher).
118

An important note is that the correct functionality of the adaptation and
diagnosis process is directly dependent on the accuracy of the anomaly
detection strategy that is used (Section 6.4).
119

6.6 Collaborative Diagnosis and Adaptation
In the collaborative approach, probes have a high degree of autonomy.
They collaborate among themselves to determine which component is
causing particular performance degradation. Additionally, they decide which
components need to be actively monitored and which components can be
monitored in stand by. The monitoring dispatcher however does not take
any decision with regard to switching probes into stand-by or active states.
6.6.1 Probes as Independent Collaborative AgentsEach probe has knowledge about the neighbouring (upstream and
downstream) probes. In relation to a Probe X, upstream probes correspond
to the EJBs that call the EJB represented by Probe X. Downstream probes
are the probes corresponding to EJBs being called by the EJB represented
by Probe X. Such relationships are illustrated in Figure 6-8 where probes in
lower levels of depth are considered upstream in relation to probes in higher
levels of depth.
The monitoring dispatcher is responsible for sending vicinity information to
all probes. This operation is performed as new interactions are discovered
or recorded. The vicinity information is sent to already existing probes
(corresponding to existing EJB instances) as well as to new probes as they
are being created. Having knowledge of the vicinity information, probes can
collaboratively infer the source of the performance degradation.
120

Figure 6-9 illustrates with an example the communication pathways
between the monitoring probes and the monitoring dispatcher in the
collaborative approach. C l, C2 and C3 are components that have
monitoring probes attached. In the diagram, the components call each other
in the C1-C2-C3 call-path and C3 is responsible for a performance problem.
Rather than each component probe sending alert information to the
monitoring dispatcher, they send alert information to the component higher
in the call-path. Therefore, the alert path is C3-C2-C1, the opposite of the
call path. In the example depicted in Figure 6-9, C3 detects an anomaly in
its execution history. It signals the anomaly by sending an alert to the next
component up-stream, C2. C2 analyses its own execution history and the
alert received from C3 and infers that the anomaly observed in its execution
history is fully caused by the anomaly in C3 that has been signalled through
the alert from C3. C2 passes on the alert to C l, but does not take any other
action. Similarly, C l receives the alert from C2 and infers that the alert
matches the observed performance anomaly fully so decides not to take any
action.
The outcome of the collaboration between the probes is that the only alert
that will be sent to the dispatcher is the one generated by C3.
121
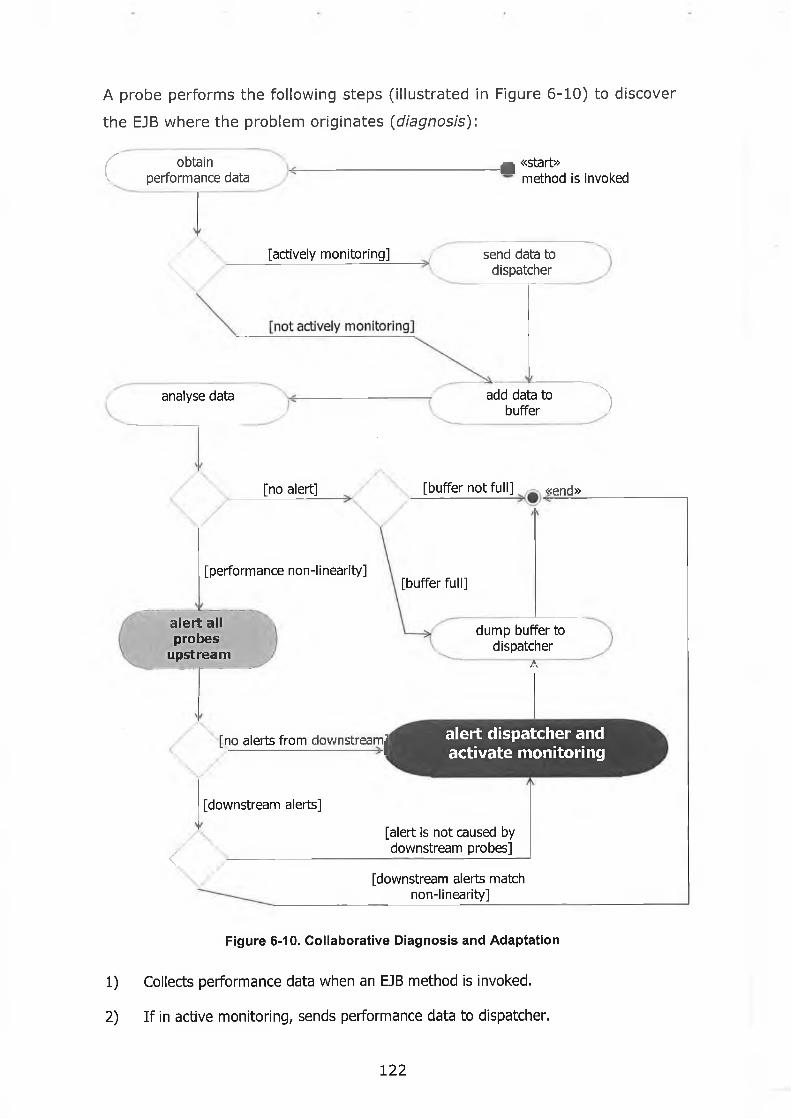
A probe performs the following steps (illustrated in Figure 6-10) to discover
the EJB where the problem originates (diagnosis):
r obtain performance data
^ «start»method is invoked
[actively monitoring] send data to dispatcher
analyse data add data to buffer 1
[no alert]
[performance non-linearity]
[buffer not full] . <<end»
[buffer full]
a lert all probes
upstream
[no alerts from downstreamj
dump buffer to dispatcher
A
alert dispatcher and activate monitoring
[downstream alerts]
<
[alert is not caused by downstream probes]
[downstream alerts match non-linearity]
Figure 6-10. Collaborative Diagnosis and Adaptation
1) Collects performance data when an EJB method is invoked.
2) If in active monitoring, sends performance data to dispatcher.
122

3) Adds performance data to its internal buffer.
4) Analyses the new buffer containing the new data.
5) If there are no performance anomalies (Section 6.4) and the buffer is full, dumps
buffer to the monitoring dispatcher for storage and / or further analysis. Activity
ends.
6) Performance anomalies having been detected, alerts all the probes upstream.
The reason is that the probes upstream can then consider this notification when
deciding whether or not the performance issue originates in one of them or in
other probes downstream from them.
7) If other alerts from downstream have been received (by this probe), it infers that
its target EJB might not contribute to the performance anomaly and activity
jumps to step 8. Otherwise, the only contributor to the anomaly is its target EJB.
In this case, it alerts the monitoring dispatcher of the performance problem;
dumps the local buffer to the dispatcher for storage and further analysis; activity
ends.
8) Since other probes downstream have exhibited performance problems, it must be
decided whether they are completely responsible for the detected anomaly. The
algorithm for taking this decision can be as simple as computing the numeric sum
of the anomalies observed downstream and comparing it to the anomaly
observed at this probe. If they are equal within an acceptable margin, it can be
decided the probes downstream are the only contributors to the performance
issues. The algorithm could be extended to include historical factors (Section
6.4).
9) If the probes downstream are fully responsible for the performance issue the
activity ends.
10) If this probe has a contribution to the performance anomaly, alerts the
monitoring dispatcher and dumps its local buffer.
The procedure for dumping the buffer to the dispatcher involves creating a
summary of the data in the buffer and sending the summary only. The
summary contains data such as number of method executions and average
execution time. This avoids the possible duplication of data received by the
monitoring dispatcher in the case of active monitoring when data for each
method invocation is already sent to the dispatcher before checking for
performance anomalies.
123

6.6.2 Emergent Alert Management and GenerationIn the collaborative approach, probes decide collaboratively which EJBs are
responsible for performance degradations. Information flow between probes
is essential to the decision making process. Although numerous alerts may
be raised by individual probes (in a direct correspondence to the cardinality
of each interaction), only a reduced subset of the alerts are actually
transmitted to the monitoring dispatcher. In this scheme, "false" alarms are
automatically cancelled as soon as the real origin of the performance
degradation is detected. The "real" performance hotspots thus emerge from
the running system due to the collaboration between the probes. This
functionality is illustrated in Figure 6-9 where only the probe corresponding
to component C3 sends an alert to the dispatcher.
6.6.3 Advantages and Disadvantages
The major advantages as well as disadvantages derive from the
collaborative property of this approach.
Potential Advantages:
- The network traffic between the proxies and the monitoring
dispatcher can be significantly reduced, as only relevant alerts and
buffer dumps are sent over the network. In case where the EJB
application and the dispatcher are located on different machines,
the reduced network traffic constitutes an even more significant
advantage.
- Although the network traffic between the proxies can be
significant, typically, most of the EJBs corresponding to a
particular interaction are collocated on the same machine. This
translates into the fact that collaborative messages between
proxies are usually sent locally, thus reducing the total
communication overhead.
Potential Disadvantages:
Since the proxies exhibit significant decision-making capabilities,
their computational overhead can be important. They can
potentially slow down the execution of their target EJBs,
complicating the discovery of authentic performance issues.
124

- In cases where the EJB application is heavily distributed, the
communication between collaborating proxies can become a
source of significant overhead.
- The performance data buffer is sent to the dispatcher only when
full or when an authentic alert is detected. The addition memory
requirements for the performance data buffers can significantly
change the footprint of the EJB application, and can even lead to
important overall performance degradation if total memory
capacity is often reached (and therefore swapping occurs
frequently).
6.6.4 Applicability
Considering the advantages and disadvantages of this approach, the domain
of applicability favours environments having the following properties:
- The client-side of COMPAS (the GUI, storage and centralised
monitoring dispatcher) is remote to the running EJB systems. This
is actually a normal running property of production systems being
monitored.
- Interactions are not heavily distributed (most of the EJB instances
corresponding to the same interaction are collocated on the same
physical machine).
- Memory and CPU resources are not scarce compared to bandwidth
resources.
- The client machine (running the client-side COMPAS) does not
have significant resources available.
125

6.7 Centralised Diagnosis and Adaptation
In the centralised scheme, probes have a smaller degree of autonomy than
in the collaborative scheme. Probes send all the alerts to the monitoring
dispatcher, which is responsible for filtering the alerts, finding performance
hot spots and instructing probes to change their states between active and
stand-by.
6.7.1 Probes as Quasi-Independent AgentsIn this scheme, probes are not collaborative, instead they communicate
only with the monitoring dispatcher. As in the previous scheme, each probe
maintains a buffer with collected performance data and has the capability to
detect a performance anomaly by performing data analysis on the local
buffer. Probes however do not have knowledge about their neighbours and
do not receive alert notifications from downstream probes. Therefore, they
do not have the capability of discerning the source of performance issues
and must report all locally observed anomalies to the monitoring dispatcher.
Dispatcher
Figure 6-11. All probes communicate with the dispatcher
Figure 6-11 illustrates the centralised approach showing the communication
pathways between the monitoring probes and the monitoring dispatcher.
C l, C2 and C3 are components that have monitoring probes attached. In
the diagram, the components call each other in the C1-C2-C3 call-path and
126

C3 is responsible for a performance problem. In the collaborative approach,
probes do not communicate with each other, instead they send all the alerts
to the monitoring dispatcher. In the example, C3 detects an anomaly and
forwards an alert to the monitoring dispatcher. Since C2 calls C3, the C3
anomaly is observed in C2 as well, so C2 sends an alert to the dispatcher.
Similarly, C l will send an alert to the dispatcher upon detecting the
performance anomaly caused by C3. The monitoring dispatcher, using
model knowledge, can order the alerts corresponding to the call trees and
can infer the origin of the performance problem. Both C l and C2 alerts can
be matched to the C3 alert and consequently the monitoring dispatcher
infers that C3 is responsible for the performance degradation and activates
the probe.
A probe performs the following steps (illustrated in Figure 6-12) for
detecting a performance anomaly (Section 6.4):
obtain 'w_performance data
[actively monitoring]
a «start»method is invoked
send data to dispatcher
Figure 6-12. Probe in Centralised Diagnosis and Adaptation
127

1) Collects performance data when an EJB method is invoked.
2) If in active monitoring, sends performance data to dispatcher; activity ends.
3) If in stand-by monitoring, adds performance data to the internal buffer.
4) Analyses the buffer containing the new data.
5) If there are no performance anomalies and the buffer is full, dumps buffer to the
monitoring dispatcher for storage and / or further analysis; activity ends.
6) If a performance anomaly has been detected alerts the monitoring dispatcher of
the performance problem; dumps the local buffer to the dispatcher; activity ends.
6.7.2 Orchestrated Alert Management and GenerationUsing model knowledge (e.g. obtained by the Interaction Recorder Section
6.3) the monitoring dispatcher analyses each alert putting it into its
interaction context. Upon receiving an alert from a probe, the dispatcher
performs the following steps (illustrated in Figure 6-13):
parse the corresponding
interactions
ye
V
V
[no alerts from downstream ]j
[downstream alerts]
[alert is not caused from downstream]
[downstream alerts match non-linearity]
• <«end»
«start» alert received
issue client alert;
activate monitoring
Figure 6-13. Dispatcher in Centralised Diagnosis and Adaptation
1) Parses the interaction corresponding to the probe that has generated the alert
and identifies the downstream probes
2) Checks for any other alerts received from downstream probes

3) If there are no alerts from downstream, the dispatcher infers that the
performance anomaly originates in the EJB corresponding to the probe that
generated the alert. No other EJBs downstream have exhibited a performance
problem; therefore the only contributor to the anomaly is the target EJB of this
probe; sends an alert to the appropriate listeners (e.g. GUI); activates the probe
that generated the alert; activity ends.
4) Since other probes downstream have exhibited performance problems, it must be
decided whether they are completely responsible for the anomaly detected
(Section 6.4) by this probe. The algorithm for taking this decision can be similar
to the one adopted in the collaborative approach (Section 6.6.1, step 8).
5) If the probes downstream are fully responsible for the performance issue, activity
ends.
6) If the alerting probe has a significant contribution to the performance
degradation, sends an alert to the appropriate listeners (e.g. GUI), activates the
probe.
6.7.3 Advantages and Disadvantages
The main difference between the centralised decision and local autonomy
schemes lies in the degree of independence attributed to the proxies. The
advantages and disadvantages of both schemes reflect follow the effects of
this difference.
Advantages:
- The proxies do not collaborate among themselves in this scheme
and this nullifies the overhead of intercommunication associated
with the local autonomy scheme.
- The simple structure of the proxies yields a low computational
overhead in the targeted system, as decision making processes
are moved in the client side. This has the benefit of leaving CPU
resources free in the EJB system to be used by the running
application.
- The amount of performance data stored in the local buffers is
smaller than in the local autonomy scheme, as alerts are raised
more often (they are only filtered at the client side). This frees
memory resources in the target application.
129
- The reduced complexity of this approach makes it easier to
implement.
Disadvantages:
- The communication between the proxies and the monitoring
dispatcher is significant. This can prove costly particularly in the
case of the client machine being remote to the running system.
- The computational resources required by the monitoring
dispatcher increase proportionally with the size of the monitored
EJB application.
- Since the monitoring dispatcher coordinates the transition
between the standby and active monitoring states, the
communication overhead can become important.
6.7.4 Applicability
This scheme is applicable in environments exhibiting the following
properties:
- The client side of COMPAS is run on the same machine as the
EJBs, or they run on different machines connected on a high
speed network.
- The EJBs run in multiple JVMs and there is a high degree of
remoteness associated with the EJB interactions.
- The client-side machine has adequate processing, memory and
bandwidth resources available to run the intensive operations
required by the monitoring dispatcher.
6.7.5 Design of Centralised Logic
The centralised approach to diagnosis and monitoring adaptation employs
significant logic in the client side of the COMPAS framework.
The main entities involved in the provisioning of adaptation and diagnosis,
are presented in Figure 6-14. The CentralisedAlertManager is the main class
and it is responsible for receiving the alerts from the monitoring dispatcher
via the MonitoringEventsListener interface. The
AdaptivelnteractionsController is used as the processor for interaction
models. The interaction models, containing trees of component-method
calls, can be obtained using the Interaction Recorder. A subset of all
130

available interactions can be selected for consideration by the adaptation
and diagnosis process. The selection is performed by the COMPAS user and
is forwarded to the CentralisedAlertManager.
The DiagnosisProcessor is the entity responsible for identifying the origin of
a performance hotspot. It schedules diagnosis operations (DiagnosisTask
instances) that analyse the current and previous alerts and infer the source
of the performance degradation.
Figure 6-14. Centralised Control Entities
Several data-structures are used by the centralised approach in order to
reduce the time needed to compute various tasks. Some of them fulfil a
caching role, by essentially storing pre-processed information for later
retrieval. They are called caching data structures. In addition, other data
structures store associations about the current state of the monitoring
infrastructure. Such structures are called operational data structures. One
of the most important structures stores associations between the monitored
beans and their monitoring states (detailed in the following paragraphs). A
background thread, the BeanStateRefresher thread continuously verifies
and marks the state of each bean. This ensures that active beans that need
not be monitored anymore are switched into stand-by mode after a
predefined active-monitoring-expiration time.
Figure 6-15 illustrates the main data structures and processes used by the
centralised adaptation and diagnosis scheme.
131

Bean State Refresher Thread
// bi l l>b2 l l>b3 II
bn ►
V.--'
Change Bean State
Legend:
always active ® new alert
[771 stand-by (a) old alert
11 [> active no alert
Figure 6-15. Centralised Diagnosis and Adaptation Design Overview
The following operational data structures are used:
Interactions: stores the interactions selected for the adaptation and
diagnosis process. The interactions are stored in a tree format as presented
in Section 6.3. The search for performance hotspots is performed only in
the space of the elements that are part of the selected interaction trees.
This ensures that the activation and deactivation of individual components is
performed only when there exists knowledge about the calling structures in
which they take part.
132

Transient alerts: maps the interaction nodes (component-method pairs)
to alerts that have been received. Each alert indicates the originating
business method, and this association is preserved. The alerts stored in this
structure have a short lifetime as the diagnosis process deletes them upon
inspection. A node can have one of the following two possible associations
in this data structure:
• an alert data representing either the current, new alert or an old alert
that has not been processed yet
• no alert in case there have been no alerts signalled for this node or in
case its transient alert has been deleted after the scanning process of
the Diagnosis Thread.
Bean modes: maps the beans that are part of the selected interactions
with their current monitoring mode. Beans can be found in three possible
modes:
• always active (for beans that are roots in interaction trees). The
number of beans in this state is directly influenced by the target
application architecture. Some applications use front-controllers [18]
which control most of the interactions in the system. In such
applications, the number of always-active beans is relatively small.
Other applications might have a flat architecture, in which case the
number of always-active beans would be higher.
• stand-by (for beans that collect performance data and emit alerts but
do not emit regular performance notifications)
• active (for beans that emit all events - typically beans that have been
found to be performance hotspots and that need to be under constant
observation)
Each mode has an associated number. For always active and stand-by
modes, the numbers are constants. For the active mode, the associated
number indicates how long the bean has been in active monitoring. It is
automatically increased with each iteration of the Bean State Refresher
background thread.
For each alert received from the monitoring dispatcher, the Centralised Alert
Manager must first determine the interaction nodes corresponding to the
source of the alert. Since a business method of a bean may participate in
multiple interactions, all the corresponding interaction nodes are first
133

extracted. The depth level of each node in its interaction is determined. This
is defined as the maximum distance from the node to a leaf in the
interaction tree. The maximum depth level of all the nodes corresponding to
the incoming alert is determined. This is then used as the scheduling index
for the diagnosis process.
The diagnosis process is performed in a new Diagnosis Thread. This thread
is not started immediately after the alert has been received. It is instead
scheduled for execution after a delay in milliseconds that is a multiple of the
scheduling index. The reason for the delay is rooted in the diagnosis process
scanning of the down-stream alerts. As presented in Section 6.7.2, the
centralised alert manager inspects the nodes that are positioned
downstream in relation to the node generating the alert. If the downstream
alerts match the non-linearity presented in the current alert, then the
current alert is ignored and no further action taken. This process involves a
bottom-up scan of the transient alerts data structure for nodes matching
downstream probes of the current alert node. In most cases, the transient
downstream alerts should already be present in the data structure as they
are issued before alerts upstream (due to the nature of synchronous calls).
However, since the alerts are transmitted via the asynchronous JMX
notification model, situations might occur in which downstream alerts arrive
after upstream alerts. In such cases, a bottom-up scan will miss
downstream alerts and possibly identify false positives in the search for
performance problems' origins. The delay used in the scheduling of the
diagnosis task aims to ensure the appropriate sequence in the transient
alerts data structure. Alerts corresponding to leaf interaction nodes are
processed immediately since their depth is zero and there are no possible
downstream alerts. Alerts corresponding to nodes higher in the interaction
trees will have higher diagnosis delays to ensure that all the possible
downstream alerts are received before the processing starts.
The diagnosis process is highly extendable to accommodate for arbitrarily
complex diagnosis algorithms. The default algorithm scans the downstream
alerts for a given alert and if the sum of the execution time increase
signalled by each alert reaches 90% of the increase signalled by the current
alert, it is considered that the current alert must be disregarded as being
134

solely a manifestation of the downstream alerts. Otherwise, the current
alert is considered valid and the corresponding node a performance hotspot.
When the diagnosis module identifies a performance hotspot, it will signal
the Centralised Alert Manager to switch the corresponding component into
the active monitoring mode and update the bean modes data structure. If
the component's previous state was standby, it will be changed into active,
and its counter will be reset. If the previous state was active monitoring,
the state will remain unchanged but the counter will be reset. This ensures
that a bean that has a high rate of anomalies will remain active for as long
as the activity continues.
The purpose of the Bean State Refresher Thread is to continuously run In
the background and update the bean modes data structure. If a bean is a
root bean in any participating interaction, no changes are ever made to its
mode, it will always be in active monitoring. If a bean is in standby
monitoring, no changes are made either, as only the diagnosis process can
decide whether the bean is a hotspot and should be switched to active
monitoring. For an active monitoring state, the refresher thread increases
the associated number that represents the "age" of the bean's active state.
If a bean's active state age exceeds a user-customisable value, the
refresher thread will switch the bean back into the standby mode. This
ensures that beans found as hotspots stay in active monitoring only for a
controllable period after they have emitted the last alert. In the current
Implementation, the background refresher thread is scheduled to perform
its operation every 5 seconds. In addition, the preset age that triggers the
switch into standby mode is 5 iterations. Therefore, after 25 seconds of
inactivity, an active monitoring bean (the bean has not been determined as
being a hotspot for 25 seconds) is switched back into standby mode by the
background refresher thread.
135

6.8 Diagnosis and Adaptation Summary
Chapter 6 presented how model information can be used to provide
diagnosis capabilities and to reduce the monitoring overhead. A non-
intrusive technique for extracting execution models from a component-
based application was described. A discussion about anomaly-detection
techniques and related work were presented together with the possibility to
extend the alert-generation strategies using the alert FEP.
Based on execution models, two diagnosis and adaptation strategies were
proposed. The collaborative strategy involves highly independent probes
that inter-communicate to discover the origins of performance problems.
Additionally, the probes decide when to activate and deactivate themselves.
The centralised diagnosis and adaptation strategy involves a lesser degree
of independence of the probes, which must communicate with the
monitoring dispatcher in order for the infrastructure to discover the origins
of performance problems. The design of the centralised strategy was
presented.
136

Chapter 7 Testing and Results
COMPAS Adaptation Test-bed
COMPAS Implementation Prototype
• Functionality Walkthrough
• Supported Environments
• Functional Tests
Performance Tests
• Different Test Configurations
• Monitoring Overhead
• Advantages of Using Adaptive Monitoring
• Differences in scaling between web container and EJB container
137

7.1 COMPAS Adaptation Test-bed
Framework
COMPAS uses adaptive proxies to monitor EJB applications. This minimises
the total overhead induced by the instrumentation layer and automatically
focuses the monitoring effort at the application "hotspots". This process is
realised by switching individual monitoring proxies "on" and "off" as new
performance hotspots are discovered.
In order to test the adaptation process, a test-bed has been designed and
implemented. The COMPAS Adaptation Test-bed (CAT) consists of highly
customisable and functionally identical test beans cells. All test bean cells
are structurally identical EJBs; in fact, they contain the same Java classes.
The difference between them is their deployment descriptor, which can
contain different values for key parameters (environment entries in the EJB
deployment descriptor). These values drive the behaviour and runtime
footprint of the test bean cell. Test bean cells simulate "real" EJBs by
emulating computational load (CPU and memory overhead) and calling
other test cells, in different calling patterns. No code is required (and
therefore no compilation) when using CAT to create a test-bed. Instead, a
declarative programming approach is taken in which XML tags are added to
the deployment descriptors of the participating test beans.
The emulation parameters controlling the test bean actions are:
• CPU overhead (the integer value representing the number of
repetitions for generating a pseudorandom Gaussian value with mean
0.0 and deviation 1.0)
• Memory overhead (the size of a byte array that will be allocated by
the EJB when it is called)
• First Target EJB (the JNDI name of the first EJB to call)
• Second Target EJB (the JNDI name of the second EJB to call)
A cell configuration contains zero or one for each of the above parameters.
All parameters are optional when specifying a cell configuration. Each test
bean cell can contain any number of configurations. A configuration is
identified by a configuration name and each of the parameters it contains is
138

labelled with the configuration name in order to separate them from
parameters corresponding to other configurations.
Test beans expose a single business method, simulateBusinessLogic(). This
method has a configuration name as a parameter, which it uses to decide
the behaviour it will emulate. For the received configuration name, it will
use the corresponding emulation parameters to generate the appropriate
overhead (CPU and memory) and call the appropriate target test beans.
When calling the target beans, the configuration name is passed on to them
(again as a parameter to simulateBusinessLogic()). This ensures that
adaptation configurations are preserved across all the participants of an
interaction.
It is important that the same configuration names be used for all the test
beans. This guarantees that if the interaction is started with a configuration,
each bean in the interaction "understands" it and therefore can generate
the appropriate behaviour. The planning of a particular test configuration
(e.g. config l) contains the following steps:
• Devise a test interaction (containing the participating EJBs and their
call patterns). Each test-bed interaction can contain any number of
test EJBs.
• Decide on the amount of resource usage each EJB must emulate.
• Write the information in all the deployment descriptors for the
participating EJBs (i.e. each deployment descriptor must contain the
configuration configl with some or all of the parameters configlcpu,
configlmem, configlfirstCalee, configlsecondCalee). Of course, the
value of the parameters corresponding to the configuration in each
deployment descriptor would normally differ between the test EJBs.
Figure 7-1 illustrates a test-bed configuration consisting of 5 Test Beans
(TB). The notes attached to each EJB element contain a simplified version of
the associated configuration parameters. For TB2, there are two
configurations available (they also exist in the other beans but are not
shown). In the first configuration, TB2 will call only TB3. In the second
configuration, TB2 will call both TB3 and TB4.
139

configl: cpu:0, mem:0, caleel:EJB2, ca!ee2:null
configl: cpu:1000, mem:500, caleel:null, calee2:null
Figure 7-1. Sample Test-bed Configuration
7.1.1 Executing Test Configurations in CAT
The point of entry in any test-bed configuration is the first test EJB (by
convention called TB1). A HTML page and a Servlet are used to submit the
configuration information (configuration name) to TB1. The HTML page and
the front-end Servlet represent the CAT Web Front-end (CATWF). The use
of CATWF for the selection of the configuration enables web-based stress-
loading tools such as OpenSTA [61] to emulate a given load by generating
sets of simultaneous users corresponding to different configurations. By
selecting the interaction configuration from outside the test-bed, control can
be exercised over the behaviour of the test beans at runtime and different
behaviour can be chosen corresponding to the desired effect. For instance, a
performance hotspot can be injected by selecting a particular configuration
that has a high overhead parameter value in one of the test EJBs.
This approach is similar to fault injection systems such path-based fault
injection system presented in [103], although the scope of the faults is
different. In [103], the focus is on lower-level fault injection in order to
exercise the fault-tolerance components of the target system. In addition,
the system in [103] uses monitoring information to direct faults in the
system. In CAT, high-level faults are injected with the purpose of testing
the behaviour of the adaptation and diagnosis functionality. The injected
140

faults drive the monitoring adaptation, rather than having the faults being
influenced by the monitoring information, as in [103].
A sample set of three configurations is illustrated in Figure 7-2. The
configuration selection is performed by submitting one of the three possible
configuration names to CATWF.
Legend:
| | within range alert ------► call
Figure 7-2. Sample C A T Configuration Set
The first configuration, configl, is composed by a linear calling pattern,
which consists of four EJB method calls. The third method call is configured
to use resources (CPU time and memory) such as to meet the alert
generation criteria (Section 6.4).
The second configuration, config2 consists of a single EJB method call. Using
such a configuration would enable a test case that either induces a reset of
the active state of the corresponding probe back to standby (if the test case
is run a duration that exceeds the monitoring expiration time - Section
6.7.5). Alternatively, if config2 specifies a low resource utilisation for the
single EJB method call, it could be used for a precise injection of an alert,
141

preceded immediately by the execution of another configuration, before the
monitoring expiration time (Section 6.7.5).
The third configuration in Figure 7-2 illustrates the possibility to generate
complex sequences of calls that could be used to test intricate alert-
generation strategies (Section 6.4.2).
By sending alternative configuration names to the CATWF, different
configurations (declared in the deployment descriptor) can be selected and
executed at runtime, without the need to redeploy the test-beans.
CAT does not support configurations that contain loops. As there is no
mechanism to specify the conditions for terminating a loop, a configuration
containing a loop would never finish executing.
7.1.2 Test Bean Cell Design
The test bean cell is the unit of composition in the CAT framework. By
cloning it and adding configuration data to its XML deployment descriptor,
any number of test EJBs can be created. A test-bed can have several
configurations spanning any number of test beans.
As Figure 7-3 shows, the test bean uses a simulation manager, which has
the responsibilities of generating the computational overhead and
orchestrating the calls to the corresponding target EJBs.
The simulation manager reads the environment properties from the
deployment descriptor and stores all the configurations. As requests arrive
at the EJB (invocations of the simulateBusinessLogic method), the test bean
passes the configuration name received to the manager, which in turn uses
the configuration parameters to generate the appropriate overhead and call
the target beans.
142

SimulationConfiguration
configurationName : cpuLoad : int memLoad : int
■ firstCalee : String
+ getCpuLoad ( )+ getFirstCalee ( )+ getMemLoad ( )+ getOptionNam e ( )+ getSecondCalee ( )+ SimulationConfigura...
TestBean
- sessionContext : javax.ejb.SessionContext
+ TestBean ( )+ ejbActivate ( )+ ejbPassivate ( )+ ejbRemove ( )+ setSessionContext ( )+ ejbCreate ( )+ sim ulateBusinessLogic ( )
1 sim Manager
SimulationManager
+ simuiateOverhead ( ) + orchestrateCalls ( )+ Sim ulationManager ( ) - readEnvEntries ( )
O V ER H EA DS IM U L A T IO N
simFactory
SimulationFactory
+ aetSimulator ( Ì
«creates»
«abstraction»
«abstraction»
OTestBeanHome
+ create ( )
— oTestBeanlF
Testbed EJB Structure
"~L
- jobSim uiator
1 ~ ^ o < -JobSimula tion
+ simulate ( )
■ concreteSimuiator->SimpleSimulator
■ tem pRes : double
+ simulate ( )+ processNumber ( Ì
+ simu/ateBui 'nessLogic ( )*
- targetEJBs
Figure 7-3. C A T Test Bean Cell Structure
The manager can use several simulation strategies to generate the load. A
simulation factory creates the appropriate simulation strategy and returns it
to the manager. The current implementation of the simulation strategy uses
Gaussian random number generation to induce CPU overhead, and byte
array creation to induce memory overhead.
143

7.2 COMPAS Prototype
This section gives an overview of the COMPAS prototype, illustrating its
functionality with a use case.
7.2.1 COMPAS Implementation
Although many concepts in COMPAS are applicable across component-based
platforms, the COMPAS implementation targets J2EE as this is by far the
most used component technology. COMPAS has been written in Java and
consists of approximately 100 Java classes comprising both the server
functionality (instrumentation) and the client functionality (monitoring
dispatcher and clients). It makes extensive use of Java enterprise APIs and
open-source technologies. This facilitates the adoption of COMPAS since all
dependencies are freely available.
Java Management Extensions (JMX API) [33] is used as the core
communication and management infrastructure. J2EE application servers
must implement the JMX API, ensuring the portability of this approach.
The most important open-source packages used in COMPAS contribute to
the probe insertion process (Section 5.1). They include Apache Ant [4],
Velocity [5], XML parsers [6] and the Log4J [7] logging framework.
Apache Ant is a highly-configurable Java-based build tool which COMPAS
uses for the target application analysis and probe generation. COMPAS
includes custom Ant tasks that are coordinated from XML-based Ant scripts.
The custom COMPAS tasks [4] are used to extract the contents of the
application archives and generate the new deployment descriptors used by
the instrumented applications (Section 5.1). The entire probe insertion
process is coordinated from scripts that can be configured to match the user
environment. Values such as the location and name of the target application
must be specified in the scripts.
Velocity is a Java-based template engine used in particular for the rendering
of dynamic data in web systems. COMPAS uses Velocity for generating the
code of the monitoring probes based on reflective [89] information from
target components.
144

XML Parsers such as Xerces [6] are used to analyse and change deployment
descriptors in the target J2EE application. They provide programming
abstractions that encapsulate low-level XML operations, allowing the use of
an object-oriented view [107],[106] of XML data.
Log4J is used in COMPAS as both the internal logging mechanism for
reporting errors and exceptions and as the data logging mechanism for
storing monitoring events such as method invocations and lifecycle
operations. Other means of storing monitoring events such as storage to
commercial databases can be added using the COMPAS framework client-
side extension points (Section 4.4.1).
In addition to the packages needed by the insertion process, COMPAS uses
the Java Graph Editing Framework (GEF) framework [100], part of the
ArgoUML [99] project for displaying UML diagrams extracted with the
interaction recorder.
7.2.2 COMPAS in the Real World
The COMPAS monitoring framework is completely portable across operating
systems and application servers. It has been tested with the following
application servers:
• IBM Websphere Application Sever 5.0 [37]
• Jboss 3.2.x [41]
• BEA Weblogic 8.x [10]
The application servers have been deployed on the following operating
systems and COMPAS has successfully operated both at the client side and
the server side:
• Microsoft Windows 2000 and XP
• IBM AIX 5.x
• Linux on IBM S390 and IBM zSeries mainframes
• Linux on Intel
In order to test the installation procedure, several representative J2EE
applications have been used. Sun Microsystems' J2EE Pet Store application
[88] is widely known in the academic and practitioner community. It is
intended as a showcase of the design patterns recommended for enterprise
J2EE applications, providing the functionality of a retail shopping
application. It consists of a representative mix of J2EE technologies and
145

application server vendors typically provide out-of the box deployments of
Pet Store with their products. COMPAS has successfully inserted monitoring
probes into Petstore and the runtime monitoring functionality has been
tested for Petstore on multiple application servers.
The Trade3 application from IBM [38] is used as a benchmark to measure
the performance of different server configurations in IBM. It is a simplified
but operational J2EE stock brokerage application, with operations such as
buy, sell and quote. COMPAS successfully installed the monitoring probes
and performed runtime-monitoring operations on Trade3.
7.2.3 Using COMPAS with the Adaptation Test-bed
This section illustrates the functionality of the COMPAS infrastructure by
presenting a case study. The case study describes how COMPAS was used
to instrument and monitoring the COMPAS Adaptation Test-bed (CAT)
application (Section 7.1), in order to obtain the results presented in Section
7.3.
Instrumentation
Before COMPAS can be used to instrument or monitoring a target
application, the configuration files a n t - s t a r t e r . x m l , c o m p a s - a n t . x m l and
c o m p a s - e n v . c o n f must be appropriately modified to correspond to the
user's environment. The COMPAS installation manual [55] provides detailed
information about the configuration process.
After COMPAS has been configured, the probe-insertion script can be
launched. It parses the CAT application metadata and generates probes
corresponding to each CAT component. The output of the process is
displayed in Figure 7-4.
146

¡S& COMPAS pr «jijcinealton
awa
-Mil■ uanneratoI
twawol! Huvlny I f i l e s to DvXfcnnpSAutuiitxJnrii;Icani»ait .flflBBi’iitfi I COM IMS i s ^ e t n s s l n g EJl) daployrw w c n in tc i 'ip to p : O :\co.npvfnitput\jrtpa\l: M \M iniW M F \© jb-jA i’ .x n l.0 i* ig in n l Cconp.-is^g o n o rato ! j jf-o iaìg© lina“ sttnsion It'JU: TBLEoonp.-in.jjonorata I p a ra ta k t o r f n c o i to o tb a d .o jh .T a s t lk m r il I’le o n p a a _ ije n o rf tC n ] Ihiaiì c L a tn : t e » t l ) « i l . o i b J o : i | i o n i iIc on p as ..gena r a tn J Ima ino a 9 i n t e r i oce and Jwoii o l« s e lo ad ed a u c ce s f u l l y . . .tcQ(itpfla_genorAtr J Tbe w arkin tf r tp p llf in t iun s e r v e r i s : JHÓSS
JtcompAe^jjonoi'Ate J [ c o n p t i i i j jo u e r A ta I IcanpasgonerAte 1 Coonpac j - ^ n e r n t c J fc o n p a o g e n e r a t e J Ccimpais _ y e n o r a t e l ioonpaa .^ o n e r a to 1 fconpas_ tfan«rA C A ) lconiu1c._3enof.Ato 1 iennyflSjcnfli'Atu 1I q o n ^ s j c n o r a C n J Eoo ripagasene r a t a J tcrtnpA'S^gonernto I f CUnjH6„fll) IIH'I'At 0 1 [oo 'upiio^niim i'ato 1 too npQs j ® n e r a to J [conpac„f(onero.to 1 CeaniMiJlonai'Atfl 1 fconpo»_jSfn i te r a te 1 iuonpas_ifoner a to I [COIilMSJBHBIMCe T
fotO U D :\ttinp\ouC mi tSsJ * r V \ t t jÌ \ to 6 tbedSo,jb\_C0h P tìS _ T e stB ean ,jav a to d is k p r o c e s s in g sp a o ia n EJB: Tn2
r e n a ta i n t e r f a c e : te* tb e il.e J li« .T e8 tB ean lP beon c l a s s : toetlaed .o .jb .T es tUc aì>3b u s in e s s in td i-fa c c And ben« c l a s s lojuled c u c c c a / u l l y . . .1/fiOIE D :\tB n |» \o u t(j< it\jj |i 'a S tM \ta itl« i(l\o j |i \_ C O H I,il8Jiost:B ofliiL j«M a t o d isk
p ro c e s s in g a e c s lo n KoUs TU‘Jr c n a t f In te r fa c « '- tB B tb n d .é J b .T e s tB e in lF tre ini c k c c : tfitb ()d .c ,jlì.T fls tìJe .v n 3bua in a ia i n te r f a c e and boan c I a b i loatfod s u a c R a f u l ly . , .Uft$TÈ Ì)i\to n u \o u tp iL t\ jfti‘sNtMStEatl>odSeJb's._COWI’n8_To3 tDc^n3 . ja u a to d is k
p r o c e s s in g t o t B la n E'JB: 184reno 10 in tf lp r* c fiì t e s tb e d .o jb . ì e s tB t ìa n lF t>nah c l a s s : te s tln » d .o jb ,T f ts t4 Ja a n ib u fin o si: in t e r f a c e and lia in c ìn s e ioailo»! iu cc a cfii 1 l y . . .MftOTIi B *\ te n p \O U C tm tS ja r s \ tb i\C 0a tb a dYojbvjCOMI.'ftSJio* t'itea.M , ja u « to d is k
p ro c e s s in g se a c lo n Edili IB5re n o ta In to rff lo o i tn s t li t ìd .n jb .ÌD a tl Ia n n lF k a l i c lo l n i tn stb o it.n jb .Iec tE te fv n S bus in e 6 * i n te r f a c e and bonn c ì a e s lo ad o d tn tc c e e fu lìy * * *
WBOIE D :S to n p so u tp u t',|s ja i ,‘sS tb lS tiiS tb iu i \P <JbS_C(thl,flS_TactÒ aanS.)tflWn to d is ktconpA S_ganorate ] UROTE tlw p r o s i f i e d deploym ent nH S eripC irr: DiStBflpVflutp«CSjai,sS tM \h ì:Ì(l-ÌH lN it1jb - lJ n r . x n l
e o R p i lc :[ j& v acl C o n p ilin g S so u rce f i l e s
T d e le te J D e le tin g 5 f i l u s f ro n D :\ te n p \o u tp u tX ja i- s
j a i ' J t e r a t o r :[ s c r i p t J Loading t b l . . .
repackJARs:t j a r l B u ild in g j a r ? D :M :f t« p \o u tp u t\ ja r s \ tM . j a r
insei't.jeo«paf?_i>robe8 :te o p y l C opying 1 f i l e to D t \ te « p \o u tp n t[co p y ] C opying 1 f i l e to D iS ten p S o u tp u fx ja i 's[co p y ] Copying 1 f i l e to D s \te p ip ''.o u tp u ty ja rs[co p y ] Copying 1 F ilo to D i\ten p \o u tp u fc ',»3arsfco p y l Copying 1 f i l e to D i \ te n p \o u tp u t \3 a r s
i o a r i U pdating e a r : D : \ te n p V o u tp u t \ t e s tb e d -p r o x if i e d , e a r
BUILD SUCCEfiSPULT o ta l t in o : 0 seconds .z i
ti
Figure 7-4. Output of Probe Insertion Procedure for CAT
After the application has been instrumented, it can be deployed on the
target application server. The deployment procedure is server-dependent
and un-related to COMPAS. The test results presented in Section 7.3 were
obtained using the open-source JBoss Application Server version 3.2.3 [41].
Monitoring
After the application has been deployed, it can be monitored by starting the
COMPAS monitoring console, which initiates the monitoring dispatcher and
registers the GUI components as listeners for monitoring events. Figure 7-5
and Figure 7-6 show screenshots of monitoring console GUI components.
147

iiÿ COMPAS Monitoring Console Monitoring Lotiymij Tools Training Help
9 ¿'-jE-|a|TB'¡Tñ1 j simulate BusinessLoglc <2 times»
<? S| jTB5[1]r'“* êimulateBusInessLoalt <1 times»
<? iP M îB3[1|£ “* simulatsBuslnessLofllc <2 times»
<•> - :E“Bj TQj [1]'] simulateBusinessLogic <3 times!-
Ç [1]£“■_"] simulateBuslnessLogic <4 times>
0.53(
I0 1 1 í |
275 ; -
283.!
428.:
Status: r.ONM P ro g re s s C
O verv iew ü et a ils H is to ry
12 Enable History Clear History
UPDATE: 1. T65;:simula(eBuslnessLoglc (1 limes @ 0 118451 m s )2.TB3::simu(ateBusinessLogic @44.457047 ms)M E RTfromTB2:threshold exceeded by83.436325ms.!3.TB4::simulateBuslnsssLogic @1.026946 ms)A L E R T from TB1; threshold exceeded by 101.58344199999999ms. I 4 . TB2::sirmilateBusinessLofllc @ 183,435325 ms)5. TB1 "simulateBusinessLogic @201.583442 m s)6. TB4:.simulateBuslnessLoglc @ 0.53694 m s)A L E RTfromTB2: threshold exceeded by56 324895999999995ms. I7. TB2::slmulateBusinessLogic @ 169,8801105 ms)H L E R Tfrom TB1: threshold exceeded by 61 238091 ms, I 3, TB1 "simulateBusinsssLogic @ 181.4107665 m s)9 TB1::sirnuiateBuslnessLogic @400.07719833333334 ms)
L E R T from TB1: threshold exceeded by 737.410062ms. I 10. TB3:-SimulateBusinessLogic (S> 275.7008225 m s)_____________
J
Figure 7-5. Monitoring Console
In Figure 7-5, the main monitoring console is presented. It displays the
components and instances in the CAT application and their business
methods, annotated with performance information. In addition, a history of
monitoring events can be displayed, as well as stored in log files.
¿ff Execution Chart for TB1::sffnuÌA(éBuslnessLogfc [- j i^ Ë I
E JB M o n ito r C o n so le > M e th od C hart V iew
T© 1 : iJitnoj ta t* 8ujkfli*ül,0||l>e
| P rioimance-limit Maximum_ Minimum H Hw
Figure 7-6. Real-Time Response Time Chart
In Figure 7-6, a real-time execution chart for a business method is
presented. It displays the evolution of the response time of a particular
component method. The number of displayed charts is not restricted.
Recording, Displaying and Selecting Interactions
In order to enable adaptive behaviour in the monitoring infrastructure,
knowledge about the execution models must be obtained (Section 6.2). To
obtain execution models, COMPAS provides the Interaction Recorder, which
148

is part of the main monitoring console and can be started using the Training
-> Record Interactions menu option from the main monitoring console
displayed in Figure 7-5. The Interaction Recorder GUI, presented in Figure
7-7 can operate the recording process using a Recording button to start the
capture of events and the Stop button to display the processed Interaction
tree.
Start Recording Display UML
Stop Recording
Save Interaction
Up Interaction Recorder - COMPAS
m Ree ® slop 100 ms sample configuration
¡ O sample configuration
9 O T81 ::sirnuiate8usine ssLogie (415ms @2788395)
$ C l TB2::simulateBu$ nessLogic (314ms <§>276893
9 l 3 TB3 :slmulatel iusinessLogic (107ms @276
5)Ì096)
nulbteBusinessLogìc (I rns @2759 ! 96)D TB5;:slrQ T84::slmuli iteEjusinessLogic (1ms @2769306)
Interaction Tree Artificial DelayInteraction Name
Figure 7-7. Interaction Recorder GUI
The text field labelled (ms) represents the number of milliseconds of delay
that can be induced in the EJBs in order to ensure that method invocations
are properly ordered (Section 6.3.1). This is needed when the environment
accuracy of the timestamps is poor, such as when using the default time-
extraction strategy on a Windows machine (Section 4.3.2). A useful value
is 100ms but it can be adjusted by the user to fit to the environment.
After an interaction has been captured and sequenced, it can be saved in
XML format or displayed as a UML sequence diagram. Figure 7-8 shows the
149

sequence diagram created automatically from the interaction saved and
displayed in Figure 7-5.
\ 5f r COMPAS VEGA jV T fu a tiiir i'S U t t G ra p h * A p p itc a t io it j w w w ,« jb p * r l< M -iiw *n c ^ w g S H e v iilo o : 1 S_«1« rUrt V'jihw Arianyay I] ofojojN | A |Q js |a ) _P_| D
i-fttfiHtvm iiiuiì &uj|SwrHii5-
i# rtHMIfcHMrtt-f PM(
P-aulin n»i 1-4liny, l i l i ftuiln I l i t i ¡¡fexi àfrbvMt
IfJ
rwwm Òuut4M*l
»unJifliilMiihMiMpn!. i'C'yiss:«O.viijiifiwii
L lU | '
Figure 7-8. Automatically Generated UM L Diagram
After interactions have been captured from the running system, they can be
saved and used in the adaptation process. The user can select a subset of
all saved interactions to be considered by the diagnosis and adaptation
module. This is realised with the Adaptive Interactions Editor, presented in
Figure 7-9. The user can choose the required interactions and when the
configuration is saved, the model knowledge is transmitted to the
monitoring framework dynamically and becomes effective immediately.
& Adaptive Interactions Editor
Available Interactions
conno1Selected Interactions
confluìeonfiij2confitj3
>>>< < <
Save
Figure 7-9. Selecting Interactions for Diagnosis and Adaptation
150

7.2.4 CAT in Adaptation Test Case
This section presents a test case that illustrates how the adaptation
mechanism affects monitoring behaviour in COMPAS. CAT is used as the
target application because it enables the emulation of conditions for the
generation of performance alerts in the system.
Figure 7-10 illustrates how different CAT configurations (Section 7.1.1) can
be selected for execution. By running different configurations, conditions for
generating alerts can be created in different EJBs.
Figure 7-10. Configuration Selection using the C A T Front-end
The focus of this test case is represented by configl, which is a CAT
configuration consisting of 5 EJBs calling each other in the sequence
illustrated in Figure 7-11 and Figure 7-12. Both figures represent
screenshots obtained from COMPAS when recording and displaying the
configl interaction using the Interaction Recorder (Section 6.3).
When configl is executed via the web front-end and no configurations have
been selected for the adaptation process, probes corresponding to each EJB
in configl emit invocation notifications. This is illustrated by the screenshot
in Figure 7-13.
151

y | ii, —wm. i i i ■■ li. j i
& Interaction Recorder - COMPAS
□ Ree ® Stop 100 ms config l
13 config lP i TB1 "s im u la teB us inessLoa ic (431 m s @ 100790172)
<? C 3 TB2::s im ula teBusinessLogic (326rns @ 100790273)
9 C 3 T 63 ;:s im u la te8us inessLog ic (126m s @ 100790373)
Q TB5::slm iJlat8BusinessLogìc (4m s @ 100790473)
Q T84::sim ulaSe8usinessLogic (3m s @ 100790593)
Figure 7-11. Structure of Configuration config l
sà/ COMPAS VEGA ( V isualis ing tJ B Graphs App lica tion ) www .eJb p c ffo rm a m » .q tj{ SRvvislmu 1 .26 S Rio fida u>ow Aif.imjii[t T n |o |n | o | \ | a | q | s | 5 | d T Z f o l
»ixi flvt-.fi ■ nitwit[
D'.uiwTr* m eijm'ijiiW H TS* W4'Ì>W1 i'ii'ilhrrW Tnnvi(l*0«icaV4]
ISMC©-© ! tuuhW.M
- 1 ¿L.
Figure 7-12. UM L Representation of Configuration configl
^ COMPAS Monitoring Console__________
Monitoring Logging Tools Trainino Help
- E JB TB5 [1] ▲
©- = E JB TB3 [1]£>. ^ E JO TB1 [1]O ^ E J S TB2 [1]©. - E JB TB4 11]
•V
I >
Overview | Details History j
[¡3 Enable History Clear History
1. TB5::slmulateBusinessLogic @ 3.5719934444444446 ms )2.TB3::simulateBusinessLogic @69.5832571 m s)3. TB4::simulateBusin8SsLogic @ 3.1328841999999995 ms )4. TB2::simulateBusinessLogIc @ 101.79871763636362 ms )5. TB1 :;simulateBusmessLogic @ 161.9776497142B572 ms )
J ►Status: CONNECTED Progress:
Figure 7-13. Execution History of configl without Adaptation
In order to avail of the adaptive monitoring capabilities in COMPAS, at least
one previously obtained interaction must be selected for adaptation. The
152

screenshot in Figure 7-14 shows that configl has been selected for
adaptation. This selection becomes effective after the "Save" button has
been pressed.
Figure 7-14. Selecting config l for Adaptation
After selecting configl for adaptation, only the probe corresponding to its
top-level component is going to be in active monitoring. This aspect is
illustrated by the screenshot Figure 7-15 that shows the execution
notifications when configl has been launched from the web front-end. The
other probes will not emit invocation notifications unless they have been
diagnosed as the source of a performance anomaly.
Figure 7-15. Execution History of config l with Adaptation
In order to emulate a performance anomaly in the third EJB of configl, TB3,
a separate configuration was’ used, config4. The structure of config4 is
presented in Figure 7-16 and Figure 7-17 representing the Interaction
Recorder's consoles after recording the execution of config4.
153

Interaction Recorder - COMPAS - i.3j©
[O] Rec® Stop 100 jms config4 y O'u
13 corrfig4? C3 TB1::sîmulatôBusinessLogic (760ms @102232950)
Ç C 3 TB2::s im ulateBusine$sLogic (656m s @ 102233050)
Q T 83 :;s im u la le8u$ inessLog ic (541 m s @ 102233150)
Figure 7-16. Structure of Configuration config4
¿p COMPAS VEGA (Visualising EJ8 Graphs Application) www.ejbperformnnce.org S Revis ion: 1.26 S
File Edit V iew Aiid ityu
l° □ o A O j s ' ô I1?; - □
Figure 7-17. UM L Representation of Configuration config4
In config4, TB3 emulates significantly more CPU and memory utilisation
than in configl. This triggers the alert-generation mechanism and an alert is
raised for TB3. In addition, since TB3 is the last component in an execution
chain, the alert is propagated upstream to TB2 and TB1. The three alert
notifications together with the invocation notification corresponding to TB1
are illustrated in Figure 7-18. COMPAS uses model knowledge and identifies
the component responsible for the performance alerts as being TB3 (Section
6.7) and prints out the following message in the COMPAS system console
(not shown in Figure 7-18): "Method TB3::simulateBusinessLogic is
hotspot!".
154

^ COMPAS Monitoring Console
Monitoring Logyiny Tools Trainino
Q@ @Help
o - 6J0 TB5 [1] -O - EJD TB3 [1]©- - ;e jb TB1 [11©- ri EJO TB2 [1]O c E JB TB4 [1]
W<[ I ►
Overview Details History
[¿'I Enable History Clear History
L E R Tfrom TB3: threshold exceeded by 226.20486700000004ms. I A L E R Tfrom TB2: threshold exceeded by 241.46881800000006ms. I 1.TB1 ::simulateBusinessLoglc @ 184.97524140000004 m s ) A L E R T from TB1; threshold exceeded by 247.34274900000003ms. I
Status: CONNECTED Proyross:
Figure 7-18. Execution History of config4
Following the identification of the component responsible for a performance
alert (TB3), the probe corresponding to the component is switched into
active monitoring mode. This is illustrated in Figure 7-19 that shows the
invocation notifications when executing configl after the hotspot has been
identified.
COMPAS Monitoring Console
Monitoring Logging Tools Training Help
o z EJB TB5 |1] AO -, E J B T B 311]
E J B TB l [1]O- " E J B TB2 [1]©- - E J B TB4 [1]
< I ■ . I I ►
I Overview j Details | History
yï Enable History Clear History
1. TB3::simulateBusinessLogic @ 105.33276738461537 ms )2. TB1 ::simuiateBusinessLoglc @ 232.29968068000002 ms )
<Status: CONNECTED Progress:
Figure 7-19. Execution History of config l with Adaptation and Hotspot
In order to avoid unnecessary notifications, probes corresponding to
hotspots remain in active mode for the duration of a timeout period, which
has a default value of 25 seconds (Section 6.7.5).
7.2.5 COMPAS in Use
COMPAS has been designed as a complete framework, which can be
integrated with applications that require J2EE monitoring capabilities.
Several projects leverage parts of the COMPAS framework in particular the
monitoring capabilities and the event management model.
155

A third-party framework for self-adapting and self-optimising component-
based systems [23][22] uses the COMPAS instrumentation FEP (Section
4.4.3) to replace the default portable COMPAS instrumentation
implementation with a server-specific, more intrusive implementation. The
external implementation allows dynamic discovery of call-graphs. The same
project uses another input FEP, the alert FEP, to provide a more complex
anomaly-detection strategy that takes into account the historical data
related to a method call. An overview of the integration of the third-party
framework with COMPAS is presented in [21].
A project that proposes a methodology for adaptation of EJB Application
Servers based on monitoring information is presented in [101][ 102]. The
authors consider the use of COMPAS as the runtime infrastructure for
providing the required monitoring data. Since COMPAS is portable across
application servers, its data extraction and event distribution capabilities
can effortlessly be leveraged without the need to develop server-specific
hooks.
There is an incipient commercial project "EJB Express" [49][56] targeting
performance prediction of EJB systems. This EJB Express uses COMPAS as
part of its data collection structure. In addition, the COMPAS Interaction
Recorder is used to generate UML models annotated with performance
information. The models are used to generate prediction models, which can
help in identifying potential performance problems under varying workloads
or hardware configurations. EJB Express is work in progress and is partially
based on the performance management solution presented in Chapter 3. In
addition to COMPAS monitoring information at component-level, it uses
lower level instrumentation hooks that extract CPU and memory usage to
build more accurate prediction models. The models are simulated in various
scenarios and the prediction results can be displayed as views in the Eclipse
Framework [29], The functionality of COMPAS-based EJB Express is
illustrated in Figure 7-20 that displays UML performance models being
simulated to predict performance under different workloads.
156

fi* Eût tomài évej*d fon *V(f>i tico•* • •* ■
fi t toCUWriChvr ttrtifi
75 »4 X VlW>.; 7Ç FotRign A& Sént*
H y » y*~*ÍT 1**« i
Dísn Aitili*«6i?Wb> Charajf MientoginHan* h»MUl>P* t IKIliV tVîWWiIréFnfcznMm.,llWlfiíi.- 0.0CPUtir* £M)I5K*W irwo
fi 3**li£Í«* Llrt'óké*
w*nt'U> «
□E3tn*?*g tanrufi g jc fc v u j i
(5-M)rtf **»ü&*í 0 l’ç-«! fcwrt QfVaíMa» gjCj>*iÿa'Aâ*<u H íítk íS iM f/ ítEÎ '3 -V-Î* W irten
I i> v'jfe '(* í<w «o ? i‘< tu fi ‘(wii'Wifi Vi|ymíirí>rJrt
jftw*aj *yj 10 ,ÿj <2> " .. I rjHj Dotati_____ J |C3,-,Ú ÜKP*«*» Pñí'Brtftfc- u s a i soûles*____ | ttjüftm.W
Figure 7-2Û. EJB Express Functionality
J it»
157

7.3 Performance Measurements
This section presents results and analysis of tests that were carried out to
measure the performance of the COMPAS Monitoring infrastructure, The
results demonstrate that the overhead of the COMPAS monitoring probes is
acceptable, particularly for large workloads. In addition, the comparison
between full monitoring and adaptive monitoring modes highlights the
advantage of using model-driven adaptation to optimise monitoring target
coverage.
7.3.1 Test Environment
The performance tests were carried out in an environment that emulated an
enterprise setting. The COMPAS Adaptation Test-bed (CAT) application with
multiple configurations was used as the target J2EE application.
The COMPAS monitoring dispatcher and client consoles were run on a
stand-alone client machine. A load generator was used to emulate multiple
simultaneous users in repetitive sequences of interactions with a remote
J2EE application server running the CAT application. CAT was used as the
test-bed rather than a J2EE application (such as Petstore [88]) because it
was designed to allow fine control of the performance parameters. COMPAS
can be used to instrument any J2EE application and has been tested with
several representative applications (Section 7.2.1), however it would be
extremely difficult to control off-the-shelf applications in a similar manner to
CAT. Using CAT, performance hotspots can be injected deterministically. In
addition, particular calling patterns can be generated and observed. This
allows for the isolation of performance characteristics and enables reasoning
about the effects of using COMPAS Monitoring.
The load generator selected for the tests was the open-source tool OpenSTA
[61]. OpenSTA provides session recording and playback, and script
generation and editing facilities. Test sessions consisting of user interactions
were recorded and subsequently edited to highlight the required properties
of the infrastructure. Delays between user operations in an interaction were
deleted from recorded scripts so that the results could be effortlessly used
to isolate the measured properties of the system.
158

All test sessions consisted of a user interaction with the CAT via the CATWF
(Section 7.1.1).
All tests were performed on three dedicated machines running in a lOOMb/s
switched LAN networked environment. The components of the test
environment are illustrated in Figure 7-21.
O ' " P'Application Server Node
connect and receive events
COMPAS Console
Figure 7-21. Environment for Performance Tests
The Application Server Node (ASN) was an enterprise-level dedicated server
with 4 x Intel Pentium III Xeon 700MHz processors and 1GB RAM with
Windows 2000 Advanced Server OS. The J2EE Application Server used was
JBoss v3.2.3, running Sun Microsystems Java Virtual Machine v. 1.4.2. The
reason behind the choice of application server was the unrestricted
availability of the open-source JBoss server, allowing for the repeatability of
the tests. COMPAS can be used on any J2EE application server running on
any operating system and has in fact been tested with multiple application
servers on multiple operating systems (Section 7.2.2).
The Load Generator (LG) machine was a dedicated server with two Intel
Pentium III 866 MHz processors and 512 MB RAM, running Windows Server
159

2003 Enterprise Edition. OpenSTA vl.4.2.34 was used to run the load-tests
and it was configured to close each user communication socket after the
test finished, in order to support the large number of test repetitions of
each user.
The COMPAS Console (CC) was run on a dedicated workstation with an Intel
Pentium IV 1.4 GHz processor and 1GB RAM, running Windows XP
Professional. The CC used the Sun Microsystems Java Virtual Machine v.
1.4.2.
7.3.2 Setting-Up and Running Tests
This section presents the results of overhead tests that were aimed at
determining how significantly the COMPAS Monitoring infrastructure affects
the target applications. CAT (Section 7.1) configurations representing
multiple and single EJB interactions were considered in order to determine
the factors that affect the overhead. COMPAS makes use of adaptive
monitoring techniques (Chapter 6) in order to reduce the monitoring target
coverage and reduce the total overhead induced in an application. The
following tests highlight the overhead reduction by comparing the overhead
that occurs when the target coverage is reduced (interaction-models driven
partial instrumentation) with the overhead when all EJBs are monitored (full
instrumentation).
A description of the tests and a discussion of the results follow. Each CAT
configuration used for the tests is described and illustrated. The diagrams
consist of boxes and arrows, where the boxes represent the test-bed cells
(Section 7.1) and the arrows represent the EJB method calls. Each cell box
contains the cell name, TBx, (Test Bean) and two numbers. The first
number is the CPU overhead parameter and the second number is the
memory overhead parameter, as set in the deployment descriptor
containing the CAT configuration (Section 7.1). All tests consisted of sets of
test-runs with increasing numbers of simultaneous users (1, 2, 5, 10, 20
etc.). Each test run involved executing the configuration presented in Figure
7-22 with the corresponding number of simultaneous users. Each user
repeated the execution of the test run 10,000 times. For instance, for the
test run corresponding to 20 simultaneous users, there were 10,000
repetitions of a batch of 20 users simultaneously executing the test
160

configuration. The total number of configuration executions in this case was
200,000. All three test-machines were rebooted after each test-run to
ensure consistency. Results were collected at the web tier level, using
OpenSTA's collectors [61], as well at the EJB level, from the log files
generated by COMPAS instrumentation events. The EJB-level measurements
were performed using the nanosecond precision time-stamping strategy
(Section 4.3.2).
The execution times extracted at the web-level included the web front-end
(CATWF) execution times, as well as the EJB tier execution times, Since the
recorded OpenSTA scripts had all the recorded user "think-time" eliminated,
the response time in the web tier includes the total response time of the EJB
tier and the processing time in the web tier. No user "think-time" was
present in the results, leading to results that most accurately isolate the
aggregated performance of the web tier and the performance of the EJB
tier.
The execution times recorded by COMPAS Monitoring were extracted from
the COMPAS log files. Only the response times recorded for TB1 were
considered, as they contained the aggregated response times of the rest of
the test bean cells in the configuration.
The extraction of both the web response times and the EJB response times
ensured that the performance of the web tier and the performance of the
EJB tier could be compared. Since COMPAS instrumentation is performed
only at the EJB tier, the evolution of the EJB response times indicated the
effect of the different COMPAS instrumentation schemes (full monitoring
versus model-driven partial monitoring).
7.3.3 Multiple EJBs Interaction
In order to determine the overhead that COMPAS induces in a typical
application, a CAT configuration was created that determined a sequence of
five EJBs, as presented in Figure 7-22.
161

f TB1 TB21 0 0 0 ; 5 0 0 0 10000; 1 0 0 0
T B 3f \
T B 52 0 0 0 ; 5 0 0 0 5 0 0 0 ; 1 0 0 0
T B 43 0 0 0 ; 3 0 0 0
Figure 7-22. CA T Configuration for Multiple EJB s Interaction
The overhead parameters' values were chosen so that the execution times
of the test-bed cells did not exceed the alert threshold. This ensured that no
alerts were raised during the test runs, and the results were consistent.
Test runs with 1, 2, 5, 10, 20 and 50 simultaneous users were created. In
the full instrumentation scheme, all the probes corresponding to the EJBs of
the test-bed configuration (TB1...5) were in active mode (Section 6.5). In
the partial monitoring mode, since no alerts were raised, COMPAS used the
model information to determine that only TB1 needed to be monitored in
active mode. The rest of EJBs (TB2...5) were monitored in stand-by.
Figure 7-23 displays the response time evolution (in seconds) measured at
the web tier for test-runs corresponding to increasing simultaneous user
numbers. The chart highlights the differences between the response time
evolution when the application was not instrumented and the evolution
when the application was instrumented (completely or partially). Derived
using linear interpolation, the shapes of response time evolutions are similar
indicating that the use of either of the instrumentation modes did not
induce any non-linearities in the application. It can be observed that the
partial instrumentation mode determined a smaller total overhead perceived
at the web tier level. In addition, with the increase of the generated load
(increase in the numbers of simultaneous users), the overhead difference
between the two instrumentation modes becomes more significant.
162

Web Response Time
S im u lta n e o u s U se rs
no instrumentation — ■ — full instrumentation — *— partial instrumentation ;
Figure 7-23. Web Response Time Evolution for Multiple EJB s
This aspect is more apparent in Figure 7-24 which displays the evolution of
the difference in overhead between the two monitoring schemes.
Web Response Time Overhead Difference Between Monitoring Schemes
S i m u l t a n e o u s U s e r s
□ o v e r i i e a d d i f f e r e n c e
Figure 7-24. Multiple EJBs: Web Overhead Difference Evolution
The evolution of the response times measured at the EJB level in both
monitoring modes, is presented in Figure 7-25. The plotted response times
163

correspond to the top-level EJB (TB1) in the CAT configuration. As
expected, the total response time of the EJB Interactions, perceived in TB1,
is smaller in the partial monitoring mode, as only one EJB is actively
monitored. As in the web-tier case, the difference between the two
monitoring modes increases with load indicating that the partial
instrumentation mode is particularly useful in heavily loaded systems with
complex interactions. This is because the reduction in monitoring overhead
due to the adaptive monitoring schemes becomes more significant where
interactions contain large numbers of EJBs. This reduction is amplified by
the large numbers of simultaneous users accessing the system.
Front EJB Response Time
<UV)coawooc 100
5 10
S im u lta n e o u s U s e r s
i—♦ —full instrumentation ^ "p a rtia l instrumentation
Figure 7-25. EJB Response Time Evolution for Multiple E JB s
Figure 7-26 and Figure 7-27 present the contribution of the EJB tier
response time to the total response time perceived at the web tier, in both
monitoring modes. It is clear that the contribution of the EJB tier to the
total response time is significantly reduced in the case of partial
instrumentation. However, an interesting observation is that the difference
in total response time (perceived at the web tier) between the full
instrumentation mode and partial instrumentation mode, is smaller than the
difference in response times perceive at the EJB tier, in particular at higher
loads. For instance, the results corresponding to 20 simultaneous users
164

indicate a difference in web response time between the two monitoring
modes of 17.6ms whereas the corresponding difference in EJB response
times is 58.87ms.
Full Instrumentation: Web and EJB Response Time
S im u lta n e o u s U s e r s
¡9ejb contribution DU web
Figure 7-26. Full Instrumentation: Contribution of EJB Tier to W eb Tier Response Time
This could be explained by differences in behaviour between thread pooling
at the web tier and EJB instance pooling at the EJB container level. This
could generate different scalability profiles for the web and EJB containers.
In addition, when performing full monitoring, the EJB container could not
scale as well as when only partial monitoring is enabled, due to higher
collateral workloads induced by JMX activity.
165

Partial Instrumentation: Web and EJB Response Time
eoo
500
4000)E
0)g 300 o a & ë
200
100
yy
||. ¿ T
m If l 9 0 L P □5 10 20 50
Simultaneous Users
■ ejb contribution Hweb
Figure 7-27. Partial Instrumentation: Contribution of EJB Tier to Web Tier Response Time
The effect of different scalability profiles is apparent in Figure 7-28 which
presents an XY scattered plot of the instrumentation overhead in
percentages, as perceived at the web tier. Both full instrumentation and
partial instrumentation induce overhead that contributes to the increase in
the response time measured at the web tier. For small workloads, the
contribution of the EJB monitoring overhead to the total overhead
(perceived at web level) is significant, ranging approximately between 4 and
21 percent for partial instrumentation, and between 19 and 43 percent for
full instrumentation. At high workloads, however, the total perceived
overhead becomes significantly reduced, ranging from 1.4 to 2.3 percent for
partial instrumentation and between 10.7 and 13.6 percent for full
instrumentation. This is most likely cause by the web container scaling less
efficiently than the EJB container.
166

Percentile Instrumentation Overhead
Simultaneous Users
-^ —overhead full instrumentation — overhead partial Instrumentation |
Figure 7-28. Percentile Instrumentation Overhead
7.3.4 Single EJB
A CAT configuration was created with the purpose of isolating the overhead
that the monitoring probes induce. The configuration, illustrated in Figure
7-29 determines a single EJB call, facilitating the observation of the probe
overhead, separated from other container activities.
r 3
TB1' 100000; 100000
s.______ /
Figure 7-29. C A T Configuration for Single E JB Interaction
When more EJBs are involved in an interaction such as in Section 7.3.3, it is
more difficult to determine the overhead of an EJB probe, as inter
component communication may be responsible for unaccounted delays. The
resource usage parameters for the TB1 test cell are configured so that the
EJB performs a reasonable workload. In contrast to the configuration used
in Section 7.3.3 where the focus was the total overhead for a complex
interaction, this configuration containing a single test cell is designed to
showcase the behaviour of one EJB and the influence instrumentation has
over its response time as well as over the web-tier response time. By
167

performing a significant workload, the EJB contributes significantly to the
web-tier response time, highlighting the contribution of the overhead to
both the EJB tier and the web tier. This ensures that the contribution of the
EJB tier to the web tier in this configuration is similar to the contribution of
the EJB tier to the web tier in the configuration presented in Section 7.3.3.
Test runs with 1, 2, 5, 10, and 20 simultaneous users were created. Figure
7-30 presents the evolution of the response time measured at the web tier
for both the un-instrumented and instrumented versions of the test-bed. It
can be observed that both response time lines follow approximately the
same shape, suggesting that COMPAS instrumentation does not induce non-
linearities. In addition, the monitoring overhead perceived at the web tier
becomes negligible for high user workloads. This can be explained by the
different scalability of the web container in comparison with the EJB
container and the fact that COMPAS monitoring influences only the EJB tier.
For the single EJB scenario, the EJB container scales well compared to the
web container, perhaps due to better thread pool management. One reason
for this could be that the test-bed is composed of stateless session beans,
which are particularly scalable as they can be shared between clients.
Web Response Time
Simultaneous Users
no instrumentation - « —full instrumentation
Figure 7-30. Web Response Time Evolution for Single EJB
168

Figure 7-31 illustrates the contribution of the EJB tier to the total response
time perceived at the web tier. The chart clearly presents different
scalability profiles for the EJB and web containers and shows that while for
small user loads, the EJB container dominates the response time, the
situation reverses with large loads. This confirms the behaviour illustrated
by Figure 7-28.
Full Instrumentation: Web and EJB Response Time
Ia>ë0 a w&1
Simultaneous Users
□ ejb contribution «web
Figure 7-31. Single EJB: Contribution of E J B Tier to Web Tier Response Time
169

Chapter 8 Conclusions
COMPAS addresses real needs
Prototype demonstrates portability and validates probe insertion
approach
Tests prove COMPAS usability and feasibility of adaptive approach
Advantages and Disadvantages over Commercial and Academic
Approaches
Open architecture enables reuse and promotes further exploration
170

8.1 Problems Addressed
Companies increasingly rely on component-based platforms such as J2EE to
build and deploy large-scale systems. Enterprise-level services such as
security and transactions can be leveraged by developers, instead of
spending time building common enterprise infrastructure. Such applications
are assembled using components that represent the atomic units of
composition and deployment. Components are managed at runtime by
component containers that typically reside in distributed application server
domains providing extensive services including distributed transaction
management and object middleware. Containers provide lifecycle services
to the components and control their execution environment by
transparently enforcing the realisation of enterprise services and managing
threading, caching, pooling, and access to resources. In addition to
component platform services, the component development model
encourages reuse and change. Large applications typically integrate
components from several sources and usually there is no one individual that
completely understand the functionality of such a system
The performance of enterprise component systems is influenced by the
complexity of the business logic and the complexity of the runtime
platforms. In addition, since the component services are provided by
containers based on configuration contracts, the contracts and their
realisation by different containers greatly influence the overall performance.
Static performance reasoning is infeasible in such systems and runtime
performance management tools are instead needed so that meaningful
performance metrics can be extracted to match the conceptual level that is
used in developing the systems. Presenting the architectural context in
which problems occur is a fundamental requirement for taking corrective
action. Since enterprise-systems are constantly required to be operational,
monitoring tools that can continuously operate and isolate potential
hotspots, while maintaining a minimal impact on their target systems
without requiring changes to the environment, are necessary.
This thesis proposes the COMPAS performance-monitoring framework for
component based enterprise applications. COMPAS can non-intrusively
171

instrument applications by attaching component-level probes during an
automatic process based on component metadata. At runtime, COMPAS
monitors and analyses component-level events such as method invocations
and lifecycle operations. In order to maintain minimum overhead, COMPAS
uses a model-based adaptive approach that constantly adjusts the target
coverage of the active monitoring probes. Alerts are generated based on
user-definable policies and the monitoring infrastructure automatically
diagnoses and highlights the performance hotspots. The framework has an
open architecture, with predefined extension points that allow vertical and
horizontal integration of third-party modules. In addition to the monitoring
platform, the thesis proposes a process for performance management that
integrates monitoring with modelling and performance prediction.
172
8.2 Review of Contributions
This section reviews and summarises the main contributions of the thesis
and their related secondary contributions (as bulleted items).
Low overhead, component-level monitoring infrastructure
Portable, non-intrusive probe insertion process
A portable approach to instrumenting and monitoring component based
systems is proposed and described in Chapters 4 and 5. It provides non-
intrusive instrumentation capabilities by analysing the target components'
metadata and generating a proxy layer that attaches to each of them. The
proxy layer acts as a probe and intercepts all method invocation and
lifecycle events. The generation of the probes does not require access to the
source code of the target application nor changes to the application server
where the application is deployed. In addition, neither changing Java Virtual
Machine class-loaders nor the use of JVM debugging hooks are required,
which contrasts to all other related approaches. Instead, a portable
installation procedure analyses the target application's structure and
metadata and generates the appropriate monitoring probes, using reflective
techniques.
The probes process the intercepted events locally. They can then generate
notifications that are collected centrally by the monitoring dispatcher.
Extensible monitoring framework
• Dynamic Bytecode Instrumentation of J2EE Applications
Extensions can be fitted to the probes and to the monitoring dispatcher
using predefined framework extension points. The extensions allow the
addition and replacement of COMPAS functionality and customisation of
strategies such as time stamping. Using the extension points,
instrumentation can be enriched to capture more information from the
target application or the probe insertion process can be improved. An
alternative probe insertion technology is presented which leverages J2EE
management extensions to improve the application structure discovery. In
addition, a technique based on dynamic bytecode instrumentation is
presented which allows the insertion of probes into a J2EE target application
173

at runtime, without requiring the redeployment of the instrumented
application.
Adaptive monitoring and diagnosis
• Model extraction
The architecture of adaptive monitoring and diagnosis functionality is
presented in Chapter 6. The adaptation process is based on knowledge of
interaction models extracted from the target application. It leverages the
different monitoring modes available in the probes, which can be in passive
(data is analysed locally but is not sent to the dispatcher) or active
monitoring (data is analysed and sent to the dispatcher).
Models can be obtained either by using the presented Interaction Recorder
that collects traces through the EJB components, or by using lower-level
approaches such as JVM stack-traces. Regardless of how models are
obtained, they are used by the adaptation process to determine the
minimum set of components that have to be instrumented (the target
coverage). When several probes issue performance alerts, the adaptation
module performs diagnosis in order to determine the origin of the
performance problem. Based on the hotspot location, target coverage can
change automatically to include the hotspot probe in the active monitoring
set.
Basic anomaly-detection techniques and a discussion about possible
comprehensive strategies are presented. External strategies can be added
using framework extension points to the alert generation logic in the probes
in order to improve the hotspot detection accuracy.
Two strategies for adaptation and diagnosis are presented in Chapter 6:
collaborative and centralised. The collaborative approach involves probes
with a high degree of autonomy and capable of intercommunicating. Upon
detection of a performance anomaly, they communicate with neighbouring
probes (in relation to participating interactions) and compare measurements
in order to determine the root cause of the anomaly. The monitoring
dispatcher is therefore not involved in the decision process.
The centralised approach employs less independent probes and more
communication with the monitoring dispatcher. Probes do not communicate
with each other and do not attempt to detect the root cause of a detected
174

anomaly. Instead, they notify the monitoring dispatcher of any anomaly. In
turn, the monitoring dispatcher uses model knowledge to filter redundant
alerts and identify the hotspot origin.
Framework for performance management
The main contributions of the thesis are place into the wider context of a
proposed complete performance management solution that uses three inter
related modules: monitoring, modelling and performance prediction.
Monitoring and modelling are connected in a feedback loop that drives the
monitoring adaptation process and the continuous update of performance
models. The performance models can be used in simulations by the
prediction module, which aims at providing automatic forecasts about
potential performance problems. The complete solution if implemented
facilitates design comprehension by providing complete UML models,
extracted from the running system. The models, augmented with
performance information and presented in UML are organised in realisation
hierarchies. They can be navigated horizontally, at the same realisation
level, and vertically between realisation levels. The navigation process is
intended to help in managing the complexity of the design information when
searching for a performance problem.
Flexible performance test-bed
The COMPAS Adaptation Test-bed (CAT) presented in Chapter 7 can be used
to create and control artificial EJB systems for testing and validation
purposes. Using CAT, several interactions can be created and executed,
with the ability to inject faults in the artificial components. This can prove
useful in testing J2EE middleware infrastructure. CAT was used in the thesis
to validate the benefits of model-based adaptive monitoring.
175

8.3 Comparison with Academic Approaches
This section contrasts COMPAS with related frameworks, approaches and
techniques. Several related projects were analysed in Chapter 2 and a
summary of their advantages and disadvantages in relation with COMPAS is
presented in this section.
General Software Performance Engineering Approaches
The main disadvantage of approaches for performance engineering such as
SPE-ED [75] is that they require developers to create models of their
applications and annotate them with performance data such as CPU and
memory utilisation. For complex systems based on component-based
platforms such as EJB, this task becomes impossible due to the large
number of management services provided by the application servers, such
as caching, pooling, persistence and clustering. It is important to have
means to extract data from a running system at the appropriate level of
granularity in order to reduce the need for developer assumptions. The
framework presented in this thesis extracts simplified performance data
such as method execution time by monitoring live versions of the
application under development, and creates UML [71] performance models
automatically. Such models can discover anti-patterns in the application
implemented in a particular technology, which are not necessarily bad
practices in other component technologies. The anti-pattern detection
engine can have different profiles (e.g. one for EJB, one for .NET)
depending on the technology being used by the developers. A knowledge
base such as [18] can be used to drive the anti-pattern detection so that
only relevant anti-patterns [105] are discovered for a particular technology.
The generated UML models, like the SPE models, become increasingly
detailed as more information is obtained, that is, as development
progresses through iterations.
OAT [43] is an approach for performance modelling of distributed
applications that maps UML models with queuing networks in order to
predict system performance. Developers must create the models, which
contrasts to the automated model-extraction approach in COMPAS. In
addition, OAT offers a layered approach to abstractions that is not as
176

semantically rich as the MDA [58] specification proposed by COMPAS, which
offers a better model for such abstractions.
Results from case studies such as [46] prove that performance prediction in
J2EE systems can be approached successfully with techniques such as
queuing networks. However, while [46] does not focus on EJB-level analysis
COMPAS enables performance prediction techniques to be applied at
component-level.
Generic Monitoring Approaches
Remote Reflection [69][68] is a technique for dynamic introspection and
alteration of distributed Java applications. Using Remote Reflection, a
facility to inject a proxy layer into distributed target components, without
requiring changes to the Java Virtual Machines [68] could be provided. Such
a facility can be integrated in COMPAS as an alternative means to the probe
insertion process (Section 5.1).
At a high-level, parts of the generic conformance-testing framework
presented in [20] contain similarities with COMPAS, in particular the use of
probes and the event-distribution middleware. However, although the
authors claim their framework targets component-based systems, they are
mostly referring to network elements such as firewalls and routers. There is
no component-level [97] semantic layer, as it is the case in COMPAS.
Furthermore, the presented framework employs a grey-box approach,
which requires user intervention in particular for revealing appropriate
probe-insertion points and semantics. By contrast, COMPAS uses a black-
box approach that leverages component semantics to insert monitoring
probes and that matches precisely and unambiguously the composition level
used in application development.
Aspect Oriented Programming [8] uses pointcuts to mark important events
in a program's execution, such as entering and exiting method calls. An
advice [45] for these pointcuts can be defined to perform similar
functionality to that of the COMPAS-generated hooks (Section 5.1).
Although this approach would still require the generation of code (the
explicit pointcuts), the amount of generated code can be smaller than in the
current COMPAS inheritance-based approach. This marginal advantage is
decisively outweighed by the disadvantages of using aspect-based
177

techniques. A special compiler would be needed to weave the generated
aspects into the target application, which might pose problems in enterprise
environments that COMPAS targets. This is because such compilers are still
not production-ready and therefore not fully adopted by the industry.
COMPAS currently uses the compiler available in the target enterprise
setting to build the generated proxy hooks. Lastly, the runtime footprint
when using aspects might be more significant as additional objects are
typically created corresponding to the aspects.
An alternative to the current COMPAS probe insertion process (Section 5.1)
is the use of container plug-ins such as the JBoss interceptors [41]. A
custom COMPAS interceptor could be added to the sequence of already
existing container-interceptors, which are used to handle component calls.
The custom interceptor could perform the functionality of the generated
proxy hooks and capture the relevant component events (business method
calls and lifecycle callbacks). One advantage of the interceptor-based
approach is that there would be no need to perform the CPI process. In
addition, there would be no need to redeploy the instrumented application;
however, the same advantages could be obtained by using dynamic
bytecode instrumentation techniques discussed in Section 5.2. The major
disadvantage of using JBoss interceptors is the loss of portability, as this
would render COMPAS useful only in relation to the JBoss application server.
Since portability is a crucial differentiator of the COMPAS framework, and
the advantages of the interceptor approach are not decisive, COMPAS does
not employ such an approach as the default instrumentation technique.
However, using the Instrumentation FEP (Section 4.4), this approach can be
used with COMPAS in a JBoss-only environment and such an
implementation has been performed as indicated in [22][21].
Adaptive Monitoring Approaches
The autonomic computing initiative [44] outlines the main requirements for
management solutions that can be used in long-running enterprise systems.
One of the main requirements is the availability of a low overhead, self-
adaptive monitoring infrastructure that can provide continuous information
about the application performance.
It is envisaged that COMPAS could be integrated in any J2EE container and
provide a reflective property that could enable applications to reflect upon
178

themselves in performance management terms. Since the middleware
would be providing COMPAS services, there would be no need for an
installation procedure anymore. In such an environment, if an application
were enabled for adaptation, it could use the performance information to
optimise its behaviour; this approach comes to support the autonomic
computing initiative for self-optimising systems. Therefore, in the context of
the autonomic computing initiative, COMPAS can be considered a basic self-
adaptive monitoring facility that can help in driving the adaptation process
for self-adaptive applications. Adaptation systems are already using
[23][22] or considering using [101][102] COMPAS as the monitoring
infrastructure that drives the adaptation process.
COMPAS corresponds in intent, scope and general architecture to the
requirements outlined in [36] for agent-based monitoring systems. The
adaptation models presented in this thesis address the need for overhead
reduction and adaptation to the application's environment, do not depend
on a global clock, and provide a robust, distributed and collaborative
environment which can scale and adapt to the target application's needs.
JAMM [98] is an adaptive monitoring infrastructure for grid environments. It
activates and deactivates monitoring components based on the detection of
activity on certain communication ports. In contrast, the COMPAS
adaptation schemes do not rely on the detection of activity but rather on
the detection of performance alerts. Since JAMM is not concerned with
monitoring software entities such as components, it cannot use model
information to optimize the monitoring overhead. It can be stated that
JAMM is concerned with performance issues in the deployment architecture
of a system (i.e. which nodes are performing badly and why) whereas
COMPAS pinpoint performance issues in the software architecture of the
system (i.e. which software components are performing badly and in which
execution context).
Software tomography [14] is a technique for lightweight monitoring of
software systems that involves the dynamic placement of subtask probes to
different program instances. It is similar to COMPAS in that both approaches
aim at incurring minimum overhead by adapting the monitoring scope.
COMPAS probes however match the conceptual level of their targets, the
EJB components. Component metadata is used to generate the probes and
179

system interaction models drive the adaptation process. In COMPAS, the
adaptation of probes is based on automatic diagnosis of performance
hotspots and on the probe's target location in the enclosing interactions.
The COMPAS adaptation process differs from the adaptive feature in
software tomography based on dynamic reassignment of subtasks to
instances, mostly due to the different nature of the COMPAS probes that are
bound to their targets but also due to different probe semantics.
The agent-based financial monitoring system presented in [108] is similar
to COMPAS in the use of adaptive monitoring techniques that use
knowledge about transactions to change the monitoring scope. One
difference between the two systems is that that the knowledge used by
COMPAS is obtained by recording interactions whereas in [108] prior
knowledge about the trading models is used. In addition, the financial
monitoring system focuses on measurements that can indicate potential
fraud issues or trading problems, whereas COMPAS focuses entirely on
performance issues. Furthermore, COMPAS uses only one simple type of
agent (the proxy) which contrasts to [108] where a hierarchy of agents is
needed in order to efficiently monitor the mostly human-driven operations
in the financial organisation. Lastly, COMPAS is concerned with performance
aspects in enterprise software applications, at the component level,
contrasting with the focus on organisational problems at the process level,
as described in [108].
180

8.4 Comparison with Commercial
Approaches
Several commercial performance management tools for Java and J2EE
systems are available. This section compares them with COMPAS and
presents a feature-matrix highlighting important similarities and differences.
One of the most significant differentiators is that COMPAS is a monitoring
framework that allows third parties to add and change a multitude of
aspects. All the commercial tools have proprietary, stand-alone
architectures that allow only minimal integration with other predefined plug
ins. COMPAS provides a completely functional, extendable base platform for
instrumenting, monitoring and analysing enterprise applications, whereas
the commercial tools provide detailed and feature-rich, non-extendable
solutions.
In contrast to the commercial tools (and other academic approaches),
COMPAS proposes a completely portable instrumentation infrastructure that
does not depend on changes to the target runtime environment or target
application. Many other approaches use application server or JVM-level
hooks to insert monitoring probes. They support the leading application
servers, such as IBM WebSphere and BEA Weblogic, however for users of
open-source or application servers with smaller market size, it is difficult to
find and use any performance management products.
An additional major difference between COMPAS and related approaches is
the use of self-adaptive techniques for automatically adjusting target
coverage. This ensures that monitoring overhead is constantly maintained
at a minimum value, without compromising accuracy. The alert detection
(Section 6.4) mechanism in COMPAS provides a basic strategy based on
simple thresholds and provides a standard framework for adding complex
strategies that can be based on historical analysis and environmental
properties. This contrasts to the approach taken in the commercial tools
that typically only provide threshold-based alert generation and do not allow
the addition of custom strategies.
The last major difference between COMPAS and the related commercial
tools is the use of models and UML to facilitate the comprehension of the
181

application design and performance hotspots. The proposed COMPAS
framework (Chapter 3) uses models at different realisation levels to help
users manage the complexity of the presented information. The Interaction
Recorder (Section 6.3) can extract and present execution models
augmented with performance information, helping in the design validation
process as well as in the localisation of the performance problems.
Quest Software's products Performasure [66], Foglight [64] and Spotlight
[67] provide a complete performance management solution for J2EE
applications. They can be used in testing or operational environments and
provide in-depth interaction tracing, alert generation and expert advice.
Mercury Interactive's J2EE tools [53] (Diagnostics, Deep Diagnostics and
Monitoring & diagnostics) focus on optimising the quality and performance
of J2EE applications both in development and production stages.
Wily Technologies' Introscope [111] provides a low overhead monitoring
facility that uses agents inserted in the application servers to collect data
from any J2EE component in deployed applications. Introscope has a base
layer that is relatively independent of the application server being used
(although it still requires it to be started in special mode as it uses JVM
hooks) and provides server extensions. The extensions collect and analyse
server-specific metrics and although they appear similar to the COMPAS
framework extension points (Section 4.4), they are much more confined in
scope, being restricted to environment data sources at the server side. In
COMPAS, framework extension points can be used to add both data sources
and data consumers at the client side as well as at the server side.
The Veritas i3 solution [104] (composed of Indepth, Inform and Insight)
aims at detecting, diagnosing and correcting performance problems in J2EE
systems. It can automatically raise alerts based on simple thresholds, helps
in drilling down to the appropriate tier (web, EJB or database) and store
information for detailed trend analysis. The performance information is
presented at different architectural levels (from coarse-grained application
tiers to Java method invocations and SQL statements). However,
component-level architectural information is not available and although the
developers can identify the low-level constructs responsible for performance
degradation, they cannot easily put this information into the appropriate
architectural context of the application.
182

Borland provides solutions that span the full application lifecycle, from
development to deployment. Optimizeit Enterprise Suite [12] can be used
during development and testing while Optimizeit ServerTrace DataCenter
[13] is aimed at runtime operation, during testing and deployment.
Applications can be monitored and information presented both at the J2EE
component-level as well as the Java class level. In addition, comprehensive
resource information is available related to server availability, database and
messaging systems.
Cyanea/ONE [19] is a performance management product that uses specific
appiication-server hooks to instrument and monitor J2EE applications.
Available only for two major application servers, it employs extensive
resource monitoring techniques and provides a broad view of the systemic
performance parameters. Although there are multiple resource-oriented
views (e.g. server availability, database parameters, memory, threads) it
offers only basic stack traces and no component-level interactions. Using
sampling-based monitoring, Cyanea/ONE can be instructed to dynamically
change the scope and breadth of the instrumentation, reducing the overall
overhead when required. This facility however is not similar to the dynamic
adaptation functionality in COMPAS (Chapter 6) which automatically
changes the target coverage without resorting to sampling techniques and
without requiring user intervention.
Table 8-1 summarizes the differences between COMPAS and related
commercial J2EE performance products. It is organised as a feature matrix
with rows representing the most relevant features in the context of this
thesis. The first six columns present the availability of the features in the
products of six different vendors and the last column illustrates the features'
availability in COMPAS. The columns' headings contain vendor names and
not product names since several vendors provide multiple products that
cooperate in achieving performance management functionality.
The first four features, portability, adaptability, custom extensions and UML
Diagrams [71] are provided only by COMPAS and are not available in
commercial implementations. Portability refers to independence from any
server or JVM hooks as well as from any operating system or any
environmental feature. Adaptability refers to the COMPAS capability to
adapt the active monitoring target coverage, based in interaction models,
183

without affecting diagnosis capabilities. Custom extensions refer to
architectural extension points that can be used by third parties to add
functionality to the framework (Framework Extension Points - FEPs in
COMPAS, Section 4.4). UML Diagrams are generated by COMPAS
automatically based on an interaction recording process.
The last six rows in the table represent features that most of the tools
implement and that COMPAS either implements or facilitates with FEPs.
High-level Interactions refers to the presentation of performance
information at the component-level. Low-level Call-Graphs refers to the
class-level stack traces or aggregated call-graphs. Performance alert
generation is available in all the commercial products and is typically based
on simple thresholds. Web and EJB refer to the instrumented tiers and the
type of components that can be monitored. COMPAS does not support web
components but its infrastructure can be leveraged to add support for such
components. Details (JVM / DB) refers to the capability to display resource-
level information such as JVM heap utilisation, database connection pools
and server availability. COMPAS can be extended to provide such
information by using a combination of input and output FEPs (Section 4.4).
184

Table 8-1. COMPAS vs. J2EE Performance Management Products
Que
st So
ftwar
e
Mer
cury
In
tera
ctiv
e
Wily
Te
chno
logi
es
If)
1•aM¡> B
orla
nd
Cyan
ea
CO
MPA
S
Portability NO NO NO NO NO NO YES
Adaptability NO NO NO NO NO NO YES
Custom Extensions NO NO NO NO NO NO YES
UML Diagrams NO NO NO NO NO NO YES
High-Level YES YES YES NO YES NO YES
Interactions
Low-Level Call- YES YES NO YES YES YES FEP
Graphs
Alerts YES YES YES YES YES YES YES
Web YES YES YES YES YES YES FEP
EJB YES YES YES YES YES YES YES
Details (JVM/DB) YES YES YES YES YES YES FEP
185

8.5 Validation
Testing the COMPAS framework proved difficult especially in the case of
monitoring adaptation and diagnosis features. Sample J2EE applications
that are available do not easily accommodate the introduction of
performance hotspots in a deterministic manner, which is a desired
requirement in testing the diagnosis and adaptation capabilities. A test-bed
was designed and implemented that allows flexible runtime configurations
consisting of dynamic calling patterns and resource usage. The test-bed,
consisting of configurable test-bed cells, can change the behaviour and
performance of the running components at runtime. This allows precise
injection of performance hotspots, which can validate the correct
functionality of the monitoring infrastructure.
The COMPAS prototype and experimental results are presented In Chapter
7. A complete monitoring implementation prototype has been functionally
tested with several applications such as Sun Microsystems' Petstore [88]
and IBM's Trade3 [38]. In addition, COMPAS has been deployed successfully
on commercial applications. The portability of the framework has been
tested by successfully deploying COMPAS on several combinations of
application servers and operating systems. Client consoles that connect to
the monitoring dispatcher have been implemented. They can display real
time or recorded events received from the probes and control the
adaptation behaviour by recording and activating models.
Performance measurements have been performed using stress-testing tools
to determine the overhead of the monitoring process. Results show that
COMPAS does not introduce non-linearities in the target system, an
essential condition in operational environments. In addition, the overhead
on the target system is acceptable in particular for high loads and when
adaptive monitoring techniques are used. Measurements demonstrate that
the use of model knowledge in monitoring results in a significant reduction
of overhead, a property that is particularly useful in long-running systems
which exhibit performance problems only occasionally. The ability to adapt
the active monitoring target coverage does not involve selective monitoring
or sampling, rather the use of model knowledge ensures that the borders of
186

the system (points of entry) are constantly monitored and isolated
anomalies are not skipped.
187

8.6 Limitations and Further Exploration
The COMPAS framework provides a base platform for performing
instrumentation and monitoring operations in J2EE systems. The use of
adaptation techniques facilitates deployments on long running systems. The
non-intrusive portable instrumentation approach ensures that COMPAS can
be deployed on any J2EE application running on any J2EE-compliant
application server. The framework extension points enable addition of
COMPAS enhancements as well as integration of COMPAS with a wide range
of potential applications that require monitoring information. Several
projects already use or are evaluating COMPAS as part of their functionality.
Several limitations of the framework are derived from its portable and non-
intrusive architecture, while others originate in its adaptive monitoring
capabilities:
• High-level performance data extraction: COMPAS can only extract
component-level performance parameters as it uses component
metadata to insert the probes. However, using the instrumentation
FEP, low-level performance information could be extracted as well, as
illustrated in Section 5.2. This could also drive the display of lower-
level call-graphs, corresponding to intra-component method calls.
• Static application instrumentation: the COMPAS Probe Insertion
process involves static analysis of the target application and generation
of probes corresponding to the application's components. The process
execution concludes by generating a new, instrumented application
that must be redeployed in the operational environment. This
disadvantage can be eliminated using the instrumentation FEP to
enable runtime probe insertion as illustrated in Section 5.2.
• Recording-based model extraction approach: when extracting the
component interactions, COMPAS requires that no more than one
interaction be executed for the duration of the recording process.
Simultaneous interactions are not supported due to the lack of
interaction identifiers associated with method calls. This situation could
be improved using the instrumentation FEP to enable the addition of
call-specific identifiers.
188

• Simple anomaly-detection approach: to prove the feasibility of using
adapting the monitoring focus based on model-knowledge and
detection of alerts, a simple threshold-based alerting system has been
implemented. This could be further extended using the alert FEP.
Directions for further exploration include:
• Anomaly detection techniques, targeted at J2EE systems, which can
benefit from information extracted by COMPAS. Such techniques can
either be implemented at the probe level, in case of low cost
operational cost, or can be placed at the monitoring dispatcher level for
complex decoupled analysis.
• Diagnosis and adaptation techniques, based on statistical learning
could improve the accuracy and performance of probe activation and
deactivation operations.
• Specialised data analysis and visualisation techniques could use raw
data extracted by COMPAS to present complex results and graphs
corresponding to different application perspectives (e.g. high-level
business metrics or low-level technical details).
189

Bibliography
[1] I. Abdul-Fatah, S. Majumdar, Performance of CORBA-Based Client-Server Architectures, IEEE Transactions on Parallel and Distributed Systems, Vol. 13, No. 2, February 2002
[2] C. Albert, L. Browfnsword, Meeting the Challenges of Commercial-Off-The- Shelf (COTS) Products: The Information Technology Solutions Evolution Process (ITSEP), International Conference on Component Based Software Systems (ICCBSS) 2002, LNCS 2255, Springer-Verlag Berlin Heidelberg,2002, pp. 10-20
[3] G. Ammons, T. Ball, and J. Larus, Exploiting hardware performance counters with flow and context sensitive profiling, In Proceedings of the ACM SIGPLAN Conference on Programming Language Design and Implementation (PLDI-97). ACM Press, 1997
[4] Apache Software Foundation, Ant, http://ant.apache.org
[5] Apache Software Foundation, Apache Velocity Template Engine, http://iakarta.apache.org/velocitv/
[6] Apache Software Foundation, Apache XML Project, http://xml.apache.org
[7] Apache Software Foundation, Log4j, http://iakarta.apache.org/log4i/
[8] Aspect Oriented Software Development Community, http://aosd.net
[9] S. Balsamo, A. Di Marco, P. Inverardi, M. Simeoni, Model-Based Performance Prediction in Software Development: A Survey, IEEE Transactions on Software Engineering, Vol. 30, No. 5, MAY 2004, pp. 295-310
[10] BEA Systems, BEA Weblogic Server 8,http ://www. bea, com/framework. isp?CNT-index.htm&FP=/content/products/s erver
[11] K. Beck, Extreme Programming Explained, Addison Wesley, 31 October, 1999
[12] Borland Software Corporation, Optimizeit Enterprise Suite, http://www.borland.com/optimizeit
[13] Borland Software Corporation, Optimizeit ServerTrace 2, DataCenter, http://www.borland.com/opt servertrace/
[14] J. Bowring, A. Orso, and M.J. Harrold. Monitoring Deployed Software Using Software Tomography. Proceedings of the ACM SIGPLAN-SIGSOFT Workshop on Program Analysis for Software Tools and Engineering (PASTE 2002), November 18-19, 2002, Charleston, SC
[15] E. Cecchet, J. Marguerite, W. Zwaenepoel. Performance and scalability of EJB applications. In Proceedings of the 17th ACM Conference on Object-Oriented Programming, Systems, Languages, and Applications (OOPSLA), November 2002, Seattle, WA
[16] J. Cheesman, J. Daniels, UML Components, Addison Wesley, October 2001
190

[17] P.C. Clements, Coming Attractions in Software Architecture, No.CMU/SEI-96- TR-003, Software Engineering Institute, Carnegie Mellon University, February 1996
[18] J. Crupi, D. Alur, D. Malks, Core J2EE Patterns, Prentice Hall, 30 September, 2001
[19] Cyanea Systems, Cyanea/ONE, http://www.cvanea.com/solution home.html
[20] P. H. Deussen, G. Din, I. Schieferdecker, An On-line Test Platform for Component-based Systems, Proceedings of 27th IEEE / NASA Goddard Software Engineering Workshop (SEW-27'02)
[21] A. Diaconescu, A. Mos, J. Murphy, Automatic Performance Management in Component Based Software Systems. Proceedings of IEEE International Conference on Autonomic Computing (ICAC), May 2004, New York
[22] A. Diaconescu, J. Murphy, A Framework for Automatic Performance Monitoring, Analysis and Optimisation of Component Based Software Systems, Workshop on Remote Analysis and Measurement of Software Systems at 26th International Conference on Software Engineering (ICSE), May 24 2004, Edinburgh, Scotland, UK
[23] A. Diaconescu, J. Murphy, A Framework for Using Component Redundancy for Self-Optimising and Self-Healing Component Based Systems, WADS workshop, ICSE'03, Hilton Portland, Oregon USA, May 3-10, 2003
[24] E. Dimitrov, A. Schmietendorf, R. Dumke UML-Based Performance Engineering Possibilities and Techniques, IEEE Software, Vol. 19, No. 1, January/February 2002
[25] Distributed Management Task Force, Inc. Common Information Model (CIM) Specification Version 2.2, June 14, 1999
[26] Distributed Systems Group at Charles University in Prague, http://nenva.ms.mff.cuni.cz/
[27] M. Dmitriev, Design ofJFIuid: Profiling Technology and Tool Bases on Dynamic Bytecode Instrumentation, Sun Microsystems Technical Report 2003-0820.
[28] M. Dmitriev, Profiling Java applications using code hotswapping and dynamic call graph revelation, Proc. 4th Intl. Workshop on Software and Performance, January 2004
[29] Eclipse Project, http://www.eclipse.ora
[30] ej-technologies, JProfiler, http://www.ej-technologies.com/products/jprofiler/overview.html
[31] Empirix, Bean Test,www. empirix. com/empirix/web+test+monitorina/products/
[32] H. H. Feng et al., Anomaly Detection Using Call Stack Information, IEEE Symposium on Security and Privacy, 2003 IEEE Symposium on Security and Privacy, May 11 - 14, 2003, Berkeley, CA
[33] M. Fleury, JMX: Managing J2EE with Java Management Extensions, Sams, 8 February 2002
[34] E. Gamma, R. Helm, R. Johnson, J. Vlissides, Design Patterns - Elements of Reusable Object Oriented Software, Addison-Wesley, NY, 1995
[35] Gartner, Inc. High-Availability Networking: Toward Zero Downtime,September 16, 2002
[36] D. Hart, M. Tudoreanu, E. Kraemer, Mobile Agents for Monitoring Distributed Systems, Proceedings Fifth International Conference on Autonomous Agents, AGENTS'01, May 28 - Junel, 2001, Montreal, Quebec, Canada
191

[37] IBM, IBM Websphere 5 Application Server, http://www- 306.ibm.com/software/websphere/info/platformv5/index.isp
[38] IBM, Trade3: Benchmark sample for WebSphere 5.0 and J2EE 1.3, http://www-306.ibm.com/software/webservers/appserv/benchmark3.html
[39] K. Ilgun, R. A. Kemmerer, P. A. Porras, State Transition Analysis: A Rule- Based Intrusion Detection Approach, IEEE Transactions on Software Engineering, March 1995, pp. 181-199
[40] Java & Internet Glossary, http://mindprod.com/ialoss/time.html
[41] JBoss, The JBoss Application Server, http://www.iboss.org/products/ibossas
[42] R. Johnson, B. Foote, Designing Reusable Classes, Journal of Object-Oriented Programming, June/July. 1988, pp. 22-35
[43] P. Kähkipuro: UML Based Performance Modelling Framework for Object- Oriented Distributed Systems, Proc. 2nd International Conference on the Unified Modeling Language: beyond the standard, UML '99, 1999, 356-371
[44] J. 0. Kephart, D. M. Chess, The Vision of Autonomic Computing, IEEE Computer, January 2003
[45] G. Klczales et al. Getting Started with AspectJ, Communications of the ACM, October 2001, Vol. 44, No. 10, pp. 59-65
[46] S. Kounev and A. Buchmann, Performance Modeling and Evaluation of Large- Scale J2EE Applications, Proceedings of the 29th International Conference of the Computer Measurement Group (CMG) on Resource Management and Performance Evaluation of Enterprise Computing Systems (CMG-2003), Dallas, Texas, December 7-12, 2003
[47] P. Krutchen, Rational Unified Process, Addison Wesley, April 2000
[48] F. Lange, R. Kroeger, M. Gergeleit, JEWEL: Design and Measurement of a Distributed Measurement System, IEEE Transactions on Parallel and Distributed Systems, November 1992
[49] A. Lee, J. Murphy, L. Murphy, The Performance of Component-based Software Systems, Proc. of the UK Computer Measurement Group (CMG) Annual Conference, May 2003
[50] D.-W. Lee, R.S. Ramakrishna, VIsOK: A Flexible Visualization System for Distributed Java Object Application, Proceedings of 14th International Parallel and Distributed Processing Symposium (IPDPS'OO), May 2000, pp. 393
[51] T.-K. Liu, S. Kumaran, Z. Luo, Layered Queuing Models for Enterprise JavaBean Applications, Proc. 5th International Enterprise Distributed Object Computing Conference (EDOC), Seattle, WA, USA, 4-7 September 2001
[52] R. A. Maxion, K. M.C. Tan, Benchmarking Anomaly-Based Detection Systems, Proceedings International Conference on Dependable Systems and Networks (DSN 2000), June 25 - 28, 2000, New York, NY
[53] Mercury Interactive Inc, Mercury J2EE Solutions, http://www.mercury.com/us/solutions/j2ee/
[54] Meta Group, Integration & Development Strategies, http://www.metagroup.com/products/insiahts/ids trends.html
[55] A. Mos, The COMPAS Project home page-, http://eibperformance.ora
[56] J. Murphy, A. Lee, Performance Modelling of Mobile and Middleware Systems, Proc. of Performance Engineering Conference, May 2003
[57] Object Management Group, CORBA Component Model, http://www.omg.org/technologv/documents/formal/components.htm
192

[58] Object Management Group, Model Driven Architecture, OMG document number ormsc/2001-07-01, OMG, 2001
[59] Object Management Group, UML Profile for Enterprise Distributed Object Computing Specification, OMG document number ptc/02-02-05, OMG, 2002
[60] Object Management Group, UML Profile for Schedulability, Performance, and Time Specification, OMG document number ptc/02-03-02, OMG, 2002
[61] Open System Testing Architecture (OpenSTA), http://www.opensta.org
[62] D.C. Petriu and H. Shen, Applying UML Performance Profile: Graph Grammar- Based Derivation of LQN Models from UML Specifications, Proc. Seventh Int'l Conf. Modelling Techniques and Tools for Performance Evaluation, pp. 159- 177, 2002
[63] D.C. Petriu, H. Amer, S. Majumdar, I. Abdul-Fatah, Using Analytic Models for Predicting Middleware performance, Proc. 2nd ACM Int. Workshop on Software and Performance (WOSP'OO), Ottawa, Canada, September 2000
[64] Quest Software, Foglight, http://www.quest.com/foglight/
[65] Quest Software, JProbe Java Profiler,http://iava.quest.com/iprobe/iprobe.shtml.
[66] Quest Software, PerformaSure, http://www.quest.com/performasure/
[67] Quest Software, Spotlight, http://www.quest.com/spotlight-portal/
[68] M. Richmond, Flexible Migration Support for Component Frameworks, Doctoral Dissertation, Department of Computing, Macquarie University, January, 2003
[69] M. Richmond, J. Noble, Reflections on Remote Reflection, Australasian Computer Science Conference (ACSC) 2001, Brisbane, Jan 2001
[70] E. Roman, S. W. Ambler, T. Jewell, Mastering Enterprise Java Beans Second Edition, Wiley Computer Publishing, 2002
[71] J. Rumbaugh, I. Jacobson, G. Booch, The Unified Modelling Language Reference Manual, Addison-Wesley 1999, pp 367
[72] T. Ryutov, C. Neuman, D. Kim, Li Zhou, Integrated Access Control and Intrusion Detection for Web Servers, IEEE Transactions on Parallel and Distributed Systems, September 2003, pp. 915-928
[73] H. A. Schmid, Systematic framework design by generalization, Communications of the ACM, Volume 40, Issue 10, October 1997, pp. 48 - 51
[74] Segue, SilkTest, www.segue, com/html/s solutions/s silktest/s silktest toc.htm
[75] C.U. Smith, L.G. Williams, Performance and Scalability of Distributed Software Architectures: An SPE Approach, Parallel and Distributed Computing Practices, 2002
[76] C.U. Smith, L.G. Williams, Performance Solutions: A Practical Guide to Creating Responsive, Scalable Software (1st Edition), Addison-Wesley, September 17, 2001
[77] T. Souder, S. Mancoridis, M. Salahm, Form: A Framework for Creating Views of Program Executions, In Proceedings of IEEE International Conference on Software Maintenance ICSM'01, Florence, Italy, November 2001
[78] B. Sridharan, S. Mundkur, A.P. Mathur, Non-intrusive Testing, Monitoring and Control of Distributed CORBA Objects, TOOLS Europe 2000, St. Malo, France, June 2000
[79] B. Sridharan, B. Dasarathy and A. P. Mathur, On Building Non-intrusive Performance Instrumentation Blocks for CORBA-based Distributed Systems,
193

4th IEEE International Computer Performance and Dependability Symposium, Chicago March 2000
[80] Standish Group, The CHAOS Report (1994),http://www.standishqroup.com/sample research/chaos 1994 l.php
[81] Sun Microsystems, ECperf Specification Version 1.1, April 16, 2002
[82] Sun Microsystems, Enterprise JavaBeans™ Specification Version 2.1, Santa Clara, CA, November 12, 2003
[83] Sun Microsystems, J2EE Compatibility & Java Verification, http://iava.sun.com/i2ee/verified/index.isp
[84] Sun Microsystems, J2EE Management Specification - Final Release 1.0, http://icp.org/isr/detail/77.isp
[85] Sun Microsystems, Java™ 2 Platform Enterprise Edition Specification, vl.4, Santa Clara, CA, November 2003
[86] Sun Microsystems, Java Applets, http://iava.sun.com/applets/
[87] Sun Microsystems, Java Architecture for XML Binding (JAXB) Specification 1.0 - Final Draft, http://iava.sun.com/xml/downloads/iaxb.html
[88] Sun Microsystems, Java BluePrints: Java Pet Store Sample Application v. 1.3.1_02,htl:p://iava.sun.com/blueprints/code/index.html#iava pet store demo
[89] Sun Microsystems, Java Core Reflection Specification version 1.3, Palo Alto California, December 1999
[90] Sun Microsystems, Java Management Extensions Instrumentation and Agent Specification, vl.2, Santa Clara, CA, October 2002
[91] Sun Microsystems, Java Message Service Specification, v l . l , Santa Clara, CA, April 2002
[92] Sun Microsystems, Java Naming and Directory Interface, Application Programming Interface and Specification Version 1.2, July 1999, http://iava.sun.com/products/indi/docs.html
[93] Sun Microsystems, Java Remote Method Invocation (Java RMI) Specification Version 1.4, http://iava.sun.eom/i2se/l.4.2/docs/auide/rmi/spec/rmiTOC.html
[94] Sun Microsystems, Java Server Pages™ Specification Version2.0, Santa Clara, CA, November 24, 2003
[95] Sun Microsystems, Java™ Servlet Specification Version 2.4, Santa Clara, CA, November 24, 2003
[96] Sun Microsystems, Sun Java System Application Server http://wwws.sun.com/software/products/appsrvr/home appsrvr.html
[97] C. Szyperski, D. Gruntz, S. Murer, Component Software: Beyond Object- Oriented Programming, Second Edition, Addison-Wesley, November 2002
[98] B. Tierney et ai., A Monitoring Sensor Management System for Grid Environments, In Proceedings of Ninth IEEE International Symposium on High Performance Distributed Computing (HPDC'OO) , August 01 - 04, 2000, Pittsburgh, Pennsylvania
[99] Tigris.org, ArgoUML, http://arqouml.tigris.org/
[100]Tigris.org, Java Graph Editing Framework, http://gef.tigris.org/
[101]M. Trofin, J. Murphy, A Self-Optimizing Container Design for Enterprise Java Beans Applications, 8th International Workshop on Component Oriented
194

Programming (WCOP), part of the 17th European Conference on Object- Oriented Programming (ECOOP), July 2003, Darmstadt, Germany
[102]M. Trofin, J. Murphy, Using Runtime Information for Adapting Enterprise Java Beans Application Servers, Second International Workshop on Dynamic Analysis (WODA) at 26th International Conference on Software Engineering (ICSE), May 24 2004, Edinburgh, Scotland, UK
[103]T. K. Tsai et al., Stress-Based and Path-Based Fault Injection, IEEE Transactions on Computers, November 1999, pp. 1183-1201
[104] Veritas, Veritas i3,http ://www.veritas.com/Products/www?c=subcateaorv&.refId = 161
[105]A. I. Verkamo, J. Gustafsson, L. Nenonen, J. Paakki, Design Patterns in Performance Prediction, Proc. 2nd International Workshop on Software and Performance (WOSP'OO), Ottawa, Canada, September 2000
[106]W3C, Document Object Model Specification, http://www.w3.org/DOM/
[107]W3C, Extensible Markup Language (XML) 1.0 (Second Edition), W3C Recommendation 6 October 2000, http://www. w3.ora/TR/REC-xml
[108]H. Wang, J. Mylopoulos, S. Liao, Intelligent Agents and Financial Risk Monitoring Systems, In COMMUNICATIONS OF THE ACM March 2002/Vol. 45, No. 3
[109]R. Weinreich, W. Kurschl, Dynamic Analysis of Distributed Object-Oriented Applications, Proc. Hawaii International Conference On System Sciences, Kona, Hawaii, January 6-9, 1997
[110]L.G. Williams, C.U. Smith, Performance Engineering Evaluation of Software Architectures, Proc. First International Workshop on Software and Performance (WOSP'98), Santa Fe, NM, USA, October 1998
[111] Wily Technology, Introscope,http://www.wilvtech.com/solutions/products/Introscope.html
[112]M. Wooldridge, An Introduction to MultiAgent Systems, John Wiley & Sons Ltd., England, 2002
195