A Forrester Total Economic Impact Study
32
A Forrester Total Economic Impact™ Study Prepared For IBM The Total Economic Impact™ of IBM Rational Service Virtualization and Test Automation Solutions Project Director: Michelle Evangelista Contributor: Shaheen Parks July 2013
-
Upload
james-macintyre -
Category
Environment
-
view
101 -
download
0
Transcript of A Forrester Total Economic Impact Study

A Forrester Total Economic Impact™ Study Prepared For IBM
The Total Economic Impact™ of IBM Rational Service Virtualization and Test Automation Solutions
Project Director: Michelle Evangelista
Contributor: Shaheen Parks
July 2013

Forrester Consulting
The Total Economic Impact™ of IBM Rational Service Virtualization and Test Automation Solutions
Page 1
TABLE OF CONTENTS
Executive Summary .............................................................................................................................................................. 2
IBM Helps Development Groups Improve Quality, Productivity, And On-Time Delivery .......................................... 2
Factors Affecting Benefits And Costs ............................................................................................................................. 5
Disclosures........................................................................................................................................................................ 6
TEI Framework And Methodology ...................................................................................................................................... 7
Analysis ................................................................................................................................................................................. 8
Interview Highlights ......................................................................................................................................................... 8
Costs ................................................................................................................................................................................. 9
Benefits ........................................................................................................................................................................... 15
Flexibility ........................................................................................................................................................................ 22
Risk ................................................................................................................................................................................. 23
Financial Summary ............................................................................................................................................................. 25
IBM Rational Service Virtualization And Test Automation: Overview ........................................................................... 27
Sandhata Technologies: Company Overview .................................................................................................................... 28
Appendix A: Total Economic Impact™ Overview ............................................................................................................ 29
Appendix B: Glossary ......................................................................................................................................................... 30
Appendix C: Endnotes ........................................................................................................................................................ 31
© 2013, Forrester Research, Inc. All rights reserved. Unauthorized reproduction is strictly prohibited. Information is based on best available resources.
Opinions reflect judgment at the time and are subject to change. Forrester®, Technographics®, Forrester Wave, RoleView, TechRadar, and Total
Economic Impact are trademarks of Forrester Research, Inc. All other trademarks are the property of their respective companies. For additional
information, go to www.forrester.com.
About Forrester Consulting
Forrester Consulting provides independent and objective research-based consulting to help leaders succeed in their organizations. Ranging in
scope from a short strategy session to custom projects, Forrester’s Consulting services connect you directly with research analysts who apply
expert insight to your specific business challenges. For more information, visit www.forrester.com/consulting.
Forrester Consulting
The Total Economic Impact™ of IBM Rational Service Virtualization and Test Automation Solutions
Page 2
Executive Summary
In 2013, IBM commissioned Forrester Consulting to examine the total economic impact and potential return on
investment (ROI) enterprises may realize by deploying the IBM Rational Service Virtualization and Test Automation
solutions. The IBM offerings represented in this analysis include:
• IBM Rational Test Workbench®: Provides test automation for complex and highly integrated applications
delivering end-to-end functional, regression, load, and integration testing.
• IBM Rational Test Virtualization Server®: Models and simulates real-system behavior to eliminate
application test dependencies and reduce the set-up and infrastructure costs of traditional testing environments.
• IBM Rational Performance Test Server®: Enables application and integration level load generation to provide
a complete view of performance and scalability across all application components.
The purpose of this study is to provide readers with a framework to evaluate the potential financial impact of adopting
IBM Rational Service Virtualization and Test Automation solutions for their own organizations.
IBM Helps Development Groups Improve Quality, Productivity, And On-Time Delivery This study highlights the benefits and costs of implementing IBM Rational Service Virtualization and Test Automation
solutions, based on the experiences of an existing customer. The customer, a large European bank with more than 30
million customers and 3,500 branches worldwide, implemented two of the IBM testing solutions — Rational Test
Workbench (RTW) and Rational Test Virtualization Server (RTVS) — for one division’s software development group.
The solutions were first implemented in 2009 by Green Hat Software, prior to the acquisition by IBM in 2012. The
interviews conducted for this study focused on the initial implementation as well as the experiences of the customer up
to the present time.
The solutions were implemented for the division’s development group in order to increase the efficiency and reliability
of the software development life cycle. Prior to deploying these solutions, the development group had difficulty
understanding and aligning around requirements, lacked robust testing tools, relied heavily on manual testing, and had
a limited testing environment that constrained its project delivery capacity. These conditions led to a “high-risk”
environment for implementing software changes, often leading to revenue-impacting outages for key applications
maintained by the division’s development group.
The findings in this study are based primarily on in-depth interviews with Sandhata Technologies, a middleware
integrator closely involved with the implementation and deployment of RTW and RTVS. Sandhata Technologies was
selected by one division of a large European bank to provide specialized consulting support for the planning, piloting,
implementation, and deployment of RTW and RTVS. Forrester notes that Sandhata partnered with the bank over the
course of three years not only to implement RTW and RTVS, but also to provide staff support with the execution of
testing for critical projects. For the purposes of this study, Forrester has focused only on Sandhata’s role implementing
and deploying RTW and RTVS for the customer organization, and not on Sandhata’s role providing staff
supplementation for execution of testing activities. This approach has been taken since the delivery model for some
customers may not require staffing support from a third-party provider. For more information about Sandhata
Technologies, please see the company overview on page 28.

Forrester Consulting
The Total Economic Impact™ of IBM Rational Service Virtualization and Test Automation Solutions
Page 3
Forrester’s interviews with Sandhata Technologies, which focused on the benefits, costs, and associated risks incurred
by the European bank’s software development group as a result of implementing RTW and RTVS, found that
customers are likely to experience the risk-adjusted ROI, costs, and benefits shown in Table 1.
Table 1
Risk-Adjusted ROI Over Three Years1
Year 1 ROI
Year 2 ROI
(Cumulative)
Year 3 ROI
(Cumulative)
Payback period
Total benefits (PV)
Total costs (PV)
Net present value
398% 860% 1,333% < 2 months $6,273,147 ($433,149) $5,839,998
Source: Forrester Research, Inc.
• Benefits. According to Sandhata Technologies, a large European bank realized the following benefits as a result
of implementing RTW and RTVS:
o Increased project delivery capacity. The customer increased its project delivery capacity by 100%
over the three-year analysis (scaling from 40 projects to 80 projects completed annually) as a result of
an improved testing environment and reduction in the frequency of production incidents, which freed up
resources to execute a larger volume of projects.
o Incremental headcount avoided. The customer was able to avoid hiring three additional FTEs into the
development group over the three-year analysis as a result of using RTW and RTVS, enabling the
organization to increase the scope, frequency, and consistency of continuous testing throughout the
development process without substantially increasing its number of development resources.
o Decreased revenue loss from production incidents. The customer better protected its revenues by
reducing the frequency of revenue-impacting production incidents. Prior to implementing RTW and
RTVS, approximately 20% of projects had production incidents, which resulted in application outages
and cost an average of $100,000 revenue loss per incident.
o Reduced costs for resolving production incidents. With integration testing performed earlier in the
software development life cycle and fewer production incidents, the development team spent less time
on bug fixing and design/integration rework, allowing developers to focus on new requirements and
other high-value projects and initiatives.
o Reduced consulting and third-party testing fees. Equipped with a robust set of testing capabilities
offered by RTW and RTVS, the customer reduced its reliance on external consultants and third-party
integration testing services to supplement its own internal testing efforts, saving fees previously incurred
for external support.

Forrester Consulting
The Total Economic Impact™ of IBM Rational Service Virtualization and Test Automation Solutions
Page 4
o Avoidance of hardware expenses. With service virtualization supported by IBM solutions, the
customer avoided incurring incremental hardware and staff expenses to purchase, configure, and
maintain additional testing environments required to support the project workload.
o Incremental revenue. By improving team efficiency and reducing production incidents with IBM
solutions, the customer was able to deliver new projects that provided additional revenue-generating
opportunities.
• Costs. The customer incurred the following costs as a result of implementing IBM Rational Service
Virtualization and Test Automation solutions:
o Licensing fees. For its 25-person development team, the customer purchased 10 floating licenses of the
product known as GH Tester from Green Hat Software. Following the acquisition of Green Hat by IBM
in January 2012, these products were repackaged as Rational Test Workbench (RTW) and Rational Test
Virtualization Server (RTVS). Under the new packaging, this implementation would require 10 floating
user licenses of RTW and 100 PVU capacity of RTVS. For the purpose of this study, we reference the
current IBM Rational product naming.
o Consulting fees. The customer engaged an experienced middleware integrator, Sandhata Technologies,
to support the planning, piloting, implementation, and deployment of RTW and RTVS.
o Internal implementation and maintenance costs. The customer incurred internal labor costs for time
spent by members of the development group on implementation and maintenance of RTW and RTVS.
o Hardware expenses. The customer incurred expenses for servers required to support RTW and RTVS,
and for staff time required to set up, configure, and maintain the servers.

Forrester Consulting
The Total Economic Impact™ of IBM Rational Service Virtualization and Test Automation Solutions
Page 5
Figure 1
Three-Year Risk-Adjusted Cost/Benefit Breakdown
Source: Forrester Research, Inc.
Factors Affecting Benefits And Costs Table 1 illustrates the risk-adjusted financial results that were achieved by the customer. These values take into account
any potential uncertainty or variance that exists in estimating the costs and benefits, producing more-conservative
estimates. The following factors may affect the financial results that an organization may experience:
• The configuration of IBM Rational Service Virtualization and Test Automation solutions being implemented and
the scope of the relationship with IBM, which may impact licensing fees, consulting and/or integrator expenses,
internal implementation costs, hardware requirements, and discount levels.
• The size of the development team, which can influence licensing and training/support costs for deploying IBM
testing solutions across a team.
• The extent of planning and implementation support provided by consultants and/or systems integrators, which
can impact how quickly IBM Rational Service Virtualization and Test Automation solutions are deployed and
how quickly productivity benefits accumulate to an organization.
($1,000,000)
$0
$1,000,000
$2,000,000
$3,000,000
$4,000,000
$5,000,000
$6,000,000
$7,000,000
$8,000,000
Initial Year 1 Year 2 Year 3
Financial Analysis (risk-adjusted)
Total Costs Total Benefits Running Total

Forrester Consulting
The Total Economic Impact™ of IBM Rational Service Virtualization and Test Automation Solutions
Page 6
Disclosures
The reader should be aware of the following:
• The study is commissioned by IBM and conducted independently by the Forrester Consulting group.
• Forrester makes no assumptions as to the potential return on investment that other organizations will receive.
Forrester strongly advises that readers use their own estimates within the framework provided in the report to
determine the appropriateness of an investment in IBM solutions.
• IBM reviewed and provided feedback to Forrester, but Forrester maintains editorial control over the study and its
findings and does not accept changes to the study that contradict Forrester’s findings or obscure the meaning of
the study.
• The customer for this case study was provided by Sandhata Technologies.

Forrester Consulting
The Total Economic Impact™ of IBM Rational Service Virtualization and Test Automation Solutions
Page 7
TEI Framework And Methodology
Introduction
From the information provided in the interviews, Forrester has constructed a Total Economic Impact™ framework for
those organizations considering engaging IBM Rational Service Virtualization and Test Automation solutions for
software testing. The objective of the framework is to identify the cost, benefit, flexibility, and risk factors that affect
the investment decision.
Approach And Methodology
Forrester took a multistep approach to evaluate the impact that RTW and RVTS can have on an organization (see
Figure 2). Specifically, we:
• Interviewed IBM marketing and sales personnel and a Forrester analyst to gather data relative to the company’s
solutions and its marketplace.
• Interviewed an implementation partner who was involved in deploying RTWand RTVS for an existing customer
to obtain data with respect to the costs, benefits, and risks experienced by the customer.
• Constructed a financial model representative of the interviews using the TEI methodology. The financial model
is populated with the cost and benefit data obtained from the interviews with the implementation partner.
Figure 2
TEI Approach
Source: Forrester Research, Inc.
Forrester employed four fundamental elements of TEI in modeling IBM Rational Service Virtualization and Test
Automation solutions:
1. Costs.
2. Benefits to the entire organization.
3. Risk.
4. Flexibility.
Given the increasing sophistication that enterprises have regarding ROI analyses related to IT investments, Forrester’s
TEI methodology serves the purpose of providing a complete picture of the total economic impact of purchase
decisions. Please see Appendix A for additional information on the TEI methodology.
Construct financial
model using TEI framework
Write case
study
Perform due
diligence
Conduct
customer interviews

Forrester Consulting
The Total Economic Impact™ of IBM Rational Service Virtualization and Test Automation Solutions
Page 8
Analysis
Interview Highlights For this case study, Forrester interviewed Sandhata Technologies, which was engaged as a specialized consultant by
the customer to support the planning and implementation of RTW and RTVS. Sandhata provided the following
services during implementation to the IBM customer: assistance with the planning of the software testing architecture,
facilitation of the vendor selection process, implementation support for the IBM solutions, and assistance with piloting
RTW and RTVS with a subset of projects.
The customer that implemented RTW and RTVS is a large European bank with more than 30 million customers and
3,500 branches worldwide. The software development group of one banking division within the organization sought to
update its software testing processes in order to optimize the testing environment to better meet the needs of the
business, increase the productivity of the development group, scale project capacity, and reduce the frequency of
revenue-impacting incidents.
The development team consisted of 25 staff members, including two architects, three project managers, nine
developers, seven QA engineers, and four infrastructure specialists. While implementing IBM Rational Service
Virtualization and Test Automation solutions, the development group was also in the process of adopting an Agile
approach to software development. Combined with continuous testing, the customer hoped to improve the efficiency,
quality, and predictability of its development processes. Implementation of RTW and RTVS began in late 2009 and
spanned 20 days for the implementation, piloting, and full deployment of the solutions.
The customer implemented service virtualization and automated integration testing across its 120 interfaces as well as
10 to 15 subsystems that were involved in executing its trading transactions, including components built in Java, EMS,
JMS, WebSphere MQ, Sybase, and a SWIFT payment service. By leveraging testing capabilities from IBM, the bank
was able to reduce the time it took to perform system integration testing (SIT) from three weeks to half a day. This
enabled the bank to do continuous testing to support its Agile development process.
Framework Assumptions
Table 2 provides the model assumptions that Forrester used in this analysis. All figures shown in the case study have
been rounded to the nearest whole USD.

Forrester Consulting
The Total Economic Impact™ of IBM Rational Service Virtualization and Test Automation Solutions
Page 9
Table 2
Model Assumptions
Ref. Metric Calculation Value
A1 Working weeks per year 48
A2 Working hours per year (M-F, 9-5) 2,080
A3 Average salary within the development group (fully loaded)
$122,000
A4 Average hourly rate within the development group
A3/A2 $59
A5 Consultant hourly billing rate $90
Source: Forrester Research, Inc.
The discount rate used in the PV and NPV calculations is 10%; the time horizon used for the financial modeling is
three years. Organizations typically use discount rates between 8% and 16% based on their current environment.
Readers are urged to consult with their respective company’s finance department to determine the most appropriate
discount rate to use within their own organizations.
Costs The customer incurred four types of costs for implementing and maintaining Rational Test Workbench and Rational
Test Virtualization Server: 1) licensing fees; 2) consulting fees; 3) internal implementation and maintenance costs; and
4) hardware expenses. All costs are shown in USD.
Licensing Fees
The customer purchased the capabilities that are now part of RTW and RTVS. When the customer implemented the
solution in 2009, licensing costs were based on legacy per-user pricing from Green Hat Software (IBM acquired Green
Hat in January 2012). Costs have since been updated and can be found on the following product websites:
• Rational Test Workbench (RTW): http://www-03.ibm.com/software/products/us/en/rtw/.
• Rational Test Virtualization Server (RTVS): http://www.ibm.com/software/products/us/en/rtvs/.
The licensing cost incurred by the customer for IBM Rational Service Virtualization and Test Automation solutions
was $185,000. An annual maintenance fee totaling 20% of the license fee (or $37,000) was applied as part of an
ongoing customer service agreement. The total costs incurred by the customer for these offerings are summarized in
Table 3 below.

Forrester Consulting
The Total Economic Impact™ of IBM Rational Service Virtualization and Test Automation Solutions
Page 10
Table 3
Licensing Fees — Non-Risk-Adjusted
Ref. Metric Calculation Initial Year 1 Year 2 Year 3
B1
Licensing fees for Service Virtualization and Test Automation functionality (originally through Green Hat)
$185,000
B2 Percent maintenance fee 20% 20%
B3 Annual maintenance fee B1*B2 $37,000 $37,000
Bt Licensing fees B1+B3 $0 $185,000 $37,000 $37,000
Source: Forrester Research, Inc.
Consulting Fees
Around the time that the customer implemented RTW and RTVS, the customer was undergoing a transformation of its
software development and testing approaches (e.g., adopting Agile). This transformation was part of a larger initiative
to update the division’s development and testing approaches, increase the productivity of the development organization,
and decrease the likelihood of revenue-impacting incidents in the production environment.
To ensure the successful implementation of RTW and RTVS, the customer engaged middleware integrator Sandhata
Technologies for assistance implementing, piloting, configuring, and deploying the solutions. Sandhata was selected by
the customer due to its specialized experience working with customers implementing and using RTW and RTVS.
According to Sandhata, the implementation for RTW and RTVS lasted approximately 20 working days. To meet the
customer’s accelerated delivery schedule, Sandhata created an implementation team comprised of eight consultants,
with each spending approximately 8 hours per day supporting implementation and deployment at an hourly billing rate
of $90.
Following the initial implementation period, Sandhata also provided ongoing annual maintenance support. Sandhata
estimated that approximately five days were spent annually on performing updates and maintenance for RTW and
RTVS. Two consultants supported these efforts.
The total consulting fees over the three-year analysis were $136,800 (PV of $133,105).
Note that Sandhata Technologies also provided staff supplementation for testing activities completed on behalf of the
customer organization in order to facilitate its adoption of Agile techniques. However, the consulting fees shown in the
TEI case study are limited to the staff required to support the implementation and maintenance of RTW and RTVS
only. This approach has been used since it is assumed that most organizations will not require staff supplementation
unless they are undergoing a broader process transformation initiative.

Forrester Consulting
The Total Economic Impact™ of IBM Rational Service Virtualization and Test Automation Solutions
Page 11
Table 4
Consulting Fees — Non-Risk-Adjusted
Ref. Metric Calculation Initial Year 1 Year 2 Year 3
C1 Number of days for implementation
20
C2 Number of consultants supporting implementation
8
C3 Hours per day per consultant
8
C4 Consultant hourly billing rate
A5 $90
C5 Number of days for annual maintenance
5 5 5
C6 Number of consultants supporting annual maintenance
2 2 2
C7 Hours per day per consultant
8 8 8
C8 Consultant hourly billing rate
A5 $90 $90 $90
Ct Consulting fees (C1*C2*C3*C4)+ (C5*C6*C7*C8)
$115,200 $7,200 $7,200 $7,200
Source: Forrester Research, Inc.
Internal Implementation And Maintenance Costs
In partnership with consultants from Sandhata, members of the customer’s internal software development group spent
time supporting implementation and maintenance of the IBM solutions. During initial implementation, members of the
development group collectively spent 80 hours on implementation activities. At an average hourly rate of $59 per team
member per hour, the internal labor cost for supporting initial implementation was $4,720.
Members of the customer’s internal software development group also spent time on ongoing maintenance of the IBM
Rational Service Virtualization and Test Automation solutions, including installing updates, resolving queries and
issues, and adapting test configurations and settings on an ad hoc basis. Members of the development team collectively
spent 40 hours annually supporting these efforts. At an average hourly rate of $59 per development resource, the annual
internal cost for maintaining the IBM solutions was $2,360, as shown in Table 5.

Forrester Consulting
The Total Economic Impact™ of IBM Rational Service Virtualization and Test Automation Solutions
Page 12
Table 5
Internal Implementation And Maintenance Costs — Non-Risk-Adjusted
Ref. Metric Calculation Initial Year 1 Year 2 Year 3
D1 Development hours required to support implementation
80
D2 Development hourly rate A4 $59
D3 Development hours required annually for maintenance
40 40 40
D4 Development hourly rate A4 $59 $59 $59
Dt Internal implementation and maintenance costs
(D1*D2)+(D3*D4) $4,720 $2,360 $2,360 $2,360
Source: Forrester Research, Inc.
Hardware Expenses
The customer incurred expenses for acquiring, setting up, configuring, and maintaining servers required to conduct
testing with RTW and RTVS. To ensure sufficient redundancy and capacity to support testing, the customer purchased
two servers. While only one server was required to support testing requirements using RTW and RTVS, the customer
purchased a second server for redundancy — a standard approach for the bank. At a cost of $5,000 per server, the
customer spent $10,000 for the two servers dedicated to testing with RTW and RTVS.
The customer also incurred costs for the internal time required for setup, configuration, and maintenance of the servers.
Each server required 6 hours for setup and configuration during initial implementation. In addition, members of the
customer’s internal development group spent time maintaining the two servers, with each server requiring 15 hours of
maintenance annually. The total hardware acquisition and maintenance expenses were $16,018 (PV of $15,110), as
shown in Table 6 below.

Forrester Consulting
The Total Economic Impact™ of IBM Rational Service Virtualization and Test Automation Solutions
Page 13
Table 6
Hardware Expenses — Non-Risk-Adjusted
Ref. Metric Calculation Initial Year 1 Year 2 Year 3
E1 Servers purchased 2
E2 Cost per server $5,000
E3 Hours per server for setup and configuration
6
E4 Development hourly rate A4 $59
E5 Servers maintained annually
2 2 2
E6 Hours per server for annual maintenance
15 15 15
E7 Development hourly rate A4 $59 $59 $59
Et Hardware expenses (E1*E2)+(E1*E3*E4)+
(E5*E6*E7) $10,708 $1,770 $1,770 $1,770
Source: Forrester Research, Inc.
Total Costs
As discussed in the sections above, costs incurred by the customer included one-time implementation costs as well as
recurring maintenance expenses. Table 7 shows the total of all costs mentioned above as well as associated present
values, discounted at 10%.

Forrester Consulting
The Total Economic Impact™ of IBM Rational Service Virtualization and Test Automation Solutions
Page 14
Table 7
Total Costs — Non-Risk-Adjusted
Ref. Metric Initial Year 1 Year 2 Year 3 Total Present Value
Bt Licensing fees $0 ($185,000) ($37,000) ($37,000) ($259,000) ($226,559)
Ct Consulting fees ($115,200) ($7,200) ($7,200) ($7,200) ($136,800) ($133,105)
Dt Internal implementation and maintenance costs
($4,720) ($2,360) ($2,360) ($2,360) ($11,800) ($10,589)
Et Hardware expenses ($10,708) ($1,770) ($1,770) ($1,770) $16,018 $15,110
Total costs (original) ($130,628) ($196,330) ($48,330) ($48,330) ($391,582) ($355,144)
Source: Forrester Research, Inc.

Forrester Consulting
The Total Economic Impact™ of IBM Rational Service Virtualization and Test Automation Solutions
Page 15
Benefits The customer experienced six quantified benefits as a result of implementing RTW and RTVS: 1) increased project
delivery capacity; 2) incremental headcount avoided; 3) decreased revenue loss from production incidents; 4) reduced
costs for resolving production incidents; 5) reduced consulting expenses; and 6) avoidance of hardware purchases to
support an increased number of projects. A seventh benefit, additional revenue generated from the rollout of additional
projects, was not quantified since data was not available for the customer, but remained a strategic consideration for the
customer in the decision to implement the IBM solution.
Increased Project Delivery Capacity
The customer increased its project delivery capacity significantly as a result of implementing RTW and RTVS. Prior to
implementing the two IBM solutions, the software development group completed approximately 40 projects annually,
when considering projects completed by internal development resources only and not staff augmentation from external
consultants. With RTW and RTVS, the project delivery volume increased to 60 projects in Year 1, 66 projects in Year
2, and 80 projects in Year 3.
To calculate the increased project delivery benefit, which assumes the customer would have required additional staff to
deliver additional projects, Forrester assumed that each project required an average of 60 hours per month. At an
average hourly rate of $59 per person, the incremental productivity from increased project delivery capacity was
$1,217,760 (PV of $987,264). Table 8, below, summarizes the value associated with increased project delivery
capacity.

Forrester Consulting
The Total Economic Impact™ of IBM Rational Service Virtualization and Test Automation Solutions
Page 16
Table 8
Increased Project Delivery Capacity — Non-Risk-Adjusted
Ref. Metric Calculation Initial Year 1 Year 2 Year 3
F1 Annual number of projects completed with IBM testing solutions
60 66 80
F2 Annual number of projects completed without IBM testing solutions
40 40 40
F3 Incremental projects per year
F1-F2 20 26 40
F4 Average project duration (months)
4 4 4
F5 Development hours spent per month per project
60 60 60
F6 Development hourly rate A4 $59 $59 $59
Ft Increased project delivery capacity
F3*F4*F5*F6 $0 $283,200 $368,160 $566,400
Source: Forrester Research, Inc.
Incremental Headcount Avoided
Another benefit experienced by the customer as a result of implementing RTW and RTVS was the avoidance of hiring
several incremental staff into the development group. Without the IBM solutions, the size of the development group
ranged between 25 and 27 full-time employees (which represents the addition of one FTE per year as the development
group continues to scale its project delivery volume). However, to execute the same level and quality of integration
testing without RTW and RTVS, the development group would have required one additional FTE in Year 1 (for 26
FTEs), one more FTE in Year 2 (for 28 FTEs), and a third incremental FTE in Year 3 (for 30 FTEs). Over time, the
size of the development group would have increased to accommodate a larger number of projects undergoing earlier
testing and to account for relatively manual processes required to stand up test environments. At an average fully
loaded salary of $122,000 per development team member, the customer saved between $122,000 and $366,000 in
additional salary costs annually. Table 9 summarizes the cost savings from incremental headcount avoided.

Forrester Consulting
The Total Economic Impact™ of IBM Rational Service Virtualization and Test Automation Solutions
Page 17
Table 9
Incremental Headcount Avoided — Non-Risk-Adjusted
Ref. Metric Calculation Initial Year 1 Year 2 Year 3
G1 Development staff required without IBM testing solutions
26 28 30
G2 Development staff required with IBM testing solutions
25 26 27
G3 Development staff hires avoided
G1-G2 1 2 3
G4 Development average salary (fully loaded)
A3 $122,000 $122,000 $122,000
Gt Incremental headcount avoided
G3*G4 $0 $122,000 $244,000 $366,000
Source: Forrester Research, Inc.
Decreased Revenue Loss From Production Incidents
A key driver for the customer was to reduce the rate of issues in the production environment. These issues typically
resulted in outages, which led to a loss of revenue during the downtime period. Prior to the implementation of IBM
solutions, approximately 20% of projects had production issues. With an average loss of $100,000 per incident (a
conservative estimate based on customer experience), the total revenue preserved as a result of reduced production
incidents over the three-year analysis was $4,120,000 (PV of $3,383,922).

Forrester Consulting
The Total Economic Impact™ of IBM Rational Service Virtualization and Test Automation Solutions
Page 18
Table 10
Decreased Revenue Loss From Production Incidents — Non-Risk-Adjusted
Ref. Metric Calculation Initial Year 1 Year 2 Year 3
H1 Projects completed per year
60 66 80
H2
Percent of production incidents with revenue loss potential without IBM testing solutions
20% 20% 20%
H3 Revenue loss per production incident (average)
$100,000 $100,000 $100,000
Ht Decreased revenue loss from production incidents
H1*H2*H3 $0 $1,200,000 $1,320,000 $1,600,000
Source: Forrester Research, Inc.
Reduced Costs For Resolving Production Incidents
In addition to preserving revenue by reducing the frequency of downtime in revenue-generating applications, the
customer also reduced its internal labor costs for resolving production incidents. This freed up staff time to focus on
more-important software development projects and initiatives. Prior to implementing Rational Test Workbench and
Rational Test Virtualization Server, the rate of production incidents was 2.5 incidents per project. As a result of
implementing the IBM solutions, the customer decreased the rate of production incidents to 0.3 over a three-year period
(with the incident rate decreasing steadily over the three-year analysis as the scope, sophistication, and frequency of
integration testing conducted increased over time).
Forrester conservatively estimated that members of the development group collectively spent an average of 40 hours
per production incident. At an average hourly rate of $59 per development team member, the annual labor cost savings
from a decreased number of production incidents ranged between $70,800 and $415,360. The total cost reduction for
resolving production incidents was $719,800 (PV of $569,521), as summarized in Table 11 below.

Forrester Consulting
The Total Economic Impact™ of IBM Rational Service Virtualization and Test Automation Solutions
Page 19
Table 11
Reduced Costs for Resolving Production Incidents — Non-Risk-Adjusted
Ref. Metric Calculation Initial Year 1 Year 2 Year 3
I1 Projects completed per year
60 66 80
I2 Production incidents per project without IBM testing solutions
2.5 2.5 2.5
I3 Production incidents per project with IBM testing solutions (average)
2.0 1.0 0.3
I4 Avoided production incidents per project
I2-I3 0.5 1.5 2.2
I5 Development hours required per production incident
40 40 40
I6 Development hourly rate A4 $59 $59 $59
It Reduced costs for resolving production incidents
I1*I4*I5*I6 $0 $70,800 $233,640 $415,360
Source: Forrester Research, Inc.
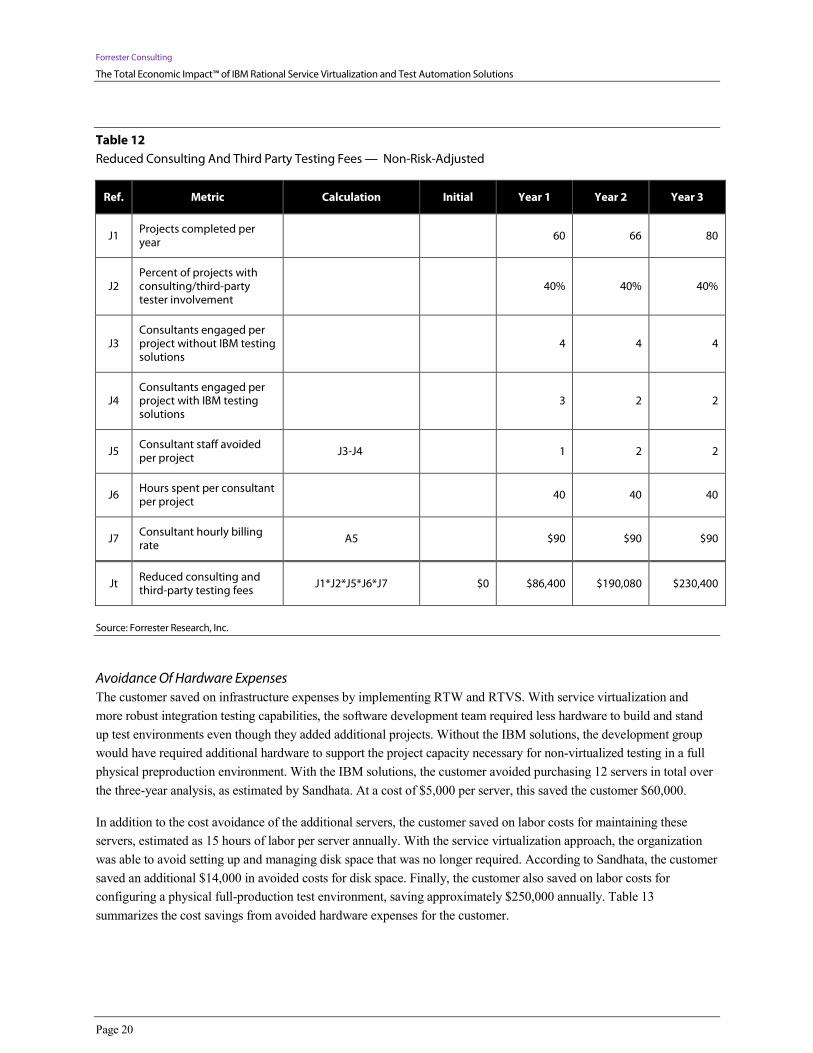
Reduced Consulting And Third-Party Testing Fees
With the implementation of RTW and RTVS, the customer reduced the frequency with which it engaged external
consultants and third-party testing services. Formerly, due to limited internal resources, the customer regularly engaged
external consulting support to complete testing; approximately 40% of its projects had consulting or third-party tester
involvement. Before implementation of the IBM solutions, approximately four consultants were engaged per project.
After implementation of RTW and RTVS, the average number of consultants per project decreased to between two and
three consultants per project, as more integration testing could be completed by internal staff. With an average of 40
hours spent per consultant per project and an hourly billing rate of $90, the customer saved between $86,400 and
$230,400 annually. Table 12 summarizes the cost savings from reduced consulting and third-party testing fees.
Forrester Consulting
The Total Economic Impact™ of IBM Rational Service Virtualization and Test Automation Solutions
Page 20
Table 12
Reduced Consulting And Third Party Testing Fees — Non-Risk-Adjusted
Ref. Metric Calculation Initial Year 1 Year 2 Year 3
J1 Projects completed per year
60 66 80
J2 Percent of projects with consulting/third-party tester involvement
40% 40% 40%
J3 Consultants engaged per project without IBM testing solutions
4 4 4
J4 Consultants engaged per project with IBM testing solutions
3 2 2
J5 Consultant staff avoided per project
J3-J4 1 2 2
J6 Hours spent per consultant per project
40 40 40
J7 Consultant hourly billing rate
A5 $90 $90 $90
Jt Reduced consulting and third-party testing fees
J1*J2*J5*J6*J7 $0 $86,400 $190,080 $230,400
Source: Forrester Research, Inc.
Avoidance Of Hardware Expenses
The customer saved on infrastructure expenses by implementing RTW and RTVS. With service virtualization and
more robust integration testing capabilities, the software development team required less hardware to build and stand
up test environments even though they added additional projects. Without the IBM solutions, the development group
would have required additional hardware to support the project capacity necessary for non-virtualized testing in a full
physical preproduction environment. With the IBM solutions, the customer avoided purchasing 12 servers in total over
the three-year analysis, as estimated by Sandhata. At a cost of $5,000 per server, this saved the customer $60,000.
In addition to the cost avoidance of the additional servers, the customer saved on labor costs for maintaining these
servers, estimated as 15 hours of labor per server annually. With the service virtualization approach, the organization
was able to avoid setting up and managing disk space that was no longer required. According to Sandhata, the customer
saved an additional $14,000 in avoided costs for disk space. Finally, the customer also saved on labor costs for
configuring a physical full-production test environment, saving approximately $250,000 annually. Table 13
summarizes the cost savings from avoided hardware expenses for the customer.

Forrester Consulting
The Total Economic Impact™ of IBM Rational Service Virtualization and Test Automation Solutions
Page 21
Table 13
Avoidance Of Hardware Expenses — Non-Risk-Adjusted
Ref. Metric Calculation Initial Year 1 Year 2 Year 3
K1 Number of server purchases avoided
3 4 5
K2 Cost per server $5,000 $5,000 $5,000
K3 Number of servers maintained annually
3 7 12
K4 Hours required per server for maintenance
15 15 15
K5 Development hourly rate A4 $59 $59 $59
K6 Value of disk purchases avoided
$14,000 $14,000 $14,000
K7 Labor costs for configuring a physical full-production test environment
$250,000 $250,000 $250,000
Kt Avoidance of hardware expenses
(K1*K2)+(K1*K3*K4)+ K6+K7
$0 $281,655 $290,195 $299,620
Source: Forrester Research, Inc.
Incremental Revenue
Forrester acknowledges that one other benefit of increased project delivery capacity is the business value of being able
to deliver an expanded range of products and services to customers at a more rapid pace. According to Sandhata, the
customer was able to increase its revenue in certain products and services as a result of continuous testing using RTW
and RTVS. However, because the business impact varies based on project requirements, and will vary significantly
based on the industry, size, offering, and distribution/service models, Forrester has not included incremental revenue
from increased project delivery capacity in the ROI model. Even factoring in conservative estimates, this benefit alone
could easily reach tens of millions of dollars and remains an important consideration for organizations considering IBM
solutions.
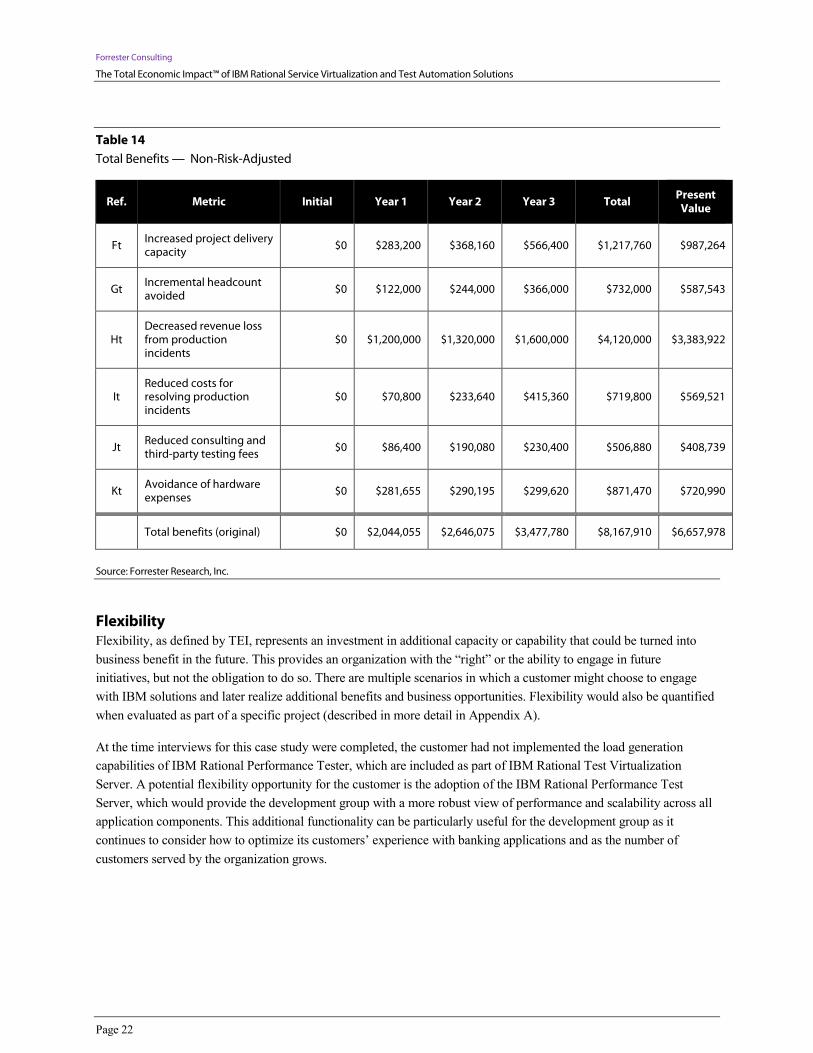
Total Benefits
Table 14 shows the total of all benefits mentioned above as well as associated present values.
Forrester Consulting
The Total Economic Impact™ of IBM Rational Service Virtualization and Test Automation Solutions
Page 22
Table 14
Total Benefits — Non-Risk-Adjusted
Ref. Metric Initial Year 1 Year 2 Year 3 Total Present Value
Ft Increased project delivery capacity
$0 $283,200 $368,160 $566,400 $1,217,760 $987,264
Gt Incremental headcount avoided
$0 $122,000 $244,000 $366,000 $732,000 $587,543
Ht Decreased revenue loss from production incidents
$0 $1,200,000 $1,320,000 $1,600,000 $4,120,000 $3,383,922
It Reduced costs for resolving production incidents
$0 $70,800 $233,640 $415,360 $719,800 $569,521
Jt Reduced consulting and third-party testing fees
$0 $86,400 $190,080 $230,400 $506,880 $408,739
Kt Avoidance of hardware expenses
$0 $281,655 $290,195 $299,620 $871,470 $720,990
Total benefits (original) $0 $2,044,055 $2,646,075 $3,477,780 $8,167,910 $6,657,978
Source: Forrester Research, Inc.
Flexibility Flexibility, as defined by TEI, represents an investment in additional capacity or capability that could be turned into
business benefit in the future. This provides an organization with the “right” or the ability to engage in future
initiatives, but not the obligation to do so. There are multiple scenarios in which a customer might choose to engage
with IBM solutions and later realize additional benefits and business opportunities. Flexibility would also be quantified
when evaluated as part of a specific project (described in more detail in Appendix A).
At the time interviews for this case study were completed, the customer had not implemented the load generation
capabilities of IBM Rational Performance Tester, which are included as part of IBM Rational Test Virtualization
Server. A potential flexibility opportunity for the customer is the adoption of the IBM Rational Performance Test
Server, which would provide the development group with a more robust view of performance and scalability across all
application components. This additional functionality can be particularly useful for the development group as it
continues to consider how to optimize its customers’ experience with banking applications and as the number of
customers served by the organization grows.

Forrester Consulting
The Total Economic Impact™ of IBM Rational Service Virtualization and Test Automation Solutions
Page 23
Risk Forrester defines two types of risk associated with this analysis: implementation risk and impact risk. “Implementation
risk” is the risk that a proposed investment in IBM solutions may deviate from the original or expected requirements,
resulting in higher costs than anticipated. “Impact risk” refers to the risk that the business or technology needs of the
organization may not be met by the investment in IBM solutions, resulting in lower overall total benefits. The greater
the uncertainty, the wider the potential range of outcomes for cost and benefit estimates.
Quantitatively capturing investment and impact risk, by directly adjusting the financial estimates, results in more-
meaningful and more-accurate estimates and a more-accurate projection of the ROI. In general, risks affect costs by
raising the original estimates, and they affect benefits by reducing the original estimates. The risk-adjusted numbers
should be taken as “realistic” expectations since they represent the expected values considering risk.
The following implementation risks that affect costs are identified as part of this analysis:
• A longer than anticipated implementation timeline, impacting consulting fees and/or internal labor costs.
• Additional infrastructure and hardware requirements.
The following impact risks that affect benefits are identified as part of the analysis:
• Minimal or no increase in project delivery capacity.
• Little or no reduction in incremental headcount requirements.
• Persisting rate of production incidents and associated revenue loss.
• Minimal or no reduction in costs for resolving production incidents.
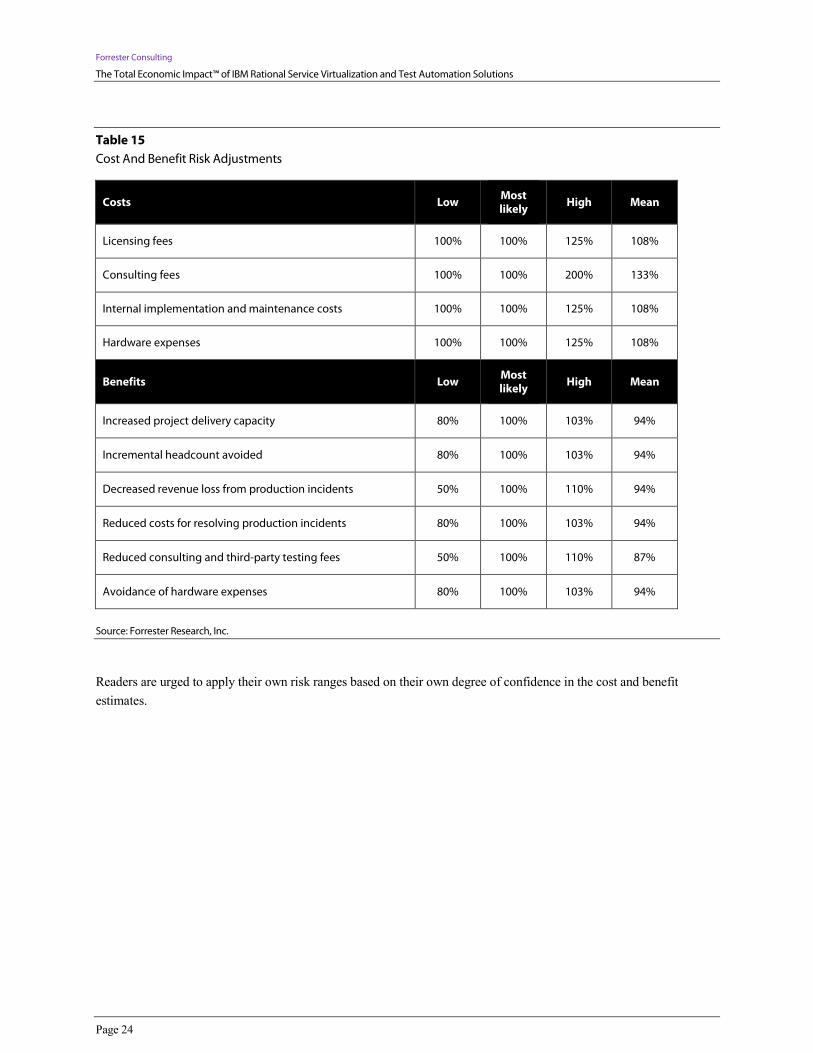
Table 15 shows the values used to adjust for risk and uncertainty in the cost and benefit estimates. The TEI model uses
a triangular distribution method to calculate risk-adjusted values. To construct the distribution, it is necessary to first
estimate the low, most likely, and high values that could occur within the current environment. The risk-adjusted value
is the mean of the distribution of those points.
Forrester Consulting
The Total Economic Impact™ of IBM Rational Service Virtualization and Test Automation Solutions
Page 24
Table 15
Cost And Benefit Risk Adjustments
Costs Low Most likely
High Mean
Licensing fees 100% 100% 125% 108%
Consulting fees 100% 100% 200% 133%
Internal implementation and maintenance costs 100% 100% 125% 108%
Hardware expenses 100% 100% 125% 108%
Benefits Low Most likely
High Mean
Increased project delivery capacity 80% 100% 103% 94%
Incremental headcount avoided 80% 100% 103% 94%
Decreased revenue loss from production incidents 50% 100% 110% 94%
Reduced costs for resolving production incidents 80% 100% 103% 94%
Reduced consulting and third-party testing fees 50% 100% 110% 87%
Avoidance of hardware expenses 80% 100% 103% 94%
Source: Forrester Research, Inc.
Readers are urged to apply their own risk ranges based on their own degree of confidence in the cost and benefit
estimates.
Forrester Consulting
The Total Economic Impact™ of IBM Rational Service Virtualization and Test Automation Solutions
Page 25
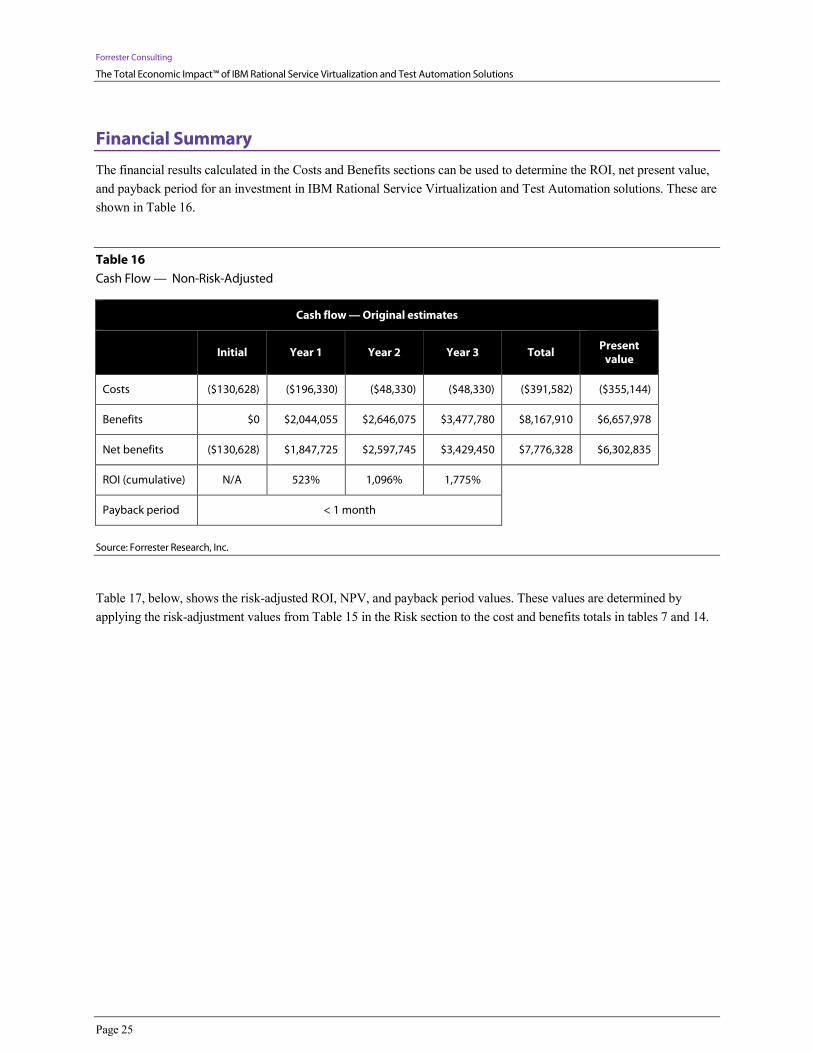
Financial Summary
The financial results calculated in the Costs and Benefits sections can be used to determine the ROI, net present value,
and payback period for an investment in IBM Rational Service Virtualization and Test Automation solutions. These are
shown in Table 16.
Table 16
Cash Flow — Non-Risk-Adjusted
Cash flow — Original estimates
Initial Year 1 Year 2 Year 3 Total Present value
Costs ($130,628) ($196,330) ($48,330) ($48,330) ($391,582) ($355,144)
Benefits $0 $2,044,055 $2,646,075 $3,477,780 $8,167,910 $6,657,978
Net benefits ($130,628) $1,847,725 $2,597,745 $3,429,450 $7,776,328 $6,302,835
ROI (cumulative) N/A 523% 1,096% 1,775%
Payback period < 1 month
Source: Forrester Research, Inc.
Table 17, below, shows the risk-adjusted ROI, NPV, and payback period values. These values are determined by
applying the risk-adjustment values from Table 15 in the Risk section to the cost and benefits totals in tables 7 and 14.

Forrester Consulting
The Total Economic Impact™ of IBM Rational Service Virtualization and Test Automation Solutions
Page 26
Table 17
Cash Flow — Risk-Adjusted
Cash flow — Risk-adjusted estimates
Initial Year 1 Year 2 Year 3 Total Present value
Costs ($169,878) ($213,836) ($53,996) ($53,996) ($474,407) ($433,149)
Benefits $0 $1,932,263 $2,491,417 $3,270,962 $7,694,642 $6,273,147
Net benefits ($169,878) $1,718,427 $2,437,420 $3,216,966 $7,220,235 $5,839,998
ROI (cumulative) N/A 398% 860% 1348%
Payback period < 2 months
Source: Forrester Research, Inc.
Forrester Consulting
The Total Economic Impact™ of IBM Rational Service Virtualization and Test Automation Solutions
Page 27
IBM Rational Service Virtualization And Test Automation Solutions: Overview
According to IBM, the IBM Rational Service Virtualization and Test Automation solutions help organizations
accelerate software delivery, reduce project risk, and increase software quality by enabling continuous integration
testing of complex applications. These offerings may be used individually or in combination with IBM development
and deployment automation solutions to address the full DevOps life cycle.
IBM Rational Service Virtualization and Test Automation solutions, leveraging technology acquired from Green Hat
Software in 2012, includes the following products:
• Rational Test Workbench: Delivers a comprehensive test automation solution including regression, load,
integration, and performance testing across web, mobile, and traditional applications. By providing an end-to-end
solution in a single offering, Rational Test Workbench allows teams to significantly improve team agility,
maximize productivity, and deliver software at the pace the business demands.
• Rational Test Virtualization Server: Enables the deployment of virtual services in order to simulate real system
behavior so teams can perform integration testing earlier and more frequently in the development cycle. Virtual
services can be reused and shared easily across teams to significantly reduce the expense of creating and
maintaining test environments.
• Rational Performance Test Server: Provides application and integration level load generation to provide a
complete view of performance and scalability across all application components. This workload test engine
maximizes the use of your test infrastructure to quickly deploy load scenarios and create large-scale system tests
to avoid the costly impact of poor application performance.
For more information, visit http://www.ibm.com/software/rational/servicevirtualization.
Forrester Consulting
The Total Economic Impact™ of IBM Rational Service Virtualization and Test Automation Solutions
Page 28
Sandhata Technologies: Company Overview
According to Sandhata Technologies, it is an experienced, professional middleware integrator, encompassing SOA,
ESB, BPM, and analytics. It has developed its own integration methodology that can offer simple and flexible solutions
to complex issues such as regulatory compliance. Sandhata has experience in capital markets, telecommunications, and
retail, and its on-staff specialists have a minimum of five years’ middleware project experience. This underlines the
company’s aim to provide quality and reliability in every customer interaction. With a head office in London, and
EMEA onshore and APAC offshore delivery centers, its global presence can provide a mix of onshore and offshore
resourcing.
Sandhata has developed its own internal methodology (the MDLC) that joins together architecture, infrastructure,
application development, project management, QA, and application support. Its library, navigated via SharePoint,
covers process, procedures, templates, best practice, project, and implementation plans.
For more information about Sandhata, please visit: http://www.sandhata.com/.

Forrester Consulting
The Total Economic Impact™ of IBM Rational Service Virtualization and Test Automation Solutions
Page 29
Appendix A: Total Economic Impact™ Overview
Total Economic Impact is a methodology developed by Forrester Research that enhances a company’s technology
decision-making processes and assists vendors in communicating the value proposition of their products and services to
clients. The TEI methodology helps companies demonstrate, justify and realize the tangible value of IT initiatives to
both senior management and other key business stakeholders.
The TEI methodology consists of four components to evaluate investment value: benefits, costs, risks and flexibility.
Benefits
Benefits represent the value delivered to the employee organization — IT and/or business units — by the proposed
product or project. Often product or project justification exercises focus just on IT cost and cost reduction, leaving little
room to analyze the effect of the technology on the entire organization. The TEI methodology and the resulting
financial model place equal weight on the measure of benefits and the measure of costs, allowing for a full examination
of the effect of the technology on the entire organization. Calculation of benefit estimates involves a clear dialogue with
the employee organization to understand the specific value that is created. In addition, Forrester also requires that there
be a clear line of accountability established between the measurement and justification of benefit estimates after the
project has been completed. This ensures that benefit estimates tie back directly to the bottom line.
Costs
Costs represent the investment necessary to capture the value, or benefits, of the proposed project. IT or the business
units may incur costs in the form of fully burdened labor, subcontractors or materials. Costs consider all the
investments and expenses necessary to deliver the proposed value. In addition, the cost category within TEI captures
any incremental costs over the existing environment for ongoing costs associated with the solution. All costs must be
tied to the benefits that are created.
Risk
Risk measures the uncertainty of benefit and cost estimates contained within the investment. Uncertainty is measured in
two ways: 1) the likelihood that the cost and benefit estimates will meet the original projections, and 2) the likelihood
that the estimates will be measured and tracked over time. TEI applies a probability density function known as
“triangular distribution” to the values entered. At minimum, three values are calculated to estimate the underlying range
around each cost and benefit.
Flexibility
Within the TEI methodology, direct benefits represent one part of the investment value. While direct benefits can
typically be the primary way to justify a project, Forrester believes that organizations should be able to measure the
strategic value of an investment. Flexibility represents the value that can be obtained for some future additional
investment building on top of the initial investment already made. For instance, an investment in an enterprise-wide
upgrade of an office productivity suite can potentially increase standardization (to increase efficiency) and reduce
licensing costs. However, an embedded collaboration feature may translate to greater worker productivity if activated.
The collaboration can only be used with additional investment in training at some future point in time. However,
having the ability to capture that benefit has a present value that can be estimated. The flexibility component of TEI
captures that value.
Forrester Consulting
The Total Economic Impact™ of IBM Rational Service Virtualization and Test Automation Solutions
Page 30
Appendix B: Glossary
Discount rate: The interest rate used in cash flow analysis to take into account the time value of money. Although the
Federal Reserve Bank sets a discount rate, companies often set a discount rate based on their business and investment
environment. Forrester assumes a yearly discount rate of 10% for this analysis. Organizations typically use discount
rates between 8% and 16% based on their current environment. Readers are urged to consult their respective
organization to determine the most appropriate discount rate to use in their own environment.
Net present value (NPV): The present or current value of (discounted) future net cash flows given an interest rate (the
discount rate). A positive project NPV normally indicates that the investment should be made, unless other projects
have higher NPVs.
Present value (PV): The present or current value of (discounted) cost and benefit estimates given at an interest rate
(the discount rate). The PV of costs and benefits feed into the total net present value of cash flows.
Payback period: The breakeven point for an investment. The point in time at which net benefits (benefits minus costs)
equal initial investment or cost.
Return on investment (ROI): A measure of a project’s expected return in percentage terms. ROI is calculated by
dividing net benefits (benefits minus costs) by costs.
A Note On Cash Flow Tables
The following is a note on the cash flow tables used in this study (see the example table below). The initial investment
column contains costs incurred at “time 0” or at the beginning of Year 1. Those costs are not discounted. All other cash
flows in Years 1 through Year 3 are discounted using the discount rate (shown in Framework Assumptions section) at
the end of the year. Present value (PV) calculations are calculated for each total cost and benefit estimate. Net present
value (NPV) calculations are not calculated until the summary tables and are the sum of the initial investment and the
discounted cash flows in each year.
Table [Example]
Example Table
Ref. Category Calculation Initial cost Year 1 Year 2 Year 3 Total
Source: Forrester Research, Inc.

Forrester Consulting
The Total Economic Impact™ of IBM Rational Service Virtualization and Test Automation Solutions
Page 31
Appendix C: Endnotes
1 Forrester risk-adjusts the summary financial metrics to take into account the potential uncertainty of the cost and
benefit estimates. For more information on Risk, please refer to Appendix A.