
A Forrester Total Economic Impact™ Study - · PDF fileGoogle Apps is a cloud-based...
40
A Forrester Total Economic Impact™ Study Prepared For Google Measuring The Total Economic Impact Of Google Apps A Cross-Industry Survey And Analysis Project Director: Jon Erickson Contributor: Emily van Metre November 2010
Transcript of A Forrester Total Economic Impact™ Study - · PDF fileGoogle Apps is a cloud-based...
A Forrester Total Economic Impact™ Study Prepared For Google
Measuring The Total Economic Impact Of Google Apps A Cross-Industry Survey And Analysis
Project Director: Jon Erickson
Contributor: Emily van Metre
November 2010

Forrester Consulting
Measuring The Total Economic Impact Of Google Apps
1
TABLE OF CONTENTS Executive Summary ................................................................................................................................................................................. 2
Google Apps Drives IT Cost Savings And Key Collaboration Benefits ................................................................................... 2
Factors Affecting Benefits And Costs ............................................................................................................................................. 5
Disclosures ........................................................................................................................................................................................... 5
TEI Framework And Methodology ...................................................................................................................................................... 7
Research Highlights ........................................................................................................................................................................... 8
Costs .................................................................................................................................................................................................... 10
Benefits ............................................................................................................................................................................................... 12
Flexibility ............................................................................................................................................................................................ 29
Risk ...................................................................................................................................................................................................... 30
Financial Summary ................................................................................................................................................................................ 32
Study Conclusions ................................................................................................................................................................................. 34
Google Apps Overview ......................................................................................................................................................................... 35
Appendix A: Composite Organization Description ....................................................................................................................... 37
Appendix B: Total Economic Impact™ Overview ............................................................................................................................ 37
Appendix C: Glossary ........................................................................................................................................................................... 38
Appendix D: Endnotes .......................................................................................................................................................................... 39
© 2010, Forrester Research, Inc. All rights reserved. Unauthorized reproduction is strictly prohibited. Information is based on best available resources. Opinions reflect judgment at the time and are subject to change. Forrester®, Technographics®, Forrester Wave, RoleView, TechRadar, and Total Economic Impact are trademarks of Forrester Research, Inc. All other trademarks are the property of their respective companies. For additional information, go to www.forrester.com.
About Forrester Consulting Forrester Consulting provides independent and objective research-based consulting to help leaders succeed in their organizations. Ranging in scope from a short strategy session to custom projects, Forrester’s Consulting services connect you directly with research analysts who apply expert insight to your specific business challenges. For more information, visit www.forrester.com/consulting.
Forrester Consulting
Measuring The Total Economic Impact Of Google Apps
2
Executive Summary
In May 2010, Google commissioned Forrester Consulting to examine the total economic impact and expected return on investment (ROI) enterprises may realize by adopting Google Apps after having managed a traditional on-premise messaging and collaboration environment. Google Apps is a cloud-based messaging and collaboration platform that includes mail, calendaring, IM, as well as Web-based collaborative documents, spreadsheets, presentations, and sites. The purpose of this study is to provide readers with a framework and analysis to evaluate the potential financial impact of switching from legacy email and productivity solutions to Google Apps.
To accomplish this analysis, Forrester conducted a combination of in-depth executive interviews as well as two broader surveys targeted at both IT and end user groups. This approach allowed Forrester to realize the broad impact Google Apps is having on IT and end user organizations and to supplement this data with an understanding of the underlying factors driving firms to move to a cloud-based messaging and collaboration platform.
Google Apps Drives IT Cost Savings And Key Collaboration Benefits Our interviews and broader survey around Google Apps and our subsequent financial analysis identified several key takeaways for organizations migrating to a cloud-based messaging and collaboration environment:
• Ninety-three percent of respondents saw positive, tangible IT and end user impacts that drove ROI. End users familiar with cloud-based personal email transitioned more smoothly to using Google Apps at work.
• End user productivity gains were even greater than IT cost savings. End users were able to use Gmail more efficiently than their previous email solution and collaborate more effectively with Google Docs and Google Sites than with traditional office software.
• The switch to Google Apps was usually driven by replacing or augmenting an existing email solution. However, Forrester saw a growing number of cases where organizations chose Google Apps for collaboration and then migrated to the messaging platform.
• For the representative organization, the three-year results of switching to Google Apps from traditional infrastructure include:
o Risk-adjusted ROI of 307%
o Risk-adjusted net present value (NPV) of $10,039,612
o Payback (break-even) within seven months
Based on our in-depth interviews with IT groups and end users who had migrated to Google Apps as well as a broader survey of 600 IT and end user respondents, Forrester created a representative financial model to aggregate the results. These results are meant to highlight the common cost and benefit impacts of migrating to Google Apps from a previous on-premise IT environment and should be used as a starting point for readers assessing the potential economic impact of Google Apps within their organization. Table 1 illustrates the summary findings.
Forrester Consulting
Measuring The Total Economic Impact Of Google Apps
3
Actual return on investment will vary by organization. However, the findings contained within the analysis suggest positive tangible returns for the participating organizations.
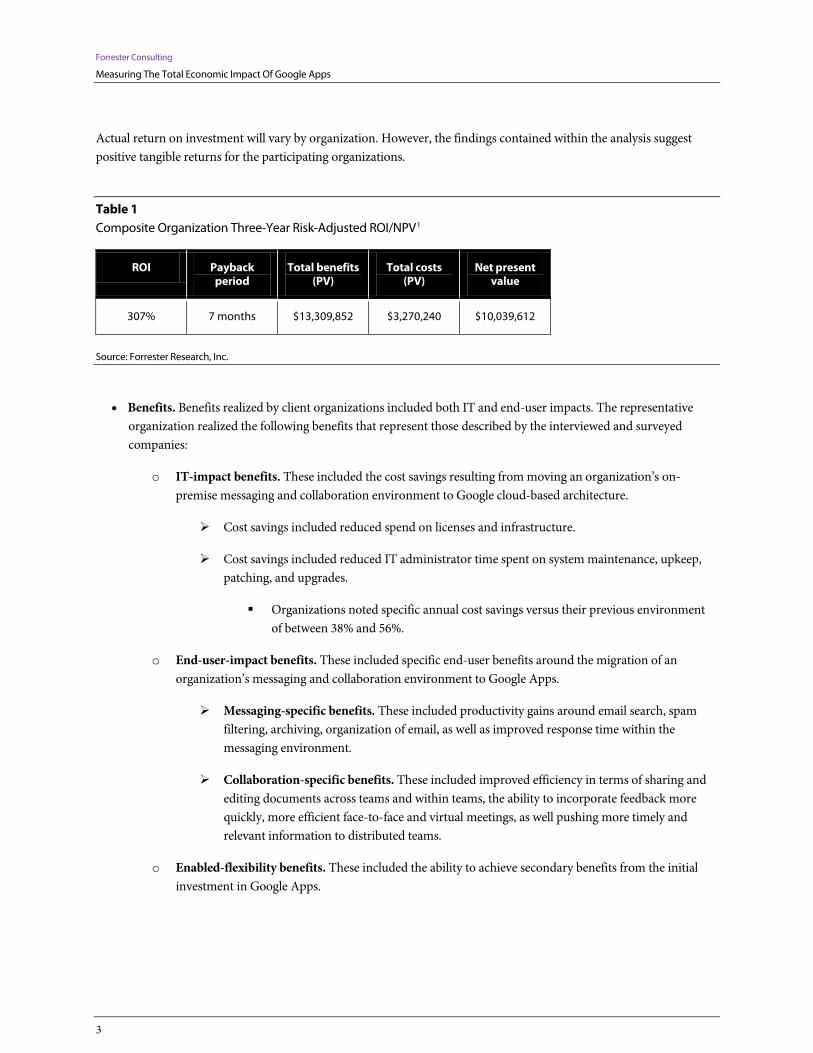
Table 1 Composite Organization Three-Year Risk-Adjusted ROI/NPV1
ROI
Payback period
Total benefits (PV)
Total costs (PV)
Net present value
307% 7 months $13,309,852 $3,270,240 $10,039,612
Source: Forrester Research, Inc.
• Benefits. Benefits realized by client organizations included both IT and end-user impacts. The representative organization realized the following benefits that represent those described by the interviewed and surveyed companies:
o IT-impact benefits. These included the cost savings resulting from moving an organization’s on-premise messaging and collaboration environment to Google cloud-based architecture.
Cost savings included reduced spend on licenses and infrastructure.
Cost savings included reduced IT administrator time spent on system maintenance, upkeep, patching, and upgrades.
Organizations noted specific annual cost savings versus their previous environment of between 38% and 56%.
o End-user-impact benefits. These included specific end-user benefits around the migration of an organization’s messaging and collaboration environment to Google Apps.
Messaging-specific benefits. These included productivity gains around email search, spam filtering, archiving, organization of email, as well as improved response time within the messaging environment.
Collaboration-specific benefits. These included improved efficiency in terms of sharing and editing documents across teams and within teams, the ability to incorporate feedback more quickly, more efficient face-to-face and virtual meetings, as well pushing more timely and relevant information to distributed teams.
o Enabled-flexibility benefits. These included the ability to achieve secondary benefits from the initial investment in Google Apps.
Forrester Consulting
Measuring The Total Economic Impact Of Google Apps
4
Collaborating with external partners. The ability to improve the efficiency of interacting with external partners and suppliers through Google Docs and Sites.
Leveraging Google Marketplace. Taking advantage of new process-specific applications from Google Marketplace, further reducing process integration costs.
• Costs. The composite organization incurred the following costs:
o Google Apps annual license.
o Internal implementation and rollout.
o Ongoing routine support.
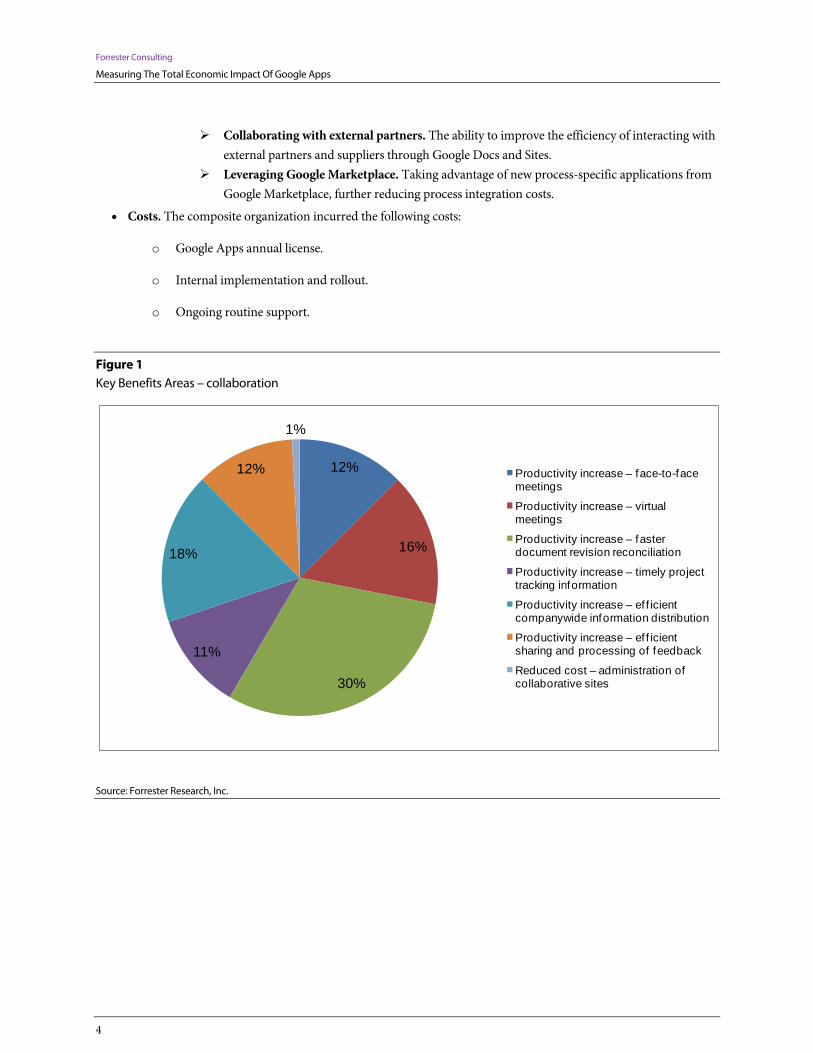
Figure 1 Key Benefits Areas – collaboration
Source: Forrester Research, Inc.
12%
16%
30%
11%
18%
12%
1%
Productivity increase – face-to-face meetings
Productivity increase – virtual meetings
Productivity increase – faster document revision reconciliation
Productivity increase – timely project tracking information
Productivity increase – ef f icient companywide information distribution
Productivity increase – ef f icient sharing and processing of feedback
Reduced cost – administration of collaborative sites
Forrester Consulting
Measuring The Total Economic Impact Of Google Apps
5
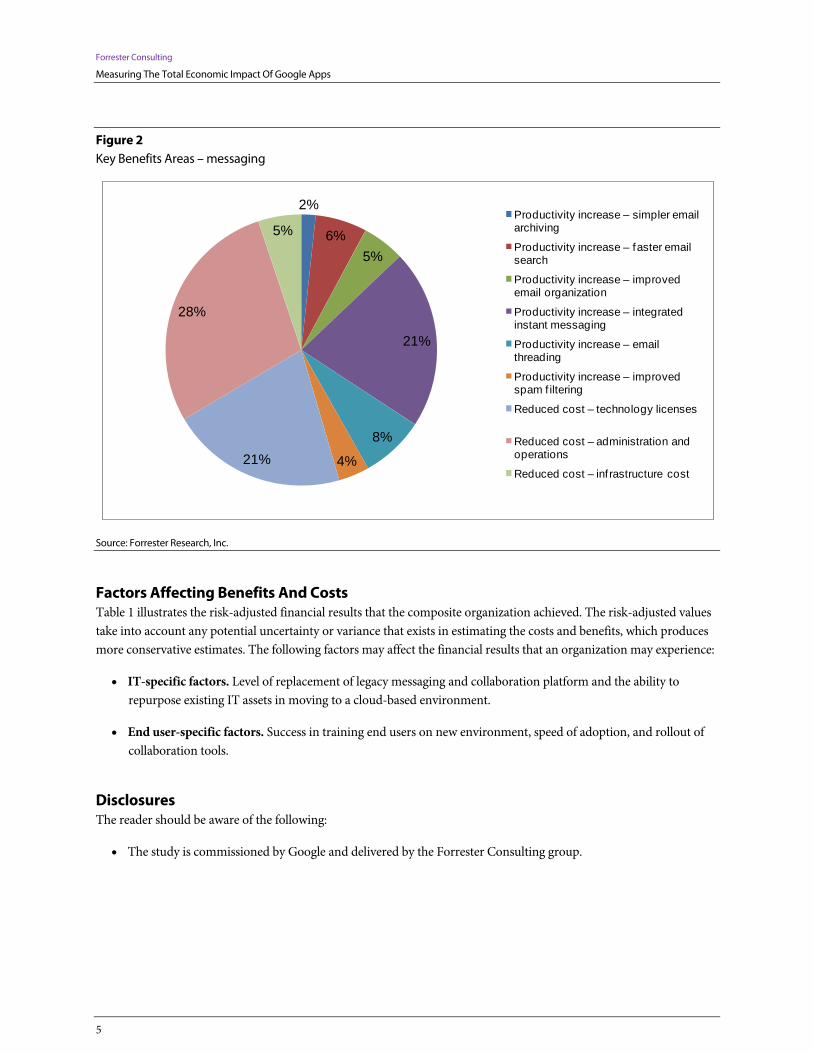
Figure 2 Key Benefits Areas – messaging
Source: Forrester Research, Inc.
Factors Affecting Benefits And Costs Table 1 illustrates the risk-adjusted financial results that the composite organization achieved. The risk-adjusted values take into account any potential uncertainty or variance that exists in estimating the costs and benefits, which produces more conservative estimates. The following factors may affect the financial results that an organization may experience:
• IT-specific factors. Level of replacement of legacy messaging and collaboration platform and the ability to repurpose existing IT assets in moving to a cloud-based environment.
• End user-specific factors. Success in training end users on new environment, speed of adoption, and rollout of collaboration tools.
Disclosures The reader should be aware of the following:
• The study is commissioned by Google and delivered by the Forrester Consulting group.
2%
6%5%
21%
8%
4%21%
28%
5%Productivity increase – simpler email archiving
Productivity increase – faster email search
Productivity increase – improved email organization
Productivity increase – integrated instant messaging
Productivity increase – email threading
Productivity increase – improved spam f iltering
Reduced cost – technology licenses
Reduced cost – administration and operations
Reduced cost – inf rastructure cost
Forrester Consulting
Measuring The Total Economic Impact Of Google Apps
6
• Forrester makes no assumptions as to the potential return on investment that other organizations will receive. Forrester strongly advises that readers should use their own estimates within the framework provided in the report to determine the appropriateness of an investment in Google Apps.
• Google reviewed and provided feedback to Forrester, but Forrester maintains editorial control over the study and its findings and does not accept changes to the study that contradict Forrester’s findings or obscure the meaning of the study.
• The customer names for the interviews were provided by Google.
Forrester Consulting
Measuring The Total Economic Impact Of Google Apps
7
TEI Framework And Methodology
Introduction From the information provided in the interviews, Forrester has constructed a Total Economic Impact™ framework for organizations considering switching to Google Apps from a traditional on-premise environment for messaging and collaboration. The objective of the framework is to identify the cost, benefit, flexibility, and risk factors that affect the investment decision.
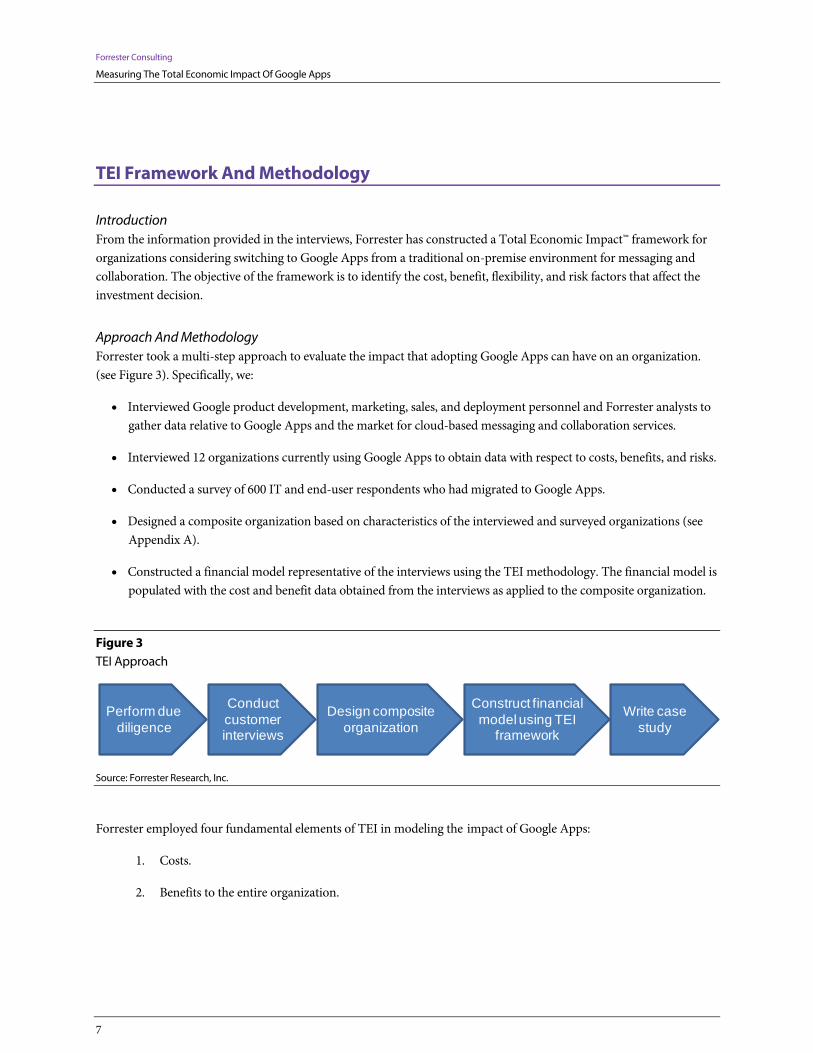
Approach And Methodology Forrester took a multi-step approach to evaluate the impact that adopting Google Apps can have on an organization. (see Figure 3). Specifically, we:
• Interviewed Google product development, marketing, sales, and deployment personnel and Forrester analysts to gather data relative to Google Apps and the market for cloud-based messaging and collaboration services.
• Interviewed 12 organizations currently using Google Apps to obtain data with respect to costs, benefits, and risks.
• Conducted a survey of 600 IT and end-user respondents who had migrated to Google Apps.
• Designed a composite organization based on characteristics of the interviewed and surveyed organizations (see Appendix A).
• Constructed a financial model representative of the interviews using the TEI methodology. The financial model is populated with the cost and benefit data obtained from the interviews as applied to the composite organization.
Figure 3 TEI Approach
Source: Forrester Research, Inc.
Forrester employed four fundamental elements of TEI in modeling the impact of Google Apps:
1. Costs.
2. Benefits to the entire organization.
Design composite organization
Construct financial model using TEI
framework
Write case study
Perform due diligence
Conduct customer interviews
Forrester Consulting
Measuring The Total Economic Impact Of Google Apps
8
3. Flexibility.
4. Risk.
Given the increasing sophistication that enterprises have regarding ROI analyses related to IT investments, Forrester’s TEI methodology serves the purpose of providing a complete picture of the total economic impact of purchase decisions. Please see Appendix B for additional information on the TEI methodology.
Research Highlights Research data for this analysis was derived from two sources: in-depth interviews with IT and end user stakeholders from 12 client organizations as well as a broader IT and end user survey consisting of 600 respondents. Clients for both the interviews and survey were globally distributed organizations consisting of at least 1,000 employees.
The 12 interviews uncovered several important drivers, which formed the basis of the financial analysis:
• The majority of the customers interviewed migrated their messaging applications first and then let users organically adopt Google’s collaboration applications. In these scenarios, the case for adopting Google Apps was driven by specific cost reductions within the management of an organization’s messaging environment.
• While the initial case for migration was usually based on direct cost savings, clients noted the role of Google Apps collaboration tools in driving higher overall value across the organization.
• The organizations interviewed for the study were a combination of globally distributed enterprises and midsized regional companies. Six were headquartered in North America while the rest were located outside of North America.
• The majority of customers saw the use of Google Apps as augmenting their existing collaboration platforms, while the use of Google Apps for messaging was seen as a direct replacement.
The results of the survey allowed us to validate several of the themes identified during the interview process. These included:
• Employees using Google email, calendar, and contacts saw material benefits over their previous email system. Eighty-nine percent of employees using Google Apps felt that the time required to simply sign in to email had decreased. Forty-six percent felt that time spent organizing their email had decreased; 37% felt that time spent searching for email messages had decreased; and 30% felt that time spent locating a contact had decreased.
• Employees who also use Google Docs, Google Sites, or Google Video saw additional benefits. For example, 72% of these employees are now more confident that they always have the current version of a project file, and 70% find that it takes less time to incorporate feedback into documents, spreadsheets, and presentations than before.
• Forty-seven percent of employees using Google’s Docs and Google Sites saw material improvements in their levels of collaboration with customers and partners since moving to those tools.
Forrester Consulting
Measuring The Total Economic Impact Of Google Apps
9
• Forty-seven percent of employees using Google Apps also felt that “If I had to switch back to my previous email environment, my productivity would suffer.”
Composite Organization Based on the interviews with the 12 existing customers provided by Google and broader survey data, Forrester constructed a TEI framework, a composite company, and an associated ROI analysis that illustrates the financial impact of Google Apps. The representative organization Forrester synthesized from these results represents a North American services organization with 18, 000 employees spread out across three continents.
The organization chose to first migrate to the Google Apps messaging platform, with 75% of end users fully migrated in Year 1 of the analysis and 100% of end users migrated in Year 2 and Year 3. The ramp-up of collaboration usage was more gradual; while Google Docs and Sites were immediately available with Gmail accounts, end users organically adopted Google Docs and Google Sites as these collaboration tools took root among their colleagues. In Year 1, 45% of users had started using Google’s collaboration tools; in Year 2, 55% had started, and in Year 3 of the analysis, 60% had started.
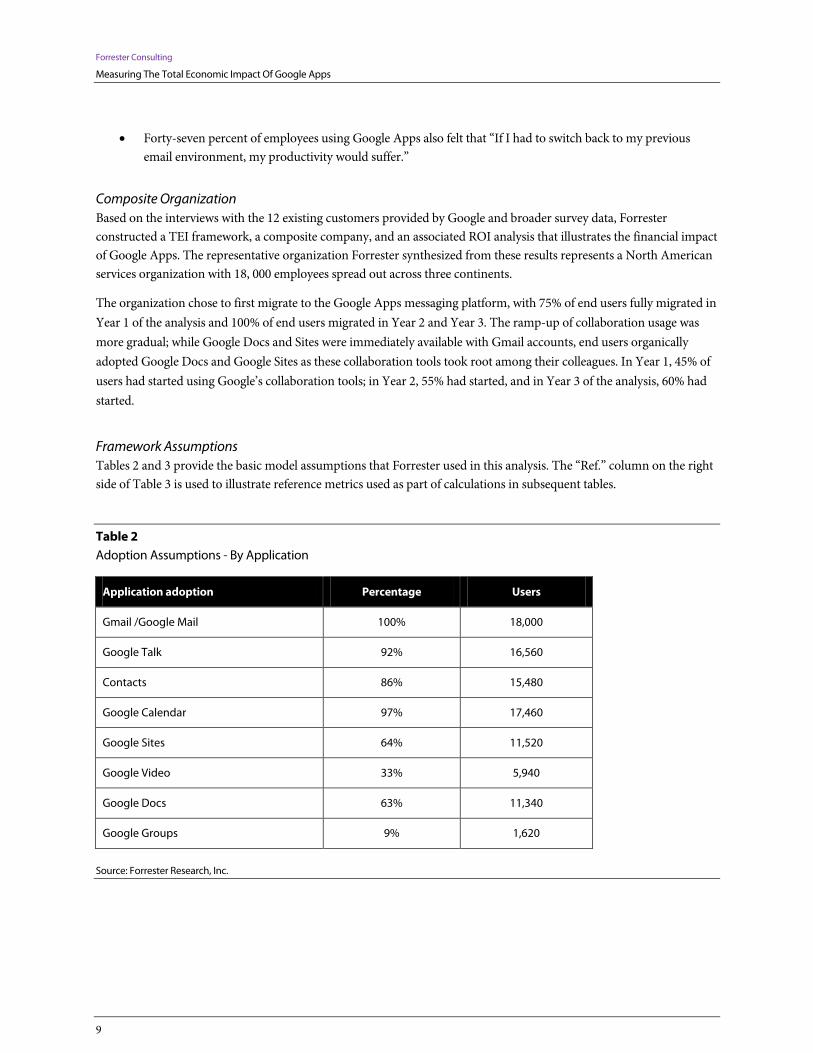
Framework Assumptions Tables 2 and 3 provide the basic model assumptions that Forrester used in this analysis. The “Ref.” column on the right side of Table 3 is used to illustrate reference metrics used as part of calculations in subsequent tables.
Table 2 Adoption Assumptions - By Application
Application adoption Percentage Users
Gmail /Google Mail 100% 18,000
Google Talk 92% 16,560
Contacts 86% 15,480
Google Calendar 97% 17,460
Google Sites 64% 11,520
Google Video 33% 5,940
Google Docs 63% 11,340
Google Groups 9% 1,620
Source: Forrester Research, Inc.
Forrester Consulting
Measuring The Total Economic Impact Of Google Apps
10
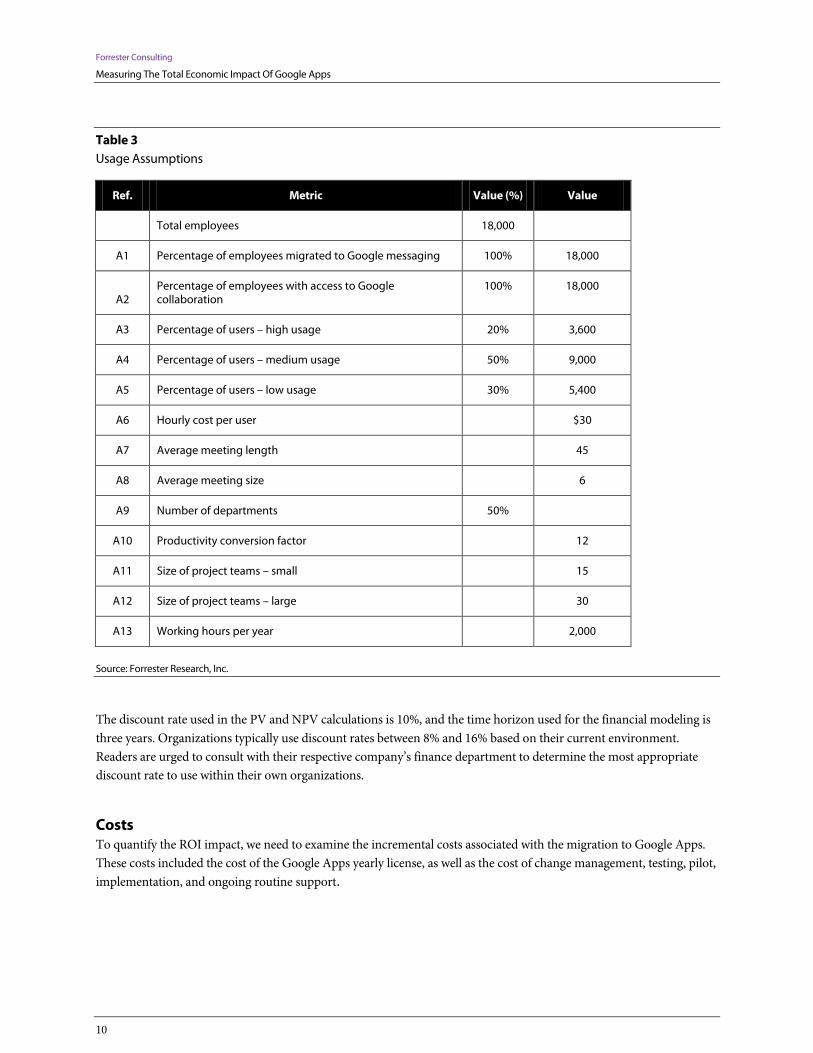
Table 3 Usage Assumptions
Ref. Metric Value (%) Value
Total employees 18,000
A1 Percentage of employees migrated to Google messaging 100% 18,000
A2 Percentage of employees with access to Google collaboration
100% 18,000
A3 Percentage of users – high usage 20% 3,600
A4 Percentage of users – medium usage 50% 9,000
A5 Percentage of users – low usage 30% 5,400
A6 Hourly cost per user $30
A7 Average meeting length 45
A8 Average meeting size 6
A9 Number of departments 50%
A10 Productivity conversion factor 12
A11 Size of project teams – small 15
A12 Size of project teams – large 30
A13 Working hours per year 2,000
Source: Forrester Research, Inc.
The discount rate used in the PV and NPV calculations is 10%, and the time horizon used for the financial modeling is three years. Organizations typically use discount rates between 8% and 16% based on their current environment. Readers are urged to consult with their respective company’s finance department to determine the most appropriate discount rate to use within their own organizations.
Costs To quantify the ROI impact, we need to examine the incremental costs associated with the migration to Google Apps. These costs included the cost of the Google Apps yearly license, as well as the cost of change management, testing, pilot, implementation, and ongoing routine support.
Forrester Consulting
Measuring The Total Economic Impact Of Google Apps
11
License Cost Google Apps is sold for a flat annual license, which includes both the messaging and collaboration tools. The annual license cost is $50 per user per year. Organizations noted a driver in moving to Google Apps was the simplicity of pricing as a factor in considering Google Apps as a messaging and collaboration platform. In addition to the base cost of licenses, message archiving costs of $13 per user per year were added to take into account the regulatory and compliance requirements of an organization of this size.
Change Management In addition to the cost of licenses, organizations noted several additional costs were incurred as part of the migration away from their on-premise environment to Google Apps. The cost of change management included the time and effort to educate and promote adoption of Google Apps among a core group of power users.
Testing Another upfront cost with Google Apps was internal testing prior to implementation. Organizations noted the need to ensure the data and information from existing accounts could be successfully migrated from the on-premise environment to the new cloud-based platform.
Pilot And Implementation The cost of pilot and implementation includes the cost to transition each user to the new Google Apps environment. As part of the rollout, most of the surveyed organizations selected a subset of “power” users to perform the initial pilot as well as act as platform champions during the wider rollout.
Support Costs Most organizations noted a reduction in overall support costs over time, but a minority of surveyed organizations saw increases in support costs as a result of user questions during the migration period.
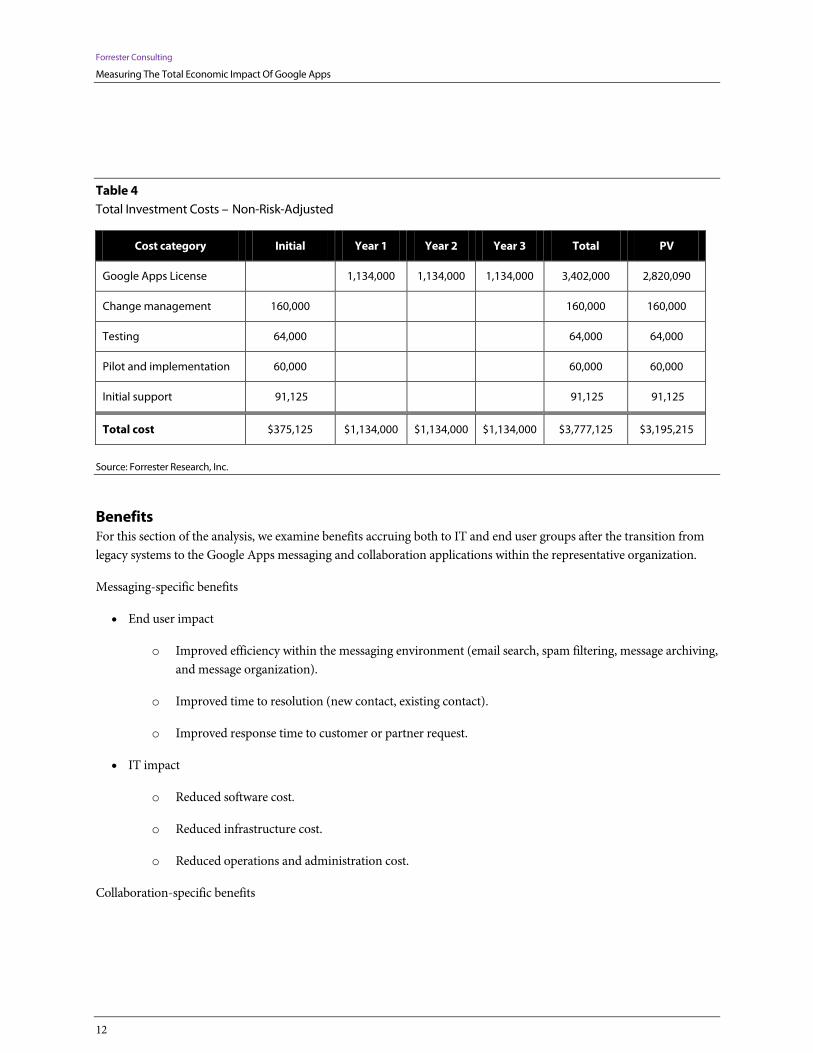
Total Costs Table 4 illustrates the total investment costs for the representative organization.
Forrester Consulting
Measuring The Total Economic Impact Of Google Apps
12
Table 4 Total Investment Costs – Non-Risk-Adjusted
Cost category Initial Year 1 Year 2 Year 3 Total PV
Google Apps License
1,134,000 1,134,000 1,134,000 3,402,000 2,820,090
Change management 160,000
160,000 160,000
Testing 64,000
64,000 64,000
Pilot and implementation 60,000
60,000 60,000
Initial support 91,125
91,125 91,125
Total cost $375,125 $1,134,000 $1,134,000 $1,134,000 $3,777,125 $3,195,215
Source: Forrester Research, Inc.
Benefits For this section of the analysis, we examine benefits accruing both to IT and end user groups after the transition from legacy systems to the Google Apps messaging and collaboration applications within the representative organization.
Messaging-specific benefits
• End user impact
o Improved efficiency within the messaging environment (email search, spam filtering, message archiving, and message organization).
o Improved time to resolution (new contact, existing contact).
o Improved response time to customer or partner request.
• IT impact
o Reduced software cost.
o Reduced infrastructure cost.
o Reduced operations and administration cost.
Collaboration-specific benefits
Forrester Consulting
Measuring The Total Economic Impact Of Google Apps
13
• End user impact
o Faster document revision reconciliation.
o Timely project tracking information.
o Improved ability to quickly incorporate feedback.
o Improved meeting efficiency.
o Efficient companywide information distribution.
o Efficient sharing and processing of feedback.
• IT impact
o Reduced software cost.
o Reduced cost to set up internal sites.
Messaging-Specific Benefits Google Apps clients noted several key end-user benefits within Google’s messaging environment in comparison with their on-premise email solution. Our survey results highlighted the improved efficiency in using specific features within Gmail, including Chat (IM). In particular, users cited key time savings with email search, spam filtering, message archiving, and message organization, as well as the ability to use integrated Chat (IM) within Gmail to quickly identify internal contacts and resolve immediate questions. In addition, users interviewed cited improvements to how they read and respond as a result of Gmail’s automatic message organization capabilities like message threading.
Improved Efficiency Within The messaging Environment (Search, Spam Filtering, Archiving, And Organization) Moving to Gmail had a net positive impact on users for many common tasks. Users saw a reduction in the amount of time spent searching, filtering, and archiving after they became accustomed to Gmail’s new features. In the case of email archiving, users noted that in the previous messaging environment they needed to perform manual archiving of their email onto their local client, whereas Gmail’s large storage quota eliminates the need for manual archiving. In addition, with all emails stored in one central, easily searched location, the amount of time spent searching for email was reduced as compared with the previous messaging environment, where archived email was stored in multiple locations. In fact, 37% of respondents reported that they spend less time searching for email messages. Forty-six percent of employees using Google Apps found that they spent significantly or slightly less time organizing email.
With Gmail’s spam filtering, users are able to reduce clutter within their inbox through a reduction in junk or spam messages. A full 25% agree that they spend less time looking for important messages because they have less spam to deal with. Furthermore, a very high 89% of employees report that they can sign into email faster with Gmail than they could with their previous solution.
Forrester Consulting
Measuring The Total Economic Impact Of Google Apps
14
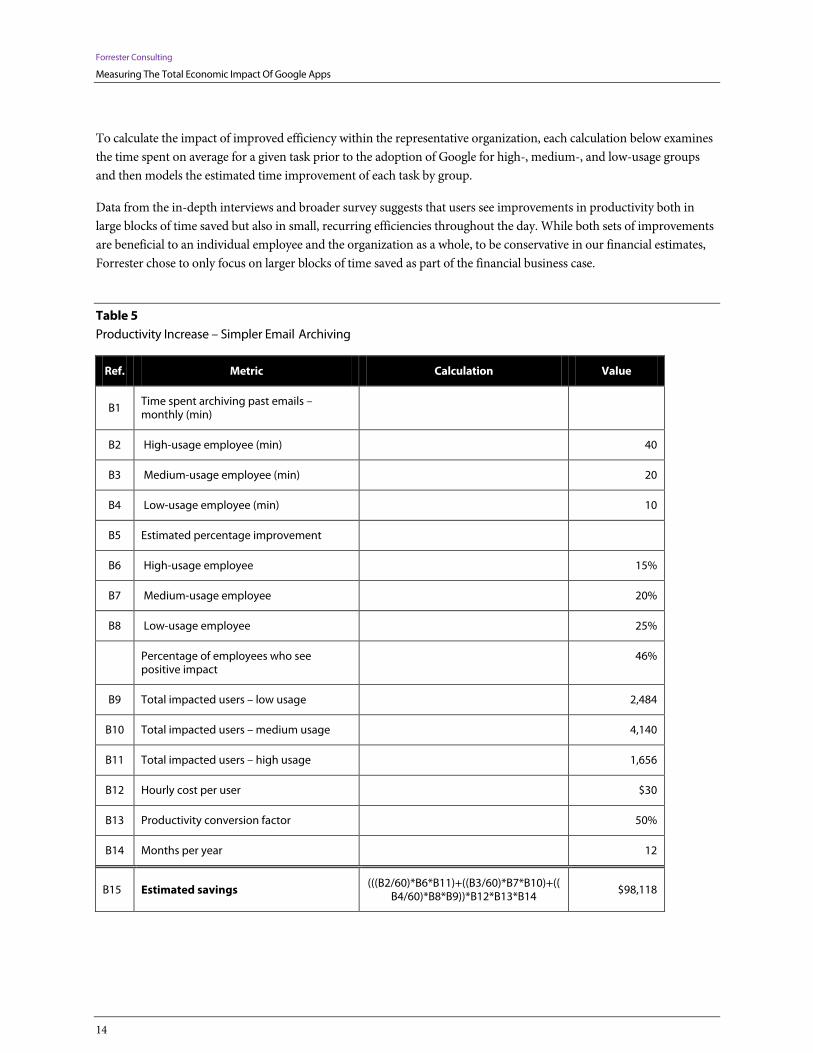
To calculate the impact of improved efficiency within the representative organization, each calculation below examines the time spent on average for a given task prior to the adoption of Google for high-, medium-, and low-usage groups and then models the estimated time improvement of each task by group.
Data from the in-depth interviews and broader survey suggests that users see improvements in productivity both in large blocks of time saved but also in small, recurring efficiencies throughout the day. While both sets of improvements are beneficial to an individual employee and the organization as a whole, to be conservative in our financial estimates, Forrester chose to only focus on larger blocks of time saved as part of the financial business case.
Table 5 Productivity Increase – Simpler Email Archiving
Ref. Metric Calculation Value
B1 Time spent archiving past emails –monthly (min)
B2 High-usage employee (min) 40
B3 Medium-usage employee (min) 20
B4 Low-usage employee (min) 10
B5 Estimated percentage improvement
B6 High-usage employee 15%
B7 Medium-usage employee 20%
B8 Low-usage employee 25%
Percentage of employees who see positive impact
46%
B9 Total impacted users – low usage 2,484
B10 Total impacted users – medium usage 4,140
B11 Total impacted users – high usage
1,656
B12 Hourly cost per user
$30
B13 Productivity conversion factor
50%
B14 Months per year
12
B15 Estimated savings (((B2/60)*B6*B11)+((B3/60)*B7*B10)+((
B4/60)*B8*B9))*B12*B13*B14 $98,118
Forrester Consulting
Measuring The Total Economic Impact Of Google Apps
15
Source: Forrester Research, Inc.
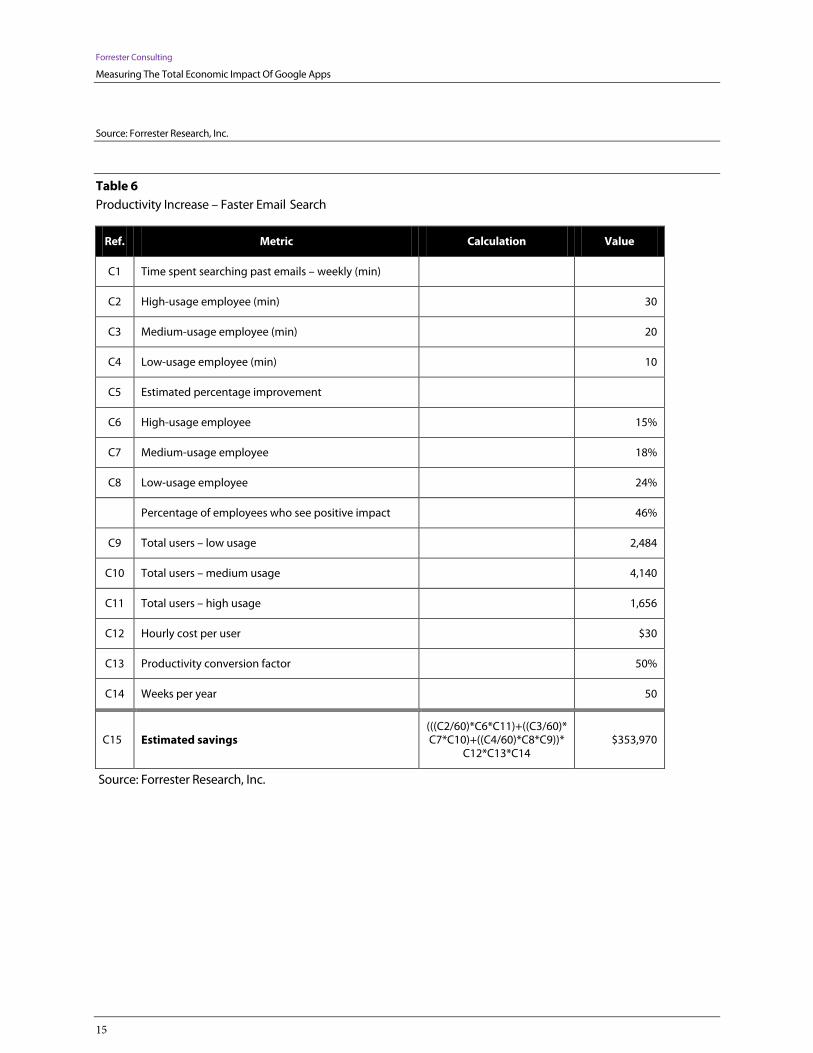
Table 6 Productivity Increase – Faster Email Search
Ref. Metric Calculation Value
C1 Time spent searching past emails – weekly (min)
C2 High-usage employee (min) 30
C3 Medium-usage employee (min) 20
C4 Low-usage employee (min) 10
C5 Estimated percentage improvement
C6 High-usage employee 15%
C7 Medium-usage employee 18%
C8 Low-usage employee 24%
Percentage of employees who see positive impact 46%
C9 Total users – low usage 2,484
C10 Total users – medium usage 4,140
C11 Total users – high usage 1,656
C12 Hourly cost per user $30
C13 Productivity conversion factor
50%
C14 Weeks per year 50
C15 Estimated savings (((C2/60)*C6*C11)+((C3/60)*C7*C10)+((C4/60)*C8*C9))*
C12*C13*C14 $353,970
Source: Forrester Research, Inc.
Forrester Consulting
Measuring The Total Economic Impact Of Google Apps
16
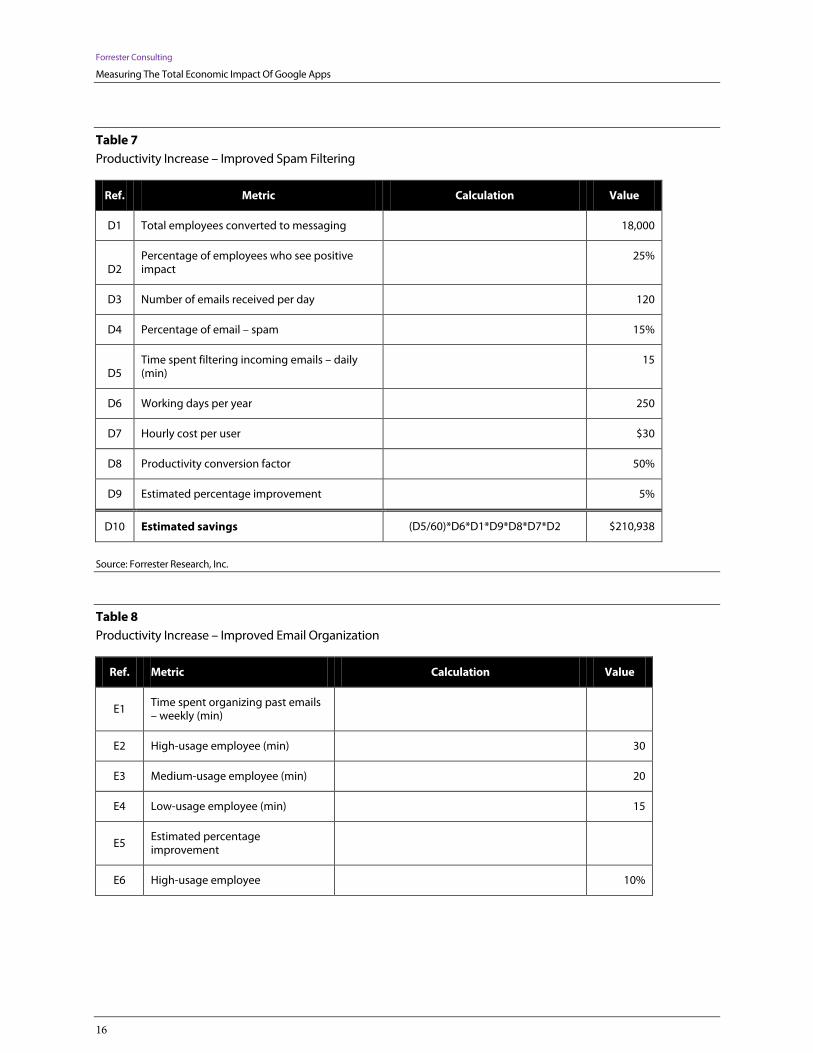
Table 7 Productivity Increase – Improved Spam Filtering
Ref. Metric Calculation Value
D1 Total employees converted to messaging 18,000
D2 Percentage of employees who see positive impact
25%
D3 Number of emails received per day 120
D4 Percentage of email – spam 15%
D5 Time spent filtering incoming emails – daily (min)
15
D6 Working days per year 250
D7 Hourly cost per user $30
D8 Productivity conversion factor 50%
D9 Estimated percentage improvement
5%
D10 Estimated savings (D5/60)*D6*D1*D9*D8*D7*D2 $210,938
Source: Forrester Research, Inc.
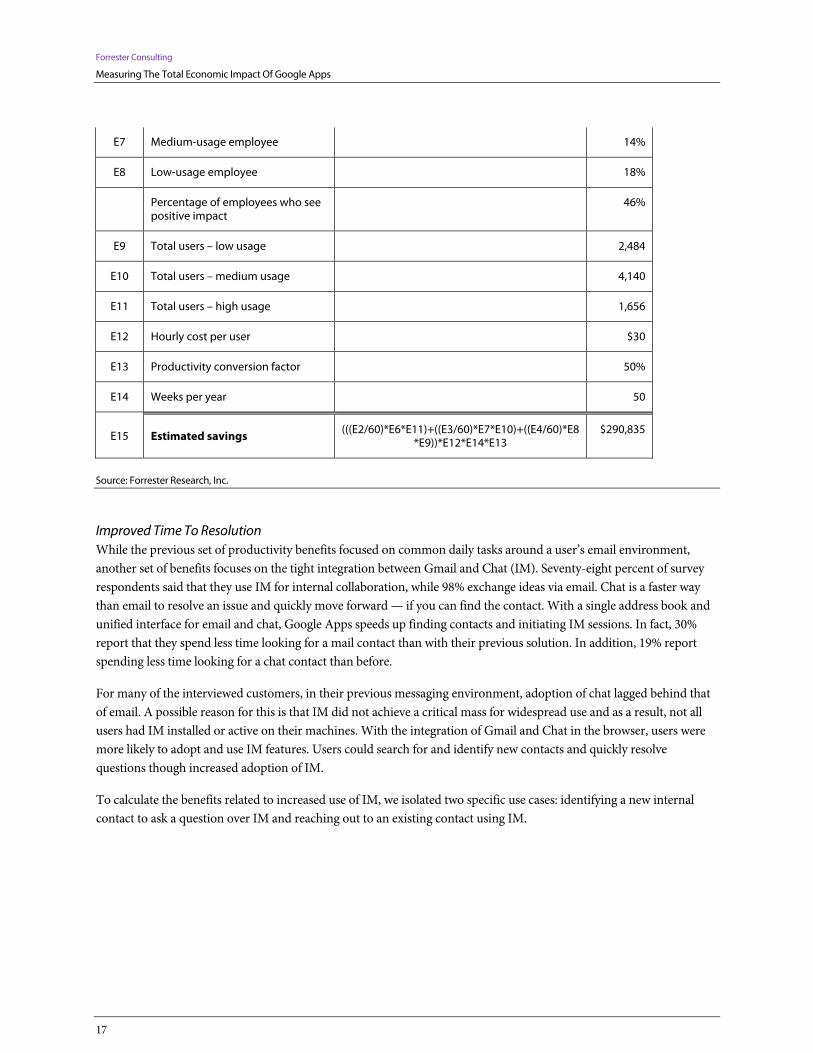
Table 8 Productivity Increase – Improved Email Organization
Ref. Metric Calculation Value
E1 Time spent organizing past emails – weekly (min)
E2 High-usage employee (min) 30
E3 Medium-usage employee (min) 20
E4 Low-usage employee (min) 15
E5 Estimated percentage improvement
E6 High-usage employee 10%
Forrester Consulting
Measuring The Total Economic Impact Of Google Apps
17
E7 Medium-usage employee 14%
E8 Low-usage employee 18%
Percentage of employees who see positive impact
46%
E9 Total users – low usage 2,484
E10 Total users – medium usage 4,140
E11 Total users – high usage 1,656
E12 Hourly cost per user $30
E13 Productivity conversion factor
50%
E14 Weeks per year 50
E15 Estimated savings (((E2/60)*E6*E11)+((E3/60)*E7*E10)+((E4/60)*E8*E9))*E12*E14*E13
$290,835
Source: Forrester Research, Inc.
Improved Time To Resolution While the previous set of productivity benefits focused on common daily tasks around a user’s email environment, another set of benefits focuses on the tight integration between Gmail and Chat (IM). Seventy-eight percent of survey respondents said that they use IM for internal collaboration, while 98% exchange ideas via email. Chat is a faster way than email to resolve an issue and quickly move forward — if you can find the contact. With a single address book and unified interface for email and chat, Google Apps speeds up finding contacts and initiating IM sessions. In fact, 30% report that they spend less time looking for a mail contact than with their previous solution. In addition, 19% report spending less time looking for a chat contact than before.
For many of the interviewed customers, in their previous messaging environment, adoption of chat lagged behind that of email. A possible reason for this is that IM did not achieve a critical mass for widespread use and as a result, not all users had IM installed or active on their machines. With the integration of Gmail and Chat in the browser, users were more likely to adopt and use IM features. Users could search for and identify new contacts and quickly resolve questions though increased adoption of IM.
To calculate the benefits related to increased use of IM, we isolated two specific use cases: identifying a new internal contact to ask a question over IM and reaching out to an existing contact using IM.
Forrester Consulting
Measuring The Total Economic Impact Of Google Apps
18
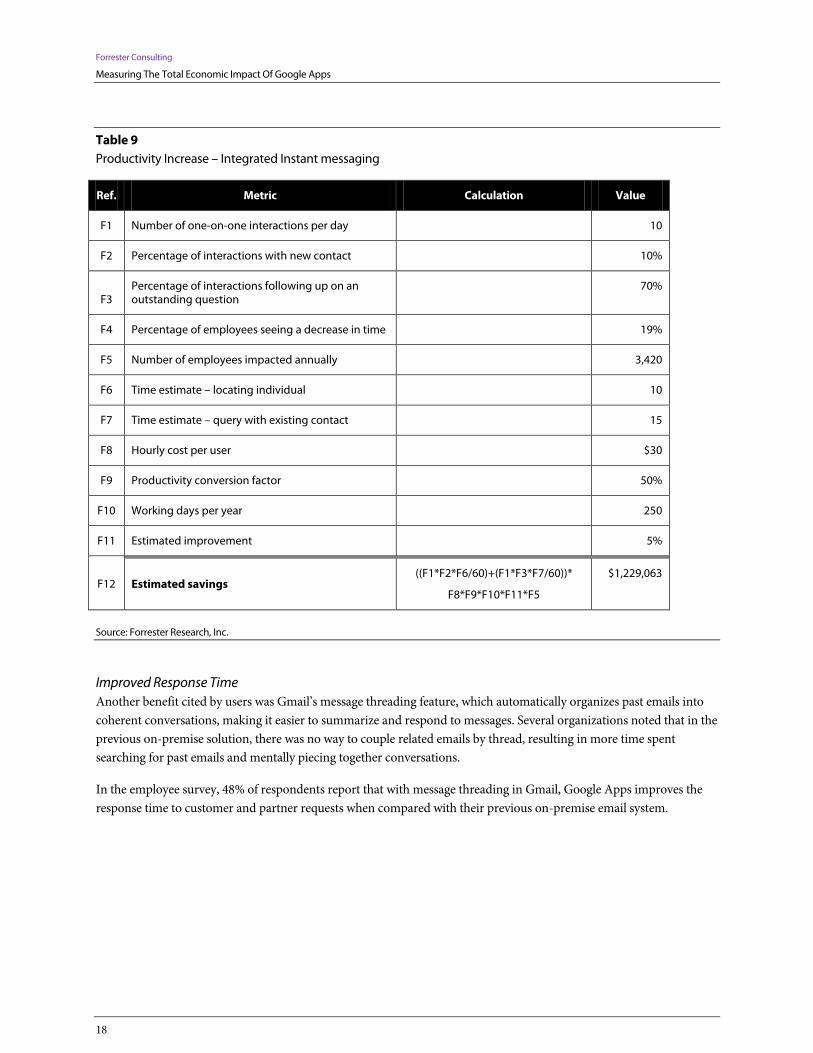
Table 9 Productivity Increase – Integrated Instant messaging
Ref. Metric Calculation Value
F1 Number of one-on-one interactions per day 10
F2 Percentage of interactions with new contact 10%
F3 Percentage of interactions following up on an outstanding question
70%
F4 Percentage of employees seeing a decrease in time 19%
F5 Number of employees impacted annually 3,420
F6 Time estimate – locating individual 10
F7 Time estimate – query with existing contact 15
F8 Hourly cost per user $30
F9 Productivity conversion factor 50%
F10 Working days per year
250
F11 Estimated improvement 5%
F12 Estimated savings ((F1*F2*F6/60)+(F1*F3*F7/60))*
F8*F9*F10*F11*F5
$1,229,063
Source: Forrester Research, Inc.
Improved Response Time Another benefit cited by users was Gmail’s message threading feature, which automatically organizes past emails into coherent conversations, making it easier to summarize and respond to messages. Several organizations noted that in the previous on-premise solution, there was no way to couple related emails by thread, resulting in more time spent searching for past emails and mentally piecing together conversations.
In the employee survey, 48% of respondents report that with message threading in Gmail, Google Apps improves the response time to customer and partner requests when compared with their previous on-premise email system.
Forrester Consulting
Measuring The Total Economic Impact Of Google Apps
19
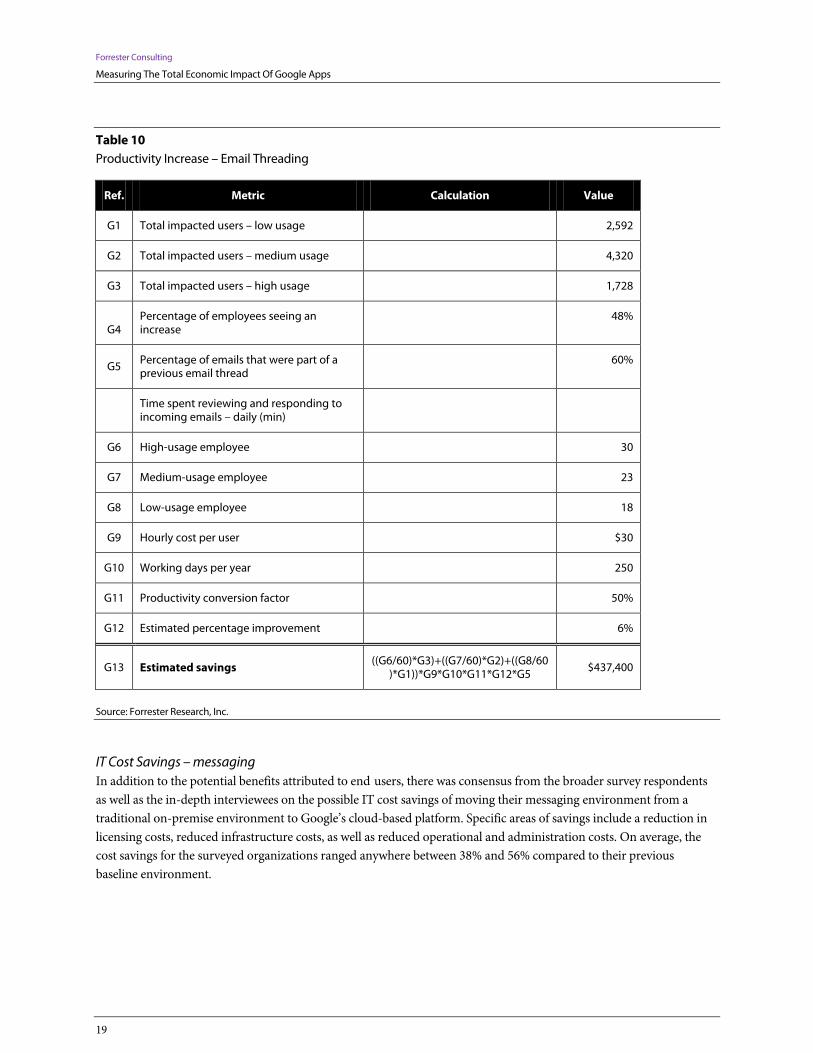
Table 10 Productivity Increase – Email Threading
Ref. Metric Calculation Value
G1 Total impacted users – low usage 2,592
G2 Total impacted users – medium usage 4,320
G3 Total impacted users – high usage 1,728
G4 Percentage of employees seeing an increase
48%
G5 Percentage of emails that were part of a previous email thread
60%
Time spent reviewing and responding to incoming emails – daily (min)
G6 High-usage employee 30
G7 Medium-usage employee 23
G8 Low-usage employee 18
G9 Hourly cost per user $30
G10 Working days per year 250
G11 Productivity conversion factor 50%
G12 Estimated percentage improvement 6%
G13 Estimated savings ((G6/60)*G3)+((G7/60)*G2)+((G8/60
)*G1))*G9*G10*G11*G12*G5 $437,400
Source: Forrester Research, Inc.
IT Cost Savings – messaging In addition to the potential benefits attributed to end users, there was consensus from the broader survey respondents as well as the in-depth interviewees on the possible IT cost savings of moving their messaging environment from a traditional on-premise environment to Google’s cloud-based platform. Specific areas of savings include a reduction in licensing costs, reduced infrastructure costs, as well as reduced operational and administration costs. On average, the cost savings for the surveyed organizations ranged anywhere between 38% and 56% compared to their previous baseline environment.
Forrester Consulting
Measuring The Total Economic Impact Of Google Apps
20
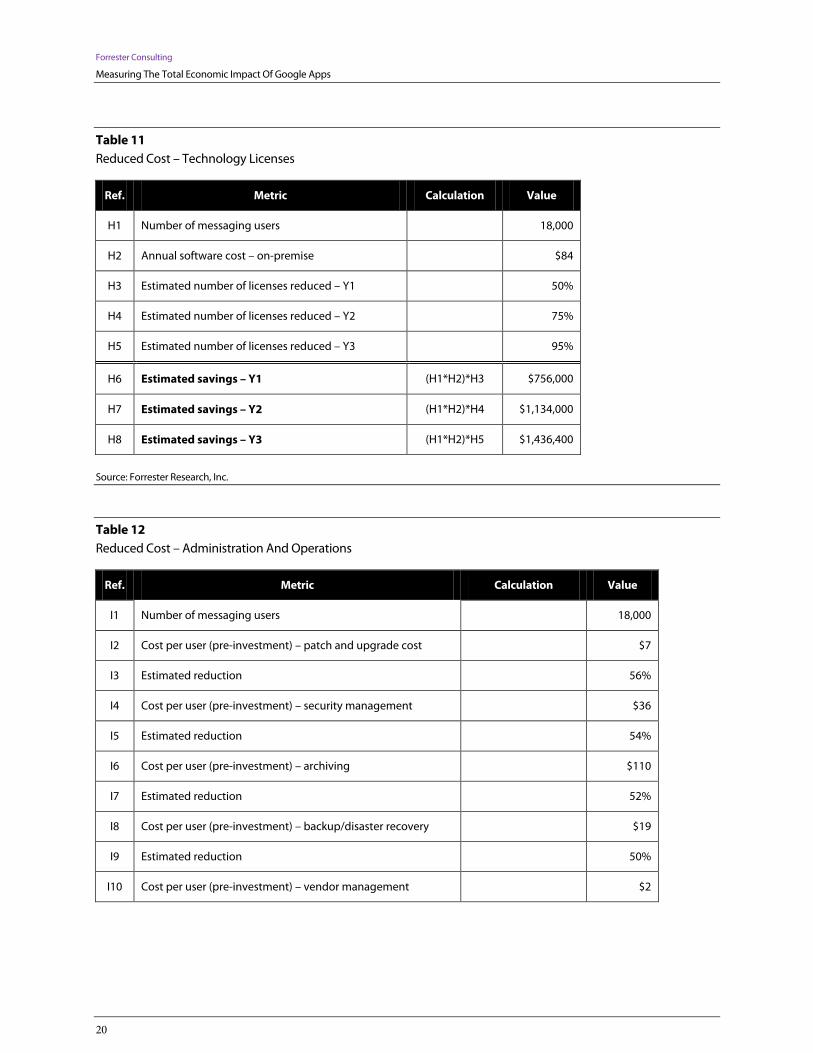
Table 11 Reduced Cost – Technology Licenses
Ref. Metric Calculation Value
H1 Number of messaging users
18,000
H2 Annual software cost – on-premise
$84
H3 Estimated number of licenses reduced – Y1
50%
H4 Estimated number of licenses reduced – Y2
75%
H5 Estimated number of licenses reduced – Y3
95%
H6 Estimated savings – Y1 (H1*H2)*H3 $756,000
H7 Estimated savings – Y2 (H1*H2)*H4 $1,134,000
H8 Estimated savings – Y3 (H1*H2)*H5 $1,436,400
Source: Forrester Research, Inc.
Table 12 Reduced Cost – Administration And Operations
Ref. Metric Calculation Value
I1 Number of messaging users
18,000
I2 Cost per user (pre-investment) – patch and upgrade cost
$7
I3 Estimated reduction
56%
I4 Cost per user (pre-investment) – security management
$36
I5 Estimated reduction
54%
I6 Cost per user (pre-investment) – archiving
$110
I7 Estimated reduction
52%
I8 Cost per user (pre-investment) – backup/disaster recovery
$19
I9 Estimated reduction
50%
I10 Cost per user (pre-investment) – vendor management
$2
Forrester Consulting
Measuring The Total Economic Impact Of Google Apps
21
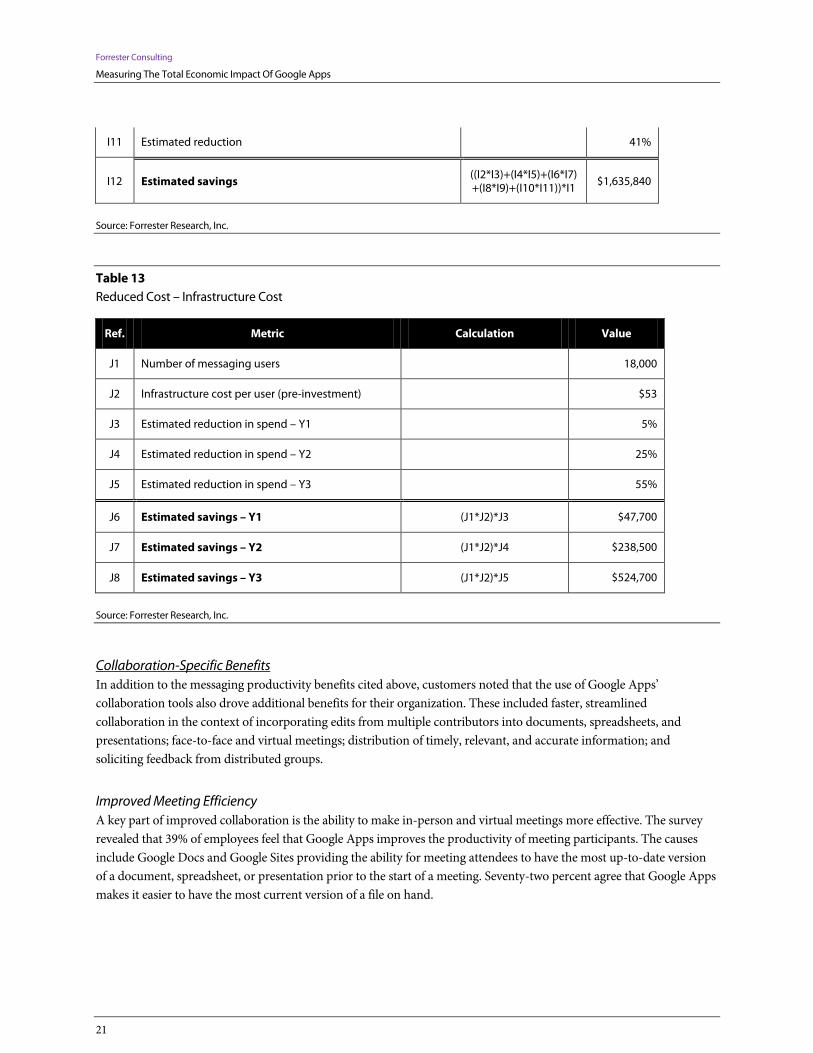
I11 Estimated reduction
41%
I12 Estimated savings ((I2*I3)+(I4*I5)+(I6*I7)+(I8*I9)+(I10*I11))*I1
$1,635,840
Source: Forrester Research, Inc.
Table 13 Reduced Cost – Infrastructure Cost
Ref. Metric Calculation Value
J1 Number of messaging users
18,000
J2 Infrastructure cost per user (pre-investment)
$53
J3 Estimated reduction in spend – Y1
5%
J4 Estimated reduction in spend – Y2
25%
J5 Estimated reduction in spend – Y3
55%
J6 Estimated savings – Y1 (J1*J2)*J3 $47,700
J7 Estimated savings – Y2 (J1*J2)*J4 $238,500
J8 Estimated savings – Y3 (J1*J2)*J5 $524,700
Source: Forrester Research, Inc.
Collaboration-Specific Benefits In addition to the messaging productivity benefits cited above, customers noted that the use of Google Apps’ collaboration tools also drove additional benefits for their organization. These included faster, streamlined collaboration in the context of incorporating edits from multiple contributors into documents, spreadsheets, and presentations; face-to-face and virtual meetings; distribution of timely, relevant, and accurate information; and soliciting feedback from distributed groups.
Improved Meeting Efficiency A key part of improved collaboration is the ability to make in-person and virtual meetings more effective. The survey revealed that 39% of employees feel that Google Apps improves the productivity of meeting participants. The causes include Google Docs and Google Sites providing the ability for meeting attendees to have the most up-to-date version of a document, spreadsheet, or presentation prior to the start of a meeting. Seventy-two percent agree that Google Apps makes it easier to have the most current version of a file on hand.
Forrester Consulting
Measuring The Total Economic Impact Of Google Apps
22
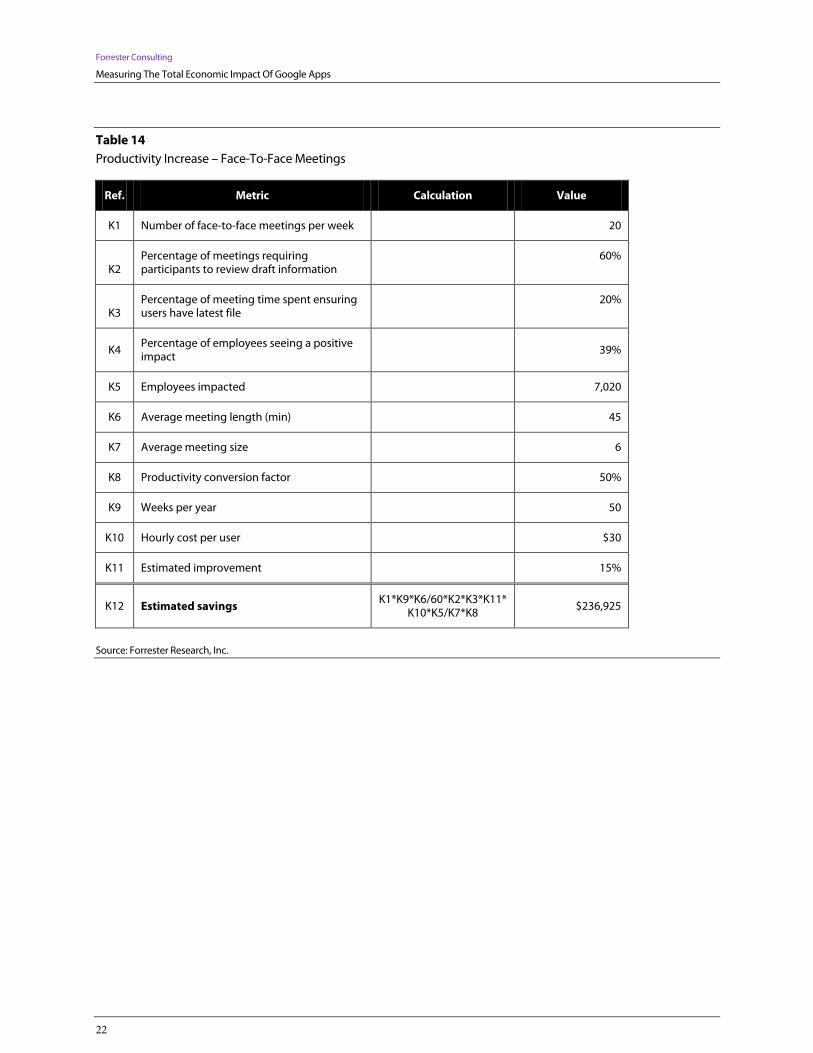
Table 14 Productivity Increase – Face-To-Face Meetings
Ref. Metric Calculation Value
K1 Number of face-to-face meetings per week
20
K2 Percentage of meetings requiring participants to review draft information
60%
K3 Percentage of meeting time spent ensuring users have latest file
20%
K4 Percentage of employees seeing a positive impact
39%
K5 Employees impacted
7,020
K6 Average meeting length (min)
45
K7 Average meeting size
6
K8 Productivity conversion factor
50%
K9 Weeks per year
50
K10 Hourly cost per user
$30
K11 Estimated improvement
15%
K12 Estimated savings K1*K9*K6/60*K2*K3*K11*
K10*K5/K7*K8 $236,925
Source: Forrester Research, Inc.

Forrester Consulting
Measuring The Total Economic Impact Of Google Apps
23
Table 15 Productivity Increase – Virtual Meetings
Ref. Metric Calculation Value
L1 Number of phone/video meetings per week
50
L2 Percentage of meetings requiring participants to review draft information
40%
L3 Percentage of meeting time spent ensuring users have latest file
15%
L4 Percentage of employees seeing an increase 39%
L5 Employees impacted
7,020
L6 Average meeting length (min)
45
L7 Average meeting size
6
L8 Productivity conversion factor
50%
L9 Weeks per year
50
L10 Hourly cost per user
$30
L11 Estimated improvement
15%
L12 Estimated savings L1*L9*L6/60*L2*L3*L11*L10*L5/L7*L8
$296,156
Source: Forrester Research, Inc.
Improved Timeliness Of Accurate Information When important project information is readily available to all team members, it leads to more work in parallel, less waiting for others to complete their tasks, and keeping the process moving forward efficiently and in sync. The survey shows that with Google Apps, 70% of employees feel that “the time to create and complete a shared file is improved.” In addition, 52% feel that they “no longer have to wait for others to complete a shared document.”
Forrester Consulting
Measuring The Total Economic Impact Of Google Apps
24
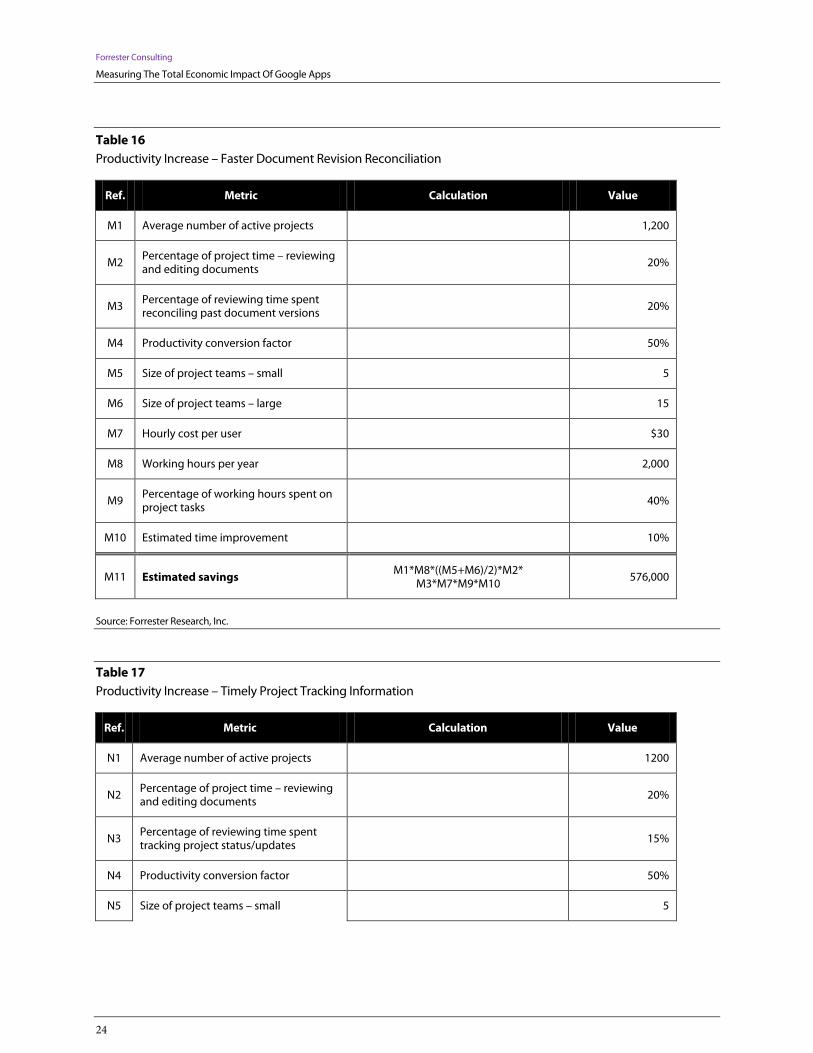
Table 16 Productivity Increase – Faster Document Revision Reconciliation
Ref. Metric Calculation Value
M1 Average number of active projects
1,200
M2 Percentage of project time – reviewing and editing documents
20%
M3 Percentage of reviewing time spent reconciling past document versions
20%
M4 Productivity conversion factor
50%
M5 Size of project teams – small
5
M6 Size of project teams – large
15
M7 Hourly cost per user
$30
M8 Working hours per year
2,000
M9 Percentage of working hours spent on project tasks
40%
M10 Estimated time improvement
10%
M11 Estimated savings M1*M8*((M5+M6)/2)*M2*
M3*M7*M9*M10 576,000
Source: Forrester Research, Inc.
Table 17 Productivity Increase – Timely Project Tracking Information
Ref. Metric Calculation Value
N1 Average number of active projects
1200
N2 Percentage of project time – reviewing and editing documents
20%
N3 Percentage of reviewing time spent tracking project status/updates
15%
N4 Productivity conversion factor
50%
N5 Size of project teams – small
5
Forrester Consulting
Measuring The Total Economic Impact Of Google Apps
25
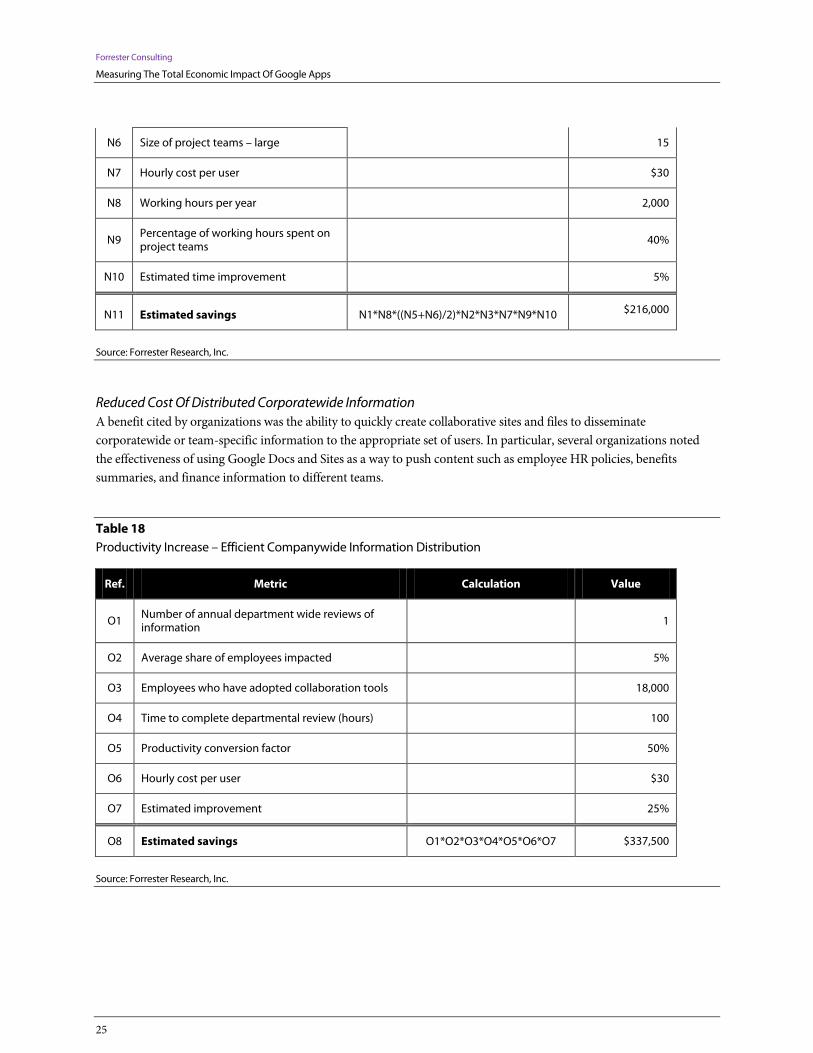
N6 Size of project teams – large
15
N7 Hourly cost per user
$30
N8 Working hours per year
2,000
N9 Percentage of working hours spent on project teams
40%
N10 Estimated time improvement
5%
N11 Estimated savings N1*N8*((N5+N6)/2)*N2*N3*N7*N9*N10 $216,000
Source: Forrester Research, Inc.
Reduced Cost Of Distributed Corporatewide Information A benefit cited by organizations was the ability to quickly create collaborative sites and files to disseminate corporatewide or team-specific information to the appropriate set of users. In particular, several organizations noted the effectiveness of using Google Docs and Sites as a way to push content such as employee HR policies, benefits summaries, and finance information to different teams.
Table 18 Productivity Increase – Efficient Companywide Information Distribution
Ref. Metric Calculation Value
O1 Number of annual department wide reviews of information
1
O2 Average share of employees impacted
5%
O3 Employees who have adopted collaboration tools
18,000
O4 Time to complete departmental review (hours)
100
O5 Productivity conversion factor
50%
O6 Hourly cost per user
$30
O7 Estimated improvement
25%
O8 Estimated savings O1*O2*O3*O4*O5*O6*O7 $337,500
Source: Forrester Research, Inc.
Forrester Consulting
Measuring The Total Economic Impact Of Google Apps
26
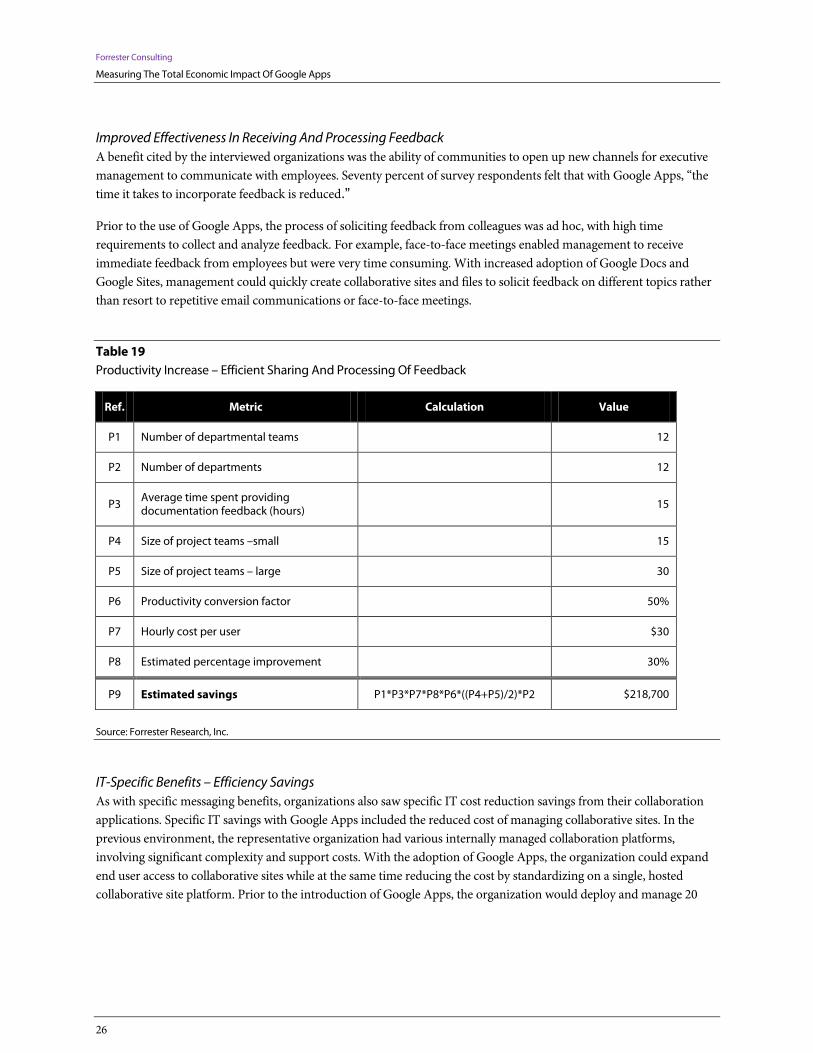
Improved Effectiveness In Receiving And Processing Feedback A benefit cited by the interviewed organizations was the ability of communities to open up new channels for executive management to communicate with employees. Seventy percent of survey respondents felt that with Google Apps, “the time it takes to incorporate feedback is reduced.”
Prior to the use of Google Apps, the process of soliciting feedback from colleagues was ad hoc, with high time requirements to collect and analyze feedback. For example, face-to-face meetings enabled management to receive immediate feedback from employees but were very time consuming. With increased adoption of Google Docs and Google Sites, management could quickly create collaborative sites and files to solicit feedback on different topics rather than resort to repetitive email communications or face-to-face meetings.
Table 19 Productivity Increase – Efficient Sharing And Processing Of Feedback
Ref. Metric Calculation Value
P1 Number of departmental teams
12
P2 Number of departments
12
P3 Average time spent providing documentation feedback (hours)
15
P4 Size of project teams –small
15
P5 Size of project teams – large
30
P6 Productivity conversion factor
50%
P7 Hourly cost per user
$30
P8 Estimated percentage improvement
30%
P9 Estimated savings P1*P3*P7*P8*P6*((P4+P5)/2)*P2 $218,700
Source: Forrester Research, Inc.
IT-Specific Benefits – Efficiency Savings As with specific messaging benefits, organizations also saw specific IT cost reduction savings from their collaboration applications. Specific IT savings with Google Apps included the reduced cost of managing collaborative sites. In the previous environment, the representative organization had various internally managed collaboration platforms, involving significant complexity and support costs. With the adoption of Google Apps, the organization could expand end user access to collaborative sites while at the same time reducing the cost by standardizing on a single, hosted collaborative site platform. Prior to the introduction of Google Apps, the organization would deploy and manage 20

Forrester Consulting
Measuring The Total Economic Impact Of Google Apps
27
new sites per year. With Google Apps, users had greater flexibility to create their own sites, increasing the number of new sites annually to 120 while reducing the IT burden to support those sites.
Table 20 Reduced Cost – Administration Of Collaborative Sites
Ref. Metric Calculation Value
Q1 FTE requirement to plan/test and deploy (hours)
150
Q2 Estimated reduction
38%
Q3 Cost per user
$30
Q4 Productivity conversion factor
50%
Q5 Number of sites created annually
20
Q6 Estimated savings Q1*Q2*Q3*Q4*Q5 $17,100
Source: Forrester Research, Inc.
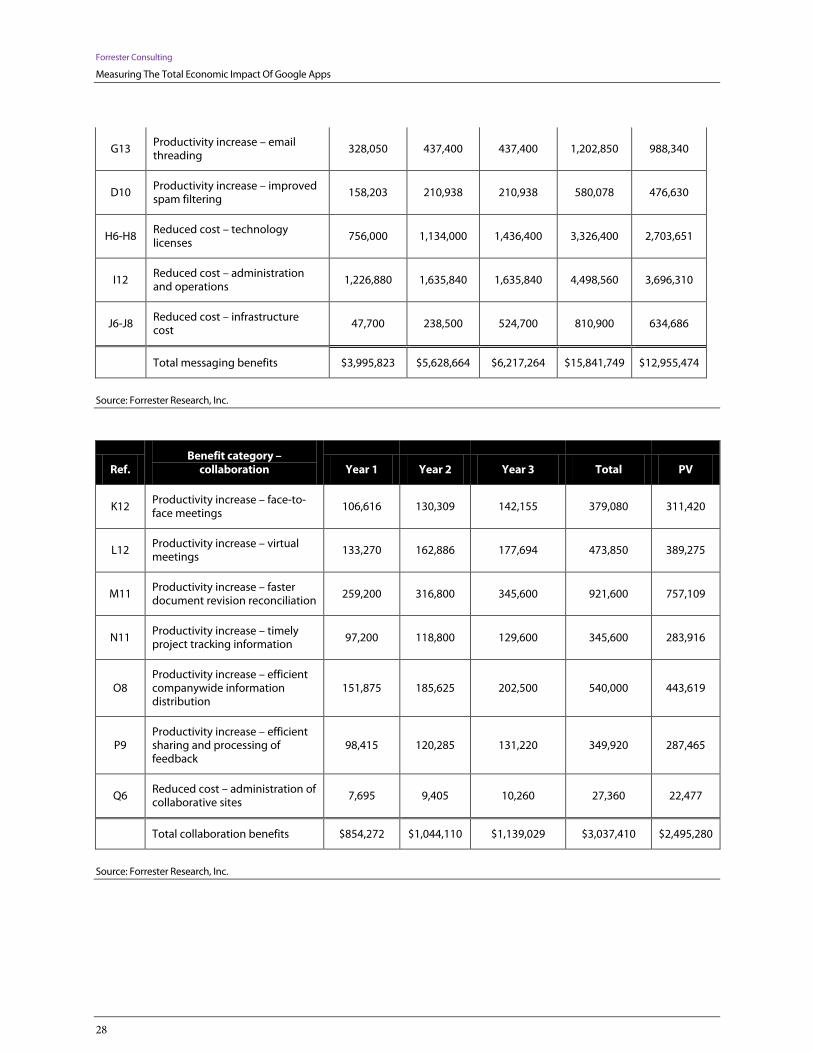
Total Benefits Total benefits of switching to Google Apps for both collaboration and messaging are listed in Table 21. Table 21 takes into account the observed ramp-up in usage of the messaging and collaboration tools in Google Apps. For messaging, we observed 75% adoption in Year 1 and 100% adoption in Year 2 and Year 3. For collaboration, we observed 45% adoption in Year 1, 55% adoption in Year 2, and 60% adoption in Year 3.
Table 21 Total Benefits – Non-Risk-Adjusted
Ref. Benefit category – messaging Year 1 Year 2 Year 3 Total PV
B15 Productivity increase – simpler email archiving
73,589 98,118 98,118 269,825 221,705
C15 Productivity increase – faster email search
265,478 353,970 353,970 973,418 799,823
E15 Productivity increase – improved email organization
218,126 290,835 290,835 799,796 657,165
F12 Productivity increase – integrated instant messaging
921,797 1,229,063 1,229,063 3,379,922 2,777,164
Forrester Consulting
Measuring The Total Economic Impact Of Google Apps
28
G13 Productivity increase – email threading
328,050 437,400 437,400 1,202,850 988,340
D10 Productivity increase – improved spam filtering
158,203 210,938 210,938 580,078 476,630
H6-H8 Reduced cost – technology licenses
756,000 1,134,000 1,436,400 3,326,400 2,703,651
I12 Reduced cost – administration and operations
1,226,880 1,635,840 1,635,840 4,498,560 3,696,310
J6-J8 Reduced cost – infrastructure cost
47,700 238,500 524,700 810,900 634,686
Total messaging benefits $3,995,823 $5,628,664 $6,217,264 $15,841,749 $12,955,474
Source: Forrester Research, Inc.
Ref. Benefit category –
collaboration Year 1 Year 2 Year 3 Total PV
K12 Productivity increase – face-to-face meetings
106,616 130,309 142,155 379,080 311,420
L12 Productivity increase – virtual meetings
133,270 162,886 177,694 473,850 389,275
M11 Productivity increase – faster document revision reconciliation
259,200 316,800 345,600 921,600 757,109
N11 Productivity increase – timely project tracking information 97,200 118,800 129,600 345,600 283,916
O8 Productivity increase – efficient companywide information distribution
151,875 185,625 202,500 540,000 443,619
P9 Productivity increase – efficient sharing and processing of feedback
98,415 120,285 131,220 349,920 287,465
Q6 Reduced cost – administration of collaborative sites
7,695 9,405 10,260 27,360 22,477
Total collaboration benefits $854,272 $1,044,110 $1,139,029 $3,037,410 $2,495,280
Source: Forrester Research, Inc.
Forrester Consulting
Measuring The Total Economic Impact Of Google Apps
29
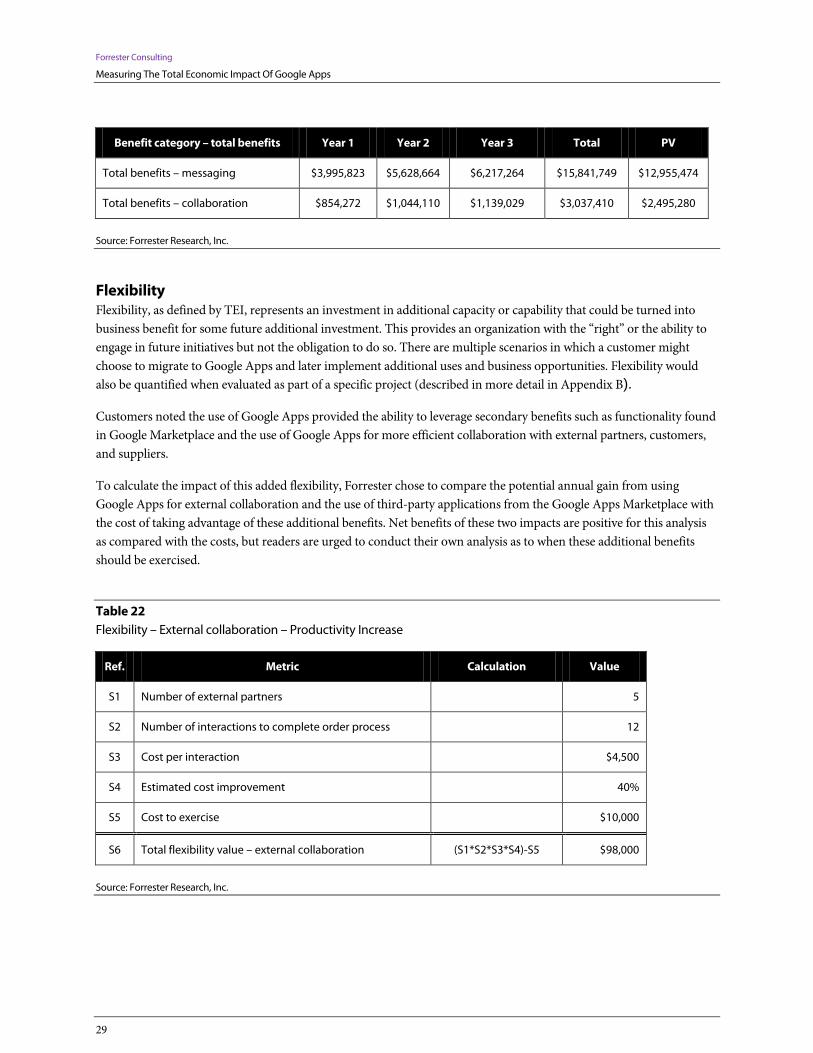
Benefit category – total benefits Year 1 Year 2 Year 3 Total PV
Total benefits – messaging $3,995,823 $5,628,664 $6,217,264 $15,841,749 $12,955,474
Total benefits – collaboration $854,272 $1,044,110 $1,139,029 $3,037,410 $2,495,280
Source: Forrester Research, Inc.
Flexibility Flexibility, as defined by TEI, represents an investment in additional capacity or capability that could be turned into business benefit for some future additional investment. This provides an organization with the “right” or the ability to engage in future initiatives but not the obligation to do so. There are multiple scenarios in which a customer might choose to migrate to Google Apps and later implement additional uses and business opportunities. Flexibility would also be quantified when evaluated as part of a specific project (described in more detail in Appendix B).
Customers noted the use of Google Apps provided the ability to leverage secondary benefits such as functionality found in Google Marketplace and the use of Google Apps for more efficient collaboration with external partners, customers, and suppliers.
To calculate the impact of this added flexibility, Forrester chose to compare the potential annual gain from using Google Apps for external collaboration and the use of third-party applications from the Google Apps Marketplace with the cost of taking advantage of these additional benefits. Net benefits of these two impacts are positive for this analysis as compared with the costs, but readers are urged to conduct their own analysis as to when these additional benefits should be exercised.
Table 22 Flexibility – External collaboration – Productivity Increase
Ref. Metric Calculation Value
S1 Number of external partners
5
S2 Number of interactions to complete order process
12
S3 Cost per interaction
$4,500
S4 Estimated cost improvement
40%
S5 Cost to exercise
$10,000
S6 Total flexibility value – external collaboration (S1*S2*S3*S4)-S5 $98,000
Source: Forrester Research, Inc.
Forrester Consulting
Measuring The Total Economic Impact Of Google Apps
30
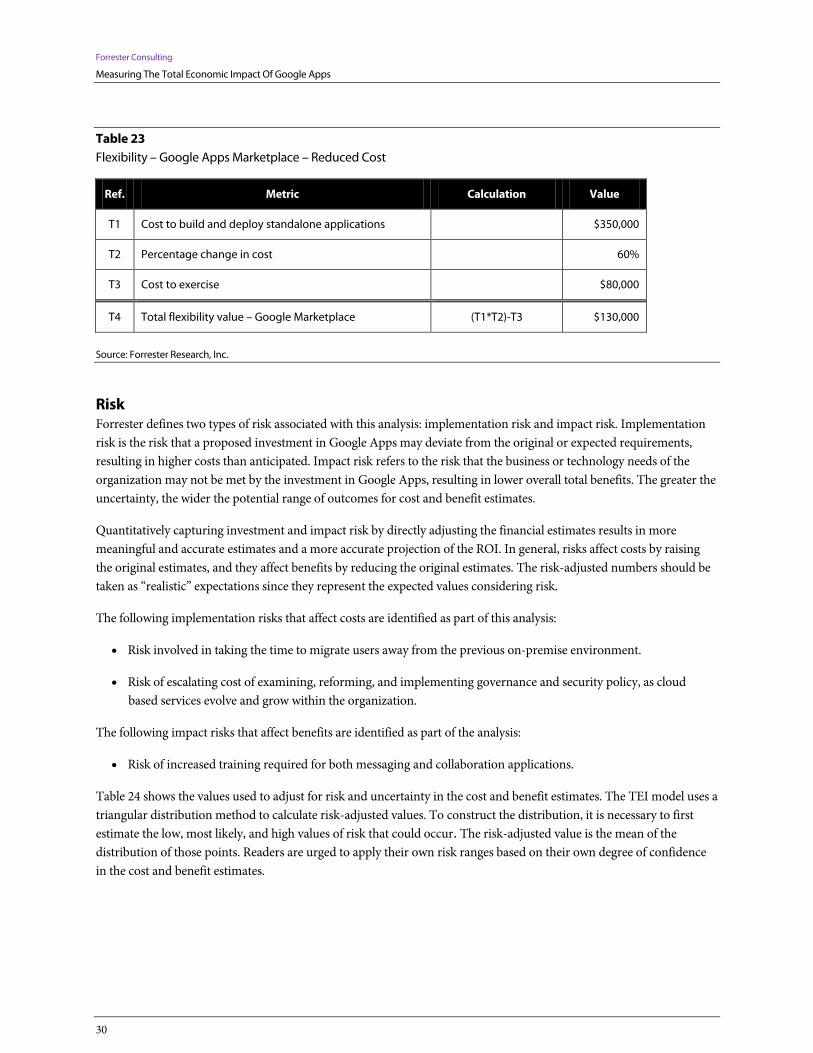
Table 23 Flexibility – Google Apps Marketplace – Reduced Cost
Ref. Metric Calculation Value
T1 Cost to build and deploy standalone applications
$350,000
T2 Percentage change in cost
60%
T3 Cost to exercise
$80,000
T4 Total flexibility value – Google Marketplace (T1*T2)-T3 $130,000
Source: Forrester Research, Inc.
Risk Forrester defines two types of risk associated with this analysis: implementation risk and impact risk. Implementation risk is the risk that a proposed investment in Google Apps may deviate from the original or expected requirements, resulting in higher costs than anticipated. Impact risk refers to the risk that the business or technology needs of the organization may not be met by the investment in Google Apps, resulting in lower overall total benefits. The greater the uncertainty, the wider the potential range of outcomes for cost and benefit estimates.
Quantitatively capturing investment and impact risk by directly adjusting the financial estimates results in more meaningful and accurate estimates and a more accurate projection of the ROI. In general, risks affect costs by raising the original estimates, and they affect benefits by reducing the original estimates. The risk-adjusted numbers should be taken as “realistic” expectations since they represent the expected values considering risk.
The following implementation risks that affect costs are identified as part of this analysis:
• Risk involved in taking the time to migrate users away from the previous on-premise environment.
• Risk of escalating cost of examining, reforming, and implementing governance and security policy, as cloud based services evolve and grow within the organization.
The following impact risks that affect benefits are identified as part of the analysis:
• Risk of increased training required for both messaging and collaboration applications.
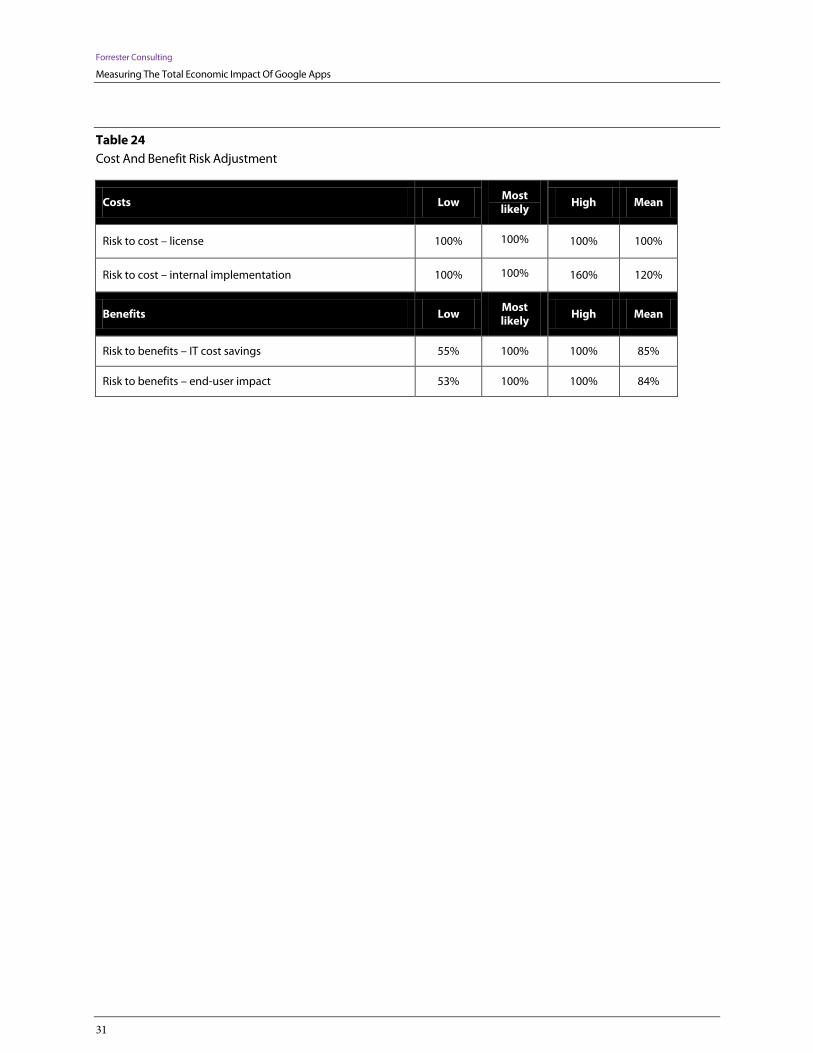
Table 24 shows the values used to adjust for risk and uncertainty in the cost and benefit estimates. The TEI model uses a triangular distribution method to calculate risk-adjusted values. To construct the distribution, it is necessary to first estimate the low, most likely, and high values of risk that could occur. The risk-adjusted value is the mean of the distribution of those points. Readers are urged to apply their own risk ranges based on their own degree of confidence in the cost and benefit estimates.
Forrester Consulting
Measuring The Total Economic Impact Of Google Apps
31
Table 24 Cost And Benefit Risk Adjustment
Costs Low Most likely High Mean
Risk to cost – license 100% 100% 100% 100%
Risk to cost – internal implementation 100% 100% 160% 120%
Benefits Low Most likely High Mean
Risk to benefits – IT cost savings 55% 100% 100% 85%
Risk to benefits – end-user impact 53% 100% 100% 84%
Forrester Consulting
Measuring The Total Economic Impact Of Google Apps
32
Financial Summary
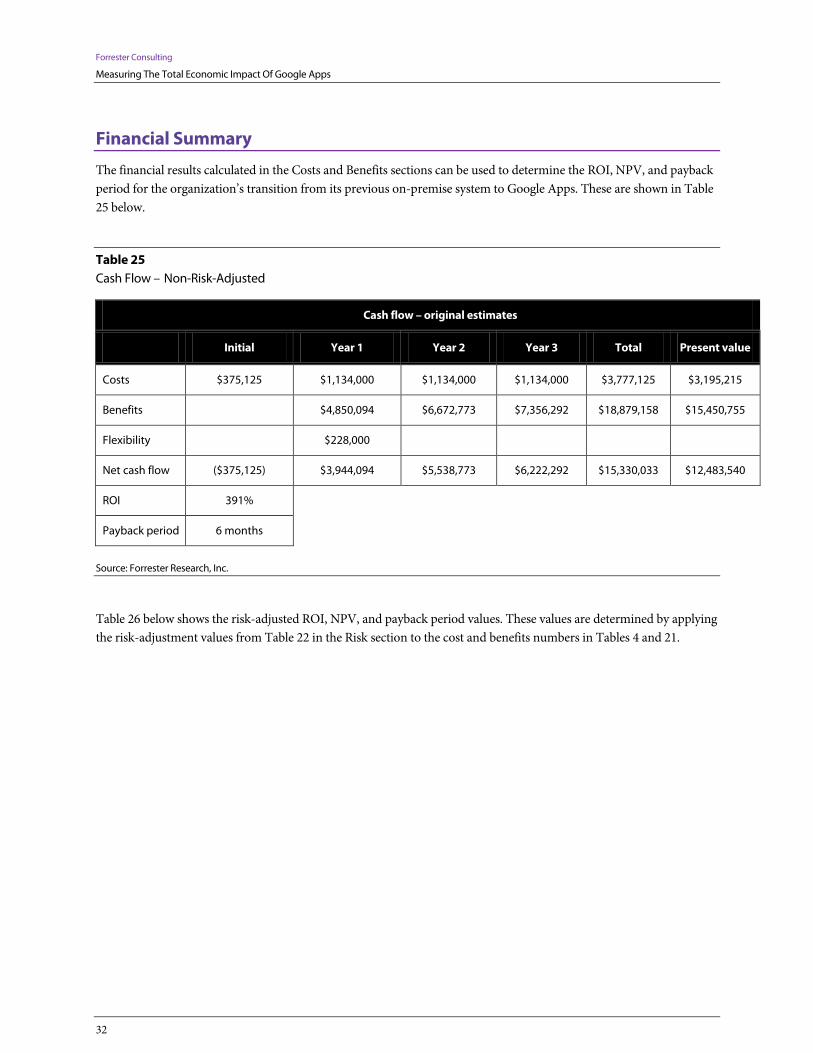
The financial results calculated in the Costs and Benefits sections can be used to determine the ROI, NPV, and payback period for the organization’s transition from its previous on-premise system to Google Apps. These are shown in Table 25 below.
Table 25 Cash Flow – Non-Risk-Adjusted
Cash flow – original estimates
Initial Year 1 Year 2 Year 3 Total Present value
Costs $375,125 $1,134,000 $1,134,000 $1,134,000 $3,777,125 $3,195,215
Benefits $4,850,094 $6,672,773 $7,356,292 $18,879,158 $15,450,755
Flexibility
$228,000
Net cash flow ($375,125) $3,944,094 $5,538,773 $6,222,292 $15,330,033 $12,483,540
ROI 391%
Payback period 6 months
Source: Forrester Research, Inc.
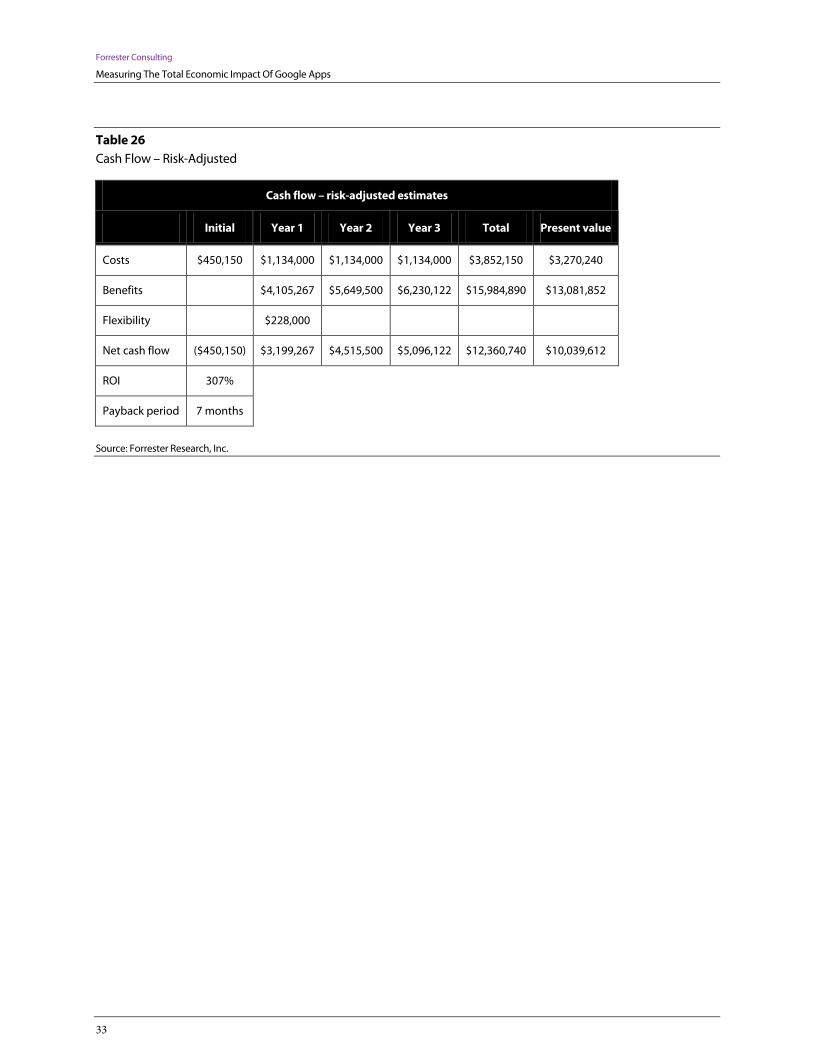
Table 26 below shows the risk-adjusted ROI, NPV, and payback period values. These values are determined by applying the risk-adjustment values from Table 22 in the Risk section to the cost and benefits numbers in Tables 4 and 21.
Forrester Consulting
Measuring The Total Economic Impact Of Google Apps
33
Table 26 Cash Flow – Risk-Adjusted
Cash flow – risk-adjusted estimates
Initial Year 1 Year 2 Year 3 Total Present value
Costs $450,150 $1,134,000 $1,134,000 $1,134,000 $3,852,150 $3,270,240
Benefits $4,105,267 $5,649,500 $6,230,122 $15,984,890 $13,081,852
Flexibility
$228,000
Net cash flow ($450,150) $3,199,267 $4,515,500 $5,096,122 $12,360,740 $10,039,612
ROI 307%
Payback period 7 months
Source: Forrester Research, Inc.
Forrester Consulting
Measuring The Total Economic Impact Of Google Apps
34
Study Conclusions
The data collected in this study from both in-depth customer interviews and broader customer surveys demonstrates that migrating an organization’s messaging and collaboration environment from legacy on-premise systems to Google Apps has the potential to provide a solid return on the investment. The risk-adjusted ROI of 307%, along with a rapid payback period (breakeven point) of less than seven months for the representative organization raises confidence that the investment is likely to succeed since the risks and uncertainty that may threaten the project have been considered and quantified. In interviews with Google Apps customers, Forrester found that a wide variety of organizations can realize tangible benefits in the form of:
IT-impact benefits. These included the cost savings resulting from moving an organization’s on-premise messaging and collaboration environment to Google’s cloud-based architecture.
• Cost savings included reduced spend on licenses and infrastructure.
• Cost savings included reduced IT administrator time spent on system maintenance, upkeep, patching, and upgrades.
• Organizations noted specific annual cost savings of between 38% and 56% versus their previous environment.
End-user-impact benefits. These included specific end user benefits around the migration of an organization’s messaging and collaboration environment to Google Apps.
• messaging-specific benefits. These included productivity gains around email search, spam filtering, archiving, organization of email, as well as improved response time within the messaging environment.
• collaboration-specific benefits. These included improved efficiency in sharing and editing documents across teams and within teams, ability to incorporate feedback more quickly, more efficient face-to-face and virtual meetings, as well pushing more timely and relevant information to distributed teams.
Enabled-flexibility benefits. These included the ability to achieve secondary benefits from the initial investment in Google Apps.
• Collaborating with external partners. The ability to improve the efficiency of interacting with external partners and suppliers through Google Docs and Google Sites.
• Leveraging the Google Marketplace. Taking advantage of new process-specific applications from Google Marketplace, further reducing process integration costs.
Based on these findings, companies looking to implement Google Apps as part of their messaging and collaboration strategy can anticipate improvements in operational efficiency, end user and IT productivity savings, and additional flexibility benefits. Using the TEI framework, many companies may find the potential for a compelling business case to make such an investment.
Forrester Consulting
Measuring The Total Economic Impact Of Google Apps
35
Google Apps Overview
Google Apps is a Web-based messaging and collaboration platform available to businesses for a flat license fee of $50 per employee, per year. Google’s applications run in any modern browser without any additional software to buy, install, maintain, or upgrade over time. Google also manages the back-end infrastructure in its highly scalable, reliable, and secure data center infrastructure, so there are no servers for customers to purchase, configure, patch, or upgrade over time.
Google Apps includes the following:
• Gmail includes 25 GB of storage per employee, Google-powered email search, industry-leading spam protection, and integrated IM, voice, and video chat. Workers can access their Gmail from any computer and on mobile devices including BlackBerry, iPhone, Windows Mobile, and tablets. Employees who prefer the Microsoft Outlook interface can continue to use Outlook as their email client without the company needing to run Microsoft Exchange.
• Google Calendar allows employees to manage their schedules, create project calendars, and easily schedule time with colleagues. Multiple calendars can be overlaid to quickly display a composite view of multiple people’s schedules. Workers can access Google Calendar on any computer and on mobile devices including BlackBerry, iPhone, Windows Mobile, and tablets. Employees who prefer the Microsoft Outlook interface can continue to use Outlook as their calendar client without the company needing to run Microsoft Exchange.
• Google Docs brings multi-person real-time collaboration to documents, spreadsheets, presentations, and drawings. Editors can simultaneously access the same Web-based file from any computer and contribute while others are also making changes, sparing colleagues the inconvenience of collaborating over attachments. Google Docs can import traditional office files and export to those formats as well.
• Google Sites allows teams to create and share collaborative team sites without burdening IT for support. Employees can access sites from any computer, and sites can display rich content such as embedded documents, spreadsheets, presentations, calendars, and videos.
• Google Video is a private, secure platform for sharing internal videos like trainings, corporate communications, and more. Videos can be viewed or uploaded from any computer.
• Google Groups allows administrators and end users to create mailing lists and browse or search discussion archives quickly from any computer. Documents, spreadsheets, presentations, sites, and other content can also be shared with groups so content owners can easily manage information permissions.
• More Google applications including Google Voice, Google Reader, Blogger, Picasa, Google Reader, and AdWords are available from Google Apps accounts at no additional charge, and IT administrators can provide the right set of tools to each group within their organization.
Migration And Integration Capabilities At no additional cost, Google offers scalable tools to easily migrate email, calendar, and contacts data from legacy Microsoft Exchange, Lotus Notes, and many IMAP email systems to Google Apps, so workers can seamlessly switch
Forrester Consulting
Measuring The Total Economic Impact Of Google Apps
36
over to Google Apps with minimal disruption. Furthermore, Google Apps is designed to integrate seamlessly with existing on-premise technology including:
• Single Sign-On (SSO) integration
• LDAP directory synchronization
• Integration with local data repositories with the Secure Data Connector
• APIs that allow flexible programmatic access to Google Apps from many other systems
Data Security Google Apps has successfully completed an SAS 70 Type II audit to ensure that its security procedures are operating effectively, and Google Apps is the first suite of cloud-based messaging and collaboration applications to receive the stringent Federal Information Security Management Act (FISMA) certification and accreditation from the US General Services Administration.
Reliability, Uptime Guarantee, And Support Google’s Service Level Agreement (SLA) guarantees that Google Apps will be available at least 99.9% of the time, and the actual performance of the system has been significantly higher than this SLA threshold. Google provides enterprise-grade support to customers including 24/7 telephone support for critical administrative issues.
Message Archiving For Regulatory Compliance In addition to Google Apps, companies can add Google Message Discovery for $13 per employee per year for one-year archiving. Google Message Discovery, powered by Postini, is a Web-based service that provides customers with complete email security, a hosted email archive, plus powerful message search and recovery tools.
Availability And Other Versions Of Google Apps
Google Apps is available in over 150 countries and in over 40 languages. In addition to Google Apps for businesses, Google offers free versions of Google Apps for small organizations, non-profits, and to schools and universities of all sizes.
More Information
For more information about Google Apps or to speak with a Google representative, visit www.google.com/apps.
Forrester Consulting
Measuring The Total Economic Impact Of Google Apps
37
Appendix A: Composite Organization Description
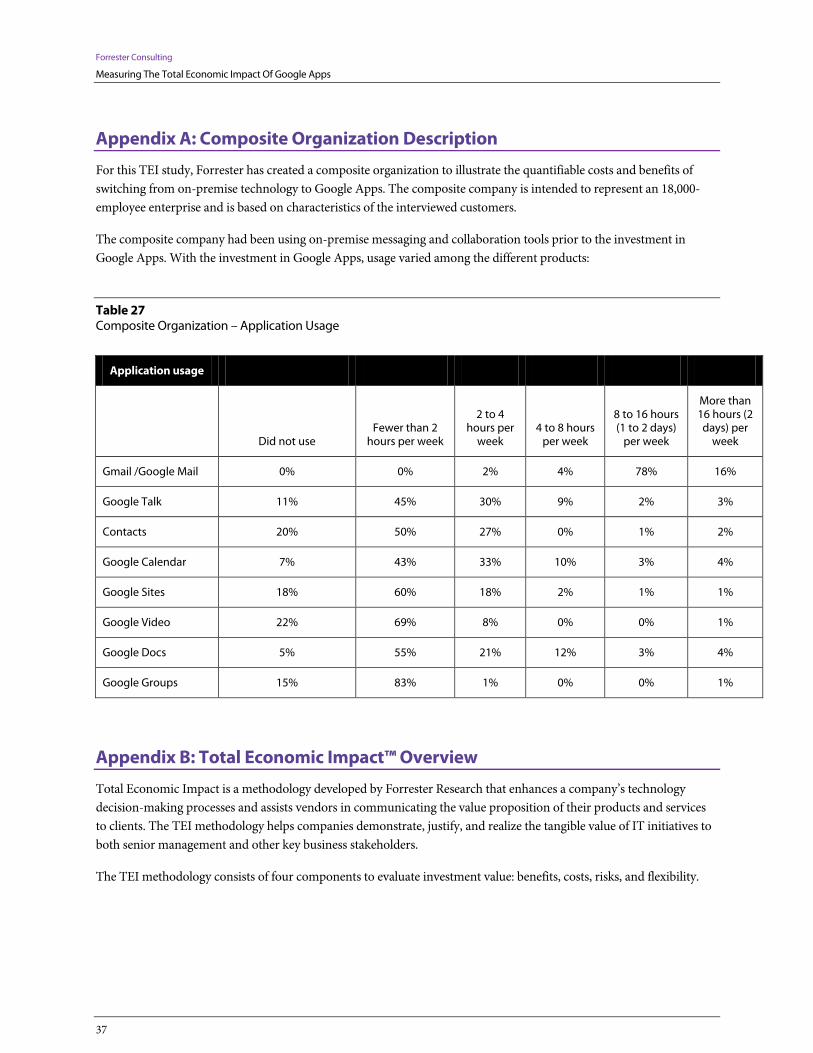
For this TEI study, Forrester has created a composite organization to illustrate the quantifiable costs and benefits of switching from on-premise technology to Google Apps. The composite company is intended to represent an 18,000-employee enterprise and is based on characteristics of the interviewed customers.
The composite company had been using on-premise messaging and collaboration tools prior to the investment in Google Apps. With the investment in Google Apps, usage varied among the different products:
Table 27 Composite Organization – Application Usage
Application usage
Did not use Fewer than 2
hours per week
2 to 4 hours per
week 4 to 8 hours
per week
8 to 16 hours (1 to 2 days)
per week
More than 16 hours (2 days) per
week
Gmail /Google Mail 0% 0% 2% 4% 78% 16%
Google Talk 11% 45% 30% 9% 2% 3%
Contacts 20% 50% 27% 0% 1% 2%
Google Calendar 7% 43% 33% 10% 3% 4%
Google Sites 18% 60% 18% 2% 1% 1%
Google Video 22% 69% 8% 0% 0% 1%
Google Docs 5% 55% 21% 12% 3% 4%
Google Groups 15% 83% 1% 0% 0% 1%
Appendix B: Total Economic Impact™ Overview
Total Economic Impact is a methodology developed by Forrester Research that enhances a company’s technology decision-making processes and assists vendors in communicating the value proposition of their products and services to clients. The TEI methodology helps companies demonstrate, justify, and realize the tangible value of IT initiatives to both senior management and other key business stakeholders.
The TEI methodology consists of four components to evaluate investment value: benefits, costs, risks, and flexibility.
Forrester Consulting
Measuring The Total Economic Impact Of Google Apps
38
Benefits Benefits represent the value delivered to the user organization — IT and/or business units — by the proposed product or project. Often product or project justification exercises focus just on IT cost and cost reduction, leaving little room to analyze the effect of the technology on the entire organization. The TEI methodology and the resulting financial model place equal weight on the measure of benefits and the measure of costs, allowing for a full examination of the effect of the technology on the entire organization. Calculation of benefit estimates involves a clear dialogue with the user organization to understand the specific value that is created. In addition, Forrester also requires that there be a clear line of accountability established between the measurement and justification of benefit estimates after the project has been completed. This ensures that benefit estimates tie back directly to the bottom line.
Costs Costs represent the investment necessary to capture the value, or benefits, of the proposed project. IT or the business units may incur costs in the forms of fully burdened labor, subcontractors, or materials. Costs consider all the investments and expenses necessary to deliver the proposed value. In addition, the cost category within TEI captures any incremental costs over the existing environment for ongoing costs associated with the solution. All costs must be tied to the benefits that are created.
Risk Risk measures the uncertainty of benefit and cost estimates contained within the investment. Uncertainty is measured in two ways: 1) the likelihood that the cost and benefit estimates will meet the original projections, and 2) the likelihood that the estimates will be measured and tracked over time. TEI applies a probability density function known as “triangular distribution” to the values entered. At a minimum, three values are calculated to estimate the underlying range around each cost and benefit.
Flexibility Within the TEI methodology, direct benefits represent one part of the investment value. While direct benefits can typically be the primary way to justify a project, Forrester believes that organizations should be able to measure the strategic value of an investment. Flexibility represents the value that can be obtained for some future additional investment building on top of the initial investment already made. For instance, an investment in an enterprisewide upgrade of an office productivity suite can potentially increase standardization (to increase efficiency) and reduce licensing costs. However, an embedded collaboration feature may translate to greater worker productivity if activated. The collaboration feature can only be used with additional investment in training at some future point in time. However, having the ability to capture that benefit has a present value that can be estimated. The flexibility component of TEI captures that value.
Appendix C: Glossary
Discount rate: The interest rate used in cash flow analysis to take into account the time value of money. Although the Federal Reserve Bank sets a discount rate, companies often set a discount rate based on their business and investment environment. Forrester assumes a yearly discount rate of 10% for this analysis. Organizations typically use discount
Forrester Consulting
Measuring The Total Economic Impact Of Google Apps
39
rates between 8% and 16% based on their current environment. Readers are urged to consult their respective organization to determine the most appropriate discount rate to use in their own environment.
Net present value (NPV): The present or current value of (discounted) future net cash flows given an interest rate (the discount rate). A positive project NPV normally indicates that the investment should be made, unless other projects have higher NPVs.
Present value (PV): The present or current value of (discounted) cost and benefit estimates given at an interest rate (the discount rate). The PV of costs and benefits feed into the total net present value of cash flows.
Payback period: The breakeven point for an investment. The point in time at which net benefits (benefits minus costs) equal initial investment or cost.
Return on investment (ROI): A measure of a project’s expected return in percentage terms. ROI is calculated by dividing net benefits (benefits minus costs) by costs.
A Note On Cash Flow Tables The following is a note on the cash flow tables used in this study (see the example table below). The initial investment column contains costs incurred at “time 0” or at the beginning of Year 1. Those costs are not discounted. All other cash flows in Years 1 through 3 are discounted using the discount rate (shown in Framework Assumptions section) at the end of the year. Present value (PV) calculations are calculated for each total cost and benefit estimate. Net present value (NPV) calculations are not calculated until the summary tables and are the sum of the initial investment and the discounted cash flows in each year.
[Table Example]
Ref. Category Calculation Initial cost Year 1 Year 2 Year 3 Total
Source: Forrester Research, Inc.
Appendix D: Endnotes
1 Forrester risk-adjusts the summary financial metrics to take into account the potential uncertainty of the cost and benefit estimates. For more information on Risk, please see page 30.


