Mantle hydration and Cl-rich fluids in the subduction forearc ...
Upload
nguyenhuongCategory
view
216download
0
A FLUVIAL RECORD OF LONG-TERM STEADY-STATE UPLIFT ANDEROSION ACROSS THE CASCADIA FOREARC HIGH,
WESTERN WASHINGTON STATE
FRANK J. PAZZAGLIA* and MARK T. BRANDON**
ABSTRACT. Six late Quaternary river terraces, preserved along the ClearwaterRiver in northwestern Washington State, provide a ;;140 ka record of long-termincision and uplift across the western side of the Cascadia forearc high. Terrace agesare constrained by weathering rind and radiocarbon dating and by correlation to datedcoastal glacio-fluvial deposits and the global eustatic curve. The terraces overlie flatbedrock surfaces, called straths, which represent uplifted segments of the riverchannel. Bedrock incision is measured by the height of a strath relative to the adjacentmodern river channel. The straths along the Clearwater show an upstream increase inbedrock incision, ranging from ;;0 at the coast to a maximum of 110 m in theheadwaters. The incision at any point along the profile increases systematically withstrath age. The calculated incision rates range from <0.1 m/ky at the coast, to ;;0.9m/ky in the central massif of the Olympic Mountains. These rates are in closeagreement with published long-term erosion rates estimated from fission-track coolingages. The coincidence between bedrock incision rates and erosion rates suggests thatover the long term (>;;10 ky) the Clearwater River valley has maintained a steady-stateprofile defined by a long-term balance in the rates of incision and rock uplift.Upstream divergence of terraces is best explained by an increase in the rate of rockuplift from the coast toward the central part of the range. These results are consistentwith other evidence indicating a long-term steady-state balance between the accretion-ary influx and the erosional outflux for this part of the Cascadia subduction wedgesince ;;14 Ma.
These results help show how terrace deposits form in tectonically active land-scapes. The dominantly fluvial Clearwater drainage was forming straths while alpineglaciers were advancing in adjacent drainages. In turn, the straths were buried duringthe transition to interglacial times because of increased sediment supply due to localdeglaciation and because of eustatic highstands that forced aggradation in the lowerreach of the drainage and across the continental shelf as well. The fluvial system showsstrong forcing by the glacial climate cycle. Even so, the river appears to have returnedto the same valley profile during each cycle of strath cutting. Thus, bedrock incision isclearly unsteady at time scales shorter than the glacial climate cycle (;;100 Ky) butappears to be relatively steady when averaged over longer time scales.
A simple kinematic model is used to examine how uplift of the Cl . Our analysisindicates that the accretionary flux into the wedge occurs mainly by frontal accretionand not by underplating. If accretion occurred entirely at the front of the wedge, thepresent west coast should be moving to the northeast at ;;3 m/ky, relative to a fixedPuget Sound. This prediction is in good agreement with offset of a ;;122 ka sea cliffpreserved at the southwest side of the Clearwater valley profile. In this case, thelong-term margin-perpendicular shortening would account for 20 to 35 percent of thegeodetically-measured northeast-southwest shortening across the Olympic Mountains.
introductionMountains come into being where rock uplift outpaces erosion. Growth of
topography generally coincides with increases in erosion rate, as long as the topogra-phy continues to receive significant precipitation. Thus, with time, we might expectthat erosion will become fast enough to balance rock uplift, resulting in a steady-state
* Department of Earth and Environmental Sciences, Lehigh University, 31 Williams, Bethlehem,Pennsylvania 18015
** Department of Geology and Geophysics, Yale University, P.O. Box 208109, New Haven, Connecticut06520-8109
[American Journal of Science, Vol. 301, April/May, 2001, P. 385–431]
385

balance between the accretionary flux into the orogen (that is,“tectonic uplift”) andthe erosional flux out of the orogen (Brandon, Roden-Tice, and Garver, 1998; Hovius,2000). The amount of time needed to reach steady state depends on the accretionaryflux, the erosional processes, and the final steady-state size of the orogen. Someorogens appear to reach a flux steady state within several million years (for example,Southern Alps of New Zealand, Taiwan Alps), whereas others will probably never reachthis steady state because of the development of an orographic rain shadow (forexample, Himalayan-Tibet, Andes) or because the orogen remains entirely belowsealevel (for example, Barbados subduction wedge).
In this paper, we use fluvial geomorphology to test the hypothesis that theOlympic Mountains sector (fig. 1) of the Cascadia convergent margin is presently in aflux steady state (Brandon, Roden-Tice, and Garver, 1998). The seismic hazardpotential of this margin has received considerable attention in recent years. Ofparticular interest is detailed evidence of large subduction-related earthquakes (Sav-age, Lisowski, and Prescott, 1981, 1991; Atwater, 1987, 1996; Dragert, 1987; Rogers,1988; Hyndman and Wang, 1993; Darienzo and Peterson, 1990; Bucknam, Hemphill-
Fig. 1(A) Simplified geologic map of the Cascadia convergent margin, modified from Brandon,Roden-Tice, Garver (1998). HRF 5 Hurricane Ridge Fault, K 5 Kalaloch, S 5 Seattle, O 5 Mt. Olympus,G 5 Mt. Garibaldi, B 5 Mt. Baker, GP 5 Glacier Peak, R 5 Mt. Rainier. Beneath the Olympics, theconvergence velocity of the Juan de Fuca plate relative to North America is 36 mm/yr at 54°, which is nearlyorthogonal to the modern subduction zone (option 2 for Juan de Fuca/Pacific in DeMets and others, 1990,and “NA-PA Combined” in DeMets and Dixon, 1999).
386 F. J. Pazzaglia and M. T. Brandon—A fluvial record of long-term steady-state uplift
Haley, and Leopold, 1992; Dragert and others, 1994; Mitchell and others, 1994).Fundamental to these studies is the distinction between short-term (, ;1 ky) cyclicelastic deformation adjacent to the seismogenic subduction thrust and long-term(. ;10 ky) permanent deformation associated with growth and deformation of the
Fig. 1 (continued) (B) Major drainages of the Olympic Peninsula. The gray dashed line marks thesouthern boundary of the last glacial maxima (LGM) of the Cordilleran ice sheet. X 5 benchmarks for GPSdata shown in figure 21. (C) Topographic section across the Olympic Peninsula, parallel to the modernconvergence direction (A-A9 in B).
387and erosion across the Cascadia forearc high, western Washington State
overlying Cascadia subduction wedge (fig. 2). Holocene deposits preserved in locallysubsiding estuaries along the west coast provide good evidence of the cyclic deforma-tion related to large prehistoric earthquakes (Atwater, 1987, 1996). It remains difficultto separate elastic deformation, which is created and then recovered during eachearthquake cycle, from the permanent deformation associated with fault slip andwithin-wedge ductile flow.
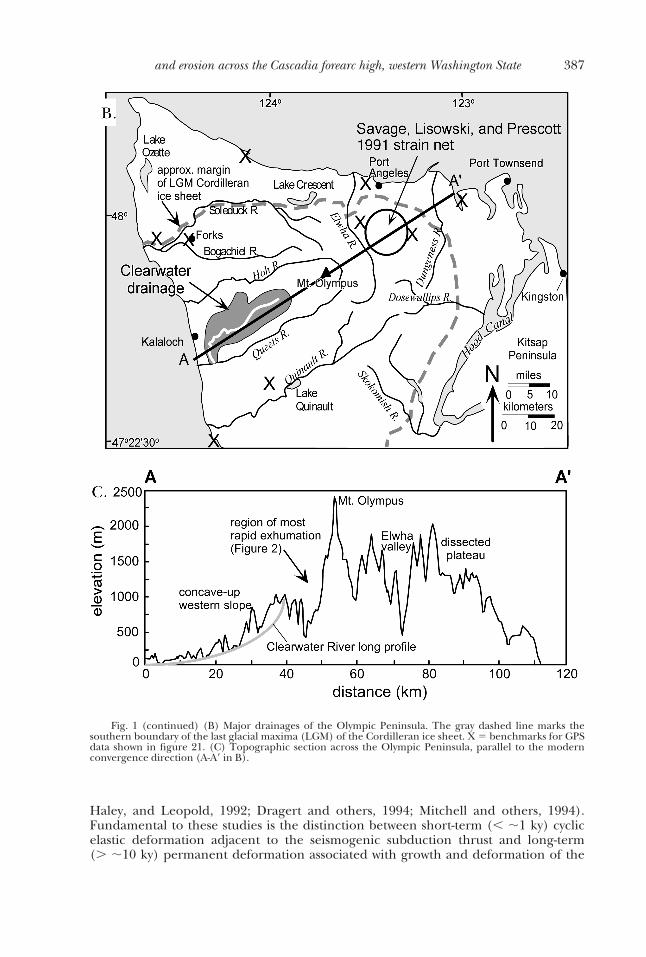
Fig. 2. Contour map showing short-term uplift rates (solid contour lines) as determined by geodeticmeasurements (Savage, Lisowiski, and Prescott, 1991; Dragert and others, 1994) and long-term erosion rates(shaded contour intervals) as determined by fission-track thermochronology (Brandon, Roden-Tice, andGarver, 1998, and M. Brandon and M. Roden-Tice, unpublished apatite fission-track ages). Rates are inmm/yr. Areas labeled Tq (diagonal-ruled pattern) along the west coast mark exposures of lower Plioceneshallow marine sediments of the Quinault Formation. The preservation of the Quinault and other adjacentnear shore units indicates slow long-term uplift and erosion along the west coast.
388 F. J. Pazzaglia and M. T. Brandon—A fluvial record of long-term steady-state uplift
Pre-Holocene stratigraphy provides the only record of sufficient duration toaverage out the elastic deformation related to the earthquake cycle. This realizationhas driven an increased study of the deformation of Quaternary deposits and land-forms, but such features are generally restricted to coastal and other lowland areas andthe continental shelf as well (Rau, 1973, 1975, 1979; Adams, 1984; West and McCrumb,1988; Kelsey, 1990; Bockheim, Kelsey, and Marshall, 1992; Kelsey and Bockheim, 1994;Thackray and Pazzaglia, 1994; McCrory, 1996, 1997; McNeill and others, 1997, 2000;Thackray, 1998). In contrast, less is known about the long-term uplift and deformationof the coastal mountains of western Oregon, western Washington, and VancouverIsland because the topography of this highland preserves little stratigraphic evidenceof its uplift history. The Oregon-Washington Coast Range and the Insular Mountainsof Vancouver Island mark the forearc high of the modern Cascadia wedge. Thismountain range parallels the modern subduction zone for ;900 km from southernOregon to northern Vancouver Island. The development and maintenance of thistopographic high provides clear evidence that it is an actively deforming part of theCascadia plate boundary. Personius (1995), Yeats (1996), and McNeill and others(2000) document the active emergence of the Oregon Coast Range over the last 10 to15 my. The Washington Coast Range shows a similar emergence history, which is bestdocumented in the Olympic Mountains (fig. 1B, C) (Brandon, Roden-Tice, andGarver, 1998).
The Olympic Mountains occupy a 5800 km2 area within the Olympic Peninsula.The central part of the range has an average elevation of ;1200 m and reaches amaximum of 2417 m at Mount Olympus (fig. 1C). The Olympics first emerged abovesealevel at ;18 Ma (Brandon and Vance, 1992) and then seem to quickly reach a fluxsteady state (Brandon, Roden-Tice, and Garver, 1998). Fission-track cooling agesindicate that the fastest erosion rates (;0.8 m/ky) are localized in the highest part ofthe range (fig. 2). Rocks exposed there were deposited and accreted in the Cascadiatrench during the late Oligocene and early Miocene and then exhumed from a depthof ;12 to 14 km over the last 16 my. Present-day rugged relief and high-standingtopography are consistent with ongoing tectonic uplift.
Geodetic and tide gauge data (Reilinger and Adams, 1982; Holdahl, Faucher, andDragert, 1989; Savage, Lisowski, and Prescott, 1991; Mitchell and others, 1994)indicate that short-term uplift is very fast in the Olympic Peninsula, ranging from 1.2 to3.2 m/ky, with the highest rates along the west side of the peninsula (fig. 2). Theselarge rates probably include a significant component of earthquake-cycle elasticdeformation, given that the Cascadia subduction thrust is presently locked. Thisconclusion is supported by geologic evidence that indicates little to no long-term upliftalong the east and west coasts of the peninsula over the last 10 my. For instance,exposures of upper Miocene to lower Pliocene shallow marine deposits locally crop outnear modern sealevel (for example, Montesano and Quinault formations; see Tq in fig.2) (Rau, 1970; Tabor and Cady, 1978a; Armentrout, 1981; Bigelow, 1987; Palmer andLingley, 1989; Campbell and Nesbitt, 2000). These units currently sit within ;200 m oftheir original depositional elevation, which implies uplift rates , ;0.05 m/ky. Slowlong-term uplift is also consistent with the preservation of extensive middle and earlyPleistocene deposits and constructional landforms along much of the west coast(Thackray and Pazzaglia, 1994; Thackray, 1998, 2001).
Our objective here is to use fluvial terraces to examine the pattern and rates oflong-term river incision across the transition from the relatively stable Pacific coast tothe actively uplifting interior of the Olympic Mountains. The basic premise is that inwell drained landscapes and over sufficiently long spatial and temporal scales (“gradedscales” of Schumm and Lichty, 1965), a river will evolve toward a steady-state profilewhere the rates of river incision and rock uplift are closely balanced along the length of
389and erosion across the Cascadia forearc high, western Washington State

the river longitudinal profile (long profile for short) (Bull, 1991; Burbank and others,1996; Maddy, 1997; Pazzaglia, Gardner, and Merritts, 1998; Hovius, 2000). While atsteady state, the river maintains its profile and the shape and dimensions of its valley, inthe presence of active uplift. This steady-state condition is analogous to what Mackin(1948) called a “graded stream” (see Knox, 1975, and Leopold and Bull, 1979, forfurther details).
A steady-state profile is an attractive concept because the profile itself couldpotentially provide a reference for measuring rock uplift, perhaps comparable to usingsealevel to measure uplift in coastal areas. However, the stability of this reference frameis not obvious given that river channels are usually constantly adjusting to variations indischarge, sediment load, and uplift. Short-term (, 0.1-1 ky) variations in dischargeand sediment yield are usually accommodated at a local scale by changes in channelsinuosity and the position of alluvial bars. Large variations tend to be accommodatedover longer time intervals (. 0.1-1 ky) and generally result in drainage-scale changes inthe shape of the river profile, including the shape of the associated valley floor.
In tectonically active landscapes, the long-term variations in climate and tectonicforcing are associated with gross changes in the incision/aggradation behavior of theriver (Schumm, 1969; Bull, 1991). Typically, these changes occur in a characteristicsequence involving wide incision, aggradation, and narrow incision. (1) Wide incisionoccurs when the river channel incises downward and laterally, commonly into bedrock,to form a broad flat valley bottom. The resulting flat erosion surface is called a strath.(2) Aggradation is triggered by an increase in sediment load or a decrease in effectivedischarge. The valley floor and associated strath surfaces are buried by fluvial sand andgravel, resulting in a fill terrace deposit. Aggradation causes the channel to steepenuntil it reaches a gradient sufficient to transport the entire sediment load through theriver system. (3) Narrow incision occurs when the sediment load decreases or dischargeincreases, causing the river channel to cut downward through the fill terrace depositand commonly through the underlying bedrock strath as well. Typically, this phase isassociated with little to no lateral incision, resulting in a narrow gorge around theactive channel. The terrace deposit is abandoned at this stage, leaving behind a recordof the incision/aggradation cycle. Continued rock uplift and channel incision causethe terrace deposit to rise above the active channel where it has a greater preservationpotential in the hill slopes adjacent to the river.
This interpretation implies a rough connection between bedrock incision androck uplift. Bedrock incision is determined by measuring the local height of a strathsurface above the adjacent modern bedrock channel (assuming that the modernchannel is on bedrock). The advantage of this approach is that we are comparing theriver under similar hydrologic conditions: the strath was formed when the river wasincising into bedrock, and the modern river channel is also incising into bedrock.Furthermore, the wide incision associated with strath formation represents a timewhen the river was able to maintain a fairly stable long profile, which suggests relativelysteady discharge and sediment load. Thus, we propose that the long profile of the riverduring periods of strath formation was probably similar to the long profile of themodern bedrock channel. This idea is central to many studies that use straths fortectonic interpretation. In our case, we will test this idea by comparing incision ratesand erosion rates on different time scales.
Our paper focuses on the Clearwater drainage (fig. 1B), which remained unglaci-ated during the late Pleistocene and Holocene and thus was able to preserve a flight offluvial terraces, with the oldest extending back into ;140 ka. An important advantageof the Clearwater is that its main channel has an orientation roughly parallel to theJuan de Fuca-North America convergence direction. We assess how fluvial terraces areformed in this setting and then use features of the terraces to estimate incision rates
390 F. J. Pazzaglia and M. T. Brandon—A fluvial record of long-term steady-state uplift

along the Clearwater long profile. A simple kinematic model is used to examine therelationship of underplating and frontal accretion to rock uplift and horizontalshortening in the Cascadia forearc high. The long fluvial history preserved in theClearwater ensures that the unsteady deformation associated with the earthquake cycleis averaged out, leaving us with a record of long-term rock uplift.
tectonic settingThe Cascadia subduction zone underlies a doubly vergent wedge (sensu Koons,
1990, and Willett, Beaumont, and Fullsack, 1993). The change in vergence occurs atthe crest of the Coast Range, which represents the forearc high. The doubly vergentsystem includes a prowedge (or proside) that overrides oceanic lithosphere andaccretes turbidites from the deep-sea Cascadia basin and a retrowedge (or retroside)that underlies the east-facing flank of the Coast Range (Willett, 1999; Beaumont, Ellis,and Pfiffner, 1999) (fig. 3). This usage emphasizes the asymmetry of the underlyingsubduction zone, defined by subduction of the pro-plate (Juan de Fuca) beneath theretro-plate (North America).
Much of the Cascadia forearc high is underlain by the Coast Range terrane, a slabof lower Eocene oceanic crust (Crescent and Siltez formations), which occurs as alandward-dipping unit within the Cascadia wedge (fig. 1A) (Clowes and others, 1987;Parson and others, 1998). Accreted sediments that make up the proside of the wedgereach a thickness of ;15 to 25 km at the present Pacific coast (figs. 1 and 3) and locallyextend landward beneath the Coast Range terrane. The Coast Range terrane is clearlyinvolved in subduction-related deformation, although the rate of deformation isrelatively slow when compared with the accretionary deformation occurring at the toeof the seaward wedge. Nonetheless, the Cascadia wedge, by definition, includes allrocks that are actively deforming above the Cascadia subduction zone. Thus, the CoastRange terrane cannot be considered a rigid “backstop” but instead represents a fullyinvolved component of the wedge.
Our usage here is at odds with more common usage (Byrne, Wang, and Davis,1993; von Huene and others, 1998, von Huene, 1998), where wedge deformation is
Fig. 3. Schematic section (A-A9 in fig. 1) showing the regional-scale structure of the Cascadia accretion-ary wedge (after Brandon, Roden-Tice, and Garver, 1998).
391and erosion across the Cascadia forearc high, western Washington State
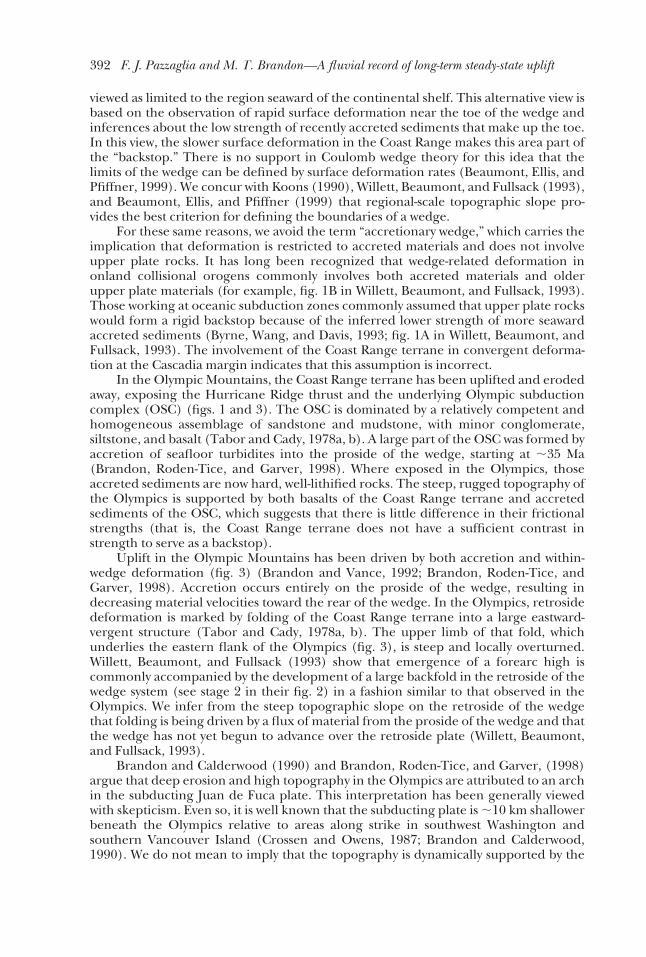
viewed as limited to the region seaward of the continental shelf. This alternative view isbased on the observation of rapid surface deformation near the toe of the wedge andinferences about the low strength of recently accreted sediments that make up the toe.In this view, the slower surface deformation in the Coast Range makes this area part ofthe “backstop.” There is no support in Coulomb wedge theory for this idea that thelimits of the wedge can be defined by surface deformation rates (Beaumont, Ellis, andPfiffner, 1999). We concur with Koons (1990), Willett, Beaumont, and Fullsack (1993),and Beaumont, Ellis, and Pfiffner (1999) that regional-scale topographic slope pro-vides the best criterion for defining the boundaries of a wedge.
For these same reasons, we avoid the term “accretionary wedge,” which carries theimplication that deformation is restricted to accreted materials and does not involveupper plate rocks. It has long been recognized that wedge-related deformation inonland collisional orogens commonly involves both accreted materials and olderupper plate materials (for example, fig. 1B in Willett, Beaumont, and Fullsack, 1993).Those working at oceanic subduction zones commonly assumed that upper plate rockswould form a rigid backstop because of the inferred lower strength of more seawardaccreted sediments (Byrne, Wang, and Davis, 1993; fig. 1A in Willett, Beaumont, andFullsack, 1993). The involvement of the Coast Range terrane in convergent deforma-tion at the Cascadia margin indicates that this assumption is incorrect.
In the Olympic Mountains, the Coast Range terrane has been uplifted and erodedaway, exposing the Hurricane Ridge thrust and the underlying Olympic subductioncomplex (OSC) (figs. 1 and 3). The OSC is dominated by a relatively competent andhomogeneous assemblage of sandstone and mudstone, with minor conglomerate,siltstone, and basalt (Tabor and Cady, 1978a, b). A large part of the OSC was formed byaccretion of seafloor turbidites into the proside of the wedge, starting at ;35 Ma(Brandon, Roden-Tice, and Garver, 1998). Where exposed in the Olympics, thoseaccreted sediments are now hard, well-lithified rocks. The steep, rugged topography ofthe Olympics is supported by both basalts of the Coast Range terrane and accretedsediments of the OSC, which suggests that there is little difference in their frictionalstrengths (that is, the Coast Range terrane does not have a sufficient contrast instrength to serve as a backstop).
Uplift in the Olympic Mountains has been driven by both accretion and within-wedge deformation (fig. 3) (Brandon and Vance, 1992; Brandon, Roden-Tice, andGarver, 1998). Accretion occurs entirely on the proside of the wedge, resulting indecreasing material velocities toward the rear of the wedge. In the Olympics, retrosidedeformation is marked by folding of the Coast Range terrane into a large eastward-vergent structure (Tabor and Cady, 1978a, b). The upper limb of that fold, whichunderlies the eastern flank of the Olympics (fig. 3), is steep and locally overturned.Willett, Beaumont, and Fullsack (1993) show that emergence of a forearc high iscommonly accompanied by the development of a large backfold in the retroside of thewedge system (see stage 2 in their fig. 2) in a fashion similar to that observed in theOlympics. We infer from the steep topographic slope on the retroside of the wedgethat folding is being driven by a flux of material from the proside of the wedge and thatthe wedge has not yet begun to advance over the retroside plate (Willett, Beaumont,and Fullsack, 1993).
Brandon and Calderwood (1990) and Brandon, Roden-Tice, and Garver, (1998)argue that deep erosion and high topography in the Olympics are attributed to an archin the subducting Juan de Fuca plate. This interpretation has been generally viewedwith skepticism. Even so, it is well known that the subducting plate is ;10 km shallowerbeneath the Olympics relative to areas along strike in southwest Washington andsouthern Vancouver Island (Crossen and Owens, 1987; Brandon and Calderwood,1990). We do not mean to imply that the topography is dynamically supported by the
392 F. J. Pazzaglia and M. T. Brandon—A fluvial record of long-term steady-state uplift
arch. Rather, the shallow slab beneath the Olympics means that there is less accommo-dation space1 there to hold the growing Cascadia wedge (Brandon, Roden-Tice, andGarver, 1998). This situation plus higher convergence rates and thicker trench fillalong the northern Cascadia trench has allowed the Olympics to become the first partof the Cascadia forearc high to rise above sealevel. The early development of subaerialtopography plus continued accretion and uplift accounts for the deep erosion ob-served in the Olympics. The corollary to this interpretation is that adjacent parts of theforearc high will evolve in the same way, although more slowly because of a largeraccommodation space for the growing wedge (that is, deeper slab) and sloweraccretionary fluxes.
regional geomorphology
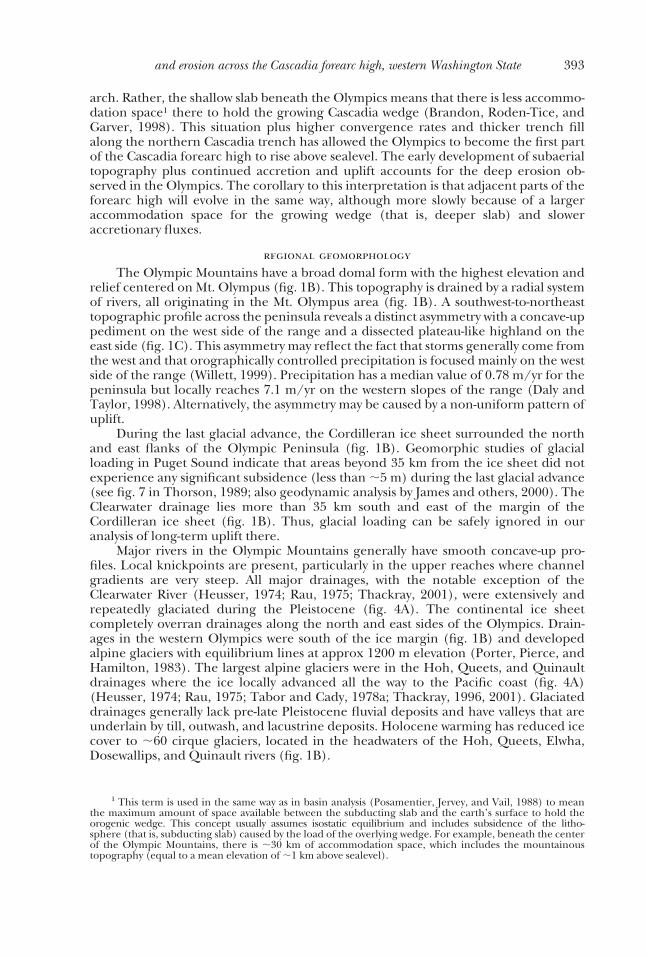
The Olympic Mountains have a broad domal form with the highest elevation andrelief centered on Mt. Olympus (fig. 1B). This topography is drained by a radial systemof rivers, all originating in the Mt. Olympus area (fig. 1B). A southwest-to-northeasttopographic profile across the peninsula reveals a distinct asymmetry with a concave-uppediment on the west side of the range and a dissected plateau-like highland on theeast side (fig. 1C). This asymmetry may reflect the fact that storms generally come fromthe west and that orographically controlled precipitation is focused mainly on the westside of the range (Willett, 1999). Precipitation has a median value of 0.78 m/yr for thepeninsula but locally reaches 7.1 m/yr on the western slopes of the range (Daly andTaylor, 1998). Alternatively, the asymmetry may be caused by a non-uniform pattern ofuplift.
During the last glacial advance, the Cordilleran ice sheet surrounded the northand east flanks of the Olympic Peninsula (fig. 1B). Geomorphic studies of glacialloading in Puget Sound indicate that areas beyond 35 km from the ice sheet did notexperience any significant subsidence (less than ;5 m) during the last glacial advance(see fig. 7 in Thorson, 1989; also geodynamic analysis by James and others, 2000). TheClearwater drainage lies more than 35 km south and east of the margin of theCordilleran ice sheet (fig. 1B). Thus, glacial loading can be safely ignored in ouranalysis of long-term uplift there.
Major rivers in the Olympic Mountains generally have smooth concave-up pro-files. Local knickpoints are present, particularly in the upper reaches where channelgradients are very steep. All major drainages, with the notable exception of theClearwater River (Heusser, 1974; Rau, 1975; Thackray, 2001), were extensively andrepeatedly glaciated during the Pleistocene (fig. 4A). The continental ice sheetcompletely overran drainages along the north and east sides of the Olympics. Drain-ages in the western Olympics were south of the ice margin (fig. 1B) and developedalpine glaciers with equilibrium lines at approx 1200 m elevation (Porter, Pierce, andHamilton, 1983). The largest alpine glaciers were in the Hoh, Queets, and Quinaultdrainages where the ice locally advanced all the way to the Pacific coast (fig. 4A)(Heusser, 1974; Rau, 1975; Tabor and Cady, 1978a; Thackray, 1996, 2001). Glaciateddrainages generally lack pre-late Pleistocene fluvial deposits and have valleys that areunderlain by till, outwash, and lacustrine deposits. Holocene warming has reduced icecover to ;60 cirque glaciers, located in the headwaters of the Hoh, Queets, Elwha,Dosewallips, and Quinault rivers (fig. 1B).
1 This term is used in the same way as in basin analysis (Posamentier, Jervey, and Vail, 1988) to meanthe maximum amount of space available between the subducting slab and the earth’s surface to hold theorogenic wedge. This concept usually assumes isostatic equilibrium and includes subsidence of the litho-sphere (that is, subducting slab) caused by the load of the overlying wedge. For example, beneath the centerof the Olympic Mountains, there is ;30 km of accommodation space, which includes the mountainoustopography (equal to a mean elevation of ;1 km above sealevel).
393and erosion across the Cascadia forearc high, western Washington State
Fig.
4
(A)
Dig
ital
shad
ed-r
elie
fim
age
(30
m-r
esol
utio
nD
EM
)sh
owin
gth
ere
lati
onof
the
Cle
arw
ater
drai
nag
eto
adja
cen
tdra
inag
esan
dgl
acia
ldep
osit
sin
the
wes
tern
Oly
mpi
cs(g
laci
alda
taar
efr
omT
hac
kray
,199
6,20
01;E
aste
rbro
ok,1
986)
.BT
6,B
T4,
and
WC
mar
kbe
ach
trai
l6,b
each
trai
l4,a
nd
Wh
ale
Cre
ek,
wh
ere
impo
rtan
tstr
atig
raph
icre
lati
onsh
ips
are
expo
sed
alon
gth
eco
ast.
Profi
les
B-B
9,C
-C9,
and
D-D
9m
ark
cros
s-va
lley
sect
ion
sof
the
Cle
arw
ater
valle
y,as
pres
ente
din
figu
re8.
394 F. J. Pazzaglia and M. T. Brandon—A fluvial record of long-term steady-state uplift

(B)
Map
ofth
eC
lear
wat
erdr
ain
age.
Th
eva
lley
profi
leis
show
nas
acr
ooke
dth
inlin
ew
ith
tics
mar
kin
gva
lley
kilo
met
ers
from
the
mou
thof
the
Que
etsR
iver
atth
eco
ast.
Th
est
raig
hts
ecti
on(A
-A9
infi
gs.1
and
3)is
loca
ted
alon
gth
eso
uth
east
side
ofth
edr
ain
age.
Fin
alre
sult
swer
epr
ojec
ted
into
A-A
9,w
hic
hpa
ralle
lsth
elo
calc
onve
rgen
cedi
rect
ion
for
the
Cas
cadi
asu
bduc
tion
zon
e.
395and erosion across the Cascadia forearc high, western Washington State

Along the west coast of the Olympics, the river channels show little to no incisionat the coast, despite the occurrence of significant lowstands (;100 m) during many ofthe Pleistocene glacial epochs. On first impression, one might expect that a largelowstand would produce an incised channel at the river mouth and an upstream-migrating knickpoint. The subsequent highstand would drown the river mouth andgradually cause any lowstand morphology to be buried by aggrading sediments.However, the lower reaches of the west coast rivers are all presently on bedrock, andthey lack any significant knickpoints. We show below that the lack of incision of theClearwater River during lowstand is because gradients in the lower reach of the Queetsvalley and across the inner continental shelf are approximately constant. Thus, wesuggest that during lowstands, the Queets River was able to extend its mouth across theshelf without appreciable incision or aggradation. Furthermore, we infer that anysignificant aggradation in the drainage must have been associated with an increase insediment flux and cannot be attributed solely to changes in sealevel.
Thick constructional terraces are present along most of the west coast. Theypreserve a clear record of at least two major aggradational events, related to glaciallydriven increases in sediment flux (Thackray and Pazzaglia, 1994; Thackray, 1998,2001). The Clearwater drainage remained unglaciated during these events. However,we show below that the lower reach of the Clearwater and Queets valley was deluged byoutwash sediment spilling over a low divide (Snahapish River and Christmas Creek)from the Hoh drainage to the north. This enhanced sediment supply caused aggrada-tion of thick terrace sequences in the lower Clearwater River, a relationship that weexploit to constrain the ages of terrace deposits.
clearwater drainage
The Clearwater drainage covers an area of 390 km2 and lies between two muchlarger drainages, the Hoh and Queets (figs. 1B and 4). Elevation in the Clearwaterranges from ;12 m at its confluence with the Queets River to ;1130 m along itseastern divide. Most of the Clearwater is underlain by a rather homogeneous assem-blage of medium to coarse sandstone of the Hoh Formation and similar rocks of theWestern Olympic lithic assemblage (Tabor and Cady, 1978a). Minor siltstone, mud-stone, conglomerate, breccia, and basalt are also present. The relatively uniformbedrock minimizes rock type as a geomorphic variable. There is a precipitationgradient ranging from approx 254 cm/yr at the mouth of the drainage to 400 cm/yr inthe headwaters.
We require three schemes to represent distance along the main channel of theClearwater River. All start at the west coast and include the lower part of the QueetsRiver, which connects the Clearwater River to the ocean. Channel distance provides adirect measure of the actual channel length (fig. 5). Valley distance is measured along aprofile that runs down the central axis of the Clearwater and Queets valleys (figs. 4Band 5). We use this profile to compare projected channel and terrace data. Unlessstated otherwise, valley distance is used to describe locations along the river. Sectiondistance is measured in a straight profile oriented in the plate convergence direction(A-A9 of figs. 1B and 4B). The A-A9 section is used to interpret the tectonic significanceof our results.
The lower Clearwater River extends from its confluence with the Queets at km 6,to its confluence with the Solleks River at km 31. This reach has a mixed bedrock-alluvial channel, which meanders through a 1 to 2 km-wide, low-relief valley (fig. 4).Nowhere is the channel far from bedrock, even where it empties into the Queets River.To confirm this point, we checked drilling logs for the Clearwater-Snahapish Roadbridge, located near the confluence of the Clearwater and Queets rivers, and theHighway 101 bridge across the Queets, which lies about 1 km from the mouth of the
396 F. J. Pazzaglia and M. T. Brandon—A fluvial record of long-term steady-state uplift

river (Washington State Department of Transportation Geotechnical Report, 1988).The alluvial cover was everywhere , 5 m. No alluvial-filled inner channel was found.The valley gradient is 0.0033 (rise over run), and the channel sinuosity is 1.66 (channellength over valley length). The most sinuous segment of the Clearwater River lies inthis lower reach, between km 20 and 24 (figs. 4B and 5). The upper Clearwater River(above km 31) has a channel cut mainly in bedrock. Here, the valley gradient is steeper(0.0167), and the sinuosity is lower (1.15).
The drainage divide between the Clearwater and Hoh rivers has two low-standingsegments at the heads of the Snahapish River and Christmas Creek (fig. 4B). Thelarger segment, ;2 km long, lies at the head of the Snahapish valley, where it standsonly 50 m above the adjacent valley floors. As shown in figure 4A, the Snahapish divideis underlain by the Lyman Rapids and Whale Creek moraines, which formed duringmajor glacial advances in the Hoh drainage. These units (dated elsewhere, not in theSnahapish valley) are .47 ka (radiocarbon dead). Thackray (1998, 2001) tentativelyassigns these moraines to glacial epochs during marine oxygen isotope stages (IS) 4and 6 (fig. 6). We present evidence below that supports this assignment. A set ofyounger moraines, Twin Creeks and Hoh Oxbow (fig. 4A), formed at 29 to 14 ka (fig.6), during the last glacial maximum (Thackray, 1998, 2001). Their internal positionrelative to the older moraines (fig. 4A) indicates that this last glacial advance and itsoutwash did not reach and overtop the Snahapish divide.
The modern Snahapish River is underfit; it is too small to have cut its valley. Thevalley itself is choked by a thick fill of glacio-fluvial outwash that grades into heads ofoutwash. These deposits are clearly genetically related to glacial advances in the Hohdrainage during Lyman Rapids and Whale Creek times. The Snahapish valley and, to alesser degree, the Christmas Creek valley acted as conduits for outwash moving fromthe Hoh drainage into the lower part of the Clearwater drainage. We show below thatthis bypassing of sediment had a strong influence on fluvial aggradation in the lowerreaches of the Clearwater and Queets rivers.
Mapping corroborates the dominance of fluvial and hillslope deposits and thesubordinance of glacial deposits in the Clearwater drainage. The only direct evidence
Fig. 5. Plots of the valley and channel long profiles for the Clearwater River. See text for discussion ofconvexity in the valley profile between km 20 and 28.
397and erosion across the Cascadia forearc high, western Washington State
for ice in the drainage is in the form of radiocarbon-dead lacustrine deposits overlyinga lodgment till (Wegmann, 1999) near km 42. There are several waterfalls on tributarychannels upstream of this point, consistent with glacially-produced hanging valleys,but the overall morphology of the main valley shows no significant evidence of alpineglaciation.
Interfluves and hillslopes are mantled with poorly-stratified, poorly-sorted collu-vial deposits, ,1 to 6 m thick. These deposits are variably weathered, which is reflected
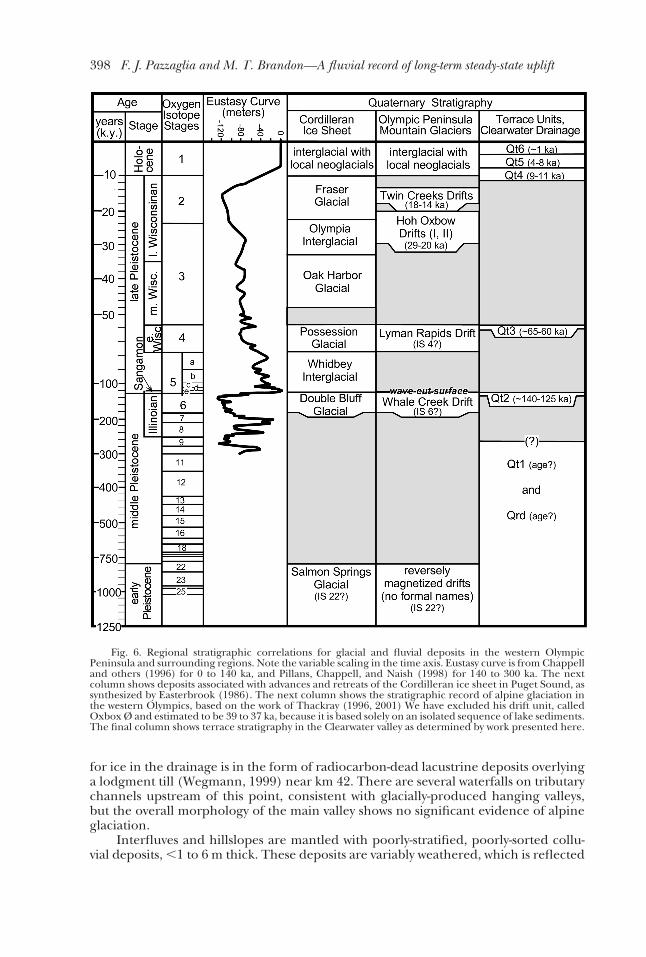
Fig. 6. Regional stratigraphic correlations for glacial and fluvial deposits in the western OlympicPeninsula and surrounding regions. Note the variable scaling in the time axis. Eustasy curve is from Chappelland others (1996) for 0 to 140 ka, and Pillans, Chappell, and Naish (1998) for 140 to 300 ka. The nextcolumn shows deposits associated with advances and retreats of the Cordilleran ice sheet in Puget Sound, assynthesized by Easterbrook (1986). The next column shows the stratigraphic record of alpine glaciation inthe western Olympics, based on the work of Thackray (1996, 2001) We have excluded his drift unit, calledOxbox Ø and estimated to be 39 to 37 ka, because it is based solely on an isolated sequence of lake sediments.The final column shows terrace stratigraphy in the Clearwater valley as determined by work presented here.
398 F. J. Pazzaglia and M. T. Brandon—A fluvial record of long-term steady-state uplift

in their color (recorded as hue, value, and chroma with a Munsell soil color chart) andclast-to-matrix ratio. Relatively unweathered colluvium tends to be clast-supported withbrownish (10YR hues) coloration, whereas more weathered colluvium is generallymatrix-supported, in that it contains more pedogenic clay, with yellow, red, and orange(5YR - 7.5YR) coloration. The degree of weathering in all Clearwater hillslope oralluvial deposits increases with relative stratigraphic age. This relationship is quantifiedbelow using clast weathering rinds. Buried colluvium is locally present in the middle ofthe Clearwater drainage and becomes increasingly abundant in the upper part of thedrainage, where it is interbedded with alluvial fan deposits. Buried colluvial/alluvialfan deposits are distinguished by a relatively high percentage of locally-derived angularclasts, including fragile shale clasts.
fluvial stratigraphy of the clearwater valleyOverview.—In actively rising landscapes, river valleys will commonly contain a
record of past valley bottoms, preserved as terraces on the valley slopes above the activeriver channel. Unconformities are used to divide terrace deposits into mapableallostratigraphic units. The bedrock unconformity at the base of the terrace deposit iscalled a strath, and the uppermost constructional surface of the deposit, a tread.
We distinguish between two different types of mapable terrace deposits. A fillterrace deposit is a thick deposit of alluvium, resting on a strath, and usually formed bywidespread aggradation along the length of the river (Bull, 1991, p. 8). In contrast, astrath terrace deposit describes a thin layer of alluvium resting on a strath surface andrepresents the bedload that was left behind by the active river channel. For practicalpurposes, a unit is assigned as a strath terrace deposit where it has less than 3 m ofcoarse alluvial sediment, which represents the approximate scour depth and character-istic bedload thickness that could be mobilized during bankfull discharge in a river thesize of the Clearwater. Geologically speaking, the cutting of a strath and deposition ofan overlying strath terrace unit occur at the same time because the moving bedload iswhat abrades the strath. On the other hand, a fill terrace deposit may take up to 10 kyto accumulate (Weldon, 1986). Thus, the fill provides only a minimum age for burial ofthe underlying strath surface.
The valley walls of the Clearwater drainage contain a series of paired and unpairedterrace deposits inset into the valley walls at 1 to 110 m above the modern channel(figs. 7 and 8). The river valley and adjacent terraces show marked changes in anupstream direction (fig. 7). The lower reach of the Clearwater (cross-valley sectionsB-B9 and C-C9 in fig. 8) is flanked by low well-rounded interfluves. The terrace depositsare made up of 5 to 40 m of coarse, stratified sand and gravel and sit on straths 0 to20 m above the elevation of the modern valley bottom. Locally, the fill has buried notonly the paleo-valley bottom (equivalent to the strath) but also the side slopes of theriver valley itself (for example, Qt2 in C-C9 in fig. 8), thus forming a buttressunconformity. Sedimentary structures within the terrace deposits include broad,shallow channel forms exhibiting 0.5 to 2 m-high tabular cross beds, and smaller-scaletrough crossbeds in finer-grained silty-sand beds. This sedimentology is generallyconsistent with a braided channel pattern and mimics the features exhibited byglacio-fluvial deposits that can be physically traced to heads of outwash in adjacent,glaciated drainages. The terrace alluvium is capped by about 1 to 2 m of thin-beddedsand, locally laminated silt, and massive silt, which are interpreted as overbank andloess deposits.
The upper reach of the Clearwater is characterized by a narrow V-shaped gorge,which lies inside a wider V-shaped valley (D-D9 in fig. 8). The fill terraces thatcharacterize the lower reach give way to unpaired strath terraces in the upper reach.Locally, pediment gravel and thin alluvial fan deposits mantle the slopes of an outervalley and grade into the highest strath terraces, which lie at the break in slope between
399and erosion across the Cascadia forearc high, western Washington State

Fig.
7.A
lon
g-pr
ofile
sect
ion
ofth
eC
lear
wat
erva
lley
show
ing
the
vert
ical
rela
tion
ship
ofm
appe
dte
rrac
ede
posi
ts(p
olyg
ons)
toth
em
oder
nC
lear
wat
erR
iver
(con
tin
uous
line)
.Ter
race
unit
swer
epr
ojec
ted
orth
ogon
ally
into
the
valle
ypr
ofile
from
thei
rm
appe
dpo
siti
onsa
lon
gth
efl
anks
ofth
eC
lear
wat
erva
lley
(fig.
4B).
Th
ebo
ttom
and
top
ofea
chpo
lygo
nco
rres
pon
dsto
the
stra
than
dtr
ead,
resp
ecti
vely
,for
am
appe
dte
rrac
ede
posi
t.
400 F. J. Pazzaglia and M. T. Brandon—A fluvial record of long-term steady-state uplift
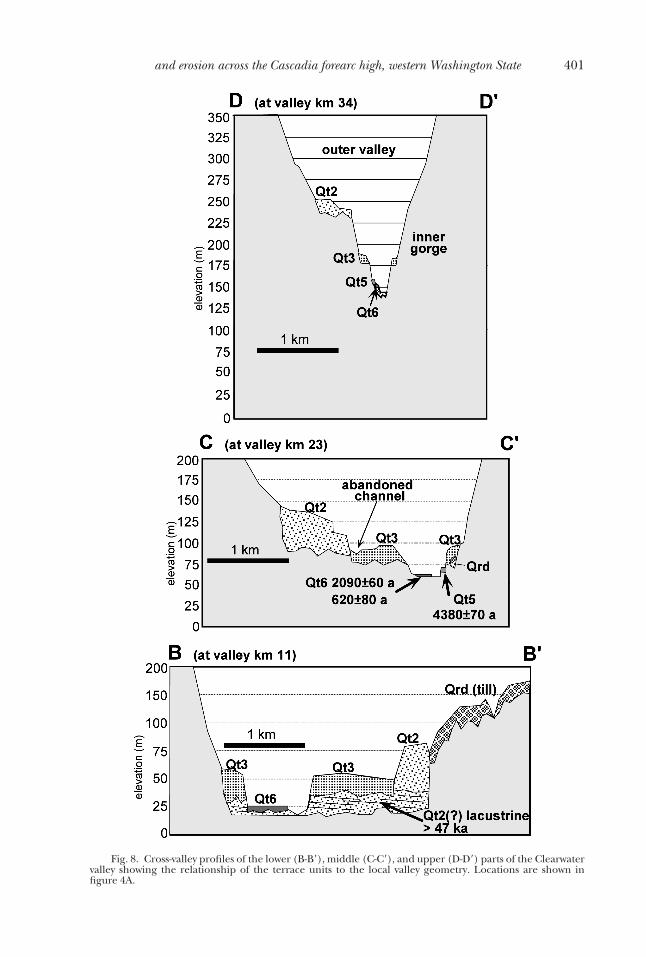
Fig. 8. Cross-valley profiles of the lower (B-B9), middle (C-C9), and upper (D-D9) parts of the Clearwatervalley showing the relationship of the terrace units to the local valley geometry. Locations are shown infigure 4A.
401and erosion across the Cascadia forearc high, western Washington State

the outer valley and an inner valley gorge. Upstream from Kunamaskt Creek (fig. 4B;D-D9 in fig. 8), all of the terraces are strath terraces, cut into pre-Quaternary bedrock orold Quaternary deposits (units Qt1 or Qrd, defined below).
Mapping and relative ages.—We have identified six terraces, Qt1 to Qt6, based on a1:12,000 scale surficial geologic map of the Clearwater watershed. Our mappingconsidered relative stratigraphic position, elevation of the terrace base above themodern stream (fig. 7), character of the soil profile developed in the terrace tread(table 1), and correlations with other Quaternary deposits in adjacent drainages and atthe Pacific coast (Thackray, 1996; Wegmann, 1999). Much of the terrace correlation,including the link between upstream strath terraces and downstream alluvial fills, iswell defined by these basic map relations. All terrace units are described here, but weare especially interested in the largest and most continuous units, Qt2 and Qt3, whichare used to estimate fluvial incision along the trunk of the Clearwater River.
Soil profile development and clast weathering rinds (figs. 9 and 10; table 1) in theterrace treads provide additional controls in distinguishing between deposits ofdifferent age and linking upstream and downstream remnants of the terraces. Soildescriptions and terminology follow the United States Department of Agriculture SoilTaxonomy (Soil Survey Staff, 1975). For the rind-thickness methods, we followprocedures outlined in Chinn (1981), Knuepfer (1988), McSaveney (1992), andRicker, Chinn, and McSaveney (1993). Rinds were measured to the nearest 1 mm onclasts of graywacke sandstone that were about 4 to 10 cm in diameter and hadwell-defined concentric rinds and unweathered cores. Most weathering rind studiessample clasts from the surface of the terrace, but this is not possible in the wet andheavily vegetated Clearwater drainage. Good exposures of terrace treads are only
Table 1
Summary of terrace units
* 5 precise age control provided by a subset of approx 55 radiocarbon AMS dates (Wegmann, 1999;Wegmann and Pazzaglia, submitted).
402 F. J. Pazzaglia and M. T. Brandon—A fluvial record of long-term steady-state uplift
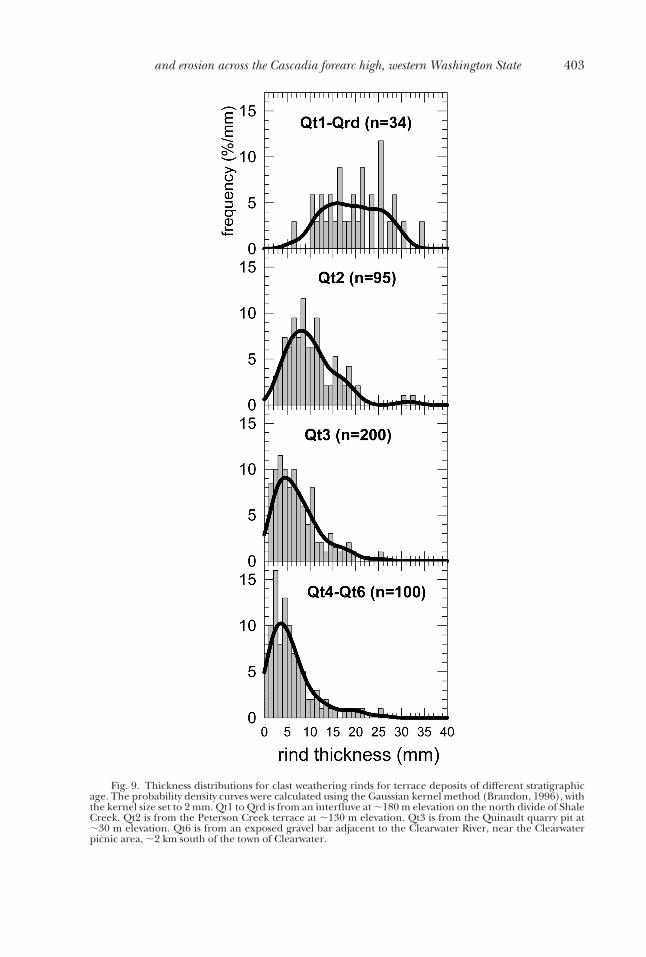
Fig. 9. Thickness distributions for clast weathering rinds for terrace deposits of different stratigraphicage. The probability density curves were calculated using the Gaussian kernel method (Brandon, 1996), withthe kernel size set to 2 mm. Qt1 to Qrd is from an interfluve at ;180 m elevation on the north divide of ShaleCreek. Qt2 is from the Peterson Creek terrace at ;130 m elevation. Qt3 is from the Quinault quarry pit at;30 m elevation. Qt6 is from an exposed gravel bar adjacent to the Clearwater River, near the Clearwaterpicnic area, ;2 km south of the town of Clearwater.
403and erosion across the Cascadia forearc high, western Washington State

available in gravel-pit highwalls and a few road cuts. Otherwise, the treads are eitherdensely forested with no clasts exposed at the surface, or they are significantlydisturbed by logging.
We avoided this problem by sampling buried clasts collected from a definedposition with the terrace soil profile (Colman and Pierce, 1981, 1986). We expect thatclasts buried in the soil profile should weather in the same manner as those at thesurface. The soil profile lies within the upper 3 m of the terrace and thus is relativelythin compared to the thickness of the overall deposit, which might reach some 30 m ormore. Furthermore, clasts at the surface and in the soil profile are subjected to similarwet-dry cycles, associated with infiltration of precipitation and fluctuations of thegroundwater table.
Sampling was done in high-wall gravel pits, which provide large cross sections, tensof meters in length, of the terrace treads. These exposures show that the soil profileshave been intensely bioturbated down to a depth of at least a meter, and in some casesmore, including most of the B horizon of the soil profile. Clasts were collected from thebase of the B horizon, where they generally preserve their original depositional fabric,indicating minimal bioturbation. Terrace treads commonly have a fine-grained capcomposed of fluvial or eolian sediment. Field and airphoto observations show that soildrainage is poor in areas where this fine-grained cap is thick. In our sampling, weselected areas that were well drained (that is, minimal fine-grained cap) in order toavoid the influence of variable soil drainage on the degree of clast weathering.
Figure 9 shows that the younger deposits tend to have tight unimodal rind-thickness distributions, with a long tail on the high side of the distribution, whereas theolder deposits show broader, more-symmetric distributions. Modes were used as the
Fig. 10. Rind-thickness data for graywacke clasts at various sample localities in the terrace units. Theaverage thickness at each locality is represented by the mode of the density plot (fig. 9). Four calibrationpoints (solid circles with estimated 2SE error bars) from localities with well-constrained ages were used todefine a best-fit curve, using an offset power function with a form: t 5 A(T-T0)B, where t is age in ka, and T isthickness in mm. The fit parameters were determined by least-squares: A 5 59.86, B 5 0.354, and T0 5 2.0.Rind-thickness modes from undated terrace units (gray triangles) are plotted using ages predicted by thecalibration curve.
404 F. J. Pazzaglia and M. T. Brandon—A fluvial record of long-term steady-state uplift
representative thickness, as recommended by McSaveney (1992). Four localities havesuitable age control to be used as calibration points (large circles in fig. 10). Anapproximate age-thickness curve was estimated using an offset power function (modi-fied from Chinn, 1981). The triangle symbols (fig. 10) show predicted ages forrind-thickness modes for undated terrace units.
We caution against putting too much reliance on specific age estimates or ourdetermination of an age-thickness curve. What is more important is that the terraceunits show a clear trend of progressively thicker rinds with increasing stratigraphic age.This result represents a positive test of our abilities to map, correlate, and sequence theterrace deposits according to their relative age.
Stratigraphic units.—Qt6 is the youngest terrace unit and is characterized by brown(10YR), poorly developed soils, rind-thickness modes between 0 and 2 mm, and anoxidation depth of 1 to 2 m in pebbly and sandy silt deposits. Soils are developedmainly in fine-grained overbank deposits with little to no illuviated material in theunderlying sand and gravel. Soil profiles typically consist of a 20 cm-thick A horizon, a30 cm-thick cambic B horizon, and a thin oxidized C horizon 1 to 3 m thick. Qt6 fillsare thickest, reaching a maximum of 4 m near the mouth of the Clearwater andthinning considerably upstream. They become strath terrace deposits at about km 35.The strath surfaces beneath Qt6 lie within ;2 m of the modern river channel and havegradients similar to the modern channel.
Qt5 and Qt4 have poorly-developed brown and yellow-brown soils. Rind-thicknessmodes are between 3 and 4 mm, and oxidation extends to ;2 to 3 m depth, and locally.4 m in coarse alluvium. Post-depositional modification is minor on the terrace treads,which retain a constructional morphology with well-preserved overbank deposits andlocal loess. A typical soil profile exhibits a 50 cm-thick B horizon composed of yellowishbrown (10YR) silt loam to silty clay. Qt5 and Qt4 are best preserved below km 35. Theirstraths sit at a consistent height of ;3 to 5 m above the modern channel, and theirtreads, at a height of ;5 to 10 m.
Qt3 has a moderately developed yellow soil profile, rind-thickness modes between3 and 4 mm, and an oxidation depth of 4 to 5 m, but locally ;10 m in coarse alluvium.Post-depositional modification is minimal on the terrace treads, which retain aconstructional morphology with well-preserved sandy overbank and silty loess deposits.The loess is .1 m near the Snahapish River and the coast. Soil profiles consist of a 50 to80 cm-thick B horizon composed of yellowish brown (10YR) to brown (10YR-7.5YR) siltloam with numerous thin clay films preserved on soil ped faces. Soil profiles infine-grained material have strong brown colors (7.5YR) and well-developed soilstructure. Qt3 is best preserved below about km 24, where it locally has two treads,designated as Qt3a and Qt3b, with the Qt3b tread sitting about ;4 m below the Qt3atread. In this part of the valley, Qt3 straths maintain a gentle gradient, lying 6 to 10 mabove the channel, and treads are ;35 m above the channel. Above km 24, Qt3 hasonly one tread, and the straths take on a steeper gradient, climbing to a maximumheight of ;70 m above the channel.
Qt2 deposits have well-developed brownish-red colored polygenetic soils. Rind-thickness modes are between 9 and 12 mm, and the oxidation depth is ;10 m in coarsesand and gravel. There are 4 distinct treads associated with the Qt2 fill, especially in theregion surrounding the Snahapish-Clearwater confluence. The treads are named Qt2athrough Qt2d, in order of decreasing elevation and age of the tread. All these treadsshow significant post-depositional modification caused by root bioturbation andcolluviation, as well as multiple episodes of loess deposition. Morphology and soilstratigraphy vary on the treads, with well-developed soils on well-drained colluviatedslopes and more poorly developed, loess-rich soils on eroded interfluves. In thelow-relief, stable parts of the tread, soils consist of a 10 cm-thick A horizon, a local 1 to
405and erosion across the Cascadia forearc high, western Washington State

10 cm-thick albic horizon, and a 50 to 100 cm-thick B horizon composed of brown(7.5YR) and strong brown (7.5YR) clay loam with moderately thick clay films. Alongthe lower Clearwater, the Qt2 strath sits at 15 to 40 m above the modern channel, andthe oldest tread, Qt2a, sits at ;60 m above the channel. In the upper Clearwater, theQt2 strath takes on a steeper gradient, rising to a maximum of ;110 m above themodern channel in the uppermost part of the drainage.
The primary tread, Qt2a, marks the constructional top of the original fill unit. Thenext three treads, Qt2b,c,d, mark a series of unpaired fill-cut terraces inset into theprimary deposit. These minor inset units are thought to have formed during a series oflocal events within the river (“complex-response” terraces of Schumm, 1973; Bull,1991, p. 24 - 25) during incision of the Qt2 fill. In contrast, the continuity and pairedgeometry of the other terrace treads, most notably Qt2a and Qt3a, indicate they wereformed by events that affected the entire drainage.
The oldest Quaternary units in the Clearwater, Qt1 and Qrd, are restricted toisolated outcrops along the crest of some high-standing interfluves. These units havesimilar weathering characteristics but different sedimentology and origins. Qt1 isinterpreted to be strictly fluvial in origin, based on its more stratified character and itsrelationship to the modern Clearwater channel. If correct, it may be the oldest andmost deeply incised terrace fill in the Clearwater drainage. Qt1 crops out in the centerof the drainage, where it lies .100 m above the modern channel. It consists of weaklystratified, highly dissected and colluviated fluvial sand and gravel. Clasts are generallywell rounded and highly saprolitized. Those that preserve weathering rinds have amodal thickness .20 mm. Qt1 soils are complex and polygenetic and have multiple 1to 2 m-thick truncated B horizons composed of strong brown (7.5YR), reddish-brown(5YR), and red (2.5YR) clay-rich soil.
Qrd consists of poorly sorted, unstratified sand, and matrix-supported gravel. Theunit is interpreted to be a relatively old glacial or glacial-fluvial deposit. Depositsinclude some deeply weathered tills exposed along the crest of Kalaloch Ridge (fig.4A), and at the top of the interfluves between Willamaud and Bull creeks and Shaleand Deception creeks (fig. 4B). These deposits are considered to have formed duringglacial advances from the adjacent Queets and Hoh drainages (Queets glaciation onthe southeast side of the Clearwater drainage; Hoh glaciation for the area betweenSnahapish River and Bull Creek, and along Kalaloch Ridge from Kalaloch to Snahap-ish River divide; for details, see Heusser, 1974; Rau, 1975; Thackray and Pazzaglia,1994; Thackray, 1996).
Weathered till and lacustrine deposits (Qrd) locally crop out in the valley bottomabove km 42 (fig. 4B; Wegmann, 1999). In the headwater of the Clearwater (above km45), several distinct flat surfaces are preserved high on the valley walls. These surfacesare locally underlain by a dark gray diamicton with angular clasts. There are no directages for these deposits, but deep weathering suggests that they are some of the oldestsurficial deposits in the drainage.
Age of terrace units.—Qt4, Qt5, and Qt6 are all Holocene to latest Pleistocene in age(0 - 11 ka in fig. 6). The detailed age data for these units come from approx 55radiocarbon AMS dates presented in Wegmann (1999) and Wegmann and Pazzaglia(submitted). The older terraces are all pre-Holocene in age. Numerous organicsamples from Qt3 have consistently given “radiocarbon dead” results, indicating anage . 47 ka (Heusser, 1972; Florer, 1972; Thackray, 1996, 2001). We have recoveredwell-preserved wood from laminated lacustrine beds interbedded with Qt2 fluvialdeposits (B-B9 in fig. 8). It too was radiocarbon dead ( . 47 ka, Beta 75762).
We can infer specific ages for the Qt2 and Qt3 deposits by correlations to glacialstratigraphy in the Hoh and Queets drainages (Thackray, 1996, 2001) and eustasticallycontrolled stratigraphic relationships preserved at the coast. In estimating ages, we
406 F. J. Pazzaglia and M. T. Brandon—A fluvial record of long-term steady-state uplift
focus on the main part of the fill deposit, which is defined to lie below the oldest treadin each deposit (Qt2a and Qt3a). These deposits are the oldest and mark when theunderlying strath was buried, so their ages are important for our estimation of incisionrates for the Qt2 and Qt3 straths.
The coastal sequence and related deposits have been studied in considerabledetail (Crandell, 1964, 1965; Huesser, 1964, 1972, 1973, 1974, 1978; Moore, 1965;Florer, 1972; Rau, 1973; Easterbrook, 1986; Saunders, Clague, and Roberts, 1987;Thackray and Pazzaglia, 1994; Thackray, 1996, 1998, 2001). The sequence is domi-nated by two glacio-fluvial fan-delta sequences that were fed by outwash from pointsources at the mouths of the Hoh and Queets rivers. The outwash can be physicallytraced to terminal moraines in the Hoh valley that mark the limits of major alpineglacial advances in the upper Hoh (fig. 4A). Recall that the Lyman Rapids and WhaleCreek advances in the Hoh valley were of sufficient magnitude to breach the low dividewest of the Snahapish River (fig. 4A). The thick fill terraces, Qt2 and Qt3, mark the twotimes that outwash from the Hoh spilled into the lower Clearwater valley. We infer thatduring each of these events, the Clearwater River was initially unable to transport theincreased sediment flux. The result was widespread deposition in the lower parts of theClearwater and Queets valleys and outward across the exposed continental shelf.Deposition continued until the river profile was steep enough to transport theenhanced sediment load.
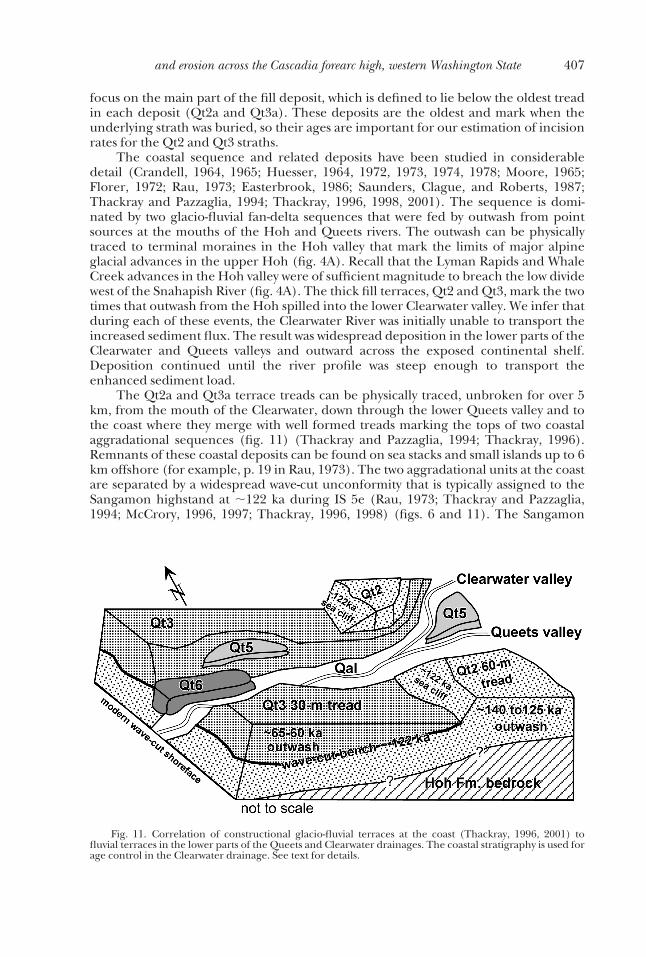
The Qt2a and Qt3a terrace treads can be physically traced, unbroken for over 5km, from the mouth of the Clearwater, down through the lower Queets valley and tothe coast where they merge with well formed treads marking the tops of two coastalaggradational sequences (fig. 11) (Thackray and Pazzaglia, 1994; Thackray, 1996).Remnants of these coastal deposits can be found on sea stacks and small islands up to 6km offshore (for example, p. 19 in Rau, 1973). The two aggradational units at the coastare separated by a widespread wave-cut unconformity that is typically assigned to theSangamon highstand at ;122 ka during IS 5e (Rau, 1973; Thackray and Pazzaglia,1994; McCrory, 1996, 1997; Thackray, 1996, 1998) (figs. 6 and 11). The Sangamon
Fig. 11. Correlation of constructional glacio-fluvial terraces at the coast (Thackray, 1996, 2001) tofluvial terraces in the lower parts of the Queets and Clearwater drainages. The coastal stratigraphy is used forage control in the Clearwater drainage. See text for details.
407and erosion across the Cascadia forearc high, western Washington State

high marks the highest stand of sealevel in the past ;250 ka (fig. 11), reaching 15 62 m amsl at 122 6 4 ka (Muhs, 1992; Chappell and others, 1996).
Lajoie (1986) and Anderson, Densmore, and Ellis (1999) report examples wheremarine-terrace cutting occurred at IS 5a (;85 ka) and not IS 5e, but they argue thatthis result occurs where a coastline is being rapidly uplifted, as indicated by preserva-tions of flights of wave-cut terraces. As discussed earlier, long-term uplift along theOlympic coast has been very slow (for example, flights of wave-cut terraces are notablyabsent). Thus, for the Olympic coast, the highest wavecut terrace should correspond tothe highest stand of sealevel, which is the Sangamon highstand. Thackray (1998)discusses the possibility that the wavecut terrace was cut at IS 5c or IS 5a (105 or 85 ka,respectively), but we consider these options untenable given that sealevel was some 25to 30 m lower than the Sangamon highstand (fig. 6).
The wavecut origin of the unconformity is indicated by a thin beach deposit withmarine fossils lying directly above the unconformity. Glacio-fluvial deposits below theunconformity are correlative with Qt2 (fig. 11). The Qt2a tread is cut out at the coast bythe unconformity, but it is exposed ;1500 m inland as a distinct flat surface at ;60 mabove modern sealevel (amsl) (Thackray, 1996). It is this terrace tread that can betraced back to Qt2a in the Clearwater drainage. At the coast, glacio-fluvial depositsabove the unconformity are correlative to Qt3. The terrace tread for this deposit is atan elevation ;30 m amsl at the coast and is coextensive with the Qt3a terrace tread inthe Clearwater valley. Numerous organic samples from these coastal units have yieldedradiocarbon-dead results (Heusser, 1972; Florer, 1972; Thackray, 1996, 2001). Fromthis, we conclude that Qt3 is older than ;47 ka but younger than the ;122 kaunconformity, and Qt2 is . 122 ka (fig. 6).
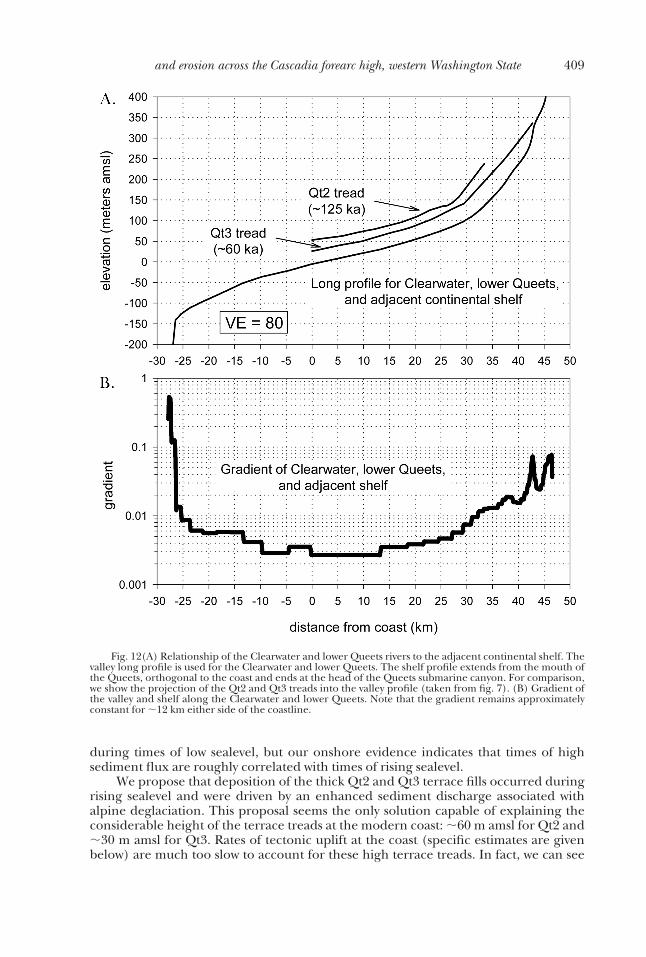
We can refine these age estimates by examining the relationship of the Qt2a andQt3a aggradational events to global eustasy. Figure 12 shows the valley profile andvalley gradient in the Clearwater-Queets drainage and its continuation across thecontinental shelf. We focus on the valley long-profile because we have no informationabout the channel long profile for the offshore area nor do we know the channel longprofile associated with deposition of the terrace fill units. In any case, the valley longprofile would seem to provide a better basis for comparison because it represents along-term integrated record of the gradient of the fluvial system. In contrast, thechannel long profile is subject to short-term change due to local variations in channelsinuosity.
The modern valley gradient remains relatively constant, at ;0.003, through thelower 12 km of the Clearwater-Queets drainage and across the inner continental shelf.The gradient increases at ;12 km offshore and becomes very steep beyond 25 km,which marks the head of a submarine canyon incised into the shelf edge. The shelf istypically ;40 km wide elsewhere but only 25 km wide offshore of the Queets-Clearwater drainages because of the headward incision of the submarine canyon.
Consider now what would happen during falling sealevel. During the early part ofthe fall, the river would extend its channel outward across the continental shelf. Thisextension would require little or no change to the upstream part of the drainage, giventhe similar gradient of the lower part of the river and the inner shelf. However, whensealevel dropped below about 250 m amsl, the Queets-Clearwater River would start todrain through the head of the Queets submarine canyon. The steeper gradient of theriver in the canyon head would initiate a landward-migrating knickpoint. The knick-point never made it to the mouth of the Queets, given that there has been nosignificant bedrock incision at the mouth of the Queets. From this, we conclude thatthe shelf has served to isolate the Queets-Clearwater drainage from the effects ofeustasy. Apparently, the lowstands were not of sufficient duration to allow the knick-points to reach the coast. An increased sediment flux may have driven aggradation
408 F. J. Pazzaglia and M. T. Brandon—A fluvial record of long-term steady-state uplift
during times of low sealevel, but our onshore evidence indicates that times of highsediment flux are roughly correlated with times of rising sealevel.
We propose that deposition of the thick Qt2 and Qt3 terrace fills occurred duringrising sealevel and were driven by an enhanced sediment discharge associated withalpine deglaciation. This proposal seems the only solution capable of explaining theconsiderable height of the terrace treads at the modern coast: ;60 m amsl for Qt2 and;30 m amsl for Qt3. Rates of tectonic uplift at the coast (specific estimates are givenbelow) are much too slow to account for these high terrace treads. In fact, we can see
Fig. 12(A) Relationship of the Clearwater and lower Queets rivers to the adjacent continental shelf. Thevalley long profile is used for the Clearwater and lower Queets. The shelf profile extends from the mouth ofthe Queets, orthogonal to the coast and ends at the head of the Queets submarine canyon. For comparison,we show the projection of the Qt2 and Qt3 treads into the valley profile (taken from fig. 7). (B) Gradient ofthe valley and shelf along the Clearwater and lower Queets. Note that the gradient remains approximatelyconstant for ;12 km either side of the coastline.
409and erosion across the Cascadia forearc high, western Washington State
that the Sangamon wave-cut surface still lies close to the original height at which it wascut.
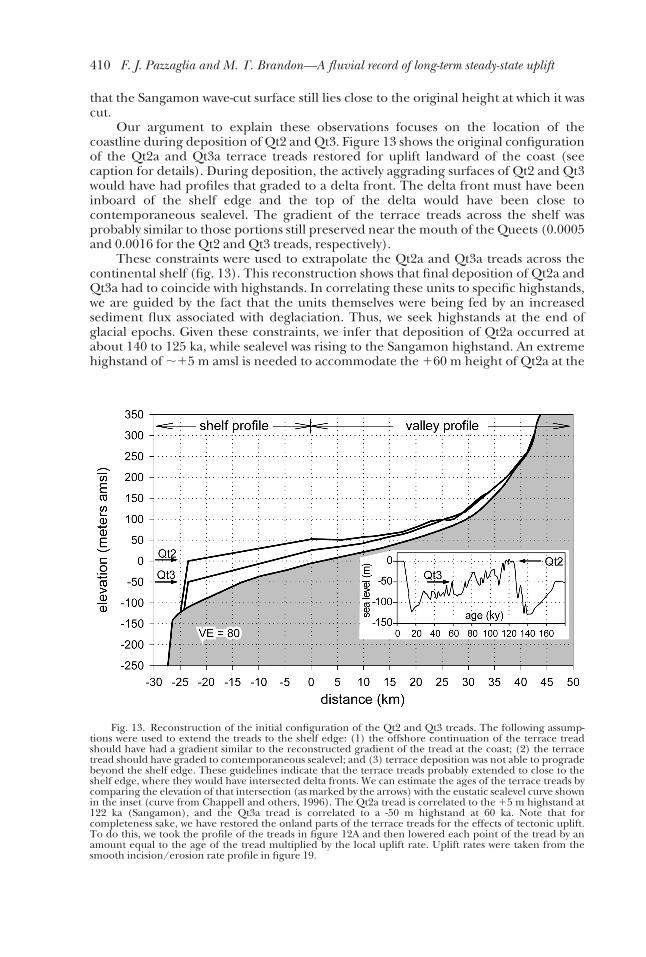
Our argument to explain these observations focuses on the location of thecoastline during deposition of Qt2 and Qt3. Figure 13 shows the original configurationof the Qt2a and Qt3a terrace treads restored for uplift landward of the coast (seecaption for details). During deposition, the actively aggrading surfaces of Qt2 and Qt3would have had profiles that graded to a delta front. The delta front must have beeninboard of the shelf edge and the top of the delta would have been close tocontemporaneous sealevel. The gradient of the terrace treads across the shelf wasprobably similar to those portions still preserved near the mouth of the Queets (0.0005and 0.0016 for the Qt2 and Qt3 treads, respectively).
These constraints were used to extrapolate the Qt2a and Qt3a treads across thecontinental shelf (fig. 13). This reconstruction shows that final deposition of Qt2a andQt3a had to coincide with highstands. In correlating these units to specific highstands,we are guided by the fact that the units themselves were being fed by an increasedsediment flux associated with deglaciation. Thus, we seek highstands at the end ofglacial epochs. Given these constraints, we infer that deposition of Qt2a occurred atabout 140 to 125 ka, while sealevel was rising to the Sangamon highstand. An extremehighstand of ;15 m amsl is needed to accommodate the 160 m height of Qt2a at the
Fig. 13. Reconstruction of the initial configuration of the Qt2 and Qt3 treads. The following assump-tions were used to extend the treads to the shelf edge: (1) the offshore continuation of the terrace treadshould have had a gradient similar to the reconstructed gradient of the tread at the coast; (2) the terracetread should have graded to contemporaneous sealevel; and (3) terrace deposition was not able to progradebeyond the shelf edge. These guidelines indicate that the terrace treads probably extended to close to theshelf edge, where they would have intersected delta fronts. We can estimate the ages of the terrace treads bycomparing the elevation of that intersection (as marked by the arrows) with the eustatic sealevel curve shownin the inset (curve from Chappell and others, 1996). The Qt2a tread is correlated to the 15 m highstand at122 ka (Sangamon), and the Qt3a tread is correlated to a -50 m highstand at 60 ka. Note that forcompleteness sake, we have restored the onland parts of the terrace treads for the effects of tectonic uplift.To do this, we took the profile of the treads in figure 12A and then lowered each point of the tread by anamount equal to the age of the tread multiplied by the local uplift rate. Uplift rates were taken from thesmooth incision/erosion rate profile in figure 19.
410 F. J. Pazzaglia and M. T. Brandon—A fluvial record of long-term steady-state uplift
coast. Deposition of Qt3a is attributed to a sealevel rise at 65 to 60 ka and wouldcoincide with deglaciation associated with the end of IS4. The highstand at that timereached –50 m amsl, which gives a reasonable graded profile relative to the 130 m amslheight of the Qt3a tread at the coast.
These observations support the following synthesis of the Clearwater terracestratigraphy (figs. 5 and 14). The oldest deposits are Qt1 and Qrd, as indicated by theirhigh position in the landscape, deep weathering, and high degree of reworking.Rind-thickness measurements (figs. 9 and 10) suggest a middle Pleistocene age.
Qt2 was formed due to enhanced sediment supply liberated during the retreat ofthe Whale Creek alpine glaciers in the Hoh and Queets valleys. Rising sealevel allowedthe unit to aggrade across the shelf to a coastline located close to the shelf edge. Theabandonment of Qt2a marks a decrease in sediment supply. The geometry of theterrace tread suggests that abandonment occurred close to the time of the Sangamonhighstand. From this, we infer that Qt2 was deposited at about 140 to 125 ka. When itwas abandoned, one could look west from the present coast across a broad braidedalluvial plain. The expanse of this plain is recorded by a seaward-thickening loessdeposit on top of Qt2a, which was apparently derived from the area of the modernshelf by wind erosion associated with prevailing westerly winds.
Without the enhanced sediment supply to sustain it, Qt2 was quickly eroded back.The Clearwater-Queets river cut down through the deposit in an unsteady fashion,leaving behind a series of small cut-and-fill deposits (Qt2b-d). The shelf part of Qt2 wasremoved by wave erosion, which drove rapid retreat of a sea cliff, much like what isobserved along the Olympic coast today. The retreating sea cliff left behind thewave-cut unconformity in its wake. The height of this unconformity at the coastindicates that it was cut during the Sangamon highstand at ;122 ka.
Qt3 is envisioned to have formed in similar way to Qt2. Lyman Rapids alpineglaciers are thought to have retreated in association with global warming and risingsealevel at the end of IS 4. Again, flushing of glacial debris provided an increasedsediment flux through the Snahapish divide and into the lower Clearwater and Queetsvalleys. The increased sediment flux accounts for the aggradation. Our best guess isthat Qt3 was deposited at ;65 to 60 ka during the transition from IS 4 to 3, whensealevel reached a local highstand of ; –50 m amsl.
Qt4 is in some ways analogous to Qt2 and Qt3 in that it was deposited during thetransition from the glacial IS 2 to the interglacial IS 1 (Holocene). What is different isthat Qt4 is much smaller in extent and volume relative to Qt2 and Qt3. The reason isthat alpine glaciation during the last glacial maximum was much smaller in extentrelative to previous glacial epochs (Thackray, 2001). This point is illustrated by figure4A, which shows the more limited extent of the Hoh Oxbow and Twin Creek morainesrelative to the older Lyman Rapids and Whale Creek moraines (fig. 4A). Thackray(2001) argues that a drier climate during the last glacial maximum resulted in smalleralpine glaciations. Stratigraphic relations indicate that there was no spillover ofoutwash sediment from the Hoh into the lower Clearwater during Qt4 time. Thus, Qt4aggradation was “sediment starved” and could not prograde outward like Qt2 and Qt3.This result illustrates that for the Clearwater-Queets system, progradation across theshelf only occurs when both sediment flux and sealevel are high.
The Holocene has been mainly a time of major valley incision and the carving ofstraths, although the straths are much narrower than their Pleistocene counterparts.The Qt5 and Qt6 terrace units are relatively thin and probably have little preservationpotential. Wegmann and Pazzaglia (submitted) propose that deposition of these unitswas controlled by short-term climate change and earthquake-induced mass wastingfrom hillslopes.
411and erosion across the Cascadia forearc high, western Washington State

Fig. 14. Interpretation of the formation and timing of terrace cycles in the Clearwater drainage. (A)Terrace cycles appear to be linked to the global climate cycle, which is represented here using the marineoxygen isotope curve (after Fuller and others, 1998). Light-shaded regions indicate global glacial climates,which prevailed during IS 2-3, 4, and 6. (B and C) Illustration of a terrace cycle, which starts with cutting of astrath during a period of wide incision, followed by burial of the valley floor during an aggradational event,and ending with narrow incision through the fill and underlying strath. A complete cycle leaves behind aterrace unit (for example, t1 and t2). (D) Illustration of age relationships for straths and treads. Straths maybe formed over a long period of time, but the form of the strath, as preserved in the stratigraphic record,dates to when the strath was buried. The deposition of a fill sequence in the lower reach of a river generallycauses the entire river channel to aggrade. The implication is that the strath surface was probably abandonedat the same time along the entire channel. In contrast, fill deposition can vary considerably along the lengthof the river. The general tendency is that aggradation will persist for a longer time in the downstream reach,with the result that terrace treads generally young in a downstream direction.

Age of straths.—Having estimated the age of the terrace units and their treads, wenow consider the age of the underlying straths. We focus here on the Qt2 and Qt3straths, which are used below to estimate incision rates. Evidence cited above indicatesthat Qt2 and Qt3 deposition started toward the end of a glacial epoch. From this weinfer that the straths were cut sometime during the glacial part of the climate cycle (“S”in fig. 14A). However, for our analysis of incision rates, we need to estimate when thestraths were buried, not when they were formed. Burial ages are estimated using theolder limits for the ages of the overlying fill: 140120 ka for burial of the Qt2 strath and65110 ka for the burial of the Qt3 strath. These estimates are crude, as indicated by thecited uncertainties. Nonetheless, the age uncertainties are small relative to theabsolute ages of the straths and the difference in their ages. Qt2a and Qt3a appear tohave been deposited within a short period time (5 - 15 ky), coincident with risingsealevel. Thus, burial of the straths probably occurred rapidly along the entire lengthof the valley. As a result, we are confident that the Qt2 and Qt3 straths provide good“snapshots” of the long profile of the valley floor.
incision of the qt2 and qt3 straths
Our estimates of fluvial incision are based on the height above the modernchannel of the Qt2 and Qt3 straths, which are the widest and most continuous strathsin the Clearwater drainage. By definition, these straths were cut when the river wascarving out a predominantly bedrock-floored valley bottom. The modern river is alsocarving out a bedrock-floored valley bottom. Thus, we suggest that the modern valleyprofile of the Clearwater is a close approximation for the valley profile during thecutting of the Qt2 and Qt3 straths. If correct, then fluvial incision would be equal torock uplift. We test this possibility below. For now, we focus on the amount, pattern,and rates of fluvial incision. Note that by measuring straths height, we are purposelyignoring the incision of the river through any overlying fill. The reason is that rockuplift is equal to the amount of bedrock incision, not total incision, assuming, ofcourse, that our assumption above holds, that the river valley returns to the same longprofile during each phase of strath formation.
Bedrock incision was measured using two methods. The strath height above thechannel was measured using an altimeter to obtain relative vertical elevation, whichhas a cited two standard error (2SE) precision of 1 m. Some straths greater than ;20 mabove the modern channel were measured by positioning the modern channel and thestrath relative to the 12 m contours on United States Geological Survey 7.5 mintopographic maps. We use a relative standard error (RSE) of 5.5 percent to representthe uncertainty for all height measurements.
Estimated incision rates are affected by errors in both height and age. Theapproximate uncertainties (;2SE) for the age of strath burial are: Qt2 5 140 ka 6 20ky (614 percent) and Qt3 5 65 ka 6 10 k.y. (615 percent).
Incision measurements for the Qt2 and Qt3 straths are shown in figure 15A and B.Incision rates are presented in figure 15C. The error bars for the incision rates includeonly height errors because the uncertainty in strath age is common to all incision ratesfrom the same strath. The uncertainties for both height and age give a combineduncertainty of 2RSE ; 18 percent.
Both Qt2 and Qt3 straths show increased incision in the upstream direction.Incision rates are remarkable similar for both straths (fig. 15C). Smooth curves fit tothe data indicate incision rates ranging from ;0.0 m/ky at the coast to ;0.9 m/ky inthe upper Clearwater valley (fig. 15). The plots also show locally fast incision betweenkm 15 and 20 (fig. 15). This feature is coincident with the convexity in the valley longprofile described in figure 5. The downstream portion of that convexity has the highestsinuosity of the entire Clearwater channel, whereas the upstream portion has relatively
F. J. Pazzaglia and M. T. Brandon 413
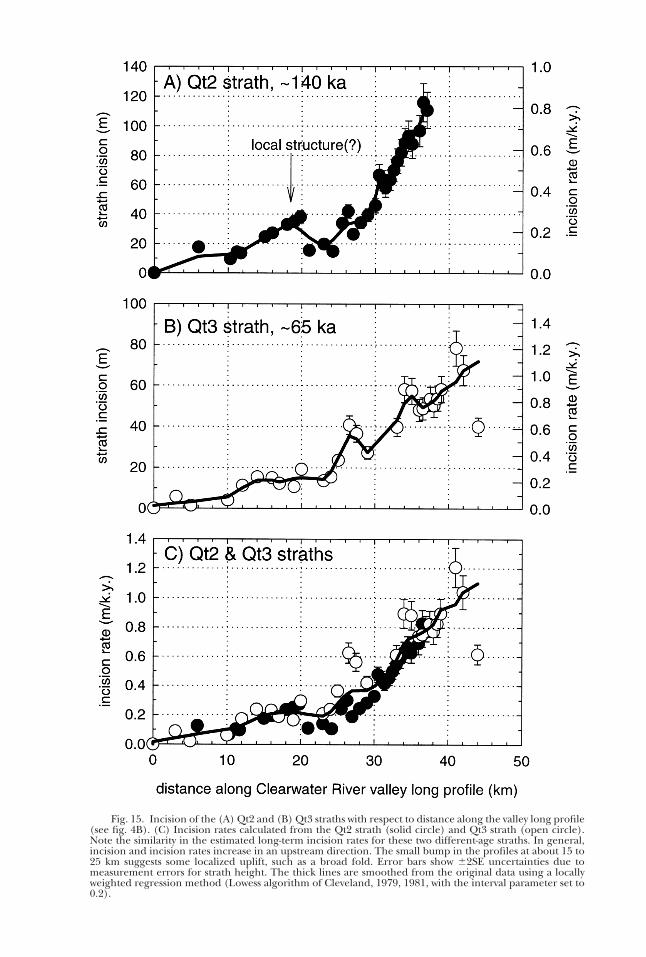
Fig. 15. Incision of the (A) Qt2 and (B) Qt3 straths with respect to distance along the valley long profile(see fig. 4B). (C) Incision rates calculated from the Qt2 strath (solid circle) and Qt3 strath (open circle).Note the similarity in the estimated long-term incision rates for these two different-age straths. In general,incision and incision rates increase in an upstream direction. The small bump in the profiles at about 15 to25 km suggests some localized uplift, such as a broad fold. Error bars show 62SE uncertainties due tomeasurement errors for strath height. The thick lines are smoothed from the original data using a locallyweighted regression method (Lowess algorithm of Cleveland, 1979, 1981, with the interval parameter set to0.2).
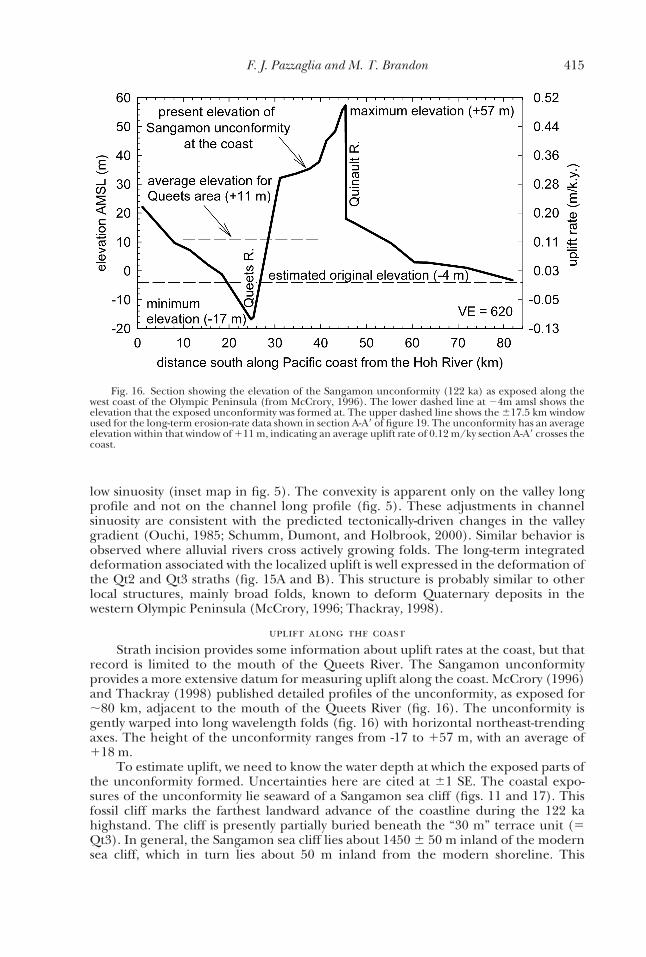
low sinuosity (inset map in fig. 5). The convexity is apparent only on the valley longprofile and not on the channel long profile (fig. 5). These adjustments in channelsinuosity are consistent with the predicted tectonically-driven changes in the valleygradient (Ouchi, 1985; Schumm, Dumont, and Holbrook, 2000). Similar behavior isobserved where alluvial rivers cross actively growing folds. The long-term integrateddeformation associated with the localized uplift is well expressed in the deformation ofthe Qt2 and Qt3 straths (fig. 15A and B). This structure is probably similar to otherlocal structures, mainly broad folds, known to deform Quaternary deposits in thewestern Olympic Peninsula (McCrory, 1996; Thackray, 1998).
uplift along the coastStrath incision provides some information about uplift rates at the coast, but that
record is limited to the mouth of the Queets River. The Sangamon unconformityprovides a more extensive datum for measuring uplift along the coast. McCrory (1996)and Thackray (1998) published detailed profiles of the unconformity, as exposed for;80 km, adjacent to the mouth of the Queets River (fig. 16). The unconformity isgently warped into long wavelength folds (fig. 16) with horizontal northeast-trendingaxes. The height of the unconformity ranges from -17 to 157 m, with an average of118 m.
To estimate uplift, we need to know the water depth at which the exposed parts ofthe unconformity formed. Uncertainties here are cited at 61 SE. The coastal expo-sures of the unconformity lie seaward of a Sangamon sea cliff (figs. 11 and 17). Thisfossil cliff marks the farthest landward advance of the coastline during the 122 kahighstand. The cliff is presently partially buried beneath the “30 m” terrace unit (5Qt3). In general, the Sangamon sea cliff lies about 1450 6 50 m inland of the modernsea cliff, which in turn lies about 50 m inland from the modern shoreline. This
Fig. 16. Section showing the elevation of the Sangamon unconformity (122 ka) as exposed along thewest coast of the Olympic Peninsula (from McCrory, 1996). The lower dashed line at 24m amsl shows theelevation that the exposed unconformity was formed at. The upper dashed line shows the 617.5 km windowused for the long-term erosion-rate data shown in section A-A9 of figure 19. The unconformity has an averageelevation within that window of 111 m, indicating an average uplift rate of 0.12 m/ky section A-A9 crosses thecoast.
F. J. Pazzaglia and M. T. Brandon 415
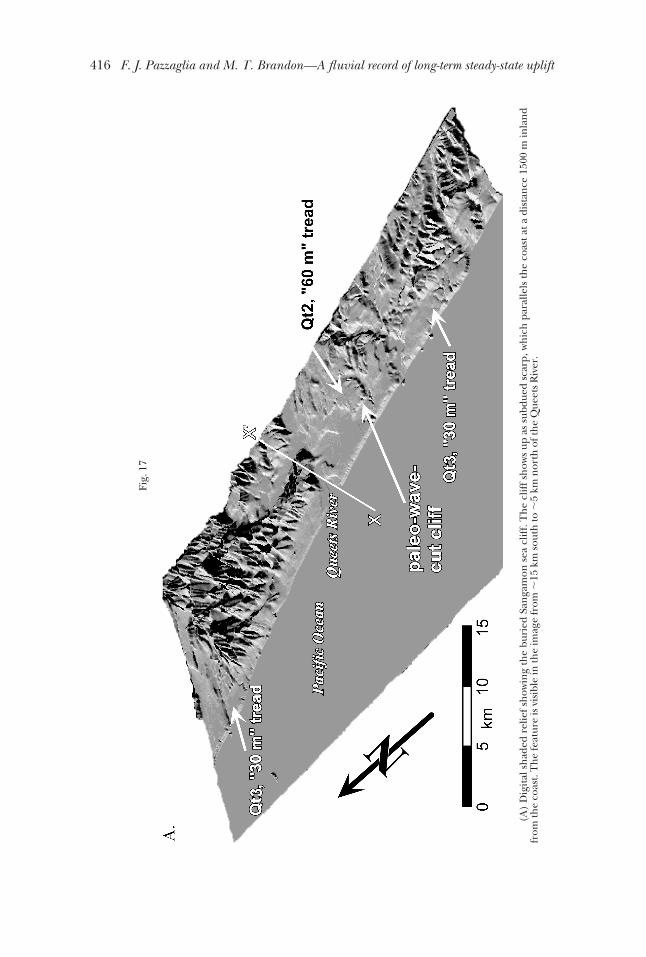
Fig.
17
(A)
Dig
ital
shad
edre
liefs
how
ing
the
buri
edSa
nga
mon
sea
clif
f.T
he
clif
fsh
ows
upas
subd
ued
scar
p,w
hic
hpa
ralle
lsth
eco
asta
tadi
stan
ce15
00m
inla
nd
from
the
coas
t.T
he
feat
ure
isvi
sibl
ein
the
imag
efr
om;
15km
sout
hto
;5
kmn
orth
ofth
eQ
ueet
sR
iver
.
416 F. J. Pazzaglia and M. T. Brandon—A fluvial record of long-term steady-state uplift

relationship is consistent from 15 km south to 5 km north of the Queets River(fig. 17A).
The present shoreface profile is used as a proxy for the Sangamon shoreface sinceboth were cut into loose fill of the coastal terrace sequence. Bathymetric contours arerelatively smooth and trend parallel to the coast, even near the mouth of the Queets.Bathymetry from the USGS Queets 7.5 minute map was fit using a standard shorefacefunction, z 5 A x2/3 (p. 6 in Trenhaile, 1997), where x is the offshore distance, z is thedepth below mean sealevel, and A is a fit parameter. The shoreface function fits thedata well, with A 5 0.0698 6 0.0022. At 1450 6 50 m offshore of the present coast, theseafloor is at 29.0 6 0.35 m amsl. Because the Sangamon highstand is estimated tohave been 15 6 0.7 m amsl (the 6 2 m uncertainty cited by Chappell and others, 1996,is taken as 63 SE), we infer that exposures of the Sangamon unconformity along themodern coast adjacent to the Queets would have originally formed at an elevation of24.0 6 0.8 m amsl.
This initial water depth, together with the age of the unconformity, allowsestimates of rock uplift rates (see right axis of fig. 16). The mouth of the Queets issubsiding at ;0.1 m/ky. This low rate is consistent with the convergence of strathsurfaces toward the mouth of the Clearwater (figs. 7 and 15). But what about thebroader area around the Queets? To answer this question, we consider all the datawithin a 615 km window parallel to the coast (see upper dashed line in fig. 16). (Notethat this window is the projected dimension of a 617.5 km wide window used below inour discussion of uplift and erosion rates along section A-A9.) The average elevation ofthe unconformity in the window is 111 m amsl, which indicates an uplift of 115 m andan average uplift rate of ;0.12 m/ky where section A-A’ crosses the coast.
More rapid uplift is observed ;20 km south of the Queets River (fig. 16). There,the north side of the Quinault River is rising at a rate of 0.50 m/ky. One interpretationis that this fast uplift is localized above a rising fold, associated with the north-southshortening recognized by McCrory (1996) and Thackray (1998). Another possibility isthat the uplift is related to local intrusion of mud diapirs, which are common in thatarea (Rau and Grocock, 1974; Orange, 1990).
(B) A schematic cross section of the modern shoreface and sea cliff and the buried Sangamon sea cliff atthe mouth of the Queets River. The section X-X9 follows A-A9; it has an azimuth of 54°, parallel to the plateconvergence direction.
417and erosion across the Cascadia forearc high, western Washington State
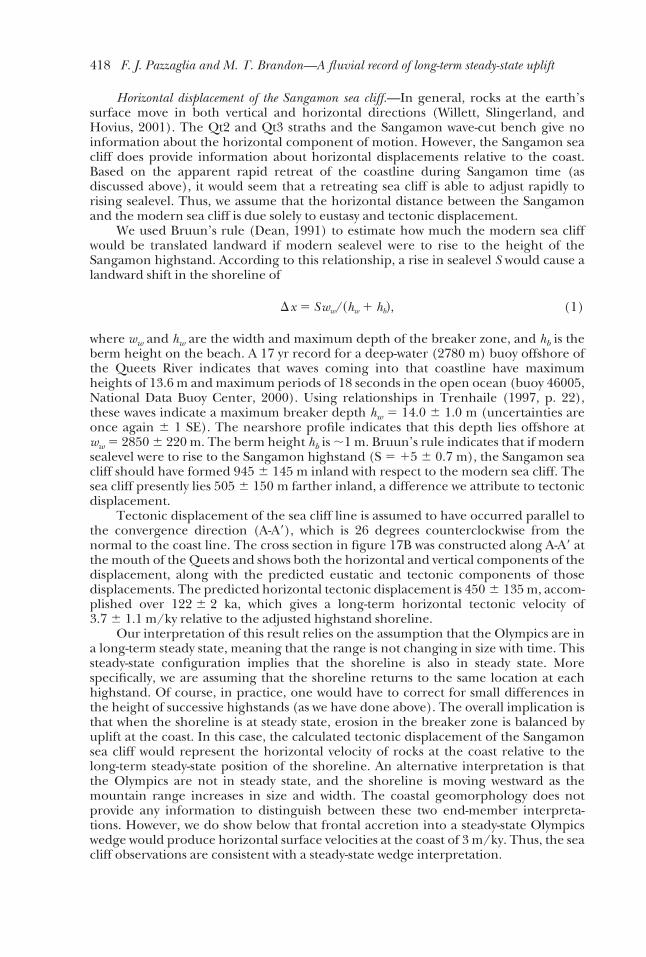
Horizontal displacement of the Sangamon sea cliff.—In general, rocks at the earth’ssurface move in both vertical and horizontal directions (Willett, Slingerland, andHovius, 2001). The Qt2 and Qt3 straths and the Sangamon wave-cut bench give noinformation about the horizontal component of motion. However, the Sangamon seacliff does provide information about horizontal displacements relative to the coast.Based on the apparent rapid retreat of the coastline during Sangamon time (asdiscussed above), it would seem that a retreating sea cliff is able to adjust rapidly torising sealevel. Thus, we assume that the horizontal distance between the Sangamonand the modern sea cliff is due solely to eustasy and tectonic displacement.
We used Bruun’s rule (Dean, 1991) to estimate how much the modern sea cliffwould be translated landward if modern sealevel were to rise to the height of theSangamon highstand. According to this relationship, a rise in sealevel S would cause alandward shift in the shoreline of
Dx 5 Sww/~hw 1 hb!, (1)
where ww and hw are the width and maximum depth of the breaker zone, and hb is theberm height on the beach. A 17 yr record for a deep-water (2780 m) buoy offshore ofthe Queets River indicates that waves coming into that coastline have maximumheights of 13.6 m and maximum periods of 18 seconds in the open ocean (buoy 46005,National Data Buoy Center, 2000). Using relationships in Trenhaile (1997, p. 22),these waves indicate a maximum breaker depth hw 5 14.0 6 1.0 m (uncertainties areonce again 6 1 SE). The nearshore profile indicates that this depth lies offshore atww 5 2850 6 220 m. The berm height hb is ;1 m. Bruun’s rule indicates that if modernsealevel were to rise to the Sangamon highstand (S 5 15 6 0.7 m), the Sangamon seacliff should have formed 945 6 145 m inland with respect to the modern sea cliff. Thesea cliff presently lies 505 6 150 m farther inland, a difference we attribute to tectonicdisplacement.
Tectonic displacement of the sea cliff line is assumed to have occurred parallel tothe convergence direction (A-A9), which is 26 degrees counterclockwise from thenormal to the coast line. The cross section in figure 17B was constructed along A-A9 atthe mouth of the Queets and shows both the horizontal and vertical components of thedisplacement, along with the predicted eustatic and tectonic components of thosedisplacements. The predicted horizontal tectonic displacement is 450 6 135 m, accom-plished over 122 6 2 ka, which gives a long-term horizontal tectonic velocity of3.7 6 1.1 m/ky relative to the adjusted highstand shoreline.
Our interpretation of this result relies on the assumption that the Olympics are ina long-term steady state, meaning that the range is not changing in size with time. Thissteady-state configuration implies that the shoreline is also in steady state. Morespecifically, we are assuming that the shoreline returns to the same location at eachhighstand. Of course, in practice, one would have to correct for small differences inthe height of successive highstands (as we have done above). The overall implication isthat when the shoreline is at steady state, erosion in the breaker zone is balanced byuplift at the coast. In this case, the calculated tectonic displacement of the Sangamonsea cliff would represent the horizontal velocity of rocks at the coast relative to thelong-term steady-state position of the shoreline. An alternative interpretation is thatthe Olympics are not in steady state, and the shoreline is moving westward as themountain range increases in size and width. The coastal geomorphology does notprovide any information to distinguish between these two end-member interpreta-tions. However, we do show below that frontal accretion into a steady-state Olympicswedge would produce horizontal surface velocities at the coast of 3 m/ky. Thus, the seacliff observations are consistent with a steady-state wedge interpretation.
418 F. J. Pazzaglia and M. T. Brandon—A fluvial record of long-term steady-state uplift
discussion
The Qt2 and Qt3 straths show that long-term incision rates in the Clearwaterdrainage increase from ,0.1 m/ky at the coast to ;0.9 m/ky in the upper part of thedrainage. Furthermore, the fossil Sangamon sea cliff indicates that rocks at the mouthof the Queets may be moving to the northeast at ;3.7 m/ky relative to the long-termposition of the highstand shoreline. In this section, we consider how these geomorphicmeasures might relate to actual rock velocities. We examine three specific issues. Thefirst is the relationship between strath height and fluvial incision. The two arecommonly thought to be equal, but this is not the case when horizontal displacementsbecome significant. The second issue concerns the long-held assumption that that ariver valley returns to the same long profile during each phase of strath formation. Ifcorrect, then vertical incision rates should be equal to rock uplift rates. Finally, we use asimple kinematic model to consider how surface velocities, as estimated from ourgeomorphic measurements, relate to regional-scale accretion and deformation of theCascadia wedge.
Strath separation.—Fluvial incision is usually defined to mean the amount ofvertical incision of the river channel. An implicit assumption is that an incised strathhas risen vertically from the river channel, but there is evidence that the bedrockaround the Clearwater may be moving both upward and horizontally to the northeastrelative to the Clearwater River. Thus, what we have really measured is strath separation,which is the vertical height of the strath above the modern channel, without anyreference to the original point of formation in the ancient river channel.
Consider the problem as illustrated in figure 18A. The river channel is taken to beat steady state, with the rate of vertical incision equal to the rate of rock uplift. Thevectors show rock velocities at the surface with u and w indicating the horizontal andvertical components of the velocity vector. The velocity field is assumed to betwo-dimensional and to lie within the x-z plane. The rate of strath separation is given by
w9 5 w 2 gu (2)
where g is the gradient of the river channel after projection into the x-z plane. Thegradient is measured in that plane because the points of the strath are, by definition,moving in that plane.
Figure 18B illustrates the relationship between w9 and w for the case of full frontalaccretion in the Olympics. The surface velocity field is based on a kinematic modelpresented below. For now, it is sufficient to say that frontal accretion tends to producethe largest horizontal velocities within an accreting wedge, so that the differencebetween w9 and w will be maximized for this situation. For the Clearwater, the velocityfield is inferred to parallel section A-A9, so g is determined by projecting the riverchannel into A-A9 (fig. 18B). There is little difference between w and w9 until km 30where the g gets large. Even in this part of the profile, the difference between w and w9is ,10 percent. Thus, in the Clearwater, it seems reasonable to equate w9 with w. Thisconclusion is not universal. For instance, large differences between w9 and w should beexpected in areas where g is large or u . w. Willett, Slingerland, and Hovius (2001)provide a general discussion of this topic in their treatment of advection of topographyin horizontally shortening mountain ranges.
Test of the steady-state assumption.—We show above that the Qt2 and Qt3 strathsrecord similar incision rates (fig. 15). This observation has several important implica-tions: (1) during strath formation, the valley profile appears to be able to quickly reachand maintain a steady-state form; (2) bedrock incision appears to be balanced over thelong term with rates of rock uplift; and (3) tectonic forcing appears to be steady overthe long term as well. These conclusions are interesting given that the river system itselfis relatively unsteady. For example, the terrace sequences record cyclic alternation
419and erosion across the Cascadia forearc high, western Washington State

between incision and aggradation. The steadiness only shows up when we look at timescales longer than a terrace sequence. An analogous situation exists for subductionzones: slip on the subduction thrust occurs episodically during major earthquakes, butthe convergent motion of the plates is steady when averaged over several earthquakecycles.
Here we examine other evidence for long-term steady state that extends beyondthe immediate long profile of the Clearwater River. If our interpretation for asteady-state orogen is correct, then we should see a close correspondence betweenerosion rates and incision rates. Section A-A9 in figure 19 shows a comparison of strathincision rates for Qt2 and Qt3 with long-term erosion rates estimated from apatite
Fig. 18(A) Illustration of how the horizontal and vertical components of the rock velocity vector, u and wrespectively, control w9, the rate of separation of the strath from the river channel. The section is orientedparallel to the rock velocity vector and is defined by coordinate directions x and z. The variable g is thegradient of the channel after projection into the x-z section. (B) Example for the Olympics using theobserved g and estimates for u and w calculated from a kinematic model assuming full frontal accretion(discussed below, see figure 20A for broad details). Full frontal accretion produces the largest horizontalvelocities and should maximize the difference between w and w’. The rock velocity vector is assumed to havea trend parallel to the modern plate convergence direction. The gradient g is measured using the channel asprojected into section A-A’. For the Olympics, there appears to be little difference between w and w9, evenwhen horizontal velocities are large.
420 F. J. Pazzaglia and M. T. Brandon—A fluvial record of long-term steady-state uplift
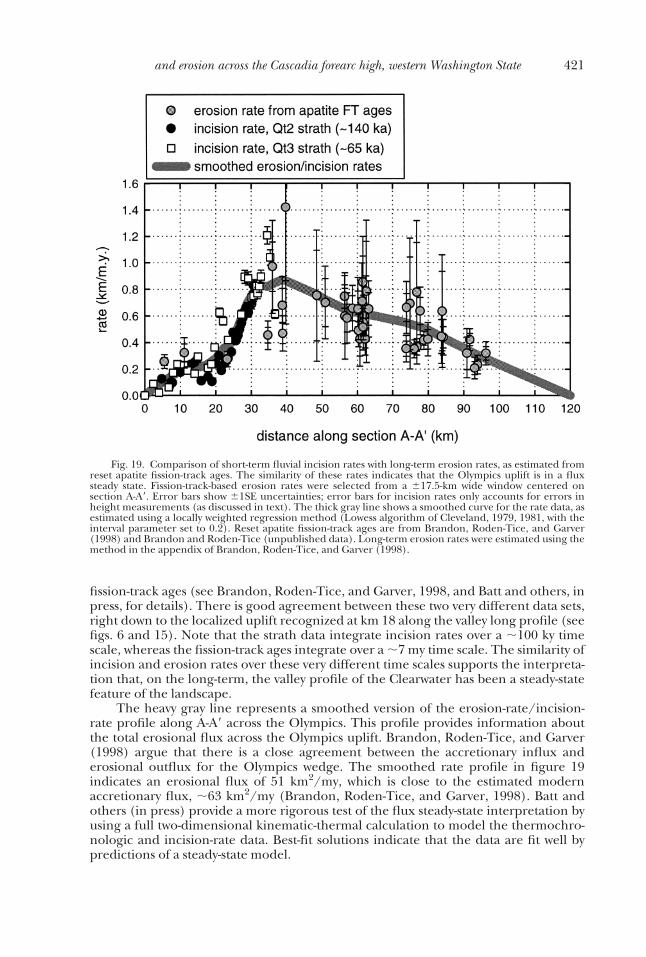
fission-track ages (see Brandon, Roden-Tice, and Garver, 1998, and Batt and others, inpress, for details). There is good agreement between these two very different data sets,right down to the localized uplift recognized at km 18 along the valley long profile (seefigs. 6 and 15). Note that the strath data integrate incision rates over a ;100 ky timescale, whereas the fission-track ages integrate over a ;7 my time scale. The similarity ofincision and erosion rates over these very different time scales supports the interpreta-tion that, on the long-term, the valley profile of the Clearwater has been a steady-statefeature of the landscape.
The heavy gray line represents a smoothed version of the erosion-rate/incision-rate profile along A-A9 across the Olympics. This profile provides information aboutthe total erosional flux across the Olympics uplift. Brandon, Roden-Tice, and Garver(1998) argue that there is a close agreement between the accretionary influx anderosional outflux for the Olympics wedge. The smoothed rate profile in figure 19indicates an erosional flux of 51 km2/my, which is close to the estimated modernaccretionary flux, ;63 km2/my (Brandon, Roden-Tice, and Garver, 1998). Batt andothers (in press) provide a more rigorous test of the flux steady-state interpretation byusing a full two-dimensional kinematic-thermal calculation to model the thermochro-nologic and incision-rate data. Best-fit solutions indicate that the data are fit well bypredictions of a steady-state model.
Fig. 19. Comparison of short-term fluvial incision rates with long-term erosion rates, as estimated fromreset apatite fission-track ages. The similarity of these rates indicates that the Olympics uplift is in a fluxsteady state. Fission-track-based erosion rates were selected from a 617.5-km wide window centered onsection A-A9. Error bars show 61SE uncertainties; error bars for incision rates only accounts for errors inheight measurements (as discussed in text). The thick gray line shows a smoothed curve for the rate data, asestimated using a locally weighted regression method (Lowess algorithm of Cleveland, 1979, 1981, with theinterval parameter set to 0.2). Reset apatite fission-track ages are from Brandon, Roden-Tice, and Garver(1998) and Brandon and Roden-Tice (unpublished data). Long-term erosion rates were estimated using themethod in the appendix of Brandon, Roden-Tice, and Garver (1998).
421and erosion across the Cascadia forearc high, western Washington State

Velocity field beneath the Cascadia forearc high.—If the wedge maintains a long-termsteady-state balance between accretionary and erosional fluxes, then the wedge will notgrow in size. The steady flux through the wedge allows us to construct a simplekinematic model, which we use to illustrate possible velocity fields within the wedge.The details of the model are described in the appendix.
One feature of the model is that it can be used to examine the relative roles ofunderplating and frontal accretion. Examples of predicted velocity fields are given infigure 20. Figure 20A shows a case where all accretion occurs through the front of thewedge (frontal accretion), whereas figure 20B illustrates the case where accretionoccurs solely at the base of the wedge (underplating). Figure 20C has an even mix ofunderplating and frontal accretion. Note that the uplift rate profile (w) is based on thesmoothed incision-rate/erosion-rate curve estimated in figure 19. Thus, all the velocityfields have the same pattern of vertical velocity at the surface. Where they differ is intheir horizontal velocities. The frontal accretion example has the largest horizontalvelocities, whereas the underplating example has zero horizontal velocities.
An important implication is that erosion rates and terrace uplift rates do notprovide any useful information about the horizontal velocities at the wedge surface.Our main source of information about horizontal velocities comes from the translatedSangamon sea cliff. In fact, the frontal accretion example predicts 3 m/ky at the coast,which compares well with the ;3.7 m/ky determined from the sea cliff. We take thismatch as evidence that the Olympic portion of the Cascadia wedge is dominated byfrontal accretion. The modeling of Batt and others (in press) also indicates that thewedge is growing mainly by frontal accretion.
The velocity fields also show the distribution of deformation within the wedge.Note that the deformation shown in the model calculations is steady and permanent.Elastic distortions associated with the earthquake cycle would be superimposed on thissteady deformation. Each example includes a plot of Dxx, the horizontal strain rate atthe surface of the wedge. The horizontal velocity w and horizontal strain rate Dxx aregreatest for pure frontal accretion and zero for pure underplating. Frontal accretiontends to cause larger horizontal strain rates toward the front of the wedge because thewedge is thinner there and because the horizontal flow within the wedge requires somevertical thickening to maintain the steady-state form of the wedge.
We can compare these model calculations with GPS measurements of horizontalvelocities across the Olympics for benchmarks shown in figure 1B (Z. Ning and A.Qamar, written communication, 2001). The data in vector form had directions thatwere withn 620° of the predicted convergence direction for Juan de Fuca relative toNorth America. GPS velocities shown in figure 21 have been projected into the A-A9section and are calculated relative to a fixed point at 0 km along A-A9, which is thereference frame used for our kinematic model. The curve showing long-term horizon-tal velocities comes from the full frontal-accretion model illustrated in Figure 20A. Thiscomparison indicates that long-term horizontal velocities across the Olympics mayaccount for 20 to 35 percent of the geodetically measured horizontal velocities.
Savage, Lisowski, and Prescott (1991) report results from a local strain networkoperated in the eastern Olympics at ;30 km along section A-A9. The network indicatesa maximum shortening direction in the horizontal at 59° 6 6.6° azimuth, which isapproximately parallel to the estimated modern convergence direction at 54°. Thestrain rate in this direction is –0.092 6 0.028 mstrain /yr. In comparison, thepermanent strain predicted at 30 km for pure frontal accretion is –0.01 mstrain/yr. Inthis case, the permanent deformation accounts for only 10 percent of the geodeticallymeasured deformation. Note that the strain network is from the eastern Olympicswhere both permanent and elastic deformations are probably relatively slow.
F. J. Pazzaglia and M. T. Brandon422

Fig. 20. Several solutions for flow fields in the Cascadia wedge across the Olympic Peninsula (sectionA-A’). The flow fields show the average velocity field and displacement paths at the scale of the entire wedge;local heterogeneities, caused by faulting and folding, are assumed to average out at this scale. The solutionsare described in the text and the appendix. (A) The frontal accretion solution assumes that all accretionoccurs at the front of the wedge. (B) The underplating solution assumes accretion entirely by verticalunderplating at the back of the wedge. (C) The mixed solution assumes 50 percent frontal accretion and 50percent underplating. The plots at the top of each cross section show the model estimates for horizontalstrain rate Dxx and the horizontal u and vertical w velocities at the surface of the wedge. The northeast side ofthe wedge is held fixed. Dxx , 0 indicates horizontal shortening, and u , 0, a northeast velocity, and w , 0,upward velocity. The solutions assume a steady-state balance between the accretionary influx and theerosional outflux for the wedge. The vertical surface velocities w are set equal to the smoothed curve forlong-term incision/erosion rates, as shown in figure 19.
concluding remarksOur study uses fluvial geomorphology to measure incision and rock uplift across
the Olympics sector of the Cascadia subduction zone. A well-preserved terrace stratig-raphy in an unglaciated drainage, together with reasonable age control for the terracedeposits, allows us to use the valley profile of the Clearwater as a crude geodetic datum.As such, we are able to look beyond the earthquake cycle, to quantify long-termpatterns of deformation and uplift across the interior of the Olympic Peninsula, wheresealevel is not available as a datum. We summarize 6 major conclusions here.
1. Fluvial terrace sequences in the Olympics appear to be closely tied to the glacialclimate cycle, through its influence on local climate, sediment supply fromadjacent alpine-glaciated drainages, and eustasy. The sequence of terrace-forming events is consistent with the model of Bull (1991), but the timing ofthese events relative to the eustatic cycle is quite different. Bull (1991)proposed that strath formation occurred during rising sealevel and aggrada-tion during falling sealevel. In the Olympics, strath formation appears to occurduring peak glaciation (when sealevel is low) and aggradation, during lateglacial and interglacial times, when sealevel is rising. We suspect that thisdifference is a local effect, related to the strong influence that local deglacia-tion has had on sediment supply and the interaction of that enhancedsediment supply with rising sealevel during the transition to interglacial times.
2. The upstream divergence of straths in the Clearwater provides strong evidencethat uplift is very slow at the coast and increases to a maximum in the center ofthe range. This conclusion runs counter to a commonly invoked assumption in
Fig. 21. Comparison of geodetically measured horizontal velocities and long-term horizontal velocitiesin section A-A9. Geodetic velocities are from GPS measurements collected and analyzed by Z. Ning and A.Qamar (written communication, 2001). Velocities have been projected into the section, which parallels themodern convergence direction, and are referenced to a fixed point at 0 km along the section (northeastcoast of the peninsula). Benchmarks are shown in figure 1B. Long-term horizontal velocities are calculatedfrom the kinematic model, assuming full frontal accretion (fig. 20A). The predicted long-term horizontalvelocities account for 20 to 35 percent of the geodetically-measured horizontal velocities.
424 F. J. Pazzaglia and M. T. Brandon—A fluvial record of long-term steady-state uplift
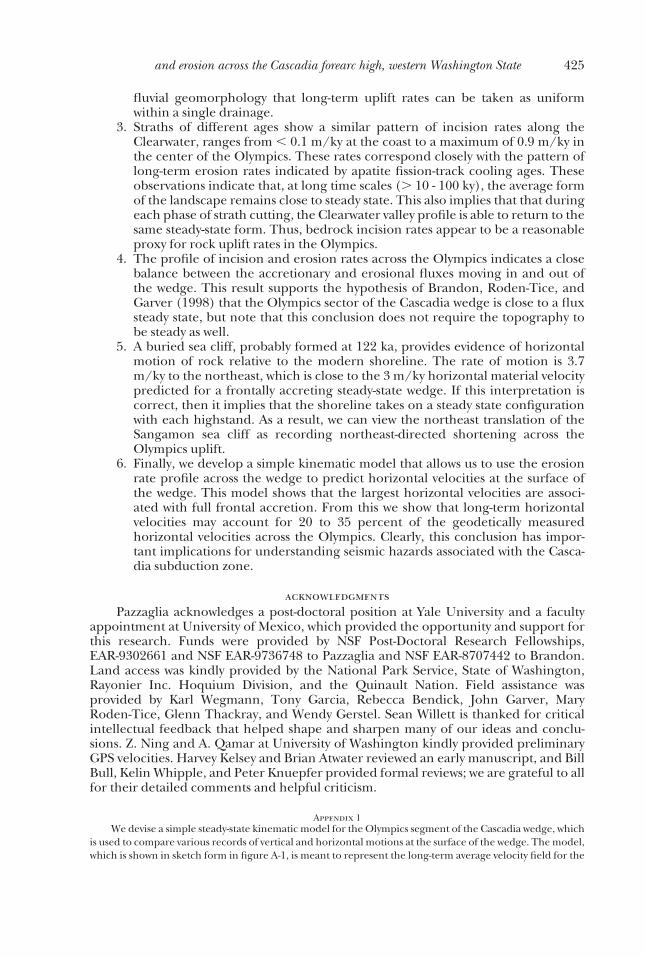
fluvial geomorphology that long-term uplift rates can be taken as uniformwithin a single drainage.
3. Straths of different ages show a similar pattern of incision rates along theClearwater, ranges from , 0.1 m/ky at the coast to a maximum of 0.9 m/ky inthe center of the Olympics. These rates correspond closely with the pattern oflong-term erosion rates indicated by apatite fission-track cooling ages. Theseobservations indicate that, at long time scales (. 10 - 100 ky), the average formof the landscape remains close to steady state. This also implies that that duringeach phase of strath cutting, the Clearwater valley profile is able to return to thesame steady-state form. Thus, bedrock incision rates appear to be a reasonableproxy for rock uplift rates in the Olympics.
4. The profile of incision and erosion rates across the Olympics indicates a closebalance between the accretionary and erosional fluxes moving in and out ofthe wedge. This result supports the hypothesis of Brandon, Roden-Tice, andGarver (1998) that the Olympics sector of the Cascadia wedge is close to a fluxsteady state, but note that this conclusion does not require the topography tobe steady as well.
5. A buried sea cliff, probably formed at 122 ka, provides evidence of horizontalmotion of rock relative to the modern shoreline. The rate of motion is 3.7m/ky to the northeast, which is close to the 3 m/ky horizontal material velocitypredicted for a frontally accreting steady-state wedge. If this interpretation iscorrect, then it implies that the shoreline takes on a steady state configurationwith each highstand. As a result, we can view the northeast translation of theSangamon sea cliff as recording northeast-directed shortening across theOlympics uplift.
6. Finally, we develop a simple kinematic model that allows us to use the erosionrate profile across the wedge to predict horizontal velocities at the surface ofthe wedge. This model shows that the largest horizontal velocities are associ-ated with full frontal accretion. From this we show that long-term horizontalvelocities may account for 20 to 35 percent of the geodetically measuredhorizontal velocities across the Olympics. Clearly, this conclusion has impor-tant implications for understanding seismic hazards associated with the Casca-dia subduction zone.
acknowledgmentsPazzaglia acknowledges a post-doctoral position at Yale University and a faculty
appointment at University of Mexico, which provided the opportunity and support forthis research. Funds were provided by NSF Post-Doctoral Research Fellowships,EAR-9302661 and NSF EAR-9736748 to Pazzaglia and NSF EAR-8707442 to Brandon.Land access was kindly provided by the National Park Service, State of Washington,Rayonier Inc. Hoquium Division, and the Quinault Nation. Field assistance wasprovided by Karl Wegmann, Tony Garcia, Rebecca Bendick, John Garver, MaryRoden-Tice, Glenn Thackray, and Wendy Gerstel. Sean Willett is thanked for criticalintellectual feedback that helped shape and sharpen many of our ideas and conclu-sions. Z. Ning and A. Qamar at University of Washington kindly provided preliminaryGPS velocities. Harvey Kelsey and Brian Atwater reviewed an early manuscript, and BillBull, Kelin Whipple, and Peter Knuepfer provided formal reviews; we are grateful to allfor their detailed comments and helpful criticism.
Appendix 1We devise a simple steady-state kinematic model for the Olympics segment of the Cascadia wedge, which
is used to compare various records of vertical and horizontal motions at the surface of the wedge. The model,which is shown in sketch form in figure A-1, is meant to represent the long-term average velocity field for the
425and erosion across the Cascadia forearc high, western Washington State

wedge. Following Brandon, Roden-Tice, and Garver (1998) and the results summarized here, we assume thatthe velocity field has been two dimensional (that is, plane strain) and steady over a time scale of at leastseveral million years. The rocks that make up the wedge are assumed to have negligible compressibility.
Thus, the continuity equation requires thatux
5 2wz
, where position is described by x and z, and velocity is
defined by
u 5dxdt
and w 5dzdt
.
Velocities are specified relative to the back of the wedge, which is defined by the eastern limit of theOlympic Mountains, where topography drops to sealevel at the west side of Puget Sound. Velocities are set tozero there, as indicated by u(0, z) 5 w(0, z) 5 0. Vertical velocities at the surface of the wedge are defined by
w~x, 0! 5 2e~x!, (A-1)
where e(x) is the long-term erosional flux through the top of the wedge section. For our calculations, we usethe best-fit estimate of e(x) shown in figure 19. For accretionary fluxes into the wedge, we use two end-member cases to defined a continuum of possibilities: (1) frontal accretion where the influx of materialoccurs entirely through the front of the wedge, and (2) underplating accretion, where the influx is limited tothe base of the wedge. The specifics of these two accretionary options are given below but note that thesteady-state condition specifies that the accretionary influx is equal to the erosional outflux. We assume thatthere is no flux through the back of the wedge, which is consistent with evidence that the east side of theOlympics uplift has not advanced eastward relative to Puget Sound. The onset of accretion into the back sideof the wedge would be indicated by east-vergent imbricate faulting within a low-taper wedge front (Willett,Beaumont, and Fullsack, 1993).
We consider the velocity field within a domain that extends from the east side of the Olympics uplift atx 5 0 to the shelf edge at x 5 170 km and extends from the surface of the wedge to the subducting Juan deFuca slab. Following Brandon and Calderwood (1990), we define the top of the slab by h(x) 5 h0 2 x tan u,with ho 5 38 km and u 5 9.4° (fig. A-1).
We make a simplying assumption that the vertical gradient in the horizontal component of the velocity
field can be ignored for our problem, so thatuz
5 0. This approach, which has been used in other types of
kinematic modeling (Holt and Haines, 1995), is reasonable because we are mainly interested in exploringthe general relationship at the surface of the wedge between the vertical velocity component as recorded bystrath uplift and erosional fluxes, and the horizontal velocity component as recorded by the offset sea cliff
Fig. A1. Layout for the kinematic model, with x indicating distance along A-A9 from an origin located atthe back of the wedge (northeast coast of the Olympic Peninsula) and z indicating depth. The west coast liesat x 5 120 km, and the shelf edge at x 5 170 km. The position of the base of the wedge is based on thedistribution of Benioff zone seismicity, which is inferred to occur mainly in the uppermost mantle of the Juande Fuca plate (Brandon and Calderwood, 1990). The model calculation produces velocity fields that areconsistent with observed erosion rates «(x) at the surface of the wedge (upper plot), as given in figure 19.Horizontal and vertical velocities, u and w respectively, are relative to a fixed point at the origin.
426 F. J. Pazzaglia and M. T. Brandon—A fluvial record of long-term steady-state uplift
and by geodetic measurements. The physical sense of this assumption is that beneath every point at thesurface, horizontal velocities are represented by a single vertical-averaged value, so that u(x,z) 5 u(x,0).
For frontal accretion alone, the erosional flux out of the top of the wedge between the origin and xmust be balanced by an accretionary flux into the wedge crossing the vertical boundary beneath x, which isspecified by *0
x e(x)dx 5 2h(x)u(x,0). This relationship can be recast to give,
u~x,z!F 521h~x!E
0
x
e~x!dx, (A-2)
where the subscript F indicates that the horizontal velocity is for frontal accretion alone. The continuityequation indicates that
Ew(x,0)
w(x,z)
dw 5 2E0
z ux
dz.
Substitution of A-1 and A-2 gives the vertical velocity for frontal accretion alone,
w~x,z!F 5 F1 1z
h(x)Ge~x! 1z tan u
h2~x!E
0
x
e~x!dx. (A-3)
The end-member case for accretion by underplating is represented here by
u~x,z!B 5 0, (A-4)
and
w~x,z!B 5 e~x). (A-5)
The subscript B indicates that these velocities are due to underplating alone. The underlying assumption forthese equations is that the erosion-rate profile mimics the underlying pattern of underplating; motion onlyoccurs in the vertical direction, resulting in a vertically-shearing velocity field.
Cases intermediate between underplating and frontal accretion can be specified by a combination ofthe two end-member velocity fields,
u~x,z! 5 a u~x,z!F 1 ~1 2 a!u~x,z!B, (A-6)
and
w~x,z! 5 a w ~x,z!F 1 ~1 2 a!w ~x,z!B, (A-7)
where a indicates the proportion of frontal accretion relative to total accretion.
The velocity field given by A-6 and A-7 can be used to calculate the horizontal strain rate Dxx 5ux
,
which is used in the text to compare model results to short-term horizontal strain rates measured by Savage,Lisowski, and Prescott (1991). The two end-member velocity fields used here were selected, in part, torepresent a maximum range of horizontal velocities and horizontal strain rates. The horizontal velocities andstrain rates for the underplating velocity field (A-4, -5) are everywhere zero, whereas the frontal accretionvelocity field (A-2, -3) has the largest possible horizontal velocities and shortening rates.
references
Adams, J., 1984, Active deformation of the Pacific Northwest continental margin: Tectonics, v. 3, p. 449–472.Anderson, R. S., Densmore, A. L., and Ellis, M. A., 1999, The generation and degradation of marine terraces:
Drainage Research, v. 11, p. 7–19.Armentrout, J. M., 1981, Correlation and ages of Cenozoic chronostratigraphic units in Oregon and
Washington, in Armentrout, J. M., editor, Pacific Northwest Cenozoic biostratigraphy: GeologicalSociety of America Special Paper 184, p. 137–148.
Atwater, B. F., 1987, Evidence for great Holocene earthquakes along the outer coast of Washington State:Science, v. 236, p. 942–944.
–––––– 1996, Coastal evidence for great earthquakes in western Washington, in Rogers, A. M., Walsh, T. J.,Kockelman, W. J., and Priest, G. R., editors, Assessing earthquake hazards and reducing risk in thePacific Northwest; Volume 1.: United States Geological Survey Professional Paper 1560, p. 77–90.
427and erosion across the Cascadia forearc high, western Washington State
Batt, G. E., Brandon, M. T., Farley, K. A., and Roden-Tice, M., in press, Tectonic synthesis of the OlympicMountains segment of the Cascadia wedge, using 2-D thermal and kinematic modeling of isotopic ages:Journal of Geophysical Research.
Beaumont, C., Ellis, S., and Pfiffner, A., 1999, Dynamics of subduction-accretion at convergent margins:Short-term modes, long-term deformation, and tectonic implications: Journal of Geophysical Research,v. 104, p. 17,573–17,602.
Bigelow, P. K., ms, 1987, The petrology, stratigraphy and drainage history of the Montesano Formation,southwestern Washington and Southern Olympic Peninsula: M.S. thesis, Western Washington Univer-sity, Bellingham, Washington, 263 p.
Bockheim, J., G., Kelsey, H. M., and Marshall, J. G., III., 1992, Soil development, relative dating, andcorrelation of late Quaternary marine terraces in southwestern Oregon: Quaternary Research, v. 37,p. 60–74.
Brandon, M. T., 1996, Probability density plots for fission-track grain age distributions: Radiation Measure-ments, v. 26, p. 663–676.
Brandon, M. T., and Calderwood, A. R., 1990, High-pressure metamorphism and uplift of the Olympicsubduction complex: Geology, v. 18, p. 1252–1255.
Brandon, M. T., Roden-Tice, M. K., and Garver, J. I., 1998, Late Cenozoic exhumation of the Cascadiaaccretionary wedge in the Olympic Mountains, northwest Washington State: Geological Society ofAmerica Bulletin, v. 110, p. 985–1009.
Brandon, M. T., and Vance, J. A., 1992, Tectonic evolution of the Cenozoic Olympic subduction complex,Washington State, as deduced from fission track ages for detrital zircons: American Journal of Science,v. 292, p. 565–636.
Bucknam, R. C., Hemphill-Haley, E., and Leopold, E. B., 1992, Abrupt uplift within the past 1700 years atsouthern Puget Sound, Washington: Science, v. 258, p. 1611–1614.
Bull, W. B., 1991, Geomorphic response to climatic change: New York, Oxford University Press, 326 p.Burbank, D. W., Leland, J., Fielding, E., Anderson, R. S., Brozovic, N., Reid, M. R., and Duncan, C., 1996,
Bedrock incision, rock uplift and threshold hillslopes in the northwestern Himalayas: Nature, v. 379,p. 505–510.
Byrne, D., Wang, W., and Davis, D., 1993, Mechanical role of backstops in the growth of forearcs: Tectonics,v. 12, no. 1, p. 123–144.
Campbell, K. A. and Nesbitt, E. A., 2000, High resolution architecture and paleoecology of an active margin,storm-flood influenced estuary, Quinault Formation (Pliocene), Washington: Palaios, v. 15, n. 6,p. 553–579.
Chappell, J., Omura, A., Esat, T., McCulloch, M., Pandolfi, J., Ota, Y., and Pillans, B., 1996, Reconciliation oflate Quaternary sealevels derived from coral terraces at Huon Peninsula with deep sea oxygen isotoperecords: Earth and Planetary Science Letters, v. 141, p. 227–236.
Chinn, T., 1981, Use of rock weathering-rind thickness for Holocene absolute age-dating in New Zealand:Arctic and Alpine Research, v. 13, p. 33–45.
Cleveland, W. S., 1979, Robust locally weighted regression and smoothing scatterplots: Journal of theAmerican Statistics Association, v. 74, p. 829–836.
–––––– 1981, LOWESS: A program for smoothing scatterplots by robust locally weighted regression: AmericanStatistician, v. 35, p. 54.
Clowes, R. M., Brandon, M. T., Green, A. C., Yorath, C. J., Sutherland Brown, A., Kanasewich, E. R., andSpencer, C., 1987, LITHOPROBE - southern Vancouver Island: Cenozoic subduction complex imagedby deep seismic reflections: Canadian Journal of Earth Sciences, v. 24, p. 31–51.
Colman, S. M. and Pierce, K., 1981, Weathering rinds on andesitic and basaltic stones as a Quaternary ageindicator, western United States: United States Geological Survey Professional Paper 1210, 56 p.
–––––– 1986, Glacial sequence near McCall, Idaho; weathering rinds, soil development, morphology, andother relative-age criteria: Quaternary Research, v. 25, p. 25–42.
Crandell, D. R., 1964, Pleistocene glaciations of the southwestern Olympic Peninsula, Washington: UnitedStates Geological Survey Professional Paper 501-B, p. B135–B139.
–––––– 1965, The glacial history of western Washington and Oregon, in Wright, H.E., and Frey, D.G., editors,The Quaternary of the United States: Princeton, New Jersey, Princeton University Press, p. 341–353.
Crosson, R. S., and Owens, T. J., 1987, Slab geometry of the Cascadia subduction zone beneath Washingtonfrom earthquake hypocenters and teleseismic converted waves: Geophysical Research Letters, v. 14,p. 824–827.
Darienzo, M. E. and Peterson, C. D., 1990, Episodic tectonic subsidence of late Holocene salt marshes,northern Oregon coast, central Cascadia margin, U.S.A.: Tectonics, v. 9, p. 1–22.
Daly, C., and Taylor, G., 1998, Washington Average Monthly or Annual Precipitation, 1961-90, Available:http://www.ocs.orst.edu/prism/prism_new.html; also published by: Water and Climate Center of the NaturalResources Conservation Service, Portland, Oregon.
Dean, R., 1991, Equilibrium beach profiles: Characteristics and Applications: Journal of Coastal Research,v. 7, no. 1, p. 53–84.
DeMets, C., and Dixon, T., 1999, New kinematic models for Pacific-North America motion from 3 Ma topresent; I, Evidence for steady motion and biases in the NUVEL-1A model: Geophysical ResearchLetters, v. 26, no. 13, p. 1921–1924.
DeMets, C., Gordon, R. G., Argus, D. F., and Stein, S., 1990, Current plate motions: Geophysical JournalInternational, v. 101, p. 425–478.
Dragert, H., 1987, The fall (and rise) of central Vancouver Island: 1930-1985: Geological Survey of CanadaContribution 10586, p.689–697.
428 F. J. Pazzaglia and M. T. Brandon—A fluvial record of long-term steady-state uplift

Dragert, H., Hyndman, R. D., Rogers, G. C., and Wang, K., 1994, Current deformation and the width of theseismogenic zone of the northern Cascadia subduction thrust: Journal of Geophysical Research B, v. 99,p. 653–668.
Easterbrook, D. J., 1986, Stratigraphy and chronology of Quaternary deposits of the Puget lowlandand Olympic Mountains of Washington and the Cascade Mountains of Washington and Oregon,in Sibrava, V., Bowen, D.Q., and Richmond, G.M., editors, Quaternary glaciations in the northernhemisphere: Quaternary Science Reviews, v. 5, p. 145–159.
Florer, L. E., 1972, Quaternary paleoecology and stratigraphy of the sea cliffs, western Olympic Peninsula,Washington: Quaternary Research, v. 2, p. 202–216.
Fuller, I. C., Macklin, M. G., Lewin, J., Passmore, D. G., and Wintle, A. G., 1998, River response tohigh-frequency climate oscillations in southern Europe over the past 200 k.y.: Geology, v. 26, p. 275–278.
Heusser, C. J., 1964, Palynology of four bog sections from the western Olympic Peninsula, Washington:Ecology, v. 45, p. 23–40.
–––––– 1972, Palynology and phytogeographical significance of a late Pleistocene refugium near Kalaloch,Washington: Quaternary Research, v. 2, p. 189–201.
–––––– 1973, Environmental sequence following the Fraser advance of the Juan de Fuca lobe, Washington:Quaternary Research, v. 3, p. 284–306.
–––––– 1974, Quaternary vegetation, climate, and glaciation of the Hoh River Valley, Washington: GeologicalSociety of American Bulletin, v. 85, p. 1547–1560.
–––––– 1978, Palynology of Quaternary deposits of the lower Bogachiel River area, Olympic Peninsula,Washington: Canadian Journal of Earth Sciences, v. 15, p. 1568–1578.
Holdahl, S. R., Faucher, F., and Dragert, H., 1989, Contemporary vertical crustal motion in the Pacificnorthwest, in Cohen, S. C. and Vanicek, P., editors, Slow deformation and transmission of stress in theearth: American Geophysical Union, Geophysical Monograph 40, International Union of Geodesy andGeophysics Volume 4, p. 17–29.
Holt, W. E., and Haines, A. J., 1995, The kinematics of northern South Island, New Zealand, determinedfrom geologic strain rates: Journal of Geophysical Research, v.100, p. 17991–18010.
Hovius, N., 2000, Macro-scale process systems of mountain belt erosion, in Summerfield, M. A., editor,Geomorphology and Global Tectonics: London, John Wiley and Sons, p. 77–105.
Hyndman, R. D., and Wang, K., 1993, Thermal constraints on the zone of major thrust earthquake failure:the Cascadia subduction zone: Journal of Geophysical Research, v. 98, p. 2039–2060.
James, T. D., Clague, J. J., Wang, K., and Hutchinson, I., 2000, Post-glacial rebound at the northern Cascadiasubduction zone: Quaternary Science Reviews, v. 19, p. 1527–1541.
Kelsey, H. M., 1990, Late Quaternary deformation of marine terraces on the Cascadia subduction zone nearCape Blanco, Oregon: Tectonics, v.9, p. 983–1014.
Kelsey, H. M. and Bockheim, J. G., 1994, Coastal landscape evolution as a function of eustasy and surfaceuplift rate, Cascadia margin, southern Oregon: Geological Society of America Bulletin, v. 106,p. 840–854.
Knox, J. C., 1975, Concept of the graded stream, in Melhorn, W. N. and Flemal, R. C., editors, Theories ofLandform Development, Proceedings of the 6th Geomorphology Symposium, Publications in Geomor-phology: Binghamton, State University of New York at Binghamton, p. 169–198.
Knuepfer, P. L. K., 1988, Estimating ages of late Quaternary stream terraces from analysis of weathering rindsand soils: Geological Society of America Bulletin, v. 100, p. 1224–1236.
Koons, P., 1990, Two-sided orogen; collision and erosion from the sandbox to the Southern Alps, NewZealand: Geology, v. 18, p. 679–682.
Lajoie, K. R., 1986, Coastal tectonics, in Wallace, R. E. editor, Active Tectonics: Washington, D.C., NationalAcademy of Sciences, p. 95–124.
Leopold, L. B. and Bull, W. B., 1979, Base level, aggradation, and grade: Proceedings of the AmericanPhilosophical Society, v. 123, p. 168–202.
McCrory, P. A., 1996, Tectonic model explaining divergent contraction directions along the Cascadiasubduction margin, Washington: Geology, v. 24, p. 929–932.
–––––– 1997, Evidence for Quaternary tectonism along the Washington Coast: Washington Geology, v. 25,p. 14–19.
McNeill, L., Piper, K., Goldfinger, C., Kulm, L., and Yeats, R., 1997, Listric normal faulting on the Cascadiacontinental margin: Journal of Geophysical Research B, v. 102, p. 12,123–12,138.
McNeill, L. C., Goldfinger, C., Kulm, L. D., Yeats, R. S., 2000, Tectonics of the Neogene Cascadia forearcdrainage; investigations of a deformed late Miocene unconformity: Geological Society of AmericaBulletin, v. 112, p. 1209–1224.
Mackin, J. H., 1948, Concept of the graded river: Geological Society of America Bulletin, v. 59, p. 463–512.McSaveney, M., 1992, A manual of weathering-rind dating for sandstone clasts of the Torlesse Supergroup:
Geological Society of New Zealand Miscellaneous Publication 63A, 106 p.Maddy, D., 1997, Uplift-driven valley incision and river terrace formation in southern England: Journal of
Quaternary Science, v. 12, p. 539–545.Mitchell, C. E., Vincent, P., Weldon R. J., and Richards, M., 1994, Present-day vertical deformation of the
Cascadia margin, Pacific Northwest, U.S.A.: Journal of Geophysical Research B, v. 99, p. 12,257–12,277.Moore, J. L., ms, 1965, Surficial geology of southwestern Olympic Peninsula: M.S. thesis, University of
Washington, Seattle, Washington, 63 p.Muhs, D. R., 1992, The last interglacial-glacial transition in North America: Evidence from uranium-series
dating of coastal deposits, in Clark, K. P., and Lea, P. D., editors, The Last Interglacial-Glacial Transitionin North America, Geological Society of America Special Paper, p. 31–51.
429and erosion across the Cascadia forearc high, western Washington State

National Data Buoy Center, 2000, Station Information, U.S. Northwest Region. http://seaboard.ndbc.noaa.gov/stuff/northwest/nwstmap.shtml
Orange, D. L., 1990, Criteria helpful in recognizing shear-zone and diapiric melanges: Examples from theHoh accretionary complex, Olympic Peninsula, Washington: Geological Society of America Bulletin,v. 102, p. 935–951.
Ouchi, S., 1985, Response of alluvial rivers to slow active tectonic movements: Geological Society of AmericaBulletin, v. 96, p. 504–515.
Palmer, S. P., and Lingley, W. S., Jr., 1989, An assessment of the oil and gas potential of the Washington outercontinental shelf: University of Washington, Washington Sea Grant Program, p. 83.
Parsons, T., Trehu, A. M., Luetgert, J. H., Miller, K. C., Kilbride, F., Wells, R. E., Fisher, M. A., Flueh, E. R., tenBrink, U. S., Christensen, N. I., 1998, A new view into the Cascadia subduction zone and volcanic arc;implications for earthquake hazards along the Washington margin: Geology, v. 26, no. 3, p. 199–202.
Pazzaglia, F. J., Gardner, T. W., and Merritts, D., 1998, Bedrock fluvial incision and longitudinal profiledevelopment over geologic time scales determined by fluvial terraces, in Wohl E. and Tinkler, K.,editors, Rivers over rock, Fluvial Processes in Bedrock Channels: American Geophysical Union,Geophysical Monograph Series, 107, p. 207–236.
Personius, S. F., 1995, Late Quaternary stream incision and uplift in the forearc of the Cascadia subductionzone, western Oregon: Journal of Geophysical Research B, v. 100, p. 20,193–20,210.
Pillans, B., Chappell, J., and Naish, T. R., 1998, A review of the Milankovitch climatic beat: template forPlio-Pleistocene sea-level changes and sequence stratigraphy: Sedimentary Geology, v. 122, p. 5–21.
Porter, S. C., Pierce, K. L., and Hamilton, T. D., 1983, Late Wisconsin mountainous glaciation in the WesternUnited States, in Wright, H. E., editor, Late Quaternary Environments of the United States, Volume 1,The Late Pleistocene: Minneapolis, University of Minnesota Press, p. 71–114.
Posamentier, H. W., Jervey, M. T., and Vail, P. R., 1988, Eustatic controls on clastic deposition; I, Conceptualframework, in Wilgus Cheryl, K., Hastings Bruce, S., Ross Charles, A., Posamentier Henry, W., VanWagoner, J., and Kendall Christopher, G. S. C., editors, Sea-level changes; an integrated approach.:Special Publication - Society of Economic Paleontologists and Mineralogists: Tulsa, Oklahoma, UnitedStates, SEPM (Society for Sedimentary Geology), p. 109–124.
Rau, W. W., 1970, Foraminifera, stratigraphy, and paleoecology of the Quinault Formation, Point Grenville-Raft River coastal area, Washington: Washington Department of Natural Resources Bulletin, v. 62, 34 p.
–––––– 1973, Geology of the Washington coast between Point Grenville and the Hoh River: WashingtonDepartment of Natural Resources, Geology and Earth Resources Division Bulletin 66, 58 p.
–––––– 1975, Geologic map of the Destruction Island and Taholah quadrangles, Washington: WashingtonDepartment of Natural Resources, Geology and Earth Resources Division Map GM-13, scale 1:62,500.
–––––– 1979, Geologic map in the vicinity of the lower Bogachiel and Hoh River valleys and the Washingtoncoast: Department of Natural Resources, Geology and Earth Resources Division Map GM-24, scale1:62,500.
Rau, W. W., and Grocock, G., 1974, Piercement structure outcrops along the Washington coast: State ofWashington, Department of Natural Resources, Division of Mines and Geology, Information Circular,v. 51, 7 p.
Reilinger, R. and Adams, J., 1982, Geodetic evidence for active landward tilting of the Oregon andWashington Coastal ranges: Geophysical Research Letters, v. 9, p. 401–403.
Ricker, K., Chinn, T., and McSaveney, M., 1993, A late Quaternary moraine sequence dated by rockweathering rinds, Craigieburn Range, New Zealand: Canadian Journal of Earth Sciences, v. 30,p. 1861–1869.
Rogers, G. C., 1988, An assessment of megathrust earthquake potential of the Cascadia subduction zone:Canadian Journal of Earth Science, v. 25, p. 844–852.
Saunders, I.R., Clague, J.J., and Roberts, M.C., 1987, Deglaciation of the Chilliwack River valley, BritishColumbia: Canadian Journal of Earth Science, v. 24, p. 915–923.
Savage, J. C., Lisowski, M., and Prescott, W. H., 1981, Geodetic strain measurements in Washington: Journalof Geophysical Research B, v. 86, p. 4929–4940.
–––––– 1991, Strain accumulation in western Washington: Journal of Geophysical Research B, v. 96,p. 14,493–14,507.
Schumm, S. A., 1969, River metamorphosis: Proceedings of the American Society of Civil Engineers, Journalof the Hydraulics Division, v. 95, p. 255–273.
–––––– 1973, Geomorphic thresholds and complex response of drainage systems, in Morisawa, M., editor,Fluvial Geomorphology: Proceedings of the 4th Geomorphology Symposium, Publications in Geomor-phology: Binghamton, State University of New York at Binghamton, p. 299–310.
Schumm, S. A., Dumont, J. F., and Holbrook, J. M., 2000, Active tectonics and alluvial rivers: Cambridge,United Kingdom, Cambridge University Press, 276 p.
Schumm, S. A. and Lichty, R. W., 1965, Time, space, and causality in geomorphology: American Journal ofScience, v. 263, p. 110–119.
Soil Survey Staff, 1975, Soil Taxonomy: A basic system of soil classification for making and interpreting soilsurveys: United States Department of Agriculture Handbook 436, 754 p.
Tabor, R. W. and Cady, W. M., 1978a, Geologic Map of the Olympic Peninsula: United States GeologicalSurvey Map I-994, 2 sheets, scale 1:125,000.
–––––– 1978b, The structure of the Olympic Mountains, Washington - analysis of a subduction zone: UnitedStates Geological Survey Professional Paper 1033, 38 p.
430 F. J. Pazzaglia and M. T. Brandon—A fluvial record of long-term steady-state uplift
Thackray, G. D., ms, 1996, Glaciation and neotectonic deformation on the western Olympic Peninsula,Washington: Ph.D. dissertation, University of Washington, Seattle, Washington, 139 p.
–––––– 1998, Convergent-margin deformation of Pleistocene strata on the Olympic coast of Washington,USA, in Stewart, I. S. and Vita-Finzi, C., editors, Coastal Tectonics: London, Geological Society SpecialPublication 146, p. 199–211.
–––––– 2001, Extensive Early and Middle Wisconsin glaciation on the western Olympic Peninsula, Washing-ton, and the variability of Pacific moisture delivery to the northwestern United States: QuaternaryResearch, v. 55, p. 257–270.
Thackray, G. D. and Pazzaglia, F. J., 1994, Quaternary stratigraphy, tectonic geomorphology, and fluvialevolution of the western Olympic Peninsula, Washington, in Swanson, D.A., and Haugerud, R.A.,editors, Geologic field trips in the Pacific Northwest, 1994 Geological Society of America AnnualMeeting, Seattle, Washington, p. 2A-1 - 2A-30.
Thorson, R. M., 1989, Glacio-isostatic response of the Puget Sound area, Washington: Geological Society ofAmerica Bulletin, v. 101, p. 1163–1174.
Trenhaile, A., 1997, Coastal Dynamics and Landforms: Oxford, Clarendon Press, 366 p.von Huene, R., 1998, Forearc highs and backstop structure, Eos, Transactions, American Geophysical
Union, v. 79, p. F917.von Huene, R., D. Klaeschen, M. Gutscher, and J. Fruehn, 1998, Mass and fluid flux during accretion at the
Alaskan margin: Geological Society of America Bulletin, v. 110, p. 468–482.Washington State Department of Transportation, 1988, Queets River Bridge Replacement: Geotechnical
Report SR101, L-8287, C.S. 1601, No. 101/204 Replacement.Wegmann, K., ms, 1999, Tectonic geomorphology of the Clearwater River drainage, Olympic Peninsula,
Washington: M.S. thesis, Albuquerque, University of New Mexico, 217 p.Weldon, R. J., ms, 1986, Late Cenozoic geology of Cajon Pass; implications for tectonics and sedimentation
along the San Andreas fault:Ph.D. dissertation, California Institute of Technology, Pasadena, California,400 p.
West, D. O., and McCrumb, D. R., 1988, Coastline uplift in Oregon and Washington and the nature ofCascadia subduction zone tectonics: Geology, v. 16, p. 169–172.
Willett, S., 1999, Orogeny and orography: The effects of erosion on the structure of mountain belts: Journalof Geophysical Research v. 104, p. 28,957–28,981.
Willett, S., Beaumont, C., and Fullsack, P., 1993, Mechanical models for the tectonics of doubly vergentcompressional orogens: Geology, v. 21, p. 371–374.
Willett, S. D., Slingerland, R., and Hovius, N., 2001, Uplift, shortening, and steady state topography in activemountain belts: American Journal of Science, v. 301, p.
Yeats, R. S., Graven, E. P., Werner, K. S., Goldfinger, C., and Popowski, T. A., 1996, Tectonics of theWillamette Valley, Oregon, in Rogers, A. M., Walsh, T. J., Kockelman, W. J., and Priest, G. R., editors,Assessing earthquake hazards and reducing risk in the Pacific Northwest; Volume 1.: United StatesGeological Survey Professional Paper 1560, p.
431and erosion across the Cascadia forearc high, western Washington State