A Fixed Platform Topside Piping System Strength Analysis...
9
American Journal of Civil Engineering 2016; 4(5): 216-224 http://www.sciencepublishinggroup.com/j/ajce doi: 10.11648/j.ajce.20160405.12 ISSN: 2330-8729 (Print); ISSN: 2330-8737 (Online) A Fixed Platform Topside Piping System Strength Analysis Under Dynamic Pigging/Slugging Loads Zhongwei Li 1, * , Heng Gu 2 1 Department of Naval Architecture and Marine Engineering, University of New Orleans, New Orleans, LA, USA 2 Rexa Inc, West Bridgewater, MA, USA Email address: [email protected] (Zhongwei Li) * Corresponding author To cite this article: Zhongwei Li, Heng Gu. A Fixed Platform Topside Piping System Strength Analysis Under Dynamic Pigging/Slugging Loads. American Journal of Civil Engineering. Vol. 4, No. 5, 2016, pp. 216-224. doi: 10.11648/j.ajce.20160405.12 Received: June 12, 2016; Accepted: July 16, 2016; Published: July 19, 2016 Abstract: This paper presents the strength analysis of a fixed platform topside piping system under dynamic pigging/slugging load. Flow assurance analysis by using OLGA provided the flow history in each pipe. Then the dynamic loads at each pipe elbow were added by time sequence onto ANSYS model. The analysis has shown overstressed region under new pigging/slugging loads and proposed modification plan to reduce the stress. Keywords: Fixed Platform Topside, Piping, Pigging, Slugging, Dynamic Load, Flow Assurance, Finite Element Analysis 1. Introduction Pigging operations are required from the fixed platform topside piping operations. The pigging generated slugs boarding the platform may cause piping vibrations when they flow through the bends. There have been various studies on pipe vibration during operation including pigging/slugging process. Direct measurement of the vibration is costly and restricted (Maekawa, 2014). CFD analysis is also very difficult (Xiao, 2015). Numerical analysis (Persson, 2015) is reliable and easier to achieve than analytical solution (Santos, 2015). Therefore FEA is a suitable tool for pipe vibration analysis during pigging/slugging process. Computer aided simulation has been widely adopted in various field like energy (Cai, 2013), material (Zhang, 2015), physics (Liu, 2016), structural strength (He, 2016), fatigue (Zhang, 2013) and crack (Zhang, 2014). Structural strength is important for engineering system. There has been intensive research for aluminum (Zhang, 2009), polymer (Wang, 2015) and composite (Liu, 2014). The mechanical forces on the piping were analyzed consistent with BP document GP 41-20 “Design for Multiphase Flow”, with forces applied from a dynamic simulation of the pigging slugging from Olga Simulations at 1-second data intervals for the critical slugging period. Based on the analysis, piping modifications consisting of the addition of two braces to the Mahogany B piping have been recommended. As the detailed fluid hold-up varied during the simulation, and coupling between fluid and the piping could not be assessed with OLGA and ANSYS Mechanical due to model limitations, the overall fluid density was changed from 10% to 90% in the ANSYS Mechanical finite element model analysis and the change in the response was analyzed. The natural response of the system showed the higher fluid density reduced the system piping stress. As the final design is predicted to be safe with minimal fluid mass in the pipe, the conclusion is the piping will be adequate to overcome the excessive stresses for pigging runs regardless of liquid hold up at a recommended flow rate of 2 m/s (150 MM scfd pigging gas rate), providing the recommended modifications are made. 2. Flow Assurance Study 2.1. Purpose Flow assurance analysis performed the activities listed below: Prepare a schematic of the piping configuration and incorporate the data into an OLGA model of the topsides
Transcript of A Fixed Platform Topside Piping System Strength Analysis...
American Journal of Civil Engineering 2016; 4(5): 216-224
http://www.sciencepublishinggroup.com/j/ajce
doi: 10.11648/j.ajce.20160405.12
ISSN: 2330-8729 (Print); ISSN: 2330-8737 (Online)
A Fixed Platform Topside Piping System Strength Analysis Under Dynamic Pigging/Slugging Loads
Zhongwei Li1, *
, Heng Gu2
1Department of Naval Architecture and Marine Engineering, University of New Orleans, New Orleans, LA, USA 2Rexa Inc, West Bridgewater, MA, USA
Email address: [email protected] (Zhongwei Li) *Corresponding author
To cite this article: Zhongwei Li, Heng Gu. A Fixed Platform Topside Piping System Strength Analysis Under Dynamic Pigging/Slugging Loads. American
Journal of Civil Engineering. Vol. 4, No. 5, 2016, pp. 216-224. doi: 10.11648/j.ajce.20160405.12
Received: June 12, 2016; Accepted: July 16, 2016; Published: July 19, 2016
Abstract: This paper presents the strength analysis of a fixed platform topside piping system under dynamic
pigging/slugging load. Flow assurance analysis by using OLGA provided the flow history in each pipe. Then the dynamic
loads at each pipe elbow were added by time sequence onto ANSYS model. The analysis has shown overstressed region under
new pigging/slugging loads and proposed modification plan to reduce the stress.
Keywords: Fixed Platform Topside, Piping, Pigging, Slugging, Dynamic Load, Flow Assurance, Finite Element Analysis
1. Introduction
Pigging operations are required from the fixed platform
topside piping operations. The pigging generated slugs
boarding the platform may cause piping vibrations when they
flow through the bends.
There have been various studies on pipe vibration during
operation including pigging/slugging process. Direct
measurement of the vibration is costly and restricted
(Maekawa, 2014). CFD analysis is also very difficult (Xiao,
2015). Numerical analysis (Persson, 2015) is reliable and
easier to achieve than analytical solution (Santos, 2015).
Therefore FEA is a suitable tool for pipe vibration analysis
during pigging/slugging process.
Computer aided simulation has been widely adopted in
various field like energy (Cai, 2013), material (Zhang, 2015),
physics (Liu, 2016), structural strength (He, 2016), fatigue
(Zhang, 2013) and crack (Zhang, 2014).
Structural strength is important for engineering system.
There has been intensive research for aluminum (Zhang,
2009), polymer (Wang, 2015) and composite (Liu, 2014).
The mechanical forces on the piping were analyzed
consistent with BP document GP 41-20 “Design for
Multiphase Flow”, with forces applied from a dynamic
simulation of the pigging slugging from Olga Simulations at
1-second data intervals for the critical slugging period.
Based on the analysis, piping modifications consisting of
the addition of two braces to the Mahogany B piping have
been recommended.
As the detailed fluid hold-up varied during the simulation,
and coupling between fluid and the piping could not be
assessed with OLGA and ANSYS Mechanical due to model
limitations, the overall fluid density was changed from 10%
to 90% in the ANSYS Mechanical finite element model
analysis and the change in the response was analyzed.
The natural response of the system showed the higher fluid
density reduced the system piping stress. As the final design is
predicted to be safe with minimal fluid mass in the pipe, the
conclusion is the piping will be adequate to overcome the
excessive stresses for pigging runs regardless of liquid hold up
at a recommended flow rate of 2 m/s (150 MM scfd pigging
gas rate), providing the recommended modifications are made.
2. Flow Assurance Study
2.1. Purpose
Flow assurance analysis performed the activities listed
below:
Prepare a schematic of the piping configuration and
incorporate the data into an OLGA model of the topsides
American Journal of Civil Engineering 2016; 4(5): 216-224 217
piping system potentially associated with routine pigging.
The piping was converted to equivalent hydraulic lengths to
account for frictional loss and predict flow rates through the
flow split around the separator using equivalent length values
from API 14E, “Recommended Practice for Design of
Offshore Piping Systems” 1991 Ed.
Determine the pressure, liquid velocity and liquid/gas
density profiles for the platform topsides pipework during the
pigging operation.
Run pigging operation simulations for three flow scenarios:
100MMscfd, 150MMscfd and 300MMscfd.
Identify maximum liquid velocity in the topsides piping
during the pigging operation.
Provide velocity, density and time profile data to piping
engineers for stress analysis.
2.2. Details
The key objective initially identified was to determine the
maximum velocity / force that the topsides piping would have
to withstand during the pigging operation.
Subsequently, after feedback from the piping engineers,
dynamic profiles were supplied to allow dynamic analysis of
the piping response by rerunning the simulation of the 150
MMscfd case for the 10 minute period with maximum fluid
velocities in 1 second intervals.
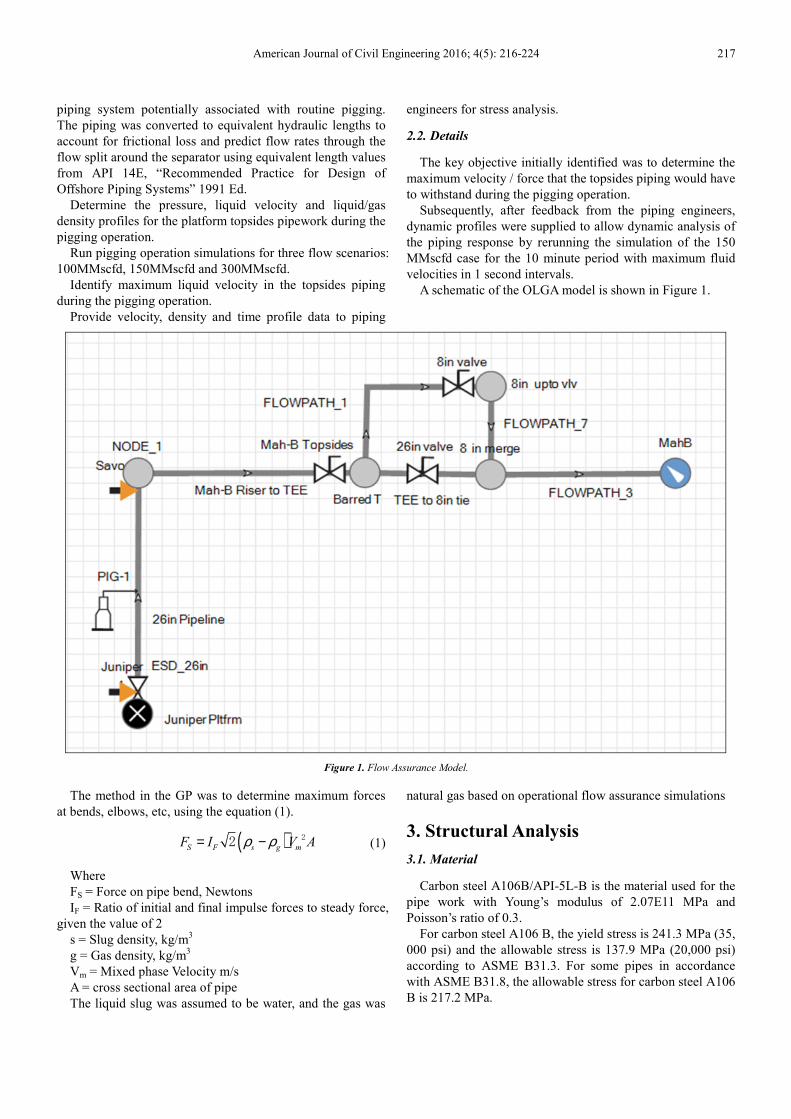
A schematic of the OLGA model is shown in Figure 1.
Figure 1. Flow Assurance Model.
The method in the GP was to determine maximum forces
at bends, elbows, etc, using the equation (1).
( )S F s g mF I V Aρ ρ= − 2
2 (1)
Where
FS = Force on pipe bend, Newtons
IF = Ratio of initial and final impulse forces to steady force,
given the value of 2
s = Slug density, kg/m3
g = Gas density, kg/m3
Vm = Mixed phase Velocity m/s
A = cross sectional area of pipe
The liquid slug was assumed to be water, and the gas was
natural gas based on operational flow assurance simulations
3. Structural Analysis
3.1. Material
Carbon steel A106B/API-5L-B is the material used for the
pipe work with Young’s modulus of 2.07E11 MPa and
Poisson’s ratio of 0.3.
For carbon steel A106 B, the yield stress is 241.3 MPa (35,
000 psi) and the allowable stress is 137.9 MPa (20,000 psi)
according to ASME B31.3. For some pipes in accordance
with ASME B31.8, the allowable stress for carbon steel A106
B is 217.2 MPa.

218 Zhongwei Li and Heng Gu: A Fixed Platform Topside Piping System Strength Analysis
Under Dynamic Pigging/Slugging Loads
Figure 2. Piping System ANSYS Model.
3.2. Boundary Conditions of FE Analysis – Pipe Support
Pipe supports are in accordance with construction isometric
drawings and Fluor Specification for Piping Standard Details
FBPS-65-PI-03. Figure 2 displays the restraints applied on the
ANSYS FE model. The blue colored supports provide
translational restrictions, while the orange colored supports
provide rotational restrictions.
3.3. Structural Model
The ANSYS model of the piping system is shown in
Figure 2.
3.4. Structural Loads
Flow assurance provided the gas and liquid velocity along
pipe length of Case 2 (150 MMScfd average pigging rate) at
1 second-intervals. Only the data from the time period with
maximum velocities have been used because the peak
velocities are significantly higher than the velocities outside
of this time period. The maximum velocities of different
pipes are listed in Table 1.
Table 1. Slug Flow Peak Velocity.
Line Number Line Size (inch) Density (Kg/m3) Velocity (m/s)
1100 26 1000 8
1102 26 1000 8
1103 20 N/A N/A
1106 16 1000 42
1107 8 1000 9
1028 24 1000 10
The forces on bends and tees due to slug flow can be
calculated by Equation (1).
Notice that the maximum fluid velocity, presented in Table
1, doesn’t always appear at pipe bend location. The fluid
velocity also changes with time. The forces on bends and tees
are calculated based on the time history of fluid velocity
including the local maximum velocity at that location.
Figure 3. Fluid velocity in flowpath 3 at 8469 s.
The maximum flow was predicted to occur within the
entrance of 16 inch diameter pipe that was downstream of a
26 inch diameter segment for the fluid. Figure 3 and Figure 4
show the fluid velocity along the equivalent length of this
flowpath 3 (including 26 inch, followed by the 16 inch and
the 24 inch pipes) at time point 8469 s and 8475 s
respectively. Although the maximum velocity is 42 m/s when
time is 8475 s, the location of the maximum velocity is not at
a pipe bend. The maximum velocity at the 16 inch pipe bend
location is 26 m/s when time is 8469 s.

American Journal of Civil Engineering 2016; 4(5): 216-224 219
Figure 4. Fluid velocity in flowpath 3 at 8475 s.
Figure 5 shows the fluid velocity time history at that 16
inch pipe bend. It can be seen that the maximum velocity is
26 m/s at 8469 s. Correspondingly, the maximum slug force
at the bend is also at 8469 s and is calculated by the fluid
velocity of 26 m/s.
Figure 5. Fluid velocity time history at 16 inch pipe bend.
The forces applied at the bend at all time points are
calculated based on the fluid velocity time history. Therefore
the load at each bend and tee changes at every second in
accordance with the velocity data from the flow assurance
analysis.
The 16 inch pipe bend total force time history
corresponding to the velocity time history of Figure 5 is shown
in Figure 6 as an example. The calculation uses above formula.
When the maximum velocity is 25.859 m/s, the calculated
total force is 196303 N for the 16 inch pipe.
Figure 6. Slug force time history at 16 inch pipe bend.
Table 2 shows the calculated slug force applied at each node
of ANSYS FE model. Each node in the first column is related
with an elbow or tee of the piping system. Some of the nodes
have been marked in Figure 7. For every node (elbow or tee)
in Table 2 there is time varying slug flow velocity like Figure 6.
Correspondingly each node has time varying slug force
calculated from the velocity like Figure 5.
Table 2. Slug Force at Time = 8485 s.
Node Number OD (in) Thk (in) Velocity (m/s) Total Force (N) Direction
3193 8.65 0.5 4.61 1786.28 Fx, Fz
3185 8.65 0.5 4.16 1449.53 Fx, Fz
3177 8.65 0.5 2.67 598.42 Fx, Fz
3169 8.65 0.5 3.60 1084.17 Fy, Fz
3161 8.65 0.5 3.94 1301.43 Fy, Fz
2128 8.65 0.5 4.20 1482.77 Fy, Fz
2138 8.65 0.5 4.61 1778.86 Fx, Fy
1617 26 1.25 3.00 7127.56 Fx, Fz
1609 26 1.25 2.36 4408.95 Fy, Fz
1603 26 1.25 3.47 9517.46 Fy, Fz
1599 26 1.25 4.21 14012.22 Fy, Fz
1764 26 1.25 4.26 14331.72 Fx, Fz
1677 16 0.844 12.79 47984.88 Fx, Fz
1681 16 0.844 9.22 24960.29 Fx, Fz
1687 16 0.844 8.66 22027.71 Fx, Fy
589 16 0.844 8.52 21327.95 Fx, Fy
581 16 0.844 8.61 21741.30 Fx, Fy
573 16 0.844 8.66 22037.89 Fx, Fy
138 16 0.844 10.05 29627.11 Fx
549 24 1.219 5.07 17115.43 Fy, Fz
557 24 1.219 5.65 21269.73 Fy, Fz
160 24 1.219 2.33 3630.42 Fy
220 Zhongwei Li and Heng Gu: A Fixed Platform Topside Piping System Strength Analysis
Under Dynamic Pigging/Slugging Loads
The slugging load case has very limited occurrence during
pipe operation. In the analysis only dynamic forces due to
slugging are considered. Constant loads (e.g. due to pressure
and self-weight) are not included for this special case.
The structural damping is assumed to be 1%. The primary
effect of the damping is to control the decay of the response
after the initial step response. The influence of damping ratio
over maximum stress level is negligible.
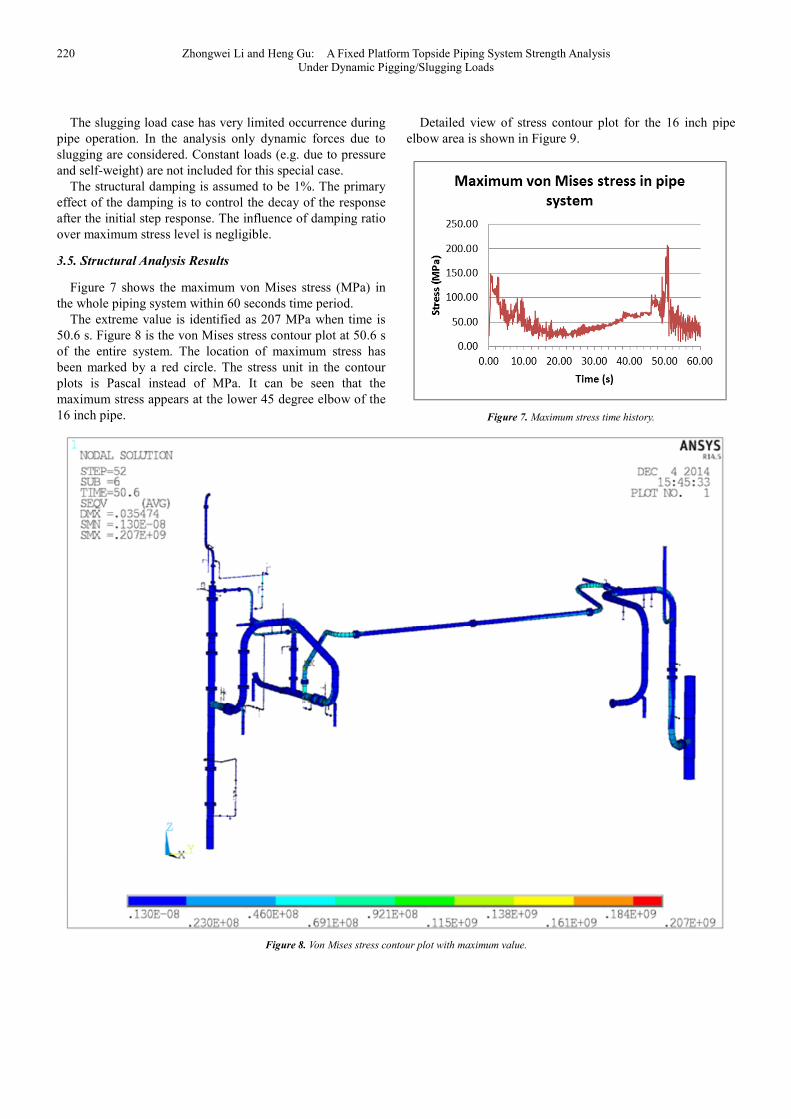
3.5. Structural Analysis Results
Figure 7 shows the maximum von Mises stress (MPa) in
the whole piping system within 60 seconds time period.
The extreme value is identified as 207 MPa when time is
50.6 s. Figure 8 is the von Mises stress contour plot at 50.6 s
of the entire system. The location of maximum stress has
been marked by a red circle. The stress unit in the contour
plots is Pascal instead of MPa. It can be seen that the
maximum stress appears at the lower 45 degree elbow of the
16 inch pipe.
Detailed view of stress contour plot for the 16 inch pipe
elbow area is shown in Figure 9.
Figure 7. Maximum stress time history.
Figure 8. Von Mises stress contour plot with maximum value.

American Journal of Civil Engineering 2016; 4(5): 216-224 221
Figure 9. Detailed view of the area with maximum von Mises stress.
Figure 10 shows the time history of the maximum von
Mises stress for the two elements at the elbow location in
Figure 9.
Figure 10. Maximum von Mises stress time history of two bend elements.
It can be seen that stress level at this elbow exceeds the
allowable stress 137 MPa at various time points. Therefore
necessary modification is needed in order to reduce the stress
during pigging process.
Stress contour plots and time history plots of other locations
with high stress are listed in the Appendix.
3.6. Analysis Results After Recommendations
Based on the analysis results, following measures are
recommended in order to reduce the pipe stress due to
slugging flow:
� Add North/South direction restraint (5G2 ATTACH N/S)
at existing 26 inch elbow support 5G2.
� Add North/South direction restraint (5G2 ATTACH N/S)
at existing pipe support 5G1-09 of 16 inch pipe.
Figure 11 shows the maximum von Mises stress in the
whole system during 60 seconds period with above the
recommended modifications. It can be seen that the stress
level is well below allowable stress 137 MPa.
Figure 11. Maximum pipe stress time history with recommended
modifications.
4. Conclusion
This paper presents the process of the strength analysis
of a platform topside piping system during
pigging/slugging. The flow assurance analysis by OLGA
calculated the velocity history in each pipe. Then the time
history of forces was applied at each elbow/bend of the
ANSYS structural model. By performing transient analysis,
the von Mises stress time history was obtained. The
maximum stress of the original design structures has
exceeded the allowable limit. Therefore modifications by
adding more supports are proposed. With the
recommended modifications, the maximum stress of the
piping system during pigging/slugging process will be
within the limit.

222 Zhongwei Li and Heng Gu: A Fixed Platform Topside Piping System Strength Analysis
Under Dynamic Pigging/Slugging Loads
Appendix
Figure 12. 16 inch pipe von Mises stress.
Figure 13. 8 inch pipe von Mises stress.

American Journal of Civil Engineering 2016; 4(5): 216-224 223
Figure 14. 16 inch pipe elbow stress time history.
Figure 15. 8 inch pipe elbow stress time history.
Figure 16. 20 inch pipe von Mises stress.
Figure 17. 2 inch pipe von Mises stress.

224 Zhongwei Li and Heng Gu: A Fixed Platform Topside Piping System Strength Analysis
Under Dynamic Pigging/Slugging Loads
Figure 18. 20 inch pipe elbow stress time history.
Figure 19. 2 inch pipe elbow stress time history.
References
[1] ANSYS. User’s Manual, Version 15.0, 2013.
[2] ASME, B31.3 Process Piping Design, 2012.
[3] ASME, B31.8 Gas Transmission and Distribution Piping Systems, 2012.
[4] BP, Designing for Multiphase Flow, BP Group Practice 41-20, 2013.
[5] W. Cai, LL. Gouveia. Modeling and Simulation of Maximum Power Point Tracker in Ptolemy. Journal of Clean Energy Technologies, 2013.
[6] J. Cordell, Pipeline Pigging Handbook, 3rd Ed., Clarion Technical Publishers, 2003.
[7] N. Dowling, Mechanical Behavior of Materials, 4th ed., 2012.
[8] J. Gong and W.Z. Wang, Offshore Oil and Gas Mixed Transportation Pipeline Flow Assurance, Science Press: 2016.
[9] J. He, F.G. Yuan. Lamb wave-based subwavelength damage imaging using the DORT-MUSIC technique in metallic plates. Structural Health Monitoring, 2016.
[10] Y. Liu. Nanoscale Thermal Transport at Graphene-Soft Material Interfaces. Doctoral dissertation, Virginia Polytechnic Institute and State University, 2016.
[11] Y. Liu, J. Huang, B. Yang, B.G. Sumpter, R. Qiao. Duality of the interfacial thermal conductance in graphene-based nanocomposites. Carbon, 2014.
[12] A. Maekawa, et al, Development of noncontact measurement methods using multiple laser displacement sensors for bending and torsional vibration stresses in piping systems, International Journal of Pressure Vessels and Piping, v 137, p 38-45, Elsevier, 2014.
[13] E. Naudascher and D. Rockwell, Flow-Induced Vibrations: An Engineering Guide, Dover Publications, 2005.
[14] Oil and Gas Pipeline Flow Assurance Technology, Petroleum Industry Press: 2010.
[15] OLGA User’s Manual, Version 7, 2014.
[16] P. Persson, et al., Numerical study of reduction in vibrations induced by water-pipe system, Dynamics of Civil Structures - Proceedings of the 33rd IMAC, A Conference and Exposition on Structural Dynamics, 2015.
[17] H. Santos, et al., Development of a simplified methodology for evaluation of piping vibration due to multi-phase flow, ASME 2015 Pressure Vessels and Piping Conference, PVP 2015.
[18] J. Tiratsoo, Pipeline Pigging and Integrity Technology, 4th Ed., Clarion Technical Conferences LLC, 2013.
[19] L. Wang, Y. Ding. Creating micro-structured hydrogel-forming polymer films by photopolymerization in an evaporating solvent: Compositional and morphological evolutions. European Polymer Journal, 2015.
[20] F. Xiao, et al., CFD simulation of vortex-induced vibrations of free span pipelines including pipe-soil interactions, Proceedings of the 25th International Ocean and Polar Engineering Conference, ISOPE 2015.
[21] J. Zhang, J. Gu, L. Li, Y. Huan and B. Wei. Bonding of alumina and metal using bulk metallic glass forming alloy. International Journal of Modern Physics B, 2009.
[22] J. Zhang, J. Johnston, A. Chattopadhyay. Physics‐based multiscale damage criterion for fatigue crack prediction in aluminium alloy. Fatigue & Fracture of Engineering Materials & Structures, 2014.
[23] J. Zhang, B. Koo, N. Subramanian, Y. Liu, A. Chattopadhyay. An optimized cross-linked network model to simulate the linear elastic material response of a smart polymer. Journal of Intelligent Material Systems and Structures, 2015.
[24] J. Zhang, K. Liu, C. Luo, A. Chattopadhyay. Crack initiation and fatigue life prediction on aluminum lug joints using statistical volume element–based multiscale modeling. Journal of Intelligent Material Systems and Structures, 2013.