A FIRE ANALYSIS TOOL REVISITED - · PDF filecompartments and the horns themselves are of a...
26
A FIRE ANALYSIS TOOL REVISITED ACOUSTIC SOOT AGGLOMERATION IN RESIDENTIAL SMOKE ALARMS Patrick M. Kennedy, CFEI, CFPS Kathryn C. Kennedy, CFEI Gregory E. Gorbett, CFEI August, 2003 July, 2004 Investigations Institute 857 Tallevast Road Sarasota, FL 34243 Telephone: 941-351-6409 Facsimile: 941-351-5849 Interflam 2004 10 th International Engineering Conference Edinburgh, Scotland July 4-7. 2004
Transcript of A FIRE ANALYSIS TOOL REVISITED - · PDF filecompartments and the horns themselves are of a...

A FIRE ANALYSIS TOOL REVISITED
ACOUSTIC SOOT
AGGLOMERATION IN RESIDENTIAL SMOKE
ALARMS
Patrick M. Kennedy, CFEI, CFPS Kathryn C. Kennedy, CFEI
Gregory E. Gorbett, CFEI
August, 2003 July, 2004
Investigations Institute 857 Tallevast Road Sarasota, FL 34243 Telephone: 941-351-6409 Facsimile: 941-351-5849
Interflam 200410th International Engineering
ConferenceEdinburgh, Scotland
July 4-7. 2004

A FIRE ANALYSIS TOOL - REVISITED ACOUSTIC SOOT AGGLOMERATION IN RESIDENTIAL SMOKE ALARMS PATRICK M. KENNEDY, CFEI, CFPS KATHRYN C. KENNEDY, CFEI GREGORY E. GORBETT, CFEI John A. Kennedy & Associates, Inc. Fire and Explosion Analysis Experts 857 Tallevast Road Sarasota, Florida 34243 Abstract In modern fire incident analysis and the litigations that frequently follow from them, it is often of great importance to know whether a particular smoke alarm operated during a fire event. Like so many other issues involving the interpretation of fire analysis data, some scientifically verifiable means of determining if a given smoke alarm had activated properly was needed. Best would be some identifiable physical evidence of smoke alarm activation. As early as 1996, it had been put forward that the presence of enhanced soot patterns on fire event exposed smoke alarms was a useable method of determining that a particular smoke alarm had or had not properly activated. Research first published in 1999 and later updated research published in 2001 began to scientifically address the issue. Building on that earlier research, this paper produces additional research particularly focusing on the production of acoustic soot agglomeration patterns in both ionization and photo-electric single station residential smoke alarms. Producing new test data, and combining that with previously reported data, this research work concludes that the presence or absence of acoustic soot agglomeration patterns on smoke detectors exposed to sooty smoke atmospheres was in fact a viable fire analysis tool. Introduction Since the early 1970s, single station smoke alarms, both 9-volt battery and 120-volt AC powered, have been the chief fire protection device in most homes and residential occupancies. Over the ensuing years, the early fire warning that these devices have provided to potential fire victims has saved thousands of lives. In household settings it is clear that a well-functioning smoke alarm is the most important fire safety innovation ever. The National Fire Protection Association (NFPA) estimates that 94% of U.S. homes have at least one smoke alarm today, and most states have laws requiring them in residential dwellings.1 Millions of people have come to rely upon the residential smoke alarm as their primary fire safety resource. The NFPA also reports that in three of every ten reported fires in homes equipped with smoke alarms, the devices did not work. Households with non-working smoke alarms now outnumber those with no smoke alarms.2
A Fire Analysis Tool Revisited – Acoustic Soot Agglomeration in Residential Smoke Detectors Page 2
© Copyright 2003, Investigations Institute, Patrick M. Kennedy
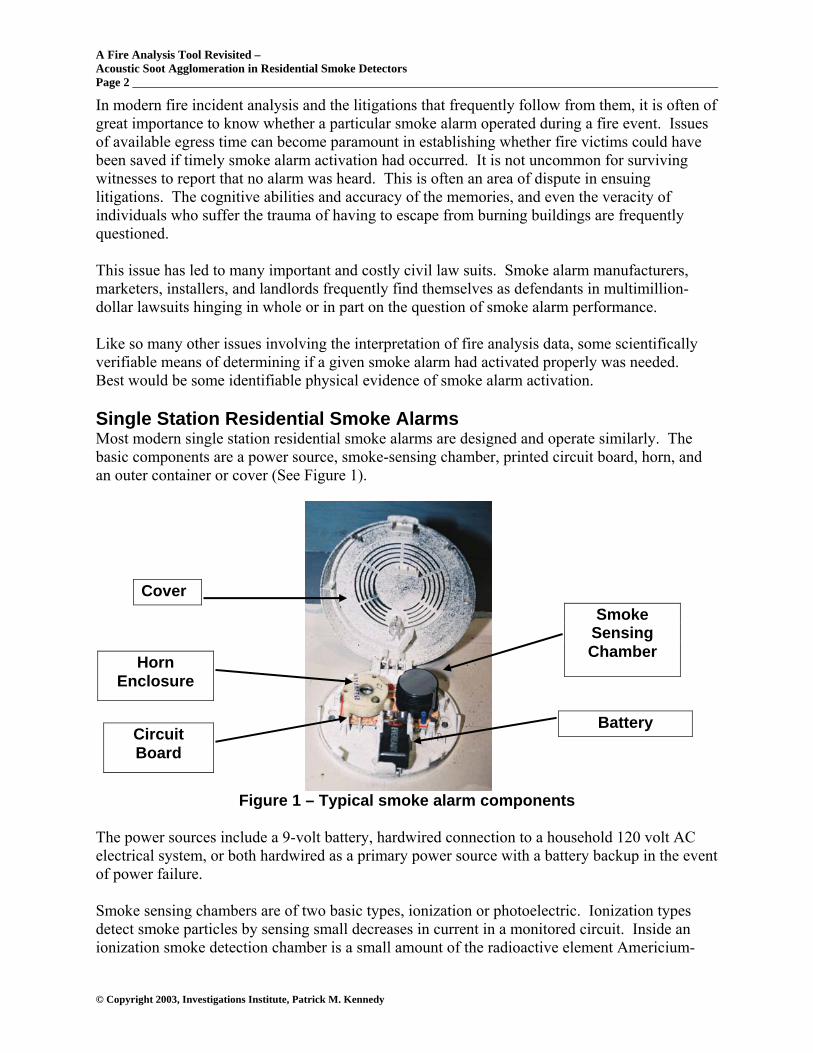
In modern fire incident analysis and the litigations that frequently follow from them, it is often of great importance to know whether a particular smoke alarm operated during a fire event. Issues of available egress time can become paramount in establishing whether fire victims could have been saved if timely smoke alarm activation had occurred. It is not uncommon for surviving witnesses to report that no alarm was heard. This is often an area of dispute in ensuing litigations. The cognitive abilities and accuracy of the memories, and even the veracity of individuals who suffer the trauma of having to escape from burning buildings are frequently questioned. This issue has led to many important and costly civil law suits. Smoke alarm manufacturers, marketers, installers, and landlords frequently find themselves as defendants in multimillion-dollar lawsuits hinging in whole or in part on the question of smoke alarm performance. Like so many other issues involving the interpretation of fire analysis data, some scientifically verifiable means of determining if a given smoke alarm had activated properly was needed. Best would be some identifiable physical evidence of smoke alarm activation. Single Station Residential Smoke Alarms Most modern single station residential smoke alarms are designed and operate similarly. The basic components are a power source, smoke-sensing chamber, printed circuit board, horn, and an outer container or cover (See Figure 1).
Figure 1 – Typical smoke alarm components The power sources include a 9-volt battery, hardwired connection to a household 120 volt AC electrical system, or both hardwired as a primary power source with a battery backup in the event of power failure. Smoke sensing chambers are of two basic types, ionization or photoelectric. Ionization types detect smoke particles by sensing small decreases in current in a monitored circuit. Inside an ionization smoke detection chamber is a small amount of the radioactive element Americium-
Cover
Horn Enclosure
Circuit Board
Smoke Sensing Chamber
Battery
A Fire Analysis Tool Revisited – Acoustic Soot Agglomeration in Residential Smoke Detectors Page 3
© Copyright 2003, Investigations Institute, Patrick M. Kennedy
241. The alpha-radiation from this material ionizes the oxygen and nitrogen atoms of the air between two parallel plate electrodes. The detector senses the small amount of electrical current that flows between these plates. When smoke enters the ionization smoke detection chamber, it disrupts this current and the smoke alarm senses the drop in current between the plates and sends an alarm signal to the horn. Photoelectric types detect smoke particles by sensing small increases in current in a monitored photoelectric cell. Inside the photoelectric smoke sensing chamber there is a small light source and a light sensitive sensor. They are positioned at right angles from one another, so that the light source does not normally illuminate the photo sensor. When smoke enters the chamber, however, the smoke particles scatter the light and some amount of light hits the sensor. This creates a small increased current flow and the smoke alarm senses the increased current and sends an alarm signal to the horn. Some more up-to-date smoke alarms are available with dual (ionization and photoelectric) sensor systems. Underwriters Laboratories3 sets the Visible Smoke Obscuration Limits within which a smoke alarm must activate at 0.5 – 4.0% / ft. Most smoke alarms on the market today list their smoke obscuration sensitivity between 0.64% / ft. ! 0.14% / ft. and 2.08% / ft. !1.23% / ft. The majority of smoke alarms have their sensitivities the area of 1.1% / ft. !0.4% / ft. The printed circuit boards contain the circuitry for power input connections (either pigtail connections for AC or battery connection terminals for 9 volt operation), smoke detection chamber operation, alarm activation, low battery (no power) alert, the test button function, temporary alarm deactivation warning, escape or test light circuits, and LED indicator light. The actual smoke detection chambers and horn assemblies are often attached to the circuit boards themselves as well. Modern smoke alarm horns are small ~1.25” diameter stainless steel disks. They are frequently, but not always, enclosed in molded thermoplastic compartments, which have small (0.43” and 0.375”) central openings that serve as sound outlets. In some older model smoke alarms the horn compartments and the horns themselves are of a brass alloy. Some horn enclosures have additional smaller openings. The horn is activated by electrical current that causes the horn disk to vibrate at frequencies up to ~4000 hz, depending upon which function the circuitry is calling for (full alarm, low battery warning, temporary alarm deactivation warning). The outer covers and bases of modern smoke alarms are constructed of thermoplastics. They are capable of melting and deforming at elevated temperatures. UL 217 section 62.2 sets the maximum temperature to which smoke alarm thermoplastic components must maintain their shapes at 194° F. (90° C).4 Our testing disclosed an initial softening temperature of a representative smoke alarm cover at 199° F. (93° C), initial softening of the plastic horn compartment at 250° F. (121° C), and smoke sensing chamber plastic components at 351° F. (177° C). Among the various manufactures there are many minor design differences, but virtually every manufacturer’s smoke alarm covers contain some arrangement of grillwork or other opening for smoke entrance, for alarm sound exit, and an opening for a test button and or alarm condition

A Fire Analysis Tool Revisited – Acoustic Soot Agglomeration in Residential Smoke Detectors Page 4
© Copyright 2003, Investigations Institute, Patrick M. Kennedy
LED indicator light. Most smoke alarms are basically designed as a squat cylinder in shape with outside diameters ranging from ~5.0” to ~5.5” and heights from ~1.25” to ~1.5.” They are all designed to be installed in the ceilings of rooms not closer than 4” from the sidewalls or on sidewalls not less than 4” nor more than 12” down from the ceiling.5 Background in Previous Research In 1999 Munger produced his doctoral thesis on residential smoke alarms.6 Prior to that time he had become aware of theories put forward by some smoke alarm manufacturer’s defense experts that the presence of certain soot patterns (Chladni Figures) on alarm horn disk plates could be used as proof that a particular alarm had sounded.7 As part of his doctoral dissertation research, Munger conducted an experiment in which he placed six smoke alarms, (three energized and three de-energized) in a “smoke box” and exposed them to a burning polyurethane smoke source for fifteen minutes. His results were “… [that] there was no discernable difference in the smoke patterns on the discs of the horns regardless of whether the device was operational or not.” Munger’s testing was quite limited in its scope, involving only three energized smoke alarms. Also, Munger’s experiment was pointed entirely to an investigation of the production of Chladni Figures on the horn disks themselves and not on other areas or types of soot deposition. Worrell et al reported in 2001, and citing Munger, that up until that time there had been “…no published methods for determining whether a particular detector actually sounded in response to a smoke exposure.”8 Their testing appears to be the first published work on the topic. In their article abstract they reported:
“A full scale house test was conducted to investigate the accuracy of two proposed methods for determining whether a smoke or carbon monoxide (CO) alarm sounded during smoke exposure. One method involves examining the plastic case of the alarm’s piezoelectric horn for locally enhanced soot deposition and agglomerated soot particles. The other method involves examining the metal disc of the piezoelectric horn for a Chladni figure. Pairs of detectors, each consisting of one detector with its battery properly inserted and the other with its battery disconnected, were placed throughout the house. Each of the properly charged detectors was monitored to determine if and when the detector sounded. It was found that the presence of locally enhanced deposition and soot agglomerates on the main central opening of the plastic horn enclosure of a smoke or CO detector was a strong indicator that the alarm sounded. It was also found that the use of Chladni figures on the piezoelectric discs as an indication of the smoke detector sounding was not an accurate predictor.”9
Chladni Figures The experiments of both the Worrell et al group and Munger dealt to a certain extent with the production “Chladni Figures,” the earliest experimental technique to visualize patterns of vibration. Ernst Chladni (klahd'nee) (1756-1827) first published his method in 1787. He excited a plate into vibration with a violin bow and sprinkled sand on the surface. The sand gathered at the nodal lines, revealing the vibration pattern. Chladni had used this method to study vibration of plates of many shapes, and these results were important in validating the theoretical models for plate vibration that were developed during the nineteenth century.10 The method is still in wide use today for varying vibration wave inquiries and as a teaching method for elementary wave theory physics. On circular plates, similar in shape to the smoke alarm horn disk, Chladni Figures can be displayed as circumferential circles centered at the center of the flat disk (see a. in Figure 2a), radial arms radiating outward from the center of the disk or combinations (see Figure 2b and c)

A Fire Analysis Tool Revisited – Acoustic Soot Agglomeration in Residential Smoke Detectors Page 5
© Copyright 2003, Investigations Institute, Patrick M. Kennedy
and variations of both including certain “starburst” type shapes (see Figure 3, nos. 4, 6, 8, 11 and 12).
Figure 2 - Examples of Circumferential (circular) and radial Chladni figures
Figure 3 – Additional Chladni Figures
(from Chladni’s original text).11,12
Soot Deposition and Acoustic Soot Agglomeration The other physical phenomenon particularly addressed by Worrell et al is Acoustic Soot Agglomeration in the activation of a smoke alarm. The simple definition of Acoustic Agglomeration from Morfey in the Dictionary of Acoustics is: “the grouping of suspended

A Fire Analysis Tool Revisited – Acoustic Soot Agglomeration in Residential Smoke Detectors Page 6
© Copyright 2003, Investigations Institute, Patrick M. Kennedy
particles into larger aggregates by the action of sound waves in the suspending fluid, usually at high intensity.”13
Acoustic agglomeration of aerosols has been known since at least 1931 when it was first observed that small particles tend to "stick" together in the presence of an intense acoustic field, thereby forming larger particles. NFPA 921 defines smoke as: “an airborne particulate product of incomplete combustion suspended in gases, vapors, or solid and liquid aerosols” and soot as: “black particles of carbon produced in a flame”14 The smoke produced in a structure fire contains both soot and other liquid and solid aerosols. Smoke and soot in combination with the high frequency (~4000 hz) and high sound pressure (~>85 decibels) of a properly operating smoke alarm are key elements for producing localized soot agglomeration on surfaces of the smoke alarm.
Though Worrell et al use the separate terms of “Enhanced [Soot] Deposition” and “Acoustic Soot Agglomeration,” they give this explanation of both terms by way of a definition, “When individual soot particles collide under certain conditions, they adhere or agglomerate to form larger particles.”15 Focusing their research on Enhanced Deposition, Acoustic Soot Agglomeration and Chladni Figures, the Worrell et al research reported three main conclusions.16
1. “For the conditions generated by a room fire that grows to flashover in a typical residential occupancy, the presence of locally enhanced deposition and soot agglomerates on the main opening of a smoke or CO detectors horn case, relative to soot deposits elsewhere on the case, is a strong indication that the alarm sounded”
2. “Due to the limited focus of the current research, the absence of such
enhanced deposition and agglomerates does not necessarily indicate that the alarm did not sound.”
3. “The absence of a Chladni figure on the piezoelectric horn disc or horn
enclosure does not necessarily exclude the possibility that the alarm sounded.”
Purpose of Kennedy et al Testing/Research Building on the ground breaking work of Worrell, Roby, Streit, and Torero,17 and also in part on Munger, we proposed to produce additional research particularly focusing on the production of acoustic soot agglomeration in both ionization and photo-electric single station residential smoke alarms. There were several aspects of the Worrell et al testing which we felt limited and called into question the breadth of some of their conclusions. We were particularly interested in their conclusion that while the presence of soot agglomeration was an indicator of smoke alarm activation, the absence of soot agglomeration was not a viable indicator of smoke alarm failure. There are many aspects of acoustic soot agglomeration that must be fully and objectively evaluated in order to reach the conclusion that the absence of soot agglomeration was not a viable indicator of smoke alarm failure. Among these are particle size distribution (10μm),
A Fire Analysis Tool Revisited – Acoustic Soot Agglomeration in Residential Smoke Detectors Page 7
© Copyright 2003, Investigations Institute, Patrick M. Kennedy
smoke mass loading, gas temperature (25-1000 C), sound pressure level (õ 85 dbA), and frequency of the acoustic field (~4000 hz). Most important of these is the presence of a truly sooty environment. In real world fire conditions, knowing the actual smoke or soot distribution and density to which a smoke alarm is exposed is problematical. In the bench-type testing which forms the basis of our research we can quantify and reproduce the amount of soot and smoke exposure of the test alarms. The Worrell et al group’s testing cannot. The conclusion that the absence of enhanced soot deposition does not accurately report the non-operation of a smoke alarm is totally dependant on some reasonable report of the nature and amount of smoke and soot to which the subject smoke alarm was exposed. In real world investigation conditions this can only be accomplished by accurate description of the visual obscuration by eyewitnesses, post-fire examinations of the soot deposition in the burned structure and perhaps by mathematical modeling of the fire. Though each of these data collection methods is somewhat subjective, reasonable estimations can be made if the analyst is conservative and objective in his or her analysis. In addition, though the Worrell et al research was partially concerned with an inquiry into the production of Chladni Figures on the horn disks themselves, we found what appeared to be the presence of unreported “starburst” radial Chladni Figures on five of the photographs of soot agglomeration presented in the Worrell et al paper.18 These photographs displayed soot agglomerations around the tops of the “main central opening[s]” of horn disk enclosures. Our testing also produced similar Chladni Figures. This was in addition to the one circumferential Chladni Figure on the exterior top surface of a horn enclosure that Worrell et al did report, but which our testing did not reproduce.19 The purpose of our current research is to further refine the question of whether the presence or absence of acoustic soot agglomeration and Chladni Figures are in fact viable tools in the determination of whether or not a smoke alarm had activated in an actual fire incident. Research Testing Considerations The only previous published testing in the subject area [Worrell et al] was conducted in a full-scale house fire. While real world conditions testing is an important part of such research, conditions with such a “test chamber” are extremely difficult to control. Witness that fully 30% of their test data was lost due to complete destruction of some of the subject alarms themselves by the fire (six units), other data acquisition failures (four units), and one case in which they were unable to recover a unit horn. While the house fire scenario did give the testing a wide variety of test media (smoke, soot, pyrolysis products, etc.), control of the test media (e.g. mass optical density, smoke obscuration, time of exposure, and chemical composition) is impossible in such a test environment. In addition trans- and post-test conditions: wind, continued emberous fire exposure, extinguishment water, disturbance of the test area by firefighters, etc. is remarkably difficult or impossible to control. In formulating our test protocols and conducting the actual research testing we focused on six issues of consideration. Each of which was lacking in the previous research. Reproducibility of Testing Results

A Fire Analysis Tool Revisited – Acoustic Soot Agglomeration in Residential Smoke Detectors Page 8
© Copyright 2003, Investigations Institute, Patrick M. Kennedy
The testing and data must be reproducible. For this, the test protocol, testing equipment, subject smoke alarms, smoke test chamber, smoke/soot medium, and smoke/soot generation system must be simple enough so that they can be reproduced in any competent fire science laboratory. At the same time the test set-up must have the characteristics to be serviceable for the production, confinement, and control of the test environment. The testing protocol must be carefully crafted so as to allow identical testing of each subject smoke alarm, and reduce the effect of uncontrolled variables on test results. Reduction in Test Variables Test variables must be kept to a minimum. In our testing we tried to limit the variables to only the actual smoke alarm units themselves. Each unit tested was of a basically similar design, with some slight variations in physical size. Each smoke alarm was purchased locally, “off-the-shelf” from regular home improvement style venders and was representative of the most common and popular manufacturers of single station residential smoke alarms. Each was basically cylindrical in shape with outside diameters ranging from ~5.0” to ~5.5” and heights from ~1.25” to ~1.5.” A variety of AC and battery powered, and ionization and photoelectric models was utilized. Each tested unit was placed in the same position on the ceiling of the test chamber. Each unit was tested under the same smoke conditions and for the same time of smoke exposure. The variable of actual elapsed time of alarming was uncontrolled by the testing lab technicians and depended solely upon the functional characteristics of the smoke alarms themselves. Not all of the smoke alarms tested began alarming at the same point in time relative to initial smoke exposure nor persisted in the alarm mode for the same time periods, but these time factors were recorded in the data collection stage. Control of Test Conditions Test conditions must be controllable, particularly the most important factors of extent and time of smoke exposure. Outside variable factors such as ambient conditions of temperature, humidity, and wind outside the test chamber must also be eliminated as test variables. This simply cannot be done in a full-scale acquired house burn. In most cases the agglomerated soot is fragile and susceptible to disturbance and removal by careless handling. Therefore post-testing conditions; such as careful removal of the test subject smoke alarms from the test chamber without disturbance to the important soot evidence, and limiting handling and transportation before laboratory examination are also important. Here the advantage of in-lab bench testing comes into play. Increased Database Size One of our primary concerns was to increase the information database of tested smoke alarms, both in total number and in variety of smoke alarm designs. This was accomplished by combining and, to the extent possible, integrating the tests results from the Worrell et al research and our own test results. Thusly, the database upon which Worrell et al’s conclusions were drawn can be more than doubled and we gain the benefit of their viable and diverse test data as well as our own. The integration of the two databases can be justified if the following key points of difference between the sets of data are duly noted and kept in mind: The Worrell et al data was achieved from a full-scale, largely uncontrolled house burn; 30% of their data was lost or deemed by them
A Fire Analysis Tool Revisited – Acoustic Soot Agglomeration in Residential Smoke Detectors Page 9
© Copyright 2003, Investigations Institute, Patrick M. Kennedy
as not reliable; their smoke and CO alarm database designs, consisted entirely of BRK manufacture; and subjective, qualitative data analysis, particularly with regard to the presence of Chladni Figures and the sufficiency of soot deposition for analysis, may vary widely between the two research teams. So in order to use the two sets of data we must take the Worrell et al data reporting as accurate as given. Two of the key elements in differing alarm manufacturers’ designs are smoke inlet grill design and horn enclosure or compartment design. The horn enclosure design displayed in the Worrell et al paper is completely of the BRK type (e.g. BRK, First Alert, Sears brands). Other manufacturers such as Kidde employ different horn enclosure or compartment designs or in the case of FireX, no horn enclosure or separate chamber at all. While BRK-types and Kidde both employ the relatively large central opening in their respective horn enclosures (approximately 0.43” and 0.375” diameter, respectively), FireX has no such construction at all other than a relatively small cover grill work sound exit hole as also do Kidde, Family-Guard, and First Alert. Similarly, widely differing designs in the size and style of smoke inlet grills are employed among the BRK-type, Kidde, Family-Guard, and FireX brands, with the Kidde and FireX brands being considerably smaller in overall entrance area and the inlet area of the tested First Alerts being roughly one-half the size of the BRKs. Data Collection We endeavored to keep our data collection simple and accurate. Worrell et al’s 30 % data loss was important in our thinking. Two kinds of data are needed and collected in this type of research, quantitative data and the more subjective observational data. Quantitative data includes temperatures, timing of events such as initial smoke alarm activation, and total smoke exposure and alarm activation times. The more subjective data is the recognition and characterization of soot patterns. Both are important to this kind of smoke alarm activation recognition research. Technicians’ observations and notes, particularly with respect to alarm initial activation and total alarm activation times, were backed-up by temperature and time data-logger input. In this topic area the advantage of in-lab bench testing over field-testing is apparent. Technicians in the laboratory could actually hear and note when the smoke alarms went into alarm and did not have to rely solely upon the electrical data acquisition which was sometimes lost in the full-scale house fire field tests. In addition, it is not unheard of that when a smoke alarm sensor detects a fire and sends an electrical signal to the horn, the horn does not sound properly. The mere monitoring for the presence of the alarm electrical activation signal will not verify that the horn is in fact sounding or sounding with the prescribed minimum sound pressure level (õ 85 dBA).20 It is in fact this elevated sound pressure level that is a key factor in whether Acoustic Soot Agglomeration will occur at all - the very point of the entire research. “Do properly sounding smoke alarms produce enhanced soot patterns while improperly operating smoke alarms do not?” Qualitative data recognition, particularly the presence or absence of enhanced soot deposition, Acoustic Soot Agglomeration, and Chladni Figures, was particularly more subjective. We are acutely aware of our opinions that the Worrell et al researchers missed or failed to report the presence of “starburst” Chladni Figures on the horn enclosures displayed in their report. We have the utmost respect for the expertise of our colleagues among the Worrell et al researchers. It is, in fact, this unequivocal respect that points up the pitfalls of these subjective characterizations of the presence of Chladni Figures. There is no doubt that we see these figures

A Fire Analysis Tool Revisited – Acoustic Soot Agglomeration in Residential Smoke Detectors Page 10
© Copyright 2003, Investigations Institute, Patrick M. Kennedy
both in their published photographs as well as in the soot agglomeration test results of our own work. That our much-esteemed colleagues failed to cite them in their work points up the importance, and pitfalls, of the qualitative nature of these observations. In order to mitigate these kinds of subjective evaluations, we utilized a “triple blind” analysis technique for all of our agglomeration and Chladni Figure opinions. Each of the three authors of our research independently examined visually, with naked eye, and with both macro- and micro- magnification, the presence of soot depositions, particularly with reference to agglomerations on the outer covers of the smoke alarm bodies, the inner and outer surfaces of the horn enclosures, and the Chladni Figures present. Exploring Pattern Persistence Lastly, an issue that frequently comes up in other pattern-based fire analyses, including smoke alarm acoustic soot agglomeration litigation cases, is the issue of patterns persistence.21 Pattern's persistence is commonly defined as a fire pattern's ability to endure through the continued fire growth affecting the surface[s] upon which the patterns occur and still be present for post-fire analysis. Smoke alarms are frequently heated by their presence on walls and ceilings within the hot upper layers of compartment fires. This heating takes place within the same upper smoke layer that distributes the smoke that causes the smoke alarm to activate and the production of acoustic soot agglomeration, soot deposition, and Chladni Figures that are the subject of this research. After fire events, the remnants of smoke alarms are seldom found in their original pristine conditions. In fact they are seldom found in their original positions at all. The thermoplastics of which smoke alarms are commonly constructed have a softening and melting temperature of approximately >199-351° F. (93-177° C). Thereby when heated to those temperatures both the outer covers and the horn enclosures begin to soften, melt, and frequently fall to the floor, with their previously deposited soot patterns already applied.
In a single, specific bench test in a laboratory Transit oven, a specimen smoke alarm fell from its gypsum wallboard vertically mounted position at a temperature of 283° F. (139° C). The question of patterns persistence is whether the previously deposited soot patterns have the ability to persist through the continued increased heating which takes place while the smoke alarms are in place on the ceiling or upper walls or ultimately on the floor as the compartment fire continues to grow through flashover where average upper layer temperatures approach and exceed 1112° F. (600° C).22 In a second single specific bench test, a previously smoke tested smoke alarm, (P3) bearing acoustic soot agglomeration was subjected to 30 minutes of heating to a temperature of 433° F. (223 C) in a lab furnace. After air cooling the resultant softened and re-solidified plastic of the outer cover and the horn enclosure were examined to see if the deposited Acoustic Soot Agglomerations persisted.

A Fire Analysis Tool Revisited – Acoustic Soot Agglomeration in Residential Smoke Detectors Page 11
© Copyright 2003, Investigations Institute, Patrick M. Kennedy
Test Procedures Equipment A specially constructed smoke chamber was used in all testing. It measured 24”L x 24”W x 14”H, producing an interior volume of 2.8 cu. ft. There was a 9”W x 7”H glass viewing window placed 5” above the chamber floor in the center of the front wall. The 24” x 24” lid of the chamber was constructed of ½” gypsum wallboard and fit (smoke-tight) into the top of the chamber on nominal 2” horizontal flanges. In the center of the right wall of the smoke chamber was an 8”W x 8.5”H manually operated dampered smoke vent. This vent remained closed during testing. The test smoke alarms were attached to the underside of the gypsum wallboard ceiling, on the lateral centerline, with the rear edge of the smoke alarm 5” from the rear wall. A type “K” thermocouple was attached to the inside surface of the chamber ceiling on the lateral centerline ~2” forward of the tested smoke alarm (see Figures 5 and 6). The smoke source was an ~2” laminar gas flame of MAPP Gas (C3H4) (mixture of 56.0% Propane and 44.0% methylacetylene-propadiene) from a ¼” diameter copper tube burner. The ~2” MAPP Gas laminar flame from a ¼” diameter copper tube burner produces an extremely sooty black smoke which is primary carbon soot in composition. The smoke source is inserted into a hole in the lower center of the chamber front wall beneath the viewing window and extends into the chamber at floor level a distance of 6” (see Figure 4).
Figure 4 – Smoke Source, 2” laminar MAPP Gas flame

A Fire Analysis Tool Revisited – Acoustic Soot Agglomeration in Residential Smoke Detectors Page 12
© Copyright 2003, Investigations Institute, Patrick M. Kennedy
Figure 5 - Top View Drawing of Smoke Test Chamber
Figure 6 - Front View Drawing of Smoke Test Chamber
Protocol

A Fire Analysis Tool Revisited – Acoustic Soot Agglomeration in Residential Smoke Detectors Page 13
© Copyright 2003, Investigations Institute, Patrick M. Kennedy
A test smoke alarm was powered, either with a prescribed internal 9V battery or if a hard wired designed unit, with external standard house line 120V AC, and attached in place on the interior ceiling (lid) of the test chamber. The monitoring thermocouple was attached through the top of the chamber lid and the lid is screwed in place onto the nominal 2” flanges. (See Figure 7).
Figure 7 – Top View of Smoke Test Chamber displaying Smoke Alarm Placement
The smoke source was lighted outside of the chamber and inserted into place within the chamber through a hole in the lower front center of the chamber and extended into the chamber a distance of 6”. Timing begins when the smoke source is inserted. Temperature in the upper layer of the chamber is recorded each minute. Time and duration of alarming are recorded. Total time of smoke exposure is 15 minutes. Immediately thereafter the smoke source is promptly removed and the vent damper and chamber lid are opened. After allowing the smoke alarm to air cool, its outer surface is visually examined and photographed. Then the smoke alarm is carefully disassembled and any interior soot patterns are noted and photographed. The testing is then repeated with a duplicate smoke alarm that is not energized.
A Fire Analysis Tool Revisited – Acoustic Soot Agglomeration in Residential Smoke Detectors Page 14
© Copyright 2003, Investigations Institute, Patrick M. Kennedy
Discussion Chladni Figures on Horn Enclosures – Horn enclosures are not true disks as is the horn disk itself. Therefore Chladni Figures do not appear in the classical fully developed forms. In the combined Worrell et al and Kennedy et al data we found both circumferential (Worrell et al only) and radial “starburst” Chladni Figures on the horn enclosures (both Worrell et al and Kennedy et al). Though the basic operational design (sensing chamber, circuit board and horn) are in all residential smoke alarms, Individual Smoke alarm designs differ greatly from manufacturer to manufacturer, particularly with respect to horn enclosures or compartments and smoke inlet grills. For example, FireX Brand alarms do not have separate horn compartments. The presence of Chladni figures in the agglomerated soot is important because it is also indicative of the vibrating nature of the dynamics of the horn operation – proving that the horn had activated a high frequency (~4000 hz) Sympathetic Vibrations - Sympathetic vibrations can produce acoustic soot agglomeration in non-operating alarms if they are placed too close to other operating alarms of the same manufacturer (i.e. identical horn disks), for example if a CO alarm, a photoelectric smoke alarm, and an ionization smoke alarm are mounted close together by an installer in an attempt to provide a wider coverage of various expected unsafe atmospheres. Manufacturers frequently recommend the installation of multiple types of alarms to increase safety from the various types of fires (smoldering and fast flaming). In our earliest test, two identical smoke alarms, one powered (P1) and one not powered (NP1) were tested simultaneously installed in the smoke test chamber about 4 inches apart. The powered alarm produced easily identifiable soot agglomeration depositions. Surprisingly the non-powered alarm produced similar, though much lighter, soot agglomeration. We attributed this to sympathetic acoustic vibration of the identical non-powered horn from the high frequency high sound pressure activation of its nearby, twin, powered horn; and to the vibrations transmitted to the non-powered horn from the powered horn through the gypsum wallboard ceiling of the test chamber itself. In all subsequent testing we tested powered and non-powered horns separately and no non-powered horn produced any evidence of agglomerated sooting patterns. Patterns Persistence – To test patterns persistence, a previously smoke tested alarm, (P3) bearing acoustic soot agglomeration was subjected to 30 minutes of heating in a lab furnace to a temperature of 433° F. (223° C). After air-cooling the resultant softened and re-solidified plastic of the outer cover and the horn enclosure were examined to see if the deposited Acoustic Soot Agglomerations persisted. Patterns persistence was evident.

A Fire Analysis Tool Revisited – Acoustic Soot Agglomeration in Residential Smoke Detectors Page 15
© Copyright 2003, Investigations Institute, Patrick M. Kennedy
Evaluation of Combined Data Combining the data from the Worrell et al and our testing effectively doubles the database. Worrell et al produced a total of 30 tests, 15 powered and 15 non-powered. Table A displays the test results for the Worrell et al testing. Of the Worrell et al testing, 9 tests produced anomalous or unusable data. A listing of these anomalous tests can be found in Table D. Removing the anomalous tests from the database, Worrell et al produced 9 powered tests (Table B) and 12 non-powered tests (Table C). Kennedy et al produced a total of 22 tests, 12 powered and 10 non-powered (Table E). The first two of the powered tests were for preliminary equipment setup and were labeled Exemplar 1 and Exemplar 2. The exemplar tests smoke alarms were subjected to less total smoke exposure than the subsequent tests, but because they did produce identifiable results, they were included in the total test database. None of the test data from the Kennedy et al testing was classified as anomalous. The combined Worrell et al and Kennedy et al tests results (less anomalous tests) encompassed a total of 42 tests, 21 powered and 22 non-powered (see Table F). All of the powered tests (21) displayed acoustic soot agglomeration and none of the non-powered tests (22) produced any enhanced soot deposition. None of the tests (Worrell et al or Kennedy et al) produced any Chladni Figures on the horn disks. Five of the Kennedy et al tests produced “starburst” type Chladni figures, 4 on the outer surfaces of the horn compartments around the central sound outlet hole and 1 on a smoke alarm outer case. Though the exact number is unknown, several of the Worrell et al tests also produced “starburst” type Chladni Figures on the outer surfaces of the horn compartments around the central sound outlet hole. More information on the evaluation of the combined Worrell et al and Kennedy et al test data can be found in Table F.

A Fire Analysis Tool Revisited – Acoustic Soot Agglomeration in Residential Smoke Detectors Page 16
© Copyright 2003, Investigations Institute, Patrick M. Kennedy
Findings Acoustic Soot Agglomeration The presence of soot agglomerations is a strong indicator that a particular smoke alarm activated properly in a fire (see Figure 8).
Figure 8 – Acoustic Soot Agglomeration around central and
circumferential sound holes of a powered horn disk enclosure. Absence of soot agglomeration products on a fire exposed smoke alarm is evidence that the alarm did not sound, providing that the atmosphere to which the smoke alarm was exposed was sufficiently sooty (see Figure 9).
Figure 9 – Lack of Acoustic Soot Agglomeration on the horn
enclosure of a non-powered smoke alarm

A Fire Analysis Tool Revisited – Acoustic Soot Agglomeration in Residential Smoke Detectors Page 17
© Copyright 2003, Investigations Institute, Patrick M. Kennedy
External agglomeration will appear in the cover grillwork of properly operating smoke alarms, particularly in the areas of horn chamber sound outlets (see Figures 10a and 10b and Figure 11).
Figures 10 a. and b. – Acoustic Soot Agglomeration around the
sound exit grillwork of a Kidde Smoke Alarm
Figure 11 – Non-powered Kidde Smoke Alarm without Acoustic Soot
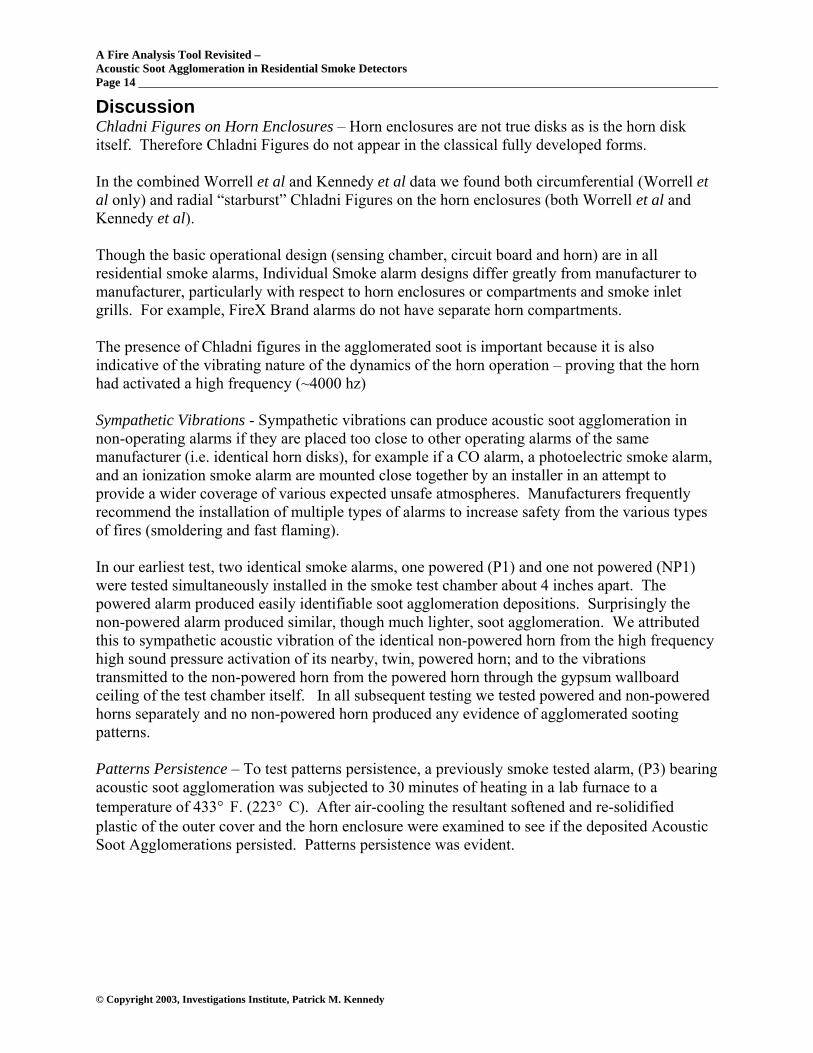
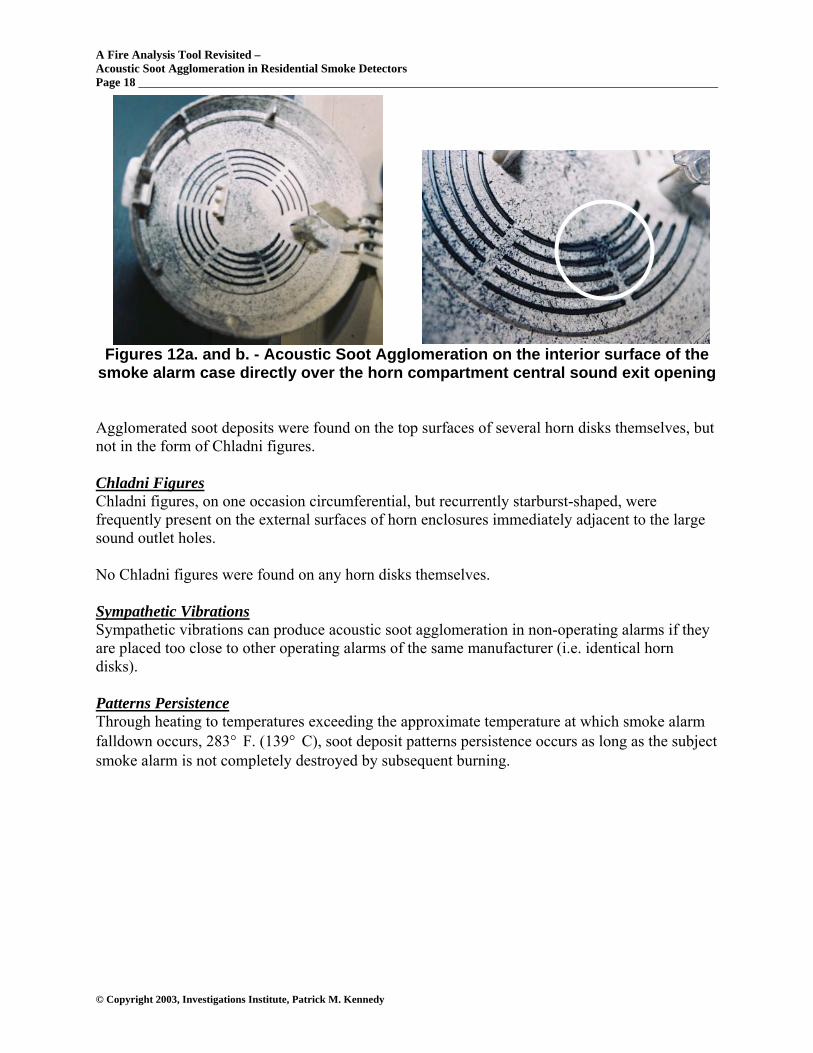
Agglomeration on the sound exit grillwork Internal Agglomeration will appear on various internal parts of a properly operating smoke alarm, particularly the sound exit openings of horn enclosures, but also frequently on such other parts as electrical components, circuit boards, and the inside surfaces of the cover grillwork close to the horn disks or horn enclosures (see Figures 12a. and 12b.).
A Fire Analysis Tool Revisited – Acoustic Soot Agglomeration in Residential Smoke Detectors Page 18
© Copyright 2003, Investigations Institute, Patrick M. Kennedy
Figures 12a. and b. - Acoustic Soot Agglomeration on the interior surface of the smoke alarm case directly over the horn compartment central sound exit opening
Agglomerated soot deposits were found on the top surfaces of several horn disks themselves, but not in the form of Chladni figures. Chladni Figures Chladni figures, on one occasion circumferential, but recurrently starburst-shaped, were frequently present on the external surfaces of horn enclosures immediately adjacent to the large sound outlet holes. No Chladni figures were found on any horn disks themselves. Sympathetic Vibrations Sympathetic vibrations can produce acoustic soot agglomeration in non-operating alarms if they are placed too close to other operating alarms of the same manufacturer (i.e. identical horn disks). Patterns Persistence Through heating to temperatures exceeding the approximate temperature at which smoke alarm falldown occurs, 283° F. (139° C), soot deposit patterns persistence occurs as long as the subject smoke alarm is not completely destroyed by subsequent burning.

A Fire Analysis Tool Revisited – Acoustic Soot Agglomeration in Residential Smoke Detectors Page 19
© Copyright 2003, Investigations Institute, Patrick M. Kennedy
Figures 13 a. and b. – Patterns Persistence Soot agglomeration on a horn enclosure central sound exit opening before (left)
and After (right) heating to 433° F. (223° C) for thirty minutes
Additional Research Our work is not complete. Such issues as soot particle size, optical obscuration data, agglomeration per unit time, ceiling vs. wall mounted smoke alarms, minimum time for agglomeration to occur, and other soot and smoke sources, all need to be addressed. Work in these regards has already begun both by the Kennedy at al and the Worrell et al teams. END

A Fire Analysis Tool Revisited – Acoustic Soot Agglomeration in Residential Smoke Detectors Page 20
© Copyright 2003, Investigations Institute, Patrick M. Kennedy
TABLE A - WORRELL et al TESTS RESULTS23
No. Type Powered Activated Macro Black Ring
Micro Black Ring
1 Ion Yes Yes A* A* 2 Ion No No No No 3 Photo Yes Yes Yes Yes 4 Photo No No No No 5 CO Yes B* No No 6 CO No No No No 7 Ion Yes Yes Yes Yes 8 Ion No No No No 9 Photo Yes Yes Yes Yes 10 Photo No No No No 11 CO Yes Yes No C* 12 CO No No No C* 13 Ion Yes Yes No Yes 14 Ion No No No No 15 Photo Yes Yes B* Yes Yes 16 Photo No No No No 17 CO Yes B* Yes Yes 18 CO No No No No 19 Ion Yes Yes Yes Yes 20 Ion No No No C* 21 Photo Yes Yes Yes Yes 22 Photo No No No No 23 CO Yes B* No C* 24 CO No No No No 25 Ion Yes Yes D* D* 26 Ion No No D* D* 27 Photo Yes Yes D* D* 28 Photo No No D* D* 29 CO Yes B* D* D* 30 CO No No D* D*
* - Anomalous Tests results
A – Horn not recovered B – Data acquisition failure C - Not enough soot to determine D – Detector Consumed in Fire

A Fire Analysis Tool Revisited – Acoustic Soot Agglomeration in Residential Smoke Detectors Page 21
© Copyright 2003, Investigations Institute, Patrick M. Kennedy
TABLE B – COMPILATION OF WORRELL et al RESULTS FOR POWERED DETECTORS THAT ACTIVATED
No. Type Activated Macro Black
Ring Micro Black
Ring 3 Photo Yes Yes Yes 7 Ion Yes Yes Yes 9 Photo Yes Yes Yes 11 CO Yes No C* 13 Ion Yes No Yes 15 Photo Yes B* Yes Yes 17 CO B* Yes Yes 19 Ion Yes Yes Yes 21 Photo Yes Yes Yes
B – Data acquisition failure C - Not enough soot to determine
TABLE C – COMPILATION OF WORRELL et al RESULTS FOR NON-POWERED DETECTORS THAT DID NOT ACTIVATE
No. Type Activated Macro Black
Ring Micro Black
Ring 2 Ion No No No 4 Photo No No No 6 CO No No No 8 Ion No No No 10 Photo No No No 12 CO No No C* 14 Ion No No No 16 Photo No No No 18 CO No No No 20 Ion No No C* 22 Photo No No No 24 CO No No No
C - Not enough soot to determine

A Fire Analysis Tool Revisited – Acoustic Soot Agglomeration in Residential Smoke Detectors Page 22
© Copyright 2003, Investigations Institute, Patrick M. Kennedy
TABLE D – COMPILATION OF WORRELL et al ANOMALOUS TEST RESULTS
No. Type Powered Activated Macro Black Ring
Micro Black Ring
1 Ion Yes Yes A* A* 5 CO Yes B* No No 23 CO Yes B* No C* 25 Ion Yes Yes D* D* 26 Ion No No D* D* 27 Photo Yes Yes D* D* 28 Photo No No D* D* 29 CO Yes B* D* D* 30 CO No No D* D*
* - Anomalous Tests results
A – Horn not recovered B – Data acquisition failure C - Not enough soot to determine D – Detector Consumed in Fire

A Fire Analysis Tool Revisited – Acoustic Soot Agglomeration in Residential Smoke Detectors Page 23
© Copyright 2003, Investigations Institute, Patrick M. Kennedy
TABLE E - KENNEDY TEST RESULTS
* NOTES FOR TABLE V a – Sympathetic vibration from P1; b – side nearest contact “B” has indistinct Chladni Figure; c – Agglomeration on circuit board in area of horn; d – Chladni Figure found inside of outer case near the horn area; e – Chladni Figure found inside of outer case near the horn area and on the inside and outside of the horn case; f – Through exposed to smoke for full 15 minutes, P7 horn only operated for 3 minutes; g – This model has no horn case; h – Agglomeration around outer edge of horn disk; i – Minimal soot for classification
TEST Model MFG. Code Ionization/ or Photo Powered
Outer case Agglomeration Horn Case Agglomeration Horn Disk
Agglomeration Chladni Figure
Outer Horn Horn Case Case Disk Exemplar 1 1235K Ion Yes Yes Yes*i Yes No No No Exemplar 2 83R Ion Yes Yes*i Yes No No No No P1 83R Ion Yes Yes Yes No No No No NP1 83R Ion No No Yes*a No No No No P2 83R Ion Yes Yes Yes No No Yes*b No NP2 83R Ion No No No No No No No P3 83R Ion Yes Yes Yes No No No No NP3 83R Ion No No No No No No No P4 83R Ion Yes Yes Yes No No Yes No NP4 83R Ion No No No No No No No P5*c 1235K Ion Yes Yes Yes Yes Yes*d No No NP5 1235K Ion No No No No No No No P6 1235K Ion Yes Yes Yes No Yes Yes*e No NP6 1235K Ion No No No No No No No P7*f CPBC Photo Yes Yes N/A*g No No N/A*g No NP7 CPBC Photo No No N/A*g No No N/A*g No P8 AD Ion Yes Yes N/A*g Yes*h No N/A*g No NP8 AD Ion No No No No No N/A*g No P9 FG888D Ion Yes Yes Yes No No Yes No NP9 FG888D Ion No No No No No No No P10 FG888D Ion Yes Yes Yes No No Yes No NP10 FG888D Ion No No No No No No No

A Fire Analysis Tool Revisited – Acoustic Soot Agglomeration in Residential Smoke Detectors Page 24
© Copyright 2003, Investigations Institute, Patrick M. Kennedy
TABLE F - EVALUATION of COMBINED WORRELL et al and KENNEDY et al TEST DATA
WORRELL et al TESTS
KENNEDY et al TESTS
TOTAL NUMBER OF TESTS
TYPES OF TESTS
Number
Percentage Number Percentage Number Percentage
Total Number Of Tests
30 30/30 (100%)
22 22/22 (100%)
52 52/52 (100%)
Powered Tests
15 15/30 (50%)
12 12/22 (55%)
27 27/52 (52%)
Non-Powered Tests
15 15/30 (50%)
10 10/22 (45%)
25 25/52 (48%)
Anomalous Tests
9 9/30 (30%)
0 0 9 9/52 (17%)
Anomalous Powered Tests
6 6/15 (40%)
0 0 6 6/52 (12%)
Anomalous Non-Powered
Tests
3 3/15 (20%)
0 0 3 3/52 (6%)
Tests with
Viable Data 21 21/30
(70%) 22 22/22
(100%) 43 43/52
(83%) Soot
Agglomeration (Powered - less
Anomalous Tests)
9 9/9 (100%)
12 12/12 (100%)
21 21/21 (100%)
Soot Agglomeration (Non-Powered
- less Anomalous
Tests)
0 0% 0 0% 0 0%
Non-Powered Tests w/o Soot Agglomeration
(less Anomalous
Tests)
12 12/12 (100%)
10 10/10 (100%)
22 22/22 (100%)

A Fire Analysis Tool Revisited – Acoustic Soot Agglomeration in Residential Smoke Detectors Page 25
© Copyright 2003, Investigations Institute, Patrick M. Kennedy
BIBLIOGRAPHY Underwriter’s Laboratories Standard for Safety UL 217, Single and Multiple Station Smoke Alarms, Fifth Edition, dated February 21, 1999 Northbrook, IL C. L. Worrell, R. J. Roby, L. Streit, and J. L. Torero, “Enhanced Deposition, Acoustic Agglomeration, and Chladni Figures in Smoke Detectors,” Fire Technology, 37, 343-362, (USA: Kluwer Academic Publishing, 2001). 343 J. Munger, “Residential Smoke Alarms: Their Effect on the Reduction of America’s Fire Death and Injury rate,” Ph.D. dissertation, Columbia Southern University, 1999 Endnotes 1 NFPA Fact Sheet “Smoke Alarms – Make Them Work for Your Safety,” National Fire Protection Association, Quincy, MA, 2003. 2 NFPA Fact Sheet. 3 UL 217, Single and Multiple Station Smoke Alarms, Underwriter’s Laboratories Standard for Safety, Fifth Edition, dated February 21, 1999 Northbrook, IL. 37.1. 4 UL 217, 62.2 5 National Fire Protection Association, “NFPA 72 - 2001, The National Fire Alarm Code,” (Quincy, MA: National Fire Protection Association, 2002) Sec. 11.8.3.4* 6 J. Munger, “Residential Smoke Alarms: Their Effect on the Reduction of America’s Fire Death and Injury rate,” Ph.D. dissertation, Columbia Southern University, 1999 7 J. R. Munger, Ph.D., CFPS, Personal Communication, July, 2003. 8 C. L. Worrell, R. J. Roby, L. Streit, and J. L. Torero, “Enhanced Deposition, Acoustic Agglomeration, and Chladni Figures in Smoke Detectors,” Fire Technology, 37, 343-362, (USA: Kluwer Academic Publishing, 2001). 343 9 Worrell et al. 343 10 University of Cambridge, Dynamics and Vibration Group, web page, www-mech.eng.cam.ac.uk/dynvib/ (2001-2002) 11 Ernst F. F. Chladni, Entdeckungen über die Theorie des Klanges (Discovery of the Theory of Pitch), Leipzig, 1787 12 Copyright, 1985 Smithsonian Institution 13 Christopher Morfey , Dictionary of Acoustics, Institute of Sound and Vibration Research, (2000): Academic Press, University of Southampton, U.K. 14 NFPA 921 – 2001, sections 1.3.108 and 1.3.111 respectively 15 Worrell et al. 345 16 Worrell et al. 361 17 Worrell et al. 18 Worrell et al, Figures 6a, 9, 11 (top), 13 (top), 13 (center) 19 Worrell et al. p. 351 and Figures 9, 10 20 UL 217. 21 Patrick M. Kennedy and James H. Shanley, Jr., “Report of the United States Fire Administration Program for the Study of Fire Patterns,” FA 178, (Emmitsburg, MD: Federal Emergency Management Agency United States Fire Administration 1997) 22 Patrick Kennedy and Kathryn Kennedy, “Flashover and Fire Analysis,” (Sarasota, FL: Investigations Institute, 2003) 23 Worrell et al. 351