A Financial Data Mining Model for Extracting Customer Behavior
14
A Financial Data Mining Model for Extracting Customer Behavior Research Paper Mark K.Y. Mak 1 , George T.S. Ho 2* and S.L. Ting 2 1 Convoy Financial Services Holdings Limited, Hong Kong 2 Department of Industrial and Systems Engineering, The Hong Kong Polytechnic University, China *Corresponding author E-mail: [email protected] Received 13 June 2011; Accepted 23 July 2011 Abstract Facing the problem of variation and chaotic behavior of customers, the lack of sufficient information is a challenge to many business organizations. Human analysts lacking an understanding of the hidden patterns in business data, thus, can miss corporate business opportunities. In order to embrace all business opportunities, enhance the competitiveness, discovery of hidden knowledge, unexpected patterns and useful rules from large databases have provided a feasible solution for several decades. While there is a wide range of financial analysis products existing in the financial market, how to customize the investment portfolio for the customer is still a challenge to many financial institutions. This paper aims at developing an intelligent Financial Data Mining Model (FDMM) for extracting customer behavior in the financial industry, so as to increase the availability of decision support data and hence increase customer satisfaction. The proposed financial model first clusters the customers into several sectors, and then finds the correlation among these sectors. It is noted that better customer segmentation can increase the ability to identify targeted customers, therefore extracting useful rules for specific clusters can provide an insight into customers’ buying behavior and marketing implications. To validate the feasibility of the proposed model, a simple dataset is collected from a financial company in Hong Kong. The simulation experiments show that the proposed method not only can improve the workflow of a financial company, but also deepen understanding of investment behavior. Thus, a corporation is able to customize the most suitable products and services for customers on the basis of the rules extracted. Keywords Association Rules Mining, Clustering, Customer Behavior, Data Mining, Financial Industry 1. Introduction Due to the subprime mortgage crisis of 2008 and the global financial crisis of 2009, many investors suffered from financial products losses. The stock markets fell and large financial institutions collapsed. Such a series of financial events not only caused panic in the financial markets but also encouraged investors to take their money out of risky mortgage bonds and unstable equities etc. Investors now have to a more cautious attitude towards investments. Dealing with the financial events, unpleasant investor experience has become common and these personal experiences are demonstrated in risk and attitude to risk. This situation creates factors impacting investors in respect to returns on expectations. Despite the economy recovering gradually, investors have had to reassess the high risk of investment. At the same time, www.intechweb.org www.intechopen.com Int. j. eng. bus. manag., 2011, Vol. 3, No. 3, 59-72
Transcript of A Financial Data Mining Model for Extracting Customer Behavior

A Financial Data Mining Model for Extracting Customer Behavior Research Paper
Mark K.Y. Mak1, George T.S. Ho2* and S.L. Ting2 1 Convoy Financial Services Holdings Limited, Hong Kong 2 Department of Industrial and Systems Engineering, The Hong Kong Polytechnic University, China *Corresponding author E-mail: [email protected]
Received 13 June 2011; Accepted 23 July 2011
Abstract Facing the problem of variation and chaotic behavior of customers, the lack of sufficient information is a challenge to many business organizations. Human analysts lacking an understanding of the hidden patterns in business data, thus, can miss corporate business opportunities. In order to embrace all business opportunities, enhance the competitiveness, discovery of hidden knowledge, unexpected patterns and useful rules from large databases have provided a feasible solution for several decades. While there is a wide range of financial analysis products existing in the financial market, how to customize the investment portfolio for the customer is still a challenge to many financial institutions. This paper aims at developing an intelligent Financial Data Mining Model (FDMM) for extracting customer behavior in the financial industry, so as to increase the availability of decision support data and hence increase customer satisfaction. The proposed financial model first clusters the customers into several sectors, and then finds the correlation among these sectors. It is noted that better customer segmentation can increase the ability to identify targeted customers, therefore extracting useful rules for specific clusters can provide an insight into customers’ buying behavior and marketing implications. To validate the feasibility of the proposed model, a simple dataset is collected from a financial company in Hong Kong. The simulation experiments show that the proposed method
not only can improve the workflow of a financial company, but also deepen understanding of investment behavior. Thus, a corporation is able to customize the most suitable products and services for customers on the basis of the rules extracted. Keywords Association Rules Mining, Clustering, Customer Behavior, Data Mining, Financial Industry
1. Introduction Due to the subprime mortgage crisis of 2008 and the global financial crisis of 2009, many investors suffered from financial products losses. The stock markets fell and large financial institutions collapsed. Such a series of financial events not only caused panic in the financial markets but also encouraged investors to take their money out of risky mortgage bonds and unstable equities etc. Investors now have to a more cautious attitude towards investments. Dealing with the financial events, unpleasant investor experience has become common and these personal experiences are demonstrated in risk and attitude to risk. This situation creates factors impacting investors in respect to returns on expectations. Despite the economy recovering gradually, investors have had to reassess the high risk of investment. At the same time,
Int. j. eng. bus. manag., 2011, Vol. 3, No. 3, 59-7259 www.intechweb.orgwww.intechopen.com
Int. j. eng. bus. manag., 2011, Vol. 3, No. 3, 59-72

investor behavior and the distribution profile of investment in their assets is altered. Indeed, financial institutions face the challenge of demanding customers who strongly seek low risk investments products relevant to their specific needs. In response such great changes in customer needs, financial institutions need to assess the current market situation and redesign appropriate financial products that having varying degrees of risk to meet differing investor preferences. In order to have better market analysis and customer relationship management, the utilization of Information Technology (IT) is a significant tool used to help the company. It helps business organizations to enhance competence and sustain continuous growth of company business (Chung et al., 2009). According to Kwan et al. (2005), technology can support knowledge management in business including data warehousing, data mining, the Internet and document management systems. In recent decades, data mining has been applied to a broad range of topics and areas (Hosseini et al., 2009; Ting et al., 2009; Ngai et al., 2008; Kirkos et al., 2006). Most business organizations use it to find the problems area and allow managers to make strategic decisions that will allow the business organizations to succeed. It is true that IT plays a significant role that helps business organizations to improve their performance. In order to increase understanding of the reasoning buying patterns of customers, many companies use automated tools to study the behavior of their customers. Once relevant information has been obtained, it can be used in a way that will allow the organization to predict the behavior of their clients. With the advent of the rapid development of information technology, the biggest challenge is not only getting important information that accumulates daily in databases, but also searching through such a huge database to find relevant connections. However, patterns among the data are not easy to extract. The reason for this is that the information must be specific and refined. To successfully apply data mining on the information obtained, a company must be able to understand the connections between the business strategies and the models that are created within the data mining programs. However, many managers do not notice the importance of data and the information for data analysis. Also, most managers do not understand the relationship between the data due to the lack of technical background. For example, a financial marketing manager does not understand the relationship between the hidden patterns and the customer’s portfolio. Therefore, it is important to have a sophisticated tool to help companies find out the relationship between different data (Zhang and Zhou, 2004). In order to gain a deep understanding of customer behavior, clustering analysis and Association Rules (ARs) are introduced in this paper, aimed at identifying target
customer groups and discovering interesting relations among the variables for each data item. Overall, several research questions are identified, including:
How to design an effective data mining model that can be used by all relevant end users?
How to link up and capture all relevant data for the company and store it into the database?
How to implement the proposed model to identify the target customer?
How to discover the hidden patterns in each specific cluster?
How to use such rules for enhancing customer satisfaction and formulating marketing strategies?
Attempted to address the research challenges, a simple, practical and user‐friendly Financial Data Mining Model (FDMM) is designed to gain better understanding and insights into investment behavior by means of clustering analysis and ARs. The clustering analysis is intended to cluster the data first and then mine the ARs. The Association Rules aim to discover the relations between variables in large databases. The integration of the Clustering and Association Rules can enable a company to have better analyses of customer purchasing behavior and to formulate a tailor made investment convergence to their clients.
2. Current Applications of Data Mining Techniques in Financial Industry The data mining technique is to identify and describe knowledge extracted from a data set. Generally, there are various types of data mining techniques, including supervised and unsupervised learning. Supervised learning uses a set of labeled training examples, including predictors and results, and the examples are used for execution. As the results are not predetermined, unsupervised learning is based on training data. In this paper, the focus is on unsupervised learning, including clustering and association rules. 2.1 Clustering Analysis Cluster analysis is commonly used for identifying interesting distributions and patterns in the data. Clustering is different to classification. Clustering is unsupervised learning while classification is supervised learning. In classification, each data item is assigned a particular class. Inversely, clustering provides only data points but no classes and labels. It only produces an initial class in which the value of a data set is determined during the classification process. This means that the records are grouped together on the basis of self‐similarity, but it would not show the types of relations
Int. j. eng. bus. manag., 2011, Vol. 3, No. 3, 59-7260 www.intechweb.orgwww.intechopen.com

among the data (Berry and Linoff, 2004). In other words, it relies on the users to decide the meaning of the data. For example, using income divides the customer into different groups. Each cluster indicates different marketing implications. These marketing implications can be helpful in formulating marketing strategies. There are several types of clustering algorithms. The K‐means algorithm is the most widely used clustering algorithm in practice. According to Wu and Kumar (2008), the K‐means algorithm is simple, easily understandable, and can be readily adjusted to deal with different scenarios, such as semi supervised learning or streaming data. Similarly, Sohn and Kim (2008) claim that some clustering algorithms generate too many clusters, however the K‐means algorithm can possibly be used to derive a set of desirable clusters. The K‐means algorithm has been increasingly applied in the financial area, and helps financial institutions to effectively manage portfolio and asset selection. According to Nanda et al. (2010), the K‐means algorithm can reduce the time for selection of stock, as compared to fuzzy C‐means and the Self Organizing Map (SOM). It helps to group similar categories into a cluster so as to select the best performing stock from the groups for building a portfolio. Financial institutions can formulate a portfolio based on the characteristics of the clusters. It results in optimizing investor returns and minimizing portfolio risk. In some studies, clustering is used together with the association rules to find the hidden patterns among the data. Sohn and Kim (2008) suggest that clustering analysis can be integrated with association rules to discover the hidden patterns from a specific group. This approach can show more specific marketing implications. Kuo et al. (2007) also applied clustering algorithms to cluster the database first and then use the association rules to discover the rules for each cluster. The result reveals that clustering can help in extracting the rules much faster and in finding more useful rules. 2.2 Association Rules (ARs) Association rules (ARs) is a widely used data mining techniques for discovering the interesting patterns in a database. Kim (2004) states that ARs are similar to If‐Then rules, in which a condition clause (If) triggers a result clause (Then). ARs, moreover, include support and confidence. In ARs, the threshold support and confidence are critical to verify the rule whether the rule is valid. According to Berry and Linoff (2004), there are three measures of ARs. Support indicates the percentages of records containing an item or combination of items to the total number of records. Confidence reflects how sure when the “If” part is true that the “Then” part is also true under a particular condition. The lift ratio, moreover,
shows the quality of the rule in estimating the “Then” part as compared to having no rule. There are various types of algorithms to mine the association rules. One of the most widely used methods of association rules is the Apriori algorithm. The Apriori algorithm was introduced by Agrawal et al. in 1993. It is used for finding frequent itemsets in a database then calculating the support for each itemset in order to determine whether they can be identified in the database for an association rules group. According to Agrawal et al. (1993), an association rule is in the form of XY, where X and Y indicate combination (itemset). They make use of two measures, minimum support and minimum confidence, to generate the interestingness of the rules discovery. Liao et al. (2008) suggest that the confidence level should be set above 70 and a support level above 80 is considered meaningful. Liang and Christos (2003) point out that a number of frequent itemsets decrease as the minimum support increase. As a result, fewer rules are found and thus the time spent in each phase decreases. ARs is popular in the finance industry. Li et al. (2008) demonstrate how to use ARs to discover the frequent patterns of investment behavior in the Shanghai stock market, and to apply the algorithm for ARs to a real securities clearing dataset. This study helps financial institutions to seek patterns on how a portfolio should be built and to learn more about behavioral finance. Sung and So (2011) also use the ARs for predicting changes in stock indices between the Korea Composite Stock Price Index (KOSPI) and the global stock market indices. The rules generated are expected to facilitate decision making on the buying or selling of what types of stock. This study reveals that using large sample sizes of raw data not only can make the results more applicable but also can be useful for finding the unexpected patterns and rules. On the other hand, Kuo et al. (2009) proposed to use a novel algorithm ‐ particle swarm optimization ‐ to generate association rules from a database. Their study discovered the correlations between industrial categories in Taiwan through applying this algorithm in stock selection behavior. The mining results can provide an insight into customers’ transaction behavior and information on decision making. All in all, the objective of this paper aims at identifying the influencing factors that affect investment behavior and in discovering the relationships and associations from such clusters. Thus, clustering analysis through integration of ARs is the best choice for gaining further understanding of investment behavior as compared to the other data mining techniques. Clustering analysis helps companies to segment customers into the most appropriate groups. To achieve high customer satisfaction, ARs should be capable of discovering
Mark K.Y. Mak, George T.S. Ho and S.L. Ting: A Financial Data Mining Model for Extracting Customer Behavior
61www.intechweb.orgwww.intechopen.com

relationships and associations from a specific, targeted cluster. Thus, the rules extracted can effectively provide a basis for forecasting and decision making (Chiang, 2011; Nenad and Svetlozar, 2006). There are studies that have proved that the ARs integrate with the clustering analysis and can significantly shorten the processing time of rules mining, and result in generating more unexpected rules. 3. Architecture of Financial Data Mining Model (FDMM) In order to gain a better understanding on investors’ behavior and achieve higher customer satisfaction, a Financial Data Mining Model (FDMM) is proposed. It is crucial for financial planners to understand what and when the clients’ need so as to devise the most appropriate asset allocation strategies. The framework is designed to select the related data from different available databases. Such data is converted into qualitative and quantitative data and then is used for building a centralized data warehouse. In order to find out which set of investment products that clients might be interested in, one year of historical data is required for data analysis. The generic architecture of FDMM is illustrated in Figure 1. The FDMM consists of three modules, namely, the Data Selection and Preprocessing Module (DSPM), the Clustering Module (CM) and the Rules Discovery Module (RDM). The DSPM is used to select the relevant data and prepare the proper format for the mining process. The CM is to identify the most influencing factors that affect customer behavior and then such data is segmented into different groups. Clustering the database is aimed at identifying the target group of customers so as to discover useful rules for these segmented groups. Following the CM, the RDM can discover useful rules for each specific group. The useful association rules can help the company to understand the relationship between different financial products and then convert them into knowledge. The company can formulate marketing strategies based on the rules extracted. With this comes the acknowledgement that it provides an insight into the different needs of customer segments identified, and also gives a determination to improve in this area. 3.1 Data Selection and Preprocessing Module (DSPM) The Data Selection and Preprocessing Module (DSPM) aims at building a central data warehouse for supporting data mining tasks and quality information sharing. DSPM is connected to various data sources. The departmental database is a major component of DSPM, which holds valuable data, such as the customers’ profiles, asset allocation and past investment records. As shown in Figure 2, there are two processes involved in DSPM, namely data selection process and data preprocessing.
Figure 1. Architecture of the FDMM
Figure 2. Workflow of DSPM
Int. j. eng. bus. manag., 2011, Vol. 3, No. 3, 59-7262 www.intechweb.orgwww.intechopen.com

3.1.1 Data Selection Process The data selection process is used for selecting the data from heterogeneous data sources, including department databases, systems, customer credit files and the company online server. First of all, relevant data is updated in different data sources according to the daily operation. Then, the DSP determines where the data can be collected. For instance, the movement of the stock market can be collected from the Product and Research Department. On the other hand, market information such as government policy, market trends, and competitors’ analysis can be collected from the marketing department. All the updated data is captured and collected. After the relevant data is gathered from various data sources, the next phase is data preprocessing. The data preprocessing plays a significant role in the entire data mining process as it can ensure the quality of the data. 3.1.2 Data Preprocessing The data preprocessing is an essential part of data mining. The purpose of data preprocessing is to clean selected data for better quality. This is because some selected data may have different formats. This stage enables all necessary information be extracted from the data selection process to have an appropriate format for further mining process. All the data will go through data cleaning to increase the accuracy of the mining result. In general, data cleaning includes filtering, aggregating and filling in missing values. The outliers may be caused by human errors or technical errors. For example, the age of a customer should be “21” but it is recorded as “12”. This is likely a human error. Data cleaning can reduce the presence of harmful data such as noisy data, inconsistent data, and missing data that affect the results. All the data will then go through the transformation process for converting the data into appropriate forms for mining. The data transformation can enhance the capability of reading different data. The data transformation can involve different types of normalization. Each attribute has its own initial range. Take income and age as an example. Income has a large initially range as compared to age, thus, it will not fall within a small specified range. Similarly, age has a small initially range which will not fall within a large ranges. Thus, those data must go through normalization to convert them into a specific range. Last but not least, the data reduction ensures the quality and quantity of the data set. It is important to maintain the size and volume of the data set especially for large, different transactions. Only qualified data can be retained. Quality data enables the data mining algorithms to progress more effectively. After the data transformation and reduction, data are available in the
central data warehouse for analysis. Because the central data warehouse can merge data from multiple data sources, it increases the availability of the required data. 3.2 Clustering Module (CM) After the data preprocessing, the data is well prepared for mining. The purpose of CM is to shorten the processing time for RDM. It not only improves the efficiency of the performance but also makes the rules easier to find. The k‐means algorithm is applied to partition such data into different groups. If there is any change of data from the data sources, such data will be preprocessed through the DPM, and the CM can then divide them into the most appropriate groups. When clusters are available for processing in the RDM, the RDM can simply generate rules for a particular cluster. Therefore, the RDM does not used to determine which target data that will generate rules. When there are huge amounts of data, the CM divides the target clusters at first, that enables the procedure of RDM to be more accurate and proceed more easily. The detailed workflow of CM is shown in Figure 3. 3.2.1 K‐means Algorithm When the input variables are multi‐dimensional, they must be transformed into an appropriate mining form through the max normalization process before starting K‐means algorithm. Here, x’ is the original value of the objects and x is the new value of the objects after the max normalization. xi represents the ith new value of the objects. The number of objects in the data set is represented as u, where x = {xi�i = 1, 2…u }. The new value of the object is defined by Eq. (1) and the K‐means algorithm is described in the following: The new value of an object (xij) = �����������������’������������������’� (1)
Step 1: Assign the initial N cluster means randomly, one for each cluster. C represents the clusters, where Cj denotes the jth cluster. Here it indicates this set of N cluster means the set ��̂ = {�̂k�k = 1, 2…v }. The value of k is an input to the base algorithm and the number of clusters desired by the users. Step2: Find the distance between the object and the mean. The distance is denoted as d, where dijk = �xi - cjk�. However, since such an equation is used to calculate the distance of one‐dimensional data, therefore when there are multi‐dimensional data, it is required to minimize the squared distance of each point to its closest centroid by using the Euclidean distance. The objective function is defined as follows:
Min Dij =�∑�������� where dijk = �xi-cjk�, i = {1, 2…u }; k = {1, 2…v} (2)
Mark K.Y. Mak, George T.S. Ho and S.L. Ting: A Financial Data Mining Model for Extracting Customer Behavior
63www.intechweb.orgwww.intechopen.com

Figure 3. The Workflow of CM Step 3: Minimize the distance Dij for all xi in order to assign the object to its belonging Cj. Step 4: Assign each object to the Cj with the mean closest to that object. When all data points fall in a belonging cluster, this step is completed and then early grouping is done.
Symbol Description x The new value of an object x’ The original value of an object before normalization xi The ith object. u The number of objects in the data set. C The clusters Cj The jth cluster �̂ The initially assigned means c The mean of all points. k kth mean of cluster Cj v The number of cluster means m The number of objects in the jth cluster. N The number of clusters D The minimized distance between the object and
the means d Distance between the object and the mean
Table 1. Notion Used in K‐means Algorithm
Step 5: Repeat step 2 and 3 to find the distance between the object and the mean for the other remaining members. Step 6: Compute the N new cluster means. The updated means are set to be �. m represents the number of objects within Cj. Here, it must be noted that �̂ is not equal to c. In Table 1, the mean of the jth cluster is defined by Eq. (3).
�jk = ��� ∑ �� , �� � � (3)
Step 7: Scan the N cluster means and compare with the previous means. If the means of the N clusters are changed, it repeats step 2 and 3. In contrast, if the means of the N clusters do not change again, the algorithm is completed. Step 8: Convert the results (new values after normalization) into original values. The original value of an object (x’ij) = Max value of x’j � New value of an object (xij). After the computation of the k‐means algorithm, a k cluster set is classified. The objects within a group tend to be more similar to one another as compared to objects belonging to different groups. In other words, the procedure locates similar points in the same cluster while locating dissimilar points in different clusters. Such a set of clusters then will be used for RDM processing. 3.3 Rules Discovery Module (RDM) In this stage, the RDM aims at discovering the relationships in a specific cluster. The RDM can directly extract an input data set from the CM to generate useful rules. In this module, the Apriori algorithm (Agrawal et al., 1993) is applied to find the frequent patterns, correlations and associations. Such rules can indicate which groups or sets of items customers are likely to purchase in a given set of clusters. After the generation of the rules, the rules will allow management to make an evaluation. Then, the sales and marketing department can use such rules for decision making in regard to a specific cluster. The detailed workflow of RDM is shown in Figure 4. 3.3.1 Apriori Algorithm Generally, the Apriori algorithm consists of two phases: mining of frequent itemsets and generation of association rules. Table 2 shows the notion used in the Apriori algorithm and the steps taken are as follows. Step 1a: Transform a set of transactions from a cluster. This set of transactions is denoted as T, where Ta represents the ath transaction. The number of transactions is indicated as b, where Ta = {Ta�a = 1, 2…b}. Each transaction consists of
Int. j. eng. bus. manag., 2011, Vol. 3, No. 3, 59-7264 www.intechweb.orgwww.intechopen.com

different attributes. Here J denotes the attributes, where p represents as pth attribute. The number of attributes is indicated as q, where Jp= { Jp�p = 1, 2…q}. J is a subset of T. Hence, T = { Jp�p = 1, 2…q}. Note that if an itemset is frequent, any of its subsets is frequent as well. The first step is to use T to form a table in order to find the frequency of occurrence (support count) of different attributes in the transactions. Here the support count of each attribute is denoted as Sp, where Sp = ∑Sap’, p = p’. Sap’ is used to indicate the absence (0) or presence (1) of an attribute in a transaction. Here, the predetermined threshold support counts all attributes, and potential itemsets are set to be Sp‐min. Step 1b: Sp is compared with Sp‐min. A candidate is retained only when it is equal to or greater than the predefined threshold support count (Sp‐min). If Sp is smaller than Sp‐min, the corresponding candidates will be removed. Step 2a: Merge the remaining candidates to form an itemset with two items. The combination of these two itemsets are called L, where Lo is represented as the oth 2‐itemset. Create a 2‐itemset table and find the support count of these 2‐itemsets. The support count of 2‐itemset
is S(2), where So(2) indicates as the support count of the oth 2‐itemset combination. Scan for support counts of these 2‐itemsets (S(2)) in the 2‐itemset table. Step 2b: Compare the support count of these 2‐itemsets (S(2)) with the predetermined threshold support count (Sp‐min) of the candidates and prune off the unqualified 2‐itemset candidates. The 2‐itemset table only contains combinations which have the support count (So(2)) equal to or greater than the threshold support(Sp‐min). Step 3a: Verify the 2‐itemset table as to whether there are any qualified combinations. Step 3b: If there are still qualified combinations, the algorithm is continued. Apply a similar approach to step 2 to form a table for the (z + 1)‐itemset, where z is set to be 2 initially, that is (2+1) as 3 itemset, (3+1) as 4‐itemset etc. Then za = zp + 1 for further combinations. za is the number of candidates of the next itemset table and zp is the number of present candidates. Here, the support count of the gth (z + 1)‐itemset combination is set to be Sg(z+1). The algorithm is said to be terminated when no frequent itemsets can be found.
Figure 4. Workflow of RDM
Mark K.Y. Mak, George T.S. Ho and S.L. Ting: A Financial Data Mining Model for Extracting Customer Behavior
65www.intechweb.orgwww.intechopen.com

Symbol Description T A set of transactions Ta The ath transaction b The number of the transactions A The attributes of the data set. Ap The pth attribute ( p = p’) q The number of the attributes Sp The support count of each attributes Sp‐min The minimum support count of all
attributes and potential frequent itemsets Lo The oth 2‐itemset So(2) The support count of oth 2‐itemset Sg( z + 1) The support count of the gth (z+1)‐itemset
combination (Aap, Aap…) Sp‐condition The support count of the 1‐itemset condition
of the rules for 2‐itemset Sap‐condition
The support count of the 1‐itemset condition of the rule for (z+1)‐itemset
So(2)‐condition
The support count of the 2‐itemset condition of the rule for (z+1)‐itemset
Sg(z)‐condition
The support count of the z‐itemset condition of the rule for (z+1)‐itemset
Sp‐result The support count of the 1‐itemset result of the rules for 2‐itemset
Sap‐result The support count of the 1‐itemset result of the rule for (z+1)‐itemset
So(2)‐result The support count of the 2‐itemset result of the rule for (z+1)‐itemset
Sg(z)‐result The support count of the z‐itemset result of the rule for (z+1)‐itemset
Rw The confidence value of the wth association rule
R‐min The threshold confidence value of all association rules.
I The lift ratio of rules of all association rules. I‐mp The lift ratio of rules of the mpth association
rule.
Table 2. Notation Used in Apriori Algorithm
Step 4: Here, it must be verified that the 2‐itemset or (z+1) combination is valid. The condition is the cause of the rule and it can be any segment of the itemset. It must be noted that the number of itemset combinations must be smaller than the number of itemset combinations, equal to or greater than 1. Here, the confidence value of each rule is denoted as R, where Rw is indicated as wth
confidence value of a rule. The equations of the confidence values (Rw) are defined in Table 3. Step 5: After the computation, the confidence values (Rw) are compared with the threshold confidence values (R‐min). Prune off the confidence values which are smaller than the threshold confidence values, then the remaining itemsets are the interesting rules with the desired level of quality.
In addition to the confidence values, the lift ratio of the rules is used to measure how well the rules generated are for predicting the results as compared to a single itemset. The equations of the lift ratio are shown in Table 4. This is not the end of the algorithm as the incremental data continuously record and enter the algorithm of RDM. The existing data and the newly formed data are loaded into the algorithm for rules mining. After the treatment of the algorithm, some new rules may be found, as the incremental data may have some preferences, customers’ requirements etc. These implications point out that some rules need to be evaluated. 3.3.2 Rules Evaluation As mentioned above, all the extracted rules must go through the rules evaluation process to assess the feasibility. The rules evaluation needs to acquire and accumulate the knowledge. Rules extracted can be used for reference. Users can adjust the rules on the basis of customers’ requirements, latest market trends, professional industry knowledge and experience. After modification of the rules, data are formed and loaded continuously. Hence, the entire proposed model is said to be worked continuously, without termination. This allows knowledge to have continuous improvement and results in high customer satisfaction. 3.3.3 Rules Classification The purpose of the RDM aims at discovering the useful relations in investment behavior in the financial industry. Such useful rules can be used for understanding investment behavior. For example, the investment behavior of younger customers who are willing to take more risky financial products product as compared to the older investors. The Product and Research Department manager can use such useful rules to devise the coverage of the portfolio to be included and what types of customers should be promoted. Another type of rule is the trivial rules. It seems to be known by common sense and the influence of such kind of rules are minimal. For instance, the higher risk of a financial product has a higher return. Thus the rules extracted can just show the evidence but not a new idea in an improvement. The last one is the inexplicable rule. Some results are not easily interpreted by the rules. Users may not understand the correlations of certain results by common sense. Such rules just conclude a fact to users but cannot provide any insight to the customer behavior. Take medical insurance as an example. The inexplicable rules show the correlations between the medical insurance and equity, but it is not easy to understand why investors select medical insurance and also select equity. The manager can discover improvement areas of the portfolio based on the rules extracted. This is because such rules enable the manager to have new concepts of portfolio coverage and can show improvement in such areas.
Int. j. eng. bus. manag., 2011, Vol. 3, No. 3, 59-7266 www.intechweb.orgwww.intechopen.com
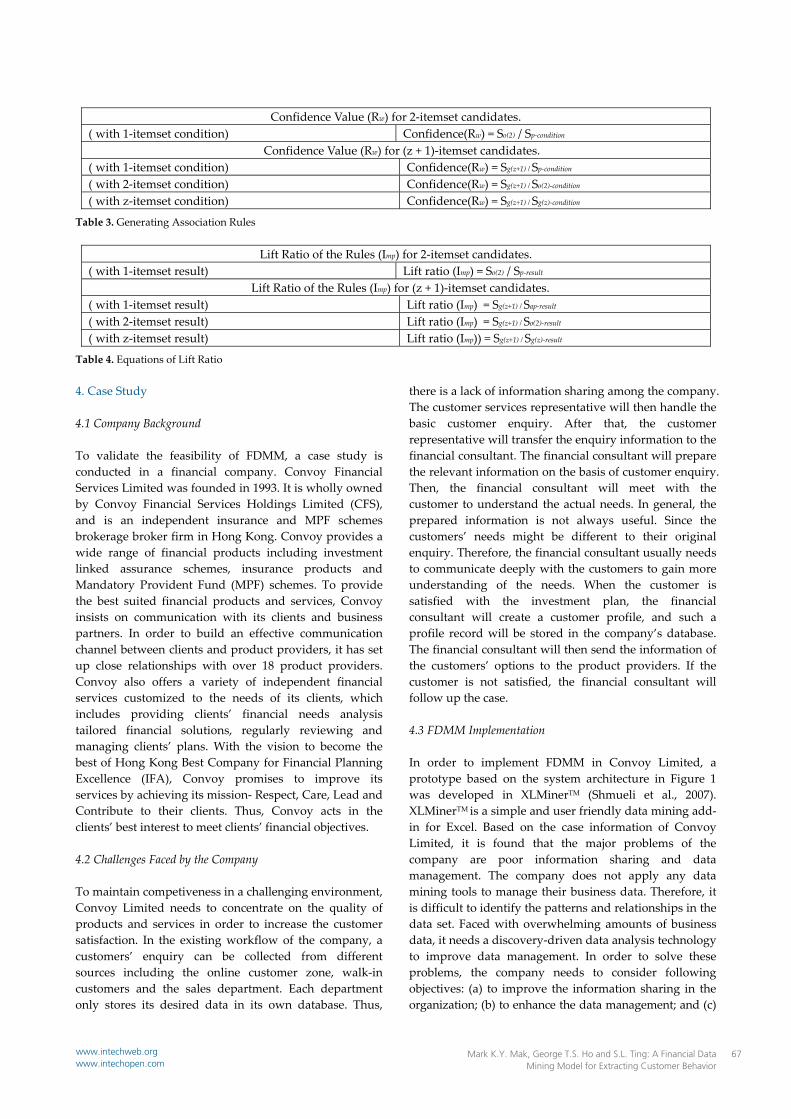
Confidence Value (Rw) for 2‐itemset candidates. ( with 1‐itemset condition) Confidence(Rw) = So(2) / Sp‐condition
Confidence Value (Rw) for (z + 1)‐itemset candidates. ( with 1‐itemset condition) Confidence(Rw) = Sg(z+1) / Sp‐condition ( with 2‐itemset condition) Confidence(Rw) = Sg(z+1) / So(2)‐condition ( with z‐itemset condition) Confidence(Rw) = Sg(z+1) / Sg(z)‐condition
Table 3. Generating Association Rules
Lift Ratio of the Rules (Imp) for 2‐itemset candidates. ( with 1‐itemset result) Lift ratio (Imp) = So(2) / Sp‐result
Lift Ratio of the Rules (Imp) for (z + 1)‐itemset candidates. ( with 1‐itemset result) Lift ratio (Imp) = Sg(z+1) / Sap‐result ( with 2‐itemset result) Lift ratio (Imp) = Sg(z+1) / So(2)‐result ( with z‐itemset result) Lift ratio (Imp)) = Sg(z+1) / Sg(z)‐result
Table 4. Equations of Lift Ratio 4. Case Study 4.1 Company Background To validate the feasibility of FDMM, a case study is conducted in a financial company. Convoy Financial Services Limited was founded in 1993. It is wholly owned by Convoy Financial Services Holdings Limited (CFS), and is an independent insurance and MPF schemes brokerage broker firm in Hong Kong. Convoy provides a wide range of financial products including investment linked assurance schemes, insurance products and Mandatory Provident Fund (MPF) schemes. To provide the best suited financial products and services, Convoy insists on communication with its clients and business partners. In order to build an effective communication channel between clients and product providers, it has set up close relationships with over 18 product providers. Convoy also offers a variety of independent financial services customized to the needs of its clients, which includes providing clients’ financial needs analysis tailored financial solutions, regularly reviewing and managing clients’ plans. With the vision to become the best of Hong Kong Best Company for Financial Planning Excellence (IFA), Convoy promises to improve its services by achieving its mission‐ Respect, Care, Lead and Contribute to their clients. Thus, Convoy acts in the clients’ best interest to meet clients’ financial objectives. 4.2 Challenges Faced by the Company To maintain competiveness in a challenging environment, Convoy Limited needs to concentrate on the quality of products and services in order to increase the customer satisfaction. In the existing workflow of the company, a customers’ enquiry can be collected from different sources including the online customer zone, walk‐in customers and the sales department. Each department only stores its desired data in its own database. Thus,
there is a lack of information sharing among the company. The customer services representative will then handle the basic customer enquiry. After that, the customer representative will transfer the enquiry information to the financial consultant. The financial consultant will prepare the relevant information on the basis of customer enquiry. Then, the financial consultant will meet with the customer to understand the actual needs. In general, the prepared information is not always useful. Since the customers’ needs might be different to their original enquiry. Therefore, the financial consultant usually needs to communicate deeply with the customers to gain more understanding of the needs. When the customer is satisfied with the investment plan, the financial consultant will create a customer profile, and such a profile record will be stored in the company’s database. The financial consultant will then send the information of the customers’ options to the product providers. If the customer is not satisfied, the financial consultant will follow up the case. 4.3 FDMM Implementation In order to implement FDMM in Convoy Limited, a prototype based on the system architecture in Figure 1 was developed in XLMinerTM (Shmueli et al., 2007). XLMinerTM is a simple and user friendly data mining add‐in for Excel. Based on the case information of Convoy Limited, it is found that the major problems of the company are poor information sharing and data management. The company does not apply any data mining tools to manage their business data. Therefore, it is difficult to identify the patterns and relationships in the data set. Faced with overwhelming amounts of business data, it needs a discovery‐driven data analysis technology to improve data management. In order to solve these problems, the company needs to consider following objectives: (a) to improve the information sharing in the organization; (b) to enhance the data management; and (c)
Mark K.Y. Mak, George T.S. Ho and S.L. Ting: A Financial Data Mining Model for Extracting Customer Behavior
67www.intechweb.orgwww.intechopen.com

Period Total number of customers (65)(Cluster 1 )
Total number of customers (52)(Cluster 2)
1‐3 years 2 8 3‐5 years 4 14 5‐10 years 7 21 10‐20 years 13 5 20 or above 39 4
Table 5. Investment Horizon Code Name DescriptionS1 Dynamic Evergreen (Medium risk) Seek to achieve returns over an 18‐months term S2 Dynamic Growth (Medium to high risk) Seek to achieve competitive long term capital growth S4 Global Opportunity (High risk) Seek to achieve returns in the medium to long term.
Table 6. Descriptions of Investment Linked Assurance Scheme
Figure 5. Raw Data from Convoy Limited to increase customer satisfaction. The company can follow these objectives and then find out the best solutions for improving the existing workflow of the company. 4.3.1 K‐means Clustering Phase The objectives of FDMM are to identify the influencing factors on investment and gain further understanding of investor behavior. Thus, basic customer information, including age, experience and the income, is used for analysis. The reasons for selecting these three variables are that these three variables mainly influenced investment behavior. Many studies reveal that experience is the most significant factor influencing investing behavior. Also, the asset allocations of each portfolio depend on the income of the clients. In order to prove that higher income can drive more diversification of the choices of the portfolio, the income variable is selected .In addition to income, age is considered as a variable. Since the categories of the portfolio mainly cover the life insurance and MPF, age is an influencing factor that
affects the asset allocation. These two products might be varied due to differences of age. Figure 5 shows the data set, in which each row represents a customer profile. In K‐means clustering phase, customers are segmented into appropriate groups based on their characteristics. Considering the numerical measurement of the K‐means algorithm, only the interval variables (age, income and investment experience) are selected (i.e. the portfolio is ignored). However, it would be used for generating the useful rules in a later part. By defining the cluster as 2 and using the “K‐Means Clustering” function in XLMinerTM, interpreting the results of the two clusters are highlighted as follows: Cluster 1: Table 5 shows the investment horizon of both clusters. Over a half the customers in this group are more likely to seek a long term investment horizon (20 years or above). To achieve a long term capital growth, this group tends to select more risky portfolios. It implies that such customers can tolerance a high risk. Table 6 shows the description of investment linked assurance schemes
Int. j. eng. bus. manag., 2011, Vol. 3, No. 3, 59-7268 www.intechweb.orgwww.intechopen.com
offered by the company. It can be seen that there is a significant proportion of customers prefer choosing the S2 investment and almost a half the customers selected S4. These two types of investment style are more risky compared with S1. Thus, this group can be considered more aggressive than cluster 2. The results provide an insight into the marketing implication of this group. The company can identify such a group as potentially valued customers. Cluster 2: This cluster indicates that the higher age of customers means higher investment experience. The past investment experience might provide such customers with more risk awareness. Thus, this group tends to diversify their portfolios. The main bulk of the portfolios consists of more than 75% of bond funds such as global bond, US bonds, and they are expected to seek steady and slow returns. Therefore, the mainly selected type of portfolio is S1. In addition to bond funds, this group mainly selects life insurance and medical insurance. Thus, the company can offer a conservative portfolio to this group of customers.
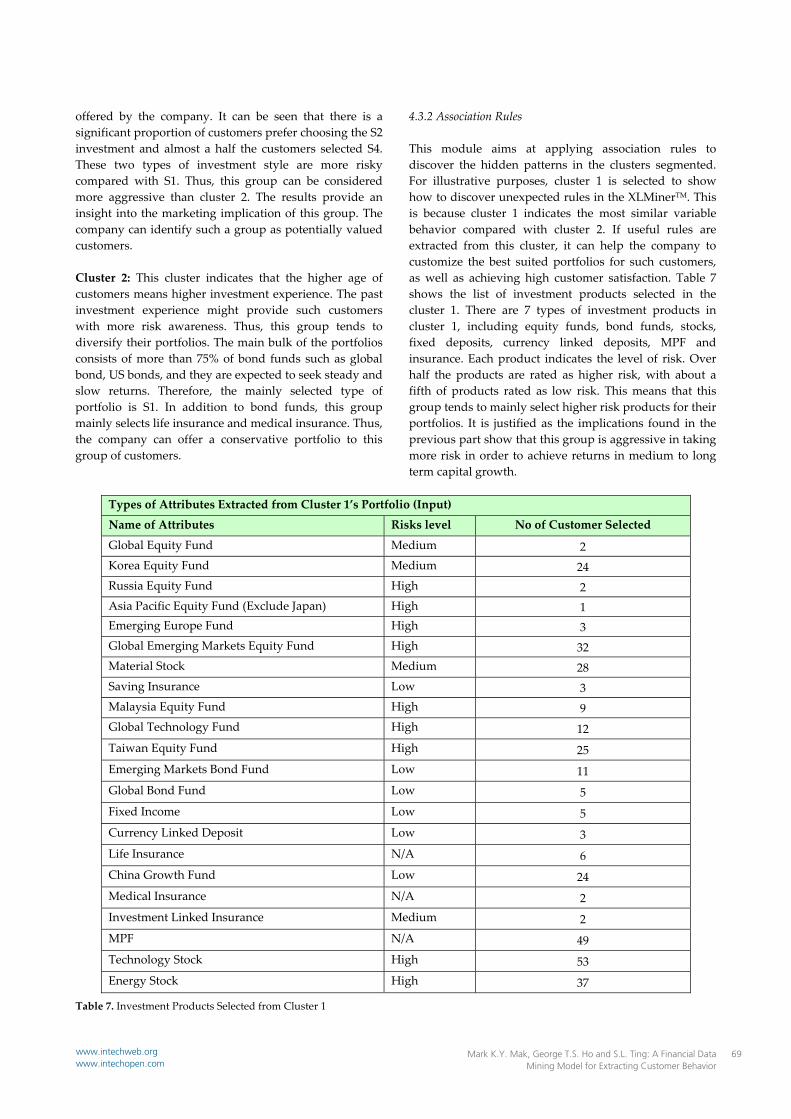
4.3.2 Association Rules This module aims at applying association rules to discover the hidden patterns in the clusters segmented. For illustrative purposes, cluster 1 is selected to show how to discover unexpected rules in the XLMinerTM. This is because cluster 1 indicates the most similar variable behavior compared with cluster 2. If useful rules are extracted from this cluster, it can help the company to customize the best suited portfolios for such customers, as well as achieving high customer satisfaction. Table 7 shows the list of investment products selected in the cluster 1. There are 7 types of investment products in cluster 1, including equity funds, bond funds, stocks, fixed deposits, currency linked deposits, MPF and insurance. Each product indicates the level of risk. Over half the products are rated as higher risk, with about a fifth of products rated as low risk. This means that this group tends to mainly select higher risk products for their portfolios. It is justified as the implications found in the previous part show that this group is aggressive in taking more risk in order to achieve returns in medium to long term capital growth.
Types of Attributes Extracted from Cluster 1’s Portfolio (Input)
Name of Attributes Risks level No of Customer Selected
Global Equity Fund Medium 2 Korea Equity Fund Medium 24 Russia Equity Fund High 2 Asia Pacific Equity Fund (Exclude Japan) High 1 Emerging Europe Fund High 3 Global Emerging Markets Equity Fund High 32 Material Stock Medium 28 Saving Insurance Low 3 Malaysia Equity Fund High 9 Global Technology Fund High 12 Taiwan Equity Fund High 25 Emerging Markets Bond Fund Low 11 Global Bond Fund Low 5 Fixed Income Low 5 Currency Linked Deposit Low 3 Life Insurance N/A 6 China Growth Fund Low 24 Medical Insurance N/A 2 Investment Linked Insurance Medium 2 MPF N/A 49 Technology Stock High 53 Energy Stock High 37
Table 7. Investment Products Selected from Cluster 1
Mark K.Y. Mak, George T.S. Ho and S.L. Ting: A Financial Data Mining Model for Extracting Customer Behavior
69www.intechweb.orgwww.intechopen.com

Figure 6. Summary Report of Association Rules
Similar to the clustering analysis, the “Association Rules” function of XLMinerTM is applied to interpret the results. Figure 6 shows that there are eight useful rules generated. As shown in the figure, five rules (rule 1, 2, 4, 5, and 6) have a confidence level of 100%. It implies that such rules are highly reliable in indicating the success rate of investment decision making, based on these rules. All rules’ lift ratios are greater than 1. It provides an insight into the prediction so as to increase the probability of the “THEN” (result) and the “IF (condition) parts. It also indicates that all items in the generated rules are positively correlated with other items. Take rule 1 as an example, the Korea equity fund and material stock have a positive correlation with the global emerging markets equity fund. The support of the items also provides marketing implications. There are 53 observations of technology stocks in the cluster 2, which is 81.54% of total observations. All the rules contain technology stock. This means that this group will buy technology stocks under particular conditions. A strong relationship between MPF and technology stocks is explained by rule 2, 4, 5, 6, 7, and 8. (IF the clients select MPF, THEN they will select technology stocks as well). This gives information to the company so as to facilitate decision making based on these rules. 4.3.3 Rule Analysis After the rules generation, a set of rules can be used for formulating market strategies. In this paper, rule 2 is selected as an illustrative example (Taiwan equity fund & MPF Technology stock). As indicated in rule 2, the company can now regularly review the customer profile. If the customer bought the Taiwan equity fund, the sales team can check whether the relevant rule exists in the ARs pool. If the rule exists, the financial advisor can formulate the appropriate promotion plan for that specific customer. After that, the financial advisor can contact the customer so as to follow up his/her existing
financial plan and then promote the MPF. If the customer is not interested in buying MPF, the financial advisor can provide discounts such as cash coupon, first month free of charge of the service, to motivate the customer. It can raise the awareness of the portfolio to that customer despite customer not buying the MPF. On the other hand, if the customer bought the MPF, the sales team can note this customer so as to promote the technology stock later. This can increase the success rate of the promotion. 5. Discussion and Conclusions After the financial crisis of 2008 and the global crisis of 2009, investors are becoming more cautious towards investments, especially in high risk financial products. These financial issues make it more difficult to devise a portfolio. In fact, customer orientation is becoming a trend in today’s business. Many companies want to understand customers’ needs, requirements and preferences in order to achieve high customer satisfaction. Customer satisfaction relies on superior products and services that the company provides. To customize the products and services, a company needs to gain more understanding of customer behavior. However, many companies lack a decision support system. The managers, thus, have difficulty in understanding the correlations in the data and in customer behavior. In addition to providing superior products or services, many companies are facing the challenge of handling a huge growing amount of data in daily transactions. Attempting to address these challenges, the aim of the paper is to develop an intelligent Financial Data Mining Model (FDMM) that can help financial companies to tackle the problems. The fundamentals of FDMM are that firstly, all the relevant quality data are collected and preprocessed through DSPM, so each department can share information across the organization. Secondly, the CM is developed to partition the customers into specific groups. The segmented groups provide marketing implications to
Int. j. eng. bus. manag., 2011, Vol. 3, No. 3, 59-7270 www.intechweb.orgwww.intechopen.com

the sales managers so as to develop customer values for highly profitable customers. Thirdly, the RDM is developed to generate useful rules for the target clusters. The unique characteristic of RDM is that it will keep going as newly formed data are continually loaded into RDM for rules mining. The new data may be of great interest for the company. Thus, knowledge discovery is an interminable process which allows the central data warehouse to become richer and richer. The useful rules can be integrated with industry knowledge, experience, customer needs, etc. This makes the products and services superior and hence increases customer satisfaction. Finally, the introduced data mining software ‐ XLMinerTM ‐ not only validates the proposed method but also provides a road map for implementing FDMM in real world practice. With the fundamentals of data mining methods and software implementation, a company can discover the patterns on how to build a customized portfolio based on the rules extracted and can learn more about investors’ behavior in financial markets. This can effectively support the company for a long term sustainable success development. 6. References 1. Agrawal, R., Imielinski, T., Swami, A.N., 1993, Data
mining: A performance perspective, IEEE Transactions on Knowledge and Data Engineering, vol. 5, no. 6, pp. 914–925.
2. Berry, M.J.A., Linoff, G.S., 2004, Data mining techniques for marketing, sales, and customer relationship management, Ind: Wiley, Indianapolis.
3. Chiang, W.Y., 2011, To mine association rules of customer values via a data mining procedure with improved model: An empirical case study, Expert Systems with Applications, vol. 38, no. 3, pp. 1716–1722.
4. Chung, R.C.P., Ip, W.H., Chan, S.L., 2009, An ARIMA‐Intervention analysis model for the financial crisis in China’s manufacturing industry, International Journal of Engineering Business Management, vol. 1, no. 1, pp. 15‐18.
5. Hosseini, S.M.S., Maleki, A., Gholamian, M.R., 2010, Cluster analysis using data mining approach to develop CRM methodology to assess the customer loyalty, Expert Systems with Applications, Vol. 37, no. 7, pp. 5259‐5264.
6. Kim, J.S., 2004, Customized recommendation mechanism based on web data mining and case‐based reasoning, In: M. Mohammadian (ed.) Intelligent agents for data mining and information retrieval, Idea Group Pub, Hershey, PA.
7. Kirkos, E., Spathis, C., Manolopoulos, Y., 2007, Data Mining techniques for the detection of fraudulent financial statements, Expert Systems with Applications, Vol. 32, no. 4, pp. 995‐1003.
8. Kuo, R.J., Chao, C.M., Chiu, Y.T., 2009, Application of particle swarm optimization to association rule mining, Applied Soft Computing, vol. 11, no. 1, pp. 326–336.
9. Kwan, I.S.Y., Fong, J., Wong, H.K., 2005, An e‐customer behavior model with online analytical mining for internet marketing planning, Decision Support Systems, vol. 41, no. 1, pp. 189‐204.
10. Li, Y., Cai, H.J., Tan. H., 2008, Frequent patterns of investment behaviors in Shanghai stock market, In: Proceedings of the 2008 International Conference on Computer Science and Software Engineering, 13 November 2008, China.
11. Liang, D., Christos, T., 2003, Experiences of using a quantitative approach for mining association rules, in: Lecture Notes Computer Science, vol. 2690, pp. 693‐700.
12. Liao, S.H., Chen, C.M., Wu, C.H., 2008, Mining customer knowledge for product line and brand extension in retailing, Expert Systems with Applications, vol. 34, no. 3, pp. 1763–1776.
13. Nanda, S.R., Mahanty, B., Tiwari, M.K., 2010, Clustering Indian stock market data for portfolio management, Expert Systems with Applications, vol. 37, no. 12, pp. 8793‐8798.
14. Nenad, J., Svetlozar, N., 2006, Comprehensive data warehouse exploration with qualified association‐rule mining, Decision Support Systems, vol. 42, no. 2, pp. 859–878.
15. Ngai, E.W.T., Xiu, L., Chau, D.C.K., 2009, Application of data mining techniques in customer relationship management: A literature review and classification, Expert Systems with Applications, Vol. 36, no. 2, pp. 2592‐2602.
16. Shmueli, G., Patel, N.R., Bruce, P.C., 2007, Data mining for business intelligence : concepts, techniques, and applications in Microsoft Office Excel with XLMiner, N.J.: Wiley Interscience, Hoboken.
17. Sohn, Y.S., Kim, Y., 2008, Searching customer patterns of mobile service using clustering and quantitative association rule, Expert Systems with Applications, vol. 34, no. 2, pp. 1070–1077.
18. Sung, H.N., So, Y. S., 2011, Forecasting changes in Korea Composite Stock Price Index (KOSPI) using association rules, Expert Systems with Applications, vol. 38, no. 7, 9046–9049.
19. Ting, S.L., Shum, C.C., Kwok, S.K., Tsang, A.H.C., Lee, W.B., 2009, Data mining in biomedicine: Current applications and further directions for research, Journal of Software Engineering & Applications, vol. 2, no. 3, pp. 150‐159.
20. Vazirgiannis, M., Halkidi, M., Gunopulos, D., 2003, Uncertainty handling and quality assessment in data mining, Hong Kong: Springer, London.
21. Wu, X.D., Kumar, V., Quinlan, J.R., Ghosh, J., Yang, Q., Motoda, H., McLachlan, G.J., Ng, A., Liu, B., Yu, P.S.,
Mark K.Y. Mak, George T.S. Ho and S.L. Ting: A Financial Data Mining Model for Extracting Customer Behavior
71www.intechweb.orgwww.intechopen.com

Zhou, Z., Steinbach, M., Hand, D.J., Steinberg, D., 2008, Top 10 algorithms in data mining, Knowledge and Information Systems, vol. 14, no. 1, pp. 1–37.
22. Zhang, D., Zhou, L., 2004, Discovering golden nuggests: Data mining in financial application, IEEE Transactions on Systems, Man, and Cybernetics ‐ Part C: Applications and Reviews, vol. 34, no. 4, pp. 513‐522.
Int. j. eng. bus. manag., 2011, Vol. 3, No. 3, 59-7272 www.intechweb.orgwww.intechopen.com