A few enlarged chloroplasts are less efficient in ...
12
1 SCIENTIFIC REPORTS | 7: 5782 | DOI:10.1038/s41598-017-06460-0 www.nature.com/scientificreports A few enlarged chloroplasts are less efficient in photosynthesis than a large population of small chloroplasts in Arabidopsis thaliana Dongliang Xiong 1,2 , Jianliang Huang 1,3 , Shaobing Peng 1 & Yong Li 1 The photosynthetic, biochemical, and anatomical traits of accumulation and replication of chloroplasts (arc) mutants of Arabidopsis thaliana were investigated to study the effects of chloroplast size and number on photosynthesis. Chloroplasts were found to be significantly larger, and the chloroplast surface area exposed to intercellular air spaces (S c ) significantly lower in the mutants than in their wild- types. The decreased S c and increase cytoplasm thickness in the mutants resulted in a lower mesophyll conductance (g m ) and a consequently lower chloroplast CO 2 concentration (C c ). There were no significant differences between the mutants and their wild-types in maximal carboxylation rate (V cmax ), maximal electron transport (J cmax ), and leaf soluble proteins. Leaf nitrogen (N) and Rubisco content were similar in both Wassilewskija (Ws) wild-type (Ws-WT) and the Ws mutant (arc 8), whereas they were slightly higher in Columbia (Col) wild-type (Col-WT) than the Col mutant (arc 12). The photosynthetic rate (A) and photosynthetic N use efficiency (PNUE) were significantly lower in the mutants than their wild- types. The mutants showed similar A/C c responses as their wild-type counterparts, but A at given C c was higher in Col and its mutant than in Ws and its mutant. From these results, we conclude that decreases in g m and C c are crucial to the reduction in A in arc mutants. e chloroplast is one of the most important plant organelles and carries out many important functions such as fatty acid synthesis, nitrogen (N) and sulphur fixation, and especially photosynthetic carbon fixation 1 . During the process of leaf development, proplastids in meristematic cells first differentiate into primeval chloroplasts, then undergo subsequent divisions to produce a large population of small chloroplasts in mesophyll cells 2, 3 . Many genetic approaches to understand chloroplast division and development in mesophyll cells in the model plant, Arabidopsis thaliana, have been used in the past decades. It is widely believed that chloroplasts are derived from ancient cyanobacterial endosymbionts. Chloroplast size and the number of chloroplasts per cell are regu- lated by both genetic and environmental factors. Rapid advances have been made in research on the regulatory mechanisms of chloroplast division in recent years due, in part, to the isolation of accumulation and replication of chloroplast (arc) mutants in A. thaliana 4–9 . arc mutants exhibit alterations in chloroplast size and number of mes- ophyll cells. In addition to genetic factors, the growth environment has been shown to play an important role in chloroplast size and number in mesophyll cells. Numerous studies have reported that chloroplast size and num- ber increase under a high CO 2 concentration 10–12 but decrease under high temperature 13, 14 . In addition, several studies investigating the effects of enlarged chloroplasts on photosynthesis using A. thaliana arc mutants found that the photosynthetic rate (A) decreased in arc mutants 15 . Most recently, the decline of mesophyll conductance (g m ) in arc mutants was observed by Weise, et al. 16 However, the anatomical factors leading to a lower g m in arc mutants are not clear yet. Although the regeneration of ribulose-1,5-bisphosphate (RuBP) has been observed to limit A in sev- eral studies 17, 18 , A in well-grown C 3 plants under light-saturated conditions is mainly considered to be 1 National Key Laboratory of Crop Genetic Improvement, MOA Key Laboratory of Crop Ecophysiology and Farming System in the Middle Reaches of the Yangtze River, College of Plant Science and Technology, Huazhong Agricultural University, Wuhan, Hubei, 430070, China. 2 Research Group on Plant Biology under Mediterranean Conditions, Universitat de les Illes Balears, Carretera de Valldemossa Km 7.5, 07121, Palma de Mallorca, Illes Balears, Spain. 3 Hubei Collaborative Innovation Center for Grain Industry, Yangtze University, Jingzhou, Hubei, 434023, China. Correspondence and requests for materials should be addressed to Y.L. (email: [email protected]) Received: 12 May 2016 Accepted: 13 June 2017 Published: xx xx xxxx OPEN
Transcript of A few enlarged chloroplasts are less efficient in ...

1Scientific RepoRts | 7: 5782 | DOI:10.1038/s41598-017-06460-0
www.nature.com/scientificreports
A few enlarged chloroplasts are less efficient in photosynthesis than a large population of small chloroplasts in Arabidopsis thalianaDongliang Xiong1,2, Jianliang Huang1,3, Shaobing Peng1 & Yong Li1
The photosynthetic, biochemical, and anatomical traits of accumulation and replication of chloroplasts (arc) mutants of Arabidopsis thaliana were investigated to study the effects of chloroplast size and number on photosynthesis. Chloroplasts were found to be significantly larger, and the chloroplast surface area exposed to intercellular air spaces (Sc) significantly lower in the mutants than in their wild-types. The decreased Sc and increase cytoplasm thickness in the mutants resulted in a lower mesophyll conductance (gm) and a consequently lower chloroplast CO2 concentration (Cc). There were no significant differences between the mutants and their wild-types in maximal carboxylation rate (Vcmax), maximal electron transport (Jcmax), and leaf soluble proteins. Leaf nitrogen (N) and Rubisco content were similar in both Wassilewskija (Ws) wild-type (Ws-WT) and the Ws mutant (arc 8), whereas they were slightly higher in Columbia (Col) wild-type (Col-WT) than the Col mutant (arc 12). The photosynthetic rate (A) and photosynthetic N use efficiency (PNUE) were significantly lower in the mutants than their wild-types. The mutants showed similar A/Cc responses as their wild-type counterparts, but A at given Cc was higher in Col and its mutant than in Ws and its mutant. From these results, we conclude that decreases in gm and Cc are crucial to the reduction in A in arc mutants.
The chloroplast is one of the most important plant organelles and carries out many important functions such as fatty acid synthesis, nitrogen (N) and sulphur fixation, and especially photosynthetic carbon fixation1. During the process of leaf development, proplastids in meristematic cells first differentiate into primeval chloroplasts, then undergo subsequent divisions to produce a large population of small chloroplasts in mesophyll cells2, 3. Many genetic approaches to understand chloroplast division and development in mesophyll cells in the model plant, Arabidopsis thaliana, have been used in the past decades. It is widely believed that chloroplasts are derived from ancient cyanobacterial endosymbionts. Chloroplast size and the number of chloroplasts per cell are regu-lated by both genetic and environmental factors. Rapid advances have been made in research on the regulatory mechanisms of chloroplast division in recent years due, in part, to the isolation of accumulation and replication of chloroplast (arc) mutants in A. thaliana4–9. arc mutants exhibit alterations in chloroplast size and number of mes-ophyll cells. In addition to genetic factors, the growth environment has been shown to play an important role in chloroplast size and number in mesophyll cells. Numerous studies have reported that chloroplast size and num-ber increase under a high CO2 concentration10–12 but decrease under high temperature13, 14. In addition, several studies investigating the effects of enlarged chloroplasts on photosynthesis using A. thaliana arc mutants found that the photosynthetic rate (A) decreased in arc mutants15. Most recently, the decline of mesophyll conductance (gm) in arc mutants was observed by Weise, et al.16 However, the anatomical factors leading to a lower gm in arc mutants are not clear yet.
Although the regeneration of ribulose-1,5-bisphosphate (RuBP) has been observed to limit A in sev-eral studies17, 18, A in well-grown C3 plants under light-saturated conditions is mainly considered to be
1National Key Laboratory of Crop Genetic Improvement, MOA Key Laboratory of Crop Ecophysiology and Farming System in the Middle Reaches of the Yangtze River, College of Plant Science and Technology, Huazhong Agricultural University, Wuhan, Hubei, 430070, China. 2Research Group on Plant Biology under Mediterranean Conditions, Universitat de les Illes Balears, Carretera de Valldemossa Km 7.5, 07121, Palma de Mallorca, Illes Balears, Spain. 3Hubei Collaborative Innovation Center for Grain Industry, Yangtze University, Jingzhou, Hubei, 434023, China. Correspondence and requests for materials should be addressed to Y.L. (email: [email protected])
Received: 12 May 2016
Accepted: 13 June 2017
Published: xx xx xxxx
OPEN

www.nature.com/scientificreports/
2Scientific RepoRts | 7: 5782 | DOI:10.1038/s41598-017-06460-0
limited by two factors under ambient CO2 concentrations: leaf biochemistry (i.e., the carboxylation capacity of ribulose-1,5-bisphosphate carboxylase/oxygenase; Rubisco) and/or CO2 supplementation18. In C3 plants, a large amount of total leaf N exists in chloroplasts, mainly forming photosynthetic proteins in the stroma. As a key enzyme in photosynthesis, Rubisco is exceptionally abundant, accounting for approximately half of total leaf N. Because of the large investment of leaf N in Rubisco and electron transport proteins (the latter with approximately 7% of total leaf N), a strong and positive correlation between A and leaf N content per leaf area is frequently observed17. Therefore, increasing the chloroplast volume per unit leaf area, and hence increasing the leaf N con-tent, would potentially increase the rate of photosynthesis.
Under a given environmental condition (i.e. temperature and light), the carboxylation to oxygenation ratio of RuBP is determined by the CO2 concentration in the chloroplast (Cc)19–23. CO2 molecules diffuse from the atmosphere into chloroplasts by overcoming a series of diffusion resistances, including the boundary layer, sto-mata and mesophyll resistances, which results in a remarkable drawdown in Cc compared to the atmospheric CO2 concentration. The diffusion conductances of stomata and mesophyll tissues are defined as stomatal conductance (gs) and gm, respectively. In the last 10–15 years, considerable efforts have been focused on the chloroplast features that determine gm. These have shown that there is a tight relationship between the area of chloroplast surface exposed to intercellular airspaces (Sc) and gm
22, 24–26. In mesophyll cells, chloroplasts are usually located next to the cytoplasmic membrane adjacent to intercellular air spaces, which was suggested to decrease resistance to CO2 diffusion25. Smaller chloroplasts are more flexible in movement than larger chloroplasts, especially under variable environmental conditions27, 28, which was suggested as the explanation why plants usually contain many small chloroplasts rather than a few large ones.
Although the important role of chloroplast number as well as chloroplast shape in gm decreasing was suggested in the study of Weise et al.16, the reasons of low A and gm in arc mutants are still unclear. As described above, both leaf structural properties, which were not quantified in their study, play the key role in determining A. In the present study, we used two Arabidopsis arc mutants and the corresponding wild-type plants to investigate the effects of chloroplast size and number on photosynthesis. Our objective was to evaluate whether a small number of enlarged chloroplasts is less beneficial to photosynthesis than a large population of small chloroplasts using leaf structural and biochemical analysis and 1-D mesophyll conductance model.
ResultsGrowth performance and photosynthetic characteristics. To investigate the effects of chloroplast size and number on plant performance and photosynthesis, the photosynthetic characteristics of two arc mutants and their wild-types (Table 1) were analysed. Both mutants exhibited lower A, transpiration (E) and CO2 diffu-sion conductance than their wild-types, and consequently reduced biomass accumulation (Table 2 and Fig. 1). Compared with Columbia (Col) and Wassilewskija (Ws) wild-type plants, gs was reduced by 42.4% and 61.0% in their respective mutants (arc 12 and arc 8) (Table 2). The intercellular CO2 concentration (Ci) was similar in both arc 12 and Col-WT, although it was lower in arc 8 than in Ws-WT. Furthermore, gm was determined using two independent methods and showed a good correlation in both (Table 2). Similar to gs, the gm in the mutants was significantly lower than that in the wild-type plants, resulting in a greater drawdown of Cc from Ci. Day respira-tion (Rd) and CO2 compensation point in the absence of respiration (Γ*) were similar in the mutants and their wild-types.
A in the mutants was generally lower than that in their wild-types across the supplied CO2 concentrations (Fig. 2a). Interestingly, the maximal A from the A/Ci curves (Amax) in arc 8 was comparable with that in Ws-WT, although Amax was lower in arc 12 than in Col-WT. The mutants and their respective wild-types generally showed similar A/Cc response curves; Col-WT and arc12 showed a higher A than Ws-WT and arc8 at a given Cc (Fig. 2b). The maximum velocity of carboxylation (Vcmax) and maximum electron transport (Jcmax), calculated from the A/Ci curves, were similar in the mutants and their wild-types (Table 2). Moreover, the light-saturated A and light saturation point determined from the light response curves were significantly lower in the mutants and their wild-types (Fig. 2c).
Differences in plant growth and photosynthetic parameters were also observed between accessions. The bio-mass, A, gt, gm, Vcmax, Jcmax, Amax and electron transport rate (J) of Col-WT were higher than those of Ws-WT. Conversely, gs, Ci and Cc were lower in Col-WT than in Ws-WT (Table 2, Figs 1 and 3a). The quantitative limita-tion analysis (Fig. 4) showed that the decreases of A in two mutants were mostly due to a mesophyll conductance limitation (Lm, 29.9% in arc 12; and 49.8% in arc 8), followed by a stomatal conductance limitation (Ls, 18.5% in arc 12; and 10.9% in arc 8), while the biochemical limitation (Lb, 0.17% in arc 12; and 0.51% in arc 8) was of minor importance in both mutants.
Leaf N content, chlorophyll content, and Rubisco content. The leaf N and Rubisco content per leaf area were significantly higher in Col-WT than in arc 12, but there were no significant differences between
Symbol Ecotype Accessions Chloroplast Number (/Cell)
Col-WT Col-0 N60000 100
arc 12 Col-0 N16472 1–2
Ws-WT Ws N1601 83
arc 8 Ws N284 45
Table 1. Details of the materials used in this study. The chloroplast numbers were obtained from the European Arabidopsis Stock Centre (NASC, http://arabidopsis.info/) with the accession number.

www.nature.com/scientificreports/
3Scientific RepoRts | 7: 5782 | DOI:10.1038/s41598-017-06460-0
Col-WT arc 12 Ws-WT arc 8
A (μmol m−2 s−1) 7.69 ± 0.54 a 3.86 ± 0.40 c 4.72 ± 0.36 b 3.32 ± 0.23 c
gt (mol m−2 s−1) 0.054 ± 0.012 a 0.015 ± 0.002 c 0.049 ± 0.001 b 0.015 ± 0.002 c
gs (mol m−2 s−1) 0.085 ± 0.003 b 0.049 ± 0.008 c 0.100 ± 0.009 a 0.039 ± 0.012 c
gm-Harley (mol m−2 s−1) 0.152 ± 0.041 a 0.022 ± 0.004 c 0.098 ± 0.010 b 0.028 ± 0.008 c
gm-Ethier (mol m−2 s−1) 0.132 ± 0.016 a 0.021 ± 0.007 c 0.097 ± 0.008 b 0.029 ± 0.006 c
gm-anatomy (mol m−2 s−1) 0.111 ± 0.003 a 0.069 ± 0.010 c 0.087 ± 0.005 b 0.065 ± 0.011 c
Ci (μmol mol−1) 292 ± 21 b 309 ± 17 b 341 ± 8 a 299 ± 29 b
Cc (μmol mol−1) 239 ± 27 b 132 ± 32 d 293 ± 7 a 172 ± 12 c
E (μmol m−2 s−1) 1.56 ± 0.21 a 0.92 ± 0.13 b 1.84 ± 0.24 a 0.96 ± 0.30 b
Rd (μmol m−2 s−1) 1.61 ± 0.16 1.54 ± 0.19 1.37 ± 0.11 1.26 ± 0.18
Г* (μmol mol−1) 41.3 ± 3.4 40.6 ± 2.7 39.5 ± 3.1 40.1 ± 3.3
J (μmol m−2 s−1) 56.0 ± 4.1 a 47.0 ± 8.5 b 33.7 ± 2.4 c 33.1 ± 1.4 c
Vcmax (μmol m−2 s−1) 30.5 ± 0.7 a 29.8 ± 3.0 a 18.1 ± 2.0 b 18.0 ± 0.9 b
Jcmax (μmol m−2 s−1) 57.8 ± 2.0 a 52.7 ± 4.2 a 35.3 ± 1.9 b 38.9 ± 0.5 b
PNUE (µmol g−1 N s−1) 9.18 ± 0.86 a 5.06 ± 0.39 c 7.82 ± 1.02 b 5.42 ± 0.47 c
Table 2. Leaf functional characteristics. The values shown are the mean ± SD of three replicates. The means were compared with a least significant difference (LSD) test; values followed by the same letter are not significantly different (P < 0.05). A, gs, gm, gt, Ci and Cc were measured at a CO2 concentration of 400 μmol mol−1 and a PPFD of 300 μmol m−2 s−1. A, photosynthetic rate; gt, total CO2 diffusion conductance; gs, stomatal conductance; gm, mesophyll conductance; Ci, intercellular CO2 concentration; Cc, chloroplast CO2 concentration; E, transpiration; Rd, daytime mitochondrial respiration rate; Г*, CO2 photo-compensation point; J, electron transport rate; Vcmax, maximum velocity of carboxylation; Jcmax, maximum electron transport; PNUE, photosynthetic N use efficiency.
Figure 1. Phenotypes and biomass (BM) of plants 72 days after germination. The BM values shown are the mean ± SD of three replicates. The means were compared with a least significant difference (LSD) test; values followed by the same letter are not significantly different (P < 0.05).

www.nature.com/scientificreports/
4Scientific RepoRts | 7: 5782 | DOI:10.1038/s41598-017-06460-0
Ws-WT and arc 8 (Table 3). There was no difference in chlorophyll content per leaf area, chlorophyll a/b, and soluble protein content per leaf area between the mutants and their wild-types. All these chemical traits, except for soluble proteins, were significantly higher in Col than in Ws.
Leaf anatomical and structural features. There were no significant differences between the mutants and their wild-types in leaf thickness (Tleaf), mesophyll thickness (Tmes), cell wall thickness (Tcell-wall), the mesophyll surface area exposed to intercellular air spaces per leaf area (Sm), chloroplast planar area per planar cell area (Pchl), chloroplast stroma thickness (Tstr) or mesophyll tissue occupied by the intercellular air spaces (fias) (Table 4). As expected, chloroplast size (cross-sectional area from microscopy images) was greater in the mutants than in their wild-types, and Sc was lower in the mutants than in their wild-types. The cytoplasm thickness (Tcyt) showed a significantly larger in mutants than in wide types. The leaf mass per area (LMA) was similar in both Col-WT and arc 12, but greater in Ws-WT than in arc 8.
There were no significant differences in Tleaf, Tmes, chloroplast size, or fias between Col-WT and Ws-WT. LMA and Tcell-wall were both greater in arc 8 than in Col-WT, whereas Sm, Sc, and chloroplast planar area per planar cell area (Pchl) were lower in Ws-WT.
Limitation of leaf anatomical traits to mesophyll conductance. The gm values calculated from ana-tomical traits agreed well with the values estimated from whether Harley method or Ethier method (Table 2). From the different components of the whole CO2 diffusion pathway, the limitations of gm were calculated (Fig. 5a,b). Intercellular air spaces (fIAS) represented less than 5.0% of CO2 diffusion resistance (max. 4.1% in Col-WT and min. 2.2% in arc 8). In the cellular phase, the stroma represented about half of diffusion resistance to CO2 (range from 48% in Ws-WT to 53% in arc 12). Otherwise, cell wall and membrane (including Plasmalemma and chloroplast envelope) accounted for ~40% of limitations. The individual components diffusion resistances were quite stable among genotypes.
DiscussionIn C3 plants, under ambient temperature (25 °C) and CO2 concentration (380 ppm), light-saturated photosynthe-sis is primarily limited by Rubisco carboxylation capacity, CO2 diffusion conductance and the RuBP regeneration rate from ambient to chloroplasts17. In the present study, we found that chloroplast size and number affect A by changing CO2 diffusion conductance.
Variation in biochemical features and their effects on photosynthesis. Tight correlations between A and leaf N content and Rubisco content per leaf area were frequently observed in previous studies29. Although the leaf N and Rubisco contents slightly decreased in arc12 and did not decrease in arc8, the A in both mutants was dramatically lower than that in their wild-types. Our results indicate that the decrease in A in the mutants is not, at least not mainly, caused by the changes in leaf N and/or Rubisco content. However, the relatively higher leaf N, Rubisco and chlorophyll content per leaf area in Col-WT compared to Ws-WT at least partly accounted for the higher A in Col-WT (Table 2). Interestingly, in the current study leaf N content, Rubisco and chlorophyll content per leaf area were related to Pchl, and the higher Rubisco and chlorophyll content in Col were related to their larger chloroplast volumes per unit leaf (represented as Pchl). Our results suggest that Rubsico and chlo-rophyll concentrations in chloroplasts may tend to be conservable, which has also been mentioned in previous studies24, 30. Otherwise, the larger total chloroplast volume in Col-WT than in Ws-WT is mainly due to the smaller size of the mesophyll cells and a greater number of chloroplasts in Col-WT (Fig. 3 and Table 4). It can be observed from Fig. 3 that a smaller proportion of mesophyll cell surface was covered with chloroplasts, which was the major reason for the lower Sc in the mutants.
Variation in CO2 diffusion conductance. Compared with the wild-type plants, a lower gs was observed in both mutants. The decreased gs in mutants may be due to changes in stomatal size, density, or opening status, with opening status usually being regulated by leaf water status (i.e leaf water potential). However, in the current study, we did not estimate stomatal features or opening status.
gm, which was calculated using three independent methods, was found to correlate well with A. Photosynthetic limitation analysis (Fig. 4) revealed that the decrease of mesophyll conductance is the most important factor limiting
Figure 2. A/Ci (a), A/Cc (b) and light (c) response curves of the mutants and their wild-types. The values shown are the mean ± SD of three replicates.

www.nature.com/scientificreports/
5Scientific RepoRts | 7: 5782 | DOI:10.1038/s41598-017-06460-0
A in mutants. Mesophyll structural features, including Tcell-wall, Sm, and Sc are believed to play a central role in deter-mining gm
22, 24, 26, 31. Using the 1-D anatomical model, we analyzed the impacts of leaf anatomical traits on meso-phyll conductance by considering all major leaf anatomical traits as described by Tosens et al.32 and Tomas et al.26. We note that many previous studies demonstrated that cell wall porosity and aquaporins can dramatically influ-ence gm, however, the 1-D anatomical model was failed to estimate their contributions. Although the absolute values were not exactly the same, the variable pattern of measured and modeled gm among estimated genotypes were quite similar (Table 2), which suggests that reduction of gm in mutants is mainly related to leaf anatomical traits. The partial limitation analysis (Fig. 5) of gm showed that Tstr, Tcw, and biological membranes are three most
Figure 3. Light (a–d) and transmission electron (e–h) microscope images of Col-WT (a,e), Ws-WT (b,f), arc12 (c,g) and arc 8 (d,h) leaves. Bars represent 10 μm in (a–d) and 5 μm in (e and h).

www.nature.com/scientificreports/
6Scientific RepoRts | 7: 5782 | DOI:10.1038/s41598-017-06460-0
important factors limiting gm. However, there were no significant difference of those traits among wild types and mutants. By modeling the influences of Tstr, Tcyt and Tcw on modeling gm with a variable Sc (Fig. 6), we found that Sc can strongly influence gm. A slight decrease of Sc leads a significant reduce in gm in leaves with a relative thin cell wall (i.e. less than 0.2 µm) or chloroplast stroma (i.e. less than 2 µm) like the A. thaliana leaves (Table 4) estimated here. The Sc of the mutants was significantly lower than that in their wild-types, which resulted in decreased gm in the mutants. Otherwise, the distance between cell membrane and chloroplasts (Tcyt) was increased significantly in the mutants (Table 4 and Fig. 3), which also potentially increased the CO2 diffusion pathway and then decreased the gm (Fig. 6c). Therefore, our results highlight the significant effects of chloroplast size and number on Tcyt and Sc and, consequently, gm and A.
Differences in A/Ci and A/Cc curves. A/Ci curves are frequently used to analyse photosynthetic limitations, including Rubisco carboxylation capacity at low Ci values and RuBP regeneration rate as well as the utilization of photosynthates at high Ci values33. In the present study, the A/Ci curves of the mutants and their wild-types were different, such that the mutants had reduced A compared to their wild-types (Fig. 2a). A was generally not significantly improved in the two wild-types when Ci > 600 μmol mol−1; in contrast, it was significantly higher in the two mutants. This suggested that the CO2 saturation points in the mutants were higher than those in their wild-types. In arc 12, A gradually increased across the supplied CO2 concentrations, and CO2 was not saturated at its highest Ci value of approximately 800 μmol mol−1.
Figure 4. (a) quantitative relative limitations of stomatal conductance (ls), mesophyll conductance (lm) and biochemical factors (lb) and (b) the contributions of stomatal conductance (Ls), mesophyll conductance (Lm) and biochemical factors (Lb) to relative changes in light-saturated photosynthetic rate (A) in mutants (dA/A = (Awild-type − Aarc)/Awild-type). Where the Awild-type and Aarc are the A in wild-types and mutants, respectively.
Col-WT arc 12 Ws-WT arc8
Leaf N content (g m−2) 0.847 ± 0.021 a 0.762 ± 0.047 b 0.604 ± 0.036 c 0.613 ± 0.006 c
Chl a + b (g m−2) 0.239 ± 0.004 a 0.233 ± 0.016 a 0.213 ± 0.033 b 0.225 ± 0.008 b
Chl a/b 2.09 ± 0.11 a 2.04 ± 0.05 a 1.57 ± 0.05 b 1.63 ± 0.14 b
Rubisco (g m−2) 0.510 ± 0.027 a 0.446 ± 0.052 b 0.244 ± 0.038 c 0.212 ± 0.022 c
Protein (g m−2) 0.80 ± 0.02 0.80 ± 0.03 0.76 ± 0.04 0.74 ± 0.11
Table 3. Leaf chemical features The values shown are the mean ± SD of three replicates. The means were compared with a least significant difference (LSD) test; values followed by the same letter are not significantly different (P < 0.05).

www.nature.com/scientificreports/
7Scientific RepoRts | 7: 5782 | DOI:10.1038/s41598-017-06460-0
As suggested earlier, restricted CO2 diffusion conductance accounted for the low A in the mutants. If this is the case, the A/Cc curves would be similar in the mutants and their wild-types, which was indeed observed in the pres-ent study (Fig. 2b). Moreover, A in the mutants gradually increased with increasing CO2 concentrations and reached 6.55 μmol m−2 s−1 in arc 8 which was similar to the 6.66 μmol m−2 s−1 in its wild-type (Fig. 2a). Because CO2 was not saturated for arc 12, Amax in arc 12 (7.56 μmol m−2 s−1) was lower than that in Col-WT (11.72 μmol m−2 s−1). Therefore, the results illustrated by the A/Ci and A/Cc curves also demonstrate that chloroplast size and number can significantly affect A through by CO2 diffusion conductance.
Implications. The question of why photosynthetic mesophyll cells in higher plants contain numerous small chloroplasts rather than one or a few larger ones, has been asked and pursued by many researchers27, 34. It has
Col-WT arc 12 Ws-WT arc 8
LMA (g m−2) 11.38 ± 0.73 b 11.85 ± 0.26 b 14.47 ± 0.49 a 12.93 ± 0.80 b
Tleaf (μm) 80.1 ± 5.6 79.6 ± 11.3 81.1 ± 7.2 75.9 ± 4.7
Tmes (μm) 68.4 ± 3.4 67.8 ± 6.3 71.3 ± 7.6 67.6 ± 5.1
Tcell wall (μm) 0.174 ± 0.006 b 0.181 ± 0.004 b 0.193 ± 0.002 a 0.199 ± 0.007 a
Sm (m2 m−2) 9.02 ± 0.77 a 8.52 ± 0.60 a 7.77 ± 0.54 b 7.38 ± 0.61 b
Sc (m2 m−2) 8.17 ± 0.54 a 5.26 ± 0.60 c 6.31 ± 0.39 b 5.48 ± 0.62 c
Tcyt (μm) 0.100 ± 0.003 b 0.121 ± 0.008 a 0.097 ± 0.009 b 0.123 ± 0.007 a
Tstr (μm) 1.98 ± 0.31 2.13 ± 0.40 1.81 ± 0.31 2.22 ± 0.22
Chloroplast size (μm2) 14.6 ± 2.1 c 198.2 ± 4.7 a 15.1 ± 2.3 c 34.4 ± 3.3 b
Pchl (m2 m−2 mesophyll) 44.3 ± 5.1 a 41.9 ± 2.8 a 31.8 ± 2.9 b 30.6 ± 4.5 b
fias (%) 23.4 ± 3.4 19.9 ± 2.9 22.7 ± 1.7 24.6 ± 3.3
Table 4. Leaf anatomical characteristics. The values shown are the mean ± SD of three replicates. The means were compared with a least significant difference (LSD) test; values followed by the same letter are not significantly different (P < 0.05). LMA, leaf mass per leaf area; Tleaf, leaf thickness; Tmes, mesophyll thickness; Tcell wall, cell wall thickness; Sm, mesophyll cell surface area face to intercellular air space per leaf area; Sc, chloroplast surface area face to intercellular air space per leaf area; Tcyt, cytoplasm thickness; Tstr, chloroplast stroma thickness; Pchl, chloroplast planar area per planar cell area; fias, mesophyll tissue occupied by the intercellular air spaces.
Figure 5. Limitation of mesophyll conductance due to anatomical constraints. (a) Share of the overall gm limitation by gas (lgas) and liquid phase (lliq) and (b) the liquid-phase limitation among its components: cell wall (lcw), cytosol (lcyt), plasmalemma and chloroplast envelope membranes (lp), and chloroplast stroma (lstr). The lias was calculated as gm/gias and the liquid-phase limitations of each components were calculated as li = gm/(gi·Sc).

www.nature.com/scientificreports/
8Scientific RepoRts | 7: 5782 | DOI:10.1038/s41598-017-06460-0
been suggested that small chloroplasts can rapidly change their positions or directions in response to changing irradiance in order to maximize their utilization of limiting irradiance or to minimize photodamage under excess light conditions27. Our study findings highlight the fact that a large population of small chloroplasts in mesophyll cells can benefit CO2 diffusion conductance and the consequent A. Moreover, the photosynthetic N use efficiency (PNUE) was also significantly higher in plants with a large population of small chloroplasts. This suggests that increasing chloroplast number and decreasing chloroplast size would be a potential approach to improve N use efficiency in plants, especially in crops.
Numerous studies have reported that PNUE decreases with increasing leaf N content per leaf area, and much effort has focused on exploring the underlying mechanisms. Lower Rubisco activation status and insufficient CO2 supplementation are frequently observed under high N conditions. It was reported that chloroplast size is signif-icantly increased by high N supplementation in many species22, 35. Moreover, constant Rubisco and chlorophyll concentration in chloroplasts were observed in the present study and by Li, et al.21. Thus, large chloroplasts will have a smaller surface area to volume ratio, leading to a reduction in exposure to intercellular airspaces and thus a lower rate of CO2 diffusion into the chloroplast.
ConclusionThe decreased A in arc mutants was due to their lower Cc. The decreased Cc in the mutants was related to reduced gm, which was strongly constrained by the lowered Sc. From these results, we conclude that the decrease in gm was crucial for the decrease in Cc and A in arc mutants.
Materials and MethodsPlant materials. A. thaliana L. (Heynh) mutants N16472 (arc 12) and N284 (arc 8), and their background lines N60000 (Col-08) and N1601 (Ws-2), respectively, were obtained from the European Arabidopsis Stock Centre (NASC, http://arabidopsis.info/) (Table 1). Seeds were incubated at 4 °C for 2 days, then sown in pots filled with a substrate containing peat, perlite and vermiculite (2:1:1 v/v)36. Pots with plastic trays for sub-irrigation were placed in a growth chamber under controlled condition (8:16 h photoperiod, 23:19 °C day: night temper-ature, light at 350 ± 47 μmol m−2 s−1 and relative humidity at 78 ± 13%). The plants were watered when needed. From 4 weeks after germination, 50 ml of half-strength Hoagland solution37 was added to each pot once per week. Nine weeks after germination, the plants were used for subsequent measurements.
Gas exchange and chlorophyll fluorescence measurements. A portable photosynthesis system equipped with an integrated fluorescence chamber (LI-6400XT; LI-COR Inc., Lincoln, NE, USA) was used to obtain simultaneous measurements of leaf gas exchange and chlorophyll fluorescence. To minimize the effects of leaf position and leaf age, measurements were taken from newly and fully expanded leaves. Photosynthesis was initiated at a leaf temperature of 23 °C, a leaf-to-air vapour pressure deficit (VPD) of 1.1 ± 0.3 kPa, a photosyn-thetic photo flux density (PPFD) of 300 μmol m−2 s−1 with 10% blue light, and a CO2 concentration of 400 μmol mol−1 with a CO2 mixture. After equilibration to a steady state, gas exchange parameters, steady state fluorescence (Fs) and maximal fluorescence (Fm’) were recorded with a light-saturating pulse of 8000 μmol m−2 s−1. The actual photochemical efficiency of photosynthetic system II (ΦPSII) was calculated as:
Φ = −F F F( ’ )/ ’ (1)PSII m s m
The J was calculated as:
= Φ × × α × βJ PPFD (2)PSII
where α is the leaf absorption and β is the partition ratio of absorbed quanta between photosystems I and II. The product of α and β was determined from the slope of the linear correlation between the quantum efficiency of
Figure 6. Modelled mesophyll conductance at 25 °C response to cell wall thickness (Tcw), chloroplast stroma thickness (Tstr) and cytoplasm thickness (Tcyt). Membrane conductance was the same in all simulations. fias, volume fraction of intercellular air space and Sc, area of chloroplast surface exposed to intercellular airspace.

www.nature.com/scientificreports/
9Scientific RepoRts | 7: 5782 | DOI:10.1038/s41598-017-06460-0
gross CO2 uptake (ΦCO2) and 1/4ΦPSII, which was obtained by simultaneously measuring leaf gas exchange and chlorophyll fluorescence at varying light intensities under nonphotorespiratory conditions (<2% O2). Eight dead leaves were used to estimate the leakage effects of the chamber as described in our previous study22.
The variable J method37 was used to calculate Cc and gm:
=Γ + +
− +
⁎ J A RJ A R
C ( 8( ))4( ) (3)c
d
d
=−
g AC C (4)m
i c
In this study, the Laisk method was used to estimate Γ* and Rd. Briefly, the A/Ci curves were measured under three light conditions (50, 100 and 200 μmol m−2 s−1)38. The coordinates of the intersection point of three A/Ci curves were considered to be Ci
* (the apparent CO2 photocompensation point; x-axis) and Rd (y-axis), and Γ* was calculated as:
Γ = +⁎ ⁎C Rg (5)
id
m
In this study, the light response curves and CO2 response curves under ambient O2 condition were also meas-ured. The CO2 concentration for the light response curves was set as 400 μmol mol−1, and the PPFDs were set across a series of 700, 500, 300, 200, 150, 100, 50 and 0 μmol m−2 s−1. The light conditions for the CO2 response curves were set as 300 μmol m−2 s−1 with 10% blue light, and the CO2 concentrations in the reference chamber were set across a series of 400, 200, 150, 100, 50, 400, 600, 800 and 1000 μmol mol−1. Calculation of gm was also conducted using the method of Ethier & Livingston (2004) by using the CO2 response curves, which rely on the gas exchange measurements, adjusting the Farquhar model17 to extract, in conjunction with Vc,max and the gm. In the current study, the total CO2 diffusion conductance was calculated as: gt = 1/(1/gs + 1/gm), and the gm values from the variable J method were used.
Chlorophyll and leaf N content. For the chlorophyll content, leaf tissues were harvested using a circular punch that yields 0.5 cm-diameter leaf discs. Then, chlorophyll was extracted from the leaf discs using 95% (v/v) ethanol (analytically pure, Sinopharm Chemical Reagent Co., Ltd), and the extracted chlorophyll concentra-tion was measured using a spectrophotometer (UV2102, Unico, Shanghai, China)23. For measurements of leaf N content, following photo-scanning, leaves were oven dried at 80 °C to a constant weight. The dried samples were digested with by the micro-Kjeldahl method, and then the N concentrations were measured using a discrete wet chemistry analyser (SmartChem® 200, AMS-Westco, Rome, Italy). The leaf area was determined using Image-J software (Wayne Rasband/NIH, Bethesda, MD, USA), and the leaf mass per area (LMA) was calculated as the ratio of leaf dry mass to leaf area.
Rubisco content. The Rubisco concentration was measured using the sodium dodecyl sulphate poly-acrylamide gel electrophoresis (SDS–PAGE) method22, 23. Leaf tissue was harvested using a circular punch, and immersed in liquid N. Samples were ground in liquid N and homogenized with an extraction buffer containing 50 mM Tris-HCl (pH 8.0), 5 mM β-mercaptoethanol, and 12.5% glycerol (v/v). After centrifugation at 1500 g for 15 min at 4 °C, the supernatants were mixed with an extraction buffer containing 2.0% (w/v) SDS solution, 4% (v/v) β-mercaptoethanol, and 10% (v/v) glycerol. Then, the solution was immediately boiled in a water bath for 1 min. The samples were loaded onto an SDS-PAGE gel containing a 4% (w/v) stacking gel, and a 12.5% (w/v) separating gel. After electrophoresis (DYY-11, Beijing Liuyi Instrument Factory, Beijing, China), the gels were washed several times with deionized water before being stained in 0.25% Coomassie blue staining solution for 9 h and then destained until the background was colourless. Both the large and small subunits were transferred into a 10 ml cuvette containing 2 ml of formamide and incubated in a 50 °C water bath for 8 h. The absorbance of the washed solution was measured at 595 nm (Infinite M200, Tecan U.S., Inc., Männedorf, Switzerland) using the background gel as a blank and bovine serum albumin (BSA) as a protein standard.
Microscopy analysis. After gas exchange measurements, five small leaf discs approximately 1.2 × 4.0 mm were immediately removed from the leaf section inside the chamber with a razor blade, taking care to avoid the midveins. The leaf discs were infiltrated in a vacuum chamber (DZF-6050, Shanghai Hasuc Co. Ltd, Shanghai, China) with the fixative 2.5% glutaric aldehyde in 0.1 M phosphate buffer (pH = 7.6) at 4 °C, and then the samples were stored at 4 °C until analysis. Samples were cut using a fully automated rotary microtome (Leica RM2265, Leica Microsystems, Milton Keynes, UK) and were examined at 100 × magnification with an Olympus IX71 light microscope (Olympus Optical, Tokyo, Japan) after staining with 1% (w/v) toluidine blue O in 1% (w/v) Na2B4O7. Transmission images were obtained using a transmission electron microscope, H-7650 (Hitachi-Science and Technology, Tokyo, Japan). For both light and electron microscopes, three plants for each genotype were measured.
As described by Evans et al.39, the total cross-sectional area of mesophyll tissues (Smes) and intercellular air space area (Sias) and the width of the analysed leaf cross section (L) in light microscope images, the total length of the mesophyll cell wall exposed to the intercellular air space (lm) in light and electron microscope images, the total length of the chloroplasts touching the plasma membrane appressed to the intercellular air space (lc), and the
www.nature.com/scientificreports/
1 0Scientific RepoRts | 7: 5782 | DOI:10.1038/s41598-017-06460-0
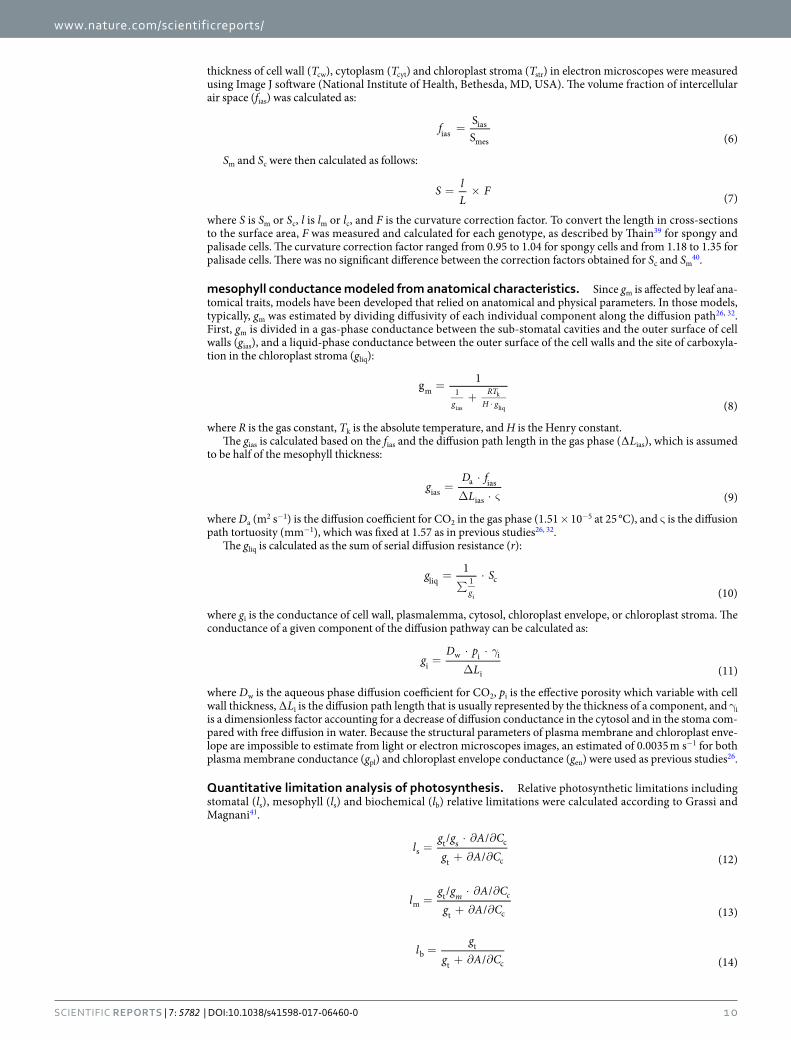
thickness of cell wall (Tcw), cytoplasm (Tcyt) and chloroplast stroma (Tstr) in electron microscopes were measured using Image J software (National Institute of Health, Bethesda, MD, USA). The volume fraction of intercellular air space (fias) was calculated as:
=f SS (6)ias
ias
mes
Sm and Sc were then calculated as follows:
= ×S lL
F (7)
where S is Sm or Sc, l is lm or lc, and F is the curvature correction factor. To convert the length in cross-sections to the surface area, F was measured and calculated for each genotype, as described by Thain39 for spongy and palisade cells. The curvature correction factor ranged from 0.95 to 1.04 for spongy cells and from 1.18 to 1.35 for palisade cells. There was no significant difference between the correction factors obtained for Sc and Sm
40.
mesophyll conductance modeled from anatomical characteristics. Since gm is affected by leaf ana-tomical traits, models have been developed that relied on anatomical and physical parameters. In those models, typically, gm was estimated by dividing diffusivity of each individual component along the diffusion path26, 32. First, gm is divided in a gas-phase conductance between the sub-stomatal cavities and the outer surface of cell walls (gias), and a liquid-phase conductance between the outer surface of the cell walls and the site of carboxyla-tion in the chloroplast stroma (gliq):
=+
⋅
g 1
(8)gRT
H gm 1
ias
k
liq
where R is the gas constant, Tk is the absolute temperature, and H is the Henry constant.The gias is calculated based on the fias and the diffusion path length in the gas phase (∆Lias), which is assumed
to be half of the mesophyll thickness:
=⋅
∆ ⋅ ςg
D fL (9)iasa ias
ias
where Da (m2 s−1) is the diffusion coefficient for CO2 in the gas phase (1.51 × 10⁻⁵ at 25 °C), and ς is the diffusion path tortuosity (mm−1), which was fixed at 1.57 as in previous studies26, 32.
The gliq is calculated as the sum of serial diffusion resistance (r):
=∑
⋅g S1
(10)gliq 1 c
i
where gi is the conductance of cell wall, plasmalemma, cytosol, chloroplast envelope, or chloroplast stroma. The conductance of a given component of the diffusion pathway can be calculated as:
γ=
⋅ ⋅
∆g
D pL (11)i
w i i
i
where Dw is the aqueous phase diffusion coefficient for CO2, pi is the effective porosity which variable with cell wall thickness, ∆Li is the diffusion path length that is usually represented by the thickness of a component, and γi is a dimensionless factor accounting for a decrease of diffusion conductance in the cytosol and in the stoma com-pared with free diffusion in water. Because the structural parameters of plasma membrane and chloroplast enve-lope are impossible to estimate from light or electron microscopes images, an estimated of 0.0035 m s−1 for both plasma membrane conductance (gpl) and chloroplast envelope conductance (gen) were used as previous studies26.
Quantitative limitation analysis of photosynthesis. Relative photosynthetic limitations including stomatal (ls), mesophyll (ls) and biochemical (lb) relative limitations were calculated according to Grassi and Magnani41.
=⋅ ∂ ∂
+ ∂ ∂l
g g A Cg A C/ /
/ (12)s
t s c
t c
=⋅ ∂ ∂
+ ∂ ∂l
g g A Cg A C/ /
/ (13)m c
mt
t c
=+ ∂ ∂
lg
g A C/ (14)b
t
t c

www.nature.com/scientificreports/
1 1Scientific RepoRts | 7: 5782 | DOI:10.1038/s41598-017-06460-0
To assess the effects of chloroplast number and size on changes of photosynthetic limitation in each ecotypes, the relative limitations were linked to overall changes in A:
= + + = + +dAA
L L Ldgg
ldgg
l dVV
l(15)
s m bs
ss
m
mm
cmax
cmaxb
where Ls, Lm and Lb are the reduction fractional limitation in A caused by reduction in stomatal conductance, mesophyll conductance and biochemistry, respectively. In the current study, the photosynthetic parameters in two wild type were defined as the references. The gm values from Harley method and the Vcmax from A-Cc curves were used in calculations.
Quantitative limitation analysis of mesophyll conductance. To quantify the main structural limi-tations of gm, an analogous analysis of Tosens et al.32 and Tomas et al.26 was applied. In the current study, the gas phase and structural components of gm (gi) were estimated from Eqn 8–11. The gas-phase limitation of gm (lias) was calculated as:
=lgg (16)
iasm
ias
The structural components limitation of the cellular phase conductances (li) was estimated as:
=⋅
lg
g S (17)ci
m
t
with li representing the limitation by the cell wall, the plasmalemma, cytosol, chloroplast envelope and stroma. The limitation imposed by each cellular component was scaled up with Sc.
Statistical analysis. One-way ANOVA analysis was used to test the differences in measured traits (in Tables) between estimated genotypes. All analyses were performed in R version 3.3.1 (https://cran.r-project.org).
References 1. Lopez-Juez, E. & Pyke, K. Plastids unleashed: their development and their integration in plant development. The International
Journal of Developmental Biology 49, 557–577 (2004). 2. Osteryoung, K. W. & Pyke, K. A. Division and dynamic morphology of plastids. Annual Review of Plant Biology 65, 443–472 (2014). 3. Pyke, K. A. Plastid division. AoB Plants, plq016 (2010). 4. Dutta, S. et al. Non-invasive, whole-plant imaging of chloroplast movement and chlorophyll fluorescence reveals photosynthetic
phenotypes independent of chloroplast photorelocation defects in chloroplast division mutants. The Plant Journal 84, 428–442 (2015).
5. Gao, H., Kadirjan-Kalbach, D., Froehlich, J. E. & Osteryoung, K. W. ARC5, a cytosolic dynamin-like protein from plants, is part of the chloroplast division machinery. Proceedings of the National Academy of Sciences of the United States of America 100, 4328–4333 (2003).
6. Glynn, J. M., Froehlich, J. E. & Osteryoung, K. W. Arabidopsis ARC6 coordinates the division machineries of the inner and outer chloroplast membranes through interaction with PDV2 in the intermembrane space. The Plant Cell 20, 2460–2470 (2008).
7. Maple, J. & Moller, S. G. Plastid division: evolution, mechanism and complexity. Annals of Botany 99, 565–579 (2007). 8. Robertson, E. J., Rutherford, S. M. & Leech, R. M. Characterization of Chloroplast Division Using the Arabidopsis Mutant arc5.
Plant Physiology 112, 149–159 (1996). 9. Shimada, H. et al. ARC3, a chloroplast division factor, is a chimera of prokaryotic FtsZ and part of eukaryotic phosphatidylinositol-
4-phosphate 5-kinase. Plant and Cell Physiology 45, 960–967 (2004). 10. Bockers, M., Capková, V., Tichá, I. & Schäfer, C. Growth at high CO2 affects the chloroplast number but not the photosynthetic
efficiency of photoautotrophic Marchantia polymorpha culture cells. Plant Cell, Tissue and Organ Culture 48, 103–110 (1997). 11. Kutík, J., Nátr, L., Demmers-Derks, H. H. & Lawlor, D. W. Chloroplast ultrastructure of sugar beet (Beta vulgaris L.) cultivated in
normal and elevated CO2 concentrations with two contrasted nitrogen supplies. Journal of Experimental Botany 46, 1797–1802 (1995).
12. Teng, N. et al. Elevated CO2 induces physiological, biochemical and structural changes in leaves of Arabidopsis thaliana. New Phytologist 172, 92–103 (2006).
13. Jin, B. et al. The effect of experimental warming on leaf functional traits, leaf structure and leaf biochemistry in Arabidopsis thaliana. BMC plant biology 11, 35 (2011).
14. Xu, C. Y., Salih, A., Ghannoum, O. & Tissue, D. T. Leaf structural characteristics are less important than leaf chemical properties in determining the response of leaf mass per area and photosynthesis of Eucalyptus saligna to industrial-age changes in CO2 and temperature. Journal of Experimental Botany 63, 5829–5841 (2012).
15. Austin, J. & Webber, A. N. Photosynthesis in Arabidopsis thaliana mutants with reduced chloroplast number. Photosynthesis Research 85, 373–384 (2005).
16. Weise, S. E. et al. The arc mutants of Arabidopsis with fewer large chloroplasts have a lower mesophyll conductance. Photosynthesis Research 124, 117–126 (2015).
17. Yamori, W., Nagai, T. & Makino, A. The rate-limiting step for CO2 assimilation at different temperatures is influenced by the leaf nitrogen content in several C3 crop species. Plant, Cell and Environment 34, 764–777 (2011).
18. Farquhar, G. D., von Caemmerer, S. & Berry, J. A. A biochemical model of photosynthetic CO2 assimilation in leaves of C3 species. Planta 149, 79–90 (1980).
19. Flexas, J. et al. Mesophyll diffusion conductance to CO2: An unappreciated central player in photosynthesis. Plant Science 193–194, 70–84 (2012).
20. Flexas, J., Ribas-Carbo, M., Diaz-Espejo, A., Galmes, J. & Medrano, H. Mesophyll conductance to CO2: current knowledge and future prospects. Plant, Cell and Environment 31, 602–621 (2008).
21. Li, Y., Gao, Y., Xu, X., Shen, Q. & Guo, S. Light-saturated photosynthetic rate in high-nitrogen rice (Oryza sativa L.) leaves is related to chloroplastic CO2 concentration. Journal of Experimental Botany 60, 2351–2360 (2009).
22. Xiong, D. et al. Rapid responses of mesophyll conductance to changes of CO2 concentration, temperature and irradiance are affected by N supplements in rice. Plant, Cell and Environment 38, 2541–2550 (2015a).

www.nature.com/scientificreports/
1 2Scientific RepoRts | 7: 5782 | DOI:10.1038/s41598-017-06460-0
23. Xiong, D. et al. Heterogeneity of photosynthesis within leaves is associated with alteration of leaf structural features and leaf N content per leaf area in rice. Functional Plant Biology 42, 687–696 (2015b).
24. Evans, J. R., Kaldenhoff, R., Genty, B. & Terashima, I. Resistances along the CO2 diffusion pathway inside leaves. Journal of Experimental Botany 60, 2235–2248 (2009).
25. Terashima, I., Hanba, Y. T., Tholen, D. & Niinemets, Ü. Leaf functional anatomy in relation to photosynthesis. Plant Physiology 155, 108–116 (2011).
26. Tomás, M. et al. Importance of leaf anatomy in determining mesophyll diffusion conductance to CO2 across species: quantitative limitations and scaling up by models. Journal of Experimental Botany 64, 2269–2281 (2013).
27. Jeong, W. J. et al. A Large Population of Small Chloroplasts in Tobacco Leaf Cells Allows More Effective Chloroplast Movement Than a Few Enlarged Chloroplasts. Plant Physiology 129, 112–121 (2002).
28. Kasahara, M. et al. Chloroplast avoidance movement reduces photodamage in plants. Nature 420, 829–832 (2002). 29. Hikosaka, K. Effects of leaf age, nitrogen nutrition and photon flux density on the organization of the photosynthetic apparatus in
leaves of a vine (Ipomoea tricolor Cav.) grown horizontally to avoid mutual shading of leaves. Planta 198, 144–150 (1996). 30. Li, Y. et al. Does chloroplast size influence photosynthetic nitrogen use efficiency? PloS one 8, e62036 (2013). 31. Muir, C. D., Hangarter, R. P., Moyle, L. C. & Davis, P. A. Morphological and anatomical determinants of mesophyll conductance in
wild relatives of tomato (Solanum sect. Lycopersicon, sect. Lycopersicoides; Solanaceae). Plant, Cell and Environment 37, 1415–1426 (2014).
32. Tosens, T., Niinemets, Ü., Westoby, M. & Wright, I. J. Anatomical basis of variation in mesophyll resistance in eastern Australian sclerophylls: news of a long and winding path. Journal of Experimental Botany 63, 5105–5119 (2012).
33. Sage, R. F. & Kubien, D. S. The temperature response of C3 and C4 photosynthesis. Plant Cell, and Environment 30, 1086–1106 (2007).
34. Hanson, D., Renzaglia, K. & Villarreal, J. Diffusion limitation and CO2 concentrating mechanisms in bryophytes. In: D. T. Hanson, S. K. Rice eds. Photosynthesis in Bryophytes and Early Land Plants 37, (95–111. Springer, Netherlands, 2014).
35. Heskel, M. A., Anderson, O. R., Atkin, O. K., Turnbull, M. H. & Griffin, K. L. Leaf- and cell-level carbon cycling responses to a nitrogen and phosphorus gradient in two Arctic tundra species. American Journal of Botany 99, 1702–1714 (2012).
36. Flexas, J. et al. Mesophyll conductance to CO2 in Arabidopsis thaliana. New Phytologist 175, 501–511 (2007). 37. Bussler, W. & Epstein, E. Mineral nutrition of plants: principles and perspectives. (John Wiley and Sons, Inc, New York, 1972). 38. Harley, P. C., Loreto, F., Di Marco, G. & Sharkey, T. D. Theoretical considerations when estimating the mesophyll conductance to
CO2 flux by analysis of the response of photosynthesis to CO2. Plant Physiology 98, 1429–1436 (1992). 39. Evans, J. R., von Caemmerer, S., Setchell, B. A. & Hudson, G. S. The relationship between CO2 transfer conductance and leaf anatomy
in transgenic tobacco with a reduced content of Rubisco. Functional Plant Biology 21, 475–495 (1994). 40. Thain, J. F. Curvature correction factors in the measurement of cell surface areas in plant tissues. Journal of Experimental Botany 34,
87–94 (1983). 41. Grassi, G. & Magnani, F. Stomatal, mesophyll conductance and biochemical limitations to photosynthesis as affected by drought and
leaf ontogeny in ash and oak trees. Plant, Cell and Environment 28, 834–849 (2005).
AcknowledgementsThis work was supported by National Natural Science Foundation of China (31301840), A Foundation for the Author of National Excellent Doctoral Dissertation of PR China (201465), and Fundamental Research Funds for the Central Universities (2662015PY031, 2012SC13).
Author ContributionsY.L. conceived and designed the experiments. D.L.X. performed the experiments, sample analyses and wrote the paper. Y.L., J.L.H. and S.B.P. revised the paper.
Additional InformationCompeting Interests: The authors declare that they have no competing interests.Publisher's note: Springer Nature remains neutral with regard to jurisdictional claims in published maps and institutional affiliations.
Open Access This article is licensed under a Creative Commons Attribution 4.0 International License, which permits use, sharing, adaptation, distribution and reproduction in any medium or
format, as long as you give appropriate credit to the original author(s) and the source, provide a link to the Cre-ative Commons license, and indicate if changes were made. The images or other third party material in this article are included in the article’s Creative Commons license, unless indicated otherwise in a credit line to the material. If material is not included in the article’s Creative Commons license and your intended use is not per-mitted by statutory regulation or exceeds the permitted use, you will need to obtain permission directly from the copyright holder. To view a copy of this license, visit http://creativecommons.org/licenses/by/4.0/. © The Author(s) 2017