
A Federal Economic Agenda for Ontario - Mowat...
51
A Federal Economic Agenda for Ontario MAY 2015 | MOWATCENTRE.CA
Transcript of A Federal Economic Agenda for Ontario - Mowat...

A Federal Economic Agenda for Ontario
may 2015 | mowatcentre.ca

Acknowledgements A Federal Economic Agenda for Ontario is the culmination of a collaborative effort to develop a common vision for Ontario’s future led by the Mowat Centre and our research partner the Northern Policy Institute, involving over a dozen stakeholder partners and numerous regional experts and industry leaders from every corner of the province. Uniting this diverse group is the belief that a strong and prosperous Ontario is in every Canadian’s interest.
Research Partner:Northern Policy Institute Northern Policy Institute is Northern Ontario’s independent think tank. Northern Policy Institute performs research, collects and disseminates evidence, and identifies policy opportunities to support the growth of sustainable Northern Communities. Northern Policy Institute’s operations are located in Thunder Bay and Sudbury. It seeks to enhance Northern Ontario’s capacity to take the lead position on socio-economic policy that impacts Northern Ontario, Ontario, and Canada as a whole.
Stakeholder Partners: » Association of Municipalities of Ontario
» Colleges Ontario
» FilmOntario
» Futurpreneur Canada
» Information Technology Association of Canada
» Institute for Competiveness and Prosperity
» Life Sciences Ontario
» Ontario Chamber of Commerce
Consultation Partner: Build Strong Cities Build Strong Cities (BSC) empowers communities, local governments and economic developers to effect sustainable growth. BSC provides customized community economic development, marketing and branding strategies specifically designed to attract foreign direct investment, tourism and workforce development.
Report Prepared By:Nevena DragicevicPolicy Associate, Mowat Centre
» Ontario Council of Agencies Serving Immigrants
» Ontario Federation of Indigenous Friendship Centres
» Ontario Home Builders’ Association
» Ontario Nonprofit Network
» Ontario Trucking Association
» Tourism Industry Association of Ontario
416.978.7858
mowatcentre.ca
720 Spadina avenue, Suite 218,
toronto, on m5S 2t9 canada
@mowatcentre
The Mowat Centre is an independent public policy think tank located at the School of Public Policy & Governance at the University of Toronto. The Mowat Centre is Ontario’s non-partisan, evidence-based voice on public policy. It undertakes collaborative applied policy research, proposes innovative research-driven recommendations, and engages in public dialogue on Canada’s most important national issues.

Contents
IntRoduCtIon 1
1 BuIldIng PRoduCtIvIty and tRade thRough ModeRn InfRaStRuCtuRe 7
2 a) enhanChIng eConoMIC PaRtICIPatIon and oPPoRtunIty foR all ontaRIanS 12 B) enhanCIng oPPoRtunIty foR aBoRIgInal PeoPle thRough taIloRed eduCatIon and SkIllS develoPMent PRogRaMS 17
3 attRaCtIng gloBal talent and SuPPoRtIng IMMIgRantS to ontaRIo 22
4 StRengthenIng InnovatIon and PRoduCtIvIty thRough CooRdInated and exPanded BuSIneSS SuPPoRtS 26
5 faCIlItatIng tRade and InveStMent aCRoSS Canada and InteRnatIonal BoRdeRS 31
6 ReSPondIng to RegIonal and CluSteR oPPoRtunItIeS thRough taRgeted StRategIeS 37
ConCluSIon 42
WoRkS CIted 43

1 | a federal economic agenda for ontario
INTRODUCTION
Why Canada needs a federal economic agenda for ontarioOntario has many of the essential strengths needed to succeed in the highly competitive global economy. The province is home to several thriving ecosystems for innovation and startups, boasts the highest post-secondary attainment rate in the world, and is the most attractive region in North America for foreign investment. The Canada-U.S. dollar exchange rate realignment is also expected to better support the manufacturing sector’s competitiveness. Ontario is again poised to lead the country in economic growth.
While Ontario long served as Canada’s economic engine, the province has found itself buffeted by emerging global headwinds and changing economic tides over the past 15 years. The rise of emerging markets, an aging population, climate change, urbanization, international macro-economic shocks, and an unstable currency have impacted Ontario’s regions and industries to various degrees. Overall, these forces have contributed to flattened productivity, sluggish growth, higher than average unemployment and increased public debt in the province. Nearly 40 per cent of Canada’s population resides in Ontario, and the province’s share of national GDP is almost twice that of Quebec’s or Alberta’s. What happens in Ontario profoundly affects the rest of the country. As Canadians prepare for a federal election this year, the economic fortunes of Ontario should be top of mind for each of the federal political parties.
Many of the tools needed to meet Ontario’s challenges lie in the hands of its provincial and municipal governments, the private and not-for-profit sectors and other actors. However, there are a number of key policy levers only available to the federal government.
The structure of fiscal federalism, for example, continues to shift resources away from Ontario at a time when the province’s fiscal capacity and per capita GDP are below the national average. According to the latest available figures, Ontarians transfer approximately $11 billion a year to the rest of Canada, equivalent to nearly 2 per cent of the province’s GDP.1 That federal fiscal transfers leave Ontario in worse shape rather than better off is something that the federal government alone can change.
Box 1: A Federal Economic Agenda for Ontario - Key Issue Areas » Building productivity and trade through modern infrastructure
» Enhancing economic participation and opportunity for all Ontarians
» Attracting global talent and supporting immigrants to Ontario
» Strengthening innovation and productivity through coordinated and expanded business supports
» Facilitating trade and investment across Canada and international borders
» Responding to regional and cluster opportunities through targeted strategies
1 Zon, Noah. 2013. Filling the Gap: Measuring Ontario’s Balance with the Federal Government. Mowat Centre.

mowat centre | may 2015 | 2
Figure 2: Per capita GDP by Province/Territory
Source: Statistics Canada, 2013.
This document, A Federal Economic Agenda for Ontario, focuses on the tools and policy areas where the federal government has the greatest ability to support and strengthen the course of Ontario’s economic future. It clearly defines the challenges and opportunities facing the province across six key issue areas (Box 1), and puts forward a set of policy recommendations to drive prosperity across Ontario, and by extension the Canadian economy, for years to come.
Two more major issues — climate change mitigation and pension system sustainability — are currently in a state of flux and not directly addressed in our six key issue areas. The outcome of the federal election will likely have a significant impact on how these important challenges are tackled at the provincial
$0 $20,000 $40,000 $60,000 $80,000 $100,000 $120,000
Prince Edward Island
Nova Scotia
New Brunswick
Quebec
Manitoba
British Columbia
OntarioCanada
Newfoundland & Labrador
Nunavut
Yukon
Saskatchewan
Alberta
Northwest Territories
Figure 2: Per Capita GDP by Province/Territory
$100,662
$48,306
$44,394
$42,241
$41,526$39,771
$51,140
$53,664
$67,754$68,330
$69,951
$74,854
$83,721
$49,896
Share of Federal Spending
Share of Federal Revenue Collected
Share of Canada's Population
39%38.7%
34%
The Gap$11.1 Billion1.9% of GDP
Figure 1: Ontario’s share of federal revenue and spending
Source: Zon, N. 2013. Filling the Gap: Measuring Ontario’s Balance with the Federation. Mowat Centre.

3 | a federal economic agenda for ontario
and national levels, for example, whether Ontario goes through with its proposed Ontario Retirement Pension Plan. The federal government must take a leadership role in the fight against climate change and strengthening the retirement income security system. Engaging Ontario and other provincial/territorial governments on these issues is vital.
drivers of change and impacts on ontario’s economyThe last decade has seen enormous change in the landscape of the global, Canadian and Ontario economies. It is likely that the next decade will continue to witness more structural and disruptive change. The impact of these larger global forces is well-known:
» growing income inequality, wage stagnation, and an increase in precarious employment, which now accounts for almost a quarter of all employment in Ontario;2
» low productivity growth in both Ontario and Canada, compared to our peers over the past 30 years;3
» declining share of global exports, from 4.2 per cent in 2000 to 2.3 in 2013;4
» the striking decline of the manufacturing sector, which has shrunk by 30 per cent and 300,000 jobs over the past decade.5
Communities across the province have felt these impacts in different ways. Mid-sized cities with a heavy reliance on manufacturing (e.g., London and Sarnia) have been particularly hard-hit. While many areas of Ontario have experienced net negative migration since the early 2000s, the outflow of people, primarily among the young, has placed a strain on northern communities.6 Anxiety about the future is widespread — nearly 60 per cent of Ontarians believe that 25 years from now the next generation will be worse off than today.7
These changes have also contributed to rising public debt loads over the last several years. In 2015-16, Ontario’s net debt-to-GDP ratio, at nearly 40 per cent, will be more than 13 percentage points higher than pre-recession levels.8 The provincial government has committed to eliminating its deficit by 2017-18 and has taken steps toward that goal, including holding the line on public sector wages, and reining in health care spending. However, the scale and pace of change that has impacted the Ontario and Canadian economies requires a transformation of public service delivery frameworks. Growing demand for services will continue to exacerbate government fiscal pressures. An engaged federal partner is critical to resolve these issues.
Moving forward — our recommendationsDespite these challenges, Ontario can seize enormous opportunities during this period of global and national economic restructuring. The province has many existing strengths to build on — a well educated population, competitive business environment, safe, vibrant cities and a diversified economy with globally competitive firms and clusters. These strengths will continue to drive economic growth and prosperity in the province and in Canada. With the proper effort from the federal government, the opportunities afforded by these strengths can be shared more widely and secured for future generations.
2 Law Commission of Ontario. 2012. Vulnerable Workers and Precarious Work. Final Report. 3 Ontario Ministry of Finance. 2014. Ontario’s Long Term Report on the Economy. Government of Ontario Accessed at http://www.fin.gov.on.ca/en/economy/ltr/4 United Nations, UNCTADstat. http://unctadstat.unctad.org/wds/TableViewer/tableView.aspx5 Oschinski, M., Chan, K. with Kobrinsky, L. 2014. Ontario Made: Rethinking Manufacturing in the 21st Century. Mowat Centre. 6 Ontario Ministry of Finance. 2013. Ontario Population Projections 2013 - 2041. Government of Ontario. Accessed at http://www.fin.gov.on.ca/en/economy/demographics/projections/#s4h7 Ekos Politics. 2013. So What’s Really Bothering you Canada? Accessed at http://www.ekospolitics.com/wp-content/uploads/full_report_october_17_2013.pdf
8 Government of Ontario. 2015. Ontario Budget — Building Ontario Up; Ontario Auditor General Annual Report 2014.

mowat centre | may 2015 | 4
A Federal Economic Agenda for Ontario supports this vision for Ontario and puts forward a set of 32 recommendations across six Key Issue Areas (Box 1) based on the following objectives:
» increased labour force participation;
» improved economic opportunity for all and reduced poverty;
» increased productivity and innovation;
» increased exports;
» modernized federal fiscal framework; and
» better coordination and collaboration among levels of government.
Furthermore, our recommendations are:
» stakeholder driven (Box 2 explains our consultation process);
» focused on areas where the federal government has the greatest ability to act; and
» informed by evidence.
Box 2: Our Consultative ProcessIn June 2014, the Mowat Centre convened a group of leaders from Ontario’s key industry and sector organizations — our stakeholder partners — to discuss what a federal agenda for Ontario might look like.
We then conducted several deep-dive conversations that focused on understanding sector-specific issues. With the help of the Northern Policy Institute and Build Strong Cities, we also engaged with public and industry leaders and experts from Ontario’s Northeastern, Northwestern, Southwestern and Southeastern regions during special round table sessions.
With every discussion, our goal was to identify the major pain-points each sector or region faced, but also to find out where common ground existed. Our recommendations therefore broadly reflect the ideas, concerns and opportunities that emerged throughout the consultative process. Many more important sector- and industry-specific recommendations can be found in our stakeholder partners’ research and other publications.
Our goal with this project is for all federal parties to clearly articulate how they would work with the Ontario government, stakeholders and specific communities and sectors to ensure Ontario continues to prosper and contribute to a vibrant national economy for years to come.
Summary of recommendations
I) Building productivity and trade through modern infrastructure
1. Allocate the Building Canada Fund on an equal per capita basis
2. Strategically invest in infrastructure that enables trade, investment and innovation
3. Build a long-term partnership with provinces and municipalities to address affordable housing needs
4. Set a more ambitious digital strategy for Canada

5 | a federal economic agenda for ontario
II) a. Enhancing economic participation and opportunity for all Ontarians
1. Adopt a nationally standardized support system for the unemployed
2. Reform structure of Labour Market Development Agreements (LMDA) to ensure more Ontarians receive training and employment supports
3. Increase the availability of local labour market information
4. Reinstate the mandatory Long-Form Census
5. Introduce an employer tax credit for job training
6. Develop a national entrepreneurship strategy
b. Enhancing opportunity for Aboriginal people through tailored education and skills development programs
1. Re-model Aboriginal education to be based on locally-controlled and culturally tailored frameworks
2. Include specific provisions in the LMDA to reflect needs of Aboriginal population
3. Support the Aboriginal workforce through proven programs that are tailored to local needs
4. Work with provincial government to close jurisdictional gaps that adversely affect health care delivery to Aboriginal people
III) Attracting global talent and supporting immigrants to Ontario
1. Increase the number of economic immigrants to Ontario
2. Develop reasonable and clear pathways to residency for international students
3. Address declining immigrant settlement funding in Ontario
4. Revise the new rules governing the Temporary Foreign Workers Program
IV) Strengthening innovation and productivity through coordinated and expanded business supports
1. Restore Scientific Research and Experimental Development program (SR&ED) tax credit to 20 per cent
2. Leverage federal procurement to address commercialization challenges
3. Facilitate not-for-profit innovation and leadership through increased revenue-generating capacity and access to business supports
4. Develop an intergovernmental strategy to coordinate economic development across Canada
V) Facilitating trade and investment across Canada and international borders
1. Facilitate the movement of goods and people across the U.S.-Canada border
2. Address critical gaps in the Agreement on Internal Trade
3. Eliminate tariffs on imports with a low effective tax rate
4. Establish a truly national securities regulator
5. Make the Investment Canada Act ‘net benefit’ test more transparent
6. Relax visa requirements for visitors from low-risk countries

mowat centre | may 2015 | 6
VI) Responding to regional and cluster opportunities through targeted strategies
1. Strengthen evaluation of FedNor and FedDev programs and build on successes
2. Develop a strategy for mid-sized cities to leverage their unique competitive advantages
3. Take a greater leadership role in the Ring of Fire development
4. Adopt a high-growth ‘lens’ for business program supports to promote cluster formation, job creation and innovation

7 | a federal economic agenda for ontario
1Building productivity and trade through modern infrastructure
Key stats » For every $1 billion of infrastructure spending, roughly 16,700 jobs are supported for one year in
Ontario.9
» Current levels of total public investments in infrastructure spending fall short of optimal levels by 2 percentage points of GDP.10
» $1 billion is the additional amount Ontario would receive if the Building Canada Fund were allocated on a per capita basis.11
» The annual cost of traffic congestion to the Toronto Region economy is $6 billion. If left unchecked, the cost could reach $15 billion by 2031.12
What we heard from Ontario stakeholders » Ensure Ontario receives fair share of federal funding for infrastructure. Investments also require
greater predictability and strategic clarity.
» Strategically invest in trade-enabling infrastructure to strengthen competitiveness and meet increased demand from new trade agreements.
» Improve alignment between funding responsibility and fiscal capacity for municipalities.
» Commit adequate and long-term funding for affordable housing.
» Invest in wider coverage and higher-speed internet for Ontario.
9 Antunes, P. and Palladini, J. 2013. The Economic Impact of Ontario’s Infrastructure Investment Program. Conference Board of Canada. Accessed at http://www.conferenceboard.ca/temp/f816e428-0b2d-419c-b9fe-cece0e6083bc/13-246_ecoimpactontinfrast_br.pdf 10 Smetanin, P., Stiff, D., and Kobak, P. 2014. Ontario Infrastructure Investment: Federal and Provincial Risks and Rewards. The Canadian Centre for Economic Analysis.11 Zon, N. 2014. Slicing the Pie: Principles for Allocating Transfer Payments in the Canadian Federation. Mowat Centre12 Toronto Region Board of Trade. 2011. Reaching Top Speed. Accessed at http://www.metrolinx.com/en/aboutus/publications/5123-GT-Metro-linx-AR-EN.pdf

mowat centre | may 2015 | 8
Issue backgroundInfrastructure facilitates the efficient flow of goods and people within and across our borders. It connects residents across our vast province to jobs and opportunities, both physically and digitally. It is essential to delivering core services, including water and electricity to businesses and homes. Infrastructure is also closely linked to productivity — about a quarter of recent productivity growth can be attributed to public investment in infrastructure.13
In short, infrastructure underpins every aspect of a well-functioning economy and a society’s overall standard of living. For this reason, the declining state of infrastructure in Ontario and Canada has raised increasing levels of concern over the last decade.
An aging capital stock built mostly in the 1950s and 1960s, rising traffic congestion in cities, a lack of affordable housing and growing worry about the risks posed by climate change, are just some of the major infrastructure challenges exerting pressure on local and regional economies across Ontario. One study estimates that Canadian municipalities have an accumulated $123 billion debt tied to existing infrastructure, with a need for another $115 billion to build new infrastructure.14 Taking into account the federal and provincial levels, estimates of Canada’s overall infrastructure deficit range from $50 to as much as $570 billion.15
FIGURe 3: ShARe IN TOTAl GOveRNMeNT INFRASTRUCTURe CAPITAl16
level of government 1961 2005
Federal 31% 10%
Provincial 31% 22%
Municipal 38% 67% Source: Statistics Canada, 2008
These issues weigh heavily on municipalities in particular. Municipalities in Ontario own 67 per cent of public infrastructure but collect just nine cents of every tax dollar.17 As a result, local governments have struggled to keep up with responsibilities that exceed their fiscal capacity. This is largely due to years of underinvestment and the downloading of infrastructure maintenance to municipalities. Today, provinces and municipalities assume 88 per cent of the investment risk associated with infrastructure, while the federal government takes on just 12 per cent.
Recommendations
1. Allocate the Building Canada Fund on an equal per capita basis
The new 10-year Building Canada Plan announced in the 2013 federal budget will deliver $47 billion in new and ongoing federal investment for a variety of infrastructure projects over 10 years, plus another $23 billion through other programs. Though the longer-term nature of these
13 Antunes, P and Palladini, J. 2013.14 Vander Ploeg, C.G., and Holder, M. 2013. At the Intersection: The Case for Sustained and Strategic Public Infrastructure Investment. Canada West Foundation. Accessed at http://cwf.ca/pdf-docs/publications/AtTheIntersection_Feb2013.pdf15 Friendship Bay Consulting. 2013. The Foundations of a Competitive Canada: The Need for Strategic Infrastructure Investment. The Canadian Chamber of Commerce. Accessed at http://www.chamber.ca/media/blog/131218-The-Foundations-of-a-Competitive-Canada/131218_The_Founda-tions_of_a_Competitive_Canada.pdf16 Association of Ontario Municipalities; Statistics Canada17 Roy, Francine. 2008. From Roads to Rinks: Government Spending on Infrastructure in Canada, 1961 to 2005. Statistics Canada. Accessed at http://publications.gc.ca/collections/collection_2008/statcan/11-624-M/11-624-MIE2008019.pdf
9 | a federal economic agenda for ontario
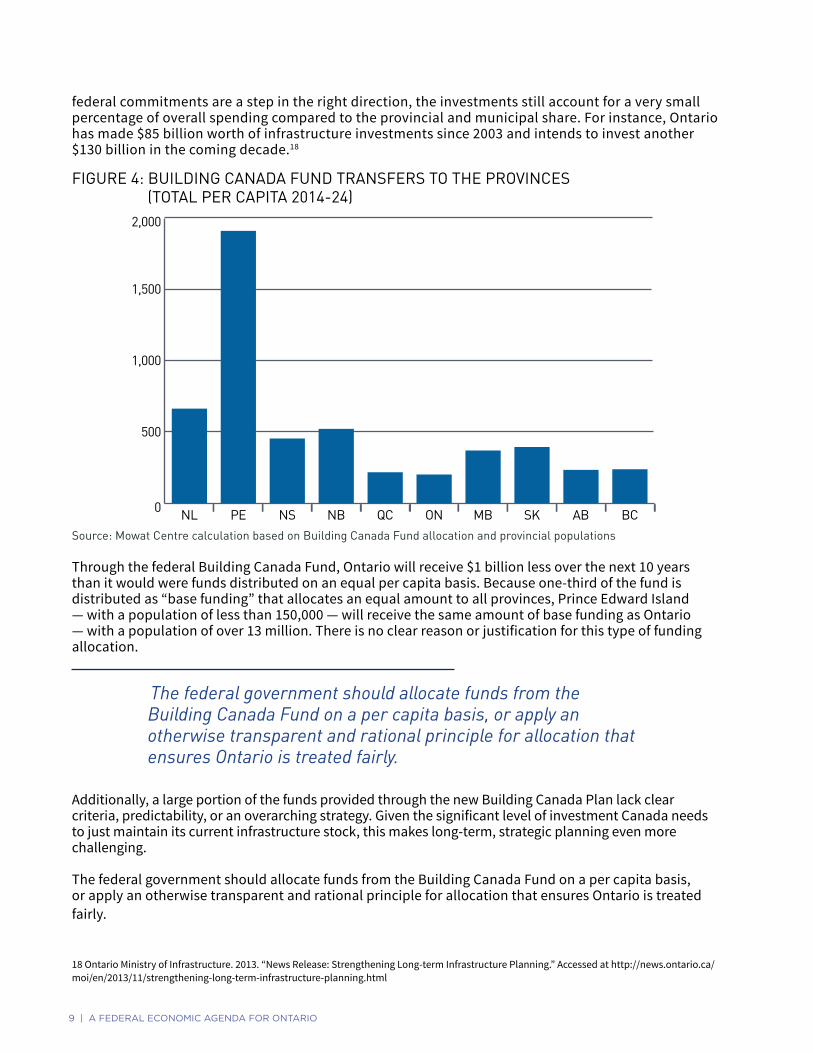
federal commitments are a step in the right direction, the investments still account for a very small percentage of overall spending compared to the provincial and municipal share. For instance, Ontario has made $85 billion worth of infrastructure investments since 2003 and intends to invest another $130 billion in the coming decade.18
Source: Mowat Centre calculation based on Building Canada Fund allocation and provincial populations
Through the federal Building Canada Fund, Ontario will receive $1 billion less over the next 10 years than it would were funds distributed on an equal per capita basis. Because one-third of the fund is distributed as “base funding” that allocates an equal amount to all provinces, Prince Edward Island — with a population of less than 150,000 — will receive the same amount of base funding as Ontario — with a population of over 13 million. There is no clear reason or justification for this type of funding allocation.
The federal government should allocate funds from the Building Canada Fund on a per capita basis, or apply an otherwise transparent and rational principle for allocation that ensures Ontario is treated fairly.
Additionally, a large portion of the funds provided through the new Building Canada Plan lack clear criteria, predictability, or an overarching strategy. Given the significant level of investment Canada needs to just maintain its current infrastructure stock, this makes long-term, strategic planning even more challenging.
The federal government should allocate funds from the Building Canada Fund on a per capita basis, or apply an otherwise transparent and rational principle for allocation that ensures Ontario is treated fairly.
18 Ontario Ministry of Infrastructure. 2013. “News Release: Strengthening Long-term Infrastructure Planning.” Accessed at http://news.ontario.ca/moi/en/2013/11/strengthening-long-term-infrastructure-planning.html
0
500
1,000
1,500
2,000
BCABSKMBONQCNBNSPENL
FIGURe 4: BUIlDING CANADA FUND TRANSFeRS TO The PROvINCeS (TOTAl PeR CAPITA 2014-24)

mowat centre | may 2015 | 10
2. Strategically invest in infrastructure that enables trade, investment and innovation
Up to date infrastructure is essential to promote economic growth, support job creation, stimulate productivity and strengthen competitiveness. Enhanced transportation and trade-related infrastructure in particular is essential to supporting these objectives.
The federal government estimates that the Comprehensive Economic and Trade Agreement (CETA) with the European Union, which has been signed in principle, is expected to boost Canada’s bilateral trade by 20 per cent and add $12 billion annually to Canada’s economy.19 In Ontario, it is expected to generate roughly 30,000 new jobs.20
The federal government must make trade and transportation a key infrastructure priority, and ensure that Canada is capable of seizing the opportunities introduced through new trade agreements.
The impending agreement with the European Union, along with on-going negotiation of the Trans-Pacific-Partnership and other bilateral trade agreements, means it is more critical than ever that we improve the system of highways, harbours, airports and other trade-related infrastructure. Canada-wide, there is currently a $5.3 billion shortfall in investment to meet the future needs of port infrastructure alone.21
The federal government must make trade and transportation a key infrastructure priority, and ensure that Canada is capable of seizing the opportunities introduced through new trade agreements.
3. Establish a long-term partnership with provinces and municipalities to address affordable housing needs
In Ontario, there is a gap between what Ontarians — particularly those with very low incomes — can afford to pay for housing and the cost of the available supply in the market. The result is a persistent problem of core housing need.22 In 2011, more than 13 per cent of households in the province were in need of core housing.23
Stable, affordable housing is critical to increased labour market attachment and benefits the economy at large. For example, each $1 increase in residential building construction investment generates an increase in overall GDP of $1.52; and a $1 million investment also creates roughly 8.5 new jobs.24 Affordable housing allows workers of all incomes to live near their workplaces, which ensures employers have access to the labour they need.25
19 Foreign Affairs, Trade and Development Canada. Canada European Union: Comprehensive Economic and Trade Agreement (CETA). Accessed at http://international.gc.ca/trade-agreements-accords-commerciaux/agr-acc/ceta-aecg/understanding-comprendre/overview-apercu.aspx?lang=eng20 Ministry of Economic Development, Employment and Infrastructure. 2013. “News Release: Ontario to Support European Trade Deal.” Accessed at http://news.ontario.ca/medt/en/2013/10/ontario-to-support-european-trade-deal.html21 Wendy Zatylny (President, Association of Canadian Port Authorities) testimony at the Federal Finance Committee, November 18, 24. Accessed at http://openparliament.ca/committees/finance/41-2/58/wendy-zatylny-1/only/22 The Canada Mortgage and Housing Corporation considers a household to be in core housing need if its housing does not meet one or more of the adequacy, suitability, or affordability standards and it would have to spend 30 per cent or more of its before-tax income to pay the median rent (including utility costs) of alternative local market housing that meets all three standards23 Canadian Housing Observer, Households in Core Housing Need, 1991-2011. CMHC. Accessed at http://www.cmhc.ca/en/corp/about/cahoob/data/data_013.cfm24 Zon, N., Oschinski, M., and Molson, M. 2014. Building Blocks: The Case for Federal Investment in Social and Affordable Housing in Ontario. Mowat Centre. 25 TD Economics. 2003. Affordable Housing in Canada: In Search of a new Paradigm. Accessed at http://www.urbancentre.utoronto.ca/pdfs/curp/TDAffd.pdf

11 | a federal economic agenda for ontario
The federal government’s involvement in housing programs and supports has undergone many changes in the past 20 years. The main result being that federal programs have become more targeted and narrow. Federal funding for social housing is being scaled down each year and will eventually be eliminated. Consequently, municipalities have faced increasing financial pressure to maintain the existing social housing stock in Ontario, as the need for more social and affordable housing across the province continues to grow.
The federal government’s revenue sources and obligations provide it with the kind of long-term fiscal flexibility and levers not available to municipal or provincial governments. Municipalities, in particular, are heavily constrained, placing significant pressure on the property tax base. Unlike local governments, the federal government is also more cushioned against the volatility of regional economic trends.
With the leadership of the federal government, the federal, provincial and municipal governments should establish a new, long-term framework to tackle housing need.
With the leadership of the federal government, the federal, provincial and municipal governments should establish a new, long-term framework to tackle housing need. The framework should take into account the different capacities of each level of government, build upon existing, successful interventions in the housing system and make room for new innovative approaches to address housing need. Any new framework should also develop a unique strategy for Ontario’s northern communities, where adequate affordable housing is especially lacking.
4. Set a more ambitious digital strategy for Canada
For people residing in remote communities or earning lower incomes, access to high-speed and reliable internet service is essential to staying connected and provides increased economic opportunity. Across the country, only 62 per cent of Canadians in the lowest income quartile have internet access, compared with 95 per cent in the highest.26
Canada’s Digital 150 strategy was launched in April 2014 with the goal of connecting 98 per cent of the country’s population to high-speed internet (5 Mbps) by 2019. While this and other initiatives to connect more rural and remote communities to better internet access should be commended, the targets set by the strategy are far slower than those set by other countries. For example, the U.S. intends to connect 100 million households to 100 Mbps broadband by 2020. The E.U., which has already achieved 100 per cent basic broadband coverage across Europe, is now targeting 100 per cent connectivity and access to 30 Mbps broadband or more by 2020.27
To support more ambitious connectivity goals in Ontario and Canada, the federal government could allocate a greater portion of the billions raised through wireless spectrum auctions. Of the $5.2 billion in revenue generated by last year’s auction, only a small amount appears to have been directed to digital infrastructure investment.28
As trade in services grows and the ability to conduct business irrespective of location increases, it will become even more imperative to link trade and investment strategies to digital connectivity initiatives. A more ambitious digital strategy should, therefore, align with Canada’s broader international trade agenda.
26 CIRA Factbook. 2014. Canadian Internet Registration Authority. Accessed at http://cira.ca/factbook/2014/the-canadian-internet.html27 European Commission. 2013. Press Release. Accessed at http://europa.eu/rapid/press-release_IP-13-968_en.htm28 Geist, M. 2014. “Digital Canada 15: The Digital Strategy Without a Strategy.” Accessed at http://www.michaelgeist.ca/2014/04/digital-cana-da-150-2/

mowat centre | may 2015 | 12
2 a) enhancing economic participation and opportunity for all Ontarians
Key Stats » Ontario’s unemployment rate averaged 7.3 per cent in 2014. It is expected to decrease to an average
annual rate of 6.3 per cent by 2017.29
» The youth unemployment rate, 15 per cent, remains more than double the average rate of unemployment in the province at the start of 2015.30
» Only 27 per cent of unemployed Ontarians qualify for Employment Insurance.31
What we heard from Ontario stakeholders » Develop better community-level labour market data to drive informed workforce development
decisions across the province.
» Make it easier for all unemployed Ontarians to access Employment Insurance (EI) benefits and training supports.
» Cultivate the human capital already in Ontario — Aboriginal people, youth, new immigrants and individuals with disabilities. Empower individuals through more access to training and by promoting and supporting entrepreneurship.
» Encourage employers to continue taking on a greater role in workplace training. Ensure incentive structure supports training of more vulnerable workers.
29 Ontario Ministry of Finance. 2014. Ontario Fall Economic Statement. Accessed at http://www.fin.gov.on.ca/en/budget/fallstatement/2014/pa-per_all.pdf30 Ontario Ministry of Training, Colleges and Universities. 2015. Ontario Labour Market Statistics for February 2015. Accessed at http://www.tcu.gov.on.ca/eng/labourmarket/currenttrends/docs/monthly/201502.pdf31 Government of Ontario. 2015. Building Ontario Up. Accessed at http://www.fin.gov.on.ca/en/budget/ontariobudgets/2015/papers_all.pdf

13 | a federal economic agenda for ontario
Issue backgroundOntario boasts impressive human capital. The province has one of the highest post-secondary attainment rates in the OECD — 66 per cent — and trains students in every field across 44 universities and colleges. Half of Canada’s knowledge workers reside in Ontario. Every year, highly trained individuals from every corner of the globe seek to settle in Ontario in search of greater opportunity.
Yet despite these significant human capital assets, compared to the rest of Canada, Ontarians experience higher than average unemployment. Aboriginal people, youth, newcomers and individuals with disabilities in particular face even greater challenges compared to the broader population. Figure 5: Unemployment Rates in Ontario
Source:Statistics Canada. Unemployment rates for peer groups are based on most recent available data for each group.
Higher unemployment in Ontario, especially among historically disadvantaged groups, is just one major concern. Worries about stagnant labour force growth and a declining dependency ratio (the ratio of those in the labour force to those outside) in Ontario and Canada are also growing.32 Meanwhile, employers across many sectors complain about a lack of qualified workers.
Ensuring Ontario educates, attracts and retains the best workers is essential to the province’s long-term prosperity. A focus on developing untapped and underutilized human capital, including Aboriginal people, youth, recent immigrants and people with disabilities, should be a priority.
However, several critical challenges stand in the way.
Only 27 per cent of Ontario’s unemployed qualify for EI. The national picture is significantly better — on average 44 per cent qualify in other provinces — but the majority still remain without access to critical unemployment supports.33 Despite this, the contribution of Ontarians to EI has remained in line with the province’s share of the population. Between 2001 and 2010, this led to a $20 billion difference between what Ontario businesses and employees pay in EI premiums and the benefits workers receive.34
32 Department of Finance Canada. 2013. Update of Economic and Fiscal Projections. Accessed at http://www.fin.gc.ca/efp-pef/2013/index-eng.asp33 Government of Ontario. 2015. Building Ontario Up. Accessed at http://www.fin.gov.on.ca/en/budget/ontariobudgets/2015/papers_all.pdf34 Employment Insurance Task Force. 2012. Making it Work: Final Recommendations of the Mowat Centre Employment Insurance Task Force. Mowat Centre.
Persons with Disabilities
Youth (15-24)
Recent Immigrants
AboriginalPeople
Ontario
6.9%
7.3%
12.6% 12.6%
15.5% 16.0%
Unemployment Rate Canada

mowat centre | may 2015 | 14
A focus on developing untapped and underutilized human capital, including Aboriginal people, youth, recent immigrants and people with disabilities, should be priority.
The fact that Canadian businesses invest less in training compared to other advanced economies is another key barrier to building up a skilled and resilient workforce. Underpinning this and other challenges is a lack of reliable and local labour market information, without which efficient workforce development planning is made even more difficult.
Recommendations
1. Adopt a nationally standardized support system for the unemployed
Canada’s EI entitlement system is one of the most complex in the OECD. While peer nations deliver comparable benefits to the unemployed regardless of address, Canada is alone in basing its entitlements on 58 regions of residence. This arrangement contributes to Ontarians receiving less unemployment support than Canadians in other areas of the country. Even within Ontario, in neighbouring municipalities such as Hamilton and Toronto, duration and level of benefits vary. Aside from being unfair, regional differences in EI also lead to decreased labour mobility.
Adopting a single national qualification standard for EI should be a priority for the federal government. The benefit duration rate and weekly benefit formula are other key components in need of standardization. These, and 15 other recommendations in support of a more effective, fair and principled system of employment insurance, were made by the Mowat Centre’s EI Taskforce in 2012.35
2. Reform structure of Labour Market Development Agreements (LMDA) to ensure more unemployed Ontarians receive training and employment supports
The structure of the LMDA is the main reason why many unemployed Ontarians fail to qualify for EI training and employment supports. As it stands, Ontario’s share (29 percent) of the nearly $2 billion in federal LMDA funds does not reflect the province’s share of population, unemployment or EI contributions.
The simple reason for this is that the LMDAs have not evolved with the changes that have drastically affected Ontario’s labour market since 1996, the last time eligibility criteria were set.
Today, more people work in part-time jobs than 20 years ago. Only about a third of those working part-time are doing so voluntarily, the rest would prefer to be employed full-time. Because EI supports are closely tied to hours worked, many individuals with part-time experience receive limited benefits or fail to qualify altogether. Qualifying for EI-sponsored training is especially difficult for those with little or no work experience, such as newcomers or youth, who would stand to gain the most from government-funded training.
The LMDA will soon be up for negotiation, and it is vital that the federal government work with Ontario to address these imbalances. In particular, the federal government should make it easier for provinces to use LMDA funding to help the unemployed regardless of whether they qualify for EI. The 1996 allocation formula should also be adjusted to ensure unemployed individuals in Ontario have the same access to skills training and development as Canadians across the country.
3. Increase the availability of local labour market information
The lack of timely, relevant and locally-refined labour market information (LMI) is a persistent and major challenge to workforce development in Ontario. Increased access to good-quality data about workers and
35 Employment Insurance Task Force. 2012.

15 | a federal economic agenda for ontario
employers in the region would drive better policy and planning at the provincial and local levels. In reality, as a 2009 report revealed, enough of this data is in fact available, but extremely difficult to locate and analyze.36
The federal government has taken important steps in recent years to improve the quality and breadth of LMI through the expansion of several labour surveys. In the 2015 budget, the federal government also proposes to allocate $4 million toward building a one-stop portal for LMI over the next two years, with the assistance of partners from the public and private sectors. The portal would be essential to raising awareness of available LMI and facilitating the dissemination of data.
Moving forward, the federal government, through Statistics Canada, should also work closely with provinces and territories to fill in key gaps on local labour markets, in order to help individuals, businesses and workforce development organizations identify and connect potential employees and employers in the same communities. In particular, higher-quality information on historically disadvantaged labour market participants — people with disabilities, Aboriginal people, youth, older workers, visible minorities, and immigrants — is needed to improve targeted policies and efforts to assist labour market integration.37
4. Reinstate the mandatory Long-Form Census
The recently introduced National Household Survey (NHS), which replaced the mandatory Long-Form Census in 2010, has also affected the ability of employers, governments and community providers to strengthen local workforces, make cross-jurisdictional comparisons and track progress over time.
Long-Form Census data have long been a reliable source of information for both private and public decision-making. With the introduction of the new voluntary survey, many have argued that NHS is not only more costly to manage, but also lacks the reliability and depth of the Long-Form Census.38 Furthermore, because of the NHS’ voluntary nature, some groups are more likely to respond to the survey than others. This both distorts data and inadvertently disadvantages whole groups.
By comparison, the Long-Form Census is a more reliable, richer and less costly data gathering method. The federal government should reinstate it as soon as possible.
5. Introduce an employer tax credit for job training
To encourage more employer participation in workforce training, the federal government introduced the Canada Job Grant in its 2013 budget. The grant makes a maximum $15,000 available to employers for training, with up to $10,000 covered by the federal government and the remaining $5,000 left to the province.
One critical issue is that funding for the provincial portion of the grant will come from Labour Market Agreements (LMA). This is problematic because the programs currently funded through LMAs target vulnerable and historically disadvantaged groups with tenuous ties to the labour market. These same groups are the ones with little chance of receiving EI-funded training supports.
The Canada Job Grant, while a step in the right direction to encouraging more employer-based training, should be complemented by other measures, such as an employer tax credit, to ensure historically disadvantaged groups continue to have access to programs that help them prepare for and secure gainful employment.
36 Advisory Panel on Labour Market Information. 2009. Working Together to Build a Better Labour Market Information System for Canada. Ac-cessed at http://publications.gc.ca/collections/collection_2011/rhdcc-hrsdc/HS18-24-2009-eng.pdf37 Advisory Panel on Labour Market Information. 200938 Globe Editorial. 2013. “Canada needs a proper census, and it’s not irresponsible to say so.” The Globe and Mail. Accessed at http://www.theglo-beandmail.com/globe-debate/editorials/canada-needs-a-proper-census-and-its-not-irresponsible-to-say-so/article12793625/

mowat centre | may 2015 | 16
An employer tax credit based on the successful Federal Apprenticeship Job Creation Tax Credit (AJCTC) could be introduced as a way to complement the Canada-Ontario Job Grant. Industry has praised the AJCTC, and has recommended that the maximum annual value be increased and eligibility criteria expanded in order for more and smaller businesses to take advantage of the program.39 A similar program in British Columbia also offers increased credit for training Aboriginal apprentices, increasing the program’s ability to target more vulnerable segments of the labour force.
6. Develop a national entrepreneurship strategy
To address persistent gaps in newcomer, youth and Aboriginal employment, the federal government should devise and promote a national entrepreneurship strategy.
This strategy could include, for example, federal leadership to promote entrepreneurial studies early-on in school curricula, mentoring and businesses supports, improving access to services and resources for new businesses through one-stop, user-friendly portals, provision of entrepreneurship accelerators and incubation services, and generally promoting entrepreneurship as a viable career path.
Similar national strategies are being successfully deployed, including in the U.S. (Box 3).
Box 3: Startup America – A National Entrepreneurship StrategyStartup America’s mission is to “celebrate, inspire, and accelerate high-growth entrepreneurship throughout the nation.”40 The White House-led initiative is a collaboration among multiple federal agencies, leading entrepreneurs, businesses, higher-education institutions and other partners to develop a thriving entrepreneurial ecosystem that supports more successful entrepreneurs.
So far, over 20 programs have been launched in support of the Startup America intiative. The programs share five core goals:
» Expanding access to capital for high-growth startups throughout the country;
» Exapanding entrepreneurship education and membership programs that empower more Americans not just to get a job, but to create jobs;
» Strengthening commercialization of the about $148 billion in annual federally-funded research and development, which can generate innovative startups and entirely new industries;
» Identifying and removing unnecessary barriers to high-growth startups; and
» Expanding collaborations between large companies and startups.
The initiative also specifically targets the “next generation of entrepreneurs,” through five national programs that engage youth — from pre-elementary to post-secondary levels — in building entrepreneurial skill and capacity.
39 Canadian Construction Association Pre-Budget Submission. 2015. Accessed at http://www.cca-acc.com/pdfs/en/budget/2015prebudget.pdf40 The White House. “Fact Sheet: White House Launches Startup America Initiative.” Accessed at https://www.whitehouse.gov/startup-america-fact-sheet

17 | a federal economic agenda for ontario
b. enhancing opportunity for Aboriginal people through tailored education and skills development programs
Key Stats » Between 2006-2011 Ontario’s Aboriginal population grew five times faster than its non-Aboriginal
population.41
» Nearly 42 per cent of Aboriginal people in Ontario are under the age of 25, compared with 30 per cent of the non-Aboriginal population.42
» Aboriginal people experience unemployment at twice the rate of other Canadians.43
» The largest provincial share, 21.5 per cent, of the Canadian Aboriginal population resides in Ontario.44
What we heard from Ontario Stakeholders » Recognize the critical role young Aboriginal people will play in addressing labour market shortages
by facilitating more skill development opportunities and increasing workforce participation.
» Engage Aboriginal students and ensure their academic success through culturally appropriate curricula.
» Address the jurisdictional gaps in Aboriginal health care delivery that lead to poorer health outcomes for Aboriginal populations and strain local service providers.
41 National Household Survey. 2011. Statistics Canada. 42 National Household Survey. 2011. Statistics Canada. 43 National Household Survey. 2011. Statistics Canada. 44 National Household Survey. 2011. Statistics Canada.

mowat centre | may 2015 | 18
Issue backgroundIn Ontario, and across Canada, Aboriginal people complete less years of schooling, are subject to more precarious employment, earn lower incomes and experience poorer health outcomes. Although the gap between Aboriginal people and the general population on a number of wealth and quality of life indices is narrowing, Aboriginal people in Ontario continue to face much tougher challenges than their non-Aboriginal counterparts.
The Aboriginal population in Ontario is younger and is growing at a faster rate than any other population segment. By 2026, more than 100,000 Aboriginal youth will enter the labour market.45 At a time of increasing labour shortages, worries about decreasing dependency ratios and intense global competition for talent, Canada can ill-afford to squander the opportunity to build up human capital within its borders. Today’s Aboriginal youth must be given a better chance to realize their potential than previous generations.
FIGURe 6: MeDIAN eMPlOyMeNT INCOMe, ABORIGINAl AND NON-ABORIGINAl
Source: Statistics Canada.
45 Ontario Federation of Indigenous Friendship Centres. 2013. Aboriginal Labour Force and Training Strategic Framework: Identifying our Poten-tial. Accessed at http://ofifc.org/sites/default/files/docs/2013-04-17%20Labour%20Force%20and%20Training%20Strategy%20-%20FINAL.pdf
$5,000
$10,000
$15,000
$20,000
$25,000
$30,000
$35,000
Income GapNon-Aboriginal Aboriginal
2011200620011996
$31,908
$24,481
$7,427

19 | a federal economic agenda for ontario
FIGURe 7: ShARe OF ONTARIO’S yOUTh POPUlATION, ABORIGINAl AND NON-ABORIGINAl (2011)
Source: Statistics Canada
Aboriginal education and employment programs remain chronically under-funded by the federal government. The structure of existing federal supports is inadequate and is further threatened by changes to LMDA funding. Many existing programs fail to take into account culturally appropriate approaches and do not recognize the individual’s full spectrum of need, which can also include housing and mental health assistance.
Effective programming must also take into account the different circumstances faced by Aboriginal people living in urban and rural regions. In Northern Ontario, especially in more remote areas, Aboriginal communities face an inadequate supply of essential public services, as well as lack of access to affordable housing and food. Big development projects in the north, such as the Ring of Fire, cannot succeed without addressing such fundamental issues.
Recommendations
1. Re-model Aboriginal education to be based on locally-controlled and culturally tailored frameworks
While growing numbers of young Aboriginal people are completing higher levels of schooling today compared to previous generations, a large achievement gap persists between Aboriginal people and the general Canadian population. In 2011, the last census year, just under half the Aboriginal population had some post-secondary education, compared to nearly two-thirds among the non-Aboriginal population.46
Aboriginal education has been a contentious issue in Canada for decades. The latest proposed solution, Bill C-33, was put forth following a national agreement between the federal government and the Assembly of First Nations. Unfortunately, the proposed legislation, which was built around enhanced federal financial contribution, missed the mark and was ultimately abandoned.
46 Statistics Canada. 2011. The educational attainment of Aboriginal people in Canada. Accessed at http://www12.statcan.gc.ca/nhs-enm/2011/as-sa/99-012-x/99-012-x2011003_3-eng.cfm
% of Population under 15% of Population under 25
Non-AboriginalAboriginal
41.6%
30.4%
24.6%
17.0%
mowat centre | may 2015 | 20
The increased financial contribution proposed in Bill C-33 may bring modest gains to on-reserve schooling, but the fundamental missing piece is the implementation of a community-based approach that is respectful of the “learning spirit” while also supporting a real shift of decision-making into the hands of First Nations communities.47
Box 4: The Nova Scotia Model for Community-Based SchoolsThe Nova Scotian Mi’kmaw school authority founded in 1992, known as the Mi’kmaw Kina’matnewey, has proven to be a promising community-based and First Nation-run model for others to follow. First Nation communities operating under this framework have experienced increasingly higher student graduation rates.48
The federal government should re-model Aboriginal education in Ontario, and in Canada more generally, to be based on locally-controlled and culturally tailored frameworks, such as the Nova Scotian Mi’kmaw school authority. Furthermore, priority should be placed more on developing an appropriate framework in partnership with First Nations communities, and less on the dollar figure attached.
2. Include specific provisions in LMDA to reflect needs of Aboriginal population
Ontario has the largest number of Aboriginal residents, representing 21.5 per cent of the total Aboriginal population in Canada;49 a large majority — nearly 85 per cent — lives off-reserve.
The proportion of the Aboriginal population residing both on-reserve and off-reserve in Ontario should be considered when negotiating and allocating funds under the LMDAs and the Canada-Ontario Jobs Grant. In particular, an Aboriginal-specific allocation within the LMDA should be introduced to support Aboriginal labour market interventions in both urban and rural settings across Ontario.
An Aboriginal-specific allocation within the LMDA should be introduced to support Aboriginal labour market interventions in both urban and rural settings across Ontario.
Current LMDA funded programs through Employment Ontario (EO) have been inadequate overall in addressing the complex training needs of urban Aboriginal people. Funding must be made available to Aboriginal multi-service agencies that can best serve individuals, and not only through existing EO service providers or employers.
3. Support the Aboriginal workforce through proven programs tailored to local needs
The need to increase Aboriginal participation in the labour force — especially of Aboriginal youth who experience unemployment at twice the rate of youth in the general population — will become even more critical in the coming years as Canada’s population ages. The federal government has helped to develop and fund a number of successful, evidence-based strategies and programs that should be expanded and extended to provide the necessary training to Aboriginal people.
47 Bennett, P.W. and Anuik, J. 2014. Picking up the Pieces: A Community-School-Based Approach to First Nations Education Renewal. Northern Policy Institute. Accessed at https://northernpolicy.files.wordpress.com/2014/10/npi_pickinguppieces_sept2014_en1.pdf48 Ibid.49 Statistics Canada. 2011. Aboriginal People in Canada: First Nations People, Métis and Inuit. Accessed at http://www12.statcan.gc.ca/nhs-enm/2011/as-sa/99-011-x/99-011-x2011001-eng.cfm

21 | a federal economic agenda for ontario
The Aboriginal Skills and Employment Training Strategy (ASETS) is one approach. ASETS assists Aboriginal people in accessing long-term employment opportunities through education, skills development and training programs. ASETS supports over a dozen organizations (ASETS agreement holders) across the province, both on-reserve and off-reserve, each of which has the flexibility and authority to make program decisions based on the needs of local clients.
ASETS grew out of a precursor program — Aboriginal Skills and Employment Partnership — following a favourable evaluation that demonstrated increases in employment earnings, incidences of employment, job retention and advancement.50 The same evaluation indicated that there was a need for similar Aboriginal labour market programs “that help to address systematic barriers which impede the full participation of Aboriginal people in the labour market.” 51
ASETS was scheduled to end in 2015, but has received a one-year extension. The federal government should renew the strategy for a longer time frame and expand its reach for both on-reserve and off-reserve Aboriginal job-seekers.
4. Work with the provincial government to close jurisdictional gaps that adversely affect the delivery of health care to Aboriginal people
The link between health and economic wellbeing is well established. Healthy people are able to work more and for longer, contributing to their incomes, their childrens’ future and to government revenues that will, in turn, provide higher quality of care.
In Canada, the federal and provincial governments share jurisdiction in delivering health care services for Aboriginal people. The federal government is responsible for delivering primary health care services on reserve, while off-reserve health care is a provincial domain. Where applicable, the federal government also provides additional funding to provinces for some cost-shareable programs and health care premiums.
Though the jurisdictional boundaries appear clear-cut, in practice they have contributed to an uncoordinated and fragmented system that, relative to other populations, has burdened Aboriginal people with poorer health outcomes. Higher mortality rates among Aboriginal people have been attributed to the poor functioning of this system.52
Current arrangements also place considerable strain on local health providers who, while seeing rising numbers of on-reserve cases, receive little in the way of funding increases from either level of government. This occurs because many on-reserve Aboriginals seek treatment within provincial jurisdiction, which does not account for them. As a result, local health providers struggle to provide adequate care with inadequate resources.
An integrated system of Aboriginal health care is needed to replace the current patchwork of policies that have left a large segment of the Canadian population greatly underserved. A model based on British Columbia’s tripartite health initiative — which aims to close the gap in health outcomes between Aboriginal people and other provincial residents through a collaborative approach — should be explored as a remedy in the Ontario context.
50 Employment and Social Development Canada. 2013. Summative Evaluation of the Aboriginal Skill and Employment Partnership Program. Ac-cessed at http://www.esdc.gc.ca/eng/publications/evaluations/skills_and_employment/2013/october.shtml51 Summative Evaluation of the Aboriginal Skill and Employment Partnership Program. 2013. 52 Kelly, M.D. 2011. Toward a New Era of Policy: Health Care Service Delivery to First Nations. The International Indigenous Policy Journal, vol. 2 (1). Accessed at http://ir.lib.uwo.ca/cgi/viewcontent.cgi?article=1017&context=iipj
mowat centre | may 2015 | 22
3 Attracting global talent and supporting immigrants to Ontario
Key Stats » Between 2001 and 2011, Ontario’s share of immigrants to Canada declined by more than 30 per
cent.53
» Economic immigrants to Ontario make up only 50 per cent of newcomers to the province. Most of Canada’s other provinces have a share that meets or exceeds the goal set by federal and provincial ministers of 70 per cent economic immigration.54
» In 2013, roughly 103,500 immigrants settled in the province.55 Immigration to Ontario must be increased to at least 135,000 people per year to sustain the provincial workforce.56
What we heard from Ontario stakeholders » Ensure immigration policies are consistent with heightened competition for talent. Policies should
focus on attracting and keeping qualified international individuals in Canada.
» Address declining funding for settlement in Ontario. Communities are having a harder time delivering adequate support to immigrants and ensuring they remain in the community, adding to heightened concerns about population outflow.
» Reassess the changes made to the Temporary Foreign Workers program. New rules threaten to hurt Ontario’s ability to attract highly-qualified workers and are more burdensome for Small and Medium Enterprises (SMEs).
53 Ontario Ministry of Citizenship and Immigration. 2012. Expanding our Routes to Success: The Final Report by Ontario’s Expert Roundtable on Immigration. 54 Expanding our Routes to Success. 2012.55 Citizenship and Immigration Canada. 2013. Facts and Figures 2013 — Immigration overview: Permanent Residents. Accessed at http://www.cic.gc.ca/english/resources/statistics/facts2013/permanent/11.asp56 Expanding our Routes to Success. 2012.

23 | a federal economic agenda for ontario
Issue backgroundUp until the beginning of the 2000s, nearly two-thirds of all immigrants to Canada settled in Ontario. Since then, the number of immigrants making their home in Ontario has dropped by more than 30 per cent.
The perception among newcomers that there is more opportunity elsewhere in Canada partly explains this decline. The drop in immigration to Ontario is also attributable to a number of major changes to Canada’s immigration system in recent years. Since 2008, significant adjustments have been made to all three immigration streams - economic, family reunification and humanitarian. Additionally, many rules affecting citizenship, temporary foreign workers and international students have been changed since then.
The result has been two-fold. First, Ontario has not only experienced declining total immigration, but also a declining number of economic immigrants specifically. Whereas most other provinces are near or above the federally set target of receiving 70 per cent of their immigrants through economic programs, Ontario’s share is well below — just 50 per cent.
FIGURe 8: IMMIGRATION CATeGORy By PROvINCe
Source: Citizenship and Immigration Canada, Permanent Resident Data System, 2011.
Second, the adjustments have led to a growing focus on a “just-in-time labour market strategy that favours immigrants and temporary entrants who can make a short-term economic impact.”57 While building a responsive and flexible immigration system is a worthwhile objective, the federal government must also ensure that new rules do not obscure paths to residency and citizenship that discourage the settling of talented individuals that our economy needs.
57 Albion, N. and Cohl, K. 2012. Shaping the Future: Canada’s rapidly changing immigration policies. Maytree. Accessed at http://maytree.com/wp-content/uploads/2012/10/shaping-the-future.pdf
Refugee/OtherFamilyEconomic
CanadaBCABSKMBONQCNBNS
69%
6%9%6%9%
13%
50%
18%
32%
72%
17%
11%8%
11%
81%
11%
20%
78%
7%
23%25%
13%
87%
61%
33%
68%62%

mowat centre | may 2015 | 24
Recommendations
1. Increase the number of economic immigrants to Ontario
The decline of immigrants, and particularly economic immigrants, to Ontario poses significant challenges to the long-term labour force outlook in the province. Because nearly all labour force growth is projected to come from outside Canada’s borders, immigration to Ontario must be increased to at least one per cent of the provincial population, or 135,000 people per year to sustain the provincial workforce.58 70 per cent of these immigrants, or 94,500 should be admitted through economic programs, including Provincial Nominee Program (PNP) and Express Entry.
Given the evolving nature of Canada’s immigration system in recent years, it is still unclear how PNP and Express Entry will interact to allocate immigrants to Ontario.
Recent positive changes to the PNP have doubled the total number of immigrants admitted through the program (from roughly 2,500 to 5,000), while Express Entry promises to introduce more provincial discretion in the selection process. Combined, these changes will maximize Ontario’s ability to attract and select immigrants based on the province’s unique economic and labour market needs.
The federal government should continue to collaborate with the province to ensure that PNP and Express Entry evolve to admit more immigrants to the province and the total number of economic immigrants is increased to 94,500 on an annual basis.
2. Develop reasonable and clear pathways to residency for international students
Ensuring international students — who have benefitted from Canadian public investments in education, gained Canadian experience and formed attachments to local communities — can remain in place after graduating is a priority for many communities in Ontario experiencing large outflows of talented graduates.
However, changes to Canada’s immigration system introduced through the new Express Entry program have obscured pathways to residency for international students. This could affect Canada’s ability to recruit international students in the future.
The federal government should assess the negative impact Express Entry has on international students’ ability to qualify for work and residence following graduation, as well as the impact on communities when the students leave.
Under the new rules, international students with a degree or diploma from a Canadian institution are placed with other groups of skilled workers in a “pool” from which Citizenship and Immigration draws invitations for permanent residence. Before Express Entry, international students were not required to compete with skilled workers, and instead gained access to residency through the Canadian Experience class.
The federal government should assess the negative impact Express Entry has on international students’ ability to qualify for work and residence following graduation, as well as the impact on communities when the students leave.
58 Expanding our Routes to Success. 2012.

25 | a federal economic agenda for ontario
3. Address declining immigrant settlement funding in Ontario
The federal government transfers immigrant settlement funds to the provinces, which help to cover important integration and settlement services such as language, skills and bridge training programs. These services are essential to getting a good start and putting newcomers on a path to long-term success in Canada.
Due to inconsistencies in the federal settlement funding formula, however, Ontario receives less support on a per-client basis to fund these important services. While the federal transfer is supposed to allocate the same amount per immigrant, Ontario receives $500 less per immigrant than Newfoundland and Labrador. The elimination of bilateral settlement agreements with provinces five years ago intended to end these discrepancies, but instead, differences in access to settlement services across Canada persist.
Ontario now also receives a greater proportion of family and humanitarian stream immigrants who require more settlement support than economic immigrants. As a result, inconsistencies in the funding formula further burden the province and disadvantage newcomers who choose to make their home in Ontario.
The federal government already has a principled approach in place to allocate immigrant settlement funds. It should now address the discrepancies in funding that continue to persist, and align practice with principle.
4. Revise the new rules governing the Temporary Foreign Workers Program
In response to a series of program abuses by high-profile employers in recent years, the federal government has introduced a number of measures to tighten Temporary Foreign Worker Program (TFWP) rules and reduce the risk of future problems. While ensuring qualified Canadians have priority to available jobs is critical, the new TFWP changes are overly-restrictive and place an unnecessarily high burden on SMEs.
Many sectors and industries rely on the TFWP to fill labour and skill shortages. For example, in the Canadian academic sector, a quarter of permanent hires enter through the TFWP.59 The perspectives and skills that these international workers bring are essential to their roles and to the success of their institutions.
With caps on occupation imposed by the Federal Skilled Worker Program (the largest source of immigrants to Canada), TFWP also offers many industries greater and more timely access to the workers they need.
The newly introduced TFWP rules will make it more difficult, costly and time consuming for organizations to justify their recruitment practices and fill their labour needs. For example, employers will be required to develop “firm plans” for transitioning to Canadian workers over time, have no more than 10 per cent of their workforce as low-wage temporary foreign workers, and pay $275 per position for the processing of Labour Market Impact Assessments.
There is a high need for workers across many occupations and sectors of the Canadian economy. The TFWP helps fill the gap and supports the employment of Canadians as well — in the creative industries, temporary foreign workers facilitate tens of thousands of Canadian jobs.
The federal government should reassess and re-write the most onerous rules and focus on targeting employers that are considered at higher-risk of abusing the system.
59 Chiose, S. 2015. “Canadian universities urge Ottawa to relax foreign worker porgram rules.” The Globe and Mail. Accessed at http://www.theglo-beandmail.com/news/politics/canadian-universities-urge-ottawa-to-relax-foreign-worker-program-rules/article22826162/

mowat centre | may 2015 | 26
4 Strengthening innovation and productivity through coordinated and expanded business supports
Key Stats » More than 50 per cent of effective Canadian patent output is generated in Ontario.60
» Since 2001, average labour productivity in Ontario has grown by only 0.5 per cent.61
» Business R&D investment has been in decline since 2001, and Canadian businesses rank 15th out of 16 OECD peers on BERD.62
» The Canadian governments spend more than $20 billion annually on economic development.63
What we heard from Ontario Stakeholders » Ensure businesses are supported at critical moments throughout the innovation life-cycle — from
research to commercialization.
» Address the lack of federal/provincial alignment in economic development and business support programs.
» Recognize the important role of not-for-profit innovation by facilitating revenue-generating capacity and opening access to business supports.
60 Task Force on Competitiveness, Productivity and Economic Progress. 2013. Course Correction: Charting a new roadmap for Ontario. Institute for Competitiveness and Prosperity. Accessed at http://www.competeprosper.ca/work/annual_reports/annual_report_course_correction61 Jobs and Prosperity Council. 2012. Advantage Ontario. 62 Conference Board of Canada. 2013. Report Card - Business Enterprise R&D Spending. Accessed at http://www.conferenceboard.ca/hcp/details/innovation/berd.aspx63 Johal, S., Mendelsohn, M. and Zon, N. 2013. Let’s Talk: Coordinating Economic Development Spending in Canada. Mowat Centre.

27 | a federal economic agenda for ontario
Issue backgroundInnovation is a key driver of productivity and economic growth. It is linked with raising quality of life and increasing sustainability. Ontario, home to several world-class research institutions, a highly-educated workforce and a competitive business environment, is Canada’s innovation hub.
For the better part of the last 30 years, however, productivity growth has been lagging in both Ontario and Canada relative to the growth experienced by peer nations. Since 2001, Ontario’s business-sector productivity has grown by 0.4 per cent annually, while in the U.S. annual growth has increased by 2.4 per cent.64 International comparisons of productivity and innovation tend to rank Canada poorly, relative to peer countries.
Many studies have attempted to explain the causes and effects of Canada’s widening productivity gap and lagging innovation performance. The structure of federal supports for R&D has received much focus — supports for business R&D in Canada are considered among some of the most generous in the world, with annual federal investments amounting to $6.5 billion. More than half of this amount is delivered through the Scientific Research and Experimental Development program (SR&ED). Despite this ample investment, the proportion of overall R&D activity in Canada undertaken by the business sector is just three-quarters of the OECD average.65
FIGURe 9: ONTARIO lABOUR PRODUCTIvITy COMPAReD wITh PeeR NATIONS
Source: Ontario’s long Term Report on the economy, 2014.
Another barrier to growing innovation in Canada is the challenge of commercializing new products. Startups in particular struggle with financing and often lack the business management expertise to take products to market. With limited support available at the critical stage in the innovation process, many firms turn to foreign investors who are able to deliver both. As a result, Canadian startups, which have benefitted from public R&D investments, are bought and relocated outside of Canada, along with the jobs that otherwise would have been created in Canada.
Finally, innovation and productivity growth must be thought of in broader terms, beyond the contribution of private sector firms. The not-for-profit (NFP) and charitable sector is one of the largest economic sectors in Ontario and in Canada, employing over 11.1 per cent of the Canadian labour force and contributing
64 Ontario Ministry of Finance. 2014. Ontario’s Long Term Report on the Economy. Accessed at http://www.fin.gov.on.ca/en/economy/ltr/2014/ch5.html#ch5_c265 Government of Canada. 2014. Seizing Canada’s Moment: Moving Forward in Science, Technology and Innovation. Accessed at https://www.ic.gc.ca/eic/site/icgc.nsf/vwapj/Seizing_Moment_ST_I-Report-2014-eng.pdf/$file/Seizing_Moment_ST_I-Report-2014-eng.pdf
Tota
l Eco
nom
y: R
eal O
utpu
t Per
Hou
r W
orke
d (2
005
$US
PP
P) (
Inde
x: 1
984
= 10
0)
Japan
G7GermanyU.S.
CanadaOntario
1984 1987 1990 1992 1996 1999 2002 2005 2008 2011
200
160
180
140
120
100

mowat centre | may 2015 | 28
8.1 per cent to the national GDP.66 Given its size and importance to the economy, the same foundational structures needed to foster innovation and accelerate productivity in the private sector need to be adopted for NFP organizations.
The not-for-profit (NFP) and charitable sector is one of the largest economic sectors in Ontario and in Canada, employing over 11.1 per cent of the Canadian labour force and contributing 8.1 per cent to the national GDP.67 Given its size and importance to the economy, the same foundational structures needed to foster innovation and accelerate productivity in the private sector need to be adopted for NFP organizations.
Overall, the federal government and the province have a number of incentives and programs already in place to promote greater business innovation and productivity. What is needed is a more coordinated strategy that maximizes the return on these significant investments, and grants wider access to business supports.
Recommendations
1. Restore SR&ED tax credit to 20 per cent
One proposed solution to lagging private sector investment in R&D has been to rebalance innovation funds in favour of more direct support, instead of through the SR&ED tax credit. Among advanced economies, Canada in fact is an outlier when it comes to its distribution of indirect and direct funding for R&D.
As a result, the federal government has already taken steps to streamline SR&ED and reduce its rate by five percentage points, down to 15 per cent. By the time changes are fully rolled out, SR&ED investments are expected to decrease by about $500 million per year across all sectors and regions in Canada.68 Given Ontario’s significant share of R&D activity in Canada, Ontario businesses stand to lose the most from the change.
Furthermore, SR&ED demonstrates clear return on investment. It has also been suggested that increasing SR&ED rates is the most effective way to increase research effort and welfare in Canada compared to other fiscal policy tools.69 Meanwhile, direct programs, which SR&ED funding is currently being redirected to, do not benefit from similarly demonstrable results.
The federal government should reinstate the 20 per cent rate of the SR&ED tax credit and undertake more analysis on the returns generated by a redistribution of R&D funds to more direct programs, to ensure the goals of R&D supports in Canada are being met.70
66 Imagine Canada. “Key Facts about Canada’s Charities.” Accessed at http://www.imaginecanada.ca/resources-and-tools/research-and-facts/key-facts-about-canada%E2%80%99s-charities67 Imagine Canada. “Key Facts about Canada’s Charities.” Accessed at http://www.imaginecanada.ca/resources-and-tools/research-and-facts/key-facts-about-canada%E2%80%99s-charities68 Canada Chamber of Commerce. 2012. Submission to the Department of Finance Canada on the August 14, 2012 Legislative Proposals Relating to the Income Tax Act and Regulations. 69 Brouillette, D. 2011. Estimating the Incremental Impacts of a Provincial R&D Tax Credit on Business R&D Expenditures Using a Natural Experi-ment in British Columbia. Industry Canada. Accessed at https://www.ic.gc.ca/eic/site/eas-aes.nsf/eng/ra02227.html?Open&pv=170 Information Technology Association of Canada. “The Issue: The Importance of SR&ED to ICT R&D.” Accessed at http://itac.ca/uploads/research/the_issue_the_importance_of_sranded_to_ict_randd.pdf

29 | a federal economic agenda for ontario
2. Leverage federal procurement to address commercialization challenges
There are many ways in which the federal government can play a bigger role in championing Ontario’s and Canada’s innovative firms. Industry repeatedly cites access to risk capital as an essential component to keeping commercialization within our borders. Strides have already been made by the federal government to increase access through the introduction of the $400 million Venture Capital Action Plan in 2013, which seeks to raise an additional $800 million from private investors. Flow-through shares — a type of common share unique to the Canadian mining industry that allows the firm’s tax credits to ‘flow through’ to shareholders — has also been proposed by the life sciences sector for years as a means to stimulate investments from the public capital markets.
One particularly important action for the federal government to take is to leverage its procurement practices to enhance the long-term commercial success of new Canadian companies. Specifically, the introduction of a program similar to one in the U.S. — the Small Business Innovation and Research Program (SBIR) — would provide small businesses and startups with much needed resources to test and market their products and services in Canada.
SBIR, and similar programs in the U.K., Australia and Japan, have been in place for as long as three decades. These set-aside programs earmark small percentages of the federal procurement budgets to innovative SMEs through competitive bids, with the goal of providing early stage financial support to innovative firms with commercial promise. In turn, the practice provides government agencies with “new, cost-effective technology and scientific solutions to meet their needs.”71
In 2011, the Jenkins Report (a review of Canada’s innovation policy) advocated for SBIR’s implementation in Canada, arguing that business innovation should be “one of the core objectives of procurement” and that SBIR would support that vision.72 The federal government should answer that call and implement a SBIR-like program as an essential cornerstone of its procurement strategy.
3. Facilitate Not-for-Profit innovation and leadership through increased revenue-generating capacity and access to business supports
Increasing the revenue-generating capacity of the NFP sector is fundamental to bolstering the sector’s capacity for innovation. With the NFP sector facing increasing sustainability challenges, the social enterprise model in particular has become more and more attractive.73 Social enterprises are profit-generating businesses with social purposes. British Columbia, Nova Scotia and the U.K. have all introduced legislation to define and regulate these types of ‘hybrid’ organizations in recent years. Ontario has recently established an office in the Ministry of Economic Development, Employment and Infrastructure dedicated to promoting social enterprise.
Expanding eligibility for these programs makes sense at a time when the sector is being asked to be more innovative and achieve more with less.
While jurisdictions in Canada have made major strides to increase revenue generation for NFPs and encourage self-sustainability, these efforts have continuously bumped up against Canada Revenue Agency (CRA) regulation. This is the result of provinces having responsibility over charitable and provincially
71 OECD. 2010. Public Procurement Programmes for Small Firms - SBIR-type Programmes. Accessed at http://www.oecd.org/innovation/policy-platform/48136807.pdf 72 Expert Panel on the Review of Federal Support to Research and Development. 2011. Innovation Canada: A Call to Action. Accessed at http://rd-review.ca/eic/site/033.nsf/vwapj/R-D_InnovationCanada_Final-eng.pdf/$FILE/R-D_InnovationCanada_Final-eng.pdf73 McIsaac, E. and Moody, C. 2013. The Social Enterprise Opportunity for Ontario. Mowat NFP, Mowat Centre.

mowat centre | may 2015 | 30
incorporated non-profits, while the federal government controls their taxation benefits through the Income Tax Act. For provincial social enterprise efforts to make a real impact, the federal government must make adjustments to the Income Tax Act and allow non-profits greater flexibility in how they use and generate revenue.74
In addition, leading not-for-profit sector organizations and experts have advocated for expanding federal innovation and business development supports to the NFP sector. Numerous programs and services at the federal level assist and advise small and medium businesses; these same programs could also serve the needs of social enterprise, charity and NFP organizations.75 Expanding eligibility for these programs makes sense at a time when the sector is being asked to be more innovative and achieve more with less. As a first step, the federal government should work with the NFP sector to identify barriers to accessing these supports, with a view to eventually opening program eligibility for NFPs.
4. Develop an intergovernmental strategy to coordinate economic development
In any federation, the national and sub-national governments often share jurisdiction in a number of policy areas. In many cases, this leads to overlapping programs and policies, unclear roles and accountabilities and divergent priorities. In Canada, while there is at least some effort to align program objectives and spending in certain areas of shared jurisdiction, including workforce development and infrastructure, no such coordination exists in economic development.
Local, provincial and federal governments together spend $20 billion annually to strengthen business productivity and innovation through economic development programs.76 However, only a few of these programs are crafted with the actions of other sub-national governments in mind. Many opportunities to better coordinate economic development efforts and maximize return on investment are missed.
To establish a coherent strategy that paves the way to improved productivity and innovation, the federal government should lead the creation of a series of federal-provincial tables on productivity, innovation and economic development to establish shared priorities and agreement on strategic investments.77
The federal government should also champion a nation-wide dialogue with business, public, NFP and academic leaders about priorities and key initiatives for a national economic development strategy.
74 Mendelsohn, M., Mulholland E., and Shamshiri, N. 2011. Strengthening the Third Pillar of the Union: An Intergovernmental Agenda for Canada’s Charities and Non-Profits. Mowat NFP, Mowat Centre. 75 Imagine Canada. 2010. Supporting innovation and resiliency in the charitable and non-profit sector: Pre-budget brief. Accessed at http://www.muttart.org/sites/default/files/report/2011_prebudget_submission_08172010.pdf76 Johal, S., Mendelsohn, M. and Zon, N. 2013. Let’s Talk: Coordinating Economic Development Spending in Canada. Mowat Centre.77 Johal, S., Mendelsohn, M. and Zon, N. 2013. Let’s Talk: Coordinating Economic Development Spending in Canada. Mowat Centre.

31 | a federal economic agenda for ontario
5Facilitating trade and investment across Canada and international borders
Key Stats » Ontario is one of the most trade-intensive regions in the world — foreign exports and imports each
represent about 31 per cent of provincial GDP each.78
» 1 in 7 Canadian jobs is linked to trade with the U.S.79
» More than 25 per cent of U.S.-Canada trade flow moves through Windsor, Ontario.80
» Eliminating obstacles in interprovincial labour mobility could increase movement of workers by more than 60 per cent. 81
What we heard from Ontario Stakeholders » Continue to expand international trade and facilitate the efficient flow of goods and people,
especially across the U.S. border.
» Address critical gaps in the Agreement on Internal Trade before CETA is enacted.
» Remove trade irritants that negatively impact Canada’s ability to attract foreign investment and contribute to declining share of Canadian global exports.
78 Anderson, B. The Border and the Ontario Economy. 2012. Cross-Border Transportation Centre, University of Windsor. Accessed at http://www1.uwindsor.ca/crossborder/system/files/The_Border_Report2012%281%29.pdf79 Canada’s Economic Action Plan. “Bilateral Relation: Canada-US Trade and Investment.” Government of Canada. Accessed at http://actionplan.gc.ca/en/page/bbg-tpf/bilateral-relations-canada-us-trade-and-investment80 Canada’s Economic Action Plan. “Detroit River International Crossing.” Government of Canada. Accessed at http://actionplan.gc.ca/en/initia-tive/detroit-river-international-crossing81 Amirault, D., de Munnik, D., and Miller, S. 2013. Explaining Canada’s Regional Migration Patterns. Bank of Canada Review. Accessed at http://www.bankofcanada.ca/wp-content/uploads/2013/05/boc-review-spring13-amirault.pdf
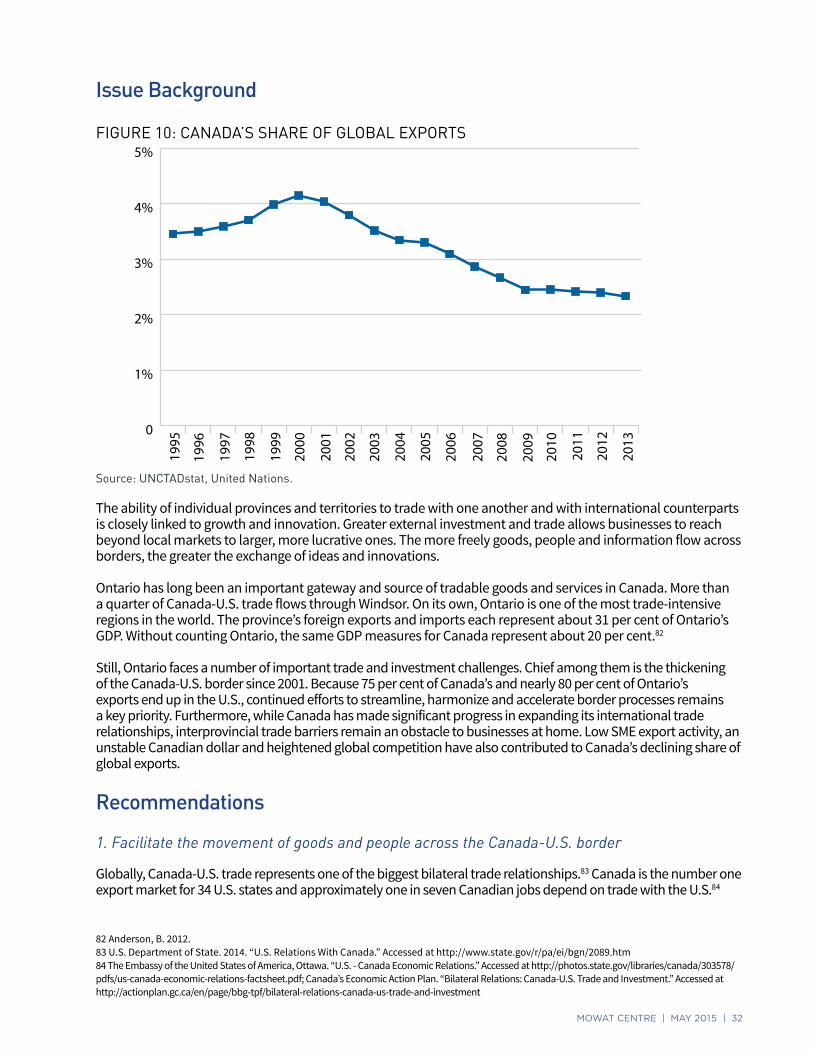
mowat centre | may 2015 | 32
Issue Background
FIGURe 10: CANADA’S ShARe OF GlOBAl exPORTS
Source: UNCTADstat, United Nations.
The ability of individual provinces and territories to trade with one another and with international counterparts is closely linked to growth and innovation. Greater external investment and trade allows businesses to reach beyond local markets to larger, more lucrative ones. The more freely goods, people and information flow across borders, the greater the exchange of ideas and innovations.
Ontario has long been an important gateway and source of tradable goods and services in Canada. More than a quarter of Canada-U.S. trade flows through Windsor. On its own, Ontario is one of the most trade-intensive regions in the world. The province’s foreign exports and imports each represent about 31 per cent of Ontario’s GDP. Without counting Ontario, the same GDP measures for Canada represent about 20 per cent.82
Still, Ontario faces a number of important trade and investment challenges. Chief among them is the thickening of the Canada-U.S. border since 2001. Because 75 per cent of Canada’s and nearly 80 per cent of Ontario’s exports end up in the U.S., continued efforts to streamline, harmonize and accelerate border processes remains a key priority. Furthermore, while Canada has made significant progress in expanding its international trade relationships, interprovincial trade barriers remain an obstacle to businesses at home. Low SME export activity, an unstable Canadian dollar and heightened global competition have also contributed to Canada’s declining share of global exports.
Recommendations
1. Facilitate the movement of goods and people across the Canada-U.S. border
Globally, Canada-U.S. trade represents one of the biggest bilateral trade relationships.83 Canada is the number one export market for 34 U.S. states and approximately one in seven Canadian jobs depend on trade with the U.S.84
82 Anderson, B. 2012. 83 U.S. Department of State. 2014. “U.S. Relations With Canada.” Accessed at http://www.state.gov/r/pa/ei/bgn/2089.htm84 The Embassy of the United States of America, Ottawa. “U.S. - Canada Economic Relations.” Accessed at http://photos.state.gov/libraries/canada/303578/pdfs/us-canada-economic-relations-factsheet.pdf; Canada’s Economic Action Plan. “Bilateral Relations: Canada-U.S. Trade and Investment.” Accessed at http://actionplan.gc.ca/en/page/bbg-tpf/bilateral-relations-canada-us-trade-and-investment
0
1%
2%
3%
4%
5%
2013
2012
2011
2010
2009
2008
2007
2006
2005
2004
2003
2002
2001
2000
1999
1998
1997
1996
1995

33 | a federal economic agenda for ontario
Figure 11: Top international and U.S. destinations for Ontario exports
10. Switzerland: 0.61%
9. Italy: 0.63%
8. Germany: 0.63%
7. Norway: 1.03%
6. Japan: 1.12%
5. Mexico: 1.15%
4. China: 1.16%3. Hong Kong: 1.84%
2. United Kingdom: 6.41%
1. United States: 79.26%
Top U.S. Destinations1. Michigan: 24.35%2. California: 12.24%3. New York: 5.83%4. Ohio: 4.28%5. Illinois: 3.25%
1
2
3
456
8
7
9
10
6. Pennsylvania: 3.16%7. Indiana: 3.03%8. Texas: 2.85%9. Massachusetts: 1.80% 10. New Jersey: 1.49%
Top International Destinations
Source: Government of Ontario, 2014.

mowat centre | may 2015 | 34
Box 5: The importance of a strong Canada-U.S. partnershipCanada’s relationship with the U.S. government is our country’s most important diplomatic asset. Common interests and values underlie the need for close Canada-U.S. cooperation. Removing remaining barriers to trade and investment will strengthen the North American economy. However, Ottawa’s bilateral relationship with Washington may be at one of its lowest points in recent history. The politics of trans-border pipelines should not be allowed to threaten the quality and resiliency of the broader relationship or to squeeze out the importance of other issues in Canada-U.S. diplomacy.
The joint Canada-U.S. Regulatory Cooperation Council and the Beyond the Border Action Plan, have achieved progress in reducing regulatory and administrative barriers to trade and travel between the U.S. and Canada.
Continuing to improve timeliness and predictability of border crossings remains a crucial goal. Today’s supply chains are built around ‘just-in-time’ shipment and production processes that require a high degree of predictability. When logistics planning becomes hampered by unpredictable shipment times, businesses will look at ways to eliminate the need for border crossings, such as relocating plants or selling more product in other jurisdictions. Both of these outcomes are bad for Ontario.
In 2011, the Council of the Federation outlined several recommendations to support Canada-U.S. border improvements.85 Among these, on-going investments in joint border processes and inspection facilities, pre-clearance and pre-inspection programs for goods, and greater employment of smart technology solutions to accelerate crossings are central to enhancing predictability and facilitating better business planning. The federal government should continue to move ahead on these recommendations and do all it can to avoid any more delays related to their implementation.
2. Address critical gaps in the Agreement on Internal Trade
The federal government has recently made progress on advancing its international trade agenda, an important factor in boosting export activity. However, many barriers to interprovincial trade still remain.
Domestic firms that engage in interprovincial trade tend to be more growth-oriented, innovative and more likely to export to international markets.86 Given these benefits, and despite the fact that responsibility for reducing trade barriers rests mainly with the provinces, addressing the obstacles to freer flow of goods and people across provincial lines is an important national priority.
In particular, the federal government should work with the provinces to address three key areas in need of reform. First is the Agreement on Internal Trade’s (AIT) dispute resolution mechanism which, despite significant advances in the past several years, still requires stricter enforcement and greater direct access to processes. The current dispute resolution mechanism is too slow and costly for most firms to engage in, and offers little in the way of consequence for failure to comply.
Second, while the Comprehensive Trade Agreement with Europe (CETA) may bring over 30,000 jobs to Ontario and a savings of $100 million in tariff reductions,87 concerns have been raised over European bidders having greater access to provincial procurement than domestic firms. More open and transparent procurement practices in the interprovincial trade context are needed to remedy this imbalance.
85 The Council of the Federation. 2011. Canada in the Global Economy. The Council of the Federation Secretariat Ottawa. Accessed at http://www.canadaspremiers.ca/phocadownload/publications/cof_canada_global_economy_eng_final.pdf86 TD Economics. 2014. Special Report: Boosting Interprovincial Trade Critical to Ensuring Sustained Growth for Small Businesses. Accessed at http://www.td.com/document/PDF/economics/special/SME_Report.pdf87 Task Force on Competitiveness, Productivity and Economic Progress. 2013. Course Correction: Charting a new roadmap for Ontario. Institute for Competitiveness and Prosperity. Accessed at http://www.competeprosper.ca/work/annual_reports/annual_report_course_correction

35 | a federal economic agenda for ontario
The federal government should work with the provinces to make it easier for Canadians to work in their professions in any region of the country.
Finally, the federal government should work with the provinces to make it easier for Canadians to work in their professions in any region of the country. Labour mobility under the AIT is hampered by a number of regulatory obstacles across many professions, especially those in healthcare. Eliminating these obstacles could increase movement by more than 60 per cent.88 In light of various labour and skill shortages across the country, increasing labour mobility should be a top federal priority.
3. Eliminate tariffs on imports with a low effective tax rate
Import taxes are commonly used to protect certain domestic industries or to generate significant government revenue. Tariffs that do not serve either purpose only create more red tape for imports while adding very little value to the economy.
In 2013 there were 230 such tariff commodity groups, generating only between $1 and $10,000 each. Combined these tariffs earned less than $1 million on $765 million worth of imports, for an effective tax rate of 0.13 per cent.
In addition, there are many areas in Canada’s overly complicated tariff code that impose significant regulatory burdens on business. The result is that businesses, especially SMEs, are less likely to take advantage of free trade deals because of the amount of paperwork and record-keeping associated with obtaining preferential rates.
The federal government should introduce a zero Most-Favoured-Nation rate (MFN rate) on tariff items with very low effective rates (e.g., less than 0.1 per cent). This could provide substantial benefit at minimal cost.
4. Establish a truly national securities regulator
Canada remains the only advanced economy in the world without a national securities regulator. A national securities regulator contributes to a stronger economy by pooling together expertise and establishing a single regulatory framework across jurisdictions, making it easier to raise funds and do business throughout the country. It builds a more globally competitive capital market and mitigates systemic risks. A truly national securities regulator would also increase the potential of introducing crowd-funding legislation to Canada, which could help entrepreneurs bring new products to market.
In recent years, the federal government has worked with the provinces to move toward a unified system, through the introduction of the voluntary Capital Markets Regulatory System (CCMRS). As of September 2014, five provinces — Ontario, British Columbia, New Brunswick, Prince Edward Island and Saskatchewan — and the federal government have signed a Memorandum of Agreement, setting out the terms and conditions of the CCMRS. To realize the full benefits of a national securities regulator however, the federal government must continue to engage with remaining provinces and territories to attain full participation across Canada in the near-term.
5. Make the Investment Canada Act ‘net benefit’ test more transparent
Through the Investment Canada Act, the Canadian federal government has unique authority among
88 Amirault et al. 2013

mowat centre | may 2015 | 36
industrialized countries to assess, and possibly restrict, significant foreign investment based on estimated ‘net benefit’ to Canada. While other countries screen foreign investment based on national security criteria or to protect sensitive sectors, none has an “across-the-board mechanism” that evaluates investments based on their ability to deliver benefits to the domestic economy.89
The net benefit test considers a set of six key criteria,90 but the language describing the criteria and the processes used to arrive at the final decision remain opaque. While only a few applications have been rejected for failing the net benefit test, the non-transparent nature of the process leaves the door open to political manoeuvring under the guise of national benefits.
To ease public and investor concerns, the federal government should offer more transparency and a clearer explanation about its net benefit assessment process.
5. Relax visa requirements for visitors from low-risk countries
Since 2010, visitor visas from key emerging markets have steadily increased, while business visas from these same places — Mexico, Brazil and China — have declined by 6 per cent, pointing to business’ sensitivity to red tape.91 Effective border security is essential for public safety, but overly restrictive policies — those that are disproportionate to the actual level of risk — can have detrimental effects on the economy. One U.K. study estimates that countries with bilateral visa requirements, like those between Canada and Mexico and Canada and Brazil, can reduce bilateral foreign direct investment (FDI) by as much as a quarter.92
Cumbersome visa processes for business travellers are a real barrier to trade and investment. Visa processing can take too long and act as deterrent for business-oriented travellers who require use of their passports. The federal government should reduce wait times for business visas or allow their application without the retention of passports.93
In the longer term, visa requirements for business visitors from low-risk countries including Mexico and Brazil should be removed altogether. The federal government should also deploy the Electronic Travel Authorization program — a recently launched online screening tool — as a proxy for countries whose nationals pose a lower risk to the physical and economic health of Canadians.
89 Dawson, L. 2012. Potash and Blackberries: Should Canada Treat All Foreign Direct Investment the Same? Macdonald-Laurier Institute. Accessed at http://www.macdonaldlaurier.ca/files/pdf/Should-Canada-Treat-All-FDI-The-Same-Commentary-June-2012.pdf90 Frigon, M. 2011. “Foreign Investment in Canada: The Net Benefit Test.” Current and Emerging Issues, 41st Parliament, Library of Parliament. Accesssed at http://www.parl.gc.ca/content/lop/researchpublications/cei-22-e.htm91 Tourism Industry Association of Canada. 2014. Gateway to Growth: Visitor Visa Progress Report. Accessed at http://tiac.travel/_Library/TIAC_Publications/TIAC_Visitor_Visa_Progress_Report_FINAL.pdf92 Neumayer E. 2011. On the detrimental impact of visa restrictions on bilateral trade and foreign direct investment. Journal of Applied Geography (31).93 Bitran, M. and Tan, S. 2013. Diaspora Nation: An inquiry into the economic importance of diaspora networks in Canada. Mowat Centre.

37 | a federal economic agenda for ontario
6 Responding to regional and cluster opportunities through targeted strategies
Key Facts » Most regions in the province have been experiencing net negative migration since the early
2000s.94
» More than 300,000 manufacturing jobs disappeared between 2001 and 2012 — Ontario’s mid-sized cities with traditional manufacturing bases have been hit the hardest.
» Ring of Fire development in Northern Ontario has an estimated $25 billion economic value over 32 years.95
What we heard from Ontario Stakeholders » Encourage investment and job creation across Ontario through more targeted policies and funding
decisions that reflect regional assets and challenges.
» Evaluate key federal instruments for regional growth — FedNor and FedDev — to ensure programs are reaching more communities and desired objectives are being achieved.
» Target more business supports to high-growth businesses, which support cluster formation, greater innovation and job creation.
94 Ontario Ministry of Finance. Ontario Population Projections 2013-2041. Accessed at http://www.fin.gov.on.ca/en/economy/demographics/projections/#s4h95 Hjartarson, J., McGuinty L., Boutilier, S., and Majernikova, E. 2014. Beneath the Surface: Uncovering the Economic Potential of Ontario’s Ring of Fire. Ontario Chamber of Commerce. Accessed at http://www.occ.ca/Publications/Beneath_the_Surface_web.pdf

mowat centre | may 2015 | 38
Issue backgroundAs a whole, Ontario’s highly diverse economy has served the province and the country well, protecting against the harshest effects of downturns and the global economic restructuring of the past decade. At the community level however, parts of the province have struggled to hold on to jobs more than others. In many smaller cities and regions, economic growth has stagnated or declined over the past ten years.
Ontario’s mid-sized cities, traditionally reliant on manufacturing for employment and growth, have been hit particularly hard by recent trends to offshore manufacturing. Much of Southern Ontario — Canada’s, manufacturing heartland — has witnessed staggering job losses, totalling over 300,000 between 2001 and 2012. Rural and remote communities have also struggled to adapt to a rapidly shifting world where traditional advantages and strengths, especially those in the natural resource sector, have been eroding for years.
Importantly, a focus on supporting high-growth firms, which have been shown to contribute significantly to cluster formation and exceedingly to job growth, should be applied to appropriate business support programs.
In response to these challenges, the federal government launched FedDev in 2010 with the goal of reinvigorating economic growth in Southern Ontario through targeted programs and local partnerships. Complement to FedDev, FedNor has been in operation for close to 30 years and serves the same purpose in northern communities. While both agencies are perceived as successful models of regional economic development, calls have been made for more relevant measures of their performance. Identifying the programs under FedDev and FedNor that have the best results is necessary not only to efficiently use federal funds, but also to fully realize the potential of Ontario’s diverse communities.
Alongside regional strategies, targeted approaches that focus on industry and cluster development are also needed to fuel prosperity, innovation and job creation in every corner of the province. Importantly, a focus on supporting high-growth firms, which have been shown to contribute significantly to cluster formation and exceedingly to job growth, should be applied to appropriate business support programs.96 High-growth firms act as economic catalysts across regions and sectors — they are not concentrated in cities or in high-knowledge industries, as is often assumed.97
Recommendations
1. Strengthen evaluation of FedNor and FedDev programs and build on successes
Communities across the province have achieved positive economic impact through the FedNor and FedDev initiatives. FedNor, which has been in place since 1987, has a strong record of success and has received favourable assessment in terms of “relevance of supports, targeted delivery of program support to local actors, and cost-effective leveraging of investments.”98 FedDev was introduced in 2010 and has been subject to limited review.
Both FedNor and FedDev stand to benefit from robust evaluation processes. In each case, calls for more appropriate performance indicators to measure both program outcomes and impact have been made.99
Critical indicators include measurements of economic expansion resulting from more effective integration of local resources, such as applied research conducted by post-secondary institutions, to help SMEs compete more successfully in the marketplace.
96 Mohr, V. and Garnsey, E. 2010. Exploring the Constituents of Growth in a Technology Cluster: Evidence from Cambridge, UK. Centre for Technol-ogy Management, Institute for Manufacturing. No: 2010/1197 Industry Canada. 2008. Profile of Growth Firms: A Summary of Industry Canada Research. Accessed at https://www.ic.gc.ca/eic/site/061.nsf/vwapj/ProfileGrowthFirms_Eng.pdf/$file/ProfileGrowthFirms_Eng.pdf98 Bradford, N. 2010. Regional Economic Development Agencies in Canada: Lessons for Southern Ontario. Mowat Centre. 99 Evaluation Group Federal Economic Development Agency for Southern Ontario. 2012. Interim Evaluation of FedDev Ontario Programs. Accessed at http://www.feddevontario.gc.ca/eic/site/723.nsf/eng/01774.html?Open&pv=1; Bradford, N. 2010.

39 | a federal economic agenda for ontario
In FedNor’s case, there is a need for more rigorous assessment of longer-term impacts, as well as increased capacity for local program officers to evaluate and report on program outcomes. Given FedNor’s longevity, a comprehensive evaluation of its organizational structure and mandate should also be conducted, with the goal of improving FedNor’s overall responsiveness to local economic development initiatives.100
In addition, improved evaluation and tracking of impact can help identify and expand on more successful programs like Community Futures. Community Futures supports growth in rural areas through a collaborative, place-based approach with local communities. It delivers access to business counselling, capacity building and funding, and promotes learning across different regions. Evaluation of the program has also demonstrated strong returns and effectiveness, owing in large part to its local decision-making approach.101 In partnership with provincial and local partners, the federal government should ensure the Community Futures Program is accessible to more communities across the province.
Box 6: Community Futures Program (CFP) — Return on Investment
“The CFP generates a strong return on investment. Based on Business Number analysis using Statistics Canada data, for every dollar contributed, the CFP in Southern Ontario generated $43.76 in business revenues and $10.97 in wages.”102
2. Develop a strategy for mid-sized cities
The economic transformation that Ontario has experienced over the past 30 years has been particularly challenging for Ontario’s mid-sized cities, which are home to a substantial share of the provincial population and economy. Their heavy reliance on manufacturing has made them more vulnerable to the sector’s decline than other parts of the province. These manufacturing jobs also represented higher wage premiums in smaller cities, making their loss more significant for the community.103
The competitive advantages of mid-sized urban centres in Ontario and the challenges they face are different than those of our largest cities and rural areas. Some of these urban centres (Kitchener-Cambridge-Waterloo, Guelph) have had some success in repositioning toward the new global economic context while others have struggled following an extended period of stagnation.
Ontario has yet to sufficiently capitalize on the unique competitive advantages of Ontario’s mid-sized cities. These include skilled labour, a strong reputation for product quality, a stable regulatory environment, proximity to high-quality agricultural land, a reasonable cost for land, and cost of living and doing business.
An under-appreciation of the competitive advantages of Ontario’s mid-sized cities has meant a lack of strategic direction and clarity. This has resulted in a lack of focus and alignment between governments at all levels on infrastructure investments, economic development strategies, municipal planning, post-secondary education policies and other policy areas.
The federal government, through FedDev, should work with the province and partners in the private, NFP and academic sectors to develop a strategy for Ontario’s mid-sized cities that, in the first instance, assesses opportunities to leverage existing funding and investments in a coordinated manner to drive economic growth objectives.
100 Conteh, C. 2015. Toward More Strategic and Collaborative Governance of Regional Economic Development in Northern Ontario: Lessons from other regions of Canada. Northern Policy Institute. Forthcoming. 101 Ference Weicker & Company Ltd. 2014. Evaluation of the Community Futures Program. Report prepared for the Federal Economic Develop-ment Agency for Southern Ontario. Accessed at http://www.feddevontario.gc.ca/eic/site/723.nsf/eng/02074.html#fnb50102 Ibid.103 In small towns and rural areas, wages and salaries in manufacturing are on average 25.3% higher than in non-manufacturing, compared with a difference of 11.2% in very large CMAs. See http://www.statcan.gc.ca/pub/75-001-x/2009102/article/10788-eng.htm

mowat centre | may 2015 | 40
3. Take a greater leadership role in the Ring of Fire development
The Ring of Fire (RoF), a mineral-resource rich area located in the Saint James Lowlands region of Northern Ontario, has a potential to generate over $25 billion in economic activity in just over 30 years. Within the first 10 years, the development could sustain roughly 5,500 jobs and generate almost $2 billion in government revenue.104
Progress so far on transforming this vast potential into reality has been extremely limited. The most immediate issue is the lack of critical infrastructure to support extraction and other business activity in the area.
In the short-term, the federal government should commit the necessary resources to partner with First Nations communities, other affected actors, the province and private sector to develop a realistic plan and commit, as the province has, to make at least $1 billion available for RoF development.
The government of Ontario recently announced its plans to invest $1 billion in RoF infrastructure. The federal and provincial governments have also recently committed joint funding for a community-led study on the infrastructure corridor to the first four RoF affected Aboriginal communities. This is an important step for development in the region and for federal-provincial relations on the RoF development.
In the short-term, the federal government should commit the necessary resources to partner with First Nations communities, other affected actors, the province and private sector to develop a realistic plan and commit, as the province has, to make at least $1 billion available for RoF development. The plan should be clear and actionable, with explicit priorities and detailed timelines.
4. Adopt a high-growth ‘lens’ for business program supports to promote cluster formation, job creation and innovation
Ontario’s high-performing clusters, including ICT, creative industries, financial services advanced manufacturing, agri-food, life sciences and others, are among the key drivers of prosperity in the province and in the country. Clusters are geographic concentrations of related firms, institutions and other organizations, supported by a thick workforce. Clusters have been shown to increase productivity, stimulate innovation and commercialization, and facilitate the creation of new business.
High-growth firms contribute considerably to cluster formation. The OECD defines high-growth firms as firms having an average annualized growth rate higher than 20 per cent per year, over a three-year period, and with ten or more employees at the beginning of the period. Using these metrics, between 2001 and 2004, “employment for the average high-growth firm grew 87.8 per cent compared with 0.1 per cent growth for the average non-high-growth firm” in Canada.105 High-growth firms are also likely to be R&D intensive.106 In Canada, nearly double the amount of high-growth firms were R&D intensive compared with non-high-growth firms between 2001-2004.107
104 Hjartarson, J., McGuinty L., Boutilier, S., and Majernikova, E. 2014. Beneath the Surface: Uncovering the Economic Potential of Ontario’s Ring of Fire. Ontario Chamber of Commerce. Accessed at http://www.occ.ca/Publications/Beneath_the_Surface_web.pdf105 SME Research and Statistics. 2012. Key Small Business Statistics. Industry Canada. Accessed at http://www.ic.gc.ca/eic/site/061.nsf/eng/02718.html#fnb4106 A firm is considered R&D intensive when more than 20% of its investment budget is spent on R&D.107 SME Research and Statistics. 2012. Key Small Business Statistics. Industry Canada. Accessed at http://www.ic.gc.ca/eic/site/061.nsf/eng/02718.html#fnb4

41 | a federal economic agenda for ontario
High-growth firms in Canada – which come in all sizes — contributed between 50 and 60 per cent of net new jobs in Ontario, Quebec and the Prairies between 1993 and 2002, and even more in the rest of the country.108 High-growth firms are present across all industry sectors, not only in high-technology industries (a common misconception). For example, more high-growth firms appear in service industries, relative to sectors such as manufacturing.109
The federal government should review its business support programs and broader economic development initiatives to identify where opportunities exist to target supports to high-growth businesses.
108 Profile of Growth Firms: A Summary of Industry Canada Research. 2008. 109 Coad, A., Daunfeldt, S.-O., Holzl, W., Johansson, D., and Nightingale, P. 2014. High-growth firms: introduction to the special section. Industrial and Corporate Change. vol. 31 (1). Accessed at http://icc.oxfordjournals.org/content/23/1/91.full#sec-15

mowat centre | may 2015 | 42
ConclusionThroughout our discussions with Ontario stakeholders over the past months, we have heard many different perspectives on the economic issues facing Ontario. Though potential solutions sometimes differed, our stakeholders uniformly urged the provincial and federal governments to work more closely together as Canada faces the challenges and opportunities of the 21st century.
Ontario’s ability to seize opportunities in today’s constantly evolving, global economy relies on the collaborative efforts of many players, including governments, businesses, and Ontarians themselves. As this Federal Economic Agenda for Ontario illustrates, an engaged federal government is a vital partner in this effort. The federal government owns many important policy tools that profoundly affect Ontario’s ability to prosper — it must work with the province to make sure both Ontario and Canada can lead in the years to come.
As the country gears up for the 2015 federal election, we encourage all Ontarians to engage with this stakeholder-driven and evidence-based agenda to raise important issues with the federal parties. We also strongly urge all federal parties to clearly articulate how they will work with the Ontario government, stakeholders and specific communities and sectors to ensure that the province has a strong economic future in the coming decade.
43 | a federal economic agenda for ontario
works CitedAdvisory Panel on Labour Market Information. 2009. Working Together to Build a Better Labour Market Information System for Canada. Accessed at http://publications.gc.ca/collections/collection_2011/rhdcc-hrsdc/HS18-24-2009-eng.pdf
Albion, N. and Cohl, K. 2012. Shaping the Future: Canada’s rapidly changing immigration policies. Maytree. Accessed at http://maytree.com/wp-content/uploads/2012/10/shaping-the-future.pdf
Amirault, D., de Munnik, D., and Miller, S. 2013. Explaining Canada’s Regional Migration Patterns. Bank of Canada Review. Accessed at http://www.bankofcanada.ca/wp-content/uploads/2013/05/boc-review-spring13-amirault.pdf
Anderson, B. 2012. The Border and the Ontario Economy. Cross-Border Transportation Centre, University of Windsor. Accessed at http://www1.uwindsor.ca/crossborder/system/files/The_Border_Report2012%281%29.pdf
Antunes, P. and Palladini, J. 2013. The Economic Impact of Ontario’s Infrastructure Investment Program. Conference Board of Canada. Accessed at http://www.conferenceboard.ca/temp/f816e428-0b2d-419c-b9fe-cece0e6083bc/13-246_ecoimpactontinfrast_br.pdf
Bennett, P.W. and Anuik, J. 2014. Picking up the Pieces: A Community-School-Based Approach to First Nations Education Renewal. Northern Policy Institute. Accessed at https://northernpolicy.files.wordpress.com/2014/10/npi_pickinguppieces_sept2014_en1.pdf
Bitran, M. and Tan, S. 2013. Diaspora Nation: An inquiry into the economic importance of diaspora networks in Canada. Mowat Centre.
Bradford, N. 2010. Regional Economic Development Agencies in Canada: Lessons for Southern Ontario. Mowat Centre.
Brouillette, D. 2011. Estimating the Incremental Impacts of a Provincial R&D Tax Credit on Business R&D Expenditures Using a Natural Experiment in British Columbia. Industry Canada. Accessed at https://www.ic.gc.ca/eic/site/eas-aes.nsf/eng/ra02227.html?Open&pv=1
Canada Chamber of Commerce. 2012. Submission to the Department of Finance Canada on the August 14, 2012 Legislative Proposals Relating to the Income Tax Act and Regulations.
Canada’s Economic Action Plan. “Bilateral Relation: Canada-US Trade and Investment.” Government of Canada. Accessed at http://actionplan.gc.ca/en/page/bbg-tpf/bilateral-relations-canada-us-trade-and-investment
Canada’s Economic Action Plan. “Detroit River International Crossing.” Government of Canada. Accessed at http://actionplan.gc.ca/en/initiative/detroit-river-international-crossing
Canadian Construction Association Pre-Budget Submission. 2015. Accessed at http://www.cca-acc.com/pdfs/en/budget/2015prebudget.pdf
Canadian Housing Observer, Households in Core Housing Need, 1991-2011. CMHC. Accessed at http://www.cmhc.ca/en/corp/about/cahoob/data/data_013.cfm
Chiose, S. 2015. “Canadian universities urge Ottawa to relax foreign worker porgram rules.” The Globe and Mail. Accessed at http://www.theglobeandmail.com/news/politics/canadian-universities-urge-ottawa-to-relax-foreign-worker-program-rules/article22826162/

mowat centre | may 2015 | 44
CIRA Factbook. 2014. Canadian Internet Registration Authority. Accessed at http://cira.ca/factbook/2014/the-canadian-internet.html
Citizenship and Immigration Canada. 2013. Facts and Figures 2013 — Immigration overview: Permanent Residents. Accessed at http://www.cic.gc.ca/english/resources/statistics/facts2013/permanent/11.asp
Coad, A., Daunfeldt, S.-O., Holzl, W., Johansson, D., and Nightingale, P. 2014. High-growth firms: introduction to the special section. Industrial and Corporate Change. vol. 31 (1). Accessed at http://icc.oxfordjournals.org/content/23/1/91.full#sec-15
Conference Board of Canada. 2013. Report Card — Business Enterprise R&D Spending. Accessed at http://www.conferenceboard.ca/hcp/details/innovation/berd.aspx
Conteh, C. 2015. Toward More Strategic and Collaborative Governance of Regional Economic Development in Northern Ontario: Lessons from other regions of Canada. Northern Policy Institute. Forthcoming.
Dawson, L. 2012. Potash and Blackberries: Should Canada Treat All Foreign Direct Investment the Same? Macdonald-Laurier Institute. Accessed at http://www.macdonaldlaurier.ca/files/pdf/Should-Canada-Treat-All-FDI-The-Same-Commentary-June-2012.pdf
de Munnik, D., Jacob, J., and Sze, W. 2012. The Evolution of Canada’s Global Export Market Share. Bank of Canada. Accessed at http://www.bankofcanada.ca/wp-content/uploads/2012/10/wp2012-31.pdf
Department of Finance Canada. 2013. Update of Economic and Fiscal Projections. Accessed at http://www.fin.gc.ca/efp-pef/2013/index-eng.asp
Ekos Politics. 2013. So What’s Really Bothering you Canada? Accessed at http://www.ekospolitics.com/wp-content/uploads/full_report_october_17_2013.pdf
Employment and Social Development Canada. 2013. Summative Evaluation of the Aboriginal Skill and Employment Partnership Program. Accessed at http://www.esdc.gc.ca/eng/publications/evaluations/skills_and_employment/2013/october.shtml
Employment Insurance Task Force. 2012. Making it Work: Final Recommendations of the Mowat Centre Employment Insurance Task Force. Mowat Centre.
European Commission. 2013. Press Release. Accessed at http://europa.eu/rapid/press-release_IP-13-968_en.htm
Evaluation Group Federal Economic Development Agency for Southern Ontario. 2012. Interim Evaluation of FedDev Ontario Programs. Accessed at http://www.feddevontario.gc.ca/eic/site/723.nsf/eng/01774.html?Open&pv=1; Bradford, N. 2010.
Expert Panel on the Review of Federal Support to Research and Development. 2011. Innovation Canada: A Call to Action. Accessed at http://rd-review.ca/eic/site/033.nsf/vwapj/R-D_InnovationCanada_Final-eng.pdf/$FILE/R-D_InnovationCanada_Final-eng.pdf
Ference Weicker & Company Ltd. 2014. Evaluation of the Community Futures Program: Report prepared for the Federal Economic Development Agency for Southern Ontario. Accessed at http://www.feddevontario.gc.ca/eic/site/723.nsf/eng/02074.html#fnb50
Foreign Affairs, Trade and Development Canada. Canada European Union: Comprehensive Economic and Trade Agreement (CETA). Accessed at http://international.gc.ca/trade-agreements-accords-commerciaux/agr-acc/ceta-aecg/understanding-comprendre/overview-apercu.aspx?lang=eng

45 | a federal economic agenda for ontario
Friendship Bay Consulting. 2013. The Foundations of a Competitive Canada: The Need for Strategic Infrastructure Investment. The Canadian Chamber of Commerce. Accessed at http://www.chamber.ca/media/blog/131218-The-Foundations-of-a-Competitive-Canada/131218_The_Foundations_of_a_Competitive_Canada.pdf
Frigon, M. 2011. “Foreign Investment in Canada: The Net Benefit Test.” Current and Emerging Issues, 41st Parliament, Library of Parliament. Accessed at http://www.parl.gc.ca/content/lop/researchpublications/cei-22-e.htm
Geist, M. 2014. “Digital Canada 15: The Digital Strategy Without a Strategy.” Accessed at http://www.michaelgeist.ca/2014/04/digital-canada-150-2/
Globe Editorial. 2013. “Canada needs a proper census, and it’s not irresponsible to say so.” The Globe and Mail. Accessed at http://www.theglobeandmail.com/globe-debate/editorials/canada-needs-a-proper-census-and-its-not-irresponsible-to-say-so/article12793625/
Government of Canada. 2014. Seizing Canada’s Moment: Moving Forward in Science, Technology and Innovation. Accessed at https://www.ic.gc.ca/eic/site/icgc.nsf/vwapj/Seizing_Moment_ST_I-Report-2014-eng.pdf/$file/Seizing_Moment_ST_I-Report-2014-eng.pdf
Government of Ontario. 2015. Building Ontario Up. Accessed at http://www.fin.gov.on.ca/en/budget/ontariobudgets/2015/papers_all.pdf
Ontario Auditor General. 2014. Annual Report.
Government of Ontario. Ontario Trade Facts. Accessed at http://www.sse.gov.on.ca/medt/ontarioexports/en/Pages/tradefactsheet_ontario.aspx
Hjartarson, J., McGuinty L., Boutilier, S., and Majernikova, E. 2014. Beneath the Surface: Uncovering the Economic Potential of Ontario’s Ring of Fire. Ontario Chamber of Commerce. Accessed at http://www.occ.ca/Publications/Beneath_the_Surface_web.pdf
Imagine Canada. “Key Facts about Canada’s Charities.” Accessed at http://www.imaginecanada.ca/resources-and-tools/research-and-facts/key-facts-about-canada%E2%80%99s-charities
Imagine Canada. 2010. Supporting innovation and resiliency in the charitable and non-profit sector: Pre-budget brief. Accessed at http://www.muttart.org/sites/default/files/report/2011_prebudget_submission_08172010.pdf
Industry Canada. 2008. Profile of Growth Firms: A Summary of Industry Canada Research. Accessed at https://www.ic.gc.ca/eic/site/061.nsf/vwapj/ProfileGrowthFirms_Eng.pdf/$file/ProfileGrowthFirms_Eng.pdf
Information Technology Association of Canada. “The Issue: The Importance of SR&ED to ICT R&D.” Accessed at http://itac.ca/uploads/research/the_issue_the_importance_of_sranded_to_ict_randd.pdf
Johal, S., Mendelsohn, M. and Zon, N. 2013. Let’s Talk: Coordinating Economic Development Spending in Canada. Mowat Centre.
Kelly, M.D. 2011. Toward a New Era of Policy: Health Care Service Delivery to First Nations. The International Indigenous Policy Journal, vol. 2 (1). Accessed at http://ir.lib.uwo.ca/cgi/viewcontent.cgi?article=1017&context=iipj
Law Commission of Ontario. 2012. Vulnerable Workers and Precarious Work. Final Report.
McIsaac, E. and Moody, C. 2013. The Social Enterprise Opportunity for Ontario. Mowat NFP, Mowat Centre.

mowat centre | may 2015 | 46
Mendelsohn, M., Mulholland E., and Shamshiri, N. 2011. Strengthening the Third Pillar of the Union: An Intergovernmental Agenda for Canada’s Charities and Non-Profits. Mowat NFP, Mowat Centre.
Ministry of Economic Development, Employment and Infrastructure. 2013. “News Release: Ontario to Support European Trade Deal.” Accessed at http://news.ontario.ca/medt/en/2013/10/ontario-to-support-european-trade-deal.html
Mohr, V. and Garnsey, E. 2010. Exploring the Constituents of Growth in a Technology Cluster: Evidence from Cambridge, UK. Centre for Technology Management, Institute for Manufacturing. No: 2010/11
Neumayer E. 2011. On the detrimental impact of visa restrictions on bilateral trade and foreign direct investment. Journal of Applied Geography (31)
OECD. 2010. Public Procurement Programmes for Small Firms — SBIR-type Programmes. Accessed at http://www.oecd.org/innovation/policyplatform/48136807.pdf
Ontario Federation of Indigenous Friendship Centres. 2013. Aboriginal Labour Force and Training Strategic Framework: Identifying our Potential. Accessed at http://ofifc.org/sites/default/files/docs/2013-04-17%20Labour%20Force%20and%20Training%20Strategy%20-%20FINAL.pdf
Ontario Ministry of Citizenship and Immigration. 2012. Expanding our Routes to Success: The Final Report by Ontario’s Expert Roundtable on Immigration.
Ontario Ministry of Finance. 2013. Ontario Population Projections 2013 - 2041. Government of Ontario. Accessed at http://www.fin.gov.on.ca/en/economy/demographics/projections/#s4h
Ontario Ministry of Finance. 2014. Ontario Fall Economic Statement. Accessed at http://www.fin.gov.on.ca/en/budget/fallstatement/2014/paper_all.pdf
Ontario Ministry of Finance. 2014. Ontario’s Long Term Report on the Economy. Government of Ontario Accessed at http://www.fin.gov.on.ca/en/economy/ltr/
Ontario Ministry of Infrastructure. 2013. “News Release: Strengthening Long-term Infrastructure Planning.” Accessed at http://news.ontario.ca/moi/en/2013/11/strengthening-long-term-infrastructure-planning.html
Ontario Ministry of Training, Colleges and Universities. 2015. Ontario Labour Market Statistics for February 2015. Accessed at http://www.tcu.gov.on.ca/eng/labourmarket/currenttrends/docs/monthly/201502.pdf
Oschinski, M., Chan, K. with Kobrinsky, L. 2014. Ontario Made: Rethinking Manufacturing in the 21st Century. Mowat Centre.
Roy, Francine. 2008. From Roads to Rinks: Government Spending on Infrastructure in Canada, 1961 to 2005. Statistics Canada. Accessed at http://publications.gc.ca/collections/collection_2008/statcan/11-624-M/11-624-MIE2008019.pdf
SME Research and Statistics. 2012. Key Small Business Statistics. Industry Canada. Accessed at http://www.ic.gc.ca/eic/site/061.nsf/eng/02718.html#fnb4
Smetanin, P., Stiff, D., and Kobak, P. 2014. Ontario Infrastructure Investment: Federal and Provincial Risks and Rewards. The Canadian Centre for Economic Analysis.
Statistics Canada. 2011. Aboriginal People in Canada: First Nations People, Métis and Inuit. Accessed at http://www12.statcan.gc.ca/nhs-enm/2011/as-sa/99-011-x/99-011-x2011001-eng.cfm

47 | a federal economic agenda for ontario
Statistics Canada. 2011. The educational attainment of Aboriginal people in Canada. Accessed at http://www12.statcan.gc.ca/nhs-enm/2011/as-sa/99-012-x/99-012-x2011003_3-eng.cfm
Task Force on Competitiveness, Productivity and Economic Progress. 2013. Course Correction: Charting a new roadmap for Ontario. Institute for Competitiveness and Prosperity. Accessed at http://www.competeprosper.ca/work/annual_reports/annual_report_course_correction
TD Economics. 2003. Affordable Housing in Canada: In Search of a new Paradigm. Accessed at http://www.urbancentre.utoronto.ca/pdfs/curp/TDAffd.pdf
TD Economics. 2014. Special Report: Boosting Interprovincial Trade Critical to Ensuring Sustained Growth for Small Businesses. Accessed at http://www.td.com/document/PDF/economics/special/SME_Report.pdf
The Council of the Federation. 2011. Canada in the Global Economy. The Council of the Federation Secretariat Ottawa. Accessed at http://www.canadaspremiers.ca/phocadownload/publications/cof_canada_global_economy_eng_final.pdf
The Embassy of the United States of America, Ottawa. “U.S. - Canada Economic Relations.” Accessed at http://photos.state.gov/libraries/canada/303578/pdfs/us-canada-economic-relations-factsheet.pdf; Canada’s Economic Action Plan. “Bilateral Relations: Canada-U.S. Trade and Investment.” Accessed at http://actionplan.gc.ca/en/page/bbg-tpf/bilateral-relations-canada-us-trade-and-investment
The White House. “Fact Sheet: White House Launches Startup America Initiative.” Accessed at https://www.whitehouse.gov/startup-america-fact-sheet
Toronto Region Board of Trade. 2011. Reaching Top Speed. Accessed at http://www.metrolinx.com/en/aboutus/publications/5123-GT-Metrolinx-AR-EN.pdf
Tourism Industry Association of Canada. 2014. Gateway to Growth: Visitor Visa Progress Report. Accessed at http://tiac.travel/_Library/TIAC_Publications/TIAC_Visitor_Visa_Progress_Report_FINAL.pdf
U.S. Department of State. 2014. “U.S. Relations With Canada.” Accessed at http://www.state.gov/r/pa/ei/bgn/2089.htm
Vander Ploeg, C.G., and Holder, M. 2013. At the Intersection: The Case for Sustained and Strategic Public Infrastructure Investment. Canada West Foundation. Accessed at http://cwf.ca/pdf-docs/publications/AtTheIntersection_Feb2013.pdf
Wendy Zatylny (President, Association of Canadian Port Authorities) testimony at the Federal Finance Committee, November 18, 24. Accessed at http://openparliament.ca/committees/finance/41-2/58/wendy-zatylny-1/only/
Zon, N. 2014. Slicing the Pie: Principles for Allocating Transfer Payments in the Canadian Federation. Mowat Centre.
Zon, N., Oschinski, M., and Molson, M. 2014. Building Blocks: The Case for Federal Investment in Social and Affordable Housing in Ontario. Mowat Centre.

A federAl economic AgendA for ontArio
mowat reSearch #108 | ©2015 iSBn 978-1-77259-001-2
may 2015 | mowatcentre.ca


