
A fast analysis method to quantify nanoparticle uptake on ... · A fast analysis method to quantify...
14
ISSN 1743-5889 doi:10.2217/NNM.12.178 © 2013 Future Medicine Ltd Nanomedicine (Epub ahead of print) RESEARCH ARTICLE RESEARCH ARTICLE part of A fast analysis method to quantify nanoparticle uptake on a single cell level The safety of nanomaterials has caused contro- versial discussions and has evoked a large vari- ety of studies looking into the bioactivity of nanoparticles; that is, particles with diameters between 1 and 100 nm [1,2,101] . Nevertheless, there is evidence that the biological effects of particles are not restricted to this size range and micro-particles of 300 or even 500 nm could just as well affect human health [2] . Specificially owing to their size, such materials often display unique physical and chemical properties creating new possibilities for technological applications. Nano- and micro-particles have been synthesized for many purposes, ranging from relatively sim- ple particles in food and cosmetics to extremely complex particles designed for medical treatment [3–8] . Concomitantly, human exposure to small particles is growing, motivating a vast variety of studies addressing nanoparticle–cell interactions [2] . In this work we focus on a new method to quantify the uptake of nano- and micro-particles by cells via fluorescence confocal microscopy with subsequent digital image analysis. Traditional techniques include mass spectroscopy and flow cytometry, as well as electron and light micros- copy-based uptake studies on the single-cell level [9–16] . Mass spectroscopy, particularly inductively coupled plasma mass spectroscopy, has been used to quantify the nanoparticle uptake by cells with very high sensitivity and in a wide detection range. Nevertheless, inductively coupled plasma mass spectroscopy is sample destructive and therefore spatial information is lost. Flow cytometry typi- cally provides good statistics as a large number of cells can be evaluated very quickly. However, it does not yield direct information about the localization of nanoparticles with respect to the cell. Moreover, results are not normally expressed in absolute number of particles but rather in arbitrary units. As an imaging method, electron microscopy on fixed cells overcomes this limita- tion with its superior spatial resolution. However, it brings along its own set of downsides, such as elaborate sample treatment and relatively low throughput. Light microscopy on the other hand can be performed on live cells yielding plenty of data in a relatively short time. However, optical resolution is limited by diffraction in standard microscopes, such as wide-field and confocal laser scanning instruments. Ranging in diameter from 1 to 100 nm, nanoparticles unfortunately fall within this limit and thus cannot be optically resolved, disabling direct absolute quantification of nanoparticles. Difficulties to count nanopar- ticles are increased by the fact that they tend to agglomerate in biological medium [17] . While small agglomerates can be counted as single nanoparticles, large agglomerates have a complex structure in which the number of nanoparticles can hardly be estimated. Aim: This study examines the absolute quantification of particle uptake into cells. Methods: We developed a novel method to analyze stacks of confocal fluorescence images of single cells interacting with nano- and micro-particles. Particle_in_Cell-3D is a freely available ImageJ macro. During the image analysis routine, single cells are reconstructed in 3D and split into two volumes – intracellular and the membrane region. Next, particles are localized and color-coded accordingly. The mean intensity of single particles, measured in calibration experiments, is used to determine the absolute number of particles. Results: Particle_in_Cell-3D was successfully applied to measure the uptake of 80-nm mesoporous silica nanoparticles into HeLa cells. Furthermore, it was used to quantify the absolute number of 100-nm polystyrene nanoparticles forming agglomerates of up to five particles; the accuracy of these results was confirmed by super-resolution, stimulated emission depletion microscopy. Conclusion: Particle_in_Cell-3D is a fast and accurate method that allows the quantification of particle uptake into cells. Original submitted 10 May 2011; Revised submitted 15 October 2012 KEYWORDS: cellular uptake n fluorescence microscopy n ImageJ n nanomedicine n nanoparticle n nanotoxicology n STED n super-resolution microscopy Adriano A Torrano ‡1 , Julia Blechinger ‡1 , Chrisan Osseforth 1 , Chrisan Argyo 1 , Armin Reller 2 , Thomas Bein 1 , Jens Michaelis 1,3 & Christoph Bräuchle* 1 1 Ludwig-Maximilians-University Munich, Department of Chemistry & Center for NanoScience, Butenandtstrasse 11, Gerhard-Ertl- Gebäude, 81377 Munich, Germany 2 University of Augsburg, Instute for Physics, Universitätsstrasse 1a, 86159 Augsburg, Germany 3 Ulm University, Faculty of Natural Sciences, Instute of Biophysics Albert-Einstein Allee 11, 89081 Ulm, Germany *Author for correspondence: Tel.: +49 89 2180 77547 Christoph.Braeuchle@ cup.uni-muenchen.de ‡ Authors contributed equally For reprint orders, please contact: [email protected]
Transcript of A fast analysis method to quantify nanoparticle uptake on ... · A fast analysis method to quantify...

ISSN 1743-5889doi:10.2217/NNM.12.178 © 2013 Future Medicine Ltd Nanomedicine (Epub ahead of print)
ReseaRch aRticleReseaRch aRticle
part of
A fast analysis method to quantify nanoparticle uptake on a single cell level
The safety of nanomaterials has caused controversial discussions and has evoked a large variety of studies looking into the bioactivity of nanoparticles; that is, particles with diameters between 1 and 100 nm [1,2,101]. Nevertheless, there is evidence that the biological effects of particles are not restricted to this size range and micro particles of 300 or even 500 nm could just as well affect human health [2]. Specificially owing to their size, such materials often display unique physical and chemical properties creating new possibilities for technological applications. Nano and microparticles have been synthesized for many purposes, ranging from relatively simple particles in food and cosmetics to extremely complex particles designed for medical treatment [3–8]. Concomitantly, human exposure to small particles is growing, motivating a vast variety of studies addressing nanoparticle–cell interactions [2]. In this work we focus on a new method to quantify the uptake of nano and microparticles by cells via fluorescence confocal microscopy with subsequent digital image analysis. Traditional techniques include mass spectroscopy and flow cytometry, as well as electron and light microscopybased uptake studies on the singlecell level [9–16]. Mass spectroscopy, particularly inductively coupled plasma mass spectroscopy, has been used to quantify the nanoparticle uptake by cells with very high sensitivity and in a wide detection range.
Nevertheless, inductively coupled plasma mass spectroscopy is sample destructive and therefore spatial information is lost. Flow cytometry typically provides good statistics as a large number of cells can be evaluated very quickly. However, it does not yield direct information about the localization of nanoparticles with respect to the cell. More over, results are not normally expressed in absolute number of particles but rather in arbitrary units. As an imaging method, electron microscopy on fixed cells overcomes this limitation with its superior spatial resolution. However, it brings along its own set of downsides, such as elaborate sample treatment and relatively low throughput. Light microscopy on the other hand can be performed on live cells yielding plenty of data in a relatively short time. However, optical resolution is limited by diffraction in standard microscopes, such as widefield and confocal laser scanning instruments. Ranging in diameter from 1 to 100 nm, nanoparticles unfortunately fall within this limit and thus cannot be optically resolved, disabling direct absolute quantification of nanoparticles. Difficulties to count nanoparticles are increased by the fact that they tend to agglomerate in biological medium [17]. While small agglomerates can be counted as single nanoparticles, large agglomerates have a complex structure in which the number of nanoparticles can hardly be estimated.
Aim: This study examines the absolute quantification of particle uptake into cells. Methods: We developed a novel method to analyze stacks of confocal fluorescence images of single cells interacting with nano- and micro-particles. Particle_in_Cell-3D is a freely available ImageJ macro. During the image analysis routine, single cells are reconstructed in 3D and split into two volumes – intracellular and the membrane region. Next, particles are localized and color-coded accordingly. The mean intensity of single particles, measured in calibration experiments, is used to determine the absolute number of particles. Results: Particle_in_Cell-3D was successfully applied to measure the uptake of 80-nm mesoporous silica nanoparticles into HeLa cells. Furthermore, it was used to quantify the absolute number of 100-nm polystyrene nanoparticles forming agglomerates of up to five particles; the accuracy of these results was confirmed by super-resolution, stimulated emission depletion microscopy. Conclusion: Particle_in_Cell-3D is a fast and accurate method that allows the quantification of particle uptake into cells.
Original submitted 10 May 2011; Revised submitted 15 October 2012
KEYWORDS: cellular uptake n fluorescence microscopy n ImageJ n nanomedicine n nanoparticle n nanotoxicology n STED n super-resolution microscopy
Adriano A Torrano‡1, Julia Blechinger‡1, Christian Osseforth1, Christian Argyo1, Armin Reller2, Thomas Bein1, Jens Michaelis1,3 & Christoph Bräuchle*1
1Ludwig-Maximilians-University Munich, Department of Chemistry & Center for NanoScience, Butenandtstrasse 11, Gerhard-Ertl-Gebäude, 81377 Munich, Germany 2University of Augsburg, Institute for Physics, Universitätsstrasse 1a, 86159 Augsburg, Germany 3Ulm University, Faculty of Natural Sciences, Institute of Biophysics Albert-Einstein Allee 11, 89081 Ulm, Germany *Author for correspondence: Tel.: +49 89 2180 77547 Christoph.Braeuchle@ cup.uni-muenchen.de ‡Authors contributed equally
For reprint orders, please contact: [email protected]

Nanomedicine (Epub ahead of print)doi:10.2217/NNM.12.178 future science group
ReseaRch aRticle Torrano, Blechinger, Osseforth et al.
In this article we report on a newly developed digital image analysis method to circumvent the aforementioned constraints while still being based on standard light microscopy, the Particle_in_Cell3D ImageJ macro. It is intended to enable absolute quantification of particles in a confocal image stack by inferring particle numbers from fluorescence intensity calibration measurements. Additionally, the macro allows semiquantitative uptake studies if no calibration data are available. Furthermore, a purely qualitative analysis method is provided to semiautomatically classify particles as being membrane associated or intracellular. Particle_in_Cell3D works with standard diffractionlimited confocal image stacks. Deployed as a macro for the opensource image analysis software ImageJ [102], the user is guided in easytofollow steps through the process of correct parameter estimation and data analysis. A set of different methods was used to validate the macro. First, quenching experiments confirmed the correctness of the spatial 3D reconstruction of the cell. Second, stimulated emission depletion (STED) microscopy was employed to check calibration measurements and to directly compare absolute numbers of 100nm nanoparticles counted by the macro with superresolved images of the exact same imaging area. The results show that the macro can infer absolute quantification statistics from diffractionlimited confocal images for nanoparticles of approximately 100 nm and small agglomerates (formed of up to five particles). Interestingly, quantification of nanoparticles in absolute numbers by confocal microscopy was so far considered ‘not achievable’ by the scientific community (see for example Elsaesser et al. [14]). In this article we demonstrate that in fact it is achievable. The ability of Particle_in_Cell3D to quantify even smaller particles (e.g., 50 nm) and their agglomerates has not yet been established. It is indeed promising and the subject of our current studies.
Methods�n The Particle_in_Cell-3D
ImageJ macroParticle_in_Cell3D was designed to quantify the uptake of nano and microparticles into cells by processing stacks of images obtained via dualcolor confocal fluorescence microscopy. In order to be evaluated by Particle_in_Cell3D, both the plasma membrane and the particles need to be labeled with spectrally separable and photostable f luorescent dyes. Control
experiments to account for unspecific staining and crosstalk (bleedthrough) are very important to guarantee a successful analysis. With this prerequisite fulf illed, the f luorescence is split into two emission channels (images) and can be processed by Particle_in_Cell3D. Briefly, our digital method executes a series of ImageJ commands to accomplish its goal. It uses the image of the plasma membrane to segment the cell in 3D and to define two subcellular regions of interest (ROIs): intracellular and the membrane region. These ROIs delineate the regions in which particles will be localized and quantified. It is important to mention that although devised for quantifying the incorporation of nano and microparticles by cells, this method has the potential to be applied to quantify other fluorescent objects of interest (e.g., viruses, molecules and proteins). The ImageJ macro Particle_in_Cell3D is freely available for download [103].
Routine selectionParticle_in_Cell3D is separated into five different routines. The first three are devoted to the visualization and quantification of particles in cell uptake experiments. They permit quantification with increasing levels of accuracy: ‘qualitative’, to visualize the intracellular distribution of particles; ‘semiquantitative’, to measure and compare the amount of particles in different cells or regions based on particles’ fluorescence intensity; and ‘quantitative’, to count the absolute number of particles internalized by a cell. The last two routines are aimed at the characterization of nanoparticles (NPs), microparticles and agglomerates: ‘calibration’, to measure the mean intensity of particles; and ‘only particles’, to count the absolute number of particles in cellfree regions. At the beginning of the digital evaluation, the user is guided through easytofollow dialog boxes and is required to select which routine to run, the image files to analyze and to choose a directory for results.
Fluorescence intensity-based approach for quantifying particlesThe spatial coordinates of every single object (i.e., a single particle or a cluster of particles) are specified by its center of intensity. The total fluorescence of an object is digitally assessed by the sum of all pixel intensities forming it. This parameter is named integrated density (IntDens; Equation 1). During the image acquisition the photons that are collected at

www.futuremedicine.com doi:10.2217/NNM.12.178future science group
A fast analysis method to quantify nanoparticle uptake on a single cell level ReseaRch aRticle
each pixel (e.g., by a chargecoupled device) are converted into pixel intensities (PI). For example, each 16bit pixel carries an intensity value that ranges from 0 to 65,535 correlating to the number of fluorophores present in the scanned volume [18]. Thus, we assume that the IntDens, which is the sum of all pixel intensities in a region, is proportional to the amount of particles in that region, and that the selfquenching of fluorescence in particle agglomerates is negligible. Particle_in_Cell3D thereby does not count individual particles by simple counting of bright spots, but accesses the number of particles indirectly by integrating their fluorescence intensities. It is therefore able to correctly estimate the quantity of particles, even if they are agglomerated. The assumptions of negligible selfquenching and linear proportionality between the IntDens and the number of particles were validated for NPs of 100 nm and agglomerates of up to five particles. The accuracy of these results was proved by comparative experiments with superresolution microscopy.
The IntDens of an object i formed by V pixels is calculated in Equation 1,
IntDens ( )PIk 1
V
i k==
/(1)
where each pixel is indexed by the letter k. The ImageJ plugin 3D Object Counter is
employed by Particle_in_Cell3D to localize fluorescent objects in the image stack of the particles [104]. It delivers a results table containing all measured objects with their respective position. Our macro automatically and systematically uses this information in order to calculate the IntDens of all objects.
Routine 1: visualization of the intracellular distribution of particlesIn this qualitative routine the cell boundaries are used to define two cellular regions of interest: the intracellular and the membrane region. Particles are classified and pseudocolorcoded according to their location. The cell and all particles interacting with it can be visualized in an intuitive 3D reconstructed image (FigurEs 1F & 2).
3D reconstruction of the cellular ROIThe spatial position of the cell volume is determined by processing the confocal stacks representing the cellular membrane (FigurE 1a). Particle_in_Cell3D is designed for singlecell and multiplecell experiments. If more than one cell appears in the image the user has the possibility to select the target cell before the segmentation
process takes place. Likewise, if a single cell exists in the image no preselection by the user has to be performed. The segmentation starts by smoothing the image with a Gaussian filter and is followed by an automatic threshold selection (for cases in which the automatic threshold is not satisfactory, the user can set the threshold). Pixels above the threshold are used to convert the image stack of the cell into a binary image – the mask of the cell membrane (FigurE 1B). Next, the user is requested to verify the image stack and enter the first and the last slices constraining the cell along the Zdirection. Accordingly, the image stack of the cell is reduced to a substack. In the following, two independent segmentation strategies – segmentation strategy 1 (S1) and segmentation strategy 2 (S2) – are applied to allow evaluation of a variety of cell shapes. The segmentation S1 uses the cell membrane position on the top plane of the stack as a seed. This seed is used to track down the mask throughout the image stack. Slice after slice, the mask of the fluorescent membrane is transformed into the mask of the whole cell volume by filling closed patterns with white pixels and clearing the outside of the patterns (FigurE 1C). The segmentation S2 uses basically the same processes as S1, slice after slice, the mask of the fluorescent membrane becomes the mask of the whole cell volume. Furthermore, before filling closed patterns with white pixels, the image of every individual slice is copied and then pasted over the following slice. S2 is therefore more robust and was devised to be an option when the delicate strategy S1 fails. The user has the possibility to choose the segmentation strategy that best represents the cellular boundaries in a particular experiment. The outlines of the chosen strategy form the outer cellular ROI (outer ROI; FigurE 1C).
In a subsequent step, the outer ROI is shrunk by a given distance set by the user (see ‘Input of analysis parameters’ section), generating the inner ROI. The distance between the inner and the outer ROIs defines the width (w) of the membrane region. This space can be used as a threshold between extracellular and intracellular volumes. Hence, particles bound to the apical membrane should appear in this region if an adequate value for w is set. The position and shape of the membrane region depends directly on the appearance of the apical plasma membrane. It means that experimental conditions, such as the choice of the membrane marker, labeling protocol and cell type might influence the final geometry of the membrane region. An easy and good procedure to stain the cell membrane is given

Nanomedicine (Epub ahead of print)doi:10.2217/NNM.12.178 future science group
ReseaRch aRticle Torrano, Blechinger, Osseforth et al.
in the ‘Cell culture & incubation of cells with particles’ section, while an example on how to estimate the extension of the membrane region is presented in the ‘Cell segmentation strategy’ section. The formation of a membrane region with an intracellular space by Particle_in_Cell3D is shown in FigurE 1a–D.
The volume of the cell and of the subcellular regions are calculated in volumetric pixels (voxels) and then converted to µm3 according to the preset XY and Zscales.
Assignment of particles to different cellular regionsParticles are classified and colorcoded according to their position with respect to the inner and the outer ROIs (FigurE 1E). In order to do so, the spatial coordinates describing the center of intensity of every single object are automatically measured and recorded by the ImageJ plugin 3D Object Counter [104]. Particle_in_Cell3D uses this information as input data. If the center of intensity of an object is located inside the inner ROI, it is assigned as intracellular and colorcoded in green (the user can also set a different color). In addition, if it is positioned between the inner and the outer ROI, it is classified as belonging to the membrane region and colorcoded in cyan (FigurE 1F). It is important to note that only objects above the lower threshold for particles and within a preselected size range (in number of voxels) are analyzed (see the ‘Routine 2: measurement of the fluorescence intensity of particles’ section and ‘Input of analysis parameters’ section).
Finally, a text file is created containing a report documenting the input parameters and the results. In addition, the main processed images and results tables are saved.
Routine 2: measurement of the fluorescence intensity of particlesAll aspects of routine 1 are present in routine 2. Additionally, it is able to quantify the fluorescence intensity (IntDens; Equation 1) of all intracellular and membraneassociated objects.
Lower threshold & volume of particlesThe lower threshold applied to particles is a key parameter for correct quantification. Objects are selected for analysis based on this value, that is, only pixels with intensity values above the threshold enter the calculation. In addition, the user is given the possibility to set the minimum and maximum volume (number of voxels) of thresholded pixels to be considered as an object (see the ‘Input of analysis parameters’ section).
Total fluorescence intensity of particles in a regionThe total IntDens (TIntDens) of a region (R) – intracellular or membrane region – is defined as the sum of the IntDens over all objects belonging to that region (Equation 2),
TIntDens IntDens Rii
n
1
==
^ h/(2)
where i indexes all objects from 1 to n.TIntDens is therefore proportional to the
number of particles in the region where it is
Figure 1. Particle_in_Cell-3D processing overview. (A) Representative confocal cross-section image of a HeLa cell plasma membrane stained with CellMask™ Deep Red. (B) The image of (A) is transformed into a white mask. (C) Further segmentation processes form the final mask of the cell. (D) Afterwards, its outer border is shrunk to define the enlarged membrane region (in red) and the region inside the cell (in white). The procedure occurs throughout the image stack, leading to a 3D reconstruction of the system. (E) Membrane region outlines (in yellow) are employed to segment the image of the fluorescent particles. (F) Merged image with orthogonal views along the yellow lines displaying the entire stack. The cell plasma membrane appears in magenta, while the membrane region outlines are shown in yellow. Particles are assigned to two different regions: intracellular (in green) and the membrane region (in cyan).

www.futuremedicine.com doi:10.2217/NNM.12.178future science group
A fast analysis method to quantify nanoparticle uptake on a single cell level ReseaRch aRticle
calculated and semiquantitative results can be achieved by comparing the TIntDens of different region or cells.
Routine 3: counting the absolute number of particlesRoutine 3 includes all features presented in routines 1 and 2. It additionally permits the absolute quantification of particle uptake on the singlecell level.
Particle number distribution in agglomeratesThe calculation is straightforward and the number of particles forming an object i is given by Equation 3,
No_PMean_IntDens
IntDensi
i=(3)
The mean IntDens of a single particle can be measured via routine 4 (see the ‘Routine 4: calibration to measure the mean intensity of single particles’ section).
Absolute number of particles taken up by cellsThe total number of intracellular particles is calculated by simple addition over all particles within the inner ROI. The same consideration holds for the total number of membrane associated particles, but this time accounting
for all particles located within the inner and the outer ROIs. The general equation can be written as follows (see Equation 4),
No_P No_PR ii 1
n
R
==^ h/
(4)
where i indexes all objects from 1 to n in the cellular region R.
Concentration of particlesThe concentration of particles within each region is obtained by dividing the number of particles by the respective cellular volume (Equation 5).
C_PV
No_PR
R
R=(5)
Concentrationbased approaches can be useful for cases in which the volume ratio of the two regions differs over time or within cells. Since the volume, the concentration and the number of particles in each region are automatically saved in a report file, it is straightforward to calculate new parameters based on the particle concentration.
Routine 4: calibration to measure the mean intensity of single particlesRoutine 4 is used to obtain the distribution of IntDens of all objects. This parameter is essential for routines 3 and 5. From this data set one can derive the mean IntDens of a single particle. Objects of interest are automatically selected
Figure 2. Transversal cut of a 3D representation of nanoparticle uptake after evaluation with Particle_in_Cell-3D. Cellular boundaries were reconstructed by the membrane region and are shown in magenta. The analyzed nanoparticles are color-coded in green if intracellular and in cyan if membrane associated; nanoparticles lying outside the cell volume are displayed in gray. The projection was created with the ImageJ plugin 3D Viewer [105]. 3D scale bars = 4 µm.

Nanomedicine (Epub ahead of print)doi:10.2217/NNM.12.178 future science group
ReseaRch aRticle Torrano, Blechinger, Osseforth et al.
in the image of the particles and added to the ImageJ ROI Manager. One after the other, each selected object is measured. In the end, a report of results shows the IntDens of all evaluated objects. However, analyzed objects are not only comprised of single particles but also of agglomerates. It is necessary to exclude agglomerates from the data set to yield just the mean IntDens of individual particles. This can be verified by other means, for example, superresolution microscopy. In this work we use STED microscopy to accomplish this task (see the ‘Accuracy of absolute quantification’ section).
Routine 5: quantifying particles in cell-free regionsRoutine 5 was designed to characterize the concentration and agglomeration of particles in control experiments without cells. This information is extremely relevant because the exposure of particles to cells in a monolayer culture may vary with time owing to sedimentation and diffusion of particles in the cell medium [19]. The user is requested to define the 3D ROI to be analyzed. Next, if the mean IntDens is known, the total number of particles, their concentration and the particle number distribution are calculated within the selected region as defined by Equations 3–5.
Input of analysis parametersThe possibility of adapting the analysis parameters according to experimental conditions increases the flexibility of Particle_in_Cell3D. The following parameters have to be set by the user during analysis and are saved in a final report.
XY-scaleThis parameter is the image size of each pixel in real space. It corresponds to the magnification calibration of the microscope system. The XYscale has to be entered in nm per pixel. This value, together with the Zscale, is used to calculate the volume of the cell and the concentration of particles.
Z-scale or interslice distanceThe Zscale is the depth of each volumetric pixel (voxel) in real space. It defines the distance between two adjacent images in an image stack. This parameter is directly given by the interslice distance that is set during acquisition in a confocal microscope. The units to be used are nm per pixel. To avoid under and oversampling, images should be acquired following the Nyquist criterion [20].
Width of the cell membrane regionThis parameter defines the distance w in pixels between the inner and the outer ROIs. It is thereby equal to the width of the region between the intra and the extracellular environments, which is the membrane region (FigurE 1D). The membrane region represents a transition space every particle has to pass through to be internalized by a cell. One should keep in mind that the membrane region is typically much wider than the actual membrane. Another point to be considered is that the amount of membraneassociated particles depends on how cells are exposed to the particles and on how cells are treated prior to imaging. For example, particles that were loosely bound to the membrane may be removed during staining and washing steps.
Background to be subtractedThis parameter is used to correct for the background present in the image stack of the particles. The entered value is subtracted from the intensity value of each pixel. If no subtraction is needed (e.g., background was removed by another method), this parameter should be set to 0.
Lower threshold for particlesOnly pixels with intensity values exceeding this threshold will be considered particles and thus analyzed. When a correct threshold is set, the bright spots associated with the fluorescent objects form clusters of adjacent pixels and only these pixels are evaluated. This choice is fundamental for the whole analysis process as it has major influence on the results. If the threshold is set too low, artifacts such as background noise and cellular autofluorescence might be counted as particles. On the other hand, if it is set too high, dimmer particles will not be considered and agglomerates will be overestimated. In summary, the threshold must be set as low as possible, but high enough to allow object segmentation. When absolute quantification is intended, the lower threshold should be the same as the one used during calibration.
Minimum & maximum number of voxelsThe volume of the objects under investigation (in number of voxels, after applying the lower threshold) can be used to eliminate background noise and to avoid analyzing dimmer or brighter objects. If absolute quantification is intended, these values should also be the same as the ones used during calibration.

www.futuremedicine.com doi:10.2217/NNM.12.178future science group
A fast analysis method to quantify nanoparticle uptake on a single cell level ReseaRch aRticle
Threshold for segmenting the cellThis is the lower threshold value applied to segment the cell and define its position.
Mean IntDens of a single particleThis value characterizes the mean f luorescence intensity of individual particles. It can be obtained from the data set provided by running routine 4. The mean IntDens is not necessary in routines 1 and 2, but crucial to calculate the absolute number of particles in routines 3 and 5.
�n Experimental detailsPreparation of fluorescent mesoporous silica nanoparticlesPoly(ethylene glycol) (PEG)ylated colloidal mesoporous silica NPs (CMSNPs) of 50–80 nm in size (ellipsoids) were synthesized as described elsewhere [21]. CMSNPs were functionalized at their periphery with aminopropyl and PEGgroups through cocondensation, followed by grafting the cyanine dye Cy3 Nhydroxysuccinimide (NHS) ester. The dye labeling was carried out with an ethanolic suspension of the particles having a concentration of 1 mg/ml by adding 14.2 µl of dye Cy3 NHS ester solution (2 mg/ml in dimethyl formamide). The reaction solution was stirred for 1 h at room temperature in the dark, then the Cy3labeled CMS nanoparticles (CMSNPsCy3) were collected by centrifugation (14000 rpm for 5 min), washed threetimes with ethanol and finally redispersed in water to a final concentration of 0.5 mg/ml.
Preparation of fluorescent polystyrene nanoparticles for STED & confocal microscopyPrecision cover slips (LH24.1, Carl Roth GmbH) were cleaned with ethanol. 50 µl of polyllysine 0.1% solution (SigmaAldrich) was applied onto each cover slip. After 5 min the solution was removed with a pipette and the cover slip left to dry in air. Commercially available fluorescent polystyrene beads with a diameter of 100 nm (Red FluoSpheres 100 nm, Invitrogen) were diluted 1:1000 in ethanol and sonicated for 10 min. 5 µl of this solution was then applied to the lysinetreated cover slips. After evaporation samples where mounted with 7 µl of 2,2 ́thiodiethanol (Sigma Aldrich, diluted to 97% in phosphate buffered saline), put on an objective slide and sealed with nail varnish. Samples were imaged as described in the ‘Superresolution imaging of 100nm nanoparticles’ section.
Cell culture & incubation of cells with particlesHeLa cells were grown in DMEM supplemented with 10% fetal calf serum (Invitrogen) in 5% CO
2 humidified atmosphere at 37°C.
Cells were seeded 24 or 48 h before imaging on collagen A LabTek chamber slides (Thermo Fisher Scientific Inc.) in a density of 2.0 × 10⁴ or 1.0 × 10⁴ cells/cm², respectively.
Cells were incubated with the CMSNPsCy3 at a final concentration of 120–180 µg/ml. The particle solution was prepared in CO
2independ
ent medium (Invitrogen) with 10% fetal calf serum, sonicated for 10 min and heated up to 37°C. Prior to livecell imaging the membrane of the cells was stained with CellMask™ Deep Red (Invitrogen) by replacing the particlecontaining cell medium by a staining solution. The latter was prepared by adding 0.2 µl of CellMask™ into 400 µl of cell medium. After 1–2 min of incubation, the staining solution was replaced by CO
2
independent medium (Invitrogen) supplemented with 10% fetal calf serum.
Quenching experimentsThe quenching experiments were carried out on a custombuilt widefield microscope based on the Nikon Eclipse Ti microscope, as described before [22]. Samples were Köhler illuminated through a Nikon Plan APO TIRF 60×/1.45 oil immersion objective with 532 nm laser light with an integration time of 300 ms, exciting Cy3. The fluorescence was separated from the excitation light and image sequences were captured with an electron multiplier chargecoupled device camera (iXon+, Andor Technology). Cy3 fluorescence was quenched by adding 10 µl of a 0.4% trypan blue solution into 400 µl medium in the observed chamber during image acquisition and gently mixed. As trypan blue is a cell membraneimpermeable dye it is not able to quench particles that have been taken up by the cells. By comparing images prior to and after quenching, the percentage of internalized particles is accessible. Quenching experiments were performed to validate Particle_in_Cell3D performance in segmenting the cell and in measuring the fraction of internalized particles (see the ‘Cell segmentation strategy’ section and the ‘Fraction of particles internalized by single cells’ section).
Spinning disc imaging for uptake experimentsUptake experiments with CMSCy3NPs were performed on a spinning disc confocal

Nanomedicine (Epub ahead of print)doi:10.2217/NNM.12.178 future science group
ReseaRch aRticle Torrano, Blechinger, Osseforth et al.
fluorescence microscope based on Nikon Eclipse TE 2000E equipped with a Nikon Apo TIRF 100×/1.49 oil immersion objective. Specimens were illuminated with laser light alternating between 488 and 633 nm, exciting Cy3 and the cell membrane stain, respectively. Image sequences were captured with an electron multi plier chargecoupled device camera (iXon DV887ECCSBV, Andor Technology). Before being captured by the camera, the emission signal was split by a dichroic mirror at 592 nm. The bandpass detection filters used were 525/50 nm (Cy3 channel) and 730/140 nm (cell membrane stain channel). Exposure times were set to 300 ms. Zstacks of single cells were imaged with an interslice distance of 166 nm, following the Nyquist criterion [20].
Super-resolution imaging of 100-nm nanoparticlesTo evaluate the absolute quantification algorithm of Particle_in_Cell3D, samples were imaged with a custombuilt STED microscope in confocal and superresolution mode. The setup is based around a supercontinuum laser (SC450PPHE, Fianium Ltd), which emits from 459 to 2000 nm at a repetition rate of 1 MHz [23]. In short, the laser light is split by a dichroic mirror (Z660 DCXR, AHF Analysentechnik AG). The short wavelength part is sent through an emission filter (z568/10×, AHF Analysentechnik AG) to provide the excitation band of 570 ± 5 nm. The long wavelength part is sent to a custombuilt prismbased monochromator to yield the spectrum suitable for efficient depletion of the excited state in superresolution mode (695–713 nm). For the purpose of spatial filtering the excitation and depletion beams are coupled into singlemode polarization maintaining fibers (PMC6304,2NA0103APC200P for excitation and PMC6304,6NA0113APC150P for STED beam, Schäfter & Kirchhoff GmbH). After collimation, the excitation beam is coupled into the optical path of a 1.4 NA oil objective (HCX PL APO 100×/1.40–0.70 oil CS, Leica Microsystems GmbH) by a dichroic mirror (585 DCXR, AHF Analysentechnik AG). The depletion beam first passes through a vortex phase plate (VPP1b, RPC Photonics) to imprint the phase necessary to yield the LaguerreGaussian LG
01 mode used in STED
microscopy. Consecutively, the depletion beam is coupled into the axis of the objective by a dichroic mirror (Q690 SPXR, AHF Analysentechnik AG). Both beams pass through an achro matic l/4 retarder (custommade by
Bernhard Halle Nachfl. GmbH) to yield perfect circular polarization for the depletion band. The sample is scanned by a highspeed piezo scanning stage setup (P733.2DD for XY, P753.11C for Z; both controlled by an E712 controller with DDL feature enabled, Physik Instrumente GmbH & Co. KG). Fluorescence is collected by a singlephoton counting module (SPCMAQRH13FC, Perkin Elmer Inc.) after it has passed the two aforementioned dichroic mirrors and a detection filter (Brightline HC 629/56, AHF Analysentechnik AG). Control of the setup is provided by customwritten Labview software (Labview 2011, National Instruments Corp.).
The microscope can be operated in two modes, namely standard confocal and STED mode [23]. In the confocal mode, only the excitation beam is active while the depletion beam is inactivated by means of a mechanical shutter (04RDS501, CVI Melles Griot). Imaging in this mode yields diffractionlimited optical resolution (~l
Excitation/[2NA
Objective]). In STED mode, the exci
tation and STED beams are both focused onto the sample rendering a resolution well below its confocal counterpart (~40 nm in imaging plane XY as opposed to 250 nm in confocal mode).
In confocal mode stacks were recorded with an area of 30 × 30 µm, a pixelsize of 100 nm and an interslice distance of 220 nm using an excitation intensity <1 µW. After recording the confocal stack, the focus was set to the position of the confocal image yielding the maximum signal, the STED beam was turned on (STED beam intensity ~1 mW) and another image of the exact same area was recorded with a pixel size of 20 nm. Pixel dwell time was typically 280 µs in both modes. The time to switch from confocal to STED imaging mode was a couple of seconds (limited mainly by refocusing to the plane of interest).
Results�n Cell segmentation strategy
The 3D reconstruction of the cellular ROI employed by Particle_in_Cell3D (see the ‘Routine 1: visualization of the intracellular distribution of particles’ section) includes the formation of a membrane region. The w of this region is a very important parameter (see the ‘Input of analysis parameters’ section). It defines the thickness of the transition region between extracellular and intracellular space and is freely set by the user. With the aim of validating the cell segmentation strategies S1 and S2 (see ‘Routine 1: visualization of the intracellular distribution of particles’) and identifying the magnitude of w,

www.futuremedicine.com doi:10.2217/NNM.12.178future science group
A fast analysis method to quantify nanoparticle uptake on a single cell level ReseaRch aRticle
quenching experiments were performed with a confocal spinning disc microscope. The images before and after quenching of CMSNPsCy3 (see the ‘Preparation of fluorescent mesoporous silica nanoparticles’ section) were processed by Particle_in_Cell3D using different values for the width of the membrane region. By comparing the images before and after quenching, we determined w = 1.4 µm (see definition of membrane
region in the ‘Input of analysis parameters’ section) as the most suitable value for our experiments (data not shown). This was the smallest possible w in which intracellular particles were never quenched and membraneassociated particles were either quenched or remained fluorescent. Therefore, the 3D reconstruction of the cell performed by our method succeeded to create an intracellular space and a transition region.
100
80
60
40
20
000:00 01:00 02:00 03:00 04:00 05:00 06:00
Incubation time (h:min)
Frac
tio
n o
f N
P u
pta
ke (
%)
100
80
60
40
20
000:00 01:00 02:00 03:00 04:00 05:00 06:00
Incubation time (h:min)
Frac
tio
n o
f N
P u
pta
ke (
%)
QuenchingParticle_in_Cell-3D
Figure 3. Fraction of Cy3-labeled colloidal mesoporous silica nanoparticles internalized by HeLa cells as analyzed by Particle_in_Cell-3D and by quenching experiments. (A) The fraction of NP uptake of individual cells is plotted with respect to their incubation time. The heterogeneity is typical for single-cell experiments. For a better overview, the median values are presented in (B). NP: Nanoparticle.
Figure 4. Calibration experiment. (A) Subregion of a confocal image stack of fluorescent 100-nm polystyrene nanoparticles (Red FluoSpheres, Invitrogen). (B) Z-projection of (A) followed by threshold and automatic segmentation of objects. (C) IntDens measured for all segmented objects of one stack. The mean IntDens corresponds to the IntDens of the first peak, 11,360 PI (Gaussian fit not shown). The second peak has roughly twice the value of the first one; a good indication that the first peak value characterizes single nanoparticles, while the second peak characterizes dimers. This indication was confirmed by super-resolution stimulated emission depletion measurements (see ‘Accuracy of absolute quantification’ section; FigurEs 5–7). IntDens: Distribution of intensity; PI: Pixel intensity.
First peak = 11,360 PISecond peak = 22,562 PI
60
50
40
30
20
10
00 10,000 20,000 30,000 40,000 50,000 60,000
IntDens (PI)
Ob
ject
s (n
)
1000 nm
1000 nm
Nanomedicine (Epub ahead of print)doi:10.2217/NNM.12.178 future science group
ReseaRch aRticle Torrano, Blechinger, Osseforth et al.
�n Fraction of particles internalized by single cellsIn order to confirm the correctness of setting w equal to 1.4 µm in the present set of experiments, the uptake of 80nm mesoporous silica NPs into HeLa cells was measured. The outcome was compared with data obtained from quenching experiments conducted in parallel.
HeLa cells were incubated with the CMSNPsCy3 from 1 to 6 h. More than 70 cells were randomly selected, imaged with a confocal spinning disc microscope and then analyzed via Particle_in_Cell3D. The fraction of particles taken up by single cells was assessed similarly
to quenching experiments; that is, the amount of internalized particles was divided by the sum of intracellular and membraneassociated particles (as described below). The fraction of internalized particles was thus calculated by Equation 6,
FIPIntDens TIntDens
TIntDensT intracellular membrane
intracellular=+^ h (6)
and then plotted against time (FigurE 3a). The values at specific time points after incubation are shown as blue circles. We found that after 1:15 (h:min) approximately 25% of the CMSNPsCy3 were taken up by the cell, and 50% was reached after 2:45. The internalization increased constantly, reaching 92% after 5:45 (FigurE 3B).
In the following we compare the results obtained by Particle_in_Cell3D with the outcome of independent quenching experiments. We analyzed the uptake of CMSNPsCy3 into HeLa cells via the wellestablished quenching method [22,24]. This procedure is commonly applied to characterize the kinetics of internalization of NPs functionalized with a quenchable dye (e.g., Cy3). Briefly, after the intended incubation time, a cell membraneimpermeable dye (e.g., trypan blue) is added to the cell culture while monitoring the NPs’ fluorescence on a widefield fluorescence microscope. The dye quenches the fluorescence of the NPs that are in the extracellular space whereas intracellular NPs remain fluorescent. By comparing images before and after quenching, the fraction of NPs taken up by single cells can be calculated [24]. As described by Equation 6, the fraction of internalized particles is given by the number of intracellular particles (number of nonquenched particles detected after quenching) divided by the sum of intracellular and membraneassociated particles (number of particles in contact with the cell detected before quenching). We determined the uptake kinetics of the CMSNPsCy3 by analyzing more than 50 individual HeLa cells within a period of 6 h. FigurE 3a (purple squares) shows the fraction of internalized particles at different time points after incubation. Each data point represents an individual cell. For a clearer insight into the behavior, the corresponding median values are shown in FigurE 3B as purple squares. After approximately 3 h, 50% of the nanoparticles were taken up by the cells.
As already mentioned in the ‘Input of analysis parameters’ section, the amount of membraneassociated particles will depend on how the cells are treated prior to imaging. In the present case, particles that were not or just loosely bound to
Confocal STED
500 nm
500 nm
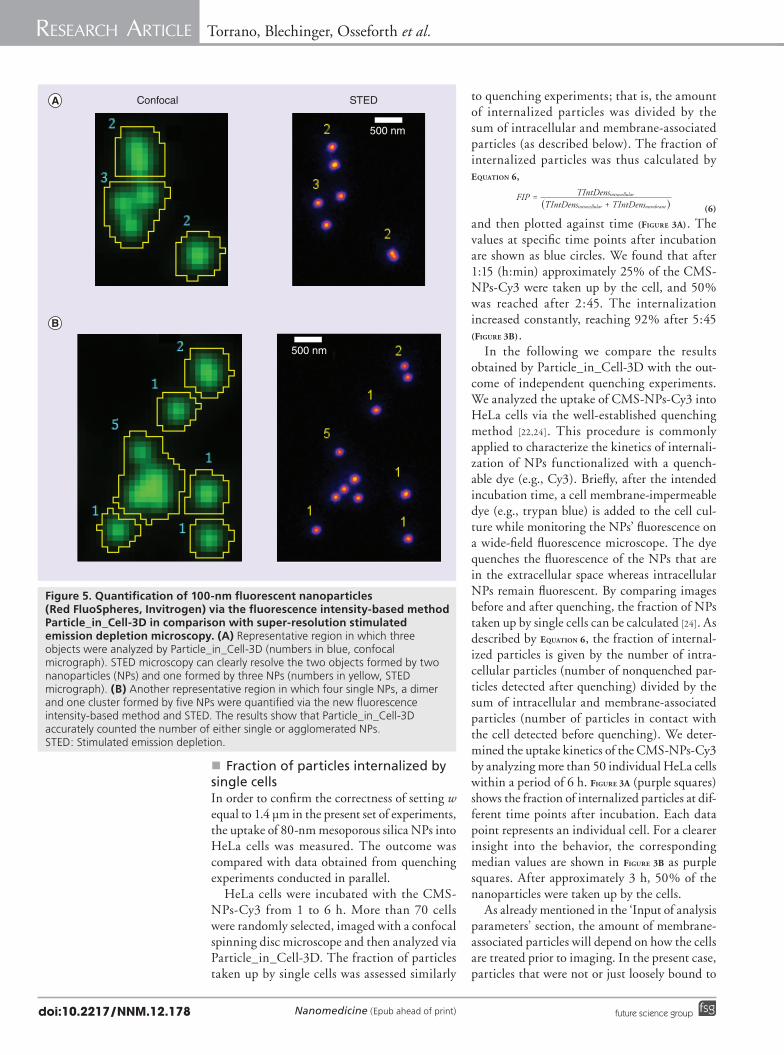
Figure 5. Quantification of 100-nm fluorescent nanoparticles (Red FluoSpheres, Invitrogen) via the fluorescence intensity-based method Particle_in_Cell-3D in comparison with super-resolution stimulated emission depletion microscopy. (A) Representative region in which three objects were analyzed by Particle_in_Cell-3D (numbers in blue, confocal micrograph). STED microscopy can clearly resolve the two objects formed by two nanoparticles (NPs) and one formed by three NPs (numbers in yellow, STED micrograph). (B) Another representative region in which four single NPs, a dimer and one cluster formed by five NPs were quantified via the new fluorescence intensity-based method and STED. The results show that Particle_in_Cell-3D accurately counted the number of either single or agglomerated NPs. STED: Stimulated emission depletion.

www.futuremedicine.com doi:10.2217/NNM.12.178future science group
A fast analysis method to quantify nanoparticle uptake on a single cell level ReseaRch aRticle
the plasma membrane were detached during the procedure to stain the cells (see the ‘Cell culture & incubation of cells with particles’ section) or to quench the particles (see the ‘Quenching experiments’ section). For this reason, the fraction of internalized particles, as calculated in Equation 6, represents the ratio between intracellular and cellassociated particles (intracellular plus membranebound particles).
The wide spread within the data of both experiments is typical for singlecell measurements and represents the heterogeneity from cell to cell. Taking this heterogeneity into account, the data sets obtained by quenching experiments and by our new analysis method correspond very well and thereby prove that Particle_in_Cell3D can be successfully used to determine the fraction of particles internalized by cells.
�n Accuracy of absolute quantificationFluorescent polystyrene beads with a diameter of 100 nm (Red FluoSpheres, Invitrogen) were dispersed on a cover slip (see the ‘Preparation of fluorescent polystyrene nanoparticles for STED & confocal microscopy’ section). Image stacks in confocal mode were recorded as described in the ‘Superresolution imaging of 100nm nanoparticles’ section. Routine 4 was used to measure the IntDens (Equation 1) of the beads (FigurEs 4a & B). One stack with 321 objects was analyzed and the values for the IntDens were plotted in a histogram (FigurE 4C). A Gaussian
fit was used to calculate the intensity values of the first and second peaks. Interestingly, the IntDens corresponding to the second peak (22,562 PI) was approximately twice the value for the first peak (11,360 PI). This is an indication that the first peak corresponded to single NPs while the second peak consisted of dimers. To validate this assumption, the same image area was analyzed in superresolution STED mode (see the ‘Superresolution imaging of 100nm nanoparticles’ section) [25]. The superresolved STED image gives direct access to absolute quantification of previously blurred nanoparticle agglomerates. Additionally, the biggest advantage of employing this particular superresolution technique is the possibility to readily analyze the same region in confocal and STED mode. As shown in FigurE 5, this allows for comparison between the data calculated by Particle_in_Cell3D and the actual numbers of NPs present in the imaged area without doing any modification to the sample in between imaging in the two modes. The resolution of our setup was sufficient to resolve individual NPs. Bead size in STED mode was measured to be 98 ± 5 nm (n = 10) in good agreement to the actual diameter of 100 nm [26]. Even two beads lying sidebyside in direct contact were resolved as individual beads (FigurE 6). By comparing the superresolved image to the results of Particle_in_Cell3D, the first peak in the histogram of FigurE 4 could be identified to be comprised
0
20
40
60
80
100
120
140
0 0.1 0.2 0.3 0.4 0.5 0.6 0.7 0.8
Raw dataDual Guassian �t
Position (µm)
Inte
nsi
ty (
cou
nts
)
~103 nm
1 µm
Figure 6. Individual nanoparticles can be resolved with stimulated emission depletion microscopy. (A) Stimulated emission depletion image of 100-nm fluorescent nanoparticles (NPs). Using the stimulated emission depletion technique, individual NPs can be resolved even when they are in direct contact. An example is marked by the yellow line. (B) The cross-section marked in (A) shows that even neighboring NPs can be resolved. A dual Gaussian fit is applied to fit the intensity profile, yielding a separation of the two NP centers of 103 nm (blue line). The figure was plotted with GnuPlot [106].

Nanomedicine (Epub ahead of print)doi:10.2217/NNM.12.178 future science group
ReseaRch aRticle Torrano, Blechinger, Osseforth et al.
of single NPs. The mean IntDens of a single NP was therefore 11,360 PI. With this value at hand we analyzed independent regions and compared the data of our macro with the number of NPs detected via STED microscopy. In total 615 objects were analyzed and the results were in good agreement up to agglomerates of five NPs (FigurE 7). For higher numbers of NPs per object it was difficult to achieve good statistics because most NPs were monodispersed in our images. It is left for future work to study the accuracy of the macro to quantify smaller NPs and larger agglomerates. In summary, the intensitybased approach of Particle_in_Cell3D is able to correctly quantify 100nm NPs in absolute numbers, from single NPs up to, at least, agglomerates of five NPs.
ConclusionOur newly developed method Particle_in_Cell3D is able to analyze the uptake of nanoparticles
by single cells from dualcolor confocal images in a semiautomatic way. The cell is reconstructed in 3D and two distinct spaces are automatically defined: intracellular and the membrane region. Furthermore, particles can be visualized in great detail, as they are colorcoded according to their position with respect to the cell. The processed images, input parameters and results are all saved and can be accessed at any time.
As shown by comparative investigation of the fraction of internalized 80nm mesoporous silica NPs, results obtained by employing Particle_in_Cell3D are in good agreement with those assessed by quenching experiments. Advantages over quenching experiments include the reduced need of material and the throughput of analysis. Furthermore, evaluation by the macro provides the possibility to measure several cells per experiment.
Particle_in_Cell3D is fast and accurate. For nanoparticles of approximately 100 nm, single or forming agglomerates of up to five NPs, it permits a rapid counting of large numbers of particles that are correctly quantified even when agglomerated. These results have been proved by comparison with STED microscopy, a superresolution technique. The resolution of the STED setup used was able to resolve individual 100nm beads even when in direct contact with neighboring beads. The accuracy of this new method to quantify smaller NPs and larger agglomerates is left for a future work.
Particle_in_Cell3D overcomes some drawbacks of commonly applied methods such as mass spectroscopy, flow cytometry, electron microscopy and singlecell quenching experiments, offering new possibilities to characterize particle–cell interactions. Potential applications of this method include studies to establish dosedependent effects for the risk assessment of nanomaterials. In addition, Particle_in_Cell3D can be used to investigate which factors determine the successful attachment and internalization of nano and microparticles designed for drug and gene delivery therapies. The potential applications of this novel method arise exactly from the advantages and conveniences of fluorescence microscopy associated with the possibility of rapid and accurate quantitative results.
Future perspectiveIn upcoming years, developments in nanomedicine will increase the number and use of nanoparticles in a vast variety of applications, raising the need for a thorough understanding of their potential toxicological properties. The ability to
1 2 3 4 5
NPs per object counted by STED analysis
0
1
2
3
4
5
6
NP
s p
er o
bje
ct c
ou
nte
d b
y P
arti
cle_
in_C
ell-
3D
Figure 7. Performance of the Particle_in_Cell-3D macro compared with stimulated emission depletion analysis. The calculated number of 100-nm NPs in an object agrees well with the actual number as determined with STED analysis. Two 30 × 30-µm stacks were analyzed, resulting in 615 objects. A total of 443 objects were composed of one NP, 100 objects of two NP, 43 objects of three NPs, 25 objects of four NPs and four objects were made up of five NPs as determined by super-resolution imaging. Whiskers extend up to 1.5-times the interquartile range; points represent outliers. The figure was plotted with GnuPlot [106]. NP: Nanoparticle; STED: Stimulated emission depletion.

www.futuremedicine.com doi:10.2217/NNM.12.178future science group
A fast analysis method to quantify nanoparticle uptake on a single cell level ReseaRch aRticle
Executive summary
The Particle_in_Cell-3D method � The Particle_in_Cell-3D method is a relatively newly developed and freely accessible digital image analysis method. � It allows rapid quantification of particle uptake into single cells by analyzing image stacks obtained via dual-color confocal fluorescence
microscopy. � The image of the cell membrane is used to segment the cell into two regions: intracellular and the membrane region. � The segmentation strategy applied to define the position and the volume of the cell was validated by comparison with quenching
experiments. � The absolute quantification based on the intensity of particles was proven to be accurate for 100-nm nanoparticles (NPs) forming
agglomerates of up to five NPs. The results were validated by comparison with stimulated emission depletion microscopy. � The performance of the method to quantify smaller NPs and larger agglomerates is under investigation. � The custom-built stimulated emission depletion setup was able to resolve individual 100-nm NPs in dense agglomerates.
Advantages compared with other methods � Quenching experiments: no quenchable dye is needed. Enhanced collection of data and reduced consumption of material and time. � Inductively coupled plasma mass spectroscopy: sample integrity is preserved and spatial information is available. � Flow cytometry: direct 3D insight into the localization of each individual particle. � Electron microscopy: sample preparation is considerably easier. Live cell imaging is possible.
References1 Lee J, Mahendra S, Alvarez PJJ. Nanomaterials
in the construction industry: a review of their applications and environmental health and safety considerations. ACS Nano. 4(7), 3580–3590 (2010).
2 Krug HF, Wick P. Nanotoxicology: an interdisciplinary challenge. Angew. Chem. Int. Ed. Engl. 50(6), 1260–1278 (2011).
3 Kim J, Piao Y, Hyeon T. Multifunctional nanostructured materials for multimodal imaging, and simultaneous imaging and therapy. Chem. Soc. Rev. 38(2), 372–390 (2009).
4 Trewyn BG, Slowing, II, Giri S, Chen HT, Lin VS. Synthesis and functionalization of a mesoporous silica nanoparticle based on the solgel process and applications in controlled release. Acc. Chem. Res. 40(9), 846–853 (2007).
5 Astruc D. Nanoparticles and Catalysis. Astruc D (Ed.). WileyVCH, Weinheim, Germany (2008).
6 Roca M, Haes AJ. Probing cells with noble metal nanoparticle aggregates. Nanomedicine (Lond.) 3(4), 555–565 (2008).
7 Ashley CE, Carnes EC, Phillips GK et al. The targeted delivery of multicomponent cargos to cancer cells by nanoporous particlesupported lipid bilayers. Nat. Mater. 10(5), 389–397 (2011).
8 Piao Y, Burns A, Kim J, Wiesner U, Hyeon T. Designed fabrication of silicabased nanostructured particle systems for nanomedicine applications. Adv. Functional Mater. 18(23), 3745–3758 (2008).
9 Oh WK, Kim S, Choi M et al. Cellular uptake, cytotoxicity and innate immune response of silica–titania hollow nanoparticles based on size and surface
functionality. ACS Nano. 4(9), 5301–5313 (2010).
10 Suzuki H, Toyooka T, Ibuki Y. Simple and easy method to evaluate uptake potential of nanoparticles in mammalian cells using a flow cytometric light scatter analysis. Environ. Sci. Technol. 41(8), 3018–3024 (2007).
11 Bräuchle C, Lamb D, Michaelis J. Single Particle Tracking and Single Molecule Energy Transfer. WileyVCH Verlag GmbH & Co. KGaA, Weinheim, Germany (2009).
12 Andersson PO, Lejon C, EkstrandHammarstrom B et al. Polymorph and sizedependent uptake and toxicity of TiO nanoparticles in living lung epithelial cells. Small 7(4), 514–523 (2011).
13 Lu F, Wu SH, Hung Y, Mou CY. Size effect on cell uptake in wellsuspended, uniform mesoporous silica nanoparticles. Small 5(12), 1408–1413 (2009).
quantify nanoparticles on the singlecell level is a basic step to better comprehend the mechanisms of their biological effects in a bottomup approach. Recent progress in superresolution microscopy, livecell imaging, and digital image analysis methods (i.e., Particle_in_Cell3D) will help to advance this research area.
AcknowledgementsThe authors thank M Franke for excellent technical help and advice.
Financial & competing interests disclosureThis work was supported by the Deutsche Forschungsgemein-schaft (DFG) within the project SPP 1313, the Nanosystems Initiative Munich (NIM), by the Center for Integrated Pro-tein Science Munich (CIPSM) and the BioImaging Network (BIN) Munich. J Blechinger acknowledges the International
Doctorate Program NanoBioTechnology (IDK-NBT) and the Römer Foundation for funding and support. J Michaelis received financial support from the SFB 749 and through an European Research Council starting grant. The authors have no other relevant affiliations or financial involvement with any organization or entity with a financial interest in or financial conflict with the subject matter or materials discussed in the manuscript apart from those disclosed.
No writing assistance was utilized in the production of this manuscript.
Ethical conduct of research The authors state that they have obtained appropriate insti tutional review board approval or have followed the princi ples outlined in the Declaration of Helsinki for all human or animal experimental investigations. In addi-tion, for investi gations involving human subjects, informed consent has been obtained from the participants involved.

Nanomedicine (Epub ahead of print)doi:10.2217/NNM.12.178 future science group
ReseaRch aRticle Torrano, Blechinger, Osseforth et al.
14 Elsaesser A, Taylor A, de Yanés GS et al. Quantification of nanoparticle uptake by cells using microscopical and analytical techniques. Nanomedicine (Lond.) 5(9), 1447–1457 (2010).
15 Brandenberger C, Muhlfeld C, Ali Z et al. Quantitative evaluation of cellular uptake and trafficking of plain and polyethylene glycolcoated gold nanoparticles. Small 6(15), 1669–1678 (2010).
16 Mühlfeld C, Mayhew TM, Gehr P, RothenRutishauser B. A novel quantitative method for analyzing the distributions of nanoparticles between different tissue and intracellular compartments J. Aerosol. Med. 20(4), 395–407 (2007).
17 Stark WJ. Nanoparticles in biological systems. Angew. Chem. Int. Ed. 50(6), 1242–1258 (2011).
18 Waters JC. Accuracy and precision in quantitative fluorescence microscopy. J. Cell Biol. 185(7), 1135–1148 (2009).
19 Cho EC, Zhang Q, Xia Y. The effect of sedimentation and diffusion on cellular uptake of gold nanoparticles. Nat. Nano. 6(6), 385–391 (2011).
20 Muller M. Introduction to Confocal Fluorescence Microscopy (2nd Edition). SPIE Press, WA, USA (2006).
21 Cauda V, Argyo C, Bein T. Impact of different PEGylation patterns on the longterm biostability of colloidal mesoporous silica nanoparticles. J. Mater. Chem. 20(39), 8693–8699 (2010).
22 Sauer AM, De Bruin KG, Ruthardt N, Mykhaylyk O, Plank C, Brauchle C. Dynamics of magnetic lipoplexes studied by single particle tracking in living cells. J. Control. Release 137(2), 136–145 (2009).
23 Wildanger D, Rittweger E, Kastrup L, Hell SW. STED microscopy with a supercontinuum laser source. Opt. Express 16(13), 9614–9621 (2008).
24 de Bruin K, Ruthardt N, von Gersdorff K et al. Cellular dynamics of EGF receptortargeted synthetic viruses. Mol. Ther. 15(7), 1297–1305 (2007).
25 Hell SW. Microscopy and its focal switch. Nat. Methods 6(1), 24–32 (2009).
26 Nakajima M, Takeda M, Kobayashi M, Suzuki S, Ohuchi N. Nanosized fluorescent particles as new tracers for sentinel node
detection: experimental model for decision of appropriate size and wavelength. Cancer Sci. 96(6), 353–356 (2005).
�n Websites101 Scientific Committee on Emerging and
NewlyIdentified Health Risks (SCENIHR). Risk assessment of products of nanotechnologies. European Commission, Brussels, Belgium (2009). http://ec.europa.eu/health/ph_risk/committees/04_scenihr/docs/scenihr_o_023.pdf
102 ImageJ. http://rsbweb.nih.gov/ij
103 ImageJ Documentation Wiki. http://imagejdocu.tudor.lu/doku.php?id=macro:particle_in_cell3d
104 3D Object Counter. http://rsbweb.nih.gov/ij/plugins/track/objects.html
105 ImageJ 3D Viewer. http://rsbweb.nih.gov/ij/plugins/3dviewer/
106 Gnuplot Version 4.6. www.gnuplot.info