
{A Extended essay cover - SPHS Devil Physics --The Baddest...
27
{A International Baccalaureate Extended essay cover j Candidates must complete this page and then give this cover and thetr final verston of the extended essay to their supervtsor. Cand rd ate session number Candidate name School number School name I I ----' I Year 2012 Examination session (May or fVIAy Diploma Programme subject in which this extended essay is registered : ___ PH--'Y'-5_:.t_-_c_s_H_t.... ___ _ (For an extended essay in the area of languages, state the language and whether it is group 1 or group 2.) Title of the extended essay· W HlC H S T(2.uc.. liAR E S.IL-:LCOIV MOST_l(-F£{ TWE 50LA1< ( SL-L--? --------------- ---------- Candidate's declaration Th1s declaration must be signed by the candidate: otherwise a grade may not be issued. The extended essay I am submitting is my own work (apart from guidance allowed by the International Baccalaureate). I have acknowledged each use of the words, graphics or ideas of another person, whether written, oral or visual I am aware that the word limit for all extended essays is 4000 words and that examiners are not required to read beyond this limit. This is the final version of my extended essay Candidate's signature Date: 15/02112 International Baccalaureate, Peterson House Malthouse Avenue, Cardiff Gate, Cardiff, Wales, CF23 8GL, Umted Kingdom ·-
Transcript of {A Extended essay cover - SPHS Devil Physics --The Baddest...

{A International ~ Baccalaureate
Extended essay cover
j
Candidates must complete this page and then give this cover and thetr final verston of the extended essay to their supervtsor.
Candrdate session number
Candidate name
School number
School name I I
----'
I Year 2012 Examination session (May or Novemb~j__ fVIAy
Diploma Programme subject in which this extended essay is registered: ___ PH--'Y'-5_:.t_-_c_s_H_t.... ___ _
(For an extended essay in the area of languages, state the language and whether it is group 1 or group 2.)
Title of the extended essay· W HlC H S T(2.uc.. liAR E 0~ S.IL-:LCOIV
MOST_l(-F£{ TWE 50LA1< ( SL-L--?
--------------- ----------
Candidate's declaration
Th1s declaration must be signed by the candidate: otherwise a grade may not be issued.
The extended essay I am submitting is my own work (apart from guidance allowed by the International Baccalaureate).
I have acknowledged each use of the words, graphics or ideas of another person, whether written, oral or visual
I am aware that the word limit for all extended essays is 4000 words and that examiners are not required to read beyond this limit.
This is the final version of my extended essay
Candidate's signature Date: 15/02112
International Baccalaureate, Peterson House Malthouse Avenue, Cardiff Gate, Cardiff, Wales, CF23 8GL, Umted Kingdom
· -

Supervisor's report and declaration
The supervisor must complete this report, sign the declaration and then give the final version of the extended essay, with this cover attached, to the Diploma Programme coordinator.
Name of supervisor (CAPITAL letters)
Please comment, as appropriate, on the candidate 's performance, the context in wh1ch the candidate undertook the research for the extended essay, any difficulties encountered and how these were overcome (see page 13 of the extended essay guide). The concluding interview (viva voce) may provide useful information. These comments can help the examiner award a level for criterion K (holistic judgment). Do not comment on any adverse personal circumstances tl?at may have affected the candidate. If the amount of t1me spent with the candidate was zero, you must explain this, in particular how it was then possible to authenticate the essay as the candidate 's own work. You may attach an additional sheet if there is insufficient space here.
is an intelligent and hardworking student.He is sound in his concepts and is highly innovative in applying those concepts.He is highly motivated towards applying his knowledge in Physics to everyday life.His research topic deals with effective use of solar cells.Its relevance in a world of dwindling fossi l fue l reserves is immense.He has skilfully made the solar cells suitable for his experiment as elaborated in the procedure. His data collection technique is systematic and exhaustive ;encompassing all relevant variables.He has done in depth analysis of the data procured.His presentation of ideas is lucid ,logical and coherent.He has presented a reasoned and convincing argument in relation to his research question. Whi le analysing the data,he came up with certain unresolved questions that provides scope for fUJther research.
This declaration must be signed by the supervisor; otherwise a grade may not be issued
I have read the final version of the extended essay that will be submitted to the examiner.
To the best of my knywledge, the extended essay is the authentic work of the candidate.
I spent 0 hours with the candidate d1scussmg the progress of the extended essay.
Supervisor's signature: -----l Date: _ ___c_J_S'----'-D=;(_..J_o....:../->..{ _ _

Assessment form (for examiner use only)
Candidate session number
Achievement level
Criteria Examiner 1 maximum Examiner 2 maximum Examiner 3
A research question [£l 2 L2J 2 L l B Introduction UJ 2 lTJ 2 [ ] c mvestigat1on [1J 4 [ } J 4 l J
0 knowledge and understanding ~ 4 liJ 4 u E reasoned argument []J 4 l :U 4 [ -J F analysis and evaluation []] 4 Q 4 [ 1 G use of subject language ~ 4 [ i] 4 l 1 H conclusion [2] 2 [ iJ 2 l l I formal presentation [ s I 4 ~ 4 l 1 J abstract [2 ' 2 L~ 2 n K holistic judgment ~ 4 [.3] 4 [ 1
Total out of 36 ~ ~ D
e of examiner 1 Examiner number· 'ITAL letters)
e of examiner 2: Examiner number: 'IT AL letters)
e of examiner 3: Examiner number· ______ _ 'ITAL letters)
IB Cardiff use only: B:
IB Cardiff use only: A: Date:

Candidate Name: Candidate Number:
International Baccalaureate Diploma Program
Extended Essay
Subject: Physics
r
Research Question: "Which structure of silicon
makes the most effective solar cell?"
Candidate Name:
Candidate Number:
School Code:
Session: May 2012
Supervisor:
Word Count: 3985
1

Candidate Name: Candidate Number:
Abstract: Word count: 298
The aim of t his Extended Essay is to examine which structure of silicon makes the best solar cell. Three
kinds were used - amorphous, moncrystalline, and polycrystalline. The incident wavelength of light was
altered by color filters of different wavelengths. The voltage and current generated by the amorphous solar
ce ll were measured for different wavelengths of incident light. The experiment was repeated for the other
so lar cells.
Analysis of the data resu lted in severa l conclusions:
1. The output of the amorphous cell varies with frequency, suggesting t hat it has a large bandgap.
2. The output of the polycrystall ine cell varies with intensity at higher wavelengths, and with
frequency at lower wavelengths, suggesting a small bandgap.
3. The output of the monocrystalline cell varies in between the other two - it has a medium-sized
bandgap, varies somewhat with intensity at higher wavelengths, and somewhat with frequency at ~~ lower wavelengths. ?l V "\ •. • ,..
These conclusions answered the research question, "Which structure of si licon makes t he most effective
solar cell?": \ -' ,. ..... ~ \ ~ • I
~~'( ...,. ~ .. ~ .... £ There is no single best solar cell, but the usage condit ions determine a cell's effectiveness.
The amorphous cell is ch!ap and its output varies little with intensity, but does not produce much po~er. @ Thus, it suitable for low intensity environments (like indoors), for use in small devices like calculators and ~..( watches. ., Q.f;.
It' , •
The output of the polycrystalline cell varies main ly with intensity, so is most useful for outdoor uses, li ke
deserts. It also varies with frequency at low wavelengths, so is useful at dawn and dusk (bluish light), as well
as midday. It produces much more power, so is suitable for large-sca le production of energy.
The output of the monocrystalline cell is more than that of the amorphous ce ll, but not enough to offset its
prohibitive cost. It is most su itable in small sca les, or in processors.
2
r ·':\ '-..,. I .·

Candidate Name: Candidate Number:
Contents /
1. Introduction ............ ....... .. ................. .. ............................................ ............... ............. ............. ......... ...... ............ ............................ ... .... .............. . 4
1.1 Background of my essay: ..... ......................................... .... ........ ............... ... ........ ...... ... .... .. ...... ... ...... ........................ ........ ..................... ............... 4
1.2 Theory of solar cells: ........................... ...... .. ..... ................. ...... ........ .......... ....... ..... ..... .............. ......... .. ................... .... .......................... ............ ..... 4
2. Selection and Control of Variables: ........... ...... .......................... ................. ............ ...... ... ........ .................. ........... ..... ............ ........... ............... ..... . 5
2.1 1ndependent Variable: ............................. ....... ........ .............................. .... .. .... ................................................................................................. ..... 5
2.2 Dependent Variable: .............. .............. .... ........ ..................................................... .......... ... .... ........ ..... ..... ............ ..... ................. ................ ...... ..... 5
2.3 Controlled Variables: .................................. ................ ....... .. ......... ............................ ...... .................................... ...... .. .......... ................. .... ...... ..... 5
3. Preparing for the experiment: ........... ....... ....... ............ ...... .......................................... ............ .... ...... ........ ..... ..... ... ......... .. ..... .... .................... .. ..... 6
3.1 Apparatus required to equalise solar cells: ........................ .............................. ........... ..... .. ...... ......... .................................................................... 6
3.2 Procedure for equalising the solar cells: .......... .............................. ............................................................................ ....... ................ .......... ......... . 6
3.3 Apparatus required to construct circuit and conduct experiment: ............................................. .................................... ................. ..................... 6
3.4 Circuit Diagram: .......................... ......... ..... ............ ...... ................................................................................................................................ .......... 6
3.5 Solar cells used in experiment: .. ................ ................. ......... .... ........... ............ ....................................... ........ .... ... ................................................ 7
3.5.1 Monocrystalline ........................................ ...... ............. ..... ..... .. ...................... .................. ..... ............................ ........ ... ...... .. ......................... 7
J 3.5.2 Polycrystalline ........................................ .. ...... ....... ................ .. .......... ..... .. ............... .. ....................... ........................ ......... .......... .......... ....... 7
3.5.3 Amorphous ............. ............ ...... ... .... ......... ...... .......................................... ... ........... ................... ................ .. ..... ........ .......... .... ........... ......... .. 7
4. Data Collection Procedure: ... ............... ........... .. ................... .... .. ........... ..... ..... .. ..... ...... ........... .......... .................................................................... 8
4.1 Raw Data Tables: ..... .................. ....... .. ..... ....... .. .... ........................................... ..... ............................. ................. .............. ......... .......... .......... ....... 8
4.1.1 Amorphous ....... ...... ........... , ............. ......... .................. ..... ................. ........ ............... .. ...... ...... ......... ............................................. .......... ...... . 8
4.1.2 Polycrystalline ................... ......... ..... .................... ............ ..... ... ............... .. ............... ....... ................................................................... .... .. .... . 8
4.1.3 Monocrysta lline ..... ...... .................... .......................... .............................................. .. ........... ............................ .. ...... .......... .......................... 9
5. Data Analysis: ............................................................................. ...... ..... .... ...... .. ........... .... .. ...... ........... ...... .......... ....... ................ .. ................ ... .... 10
5.1 Data Comparison (adjusted for intensity): ...... .. ...... ..... ............ ....... ............................. ............ .... ..... .. ...... ..... ..... ..... ................................. .......... 10
5.1.1 Data Tables (adjusted for intensity) ....... .. ...... ..... ..... ............ ... .... ........... .. ............... ........ ......... ...... .............. .... .. .......................... ..... ......... 11
5.1.1.1 Amorphous (wrt 60000 lx) ..... .............. ............. ........................................................... .... ........... ... .... ........ ...... .... ..... ............ .... .... ..... 11
5.1.1.2 Polycrystalline (wrt 60000 lx) ........ ......... ................. .. ................................ .. .... .. ... .. ...... ...... ..... .... ...... ....... ........ ........... ....................... 11
5.1.1.3 Monocrystalline (wrt 60000 lx) .............................. ............. ........... .. .... ..... ............. ..... ....... .... ............. ..... .. ................................... ..... 12
5.2 Data Comparison (adjusted for intensity, spect ral irradiance) ............ ............ ........... ...... , ................. ............ .......... .. ..... ........... .. ....................... 17
5.2.1 Data Tables (adjusted for intensity, spectral irradiance) .......................... ................ ..... ...... .. ... .. ........................ ..... ................................... 18
5.2.1.1 Amorphous (wrt 600001x, 1.1Wm.2nm.1) .... ................... .. ........... .... .. .......... ..... .. ...... ......... . ....... .... ....... .... . .. ..... ................................... 18
5.2.1.2 Polycrystalline (wrt 600001x, 1.1Wm'2nm.1) ................................. . ....................... . . ....... ... .. .......... . ........... .. ................ . .. . ... . ........... ..... 18
5.2.1.3 Monocrystalline (wrt 600001x, 1.1 Wm.2nm.1) . . . .................................................................... . ........... . ..... . ...... . .... . ..... ............... ... ....... 18
6. Evaluation ..... ....... ...... ... ......... ............ ............ .. ....................... .. ................. ..... .......... ....... ................. ...... ....... ....... ..................... .. .............. ......... 22
6.1 Errors: ........................ ............................... ................. .. ............................. .......... ...... .. ........... ........ ............. .............. .......................................... 22
7, Conclusion .... ............................................. ...................................... ......... ............. .... .. ........................ .... ........... .. ............. ......................... ......... 23
7.1 Which structure of silicon makes the most effective solar cell? .................................................................. ...... .. .... .. ................................ .. ....... 23
7.2 Scope of research: ... ................... .................................................................................................................. ........... .. ....... ..... ............... .......... .... 23
8. Bibliography ............................... ........ ....... ........ .......... ....... ....................................... ...... ... ...... ..... .... .. ......... ....... ...... .......................................... 24 /
3

Candidate Name: Candidate Number:
1. Introduction · ~
1.1 Background of my essay: l ""~ ') I have always been interested in solar cells, as I think they wi ll be very relevant in the near future. Solar ~
power is a renewable energy source available in abundance, and with oil reserves running out, I think we
need to f ind out which solar cell is the best, and for what application. I think that this extended essay was a
very good opportunity to clear this question in a more scientific manner. My experiment is designed to
explore the effectiveness of each kind of solar cell in different situations. If we find each solar cell's
P.f(tormance at different points along the electromagnetic spectrum, :;;; can determine which kind would
• I / 6e best for different applications. This led to my research question: .... L- ... ......,.t,_j...._ "'"~·~ '· , '\.1. - - -) "
' . .......
,.. "Which structure of silicon makes the most effective solar cell?" o\.J~ L. ~· lqJ·vht .A tJtL ('· J) .
•I
< "-\\ '-~ t "'"\. ~- ~ 0 t•t/4~{11.(. 1.2 Theory of solar cells:.1 u....~ 1 ~ ~~ ~ ~ tla "-b .. du4'...c! · 0 Solar cells are semiconductor devices which convert solar energy to electrical energy. They are p-n
junctions. The light is incident on the p-surface of the solar cell, which is made very thin to allow photons to
./ reach the underlying p-n junction. If the energy of the incident photons is greater than or equal to that of
.I the band gap of the materia l, the photons cause the breakage of covalent bonds, form ing free electron-hole
pairs. The electrons move across the junction to the n-side and the holes cross to the p-side, resulting in a
potential difference across the ends of the cell. Metal contacts connect the cell to the external circuit.
The typical V-1 characteristics of a solar cell are shown below:
60
50
1 40 u
0 0.2 0.4
r Output VOltage 1 <;-? s fig. 6.9
~\) I \ t~....'-.'- \ ~ ---- . ® (S)
\~ ~"""' \J\IVWV~ ~ ~\..~~ _N... ~"" WI ~ 'tf--"-~
<y'-"'~ ~ ~~
"'-'~\,.(.J.__ ~ ~ ~ ~ .. ,.:~..t .N.. --· . ~.M._.j,.,~ ..... ~\,.c:. • 'f.. otJ'\.v 1.\, ) ~ • J p
~ ..... ~ .. c..~cl..t. '\ eM~.~.. "V ~ ~ '(1 \J c. c.~ ; i. --¥-.._Jr. -\. ~ '\ ~ ~ :y ~ "'-'\,~ • . •
-\."' ~ : _.. - ·
l(2.
~';,"'-• w.,....,l./l.._, ~
~~ ..... ~ ~v;~ ! .. .4..........:...""' <A." ) ~
a c ~~~ .M..~~ 1\~ '-'< J~ ~ ~
1 Theraja, B.L. (2001) Basic Electronics Solid State (pp. 68 - 69). New Delhi, S. Chand & Company Ltd . ./
4

. ~ . ...
Candidate Name Cand idate Number:
2. Selection and Control of Variables:
.J' . ~ -~ .! ~~
0 ,f J "' 2.11ndependent Variable: J J X../~~.,"
1. Wavelength of incident light- the readings are taken with different color f ilters. . } J J' ~ '.. 2. Structure of silicon so lar cell - the experiment is repeated for each of t he cells. ~ l J .)r J I
¥'. ~vv" · 'V /! i'/tCil 2.2 Dependent Variable: " -...J! ~ V/
1. Voltage generated by solar cell .,).f / .j' (2) ~ 2. Current generated by solar cell _.,.. / " " " )
Each of t he above quantities are measured with each oft he color fi lters with each of the so lar cells.
2.3 Controlled Variables: M :\"""......C.~ -\.vl'""'- ~""" ........ ~._""-. o.J.... ~
\.4\-~ "\ ~~ .. A...cM.. --~~ .....:... l -t,. ').._ ~ 1. Color of sunlight- At sunrise and sunset, the color of sunlight changes. All of the readings are taken
at midday, so the sun moves very little whi le the read ings are taken. Assuming sufficient speed in
taking the readings, the co lor of sunlight can be taken as constant.
2. Angle of incidence- For the same reason as previous, the sun moves very little. Thus, t he angle can ·~ ! ~tL , , /0 ') 1?\)'l
be taken to be 90° for all read ings. -~ LU<t6 C..v.fitJ, owt ctk a.. J:F LV ""fJIJ(, · ~ • 1.> ~ 3. Temperature - Because t he readings are all taken within a short time of each other at midday (on h~!oJ-, LJo,
one day), there is very little temperature variation. Thus, the temperature can be taken as constant. ~~( 4. Intensity of incident light- The light intensity meter measures t he intensity of the incident light at (j
the t ime of measuring voltage and current. After co llecting the intensity data, the data was
adjusted to simulate constant intensity.
5. Surface area of solar cells- The solar ce lls are covered with duct tape in order to leave a specif ic
surface area open to incident light.
6. Structure of silicon solar cell- While the wavelength of the incident light is being varied, t he so lar
cells are not switched.
7. Wavelength of incident light- The wavelengths let through by the fi lters remain constant, even
when the structure of the solar cell changes.
7
5

.• '
Candidate Name: Candidate Number:
3. Preparing for the experiment: bought 1 solar cell of each structure, but their sizes were different. In order to equal ize them, this
procedure is required.
3.1 Apparatus required for equalising solar cells: 1. Sheet of paper cut to desired size
2. 1 amorphous silicon solar ce ll ~ ·"" r~ 3. 1 monocrystalline solar cell
4. 1 polycrystalline solar cel l
5. 1 roll of black, opaque duct tape
6. Scissors
7. Ruler
8. Pencil
3.2 Procedure for equalising solar cells: 1. Measure paper to a specific size (I chose 3 x 2.3cm arbitrarily) and mark w ith pencil
2. Cut along pencil line, take piece of paper
3. Place paper on amorphous solar cell.
4. Put duct tape along its edges in order to cover the rest of solar cel l.
'J.
~/~"; tot<'»-~'!'
I' ,r ~'<~ t r<,Jc ,. ~,.,
5. Cover the outer parts of the panel with additional duct tape, until the paper is the on ly part not 'I' covered. ., @
6. Remove the paper, leaving the amorphous solar cell w ith only a specifica lly-sized area open.
7. Repeat for monocrystal line, po lycrystalline solar cells.
3.3 Apparatus required to construct circuit and conduct experiment:
1. 2 multimeters
2. 2 crocodile clips
3. connection wires
4. amorphous, monocrysta ll ine, and polycrystal line silicon solar cells
5. 11ightmeter ok...L.....::. '--. ••
3.4 Circuit Diagram:
/
Sma ll load

:1
" .,
Candidate Name: Candidate Number:
3.5 Solar cells used in experiment: For this experiment, I was only ab le to acquire silicon-based solar cel ls. However, since silicon cells are very
widespread, I think that the experiment is still relevant even with only si licon cells. I have explored
efficiencies of three structures of si licon: monocrystalline, polycrysta lline, and amorphous silicon.
3.5.1 Monocrystalline
3.5.2 Polycrystalline
r
3.5.3 Amorphous
Monocrystalline cells are made of a single crysta l, and polycrystalline cells of multiple crystals. Amorphous
cells do not have a crystalline structure.
7
/
\)'
fA\r (\ 'lc:# ~/ ~
Candidate Name:
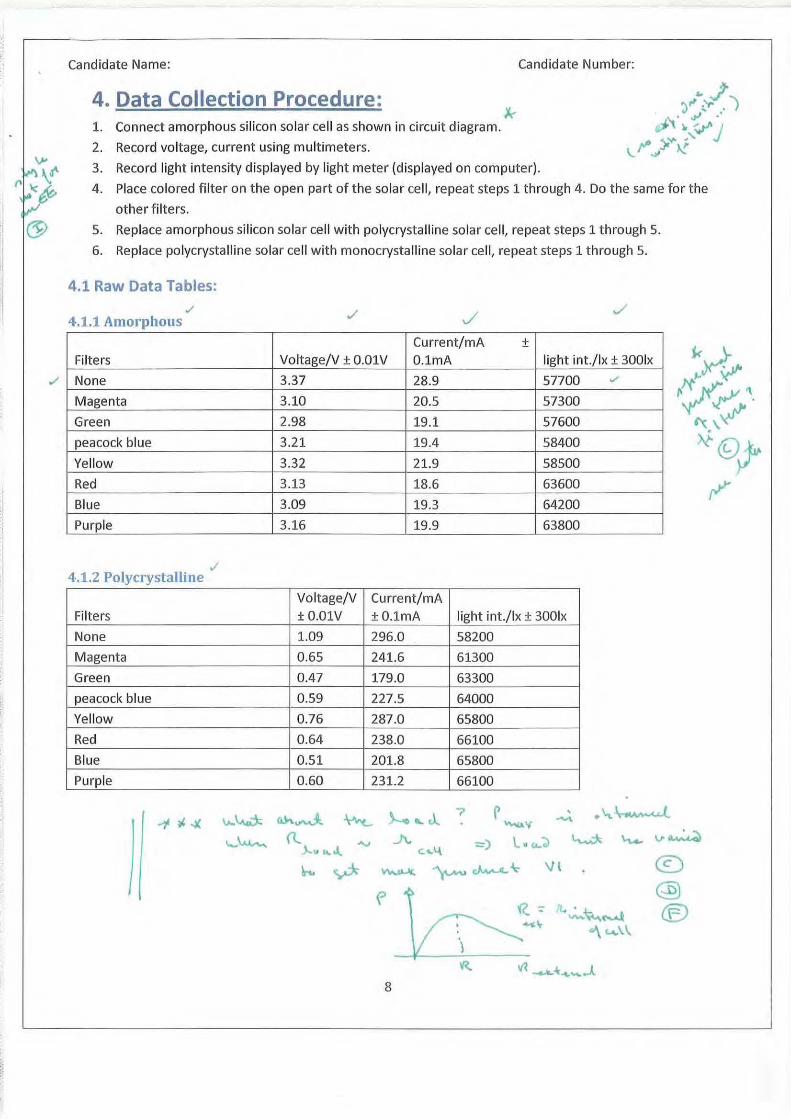
4. Data Collection Procedure: 1.
2.
k Connect amorphous silicon solar cell as shown in circuit diagram.
Record vo ltage, current using multimeters.
Candidate Number:
3. Record light intensity displayed by light meter (displayed on computer).
4.
5 .
6.
Place colored filter on the open part of the solar ce ll, repeat steps 1 through 4. Do the same for the
other filters.
Replace amorphous si licon solar cell with polycrystalline solar cell, repeat steps 1 through 5.
Replace polycrystalline solar cell with monocrystalline solar cell, repeat steps 1 through 5.
4.1 Raw Data Tables:
./ 4.1.1 Amorphous
Filters
./
Voltage/V ± 0.01 V
J Current/rnA ± 0.1mA light int./lx ± 300ix
./ None 3.37 28.9 57700 .,/ ~* ~~~~. Magenta
Green
peacock blue
Yellow
Red
Blue
Purple
./ 4.1.2 Polycrystalline
Filters
None
Magenta
Green
peacock blue
Yellow
Red
Blue
Purple
I
3.10
2.98
3.21
3.32
3.13
3.09
3.16
Voltage/V ± 0.01V
1.09
0.65
0.47
0.59
0.76
0.64
0.51
0.60
20.5 57300
19.1 57600 ~'~ 19.4 58400 *<Dt 21.9 58500
18.6 63600 rJ" 19.3 64200
19.9 63800
Current/rnA ±0.1mA light int./lx ± 3001x
296.0 58200
241.6 61300
179.0 63300
227.5 64000
287.0 65800
238.0 66100
201.8 65800
231.2 66100
8

Candidate Name: Candidate Number:
4 1 3 Monocrystalline . .
Voltage/V Current/rnA Filters + 0.01V +0.1mA light int./lx ± 3001x
None 2.17 108.0 66900
Magenta 1.69 74.9 66800
Green 1.47 60.3 69000
peacock blue 1.55 67.6 69100
Yellow 1.75 80.2 69400
Red 1.63 74.2 69500
Blue 1.52 65.6 69000
Purple 1.60 72.1 68700
9

Candidat e Name: Candidate Number:
5. Data Analysis: 5.1 Data Comparison (adjusted for intensity):
Paton Hawksley Education Limited • www.patonbawksley.c::o.uk -H-\
~
Diffraction Gratings and Spectroscopes ?I ~oO Equipment for Education and Science , t -1
~~ Rockhill Laborntoric:s 59 Wcllsway Keynshrun
PRIMARY RED
PRIMARY GREEN
PRIMARY BLUE
SECONDARY YELLOW
SECONDARY MAGENTA
PURPLE -rc~ : ·-1-l 111 986lJCH
l Sri.stol DS31 I PG United Kingdom
)00 tOO tot tot .. tOO 1W ...... _,. __ ,,, -;i JOOeooaoo .. *'"
w•"ut .. ou• .. ..,.o.wuau
l(IQ .,. 100 t(JQ ..., ••
t'ltAW"(\l .. 0t14 llf&,NQMrtAn
-~1 IOO.OOMO.OOJQ)WIO
WA"' fU .. tttttAI'IQWfl._t t
The wavelengths of t he f ilters are described by this paper f rom t heir manufacturer. This data is used to
order the filters in terms of increasing wavelength (except for magenta and yellow, as t hey allow mult iple
10

r
Candidate Name: Candidate Number:
wavelengths, and cannot be sorted).
The values of voltage and current cannot be compared when the incident intensities t hey re late to are
different. To co rrect t his, I have taken an arbitrary value {60000lx) and adjusted all t he values to account for . >-.' 1..
t he change: " "'} ; (;r v- ~ / ·•
~~ ~~~ / ·'f-v .y /
@
Adjusted Amorphous Voltagenone = 3.37 * {60000/57700) = 3.50V
Adjusted Amorphous Currentnone = 28.9 * {60000/ 57700) = 30.1mA
From these adjusted values, I have calculated the power generated by the ce lls, through the formula P =
VI:
~ .,.v, J..) Adjusted Amorphous Power none= 3.50 * 30.1 = 0.11W - \.. ~,... 'J.-vl L
I repeated these actions for all values of voltage, current and power, for all t hree sol: r cells. ~ 5.1.1 Data Tables (adjusted for intensity) ~ 5.1.1.1 Amorphous (wrt 60000/x) /
Power/W Current/ rnA
/
Filters {wavelength, % ± ± ./
transmitted) I Voltage/V ± 0.01 V 0.1mA light int./lx ± 300lx 0.001W
None ,., 3.50 .., 30.1 ..... 60000 0.105
magenta {400, 17% + 670, 90%) 3.25 21.5 60000 0.070
yellow {320, 7% + 600, 90%) 3.40 22.5 60000 0.076
purple {410, 40%) 2.97 _, 18.7 "" 60000 0.056 ./
blue {420, 37%) 2.89 18.0 60000 0.052
peacock blue {500, 75%) 3.29 19.9 60000 0.066
green {525, 37%) 3.10 19.9 60000 0.062
red {650, 75%) 2.95 17.5 60000 0.052 ~
5.1.1.2 Polycrystallitte (wrt 60000/x) Power/W
Voltage/V Current/ rnA ± Filters {wave length, %transmitted) ± 0.01V ± 0.1mA light int./lx ± 300lx 0.001W
None 1.12 305.2 60000 0.341
magenta {400, 17% + 670, 90%) 0.64 236.5 60000 0.151
yellow {320, 7% + 600, 90%) 0.69 261.7 60000 0.182
purple {410, 40%) 0.55 209.9 60000 0.115
blue {420, 37%) 0.47 184.0 60000 0.086
peacock blue {500, 75%) 0.55 213.3 60000 0.118
green {525, 37%) 0.44 169.7 60000 0.075
red {650, 75%) 0.58 216.0 60000 0.125
t. a\-o. '\~
11
( ·~\\v... c\.,t.A.'-'-~ ~V\ ~..t. I) 0 \.Of\. " ~ c.'"'"""'~ -~V\ ~ ~ '-~lo'AJ
c..~ ~ J~ ~ "'\~ ~ ~"' " ~~I: ~ ~""""-~ ~ ~ .k._,\..'\-~
~ .l...Jrv-...) © ®
~ ~ v-..........~ ~ \U'"-'\, "1

Candidate Name:
5.1.1.3 Monocrystalline (wrt 60000/x)
Voltage/V Filters (wavelength,% transmitted) ± 0.01V
None 1.95
magenta (400, 17% + 670, 90%) 1.52
yellow (320, 7% + 600, 90%) 1.51
purple (410, 40%) 1.40
blue (420, 37%) 1.32
peacock blue (500, 75%) 1.35
green (525, 37%) 1.28
red (650, 75%) 1.41
Current/rnA ± 0.1mA
96.9
67.3
69.3
63.0
57.0
58.7
52.4
64.1
Candidate Number:
Power/W ±
light int./lx ± 300ix 0.001W
60000 0.189
60000 0.102
60000 0.105
60000 0.088
60000 0.075
60000 0.079
60000 0.067
60000 0.090 © ®
{'- ""'-"< \. -"""1 ~ r-..., \M,..~
\-~ ~\..llk.o.l..(.. ~
.... ~~ ~ L~~ ~ ')... ""'"-. - •
~ ~ u~ . -., ~ "1\ ... '\ .... ku.:~ ... " ""~ ,...... ..... ~~ ...... ; .
(.A.t..A..~ ..... \ f..~~~-~ ..-\..~.)... ~ (... ~ ~ ~ ~ evv~...k
.. ....! \ \.\..v .., \v.v ~ A ~c.l. "-" ~ cr.-
Y.\' \_ -:;t( ) o \o\ \.. l '> \. c..~~"--'..~') .
12

l
l I
I
, .
Candidate Name: @ Candidate Number:
0.375 .-----,---- ,----=--r----=----.-:::-----:-----::---- ------------;---
Power Cqmparison 0.35 +--..:----;------',----++ ----'"-----,----·;- ---- +-----i
0.325
0.3 +---.~~--~-----r-----------t~---:----T---~---
0.275 t--:-:T--=\~=-=f:=-=-:=-:::j:==:=-i:----;t:----~--:r-----;:----
~ 0.25 t ::;; 0.225 t---=:t==----T-~==:=;=--:-----±-----'t----::------r------~ o.2 t---=:t==:--'r~-=----=~---------"--~:..----t;:-------;:-----+----' w t ~ 0.175 -J=~~~=--~b:~~~~=--==:..._-4----t~---~------:;;;;;;;;;;.;;;;;;:AAimFnBiorFE·pil'ihDiou_s_ ~ 0.15 -l===!=~~__J!2~==i~~~--=-~----~~--_j------~---±r ~Po~lyc:-:c:=:ry-:::s~tamll-:-::m:-::--e /?. 0.125 +-----=:!.==:::~~b~~~~~~~-----:.~-~--~:-----;-~----r;~~;:;r:r.;~~
0.1 t-:a~~~===~=r::s§;;;;z-t~~~~~:........:~""'-------:-r=-----;--
o.o75 t-----=:t==--==~;;;;;;;;iiiii!!'!~~~;::-::---r---="'-----"'--=:e..-os::~~- -=:::....._~
0.05 +--J:=-==--==~=-=-=:t=---=~~~!!!!!!-.~~::::+==::::;::~~---0.025 +---1-------:-----+-----c----~;-----'-----r------
o +----.------,no---.~---r~--~~--~---~---. " . . . . none magenta yellow (320,purple (410, blue (420, peacock green (5L5, 'red (6~0,
(400, 17% + 7% + 6.Q.O, 40%} .... 37%} blue (500, 37%) 75%) ./ §Z.Q, 90%) 90%) 75%)
., ~ .:::? Color of Filter (transmitted wavelength (nm), %transmitted) . et>
From this graph, it can be seen that the polycrystalline solar ce ll generates much more power (thrice that of
amorphous without a f ilter). However, with this high output also comes a very large variance in power
output with the color of the incident light. This also applies somewhat to the monocrystalline solar cell, in
that it has less output, but also varies much less. For example, the output with magenta and yellow filters is
almost identical, as opposed to those of the polycrystalline solar cell, which varies by .03W. The amorphous
so lar cell is always the weakest in this data. However, it also possesses greater stabil ity. Its output varies _._..-
little compared to the other cells. 7
(f) From the graph, the output of the polycrysta lline cell is heavily dependent on the intensity of the incident
'1 light. For example, its output vacillates in the last four data points. The troughs coincide with low % -transmitted filters (blue, green), and the peaks coincide with high %transmitted filters (peacock blue, red).
Intensity is the number of photons emitted, and each photon can only interact with one electron. Thus, the
polycrystalline cell is more powerful because more electrons are able to jump across the bandgap to the , · •
conduction band. This indicates that the polycrystalline silicon bandgap will be the lowest of the three. If
this is true, then the voltage should be low (each electron has little energy), but the current should be high
(many electrons). We can verify this in the next graphs.
The power output of the other cells varies less with intensity, which suggests they have a large bandgap
(especially in the case of the amorphous cell) . Only some high-energy photons are able to excite the
electrons, so the addition of more photons (higher intensity) has little effect. This might be why an
13
® ..:... ~ o wM. ~ ~.::. ~.v... c.vt.. f\.v.~~w ~ Qq__ .. (\~ ~~~ \.o.c · v..~ '-""'-~ -\ ~ ~ ~ ~v.>N'>c,. =-) ~ A U£"\: .:. ~~ 1- -~ lA... ~ r... i.~t..~ "'\ '>.... .. o-. ~ \'\J ~ ..,_,"\JM,t.lA ~ ~ ~

.I I
./
Candidate Name: Candidate Number:
amorphous solar cell is used in my ca lculator - in low light conditions, its output will not fall by as much as a
polycrystalline cell. According to t his, the amorphous ce ll should have the highest voltage (energetic
electrons) but the lowest current (not many current-carrying electrons). We can also verify this in the next
graphs.
The power output of solar cells appears to vary upwards and downwards at t he same places, except for in
the case of red light. For red light, the amorphous solar ce ll decreases its output, while t he other two
increase output. This suggests t hat for the most part, efficiencies at specific wavelengths are determined
mainly by the material used, rather than its structure.
3.75
3.5
3.25
3
2.75
> 2.5 -~ 2.25 -<J 11) .... 2 Q) c & 1.75 Q) llO 1.5 11)
-<J
0 > 1.25
1
0.75 J
0.5 f. I
0.25 ~
0 none magenta yellow {320,purple {410, blue {420, peacock green {525, red {650,
(400, 17% + 7% + 600, 40%) 37%) blue (500, 37%) 75%)
7 670, 90%) 90%) 75%)
Color of Filter (transmitted wavelength (nm), %transmitted)
~ This comparison confirm s the idea held before - the amorphous silicon has very high voltage, indicating
that the average energy of its electrons is high. This supports the idea of a very high bandgap; lower energy
photons cannot excite the electrons enough to cross the bandgap. 7
However, the polycrystalline cell sti ll varies a lot compared to monocrystalline, despite its lower output.
This validates the previous conclusion: the bandgap in polycrystalline silicon is lower, so more electrons
jump across under sunlight and their average energy is lower. Following this, the current should be
maximum for the polycrystalline ce ll. The voltage is highly dependent on the intensity, as its peaks are
where the %transmitted is highest. As the voltage is low, this confirms that the polycrysta lline cell's high
power output is due to having low energy electrons, but a large amount of them. ./
14

/
Candidate Name: Candidate Number:
This can expla in why the amorphous cell is used in calculators - it shows less variation w ith light intensity,
so remains somewhat effective at low intensities. On the other hand, polycrystalline cells would be
rendered ineffective by a low-light situation like a study hall, classroom, etc.
In addition, the relatively high voltages of the monocrystalline and amorphous silicon so lar ce lls would
mean that their current would be lower - reducing power loss when transmitted over large dis~ces (by
the equation P1oss = 12R). This, however, would probably only make a difference when transmitting power
over very large distances - large enough to nullify the difference in power between the polycrystalline cells
and the others. ./
~ -
325
300
275
250
~ 200 +---~------~------~------~~~~--~--~~-L~~------~~~. Q) -~ 175 Q) c:: Q)
~ 150 +---~------~------~------~------~------~-----~--~~~rrm~--c:: ~ 125 +-----------~------~------~----------------7---------P&I :::s u
100
none
7
magenta yellow {320, purple {410, blue (420, {400, 17% + 7% + 600, 40%) 37%) 670, 90%) 90%)
peacock blue (500,
75%)
green (525, red (650, 37%) 75%)
Color of Filter (transmitted wavelength (nm),% transmitted)
As suggested by the voltage comparison, the polycrystalline cell has the highest current, and it is heavily
dependent upon the intensity(% transmitted) of the incident light. The bandgap must be lower to allow for
this. Thus, this agrees with the previous graph, in that the determining factor is the number of photons.
The other two have much lower current outputs. The amorphous cell's output has a slight downward curve
with increasing wavelength. This confirms the idea of the high bandgap again; the energy transmitted
depends on the average energy of the photons being high. According to this, we would expect to see large
variations in the voltage comparison, varying more with regards to wavelength than with intensity. Sure
enough, there are large variations, but they have little correlation with the intensities of the incoming light.
For example, the amorphous panel's output for green light (37%) is higher than that of red light (75%).
15
../

Candidate Name: Candidate Number:
Thus, the amorphous and (to a lesser extent) monocrystalline cells are not intensity capped, but rather
frequency capped -the energy of each photon is the determining factor for these cells. Now we can see
that monocrystalline and amorphous silicon solar cells are frequency capped, while polycrystalline silicon
solar cells are intensity capped. Thus, we can show the best applications for each. Polycrystalline ce lls
would likely be very good for large-sca le electricity generation (for example, in a desert, where the intensity
is very high regardless of the wavelength ). Amorphous (and to a lesser extent, monocrystalline) cells are
useful in unstable, low-light envi ronments like classrooms and such. Monocrystalline ce lls seem to be a kind
of middleman, merely all right for large sca le operation, but more powerful than amorphous cells in small
scale-c;-p;ration. Their weakness, however, is their cose- a single 300mm wafer can be $200, much too
expensive for use in ca lculators, etc. This may be the reason that calculators seem to generally have
amorphous silicon solar cells- they are relatively cheap. ./
"\ ~lui.,":)
\-v.M ~ "-'..~J.... ~ ~ \
\u--w u <.. .....::. I...'-- .J......:.\. ~~~
\
o ,t,o 5 ~~ o. \'\I u;
o . ,~., v
./
-:?} ,,~ \_ .. d~~· V' ~ ~ ~.uMJ ~
~ "-......... ~~
4 ~ ... ~. ~.,+-_
4 "'-'P '\M) • ~I'~ 0
2 http:/ I en. wikipedia .org/wi ki/Polycrysta lli ne_ si licon_photovolta ics
16
Candidate Name: Candidate Number:
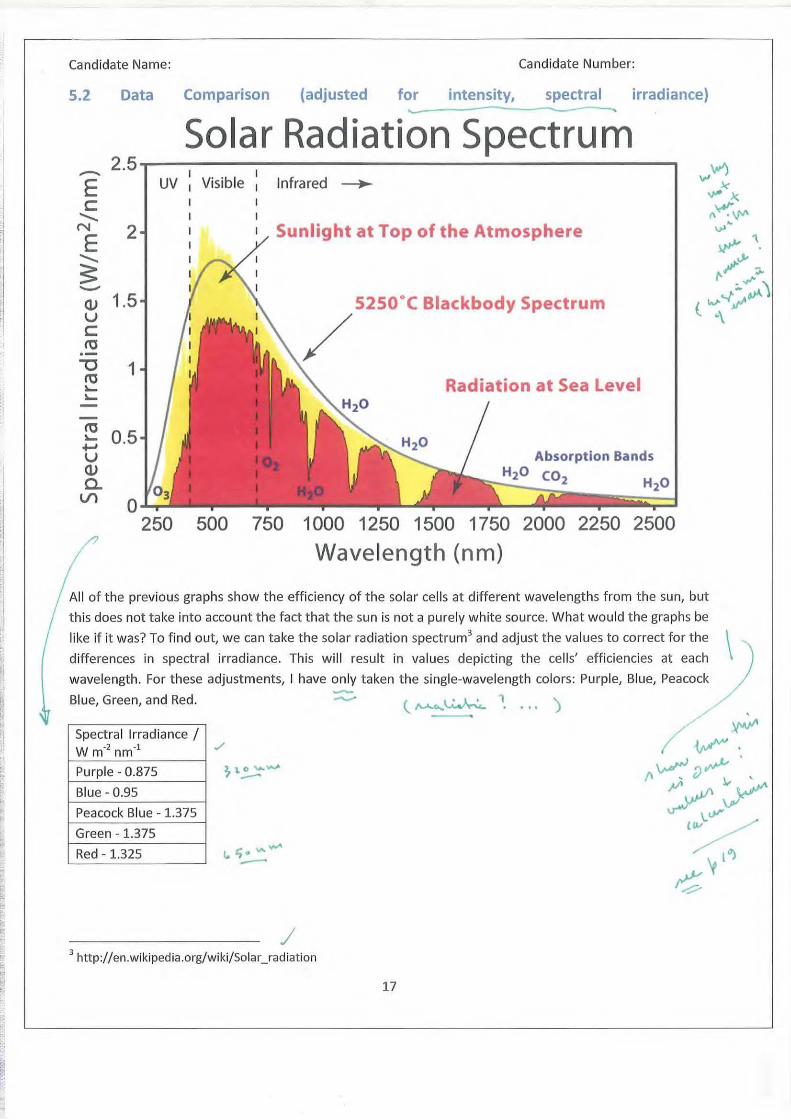
5.2 Data Comparison (adjusted for intensity, spectral irradiance) '-"" -...
Solar Radiation Spectrum 2.5~----------------------------------------~ -E UV 1 Visible 1 Infrared ~
c ........... N
E ...........
~ -2
Q) 1.5 u c tO ·--o 1 tO ~ ~
0.5
0 250 500
Sunlight at Top of the Atmosphere
750
/ 5250°( Blackbody Spectrum
Radiation at Sea Level
Absorption Bands H20 C02
1000 1250 1500 1750 2000 2250 2500 Wavelength (nm)
All of the previous graphs show the efficiency of the solar ce lls at different wavelengths from the sun, but
this does not take into account the fact that the sun is not a purely white source . What wou ld the graphs be
like if it was? To find out, we can take t he solar radiation spectrum3 and adjust the values to correct for the ~ differences in spectral irrad iance. This will resu lt in values depicting the cells' efficiencies at each
wavelength. For these adjustments, I have only t aken the single-wavelength colors : Purple, Blue, Peacock
Blue, Green, and Red. .._.. (. ,._o...~~ 1. • . , ) /
/ /v~ ~~
f\ , D ~ , j/1~~ ~ cY
(~ v'")
~
Spectral lrradiance I W m·2 nm·1
Purple - 0.875
Blue - 0.95
Peacock Blue- 1.375
Green - 1.375
Red -1.325
/ 3 http:/ /en.wikiped ia.org/wiki/Solar _radiation
17

Candidate Name: Candidate Number:
I have taken the average of the spectral irradiance for the visible spectrum as 1.1 W m·2 nm·1 (estimated
from the above graph}. I then adjusted the voltage and current values as follows:
. . * l'wu,:..~ ~\-~ ~\~ Wh1te-llght Amorphous Voltagepurple = 2.97 (1.1/0.875} = 3.74V ~ ~ ~ ·' _ 1 • , .,
___ _.._ - __.. ""- ·--, .L.; Q."" ~ - ..l ~ ~ .
White-light Amorphous Currentpurple = 18.7 * (1.1/0.875} = 23.5mA ~ ..._ ~\' """"-~ ~ ~ """-.....: '- )
White-light Amorphous Power purple= .056 * (1.1/0.875} = 0.070W €)
This was repeated for all five colors, and for all three solar cells.
5.2.1 Data Tables (adjusted for intensity, spectral irradiance)
5.2.1.1 Amorphous (wrt 60000/x, 1.1 Wm·znm·l)
Filters Current/rnA ± Power/W ± Voltage/V ± 0.01V 0.1mA 0.001W
Purple 3.74 23.5 0.070 Blue 3.34 20.9 0.060
Peacock Blue 2.64 15.9 0.053 Green 2.48 15.9 0.049
Red 2.45 14.6 0.043
5.2.1.2 Polycrystalline (wrt 60000/x, 1.1 Wm ·Znm·I)
Filters Current/rnA ± Power/W ± Voltage/V ± 0.01 V 0.1mA 0.001W
Purple 0.69 263.8 0.145 Blue 0.54 213.1 0.100
Peacock Blue 0.44 170.6 0.094 Green 0.35 135.7 0.060
Red 0.48 179.4 0.104
5.2.1.3 Monocrystalline (wrt 60000/x, l.IWm·Zmn·I)
Filters Current/rnA ± Power/W ± Voltage/V ± 0.01 V 0.1mA 0.001W
Purple 1.75 79.2 0.110 Blue 1.53 66.1 0.087
Peacock Blue 1.08 47.0 0.063 Green 1.02 41.9 0.054 Red 1.17 53.2 0.075
18

:J
Candidate Name: Candidate Number:
0.16
0.15
0.14
0.13
0.12
3: 0.11 ....... 0.1 "C Q)
~ 0.09 .... ~ 0.08
= Q)
l!) 0.07 .... ~ 0.06 &. 0.05 c1 ystalli11e
0.04
0.03
0.02 f 0.01
0 purple (410, 40%) blue (420, 37%) peacock blue (500, green (525, 37%) red (650, 75%)
75%)
Color of Filter (transmitted wavelength (nm), %transmitted)
Now that the differences in the irradiation of the sun are accounted for, we can see the variation solely
with respect to incident wavelength.
Here, in the case of the polycrystalline cell, we see a slightly different picture. Before, we saw that the
power output was heavily dependent on the intensity of the incident light - the bandgap is small. However,
here, its e~t only extends until the green wavelength. The three values with the higher wavelengths
(peacock blue, green, and red) appear to vary with intensity, as before. However, t he lower wavelengths do
not. Despite their low intensities, they still allow high power output. Thus, my previous statement should
be modified somewhat - the polycrystalline cell is intensity limited for higher wavelengths of light, but
frequency limited at lower wavelengths. In other words, the bandgap isn't as small as I thought. Radiation
with a very high frequency (energy) can still increase the number of electrons crossing the bandgap.
Looking back, this agrees with the previous power comparison graph. ./
Again, the monocrystalline and amorphous solar cells appear to be affected little by incident intensity.
Especially in the case of the amorphous ce ll, the only meaningful va riation seems to be a downward slope
with increasing wavelength (again confirming a large bandgap).
~ ~ ..._)._ ":3 ..Jy.-. ~ ~~~ ...
19

Candidate Name: Candidate Number:
4 .-----.,.----- - -----.,.---, -Vo tage Comparison
(crdjustecHorintensity~spectraHrra·diance}- - -~ ----r-
2.5 -1---~--------:-----> ...... ~2-~ +---~-------;-------~---~ .. c: ..
..:> +---~-------+-------~------------------~-~
~ - Potvcrvst•Uine ! 1.75 f----~"'"""'==-------~------......... ------------------~ M cnouyJtalline
0.5 t---+-====~-====;========:====::=:::::::;;;;...j-- -0.~ ~----i--------+---- ______ ;,..._ _______ ~----
0 +--------....----purp~ (410, 4~) blue ( 420, 37~) P"acoc:~ blue (500, 75~) J reen (5~. 37>6) red (650, 7SS6)
Color of FlltRr (transmitted wavelen&th (nm), 16 trilnsmllled)
This data agrees with t he other comparisons. Again, the amorphous cell is purely wavelength limited - the
line slopes downward with increasing wavelength. The polycrystalline cell varies with intensity at higher
wavelengths, and with frequency at lower wavelengths.
The monocrysta lline cell varies like the amorphous cell at lower wave lengths, and like the polycrystalline
cell at higher wavelengths. It varies less than eit her, however, so the size of its bandgap must be between
the other two.
./
20

Candidate Name: Candidate Number:
300 T---------------~~------~------~--------------------~-----Current Comparison
275 +---~-~--~----~-T,,-~--~--------~-..---~.-----T--~·------•usted fortintensity, spectral irradiance}
250 +-----~--3~-------~------------·------------·------------~------
~ 200 +-----~-----------~----~------·------------·------------~-----........ "0 ~ 175 +-----~-----------~--------~~-----------------------~~-----~ <1.1 @ 150 +-----;------------,-----------------~~~--'--~~--~---~----(!) ..... @ 125 +-----------------~------------------------·----~--~1 .... .... ::s U 100 +-----~----------~----------------------------~=--=~w~~~
75
25
0 +-----------~----------~----------~r-----------T-----------~ purple (410, 40%) blue (420, 37%) peacock blue (500, green (525, 37%) red (650, 75%)
75%)
Color of Filter (transmitted wavelength (nm), %transmitted)
Again, the amorphous cell hardly varies at all with intensity, and has a slight downward slope with
increasing wavelength. The polycrystalline cell displays the same properties we have seen before - it is
intensity limited at high wavelengths and frequency limited at low wavelengths. The monocrystalline cell
seems to be a hybrid of t he two others - it varies with intensity and with frequency, rather than one or the
other.
'-"t>j._ ~ V\...t c.:....~"-~
~ J C."-\....\
21
""--..l:....:· ........... ~ ~ "" --\."----«-'-'~ '-"""..
......_, ~ "-:- \. ~ ""'

Candidate Name: Candidate Number:
6. Evaluation ---6.1 Errors: 1. Delay in measurement: the voltage and current readings have to be taken separately from each
other - doing those together affects both their readings. This, as well as the time taken to look to
the data-logging computer from the multimeter, introduces a lag, during which the light intensity
often changed. This increased the uncertainty on light intensity. I think this could have been
removed with the use of computerized data-loggers. Each measurement of voltage or current cou ld
also have a near-instantaneous value for light intensity. This would decrease the uncertainty in light
intensity, through random errors.
2. Color filter precision: the filters used in the experiment did not only let through one wavelength of
~It- _ light- rather, they let through a range, which peaked at the values that I have described. More
precise filters would allow more detailed analysis of the effects of the wavelength on the power
generated. Also, apparently, they only filter out light in the visible spectrum. They allow all the light
from the ultraviolet and infrared spectra. Since they all do this, it does not affect the outcome, but
it does mean that the results cannot be extrapolated easily to those spectra.
3. Color filter intensity: In addition, the intensities of the light they let through varied from filter to
~'U- ---7 f ilter. Ideally, they would all let through the same intensity, to allow the variable to be controlled by
other factors. Unfortunately, the only way to do that is to buy other fi lters, which I cou ld not do.
4. Filter placement: It was quite difficult to place the filter exactly upon the open part of the so lar cell.
This would result in a systematic error, where the power measured is less than it would be with the
filter placed perfectly. Guiding vanes placed atop the cell would help remove this uncertainty.
5. Light intensity meter placement: The meter only took in light from one direction, while the solar
panel can take in light from any direction. This would produce a small systematic error, which could
be solved by an open light sensor (mine was opaque on the sides).
6. Solar panel temperature: The solar panels would get very hot under the sun, which cou ld affect
their efficiency. This systematic error could be solved by getting reflective tape, or by covering the
tape in reflective material, like aluminum foil. L n':\..v\..\ ~~
~\. '' .::);..., \-\-..-. '"(.
. . -)
22

Candidate Name: Candidate Number:
7. Conclusion
7.1 Which structure of silicon makes the most effective solar cell? There is no single best solar ce ll, but the usage conditions determine a cell's effectiveness.
An amorphous cell is very effective in darker environments with low power requirements, due to its
cheapness and the fact that it is frequency limited (its bandgap is very large). Thus, only the high energy -photons excite electrons, and enough of these exist even at low intensities. This means that its power
output is not determined by the intensity of the incident light until very low intensities are reached (less
than 37% of normal light, according to my data). Thus, it can be used in devices like ca lculators, where the
light may be from inside a dark classroom.
A polycrystalline cell has relatively high output. However, it is intensity limited at higher wavelengths, due
to its small bandgap. Thus, it depends on many electrons being excited to generate power, as each electron
has little energy. It would be best for large-scale power generation, as the intensity somewhere like a
desert does not vary much through a day (especially in long-wavelength radiation). It is also frequency
limited at lower wavelengths, so it would be especially suitable for power generation at sunrise and sunset;
./
it can take advantage of re latively low-intensity but high-frequency (bluish) scattered radiation. ../
The monocrystalline ce ll acts as a middle ground. Its power generation is not as much as the polycrystalline
cell, but more than the amorphous cell. The variance in its power generation is in the middle too. It behaves
like the polycrystalline cell, in that it is intensity limited at higher wavelengths and frequency limited at
lower wavelengths, but the intensity plays a much larger part than in the polycrystalline cell. Thus, it varies
like a in between the other two. It would be a decent all-round performer, if not for its extremely high cost . . Thus, to answer the question, amorphous cells are most suitable for small-sca le operation, while
polycrystalline ce lls are best for large scale operation.
7.2 Scope of research: Initially I intended to take every kind of solar ce ll available, and test them at wavelengths between 250-
2500nm. However, due to difficulties in availability, I was only able to find silicon-based solar cells, and
filters for the visible spectrum. This limits the scope of the experiment to the visible spectrum. The scope of
the experiment can be expanded as follows:
1. Using filters for a larger range of wavelengths
2. Using other kinds of solar cells, like gallium arsenide, etc.
3. Testing the output at different temperatures (by heating/cooling the cells) to simulate different
environments
4. Taking readings from multiple units of each solar cell type.
23
./

Candidate Name: Candidate Number:
8. Bibliography /
Description of working of solar cells
v 1Theraja, B.L. (2001) Basic Electronics Solid State (pp. 68- 69). New Delhi, S. Chand & Company Ltd.
Wikipedia article on polycrystalline silicon photovoltaics
) 2http://en.wikipedia.org/wiki/Polycrystalline_silicon_photovoltaics (referenced by: Green, M. A. (2004), .rJ "~ . "Recent Developments in Photovoltaics", Solar Energy 76 (1- 3): 3-8, doi:10.1016/S0038-092X(03)00065-3) ._rYw
Wikipedia article on solar radiation ..., "'ri'
/ 3http://en.wikipedia.org/wiki/Solar_radiation (Image created by Robert A. Rohde I Global Warming Art,
http://www.globalwarmingart.com/wiki/File :Solar Spectrum png)
C\n ;;J:t,~~ QN"'l ..,.Q pti-lf<Jtl ..we~r ~ ... " . Pn~"'J re~v(\_ w~t tfv ~~~~J: ~ r:Jv)l ~ ~p ~ Ct. ~"' ~.,.
all r~ du~~~- fu "fFl ~ ~~~~J~ '4ves
cc'*:p.J-. oJ; old.4't;J-- C,l<mUJI.> aiL ~WkJ -~Lti- '«"'l f.{ft.C!.uvf1 wJ_/ Por va.r ~~ -w" ~v6w~i f~, ck to ~IJ)~al v;vdlfiMOli\.1(
~ Ju~d:l4u CA.UJ /zj tiv. ~t<fr.. c~ ~ ~ ~Lck ~~ -~ c<A· l.Ltf~~ ~~~ awl 4t\6.
24


